Embed Size (px)
Citation preview

Whole genome sequencing for epidemiological studies of tuberculosis: a systematic review of
reporting practices and factors associated with reporting quality of STROME-ID
Brianna Cheng
Department of Epidemiology, Biostatistics, and Occupational Health
McGill University, Montréal, Canada
April 2020
A thesis submitted to McGill University in partial fulfillment of the requirements of the degree
of Master of Science
© Brianna Cheng, 2020

1
Abstract
Background: Whole-genome sequencing (WGS) has the potential to improve the understanding
of tuberculosis (TB) epidemiology. However, standardized reporting is necessary to enhance the
reproducibility and interpretation of WGS results in genomic epidemiology
studies of TB to better inform public health decision-making. In 2014, guidelines called
STROME-ID were published to provide recommendations for reporting in genomic
epidemiology studies. Reporting practices before and after its publication were compared, and
the correlation between STROME-ID reporting quality and study-level characteristics were also
explored.
Methods: This study is registered on PROSPERO (CRD42017064395). MEDLINE, Embase
Classic and Embase were searched on May 3, 2017 (updated April 23, 2019). 976 titles and
abstracts were screened, with 114 full-texts eligible for inclusion. The proportion of STROME-
ID criteria reported was tabulated for each article, and differences in means were compared
before and after STROME-ID’s publication date using a t-test. A 6-month lag period after
STROME-ID was included to account for articles in-press; sensitivity analyses were also
performed. Quasi-Poisson and tobit regression were used to assess whether h-index (HI), journal
impact factor (IF), sample size (SS), and geographic region of the senior author’s primary
affiliation were correlated with the count and proportion of STROME-ID criteria met.
Results: The proportion of applicable criteria met in included articles ranged from 16.3-75.0%
(mean 49.9%, ± 11.88%), with no difference between mean proportions of criteria comparing
before and after guideline publication. HI was not included in the adjusted regression analysis.
Only SS was significantly associated with a greater proportion of STROME-ID criteria met.
Conclusion: Reporting quality in genomic epidemiology studies of tuberculosis is variable,
despite publication of STROME-ID guidelines. Future studies should investigate factors
affecting adherence to these guidelines to improve the value and utility of evidence. Journal
endorsement may be needed to support this.

2
Résumé
Context: Le séquençage du génome entier (SGE) possède le potentiel d'améliorer la
compréhension de l'épidémiologie de la tuberculose (TB). Cependant, des rapports standardisés
sont nécessaires pour améliorer la reproductibilité et l'interprétation des résultats du SGE dans
les études épidémiologie génomiques de la tuberculose. Cela peut mieux éclairer la prise de
décision en matière de santé publique. En 2014, des lignes directrices appelées STROME-ID ont
été publiées pour fournir des recommandations sur la notification dans les études
d'épidémiologie génomique. Les pratiques de déclaration avant et après sa publication ont été
comparées, et la corrélation entre la qualité de la déclaration STROME-ID et les caractéristiques
au niveau de l'étude a également été explorée.
Methodes: Cette étude est enregistrée sur PROSPERO (CRD42017064395). Les bases de
données MEDLINE, Embase Classic, et Embase ont été cherchées le 3 mai, 2017 (mise à jour le
23 avril, 2019). 976 titres et résumés ont été évalués, dont 114 textes-complètes étaient inclus. La
proportion de critères STROME-ID rapporter s’est tabulée pour chaque publication, et les
différences entre les moyennes étaient comparées avant et après la publication de STROME-ID,
à l’aide d’un test t. Une période de 6 mois après la publication de STROME-ID était inclus pour
inclure les articles sous presse. En plus, des analyses de sensibilité ont été réalisés. Les
régressions quasi-poisson et tobit ont été utilisés pour déterminer si l’indice-h (IH), le facteur
d’impact du journal (FI), la taille de l’échantillon (TE), et la région géographique de l’affiliation
de l’auteur principal ont été corrélés avec le nombre et proportion de critères STROME-ID
effectués.
Resultats: La proportion des critères applicables effectués dans les articles était 16,3-75,0%
(taux moyenne 49,9% ± 11,88%), sans différence entre les taux moyennes de la proportion des
critères comparées avant et après la publication des lignes directrices STROME-ID. IH n’était
pas inclus dans l’analyse de régression ajustée. Seulement TE était associée significativement
avec une plus grande proportion des critères STROME-ID effectués.
Conclusion: La qualité de rapport des études épidémiologiques génomiques est variée, malgré la
publication des lignes directrices STROME-ID. Les études dans le futur devraient investiguer les
facteurs responsables pour maintenir l’adhérence des lignes directrices STROME-ID afin
d’augmenter la qualité et l’utilité des données. L’appui des journaux pourrait être nécessaire pour
augmenter l’adhérence des lignes directrices STROME-ID.

3
Acknowledgements
I would like to thank my co-supervisors, Dr. Marcel Behr and Dr. Robyn Lee for providing high-
quality mentorship and dedicated supervision throughout my graduate training. Their
commitment to scientific inquiry and public health, especially during the coronavirus pandemic,
has made a lasting impression on me. I am certain I am a better researcher and communicator
because of how they have challenged and encouraged me throughout this process. Amid the
challenges and milestones, they were quick to listen and offer feedback, which has greatly
informed this work. Having worked with Robyn closely, I cannot express enough gratitude for
her patience and willingness to go above and beyond to guide me throughout this entire process,
and to make sure I met required deadlines. I am grateful that they both took an interest in my
long-term goals, and for providing me with learning opportunities along the way.
My heartfelt gratitude extends to Dr. Jim Hanley for sharing his expertise about the statistical
methods used in this thesis, Jaryd Sullivan for providing French translation services, and Fiona
McIntosh for her lab support. Thank you to the rest of the Behr lab for providing a welcoming,
stimulating learning environment, and the administrative staff of the Epidemiology department.
Thank you to my peers who brought joy and balance into my life. Kacper, David, and Jiameng
for sharing their stories. Talia, for celebrating the outdoors with me. Most of all, I could not have
done this without my twin sister, Breagh, who completed her own epidemiology degree in
tandem with me. To my friends and family, thank you for your ongoing trust and support.
Acknowledgement of financial support
I would like to acknowledge and thank the Canadian Institutes of Health Research for the
funding of this work, via a Frederick Banting and Charles Best Canada Graduate Scholarship
(CIHR-CGS-M). An Operating Grant awarded to Marcel also funded my stipend during my
degree. I would also like to thank Marcel and the Epidemiology department for providing
financial support to attend The Union NAR conference in Chicago.

4
Preface and contribution of authors
This thesis contains 7 chapters. Chapter 1 provides a rationale for the research and outlines the
main objectives of the thesis. Chapter 2 is a literature review summarizing the epidemiology of
tuberculosis (TB), whole-genome sequencing (WGS) and its epidemiological applications, and
the current reporting issues in TB epidemiology studies using WGS. Results are elaborated upon
in Chapter 3. Chapter 4 explains the study methodology. The results of the thesis are presented in
the form of a manuscript in Chapter 5, which will be submitted to The Lancet Microbe. Chapter
6 reports additional findings to those in the manuscript, which their interpretation is discussed in
Chapter 7. The master reference list is provided at the end of the thesis.
This thesis is presented in manuscript-based format. The results are given in the following
manuscript, which has been prepared for submission to a peer-reviewed journal:
Manuscript I. Whole genome sequencing for epidemiological studies of tuberculosis: a
systematic review of applications and reporting practices
Authors: Brianna Cheng, Marcel A Behr, Ben P Howden, Ted Cohen, Robyn S Lee
Status: In preparation for submission to The Lancet Microbe
BC screened abstracts and titles for inclusion, data extraction, statistical analysis, created the
tables and figures, interpreted the data, and wrote the first draft of the manuscript. RSL
conceived and led the study, designed the protocol and ran the searches, screened abstracts and
titles for inclusion, guided statistical analyses and interpretation of the data, wrote the first draft
of the manuscript with BC and co-supervised BC. MAB assisted with data interpretation,
reviewed manuscript drafts, and co-supervised BC. BPH and TC contributed to protocol
development, and reviewed the final manuscript draft. TC also served as arbitrator for
disagreement in study inclusion.
Author initials: Brianna Cheng (BC), Dr. Marcel A Behr (MAB), Dr. Robyn S Lee (RSL), Dr.
Benjamin P Howden (BPH), and Dr. Ted Cohen (TC).

5
Table of contents
Abstract ........................................................................................................................................... 1
Résumé ............................................................................................................................................ 2
Acknowledgements ......................................................................................................................... 3
Preface and contribution of authors ................................................................................................ 4
Table of contents ............................................................................................................................. 5
List of tables .................................................................................................................................... 8
List of appendices ......................................................................................................................... 10
List of abbreviations ..................................................................................................................... 11
Chapter 1. Introduction ................................................................................................................. 12
Chapter 2. Literature review ......................................................................................................... 12
2.1. Overview of the pathogenesis of TB .................................................................................. 12
2.1.1. Diagnosis and clinical treatment of TB ....................................................................... 13
2.1.2. Prevention and control of TB ...................................................................................... 13
2.1.3. Epidemiology of TB .................................................................................................... 13
2.2. Genotyping methods of TB strains ..................................................................................... 14
2.2.1. Traditional genotyping methods .................................................................................. 14
2.2.2. Whole genome sequencing (WGS) ............................................................................. 14
2.3. Reporting guidelines for genomic epidemiology studies ................................................... 15
2.4. Data-sharing of genomic data ............................................................................................ 16
2.5. Reproducibility of next-generation sequencing research ................................................... 17
2.6. Factors correlated with reporting quality ........................................................................... 17
2.6.1 Geographic affiliation of the authors ............................................................................ 18
2.6.2. Journal Impact Factor (IF) ........................................................................................... 18
2.6.3. H-index (HI) ................................................................................................................ 18
2.6.4. Sample size (SS) .......................................................................................................... 18

6
Chapter 3. Overview of study data and methodology ................................................................... 19
3.1. Systematic review .............................................................................................................. 19
3.2. Statistical analysis .............................................................................................................. 20
3.2.1. Descriptive statistics .................................................................................................... 20
3.2.2. Missing data ................................................................................................................. 20
3.2.3. Sensitivity analyses ...................................................................................................... 21
3.2.4. Quasi-Poisson .............................................................................................................. 21
3.2.5. Tobit regression ........................................................................................................... 22
3.2.6. Model fit ...................................................................................................................... 23
Chapter 4: Results ......................................................................................................................... 23
4.1. Statistical analyses .............................................................................................................. 23
4.2. Model fit ............................................................................................................................. 27
Preamble to Manuscript I .............................................................................................................. 31
Chapter 5: Manuscript I ................................................................................................................ 32
5.1. Summary ............................................................................................................................ 32
5.2. Introduction ........................................................................................................................ 34
5.3. Methods .............................................................................................................................. 35
5.4. Results ................................................................................................................................ 37
5.5. Discussion .......................................................................................................................... 40
5.7. Acknowledgements ............................................................................................................ 44
Manuscript references ............................................................................................................... 45
Manuscript figures and tables ................................................................................................... 59
Supplemental materials ............................................................................................................. 81
Chapter 6. Discussion ................................................................................................................. 100
6.1. Summary .......................................................................................................................... 100
6.2. Strengths and limitations .................................................................................................. 101

7
Chapter 7. Conclusions ............................................................................................................... 102
References ................................................................................................................................... 103
Appendix ..................................................................................................................................... 125

8
List of tables
Chapter 3
Table 1. Number of genomic epidemiology of tuberculosis papers per publication year ............ 24
Table 2. Descriptive statistics of independent variables ............................................................... 24
Table 3. Descriptive statistics for dependent variables ................................................................. 26
Table 4. Mean and variance of count data suggest over-dispersion ............................................. 27
Chapter 4
Table 1. Summary of included studies .......................................................................................... 63
Table 2. Mean proportions of STROME-ID criteria met pre- and post-guideline publication .... 78
Table 3. Quasi-Poisson univariate and multivariate analyses of impact factor, H-index, continent,
and sample size of isolates ............................................................................................................ 79
Table 4. Univariate and multivariate tobit analysis of impact factor, H-index, continent, and
sample size of isolates ................................................................................................................... 80

9
List of figures
Chapter 3
Figure 1. Pairwise correlation matrix for impact factor (IF), H-index (HI), sample size of isolates
(SS), and sample size of patients (SP). ......................................................................................... 27
Chapter 4
Supplemental Figure 1. Count of "not applicable" papers per STROME-ID criterion, pre-
publication. .................................................................................................................................... 84
Supplemental Figure 2. Count of "not applicable" papers per STROME-ID criterion, post-
publication ..................................................................................................................................... 85
Supplemental Figure 3. Distribution of impact factors for included papers ................................. 86
Supplemental Figure 4. Distribution of sample size of isolates in included papers ..................... 87
Supplemental Figure 5. Proportion of STROME-ID criteria met with 12-month lag pre-
publication. .................................................................................................................................... 88
Supplemental Figure 6. Proportion of STROME-ID criteria met with 12-month lag post-
publication. .................................................................................................................................... 89
Supplemental Figure 7. Proportion of STROME-ID criteria met post-publication, excluding
articles from 12-month lag. ........................................................................................................... 90

10
List of appendices
Appendix 1. Distribution of H-index in included papers ............................................................ 125
Appendix 2. Distribution of count of eligible criteria met in included papers ........................... 125
Appendix 3. Distribution of proportion of all criteria met in included papers ........................... 125

11
List of abbreviations
AIC Akaike information criterion
CI confidence interval
CONSORT Consolidated Standards of Reporting Trials
DNA deoxyribonucleic acid
HI h-index
IF impact factor
IQR interquartile range
MDR multi-drug resistant M. tuberculosis
M. tuberculosis Mycobacterium tuberculosis
NGS next generation sequencing
RFLP restriction fragment length polymorphism
SS sample size of isolates
SP sample size of patients
STARD Standards for Reporting of Diagnostic Accuracy Studies
STROBE Strengthening the reporting of observational studies in
epidemiology
STROME-ID Strengthening the reporting of observational studies in
epidemiology for infectious diseases
TB tuberculosis
VNTR variable number tandem repeat
WGS whole-genome sequencing
WHO World Health Organization
XDR extensively drug-resistant M. tuberculosis
12
Chapter 1. Introduction
Tuberculosis (TB) is the world’s leading cause of mortality attributed to a communicable disease
(1). Despite available treatments and advances in public health infrastructure, it remains a major
global public health challenge.1 Recent advances in technology and cost have enabled the
widespread use of whole-genome sequencing (WGS). WGS is a next-generation sequencing
technique that is being increasingly applied in TB epidemiological research, with the potential to
inform clinical and public-health decision-making.
The greatest potential of WGS is realized when its results are reproducible. Lack of
standardization in analytical approaches and poor reporting make it difficult to compare WGS
results across studies, as different analytical approaches can influence final data interpretation.2
Recent studies have also revealed poor reporting and sharing practices of genomic data, which
further hinders the ability to assess the validity and biases of studies.3 At the time of writing, no
studies have examined reporting quality and its correlates per reporting guidelines called
STROME-ID among genomic epidemiology studies of TB.
This thesis will assess the reporting quality of genomic epidemiology studies of TB before and
after the publication of STROME-ID in 2014. It will investigate the relationship between
reporting quality and study characteristics; specifically, h-index (HI), sample size of isolates
(SS), geographical affiliation of the senior authors’ affiliation, and journal impact factor (IF) and
their association with the count, and proportion, respectively, of met criteria were examined. It
was hypothesized that reporting quality will increase post-guideline publication, and that IF, SS,
and the continent of the senior author’s primary affiliation are associated with reporting quality.
Chapter 2. Literature review
2.1. Overview of the pathogenesis of TB
Tuberculosis (TB) is an infectious respiratory disease caused by the bacteria, Mycobacterium
tuberculosis.1 It is the number one infectious cause of mortality in the world.1 The infection is
spread primarily by aerosol transmission between humans, whereby the bacteria gains access to
alveolar macrophages in the lung.4 Bacilli that survive attack from immune system cells (e.g.,
macrophages, granulocytes) establish primary infection, giving rise to granuloma or the “Ghon

13
focus,” a hallmark feature of TB caused by aggregates of inflammatory cells.5,6 The degeneration
of granuloma results in active TB infection.7 In cases where the bacilli migrate to organs outside
of the lungs, this is known as extrapulmonary TB.6
Until recently, the scientific community has distinguished the acquisition of TB infection to be
either latent or active.8 According to these definitions, latent TB is understood as when
individuals fail to exhibit clinical symptoms of active TB infection, yet displays positive
immunologic markers for the disease.8 Of those who are immune reactive, the risk of progression
to active TB is highest in the first 2 years, then declines thereafter.9
2.1.1. Diagnosis and clinical treatment of TB
Current diagnostic procedures for active TB include chest radiography, microbiologic cultures,
and phenotypic drug-susceptibility testing, sputum smear microscopy, and other rapid screening
tests.10 Latent TB may be diagnosed using the tuberculin skin test (TST) or interferon-γ release
assays (IGRA), in addition to evaluating the patient’s medical history and the results of their
physical examination.11 Chest x-ray is used to rule out active TB disease before initiating
treatment of latent TB.12
For adults with active TB, standard treatment involves 6-months of anti-TB drugs.13 Patients
with drug-sensitive TB are treated according to the standard therapy of isoniazid, rifampin,
pyrazinamide, and ethambutol for the first 2 months followed by isoniazid and rifampicin for 4
more months.13
2.1.2. Prevention and control of TB
Prevention and control of TB relies on the timely and accurate identification of active cases.
Accurate strain differentiation, which allows for the identification of the source and transmission
pathway of TB, is thus important for public health and clinical decision-making.14,15
2.1.3. Epidemiology of TB
It is estimated that 10 million new cases of TB are reported worldwide annually.16 Although the
global incidence of TB has declined over the past decade, efforts are still needed to achieve

14
worldwide TB elimination.16 Globally, TB incidence remains highest among Asian countries,
including Bangladesh, China, India, Indonesia, and Pakistan, which collectively account for half
of new cases each year.17 One third of the world population is estimated to have latent TB,
although this may be overestimated.1,18 TB disproportionately affects the poorest, the most
vulnerable, and marginalized population groups wherever it occurs.19 For example, in 2016, TB
incidence rates were almost 300 times greater in the Inuit compared to the non-Indigenous
Canadian born population.20
The World Health Organization (WHO) has set global TB elimination targets to reduce 80% of
new TB cases by the year 2030.21 Furthermore, there has been a renewed urgency in addressing
TB as a public health priority due to the emerging global spread of drug-resistant TB, including
multi-drug resistant (MDR) and extensively-drug resistant (XDR) TB. According to drug
surveillance data by the World Health Organization (WHO), the global incidence of MDR-TB in
2018 was estimated to be 600 000 new cases, of which 6.2% are XDR-TB.22
2.2. Genotyping methods of TB strains
2.2.1. Traditional genotyping methods
Molecular genotyping is a laboratory technique for studying the spread and evolution of
diseases.23 Traditional genotyping relies on different genetic markers for analysis, such as strain-
specific banding patterns (IS6110 fingerprinting), numerical patterns (24 locus-MIRU-VNTR
typing), or barcode-like patterns (spoligotyping).24 These tools have broad applications when
applied to the study of bacterial pathogens, such as M. tuberculosis. For example, they can help
discern if two, unrelated individuals are part of the same chain of TB transmission; this is more
likely for genetic patterns that are similar.24
2.2.2. Whole genome sequencing (WGS)
WGS is an alternative sequencing method that is increasingly being used for detecting genomic
variability.25 In contrast to traditional genotyping, it analyzes the entire deoxyribonucleotide
(DNA) genome.26 Based on parallel sequencing technologies called next-generation sequencing
(NGS), WGS identifies genomic regions at which individual nucleotide bases differ, called
single nucleotide polymorphisms (SNPs).25,26 TB transmission can be inferred by analyzing the

15
genetic distances (number of SNPs) between patients’ bacterial isolates; closely related isolates
may provide evidence of recent transmission.24
Specifically, WGS analyzes approximately 90% of the genome instead of 1% by traditional
genotyping such as spoligotyping and VNTR.27 WGS thus provides added resolution that is
useful for understanding recent TB transmission, as well as drug-resistance evolution and strain
characterization.27 Previous transmission and systematic review studies show that WGS-based
genotyping can identify strains with greater accuracy and higher resolution compared to
traditional genotyping methods.28-30 Despite these advantages, intensive bioinformatic resources
are required to process and interpret raw genomic data.32 After sequencing, WGS data must be
analyzed using SNP-calling pipelines,2 which have been described in detail by other review
papers.33,34 This genotyping information can then be combined with epidemiological data to
determine whether cases are indicative of recent transmission.24 Future improvements in its cost
effectiveness, and ease of data interpretation will allow WGS to become a gold standard in
routine practices among diagnostic and reference laboratories.31
2.3. Reporting guidelines for genomic epidemiology studies
There are currently no reporting guidelines for WGS. Sandve et al. had proposed ten reporting
guidelines for computational biology research, although these were general suggestions about
reporting software versions and data sharing.35 Lubin et al. provided recommendations for
standardizing the content of NGS variant files in clinical settings, which also discussed reporting
software versions and their parameters.36 To expand upon these limited works, specific reporting
guidelines for WGS are needed.
Formal reporting guidelines do exist for observational studies, however. In 2007, reporting
guidelines for observational studies in epidemiology, called Strengthening the reporting of
observational studies (STROBE), were published by an international organization called the
EQUATOR network.37 STROBE guidelines consist of a checklist of 22 items that provide
recommendations relating to the abstract, methods, results, and discussion sections of the
article.37
16
In 2014, reporting guidelines called Strengthening the Reporting of Molecular Epidemiology for
Infectious Diseases (STROME-ID) were published to provide tailored recommendations for
infectious disease studies, including TB.38 These guidelines were developed to increase
transparency of reporting, interpretability of results, and to encourage data-sharing.
STROME-ID guidelines extended the original list of STROBE criteria with 20 more items that
are tailored to genomic epidemiology studies. In total, the STROME-ID guidelines5 comprise 42
criteria for which specific details are recommended in the methods, results or analysis.
Evidence for STROBE guidelines affect reporting quality is mixed. While some systematic
reviews found improved reporting post-publication,6,7 others did not find STROBE to
significantly impact reporting compliance.8,9 Other systematic reviews found that guidelines are
not being appropriately applied, which suggests confusion about the intended use of STROBE
guidelines.10 To date, no studies have investigated adherence to STROME-ID guidelines for
genomic epidemiology studies of TB.
2.4. Data-sharing of genomic data
Pathogen genomics first emerged with the commercial introduction of NGS technology in
2005.39 The falling costs of NGS, and its capacity for parallel sequencing has generated an
enormous number of reads; this has been further facilitated by Illumina sequencing platforms,
which currently offer the lowest per-base cost.26
In this era of “big data” where increasingly larger quantities of information are being produced,
open-access biological databases provide researchers access to these datasets for conducting their
own independent analyses.40 Repositories for depositing WGS data include The National Center
for Biotechnology Information’s (NCBI) GenBank database, The European Nucleotide Archive
also partners with the NCBI, which consists of three databases, including the Sequence Read
Archive.41 Despite the importance of data-sharing in advancing bioinformatic and TB
epidemiology research, there is still inadequate data-sharing.3
17
2.5. Reproducibility of next-generation sequencing research
Studies continue to under-report methods and study limitations,3 which contributes to wasted
time and resources.42,43The extent of this “reproducibility crisis” was described in a 2016 Nature
survey of over 1500 researchers, whereby approximately 70% were unable to replicate
another scientist's experiments.42 Surprisingly, 50% of respondents, who come from scientific,
engineering, and medical disciplines, failed to even reproduce their own data.42 These findings
suggest that greater attention is needed to allow for the verification and transparency of
biomedical research. There are also moral and ethical reasons for openly communicating study
methods and biases, given that the use of public funds are often used to support scientific
research.44
Reproducibility is of particular concern for WGS studies, where there is presently widespread
heterogeneity of WGS analytical pipelines.33,45 These analytical pipelines rely on various
commercial or publicly available bioinformatic software or programs, which all perform to
different standards.28,46 Thus, given the range of tools available for bioinformatic analysis of
WGS data, it is necessary to know the specific version of the base software in order to replicate
and execute the workflow successfully. For instance, a specific version of Java (version 1.8) is
required to execute tools from GATK or Picard toolkit, and is needed to successfully execute
workflows using this software.47 Moreover, different pipelines may lead to discrepancies in
variant calling, as suggested by studies comparing unique SNP-calling pipelines.48,49 Thus,
understanding the specific characteristics of WGS pipelines (e.g., types of bioinformatic tools
used, and their versions) facilitates reproducibility, and the assessment of bias. Standardization
better allows for comparisons and investigations of cross-border outbreaks and other public
health initiatives.49
2.6. Factors correlated with reporting quality
Several study characteristics and bibliometric indicators have been suggested to be correlated
with reporting quality. In this section, the evidence for correlates of reporting quality will be
discussed.
18
2.6.1 Geographic affiliation of the authors
No studies have yet examined this using the STROBE framework. Selman et al. also did not find
a significant correlation between geographic region of publication and percent compliance to the
Standards for Reporting of Diagnostic Accuracy Studies (STARD) guidelines.50 Ghimire et al.
discovered a similar finding when tested using a different framework, Consolidated Standards of
Reporting Trials (CONSORT).51
2.6.2. Journal Impact Factor (IF)
Often perceived as a metric of study quality by funding agencies and academic employers,52
journal IF is a bibliometric measure that conveys the average number of citations of recent
articles published in a particular journal.53 The few studies examining the association of IF with
reporting quality using STROBE have found mixed results. A systematic review observed that
journals with lower IF (<5) had a greater increase in their STROBE reporting score than journals
with higher IF (> 5) when comparing time periods before and after STROBE publication in
2007.54 Another study found that even prestigious medical journals with the top IF reported only
69.3% of STROBE criteria three years after guideline publication.55 A systematic review that
analyzed this correlation using STARD did not observe a significant relationship between the
number of criteria reported and five-year journal IF.56
2.6.3. H-index (HI)
The HI was developed in 2005 as an alternative indicator of scientific quality to journal IF.57
Briefly, its calculation involves ordering an author’s publications so the most cited is listed first.
The final HI is obtained by counting down until the number of papers equals the number of
citations.57 Although the HI is thought to be a clearer and more objective measure of the quality
of papers published by an author,58 its correlation with reporting quality has been poorly
described in the literature. One study has suggested that perceptions of journal quality are
correlated with higher HI.59
2.6.4. Sample size (SS)
Small sample size (e.g., of genomic isolates) may not be representative of the entire target
population, and may lead to bias if inappropriate sampling methods are used, affecting overall

19
conclusions of WGS drug-susceptibility human studies.28 Simulation studies suggest that larger
sample sizes are correlated with higher reporting quality.60,61 This has been observed among
randomized control studies per CONSORT guidelines,62-64 and per STARD guidelines.50
Chapter 3. Overview of study data and methodology
In this section, the variables used in the dataset will be described. The rationale for the
systematic review and statistical approaches will be discussed. All statistical analyses were
performed using RStudio (version 1.1.456). Ethics approval was not needed for the purposes of
this study.
3.1. Systematic review
In response to the proliferation of pathogen genomic studies in the past decade, this thesis was
conducted to understand their level reporting. Although systematic and narrative reviews about
WGS have previously been conducted,2,29,65 these studies have not examined reporting quality in
light of their reproducibility issues. Instead, they focused on outbreaks,29 the methodology of
WGS,65 and general issues with WGS-based bioinformatic pipelines.2 These studies are also
limited in their scope, given their small sample sizes of three and twenty-five.29,65
This systematic review will examine the reporting quality of WGS papers based on the
STROME-ID reporting checklist. The detailed methods, including inclusion and exclusion
criteria, are discussed in the registered PROSPERO protocol (CRD42017064395). The theme of
these papers will be discussed. Moreover, variables defined a priori were extracted, as detailed
in Supplemental Dataset 1 (https://drive.google.com/file/d/1r0JIu4q1XfQxlFJWE-
VZzyv9da1V_QnM/view?usp=sharing), including information about bioinformatic tools used,
their versions, and whether or not changes were made to public health interventions based on
genomic data.
This systematic review will also examine whether certain study characteristics are associated
with reporting quality, which is defined as both the count of eligible criteria, and proportion of
all criteria met, respectively.
20
3.2. Statistical analysis
3.2.1. Descriptive statistics The median, minimum, maximum, and interquartile range (IQR) for continuous variables IF, HI,
and SS are presented in Table 2. After assessing the distribution of these continuous variables, IF
and SS were categorized. HI was analyzed as a continuous variable (Appendix 1). The categories
for IF were selected arbitrarily, and based on author experience with the metric. Quartiles of SS
were chosen to reflect the low frequency range across the included studies (Supplemental Figure
4), and were also informed by previously defined quartiles by similar studies.66 Due to low
counts of individual countries of the senior author’s primary affiliation, this was analyzed by
continent instead.
Collinearity was tested between all continuous variables. Using a pairwise correlation matrix,
continuous variables, including sample size of patients (SP), were checked graphically for
collinearity (Figure 1). To test this empirically (Table 4), Spearman’s non-parametric correlation
test was done to determine whether both or only one of these should be included in analysis.
Dependent variables include the count of eligible criteria met, and the proportion of all criteria
met. The number of STROME-ID criteria met out of all eligible STROME-ID criteria was
tabulated to determine the count of eligible criteria. Proportions were obtained by dividing the
number of criteria met by each paper divided by the total number of criteria.
3.2.2. Missing data
There was a non-negligible amount (n= 15, 13.16%) of missing IF values, which was assumed to
be missing at random. To address this, the IF for the previous year was used after assessing the
variation of IF between 2013-2018 was assessed for variation (Supplemental Table 3). Given the
little variation across this five-year time period (<1.00 IF), negligible selection bias is expected
for using this simple imputation method compared to complete case analysis to address missing
data.67

21
3.2.3. Sensitivity analyses Sensitivity analyses were conducted for each of the publication time periods. Articles published
during the six-month and twelve-month lag were excluded to acknowledge that work under
review or in-press at the time of STROME-ID publication would be less likely to be able to
apply the reporting guidelines.
This six- and twelve-month lag period were chosen arbitrarily, as there are no defined standards
regarding publication uptake time. One systematic review used a lag time of eighteen months.68
Other studies did not account for lag time in their analysis, although they analyzed reporting
levels one54,69 and three years70 post-guideline publication.
A sensitivity analysis was also conducted when examining the correlation of geographic region
of last authors’ affiliation with reporting quality. This was done to address instances in which
there was more than one senior author with equal contributions, who were from different
continents. In total, seven papers with multiple last authors whose primary affiliations were from
different continents were identified.
3.2.4. Quasi-Poisson Poisson regression was used to model the count data in this thesis. Poisson regression is part of a
family of generalized linear models that is used to model count data.71 The general log-linear
regression equation takes the form of Equation 1, given explanatory variable x, and outcome
variable Y. Equation 2 shows the exponentiated form of Equation 1, which is transformed for
easier interpretation of parameter estimates (incidence rate ratio):71
!"#$%&'(1:[-.|0.] = 3404 + 3606 + 3707 +3808
!"#$%&'(2:![-.|0.] = exp( 3404 + 3606 + 3707 +3808)
A central assumption of this statistical model is that the mean (μ) equals the variance (σ2).71
When this assumption is not met, either over- or under-dispersion occurs. For the latter, this is
defined as when μ > σ2.

22
In the presence of under-dispersion, the standard Poisson model is inadequate and can result in
misleading conclusions about the effects of experimental factors or covariates of interest.72
Under-dispersion can be accounted for during quasi-Poisson prediction and/or inference by
estimating the scale parameter,73 whereby the variance is multiplied by a scale factor to allow for
over- or under-dispersion.72 In contrast to traditional Poisson, this offers a more flexible
modelling strategy that allows variances to differ from the expected values.74
3.2.5. Tobit regression Two-limit tobit regression was used to model the proportion outcome data in this thesis to
account for values between zero and one. There is no commonly accepted method to analyze
proportions. Health economics research has traditionally used generalized linear models
(GLMs),75,76 however, linear modeling may not guarantee that the fitted values will be
constrained within the upper and lower thresholds of the data interval, especially if the data is
naturally bounded or theoretically “censored” above or below certain values. Use of regression
models based on the binomial distribution are also not appropriate for non-binary, continuous
proportions, such as the case for this data set.77
The tobit model allows for the modeling of continuous proportions of values that are restricted to
a closed interval.78 The model works best if there are no excessive values at the endpoints of this
interval, such as the case with this data set, which can lead to erroneous inferences.75
Applications of tobit regression to bounded or semi-bounded data has mostly been described in
statistical modeling papers79,80 instead of in observational studies.81 This evidence suggests that
tobit regression performs better or the same as linear regression methods, with the added benefit
of addressing outcome data with particular floor and ceiling limits. In papers comparing
traditional linear mixed models and tobit regression, the tobit model was found to be either
superior in model fit, based on model fit parameters and residual plots.78 In other statistical
modeling papers, tobit estimates produced comparable coefficient estimates with other
regression methods.76
23
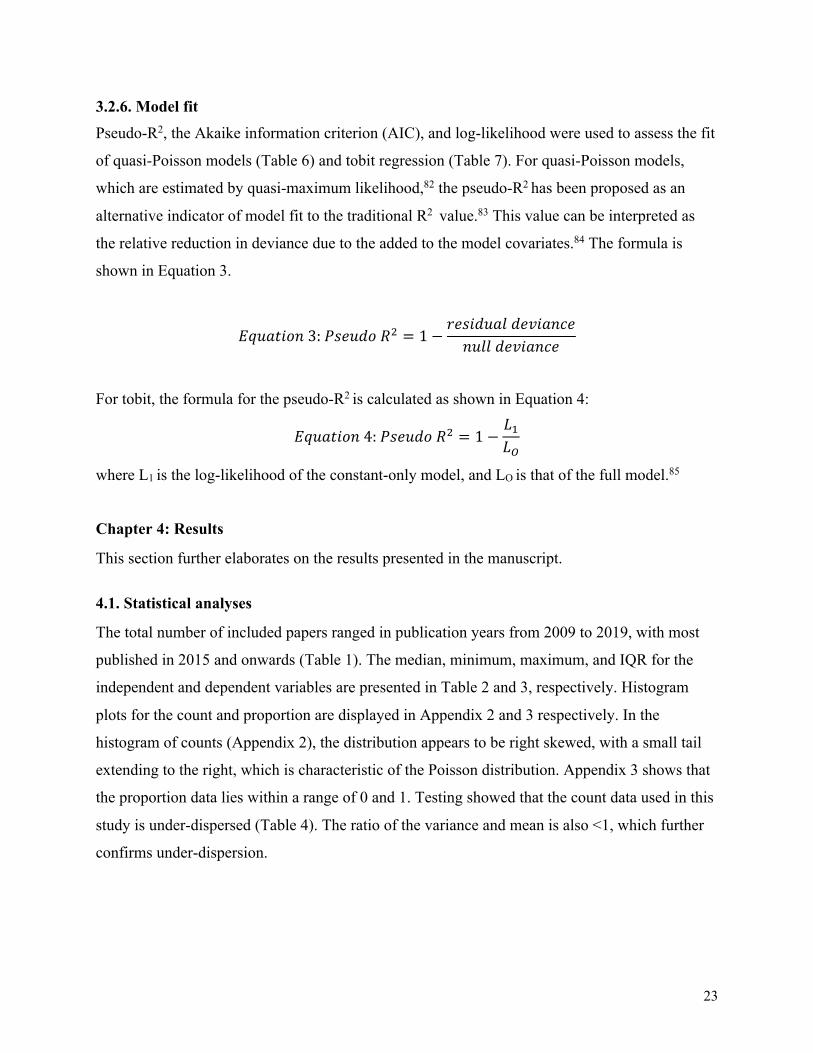
3.2.6. Model fit Pseudo-R2, the Akaike information criterion (AIC), and log-likelihood were used to assess the fit
of quasi-Poisson models (Table 6) and tobit regression (Table 7). For quasi-Poisson models,
which are estimated by quasi-maximum likelihood,82 the pseudo-R2 has been proposed as an
alternative indicator of model fit to the traditional R2 value.83 This value can be interpreted as
the relative reduction in deviance due to the added to the model covariates.84 The formula is
shown in Equation 3.
!"#$%&'(3:@AB#C'D6 = 1 −FBA&C#$GCBH&$(IB(#GGCBH&$(IB
For tobit, the formula for the pseudo-R2 is calculated as shown in Equation 4:
!"#$%&'(4:@AB#C'D6 = 1 −K4KL
where L1 is the log-likelihood of the constant-only model, and LO is that of the full model.85
Chapter 4: Results
This section further elaborates on the results presented in the manuscript.
4.1. Statistical analyses
The total number of included papers ranged in publication years from 2009 to 2019, with most
published in 2015 and onwards (Table 1). The median, minimum, maximum, and IQR for the
independent and dependent variables are presented in Table 2 and 3, respectively. Histogram
plots for the count and proportion are displayed in Appendix 2 and 3 respectively. In the
histogram of counts (Appendix 2), the distribution appears to be right skewed, with a small tail
extending to the right, which is characteristic of the Poisson distribution. Appendix 3 shows that
the proportion data lies within a range of 0 and 1. Testing showed that the count data used in this
study is under-dispersed (Table 4). The ratio of the variance and mean is also <1, which further
confirms under-dispersion.
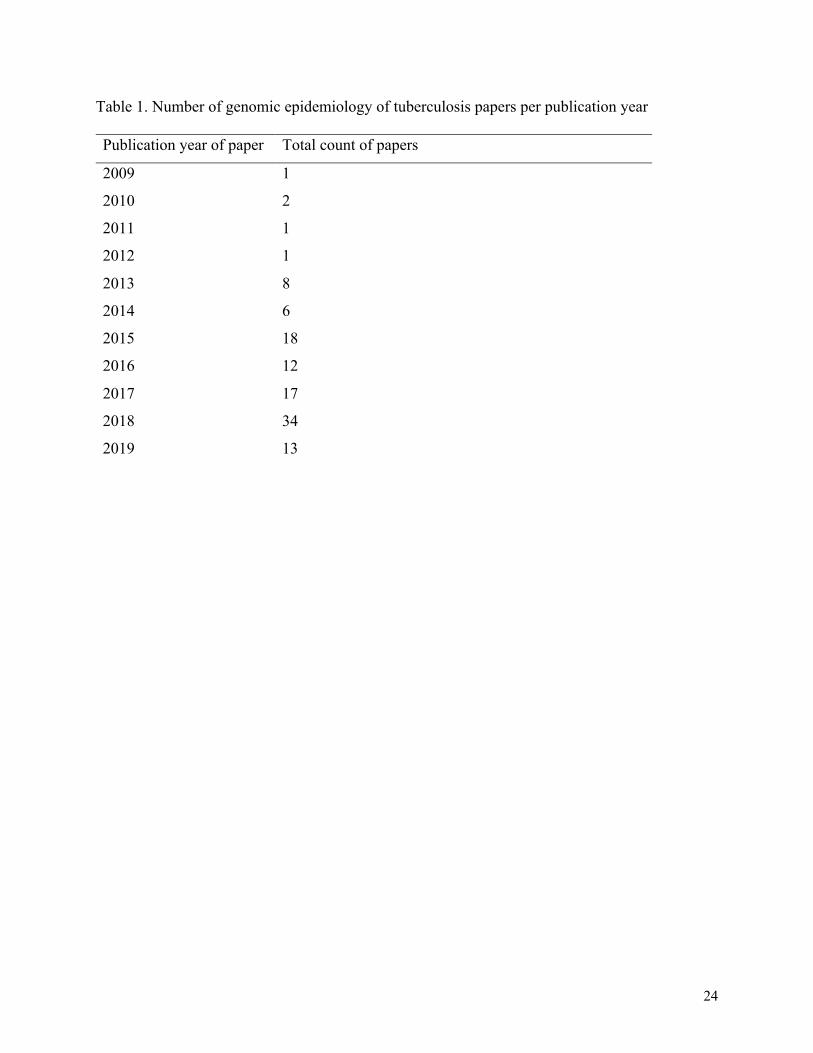
24
Table 1. Number of genomic epidemiology of tuberculosis papers per publication year
Publication year of paper Total count of papers
2009 1
2010 2
2011 1
2012 1
2013 8
2014 6
2015 18
2016 12
2017 17
2018 34
2019 13

25
Table 2. Descriptive statistics of independent variables
Independent variables Descriptive statistics
Impact factor Median
IQR
Min
Max
4.85
(3.06, 9.09)
1.67
79.26
H-index Median
IQR
Min
Max
34.5
(19, 51)
1.0
88.0
Continent North America
South America
Africa
Asia
Europe
Oceania
32
1
6
13
53
8
Sample size of isolates Median
IQR
Min
Max
83.0
(30, 277)
2.0
5715
IQR= Interquartile range, Min= minimum, Max= maximum

26
Table 3. Descriptive statistics for dependent variables
Visual and empirical tests of collinearity are displayed in Figure 1 and Table 4. Upon visual
inspection, the matrix scatterplot does not suggest any collinearity between IF, HI, and SS.
However, SS and SP appeared to be correlated given the graph’s slight linear trend (third row,
fourth column in Figure 1). Based on Spearman’s rho (0.86, P-value <0.01), and greater
completeness of data for SS, SP was excluded from statistical analysis.
Dependent variables Descriptive statistics
Count Median
Min
Max
IQR
8
4
14
(7, 9)
Proportion Median
Min
Max
IQR
0.5
0.16
0.75
(0.41, 0.58)
IQR= Interquartile range, Min= minimum, Max= maximum

27
Figure 1. Pairwise correlation matrix for impact factor (IF), H-index (HI), sample size of isolates
(SS), and sample size of patients (SP).
Table 4. Mean and variance of count data suggest over-dispersion
Mean Variance Ratio of variance and mean
8.01 3.44 0.43
4.2. Model fit
The AIC and log-likelihood for both quasi-Poisson and tobit models support the final
multivariate model in Table 6 and 7 respectively. The residual deviance values that were used to
calculate the pseudo-R2 for quasi-Poisson analysis are displayed in Table 5. The pseudo-R2
supported the full quasi-Poisson model.

28
Table 5. Residual deviance for independent variables
Independent variables Residual deviance
Impact factor 43.11
H-index 46.29
Continent 45.48
Sample size of isolates 45.23
IF + SS 42.96
IF + Continent + SS 41.72
Note: Null deviance for all models is 46.64. IF= Impact factor, HI= H-index, SS= sample size of isolates

29
Table 6. Tests of model fit for quasi-Poisson model
Quasi-Poisson model AIC Pseudo-R2 Log-likelihood DF
Impact factor 492.88 0.08 -242.44 4
Continent 497.25 0.02 -243.62 5
Sample size of isolates 495.00 0.03 -243.50 4
IF + SS 498.73 0.08 -242.36 7
IF + SS + Continent 505.50 0.11 -241.74 11
AIC: Akaike information criteria, DF = degrees of freedom, IF= impact factor, SS= sample size of isolates

30
Table 7. Tests of model fit for tobit model
Tobit model AIC Pseudo-R2 Log-likelihood DF
Impact factor -165.12 -0.07 87.56 221
Continent -155.55 -0.03 83.77 220
Sample size of isolates -167.61 -0.09 88.81 221
IF + SS -166.31 -0.12 91.15 218
IF + SS + Continent -163.05 -0.15 93.53 214
AIC: Akaike information criteria, DF = degrees of freedom, IF= impact factor, SS= sample size of isolates

31
Preamble to Manuscript I
The results of this thesis are presented in one manuscript. The manuscript presents a systematic
review of genomic epidemiology studies of TB, as well as the association between study
characteristics with reporting quality.
The appendix to the manuscript is included at the end of the chapter, and provides additional
information on the dataset and study methodology.
The results have previously been presented at:
The Union North American Regional (NAR) Meeting, February 2020. Chicago, Illinois,
United States of America. Poster presentation.

32
Chapter 5: Manuscript I
Whole genome sequencing for epidemiological studies of tuberculosis: a systematic review
of applications and reporting practices Cheng B1, Behr MA1, 2, Howden BP3, Cohen T4, Lee RS5,6*
1McGill University, Department of Epidemiology, Biostatistics and Occupational Health, Montreal, Canada 2Infectious Diseases and Immunity in Global Health Program, Research Institute of the McGill University Health Centre, Montreal, Quebec; McGill International TB Centre, Montreal, Quebec, Canada 3The Microbiological Diagnostic Unit Public Health Laboratory, University of Melbourne, Melbourne, Australia 4Yale University, New Haven, United States of America 5University of Toronto, Dalla Lana School of Public Health, Epidemiology Division, Toronto, Canada 6Harvard School of Public Health, Center for Communicable Disease Dynamics, Boston, United States of America
*Address correspondence to: Dr. Robyn Lee, PhD Epidemiology Division Dalla Lana School of Public Health Health Sciences Building 155 College Street, 6th floor Toronto, ON M5T3M7 [email protected] Word count: 3561 Figures: 4 Tables: 4

33
5.1. Summary Background: As pathogen genomics become increasingly important in infectious disease
epidemiology and public health, it is essential to assess the quality of studies that use these
approaches. Here, we investigate the reporting practices in genomic epidemiology studies of
tuberculosis (TB) using the 'Strengthening the Reporting of Observational studies in
Epidemiology’ (STROME-ID) guidelines as a benchmark.
Methods: MEDLINE, Embase Classic and Embase were searched on April 23, 2019. Two
reviewers determined eligibility, and completeness of STROME-ID criteria were extracted. A
pre-post publication analysis of the mean proportion of STROME-ID criteria was done using a
two-tailed t-test. Quasi-Poisson and tobit regression were used to examine associations between
study characteristics and the number, and proportion of criteria completed, respectively.
Results: 976 titles and abstracts were screened; 114 full-texts (2009-2019) met inclusion criteria.
The mean proportion of criteria met was 49·9% (range 16·3-75·0%). Reporting quality did not
change significantly before vs. after STROME-ID publication (0·51 vs. 0·46, P=0·26). The
number of criteria reported (among those applicable to all studies) was not associated with
impact factor, h-index, country of affiliation of the senior author, or sample size (SS). In terms of
reproducibility, 87·7% (n=100) of studies reported which bioinformatic tools were used, but only
33% (n= 33) reported corresponding version numbers. Sequencing data was available for 75·4%
(n= 86).
Conclusion: STROME-ID criteria were not fully met in the majority of genomic epidemiology
studies of TB. The high proportion of studies without sequencing data available highlights a key
concern for reproducibility in this field.
34
5.2. Introduction
Whole genome sequencing (WGS) has been increasingly used in genomic epidemiological
studies of tuberculosis (TB). Its superior resolution compared to classical genotyping methods
(e.g., restriction fragment length polymorphism or mycobacterial interspersed repetitive units
variable number tandem repeats) provides the opportunity to gain new insights into transmission
of TB and evolution of drug resistance, and potentially inform public health interventions.1-4
However, the ability of WGS to serve these purposes depends on the quality of the studies that
use this technology. This is true not only for TB, but for other pathogens as well. Presently,
heterogeneity of WGS bioinformatic pipelines pose challenges to the standardized reporting and
interpretation of results across genomic epidemiological studies.5, 6 Standardized reporting of
data and software would further facilitate comparison of WGS-based findings, and enable
researchers to assess the validity of published data.7
In 2007, guidelines called 'Strengthening the Reporting of Observational studies in
Epidemiology (STROBE)’ were published. These consisted of 22 criteria8 intended to help
readers better understand and assess the validity of observational studies. More recently, a new
set of guidelines was released in 2014, called the Strengthening the Reporting of Molecular
Epidemiology for Infectious Diseases (STROME-ID).9 These extended the original 22 STROBE
criteria with 20 additional criteria on study design, and reporting of results, that were specific to
genomic epidemiology studies (Supplemental Table 1). In this paper, unless otherwise reported,
we define STROME-ID as the combined set of STROBE and STROME-ID criteria.
The impact of STROBE guidelines on reporting quality has been inconsistent. Some systematic
reviews found improved reporting post-publication of STROBE guidelines,10, 11 while others
found it was not associated with improved reporting.12, 13 One systematic review suggested that
guidelines were not being appropriately applied, even when used, suggesting the guidelines may
lack clarity or be otherwise difficult to fulfill.14 To date, no study has investigated reporting
quality using STROME-ID for pathogen genomic epidemiology. To address this gap, we
systematically reviewed genomic epidemiology studies, using TB as an example, to determine
the extent to which STROME-ID criteria have been reported, and investigated whether specific
study characteristics were associated with reporting practices.

35
5.3. Methods
Search strategy
This study is registered on PROSPERO (CRD42017064395) and followed Preferred Reporting
Items for Systematic Reviews and Meta-Analyses (PRISMA) guidelines.15 We initially searched
MEDLINE, Embase Classic and Embase on May 3, 2017 using the terms “tuberculosis” and
“genom* sequencing”. We then updated this search on April 23, 2019. No restrictions were
placed on the start date or geographic location. We also systematically searched the pre-print
server bioRxiv. References of included articles were also hand-searched to ensure no eligible
articles were missed.
Inclusion and exclusion criteria
To be eligible for inclusion, studies needed to include patients with microbiologically-confirmed
TB and needed to have used WGS for typing of strains. Studies must have been published in
English, French or Spanish. As suggested by Field et al.,9 we considered studies to be genomic
epidemiology papers if they investigated the distribution or transmission dynamics of TB across
time, a particular population, or a geographic location in order to inform outbreaks, evaluate
infection control practices or perform surveillance. Studies were also included if they examined
risk factors for transmission (e.g., clustering), or if they distinguished between recurrent cases of
TB as relapse or reinfection. If studies described the evolution of TB strains and drug resistance,
or if they identified and classified new TB strains or lineages, they were included as well.
Finally, studies were included if they investigated the association between strain types or
mutations and clinical outcomes (e.g., death, treatment failure, relapse).
We excluded non-human studies, studies that were exclusively experimental (e.g., in-vitro or in-
vivo animal studies, or those that were purely diagnostic. The latter included studies where WGS
was exclusively used for predicting phenotypic drug resistance, without epidemiological aims.
We also excluded studies whose primary aim was to use WGS to develop a SNP-based typing
method (unless the overall analysis and description of the epidemiology still relied on WGS),
studies that exclusively compared typing methods, and studies with less than two patients.
Conference abstracts, editorials, and literature reviews were also excluded.

36
Data extraction
To determine if manuscript met eligibility criteria for STROME-ID, two reviewers
independently reviewed titles and abstracts (BC and RSL). Discrepancies were resolved by
discussion and third-party arbitration (TC). One reviewer (BC) was responsible for data
extraction. A second reviewer (RSL) independently checked a random sample consisting of 5%
of all eligible papers, with data extraction of these compared and discussed to clarify
discrepancies prior to extraction for the remaining articles (see Supplemental Methods for
detail).
Each STROME-ID variable was assessed, and scored as ‘complete’ or ‘incomplete’ (or assigned
‘not applicable’, where appropriate). The number of STROME-ID criteria and proportion of
those out of all criteria were then tabulated for each article, with the denominator for the
proportions excluding criteria that were not applicable (e.g., specific to a different study design).
In addition to this, we analyzed whether certain study characteristics were associated with the
number and proportion of fulfilled STROME-ID criteria, which were specified a priori. These
included sample size (SS), the journal impact factor (IF), the geographic region of senior
author’s primary affiliation, and h-index of the senior author. See Supplemental Methods for
rationale and details on how these data were collected/extracted, and analyzed.
Statistical Analysis
To assess differences in reporting following STROME-ID’s publication, the mean proportions of
completed criteria were compared before and after its publication date. A 6-month lag period
was included to account for articles that were already in press when STROME-ID was published.
Sensitivity analyses were also performed using a 12-month lag period, and excluding articles
published 6 and 12 months post-STROME-ID publication. Differences in mean proportions of
criteria were compared pre- and post-publication using a two-tailed t-test using R software
(version 1.1.456). The least and most reported STROME-ID criteria were also qualitatively
assessed to explore differences between periods, excluding criteria that were not eligible for >
20% of articles (Supplemental Figure 1 and 2).

37
To examine the association between study characteristics and reporting, two main approaches
were used. First, we used quasi-Poisson regression (to account for under-dispersion) with the
number of criteria completed as the dependent variable. Given not all criteria were applicable
across every study, this analysis was restricted to criteria that were applicable across all studies.
Second, we used tobit regression (censored between 0 and 1) to assess the association with the
proportion of criteria that were completed, including all studies in the analysis. The distribution
of IFs from all papers is shown in Supplemental Figure 3; IF was used as a categorical variable,
with categories chosen based on our experience with the metric, and previous studies that
examined correlates with IF.16, 17 For SS, we categorized this into quartiles due to low counts
across a wide range of data (Supplemental Figure 4). HI was analyzed as a linear variable.
Variables that had a P-value of < 0·20 in univariate analyses were included in the final model for
each analysis. Pseudo-R2, the Akaike information criterion, and log-likelihood were calculated to
assist with model selection and evaluate fit.
Missing data
The number of patients was missing for 18·4% (n=21) articles. IF was also not available for one
article published during the first year of the journal (2013), which we excluded from further
analysis, and from 15 articles published in 2019 (13.16%). For the latter, trends in IF were
reviewed over time to assess the degree of variation (Supplemental Table 2).
Role of the funding source
The funder of the study had no role in study design, data collection, data analysis, data
interpretation, or writing of the report. The corresponding author had full access to all the data in
the study and had final responsibility for the decision to submit for publication.
5.4. Results
A total of 976 titles and abstracts were screened. After full-text review and removal of
duplicates, 114 full-texts from among the original list of articles were eligible for inclusion
(Figure 1). No studies were excluded due to language of publication. A summary of the main
characteristics of included papers is presented in Table 1 (detailed information in Supplemental

38
Dataset 1). These were classified into themes based on their overall aims (not mutually-
exclusive: transmission, evolution, strain identification and clinical outcomes; Supplemental
Results).
Reporting practices of included articles
Overall, we found that the proportion of applicable STROME-ID criteria met among the
included papers in this study ranged from 16·3-75·0% (mean 49·9%, ± 11·88%). There was no
significant difference between the average proportion of criteria before and after guideline
publication (Table 2). For both the pre- and post-publication period, STROME-4.1 (definitions
for molecular terminology), and STROME-ID 8.1 (methods used to detect multiple-strain
infections) were among the two least reported criterion (pre-publication: 0%, post-publication:
11.34%, and pre-publication: 5.88%, post-publication: 7.45%, respectively). Across both time
periods, both STROBE-3 (study objectives and hypotheses) (pre-publication: 94.12%, post-
publication: 96.91%), and STROME-3.1 (the epidemiological objectives of using molecular
typing) were among the top reported criterion (pre-publication: 94.12%, post-publication:
96.91%, and pre-publication: 100%, post-publication: 94.85%, respectively). The same fifteen
criteria were ‘not eligible’ in ≥ 20% of papers for both pre- and post-publication periods
(Supplemental Figures 1 and 2); of these, 12 (80%) were from the original STROBE guidelines,
and pertained to specific epidemiological study designs and/or statistical analyses that are less
likely to be used in genomic epidemiology studies.
The average proportion of each individual STROME-ID criteria are shown in Figures 3 and 4 for
pre- and post-publication periods, respectively. During the pre-publication period (Figure 3),
there were 6 STROME-ID criteria that were not completed at all, while during post-publication
period, a single criterion was not completed (STROBE-16a). Similar results were obtained in
sensitivity analyses employing a 12-month lag and those excluding articles published during the
lag period, respectively (Supplemental Figures 5, 6, and 7).
Association of Study Characteristics
We initially considered sample size both in terms of the number of isolates and number of
individual patients. However, Spearman’s rho suggested evidence of collinearity between these

39
variables (0.86, P-value <0.01). In light of this, and missing data for the number of patients
(n=21 articles, 18·4%), the sample size of isolates was used for further analysis (SS). When
examining the IF between 2013-2018 for articles published in 2019, there was minimal variation
across these years (Supplemental Table 2), therefore the 2018 values were used. One paper in
2013 did not have an IF; this was excluded from the analysis. Moreover, due to low individual
country counts, we analyzed author affiliation by continent; there was only one count of South
America, which was subsequently combined with North America in the category “Americas”.
See Supplemental Table 3 for counts of papers per continent.
Univariate and multivariate analyses for quasi-Poisson and tobit regression models are presented
in Tables 3 and 4, respectively. As shown, HI did not meet criteria for inclusion in the full
multivariate model for either quasi-Poisson or tobit regression models. There was no association
between SS, IF, or geographic region of the senior author and the number of STROME-ID
criteria completed. Similar results were found in the multivariate tobit regression analysis,
although SS ≥ 277 was significantly associated with proportion of criteria met (P-value < 0.01).
There were seven papers with equal last authors whose primary affiliations were from different
continents; sensitivity analyses excluding these manuscripts yielded similar results
(Supplemental Tables 4 and 5).
Data-Sharing
As STROME-ID aims to support transparent reporting practices9, which is important for
reproducibility, we also investigated 1) whether authors reported the bioinformatics tools used,
along with corresponding version numbers for software, and 2) whether studies had uploaded
their genomic data to an open-access sequence archive. 87.7% (n=100) articles reported the
names of bioinformatic tools, however, only 33 (33%) of articles provided version numbers for
all of them (Supplemental Dataset 1). 75.4% (n= 86) of papers reported accession numbers for
their raw genomic data (Supplemental Table 6).
Effect on clinical and public health interventions
Given that genomic epidemiology studies aim to inform public health, we investigated whether
any articles reported clinical or public health actions as a result of their findings. Possibly due to

40
the retrospective nature of most of these studies, only 3 (2.6%) of included studies reported such
changes; specifically, WGS results helped identify linked cases, guide tailored drug treatment
based on drug-resistance analysis, and informed epidemiological investigations.18-20 It was noted
that one study reported their WGS findings to national tuberculosis surveillance programs, but
subsequent public health intervention was not possible because of the region’s political
instability.21
5.5. Discussion
STROME-ID was developed by an interdisciplinary team with expertise in infection control and
infectious diseases9 to facilitate reporting of study variables that were considered to be critical
for assessment of bias and study quality. Herein, we have used STROME-ID as the framework to
evaluate the reporting and transparency of genomic epidemiology studies of tuberculosis. This
comprehensive systematic review explored the application of WGS to genomic epidemiological
studies, completion of STROME-ID guidelines, and the association of specific study
characteristics with the degree of reporting.
We initially hypothesized that there would be improved reporting following the publication of
STROME-ID guidelines, however, we found no evidence of this in the current study. Only
~50%, on average, of STROME-ID criteria were completed before and after their publication, a
finding similar to that from other systematic reviews that have evaluated reporting quality post-
publication of STROBE. The proportion of criteria completed in these reviews ranged from
51·4%-76·5%.11, 12, 21, 22 While the proportions of criteria completed pre and post STROME-ID
publication were similar, however, we note there were more criteria completed, at least to a small
degree, in post-publication, as there were fewer criteria that were never completed in the post-
publication period (Figures 2 and 3). However, this could simply be due to undocumented
temporal changes, such as increased demand for reproducibility, and therefore unrelated to
STROME-ID.
There may be several reasons for the observed low reporting of STROME-ID criteria. That only
one included article specifically cited these guidelines20 suggests a lack of awareness may be an
issue.23 Some studies have also shown that formal journal endorsement of STROBE reporting

41
guidelines improves reporting adherence,24, 25 but to our knowledge, no publishers require
authors follow and report adherence to STROME-ID guidelines. Other practical limitations, such
as article word count and lack of online supplements, could have also influenced reporting
practices. That we did not find a single article that completed all STROME-ID criteria may also
suggest that many of the criteria in these guidelines may be too vague and/or difficult to employ
in practice. Further investigation is needed to evaluate this.
In terms of which criteria were less likely to be reported, we found STROME-ID criteria that
concerned key definitions, methods and potential limitations to be more poorly reported. While it
may seem trivial that the least completed STROME-ID criteria related to the defining of
molecular terminology, we would argue that standardization of basic microbiological
terminology is essential to allow for clear comparisons between studies and correct interpretation
of results for public health. Despite this, it has been suggested that, even in the same academic
field, terms such as strain, isolate, and clone may be used differently by different researchers.26
In addition to this, we note that STROME-ID 8·1 (methods for detecting multi-strain infections)
was also reported poorly across the entire study period; while this criterion was investigated by
some of the included papers, methods for discriminating within-host diversity using WGS data
are an area of active research,27, 28 which may explain why these were less frequently discussed.
Journal IF has been frequently used as an indicator of quality,29 by funding organizations30, 31 and
even for academic promotion.31However, our analyses suggest that reporting quality is not linked
to IF, adjusting for SS and geographic region of publication. Similarly, we found no association
between HI and reporting quality. This reinforces the limitations of such indicators as correlates
of the quality of scientific publications, supporting other recent studies.30, 32, 33 Moreover, SS was
not found to be associated with the number of criteria completed; studies with 153-276 isolates
completed a similar number of mean criteria as those with ≥ 277 isolates. While SS ≥ 277 was
associated with a higher proportion of criteria being reported, this was equivalent to a < 10%
increase compared to the reference of < 30 samples, and only a 2.0% difference from 153-276,
the adjacent category. Therefore, while this is statistically significant, we suspect this is not an
epidemiologically meaningful difference.

42
In addition to STROME-ID criteria, we also investigated whether bioinformatics tools (at a
minimum) were well-documented in TB genomic epidemiology papers as reproducibility is a
critical concern in genomic studies.34, 35 Although we found articles frequently reported the name
of the tool, we found that their corresponding version number of the software was reported much
less frequently - consistent with a recent analysis of RNA-seq methodology.36 The inclusion of
version numbers is essential to evaluate bias, reproduce workflows and compare results across
studies, which, as Simoneau et al. propose, suggests the need for standardized reporting of these
methodologic details.36 Even more surprisingly, we found that nearly 1/4 of studies did not
provide an Sequence Read Archive or Genbank accession number for their sequencing data -
with no improvement across the whole study period (Supplemental Dataset 1). This is
problematic; it not only prevents others from reproducing analyses and verifying others’
results,37 but in the context of infectious diseases, this can hinder public health investigations that
rely on global strain depositions for genomic context and/or for evaluation of cross-jurisdictional
transmission. We therefore suggest that data deposition should be a requirement for publication,
rather than just a ‘social norm’ in genomic epidemiology. However, such a change will be
unlikely without collaboration (and enforcement) by publishers.34
Overall, this study has a number of strengths. First, this represents a comprehensive review of
reporting practices in TB genomic epidemiology studies, starting with the first publication in TB
genomic epidemiology in 200938 and including a search of unpublished literature. Using
STROME-ID guidelines, we have identified key gaps in current reporting practices which may
affect interpretation of results; this adds to recent work that highlighted the implications of
differences in analytic pipelines.4 To our knowledge, this is the first study to examine the
application of STROME-ID guidelines - to TB or any other pathogen - and will serve as a role
model for other such investigations. In terms of analysis, we employed a rigorous analytic
approach, and conducted numerous sensitivity analyses to assess the robustness of our results,
lending further support to our inferences. Finally, in addition to STROME-ID criteria, we also
examined variables related to reproducibility - highlighting that even in a field that has
(arguably) embraced open-science, a large proportion of studies continue to not share their
underlying genomic data.

43
There are several limitations of this work. First, we note that, given that the STROME-ID
guidelines were only published in 2014, this may have not been enough time for widespread
uptake of these reporting guidelines at the time this study was conducted. However, as we did
not observe increased reporting practices even in 2019 - four years after publication - we
consider this to be somewhat unlikely. This view is supported by other studies suggesting low
adherence to STROBE post-publication.12, 13, 39 Furthermore, due to the limited number of
studies in each time period, we were not able to conduct an analysis controlling for secular trends
(e.g., an interrupted time-series). However, as we did not see evidence of any such trends on
visual assessment by year, this is unlikely to influence our pre/post comparison, and in our
regression analyses, we specifically accounted for time by using IF for the year of publication.
We also note that, as bioinformatics pipelines are not yet standardized,4 our review of reporting
bioinformatics tools was qualitative and did not require adherence to a specific pipeline or set of
steps. Had we required a minimum set of tools and/or analytic steps be reported, we expect this
would have painted an even worse picture of reproducibility of these pipelines. Finally, we did
not separate STROME-ID criteria that required multiple pieces of information (e.g., STROBE-
19, which required reporting of both limitations and direction of bias); thus, if the entire criterion
was not met, it was assigned “incomplete”. Similarly, for bioinformatics version numbers, we
considered reporting to be complete only if steps were reported with versions for all included
tools; there may be differences in reporting version numbers across steps in the analysis.
5.6. Conclusion
In this comprehensive review, we systematically examined reporting quality using STROME-ID
as a benchmark. We have shown that, in general, only ~50% of STROME-ID criteria were
completed. While the current study is limited to TB, we anticipate that many of these reporting
and transparency issues also apply to genomic epidemiology studies of other pathogens as well.
The reasons underlying this low level of reporting are unclear; similar reporting practices have
been found with other guidelines for other types of studies.40, 41 Possible reasons include
adherence to strict word limits, low author awareness and/or understanding of guidelines, and
possibly, resistance to change. Alternatively, it may be that these guidelines may be too difficult
to implement in practice. Further study is warranted to investigate these hypotheses.

44
Finally, in addition to STROME-ID, we also identified key reproducibility issues in many
studies, pertaining to methods of analysis and data sharing. For the latter, we suggest that data
deposition should be more than a ‘social norm’ in genomic epidemiology - it should be a
requirement for publication. This will require active support for journals, with real consequences
for failing to meet this obligation.36
5.7. Acknowledgements Contributions
BC was responsible for screening abstracts and titles for inclusion, data extraction, statistical
analysis, making the tables and figures, interpreting the data, and writing the first draft of the
manuscript. MAB assisted with interpreting the data, reviewed drafts of the manuscript, and co-
supervised BC. BPH and TC contributed to the protocol development, and reviewed the final
draft of the manuscript. TC also served as arbitrator for disagreement in study inclusion. RSL
conceived and led the study, designed the protocol and ran the searches, screened abstracts and
titles for inclusion, guided statistical analyses and interpretation of the data, wrote the first draft
of the manuscript with BC and co-supervised BC.
Funding
BC was supported by a CIHR Frederick Banting and Charles Best graduate award. MAB holds a
CIHR Foundation Grant (FDN-148362). BP Howden holds a Practitioner Fellowship from the
National Health and Medical Research Council (Australia). TC holds grants from the National
Institutes of Health, USA (R01 AI112438 and U54GM088558).
Declaration of interest
The authors declare no conflict of interests.

45
Manuscript references
1. Roetzer A, Diel R, Kohl TA, et al. Whole genome sequencing versus traditional
genotyping for investigation of a ycobacterium tuberculosis outbreak: A longitudinal molecular
epidemiological study. PLoS Medicine 2013; 10(2): e1001387.
2. Berg JS, Khoury MJ, Evans JP. Deploying whole genome sequencing in clinical practice
and public health: Meeting the challenge one bin at a time. Genet Med. 2011; 13(6): 499-504.
3. Lee RS, Behr MA. The implications of whole-genome sequencing in the control of
tuberculosis. Ther Adv Infect Dis 2016; 3(2): 47-62.
4. Meehan CJ, Goig GA, Kohl TA, et al. Whole genome sequencing of Mycobacterium
tuberculosis: current standards and open issues. Nat Rev Microbio.2019; 17(9): 533-45.
5. Peng RD, Dominici F, Zeger SL. Reproducible epidemiologic research. Am J Epidemiol
2006; 163(9): 783-9.
6. Kwong JC, McCallum N, Sintchenko V, Howden BP. Whole genome sequencing in
clinical and public health microbiology. Pathology 2015; 47(3): 199-210.
7. Phelan J, O’Sullivan DM, Machado D, et al. The variability and reproducibility of whole
genome sequencing technology for detecting resistance to anti-tuberculous drugs. Genome
Medicine 2016; 8(1): 132.
8. von Elm E, Altman DG, Egger M, Pocock SJ, Gøtzsche PC, Vandenbroucke JP. The
Strengthening the Reporting of Observational Studies in Epidemiology (STROBE) statement:
guidelines for reporting observational studies. J Clin Epidemiol 2008; 61(4): 344-9.
9. Field N, Cohen T, Struelens MJ, et al. Strengthening the Reporting of Molecular
Epidemiology for Infectious Diseases (STROME-ID): an extension of the STROBE statement.
Lancet Infect Dis 2014; 14(4): 341-52.
10. Sorensen AA, Wojahn RD, Manske MC, Calfee RP. Using the strengthening the
reporting of observational studies in epidemiology (STROBE) statement to assess reporting of
observational trials in hand surgery. J Hand Surg Am 2013; 38(8): 1584-9.
11. Agha RA, Fowler AJ, Limb C, et al. Impact of the mandatory implementation of
reporting guidelines on reporting quality in a surgical journal: A before and after study. Int J
Surg 2016; 30: 169-72.
46
12. Bastuji-Garin S, Sbidian E, Gaudy-Marqueste C, et al. Impact of STROBE statement
publication on quality of observational study reporting: interrupted time series versus before-
after analysis. PLoS ONE 2013; 8(8): e64733.
13. Rao A, Brück K, Methven S, et al. Quality of reporting and study design of CKD cohort
studies assessing mortality in the elderly before and after STROBE: a systematic review. PLoS
ONE 2016; 11(5): e0155078.
14. da Costa BR, Cevallos M, Altman DG, Rutjes AWS, Egger M. Uses and misuses of the
STROBE statement: bibliographic study. BMJ Open 2011; 1(1).
15. Liberati A, Altman DG, Tetzlaff J, et al. The PRISMA statement for reporting systematic
reviews and meta-analyses of studies that evaluate health care interventions: explanation and
elaboration. Ann Intern Med 2009; 151(4): W65-W94.
16. Kuroki LM, Allsworth JE, Peipert JF. Methodology and analytic techniques used in
clinical research: associations with journal impact factor. Obstet Gynecol 2009; 114(4): 877-84.
17. Falagas ME, Kouranos VD, Michalopoulos A, Rodopoulou SP, Batsiou MA,
Karageorgopoulos DE. Comparison of the distribution of citations received by articles published
in high, moderate, and low impact factor journals in clinical medicine. Intern Med J 2010; 40(8):
587-91.
18. Cabibbe AM, Trovato A, De Filippo MR, Ghodousi A, Rindi L, Garzelli C, et al.
Countrywide implementation of whole genome sequencing: an opportunity to improve
tuberculosis management, surveillance and contact tracing in low incidence countries. The Eur
Respir J 2018;51(6): 1800387.
19. Genestet C, Tatai C, Berland JL, Claude JB, Westeel E, Hodille E, et al. Prospective
whole-genome sequencing in tuberculosis outbreak investigation, France, 2017-2018. Emerg
Infect Dis 2019; 25(3): 589-92.
20. Walker TM, Merker M, Knoblauch AM, et al. A cluster of multidrug-resistant
Mycobacterium tuberculosis among patients arriving in Europe from the Horn of Africa: a
molecular epidemiological study. Lancet Infect Dis 2018; 18(4): 431-40.
21. Parsons NR, Hiskens R, Price CL, Achten J, Costa ML. A systematic survey of the
quality of research reporting in general orthopaedic journals. J Bone Joint Surg Br 2011; 93(9):
1154-9.

47
22. Hendriksma M, Joosten MHMA, Peters JPM, Grolman W, Stegeman I. Evaluation of the
quality of reporting of observational studies in otorhinolaryngology - Based on the STROBE
statement. PLoS ONE 2017; 12(1): e0169316.
23. Sharp MK, Bertizzolo L, Rius R, Wager E, Gómez G, Hren D. Using the STROBE
statement: survey findings emphasized the role of journals in enforcing reporting guidelines. J
Clin Epidemiol 2019; 116: 26-35.
24. Sharp MK, Tokalić R, Gómez G, Wager E, Altman DG, Hren D. A cross-sectional
bibliometric study showed suboptimal journal endorsement rates of STROBE and its extensions.
J Clin Epidemiol 2019; 107: 42-50.
25. Sharp MK, Utrobicic A, Gomez G, Cobo E, Wager E, Hren D. The STROBE extensions:
protocol for a qualitative assessment of content and a survey of endorsement. BMJ Open 2017;
7(10).
26. Van Belkum A, Tassios PT, Dijkshoorn L, et al. Guidelines for the validation and
application of typing methods for use in bacterial epidemiology. Clin Microbiol Infect 2007;
13(s3): 1-46.
27. Wyllie DH, Davidson JA, Grace Smith E, Rathod P, Crook DW, Peto TEA, et al. A
Quantitative evaluation of MIRU-VNTR typing against whole-genome sequencing for
identifying Mycobacterium tuberculosis transmission: a prospective observational cohort study.
EBioMedicine 2018; 34: 122-30.
28. Martin MA, Lee RS, Cowley LA, Gardy JL, Hanage WP. Martin MA, Lee RS, Cowley
LA, Gardy JL, Hanage WP. Within-host Mycobacterium tuberculosis diversity and its utility for
inferences of transmission. Microb Genom 2018; 4(10).
29. Lee KP, Schotland M, Bacchetti P, Bero LA. Association of journal quality indicators
with methodological quality of clinical research articles. JAMA 2002; 287(21): 2805-8.
30. Bornmann L, Williams R. Can the journal impact factor be used as a criterion for the
selection of junior researchers? A large-scale empirical study based on ResearcherID data. J
Informetr 2017; 11(3): 788-99.
31. Retzer V, Jurasinski G. Towards objectivity in research evaluation using bibliometric
indicators – A protocol for incorporating complexity. Basic App Ecology 2009; 10(5): 393-400.
32. Oswald A. An examination of the reliability of prestigious scholarly journals: evidence
and implications for decision-makers. Economica 2007; 74(293): 21-31.

48
33. Waltman L, Costas R, Jan van Eck N. Some Limitations of the H Index: A Commentary
on Ruscio and Colleagues' Analysis of Bibliometric Indices. Measurement 2012; 10(3): 172-5.
34. Nekrutenko A, Taylor J. Next-generation sequencing data interpretation: enhancing
reproducibility and accessibility. Nature Reviews Genetics 2012; 13(9): 667-72.
35. Reality check on reproducibility. Nature 2016; 533(7604).
36. Simoneau J, Dumontier S, Gosselin R, Scott MS. Current RNA-seq methodology
reporting limits reproducibility. Brief Bioinform 2019.
37. Miyakawa T. No raw data, no science: another possible source of the reproducibility
crisis. Mol Brain 2020; 13(1): 24.
38. Bryant JM, Schürch AC, van Deutekom H, et al. Inferring patient to patient transmission
of Mycobacterium tuberculosis from whole genome sequencing data. BMC Infect Dis 2013;
13(1): 110-.
39. Pouwels KB, Widyakusuma NN, Groenwold RHH, Hak E. Quality of reporting of
confounding remained suboptimal after the STROBE guideline. J Clin Epidemiol 2016; 69: 217-
24.
40. Ghimire S, Kyung E, Lee H, Kim E. Oncology trial abstracts showed suboptimal
improvement in reporting: a comparative before-and-after evaluation using CONSORT for
Abstract guidelines. J Clin Epidemiol 2014; 67(6): 658-66.
41. Fleming PS, Buckley N, Seehra J, Polychronopoulou A, Pandis N. Reporting quality of
abstracts of randomized controlled trials published in leading orthodontic journals from 2006 to
2011. Am Journal Orthod Dentofacial Orthop 2012; 142(4): 451-8.
42. Al-Ghafli H, Kohl TA, Merker M, et al. Drug-resistance profiling and transmission
dynamics of multidrug-resistant Mycobacterium tuberculosis in Saudi Arabia revealed by whole
genome sequencing. Infect Drug Resist 2018; 11: 2219-29.
43. Alaridah N, Hallback ET, Tangrot J, et al. Transmission dynamics study of tuberculosis
isolates with whole genome sequencing in southern Sweden. Sci Rep 2019; 9.
44. Arandjelovic I, Merker M, Richter E, et al. Longitudinal Outbreak of Multidrug-Resistant
Tuberculosis in a Hospital Setting, Serbia. Emerg Infect Dis 2019; 25(3): 555-8.
45. Arnold A, Witney AA, Vergnano S, et al. XDR-TB transmission in London: Case
management and contact tracing investigation assisted by early whole genome sequencing. J
Infect 2016; 73(3): 210-8.

49
46. Auld SC, Shah NS, Mathema B, et al. Extensively drug-resistant tuberculosis in South
Africa: genomic evidence supporting transmission in communities. Eur Respir J 2018; 52(4).
47. Ayabina D, Ronning JO, Alfsnes K, et al. Genome-based transmission modeling
separates imported tuberculosis from recent transmission within an immigrant population.
Microb Genom 2018; 4(10): e000219.
48. Bainomugisa A, Lavu E, Hiashiri S, et al. Multi-clonal evolution of multi-drug-
resistant/extensively drugresistant Mycobacterium tuberculosis in a high-prevalence setting of
Papua New Guinea for over three decades. Microb Genom 2018; 4(2): 000147.
49. Bouzouita I, Cabibbe AM, Trovato A, et al. Whole-genome sequencing of drug-resistant
Mycobacterium tuberculosis strains, Tunisia, 2012-2016. Emerg Infect Dis 2019; 25(3): 547-50.
50. Bjorn-Mortensen K, Soborg B, Koch A, et al. Tracing Mycobacterium tuberculosis
transmission by whole genome sequencing in a high incidence setting: a retrospective
population-based study in East Greenland. Scientific reports 2016; 6: 33180.
51. Black PA, de Vos M, Louw GE, et al. Whole genome sequencing reveals genomic
heterogeneity and antibiotic purification in Mycobacterium tuberculosis isolates. BMC Genomics
2015; 16(1): 857.
52. Brown TS, Narechania A, Walker JR, et al. Genomic epidemiology of Lineage 4
Mycobacterium tuberculosis subpopulations in New York City and New Jersey, 1999-2009.
BMC Genomics 2016; 17(1): 947.
53. Bryant JM, Harris SR, Parkhill J, et al. Whole-genome sequencing to establish relapse or
re-infection with Mycobacterium tuberculosis: A retrospective observational study. Lancet
Respir Med 2013; 1(10): 786-92.
54. Bui DP, Oren E, Roe DJ, et al. A Case-Control Study to Identify Community Venues
Associated with Genetically-clustered, Multidrug-resistant Tuberculosis Disease in Lima, Peru.
Clin Infect Dis 2018; 68(9): 1547-55.
55. Casali N, Nikolayevskyy V, Balabanova Y, et al. Microevolution of extensively drug-
resistant tuberculosis in Russia. Genome Research 2012; 22(4): 735-45.
56. Casali N, Nikolayevskyy V, Balabanova Y, et al. Evolution and transmission of drug-
resistant tuberculosis in a Russian population. Nature Genetics 2014; 46(3): 279-86.

50
57. Casali N, Broda A, Harris SR, Parkhill J, Brown T, Drobniewski F. Whole Genome
Sequence Analysis of a Large Isoniazid-Resistant Tuberculosis Outbreak in London: A
Retrospective Observational Study. PLoS Medicine 2016; 13(10): e1002137.
58. Chatterjee A, Nilgiriwala K, Saranath D, Rodrigues C, Mistry N. Whole genome
sequencing of clinical strains of Mycobacterium tuberculosis from Mumbai, India: A potential
tool for determining drug-resistance and strain lineage. Tuberculosis 2017; 107: 63-72.
59. Clark TG, Mallard K, Coll F, et al. Elucidating emergence and transmission of multidrug-
resistant tuberculosis in treatment experienced patients by whole genome sequencing. PLoS ONE
2013; 8(12): e83012.
60. Cohen KA, Abeel T, Manson McGuire A, et al. Evolution of Extensively Drug-Resistant
Tuberculosis over Four Decades: Whole Genome Sequencing and Dating Analysis of
Mycobacterium tuberculosis Isolates from KwaZulu-Natal. PLoS Medicine 2015; 12(9):
e1001880.
61. Comas I, Hailu E, Kiros T, et al. Population Genomics of Mycobacterium tuberculosis in
Ethiopia Contradicts the Virgin Soil Hypothesis for Human Tuberculosis in Sub-Saharan Africa.
Current Biology 2015; 25(24): 3260-6.
62. Comas I, Coscolla M, Luo T, et al. Out-of-Africa migration and Neolithic coexpansion of
Mycobacterium tuberculosis with modern humans. Nat Genet 2013; 45(10): 1176-82.
63. Coscolla M, Barry PM, Oeltmann JE, et al. Genomic epidemiology of multidrug-resistant
Mycobacterium tuberculosis during transcontinental spread. J Infect Dis 2015; 212(2): 302-10.
64. Dheda K, Limberis JD, Pietersen E, et al. Outcomes, infectiousness, and transmission
dynamics of patients with extensively drug-resistant tuberculosis and home-discharged patients
with programmatically incurable tuberculosis: a prospective cohort study. Lancet Respir Med
2017; 5(4): 269-81.
65. Dixit A, Freschi L, Vargas R, et al. Whole genome sequencing identifies bacterial factors
affecting transmission of multidrug-resistant tuberculosis in a high-prevalence setting. Sci Rep
2019; 9.
66. Doroshenko A, Pepperell CS, Heffernan C, et al. Epidemiological and genomic
determinants of tuberculosis outbreaks in First Nations communities in Canada. BMC Med 2018;
16.

51
67. Eldholm V, Monteserin J, Rieux A, et al. Four decades of transmission of a multidrug-
resistant Mycobacterium tuberculosis outbreak strain. Nature Communications 2015; 6.
68. Fiebig L, Kohl TA, Popovici O, et al. A joint cross-border investigation of a cluster of
multidrug-resistant tuberculosis in Austria, Romania and Germany in 2014 using classic,
genotyping and whole genome sequencing methods: Lessons learnt. Eurosurveillance 2017;
22(2).
69. Gardy JL, Johnston JC, Sui SJ, et al. Whole-genome sequencing and social-network
analysis of a tuberculosis outbreak. N Engl J Med 2011; 364(8): 730-9.
70. Gautam SS, Aogain MM, Cooley LA, et al. Molecular epidemiology of tuberculosis in
Tasmania and genomic characterisation of its first known multi-drug resistant case. PLoS ONE
2018; 13(2): e0192351.
71. Gautam SS, Mac Aogain M, Bower JE, Basu I, O'Toole RF. Differential carriage of
virulence-associated loci in the New Zealand Rangipo outbreak strain of Mycobacterium
tuberculosis. Infectious Diseases 2017; 49(9): 680-8.
72. Glynn JR, Guerra-Assuncao JA, Houben RM, et al. Whole Genome Sequencing Shows a
Low Proportion of Tuberculosis Disease Is Attributable to Known Close Contacts in Rural
Malawi. PLoS ONE 2015; 10(7): e0132840.
73. Guerra-Assuncao JA, Crampin AC, Houben RM, et al. Large-scale whole genome
sequencing of M. tuberculosis provides insights into transmission in a high prevalence area. elife
2015; 4: 03.
74. Guerra-Assunçao JA, Houben RMGJ, Crampin AC, et al. Recurrence due to relapse or
reinfection with Mycobacterium tuberculosis: a whole-genome sequencing approach in a large,
population-based cohort with a high HIV infection prevalence and active follow-up. J Infect Dis
2015; 211(7): 1154-63.
75. Guthrie JL, Delli Pizzi A, Roth D, et al. Genotyping and Whole-Genome Sequencing to
Identify Tuberculosis Transmission to Pediatric Patients in British Columbia, Canada, 2005-
2014. J Infect Dis 2018; 218(7): 1155-63.
76. Ho ZJM, Chee CBE, Ong RTH, et al. Investigation of a cluster of multi-drug resistant
tuberculosis in a high-rise apartment block in Singapore. International J Infect Dis 2018; 67: 46-
51.

52
77. Holden KL, Bradley CW, Curran ET, et al. Unmasking leading to a healthcare worker
Mycobacterium tuberculosis transmission. Journal of Hospital Infection 2018; 100(4): E226-
E32.
78. Holt KE, McAdam P, Thai PVK, et al. Frequent transmission of the Mycobacterium
tuberculosis Beijing lineage and positive selection for the EsxW Beijing variant in Vietnam. Nat
Genet 2018; 50(6): 849-56.
79. Huang H, Ding N, Yang T, et al. Cross-sectional whole-genome sequencing and
epidemiological study of multidrug-resistant Mycobacterium tuberculosis in China. Clin Infect
Dis: 2019: 69(30):405-413.
80. Ioerger TR, Koo S, No E-G, et al. Genome analysis of multi- and extensively-drug-
resistant tuberculosis from KwaZulu-Natal, South Africa. PloS one 2009; 4(11): e7778.
81. Ioerger TR, Feng Y, Chen X, et al. The non-clonality of drug resistance in Beijing-
genotype isolates of Mycobacterium tuberculosis from the Western Cape of South Africa. BMC
Genomics 2010; 11:670.
82. Ismail NA, Omar SV, Joseph L, et al. Defining bedaquiline susceptibility, resistance,
cross-resistance and associated genetic determinants: a retrospective cohort study. EBioMedicine
2018; 28: 136-42.
83. Jajou R, de Neeling A, Rasmussen EM, et al. A predominant variable-number tandem-
repeat cluster of Mycobacterium tuberculosis isolates among asylum seekers in the Netherlands
and Denmark, deciphered by whole-genome sequencing. J Clin Microbiol 2018; 56(2).
84. Jajou R, De Neeling A, Van Hunen R, et al. Epidemiological links between tuberculosis
cases identified twice as efficiently by whole genome sequencing than conventional molecular
typing: A population-based study. PLoS ONE 2018; 13(4): e0195413.
85. Jiang Q, Lu L, Wu J, et al. Assessment of tuberculosis contact investigation in Shanghai,
China: An 8-year cohort study. Tuberculosis 2018; 108: 10-5.
86. Kato-Maeda M, Ho C, Passarelli B, et al. Use of whole genome sequencing to determine
the microevolution of mycobacterium tuberculosis during an outbreak. PLoS ONE 2013; 8
(3):e58235.
87. Koster K, Largen A, Foster JT, et al. Whole genome SNP analysis suggests unique
virulence factor differences of the Beijing and Manila families of Mycobacterium tuberculosis
found in Hawaii. PLoS ONE 2018; 13(7).
53
88. Koster KJ, Largen A, Foster JT, et al. Genomic sequencing is required for identification
of tuberculosis transmission in Hawaii. BMC Infect Dis2018; 18.
89. Kato-Miyazawa M, Miyoshi-Akiyama T, Kanno Y, Takasaki J, Kirikae T, Kobayashi N.
Genetic diversity of Mycobacterium tuberculosis isolates from foreign-born and Japan-born
residents in Tokyo. Clinical Microbiology and Infection 2015; 21(3): 248.
90. Korhonen V, Smit PW, Haanpera M, et al. Whole genome analysis of Mycobacterium
tuberculosis isolates from recurrent episodes of tuberculosis, Finland, 1995-2013. Clin Microbiol
Infect 2016; 22(6): 549-54.
91. Lalor MK, Casali N, Walker TM, et al. The use of whole-genome sequencing in cluster
investigation of a multidrug-resistant tuberculosis outbreak. Eur Resp J 2018; 51(6).
92. Lanzas F, Karakousis PC, Sacchettini JC, Ioerger TR. Multidrug-resistant tuberculosis in
panama is driven by clonal expansion of a multidrug-resistant mycobacterium tuberculosis strain
related to the KZN extensively drug-resistant m. tuberculosis strain from South Africa. J Clin
Microbiol 2013; 51(10): 3277-85.
93. Lee RS, Radomski N, Proulx JF, et al. Reemergence and amplification of tuberculosis in
the Canadian Arctic. J Infect Dis 2015; 211(12): 1905-14.
94. Lee RS, Radomski N, Proulx J-F, et al. Population genomics of Mycobacterium
tuberculosis in the Inuit. Proc Natl Acad Sci USA 2015; 112(44): 13609-14.
95. Luo T, Comas I, Luo D, et al. Southern East Asian origin and coexpansion of
Mycobacterium tuberculosis Beijing family with Han Chinese. Proc Natl Acad Sci U S A 2015;
112(26): 8136-41.
96. Luo T, Yang C, Peng Y, et al. Whole-genome sequencing to detect recent transmission of
Mycobacterium tuberculosis in settings with a high burden of tuberculosis. Tuberculosis 2014;
94(4): 434-40.
97. Ma MJ, Yang Y, Wang HB, et al. Transmissibility of tuberculosis among school
contacts: An outbreak investigation in a boarding middle school, China. Infect Genet Evol 2015;
32: 148-55.
98. Macedo R, Pinto M, Borges V, et al. Evaluation of a gene-by-gene approach for
prospective whole-genome sequencing-based surveillance of multidrug resistant Mycobacterium
tuberculosis. Tuberculosis 2019; 115: 81-8.
54
99. Madrazo-Moya CF, Cancino-Munoz I, Cuevas-Cordoba B, et al. Whole genomic
sequencing as a tool for diagnosis of drug and multidrug-resistance tuberculosis in an endemic
region in Mexico. PLoS ONE 2019; 14(6).
100. Mai TQ, Martinez E, Menon R, et al. Mycobacterium tuberculosis Drug Resistance and
Transmission among Human Immunodeficiency Virus-Infected Patients in Ho Chi Minh City,
Vietnam. Am J Trop Med Hy g2018; 99(6): 1397-406.
101. Makhado NA, Matabane E, Faccin M, et al. Outbreak of multidrug-resistant tuberculosis
in South Africa undetected by WHO-endorsed commercial tests: an observational study. Lancet
Infect Dis 2018; 18(12): 1350-9.
102. Malm S, Linguissi LSG, Tekwu EM, et al. New Mycobacterium tuberculosis complex
sublineage, Brazzaville, Congo. Emerg Infect Dis 2017; 23(3): 423-9.
103. Manson AL, Abeel T, Galagan JE, et al. Mycobacterium tuberculosis whole genome
sequences from Southern India suggest novel resistance mechanisms and the need for region-
specific diagnostics. 2017; 64(11): 1494-501.
104. Manson AL, Cohen KA, Abeel T, et al. Genomic analysis of globally diverse
Mycobacterium tuberculosis strains provides insights into the emergence and spread of
multidrug resistance. Nature Genetics 2017; 49(3): 395-402.
105. Mehaffy C, Guthrie JL, Alexander DC, Stuart R, Rea E, Jamieson FB. Marked
microevolution of a unique Mycobacterium tuberculosis Strain in 17 years of ongoing
transmission in a high risk population. PLoS ONE 2014; 9(11): 0112928.
106. Merker M, Blin C, Mona S, et al. Evolutionary history and global spread of the
Mycobacterium tuberculosis Beijing lineage. Nature Genetics 2015; 47(3): 242-9.
107. Merker M, Barbier M, Cox H, et al. Compensatory evolution drives multidrug-resistant
tuberculosis in Central Asia. elife 2018; 7.
108. Merker M, Kohl TA, Roetzer A, et al. Whole genome sequencing reveals complex
evolution patterns of multidrug-resistant Mycobacterium tuberculosis Beijing strains in patients.
PLoS ONE 2013; 8(12): e82551.
109. Mizukoshi F, Miyoshi-Akiyama T, Iwai H, et al. Genetic diversity of Mycobacterium
tuberculosis isolates from Tochigi prefecture, a local region of Japan. BMC Infect Dis2017;
17(1): 365.

55
110. Mokrousov I, Shitikov E, Skiba Y, Kolchenko S, Chernyaeva E, Vyazovaya A. Emerging
peak on the phylogeographic landscape of Mycobacterium tuberculosis in West Asia: Definitely
smoke, likely fire. Mol Phylogenetics Evol 2017; 116: 202-12.
111. Mortimer TD, Weber AM, Pepperell CS. Signatures of selection at drug resistance loci in
Mycobacterium tuberculosis. mSystems 2018; 3(1).
112. Nelson KN, Shah NS, Mathema B, et al. Spatial patterns of extensively drug-resistant
tuberculosis transmission in KwaZulu-Natal, South Africa. J Infect Dis 2018; 218(12): 1964-73.
113. Norheim G, Seterelv S, Arnesen TM, et al. Tuberculosis outbreak in an educational
institution in Norway. J Clin Microbiol 2017; 55(5): 1327-33.
114. Ocheretina O, Shen L, Escuyer VE, et al. Whole genome sequencing investigation of a
tuberculosis outbreak in Port-au-Prince, Haiti caused by a strain with a "Low-Level" rpoB
Mutation L511P - Insights into a Mechanism of Resistance Escalation. PLoS ONE 2015; 10(6):
e0129207.
115. O'Neill MB, Shockey A, Zarley A, et al. Lineage specific histories of Mycobacterium
tuberculosis dispersal in Africa and Eurasia. Mol Ecol 2019; 28(13): 3241-56.
116. Otchere ID, Coscolla M, Sanchez-Buso L, Asante-Poku A, Meehan C, Osei-Wusu S, et
al. Comparative genomics of Mycobacterium africanum Lineage 5 and Lineage 6 from Ghana
suggests different ecological niches. Sci Rep 2018;8;11269.
117. Outhred AC, Holmes N, Sadsad R, et al. Identifying likely transmission pathways within
a 10-year community outbreak of tuberculosis by high-depth whole genome sequencing. PLoS
ONE 2016; 11(3): e0150550.
118. Packer S, Green C, Brooks-Pollock E, Chaintarli K, Harrison S, Beck CR. Social network
analysis and whole genome sequencing in a cohort study to investigate TB transmission in an
educational setting. BMC Infect Dis 2019; 19.
119. Panossian B, Salloum T, Araj GF, Khazen G, Tokajian S. First insights on the genetic
diversity of MDR Mycobacterium tuberculosis in Lebanon. BMC Infect Dis 2018; 18.
120. Parvaresh L, Crighton T, Martinez E, Bustamante A, Chen S, Sintchenko V. Recurrence
of tuberculosis in a low-incidence setting: a retrospective cross-sectional study augmented by
whole genome sequencing. BMC Infect Dis 2018; 18.
121. Perdigao J, Silva H, Machado D, et al. Unraveling genomic diversity and evolution in
lisbon, portugal, a highly drug resistant setting. BMC Genomics 2014; 15 (1): (991).

56
122. Perez-Lago L, Comas I, Navarro Y, et al. Whole genome sequencing analysis of
intrapatient microevolution in mycobacterium tuberculosis: potential impact on the inference of
tuberculosis transmission. J Infect Dis 2014; 209(1): 98-108.
123. Regmi SM, Chaiprasert A, Kulawonganunchai S, et al. Whole genome sequence analysis
of multidrug-resistant Mycobacterium tuberculosis Beijing isolates from an outbreak in
Thailand. Mol Genet Genomics 2015; 290(5): 1933-41.
124. Roycroft E, O'Toole RF, Fitzgibbon MM, et al. Molecular epidemiology of multi- and
extensively-drug-resistant Mycobacterium tuberculosis in Ireland, 2001-2014. J Infect 2018;
76(1): 55-67.
125. Ruesen C, Chaidir L, van Laarhoven A, et al. Large-scale genomic analysis shows
association between homoplastic genetic variation in Mycobacterium tuberculosis genes and
meningeal or pulmonary tuberculosis. BMC Genomics 2018; 19(1): 122.
126. Rutaihwa LK, Menardo F, Stucki D, et al. Multiple introductions of Mycobacterium
tuberculosis Lineage 2–Beijing into Africa over centuries. Front Ecol and Evol 2019; 7(112).
127. Saelens JW, Lau-Bonilla D, Moller A, et al. Whole genome sequencing identifies
circulating Beijing-lineage Mycobacterium tuberculosis strains in Guatemala and an associated
urban outbreak. Tuberculosis 2015; 95(6): 810-6.
128. Satta G, Witney AA, Shorten RJ, Karlikowska M, Lipman M, McHugh TD. Genetic
variation in Mycobacterium tuberculosis isolates from a London outbreak associated with
isoniazid resistance. BMC Med 2016; 14: 1-9.
129. Schurch AC, Kremer K, Daviena O, et al. High-resolution typing by integration of
genome sequencing data in a large tuberculosis cluster. J Clin Microbiol 2010; 48(9): 3403-6.
130. Senghore M, Otu J, Witney A, et al. Whole-genome sequencing illuminates the evolution
and spread of multidrug-resistant tuberculosis in Southwest Nigeria. PLoS ONE 2017; 12(9):
e0184510.
131. Seraphin MN, Didelot X, Nolan DJ, et al. Genomic Investigation of a Mycobacterium
tuberculosis Outbreak Involving Prison and Community Cases in Florida, United States. Am J
Trop Med Hyg2018; 99(4): 867-74.
132. Shah NS, Auld SC, Brust JCM, et al. Transmission of extensively drug-resistant
tuberculosis in South Africa. N Engl J Med 2017; 376(3): 243-53.
57
133. Smit PW, Vasankari T, Aaltonen H, et al. Enhanced tuberculosis outbreak investigation
using whole genome sequencing and IGRA. Eur Resp J2015; 45(1): 276-9.
134. Sobkowiak B, Glynn JR, Houben R, et al. Identifying mixed Mycobacterium tuberculosis
infections from whole genome sequence data. BMC Genomics 2018; 19(1): 613.
135. Stucki D, Ballif M, Bodmer T, et al. Tracking a tuberculosis outbreak over 21 years:
strain-specific single-nucleotide polymorphism typing combined with targeted whole-genome
sequencing. J Infect Dis 2015; 211(8): 1306-16.
136. Stucki D, Ballif M, Egger M, et al. Standard Genotyping Overestimates Transmission of
Mycobacterium tuberculosis among Immigrants in a Low-Incidence Country. J Clin Microbiol
2016; 54(7): 1862-70.
137. Stucki D, Brites D, Jeljeli L, et al. Mycobacterium tuberculosis lineage 4 comprises
globally distributed and geographically restricted sublineages. Nat Genet 2016; 48(12): 1535-43.
138. Tyler AD, Randell E, Baikie M, et al. Application of whole genome sequence analysis to
the study of Mycobacterium tuberculosis in Nunavut, Canada. PLoS ONE 2017; 12(10):
e0185656.
139. Vaziri F, Kohl TA, Ghajavand H, et al. Genetic Diversity of Multi- and Extensively
Drug-Resistant Mycobacterium tuberculosis Isolates in the Capital of Iran, Revealed by Whole-
Genome Sequencing. J Clin Microbiol 2019; 57(1).
140. Walker TM, Ip CL, Harrell RH, et al. Whole-genome sequencing to delineate
Mycobacterium tuberculosis outbreaks: a retrospective observational study. Lancet Infect Dis
2013; 13(2): 137-46.
141. Walker TM, Lalor MK, Broda A, et al. Assessment of Mycobacterium tuberculosis
transmission in Oxfordshire, UK, 2007-12, with whole pathogen genome sequences: An
observational study. Lancet Respir Med 2014; 2(4): 285-92.
142. Winglee K, Manson McGuire A, Maiga M, et al. Whole genome sequencing of
mycobacterium africanum strains from mali provides insights into the mechanisms of geographic
restriction. PLoS Negl Trop Dis 2016; 10(1): e0004332.
143. Witney AA, Bateson AL, Jindani A, et al. Use of whole-genome sequencing to
distinguish relapse from reinfection in a completed tuberculosis clinical trial. BMC Med 2017;
15(1): 71.
58
144. Wollenberg KR, Desjardins CA, Zalutskaya A, et al. Whole-genome sequencing of
mycobacterium tuberculosis provides insight into the evolution and genetic composition of drug-
resistant tuberculosis in Belarus. J Clin Microbiol 2017; 55(2): 457-60.
145. Wyllie DH, Davidson JA, Smith EG, et al. A Quantitative Evaluation of MIRU-VNTR
Typing Against Whole-Genome Sequencing for Identifying Mycobacterium tuberculosis
Transmission: A Prospective Observational Cohort Study. Ebiomedicine 2018; 34: 122-30.
146. Yang C, Luo T, Shen X, et al. Transmission of multidrug-resistant Mycobacterium
tuberculosis in Shanghai, China: a retrospective observational study using whole-genome
sequencing and epidemiological investigation. Lancet Infect Dis 2017; 17(3): 275-84.
147. Yang CG, Lu LP, Warren JL, et al. Internal migration and transmission dynamics of
tuberculosis in Shanghai, China: an epidemiological, spatial, genomic analysis. Lancet Infect Dis
2018; 18(7): 788-95.
148. Yimer SA, Namouchi A, Zegeye ED, et al. Deciphering the recent phylogenetic
expansion of the originally deeply rooted Mycobacterium tuberculosis lineage 7. BMC Evol Biol
2016; 16(1): 146.

59
Manuscript figures and tables
Figure 1. PRISMA diagram of the stages of the systematic review.
Search and selection process during the systematic review. Full texts excluded because study was
a conference abstract or case report (n=3), lacked epidemiological aims (n=12), drug-resistance
prediction (n=2), inadequate or no WGS use (n=5), did not meet inclusion criteria (n=2).

60
Figure 2. Proportion of STROME-ID criteria met with 6-month lag pre-publication.
The average proportion of STROME-ID criteria met was variable across articles prior to
guideline publication, accounting for a six-month lag. Overall, the four most frequently
completed STROME-ID criteria included explaining the scientific background and rationale
(STROBE-2), stating the epidemiological objectives of using molecular typing (STROME-3.1),
stating the study’s overarching objectives and hypotheses (STROBE-3), and summarizing key
results with reference to study objectives (STROBE-18). The criterion requiring definitions for
molecular terminology (STROME-4.1) was not completed. The other two least completed
criterion were: methods used to detect multiple-strain infections (STROME-ID 8.1), and
discussion of limitations and direction of bias (STROBE-19).

61
Figure 3. Proportion of STROME-ID criteria met with 6-month lag post-publication.
The average proportion of STROME-ID criteria met was also variable post-guideline
publication, accounting for a six-month lag. The four most frequently completed STROME-ID
criteria were: explaining the scientific background and rationale (STROBE-2), stating the
epidemiological objectives of using molecular typing (STROME-3.1), stating source of
participants and specimens, including sampling frame (STROME-ID 6.1), and summarizing key
results (STROBE-18). The three least reported criterion were: definitions for molecular
terminology (STROME-4.1), methods used to detect multiple-strain infections (STROME-ID
8.1), and alternative explanations for explaining transmission chain results, (STROME-ID 19.1).

62
Figure 4. Proportion of STROME-ID criteria met post-publication, excluding articles from the
first 6 months following guideline publication.
A sensitivity analysis for the time period post-guideline publication was conducted, which
excludes articles published in a six-month publication lag. Six criteria were not completed. This
was also observed in the pre-guideline publication period that accounted for the six-month lag.
The least completed STROME-ID criterion required definitions for molecular terminology
(STROME-ID 4.1). The most completed STROME-ID criterion required stating the
epidemiological objectives of using molecular typing (STROME-ID 3.1).

63
Table 5. Summary of included studies
First author Study year Study aims Country or countries Sample size
isolates
Sample size
patients
Sequencing
platform(s)
Al-Ghafli 1 2018 Elucidate transmission dynamics
and describe resistance-conferring
mutations.
Saudia Arabia 205 NR Illumina
NextSeq
Alaridah 2 2019 Compare genotype techniques to
determine transmission in low
incidence country.
Sweden 100 52 Illumina HiSeq
Arandjelovic 3 2019 Explore countrywide transmission
routes, strain dynamics, and
bacterial evolution.
Serbia 103 110 Illumina MiSeq
and HiSeq
Arnold 4 2016 Describe XDR-TB cluster in the
UK.
England, Scotland,
Wales, Ireland
4 35 Not described
Auld 5 2018 Determine genomic transmission
links between individuals without
an epidemiologic link.
South Africa 342 386 Illumina MiSeq
Ayabina 6 2018 Infer if cases represent important
or local transmission.
Norway 129 127 Illumina MiSeq
and NextSeq
Bainomugisa 7 2018 Describe strains driving the
epidemic and associated drug
resistance mutations.
Daru Island, Papua
New Guinea
100 NR Illumina MiSeq
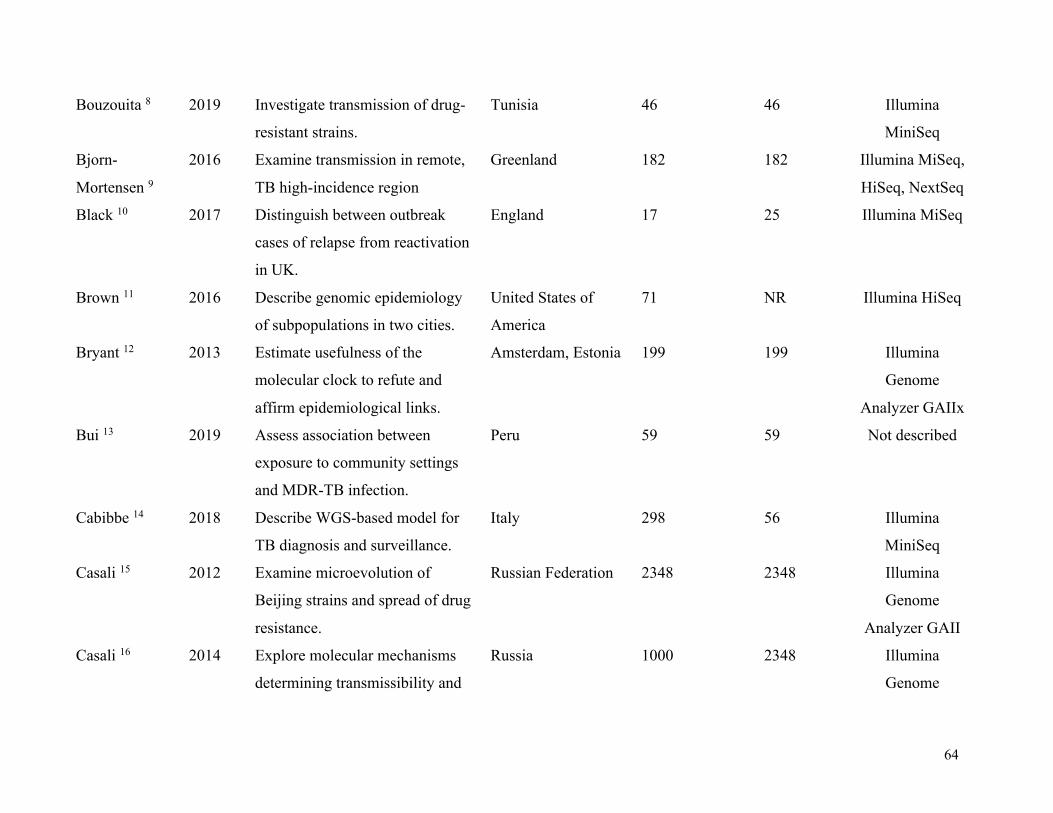
64
Bouzouita 8 2019 Investigate transmission of drug-
resistant strains.
Tunisia 46 46 Illumina
MiniSeq
Bjorn-
Mortensen 9
2016 Examine transmission in remote,
TB high-incidence region
Greenland 182 182 Illumina MiSeq,
HiSeq, NextSeq
Black 10 2017 Distinguish between outbreak
cases of relapse from reactivation
in UK.
England 17 25 Illumina MiSeq
Brown 11 2016 Describe genomic epidemiology
of subpopulations in two cities.
United States of
America
71 NR Illumina HiSeq
Bryant 12 2013 Estimate usefulness of the
molecular clock to refute and
affirm epidemiological links.
Amsterdam, Estonia 199 199 Illumina
Genome
Analyzer GAIIx
Bui 13 2019 Assess association between
exposure to community settings
and MDR-TB infection.
Peru 59 59 Not described
Cabibbe 14 2018 Describe WGS-based model for
TB diagnosis and surveillance.
Italy 298 56 Illumina
MiniSeq
Casali 15 2012 Examine microevolution of
Beijing strains and spread of drug
resistance.
Russian Federation 2348 2348 Illumina
Genome
Analyzer GAII
Casali 16 2014 Explore molecular mechanisms
determining transmissibility and
Russia 1000 2348 Illumina
Genome
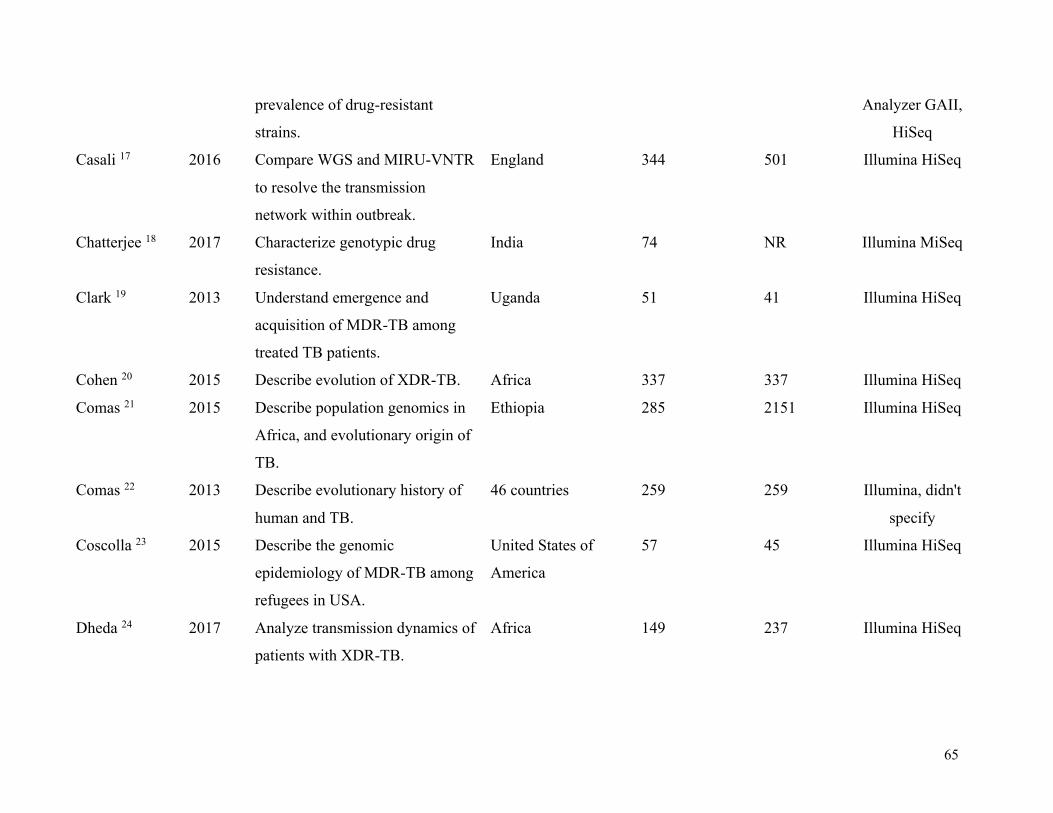
65
prevalence of drug-resistant
strains.
Analyzer GAII,
HiSeq
Casali 17 2016 Compare WGS and MIRU-VNTR
to resolve the transmission
network within outbreak.
England 344 501 Illumina HiSeq
Chatterjee 18 2017 Characterize genotypic drug
resistance.
India 74 NR Illumina MiSeq
Clark 19 2013 Understand emergence and
acquisition of MDR-TB among
treated TB patients.
Uganda 51 41 Illumina HiSeq
Cohen 20 2015 Describe evolution of XDR-TB. Africa 337 337 Illumina HiSeq
Comas 21 2015 Describe population genomics in
Africa, and evolutionary origin of
TB.
Ethiopia 285 2151 Illumina HiSeq
Comas 22 2013 Describe evolutionary history of
human and TB.
46 countries 259 259 Illumina, didn't
specify
Coscolla 23 2015 Describe the genomic
epidemiology of MDR-TB among
refugees in USA.
United States of
America
57 45 Illumina HiSeq
Dheda 24 2017 Analyze transmission dynamics of
patients with XDR-TB.
Africa 149 237 Illumina HiSeq
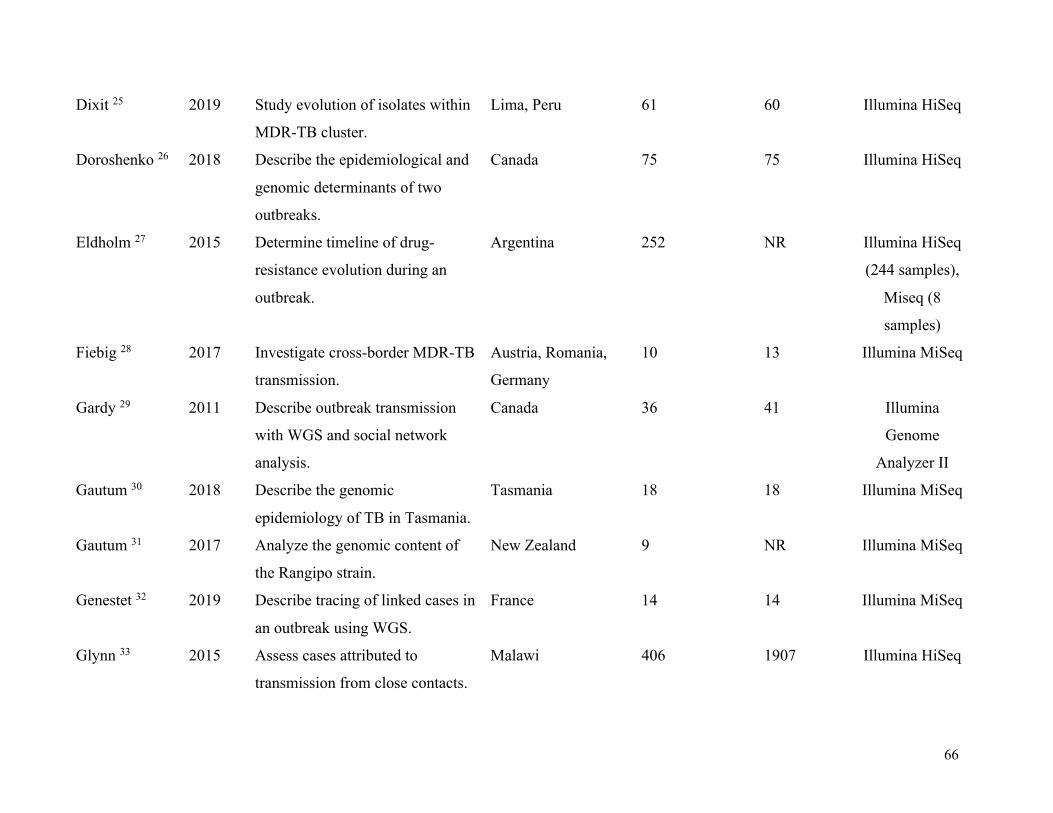
66
Dixit 25 2019 Study evolution of isolates within
MDR-TB cluster.
Lima, Peru 61 60 Illumina HiSeq
Doroshenko 26 2018 Describe the epidemiological and
genomic determinants of two
outbreaks.
Canada 75 75 Illumina HiSeq
Eldholm 27 2015 Determine timeline of drug-
resistance evolution during an
outbreak.
Argentina 252 NR Illumina HiSeq
(244 samples),
Miseq (8
samples)
Fiebig 28 2017 Investigate cross-border MDR-TB
transmission.
Austria, Romania,
Germany
10 13 Illumina MiSeq
Gardy 29 2011 Describe outbreak transmission
with WGS and social network
analysis.
Canada 36 41 Illumina
Genome
Analyzer II
Gautum 30 2018 Describe the genomic
epidemiology of TB in Tasmania.
Tasmania 18 18 Illumina MiSeq
Gautum 31 2017 Analyze the genomic content of
the Rangipo strain.
New Zealand 9 NR Illumina MiSeq
Genestet 32 2019 Describe tracing of linked cases in
an outbreak using WGS.
France 14 14 Illumina MiSeq
Glynn 33 2015 Assess cases attributed to
transmission from close contacts.
Malawi 406 1907 Illumina HiSeq

67
Guerra-
Assunção 34
2015 Conduct district-wide analysis to
examine transmission over time.
Malawi 1687 2332 Illumina HiSeq
Guerra-
Assunção 35
2015 Assess effect of different factors
on the rate of recurrence due to
reinfection or relapse.
Malawi 1933 903 Illumina HiSeq
Gurjav 35 2016 Understand local TB transmission
in low-incidence setting.
Australia 30 1692 Ion Torrent
Personal
Genome
Guthrie 36 2018 Understand transmission
dynamics of pediatric TB in a
low-incidence setting.
Canada 49 49 Illumina HiSeq
Ho 37 2018 Describe extent of transmission
based on mass-screening exercise.
Singapore 10 6 Illumina, didn't
specify
Holden 38 2018 Describe results of an outbreak
investigation.
England 2 2 Illumina HiSeq
Holt 39 2018 Examine transmission dynamics. Vietnam 1635 2091 Illumina HiSeq
Huang 40 2019 Describe the epidemiological and
drug-resistance characteristics
MDR-TB.
China 357 357 Illumina HiSeq
Ioerger 41 2009 Investigate the causes and
evolution of drug-resistance.
South Africa 11 NR Illumina GAII
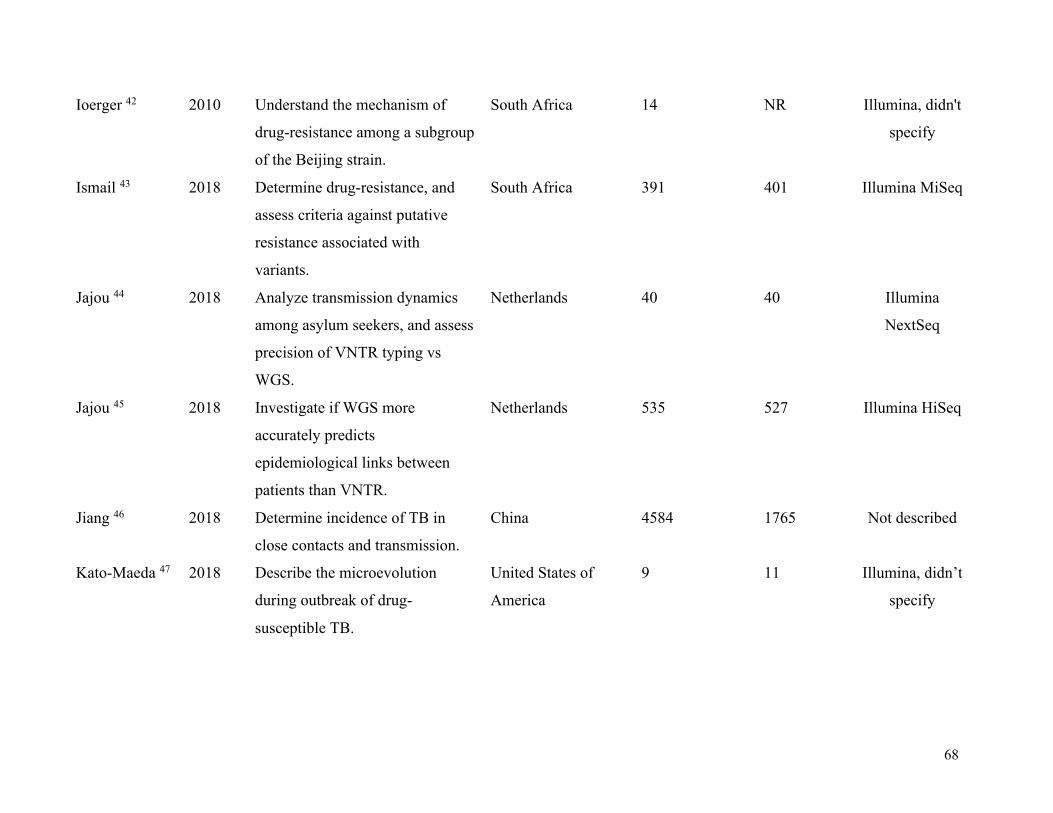
68
Ioerger 42 2010 Understand the mechanism of
drug-resistance among a subgroup
of the Beijing strain.
South Africa 14 NR Illumina, didn't
specify
Ismail 43 2018 Determine drug-resistance, and
assess criteria against putative
resistance associated with
variants.
South Africa 391 401 Illumina MiSeq
Jajou 44 2018 Analyze transmission dynamics
among asylum seekers, and assess
precision of VNTR typing vs
WGS.
Netherlands 40 40 Illumina
NextSeq
Jajou 45 2018 Investigate if WGS more
accurately predicts
epidemiological links between
patients than VNTR.
Netherlands 535 527 Illumina HiSeq
Jiang 46 2018 Determine incidence of TB in
close contacts and transmission.
China 4584 1765 Not described
Kato-Maeda 47 2018 Describe the microevolution
during outbreak of drug-
susceptible TB.
United States of
America
9 11 Illumina, didn’t
specify

69
Koster 48 2013 Identify genomic differences
between Beijing and Manila
families.
United States of
America
82 NR Illumina MiSeq
Koster 49 2019 Investigate TB transmission
clusters using WGS vs VNTR
typing.
United States of
America
16 15 Ilumina MiSeq
Kato-
Miyazawa 50
2018 Characterize genomic diversity of
foreign-born and Japan-born
residents in Tokyo.
Japan 259 91 Illumina MiSeq
Korhonen 51 2015 Determine whether recurrent
cases were caused by relapse vs
re-infection.
Finland 21 21 Illumina MiSeq
Lalor 52 2016 Delineate transmission networks
and investigate benefits of WGS
during cluster investigation.
England 22 22 Illumina MiSeq,
Illumina
Genome
Analyzer GAII,
Illumina HiSeq
Lanzas 53 2018 Determine extent of primary
acquired MDR-TB cases.
South Africa 97 NR Illumina
Genome
Analyzer Iix

70
Lee 54 2015 Explore epidemiological links
during an outbreak.
Canada 42 933 Illumina MiSeq
Lee 55 2015 Describe genomic features of an
epidemiologically successful
strain over time.
Canada 163 NR Illumina MiSeq
Luo 56 2015 Characterize global diversity of
358 Beijing strains.
China 908 NR Illumina HiSeq
Luo 57 2015 Compare VNTR and WGS to
study the transmission in a high
burden setting.
China 32 42 Illumina HiSeq
Ma 58 2014 Explore transmission dynamics of
an outbreak in a boarding school.
China 33 46 Ion Torrent
Macedo 59 2015 Compare WGS and classical
genotyping methods to determine
transmission chains.
Portugal 83 83 Illumina MiSeq
Madrazo-
Moya 60
2019 Identify drug-resistant mutations
in an endemic region.
Mexico 91 91 Illumina
NexSeq
Mai 61 2019 Examine transmission dynamics
and drug resistance-conferring
mutations among TB/HIV co-
infected patients.
Vietnam 200 200 Illumina
NextSeq
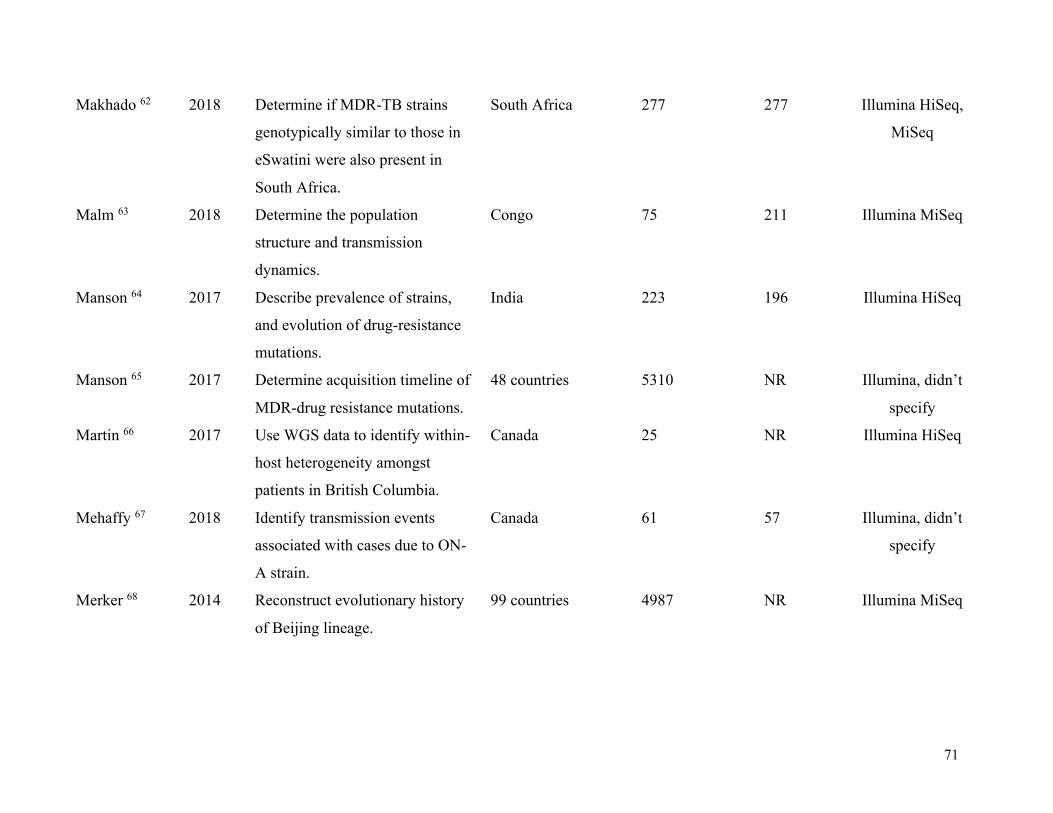
71
Makhado 62 2018 Determine if MDR-TB strains
genotypically similar to those in
eSwatini were also present in
South Africa.
South Africa 277 277 Illumina HiSeq,
MiSeq
Malm 63 2018 Determine the population
structure and transmission
dynamics.
Congo 75 211 Illumina MiSeq
Manson 64 2017 Describe prevalence of strains,
and evolution of drug-resistance
mutations.
India 223 196 Illumina HiSeq
Manson 65 2017 Determine acquisition timeline of
MDR-drug resistance mutations.
48 countries 5310 NR Illumina, didn’t
specify
Martin 66 2017 Use WGS data to identify within-
host heterogeneity amongst
patients in British Columbia.
Canada 25 NR Illumina HiSeq
Mehaffy 67 2018 Identify transmission events
associated with cases due to ON-
A strain.
Canada 61 57 Illumina, didn’t
specify
Merker 68 2014 Reconstruct evolutionary history
of Beijing lineage.
99 countries 4987 NR Illumina MiSeq

72
Merker 69 2015 Analyze evolutionary history of
drug-resistance and transmission
networks of MDR-TB isolates.
Uzbekistan 277 277 Illumina MiSeq,
HiSeq
Merker 70 2018 Examine mutation rates in Beijing
strains from regions with MDR-
TB.
Germany, Republic
of Georgia,
Uzbekistan
Not reported 3 Illumina, didn’t
specify
Mizukoshi 71 2013 Describe molecular epidemiology
of TB patients living in localized
area.
Japan 169 169 Illumina MiSeq
Mokrousov 72 2017 Describe evolutionary origin of
NEW-1 family in the Euro-
American lineage.
China, Tibet, Iran,
Russia, Kazakhstan
5715 NR Illumina MiSeq
Mortimer 73 2017 Characterized population genetics
of known drug resistance loci.
Russia, South Africa 1161 NR Illumina HiSeq
Nelson 74 2018 Evaluate XDR-TB transmission
within and between municipal
districts in KwaZulu-Natal.
South Africa 344 344 Illumina MiSeq
Norheim 75 2018 Report use of WGS to delineate
an outbreak.
Norway 22 24 Illumina MiSeq,
NextSeq
Ocheretina 76 2017 Investigate suspected outbreak of
8 cases.
Haiti 8 8 Illumia HiSeq
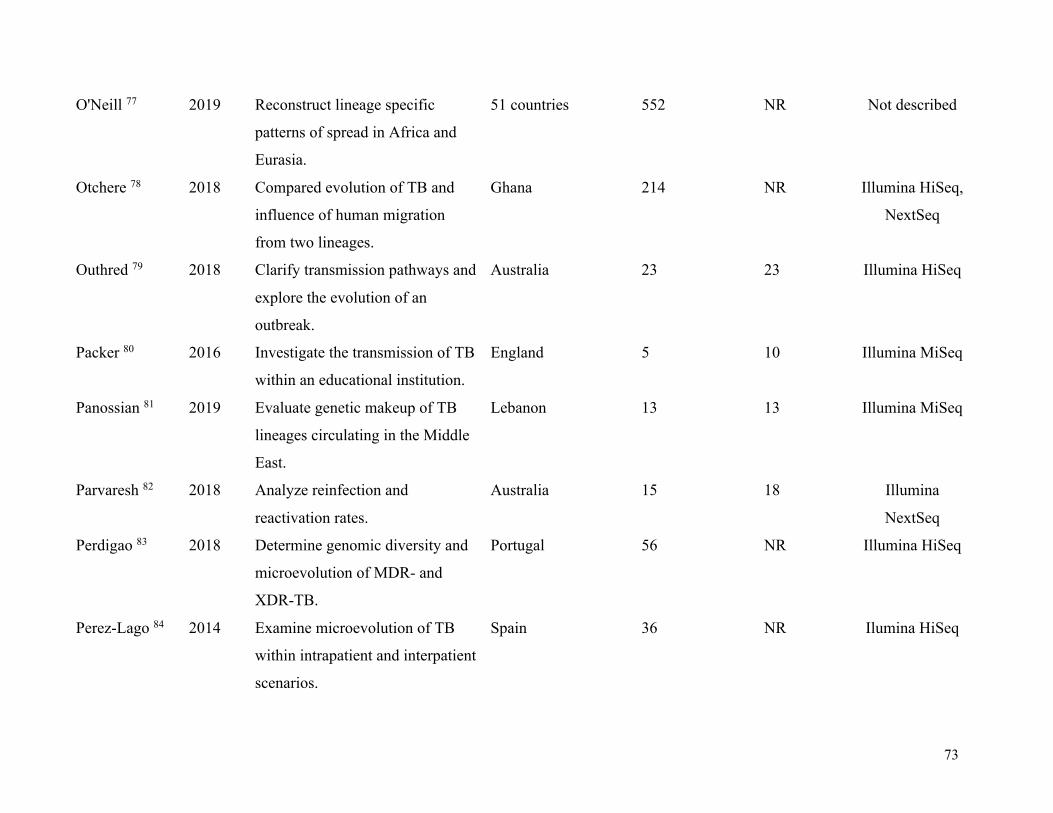
73
O'Neill 77 2019 Reconstruct lineage specific
patterns of spread in Africa and
Eurasia.
51 countries 552 NR Not described
Otchere 78 2018 Compared evolution of TB and
influence of human migration
from two lineages.
Ghana 214 NR Illumina HiSeq,
NextSeq
Outhred 79 2018 Clarify transmission pathways and
explore the evolution of an
outbreak.
Australia 23 23 Illumina HiSeq
Packer 80 2016 Investigate the transmission of TB
within an educational institution.
England 5 10 Illumina MiSeq
Panossian 81 2019 Evaluate genetic makeup of TB
lineages circulating in the Middle
East.
Lebanon 13 13 Illumina MiSeq
Parvaresh 82 2018 Analyze reinfection and
reactivation rates.
Australia 15 18 Illumina
NextSeq
Perdigao 83 2018 Determine genomic diversity and
microevolution of MDR- and
XDR-TB.
Portugal 56 NR Illumina HiSeq
Perez-Lago 84 2014 Examine microevolution of TB
within intrapatient and interpatient
scenarios.
Spain 36 NR Ilumina HiSeq

74
Regmi 85 2014 Investigate outbreak of MDR-TB. Thailand 64 148 Illumina HiSeq
Roetzer 86 2015 Identify outbreak-related
transmission chains.
Germany 86 86 Illumina (didn't
say which one)
Roycroft 87 2013 Examine acquisition and spread of
MDR-TB.
Ireland 42 41 Illumina MiSeq
Ruesen 88 2018 Examine association between TB
genotype and susceptibility to
TBM.
Indonesia 106 322 Illumina HiSeq
Rutaihwa 89 2018 Determine geographical origin of
Beijing strain and spread across
Africa.
Africa 781 781 Illumina HiSeq
Saelans 90 2019 Assess distribution of Beijing-
lineage.
Guatemala 5 5 Illumina HiSeq,
MiSeq
Satta 91 2015 Examine genetic variation of
outbreak samples.
England 16 NR Illumina HiSeq
Schurch 92 2016 Use WGS to study epidemiology
of an outbreak.
Netherlands 3 NR Genome
Sequencer
Senghore 93 2010 Understand epidemiology and
genetics of MDR-TB.
Nigeria 63 5 Illumina MiSeq
Seraphin 94 2017 Define recent transmission
clusters and timing of
transmission.
United States of
America
21 82 illumina MiSeq

75
Shah 95 2018 Describe population-level
transmission of XDR-TB.
South Africa 298 404 Illumina MiSeq
Smit 96 2017 Describe outbreak using WGS
and IGRA.
Finland 12 14 Not described
Sobkowiak 97 2014 Assess prevalence of mixed
infection and correlation with
patient characteristics and
outcomes.
Malawi, Portugal 48 10 Illumina HiSeq
(168 samples),
Illumina MiSeq
(10 samples)
Stucki 98 2018 Study outbreak dynamics. Switzerland 69 68 Illumina, didn't
specify
Stucki 99 2015 Assess transmission among
Swiss- and foreign-born TB
patients.
Switzerland 90 93 Illumina HiSeq,
MiSeq, NextSeq
Stucki 100 2016 Understand global population
structure of Lineage 4 and its
evolution.
100 countries 293 NR Illumina MiSeq,
HiSeq, NextSeq
Tyler 101 2016 Characterize genomic diversity of
outbreak clusters.
Canada 233 NR Illumina
NextSeq
Vaziri 102 2017 Explore drug resistance and
transmission dynamics.
Iran 38 13,892 Illumina
NextSeq

76
Walker 103 2019 Estimate genetic diversity of
related strains, and investigate
community outbreaks.
England 390 254 Illumina HiSeq
Walker 104 2013 Explore epidemiology of TB
transmission.
England 247 269 Illumina HiSeq
Walker 105 2014 Describe origin of transmission
cluster.
Germany,
Switzerland, France,
England, Somalia,
Ethiopia, Eritrea
58 29 Illumina, Ion
Torrent
Winglee 106 2018 Understand geographic
distribution of Lineages 5 and 6.
Mali 92 NR Illumina, didn’t
specify
Witney 107 2016 Determine proportion of cases
attributable to relapse and
reinfection.
South Africa,
Zimbabwe,
Botswana, Zambia
36 51 Illumina HiSeq
Wollenberg 108 2017 Understand evolution of MDR-
and XDR-TB
Belarus 138 97 Illumina HiSeq
Wyllie 109 2017 Determine proportion of linked
TB isolates that are closely
genomically related.
England 1999 1999 Illumina MiSeq
Yang 110 2018 Assess transmission of MDR-TB
and identify transmission risk
factors.
China 324 324 llumina Hiseq

77
Yang 111 2017 Describe transmission dynamics
in an urban setting.
China 218 NR Illumina HiSeq
Yimer 112 2018 Identify genomic features of
Lineage 7 strains.
Ethiopia 30 NR Illumina MiSeq
Note: NR = Not reported

78
Table 6. Mean proportions of STROME-ID criteria met pre- and post-guideline publication
Exposure Pre-STROME-ID SD Post-STROME-ID SD P-value
6 Months 0·51
0·11 0·46 0·14 0·26
12 Monthsa 0·48
0·14 0·51 0·11 0·52
6 Months Exclusionb 0·46
0·14 0·46 0·14 0·98
12 Months Exclusionb 0·48 0·14 0·49 0·14 0·71
SD= Standard deviation, STROME-ID= Strengthening the Reporting of Molecular Epidemiology for Infectious
Diseases
aPapers published within 12 months following STROME-ID were classified as ‘unexposed’, i.e., we considered that
authors may not have seen the guidelines or had the opportunity to incorporate them. bPapers published in this time
period following the STROME-ID publication date were excluded from the analysis altogether.
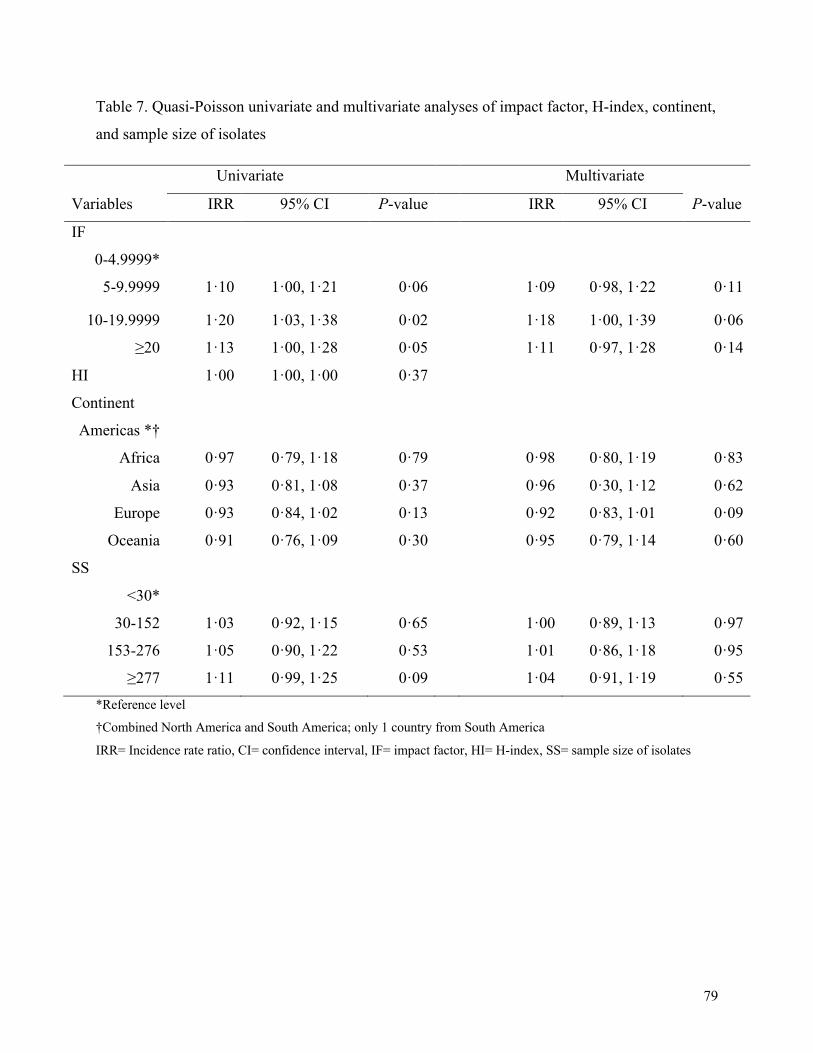
79
Table 7. Quasi-Poisson univariate and multivariate analyses of impact factor, H-index, continent,
and sample size of isolates
Univariate Multivariate
Variables IRR 95% CI P-value IRR 95% CI P-value
IF
0-4.9999*
5-9.9999 1·10 1·00, 1·21 0·06 1·09 0·98, 1·22 0·11
10-19.9999 1·20 1·03, 1·38 0·02
1·18 1·00, 1·39 0·06
≥20 1·13 1·00, 1·28 0·05 1·11 0·97, 1·28 0·14
HI 1·00 1·00, 1·00 0·37
Continent
Americas *†
Africa 0·97 0·79, 1·18 0·79 0·98 0·80, 1·19 0·83
Asia 0·93 0·81, 1·08 0·37
0·96 0·30, 1·12 0·62
Europe 0·93 0·84, 1·02 0·13 0·92 0·83, 1·01 0·09
Oceania 0·91 0·76, 1·09 0·30
0·95 0·79, 1·14 0·60
SS
<30*
30-152 1·03 0·92, 1·15 0·65 1·00 0·89, 1·13 0·97
153-276 1·05 0·90, 1·22 0·53
1·01 0·86, 1·18 0·95
≥277 1·11 0·99, 1·25 0·09 1·04 0·91, 1·19 0·55
*Reference level
†Combined North America and South America; only 1 country from South America
IRR= Incidence rate ratio, CI= confidence interval, IF= impact factor, HI= H-index, SS= sample size of isolates

80
Table 8. Univariate and multivariate tobit analysis of impact factor, H-index, continent, and
sample size of isolates
Univariate Multivariate
Variables Coefficients 95% CI P-value Coefficients 95% CI P-value
IF
0-4.9999*
5-9.9999 0·05 -0·001, 0·10 0·06 0·04 -0·02, 0·09 0·18
10-19.9999 0·08 0·006, 0·16 0·04
0·06 -0·02, 0·14 0·14
≥20 0·10 0·03, 0·16 0·003 0·06 -0·01, 0·13 0·09
HI 0·0002 0·001, 0·001 0·75
Continent
Americas *†
Africa 0·04 -0·06, 0·14 0·40 0·03 -0·01, 0·12 0·54
Asia -0·04 -0·11, 0·04 0·32
-0·03 -0·10, 0·04 0·34
Europe -0·04 -0·09, 0·01 0·15 -0·04 -0·01, 0·01 0·08
Oceania -0·04 -0·13, 0·05 0·42
-0·01 -0·01, 0·08 0·92
SS
<30*
30-152 0·07 0·01, 0·12 0·02 0·05 0·00, 0·11 0·05
153-276 0·09 0·02, 0·16 0·02
0·07 -0·01, 0·14 0·08
≥277 0·11 0·05, 0·17 < 0·0001 0·09 0·02, 0·15 0·01
*Reference level
†Combined North America and South America; only 1 country from South America
IRR= Incidence rate ratio, CI= confidence interval, IF= impact factor, HI= H-index, SS= sample size of isolates

81
Supplemental materials
Search strategy
This study is registered on PROSPERO (CRD42017064395) and followed Preferred Reporting Items for Systematic
Reviews and Meta-Analyses (PRISMA) guidelines.1 We initially searched MEDLINE, Embase Classic and Embase on May
3, 2017 using the terms “tuberculosis” and “genom* sequencing”. We then updated this search on April 23, 2019. No
restrictions were placed on the start date or geographic location. We also systematically searched the pre-print server
bioRxiv. References of included articles were also hand-searched to ensure no eligible articles were missed.
Inclusion and exclusion criteria
To be eligible for inclusion, studies needed to include patients with microbiologically-confirmed TB and needed to have
used WGS for typing of strains. Studies must have been published in English, French or Spanish. As suggested by Field et
al.,2 we considered studies to be genomic epidemiology papers if they investigated the distribution or transmission dynamics
of TB across time, a particular population, or a geographic location in order to inform outbreaks, evaluate infection control
practices or perform surveillance. Studies were also included if they examined risk factors for transmission (e.g., clustering),
or if they distinguished between recurrent cases of TB as relapse or reinfection. If studies described the evolution of TB
strains and drug resistance, or if they identified and classified new TB strains or lineages, they were included as well.
Finally, studies were included if they investigated the association between strain types or mutations and clinical outcomes
(e.g., death, treatment failure, relapse).
We excluded non-human studies, studies that were exclusively experimental (e.g., in-vitro or in-vivo animal studies, or
those that were purely diagnostic. The latter included studies where WGS was exclusively used for predicting phenotypic
drug resistance, without epidemiological aims. We also excluded studies whose primary aim was to use WGS to develop a
SNP-based typing method (unless the overall analysis and description of the epidemiology still relied on WGS), studies that
exclusively compared typing methods, and studies with less than two patients. Conference abstracts, editorials, and
literature reviews were also excluded.
Data extraction
To determine if manuscript met eligibility criteria for STROME-ID, two reviewers independently reviewed titles and
abstracts (BC and RSL). Discrepancies were resolved by discussion and third-party arbitration (TC). One reviewer (BC)
was responsible for data extraction based on STROME-ID criteria, as well as additional variables of interest (specified a priori), including whether the bioinformatic tools used were reported (along with corresponding version numbers) and
whether WGS sequencing data were made openly available, to assess reproducibility. All accession numbers were checked
to confirm that the raw data was uploaded for papers that reported sequence accession numbers. A second reviewer (RSL)
independently checked a random sample consisting of 5% of all eligible papers; data extraction for these papers was
compared between BC and RSL prior to data extraction for the remaining articles, with discussion to clarify any
discrepancies.
Following data extraction, overall themes of the articles were synthesized and described. Each STROME-ID variable was
assessed, and scored as ‘complete’ or ‘incomplete’ (or assigned ‘not applicable’, where appropriate). The number of
STROME-ID criteria and proportion of those out of all criteria were then tabulated for each article, with the denominator
for the proportions excluding criteria that were not applicable (e.g., specific to a different study design).
In addition to this, we analyzed whether certain study characteristics were associated with the number and proportion of
fulfilled STROME-ID criteria, which were specified a priori. Few studies have specifically examined factors correlated
with STROBE reporting quality,3,4 although this was analyzed using other reporting frameworks (e.g., CONSORT,
STARD).5-7 These include sample size (SS), the journal impact factor (IF), and the geographic region of senior author’s
primary affiliation. For sample size, the number of patients as well as isolates were extracted from each article. We
anticipated that the sample size of patients and that of isolates would be highly correlated and assessed this using the

82
Spearman’s non-parametric correlation test to determine whether both or only one of these should be included. For IF, this
was obtained from Journal Citation Reports (https://jcr.clarivate.com) for the year of each article’s publication. When IF
could not be located in in this database, SciJournal (https://scijournal.org) was searched. The continent of the senior
author’s primary affiliation was determined by examining the geographic region of the last author, which typically
represents the senior author in genomic epidemiology as well as other fields.8,9 When authors had multiple affiliations, the
continent from which the study samples were obtained was assigned as the primary affiliation (Supplemental Table 2). In
addition to these, we also included the current h-index (HI) of the senior author. This was obtained using Scopus
(https://www.scopus.com).
Statistical Analysis
To assess differences in reporting following STROME-ID’s publication, the mean proportions of completed criteria were
compared before and after its publication date. A 6-month lag period was included to account for articles that were already
in press when STROME-ID was published. Sensitivity analyses were also performed using a 12-month lag period, and
excluding articles published 6 and 12 months post-STROME-ID publication. Differences in mean proportions of criteria
were compared pre- and post-publication using a two-tailed t-test using R software (version 1.1.456). The least and most
reported STROME-ID criteria were also qualitatively assessed to explore differences between periods, excluding criteria
that were not eligible for > 20% of articles (Supplemental Figure 1 and 2).
To examine the association between study characteristics and reporting, two main approaches were used. First, we used
quasi-Poisson regression (to account for under-dispersion) with the number of criteria completed as the dependent variable.
Given not all criteria were applicable across every study, this analysis was restricted to criteria that were applicable across
all studies. Second, we used tobit regression (censored between 0 and 1) to assess the association with the proportion of
criteria that were completed, including all studies in the analysis. The distribution of IFs from all papers is shown in
Supplemental Figure 3; IF was used as a categorical variable, with categories chosen based on our experience with the
metric, and previous studies that examined correlates with IF.10,11 For SS, we categorized this into quartiles due to low
counts across a wide range of data (Supplemental Figure 4). HI was analyzed as a linear variable.
Variables that had a P-value of < 0·20 in univariate analyses were included in the final model for each analysis. Pseudo-R2,
the Akaike information criterion, and log-likelihood were calculated to assist with model selection and evaluate fit.
Missing data
The number of patients was missing for 18·4% (n=21) articles. IFs were also not available for articles published during the
first year of the journal (n=1, 2013) or published in 2019 (n= 15, 13·16%). To address this, IF was reviewed for all available
years. If the variation in IF between years was minor, the most recent value was used (Supplemental Table 3).

83
Supplemental Results
Themes of the included articles
135 studies used WGS to investigate transmission. When compared to classical genotyping methods, these studies
demonstrated WGS’ superior ability to identify and confirm epidemiological linkages between different subgroups in an
outbreak, and their patterns of transmission.12-15 This was seen across populations in both high-incidence15 and low-
incidence settings,16-18 as well as between different groups, such as foreign-born and locally born individuals.19,20 Authors
also found that WGS provided additional resolution to distinguish between recurrent TB cases due to relapse or re-
infection.14,21,22 36 studies used WGS to examine the evolution of TB and drug resistance. Several studies characterized
genomic differences using WGS in order to describe the mechanisms of the microevolution of drug-resistant TB and its
transmission.23-28 Studies also described the evolution of outbreaks in various settings, using WGS to reconstruct the
timeline of resistance-conferring mutations.28-30 Lastly, studies broadly examined the evolution of TB in comparison to
human migration patterns.31-34 Eight studies used WGS to investigate strains and/or lineages of TB. WGS-based genotyping
provided additional resolution to elucidate strain diversity,35,36 and identify genomic characteristics of different strains.37,38
WGS was also used to identify strains and the sub-lineages present in a particular region’s transmission network.33,39,40 One
of the studies also described a new sub-lineage.41 Finally, two studies examined associations of TB strains or mutations with
clinical outcomes, which included rates of relapse, treatment status, death or loss to follow-up.22,42

84
Supplemental figures
Supplemental Figure 1. Count of "not applicable" papers per STROME-ID criterion, pre-publication.
The number of “not applicable” (NA) papers (n= 17) per STROME–ID criterion prior to guideline publication, accounting
for a six-month lag. The criterion with the most amount of NA papers required translating estimates of relative risk into
absolute risk (STROBE–16c).

85
Supplemental Figure 2. Count of "not applicable" papers per STROME-ID criterion, post-publication
The number of “not applicable” (NA) papers (n= 97) per STROME–ID criterion in the pre-publication reporting period,
accounting for a six-month lag. The criterion with the most amount of NA papers required stating the eligibility criteria and
methods of participant selection (STROBE–6b).

86
Supplemental Figure 3. Distribution of impact factors for included papers
Frequency distribution of journal impact factor (IF). Most IFs in the data set are less than 20, with low counts of IFs greater
than 20.

87
Supplemental Figure 4. Distribution of sample size of isolates in included papers
Frequency distribution of sample size of isolates (SS). Most SS are less than 1000, with low counts of SS greater than 1000.
There were no counts of SS between 3000 and 4000 isolates.

88
Supplemental Figure 5. Proportion of STROME-ID criteria met with 12-month lag pre-publication.
The average proportion of STROME-ID criteria met across articles prior to guideline publication, accounting for a twelve–
month lag, was similarly variable to the trend observed in the six-month lag period. The least completed STROME–ID
criterion required defining of key molecular terms (STROME–4.1). The three most frequently reported criteria were:
explaining the scientific background and rationale (STROBE–2), stating the epidemiological objectives of using molecular
typing (STROME–ID 3.1), and stating study objectives and hypotheses (STROBE–3).

89
Supplemental Figure 6. Proportion of STROME-ID criteria met with 12-month lag post-publication.
All criteria were completed at least once in this reporting period. The least frequently completed STROME–ID criterion
required defining of key molecular terms (STROME–4.1). The three most frequently completed STROME-ID criteria were:
stating the study’s overarching objectives and hypotheses (STROBE 3), stating the epidemiological objectives of using
molecular typing (STROME–ID 3.1), and stating the source of participants, clinical specimens and the sampling frame
(STROME–ID 6.1).

90
Supplemental Figure 7. Proportion of STROME-ID criteria met post-publication, excluding articles from 12-
month lag.
A sensitivity analysis for the time period post-guideline publication was conducted, which excludes articles
published in a twelve–month publication lag. Five criteria were not met, which were the same as those criteria not
met in the pre-publication period accounting for the 12-month lag.

91
Supplemental tables Supplemental Table 1. STROME-ID criteria, adapted from Field et al.2
Criteria Description of criteria
STROBE-1(a) Denote study’s design using a term in the title or the abstract
STROBE-1(b) Briefly describe methods and results in the abstract
STROME-ID 1.1 The term molecular epidemiology is mentioned in the title or abstract and the keywords
STROBE-2 Describe the scientific context and rationale of the methods used
STROME-ID 2.1 Discuss the pathogen population and the distribution of pathogen strains within the host population
STROBE-3 State study objectives and any prespecified hypotheses
STROME-ID 3.1 State the epidemiological objectives of using molecular typing
STROBE-4 Discuss study design early in the paper
STROME-ID 4.1 Define key molecular terminologies used in the study
STROME-ID 4.2 Define the molecular markers using a standard nomenclature
STROME-ID 4.3 Provide definitions for infectious-disease cases
STROME-ID 4.4 Discuss methods about sample collection, laboratory techniques, and minimizing cross-contamination. Provide criteria for
identifying strains
STROBE-5 Provide information about the locations, dates, participant recruitment, exposure, follow-up, and data collection
STROME-ID 5.1 Mention the timeframe of the study. Discuss the molecular clock of markers if known, and its natural history
STROBE-6(a) Cohort study—Provide eligibility criteria, and the sources and methods for including participants. Explain follow-up methods
Case-control study— Provide eligibility criteria, and the sources and methods of case ascertainment and control selection.
Provide explanation for use of cases and controls
Cross-sectional study— Provide eligibility criteria, and the sources and methods of participant selection
STROBE-6(b) Cohort study—For matched studies, state matching criteria and number of exposed and unexposed participants
Case-control study—For matched studies, state matching criteria and controls per case
STROME-ID 6.1 Discuss source of participants and clinical specimens. State sampling frame and strategy
STROBE-7 Report all outcomes, exposures, predictors, potential confounders, and effect modifiers. Give diagnostic criteria, if applicable
STROBE-8 For each variable of interest, state data sources and methods of assessment. If more than one group, state comparability of
assessment methods.
STROME-ID 8.1 Explain detection of multiple-strain infections
STROBE-9 Explain methods to address potential sources of bias
STROME-ID 9.1 Explain how discovery or ascertainment bias was addressed
STROBE-10 Explain the rationale for study size
STROME-ID 10.1 Report unique restrictions placed on the study sample size
STROBE-11 Describe the analyses of quantitative variables. If relevant, describe rationale for groupings
STROBE-12(a) Describe all statistical methods, including those used to control for confounding
STROBE-12(b) Describe any methods used to examine subgroups and interactions
STROBE-12(c) Discuss methods for addressing missing data
STROBE-12(d) Cohort study—if applicable, explain how loss to follow-up was addressed case-Control study—if applicable, explain how
matching of cases and controls was addressed
Cross-sectional study—if applicable, describe analytical methods taking account of sampling strategy
STROBE-12(e) Describe any sensitivity analyses
STROME-ID 12.1 State how the study took account of the non-independence of sample data, if appropriate

92
STROME-ID 12.2 Explain methods for addressing missing data
STROBE-13(a) Discuss count of individuals at each stage of the study
STROBE-13(b) Provide rationale for non-participation at each stage
STROBE-13(c) Uses a flow diagram
STROME-ID 13.1 Report numbers of participants and samples at each stage of the study (e.g., number of samples, the number typed, and the
number yielding data)
STROME-ID 13.2 If molecular clusters are investigated, report the sampling fraction, cluster sizes, and the study population turnover, if known
STROBE-14(a) Provide characteristics of study participants, including details about exposures and potential confounders
STROBE-14(b) Denote the number of individuals with missing data for each variable of interest
STROBE-14(c) Cohort study-summarise follow-up time
STROME-ID 14.1 Give information by strain type if appropriate, with use of standardised nomenclature
STROBE-15 Cohort study—state numbers of outcome events or summary measures over time
Case-control study—state count of each exposure category
Cross-sectional study—state numbers of outcome events or summary measures
STROBE-16(a) Provide unadjusted estimates, included confounder-adjusted estimates and their precision if relevant. Explain which confounders
were adjusted for and why
STROBE-16(b) State category boundaries for continuous variables that were categorised
STROBE-16(c) If relevant, convert relative risk into absolute risk
STROME-ID 16.1 Illustrate molecular similarity among strains with a dendrogram or phylogenetic tree
STROBE-17 Report other analyses done, such as subgroup analyses
STROBE-18 Discuss key results that consider study objectives
STROBE-19 Report limitations, including potential bias or imprecision, and their direction and magnitude.
STROME-ID 19.1 Consider other possible explanations for findings about transmission chains if relevant. State the consistency between molecular
and epidemiological evidence
STROBE-20 Discussion of results that consider objectives, limitations, and other studies’ results
STROBE-21 Explain the generalizability of study results
STROBE-22 Provide funding sources and their role
STROME-ID 23.1 State ethical considerations and implications for infectious-disease molecular epidemiology
.

93
Supplemental Table 2. Count of papers per continent of senior author’s primary affiliation.
Continent of senior author’s primary affiliation Count of papers
North America 32
South America 1
Africa 6
Asia 13
Europe 54
Oceania 8
Note: Due to low individual country counts, countries were grouped by continent, where South America was
included with North America for the category “Americas” because it had only one count.

94
Supplemental Table 3. Standard deviation of journal IF from 2013-2018, shown for the journals
corresponding to an article published in 2019.
Journal SD
BMC Genomics 0.12
BMC Infectious Diseases 0.07
Clinical Infectious Diseases 0.30
Emerging Infectious Diseases 0.46
J Clin Microbiol 0.44
Molecular Ecology 0.20
Nature Scientific Reports 0.58
PLOS One 0.17
Tuberculosis 0.09

95
Supplemental Table 4. Sensitivity univariate and multivariate analysis for quasi-Poisson, excluding seven
papers with senior authors from >1 continent. Univariate Multivariate
Variables IRR 95% CI P-value IRR 95% CI P-value
IF
0-4.9999*
5-9.9999 1·10 1·00, 1·21 0·06 1·10 0·99, 1·22 0·09
10-19.9999 1.19 1·02, 1·39 0·03 1·18 0.99, 1·40 0·07
≥20 1.17 1·02, 1·33 0·02 1·15 0·99, 1·34 0·08
HI 1·00 1·00, 1·00 0·31
Continent
Americas *†
Africa 0·98 0·79, 1·22 0·89 1·00 0·80, 1·24 0.97
Asia 0·91 0·77, 1·06 0·23 0·95 0·81, 1·11 0·53
Europe 0·91 0·82, 1·00 0·07 0·91 0·82, 1·00 0·06
Oceania 0·92 0·76, 1·11 0·40 1.00 0·81, 1·21 0·96
SS
<30*
30-152 1·03 0·92, 1·16 0·59 1·00 0·89, 1·13 0·93
153-276 1·07 0·91, 1·25 0·40 1·03 0·88, 1·22 0·69
≥277 1·12 0·99, 1·26 0·08 1·05 0·91, 1·21 0·49
*Reference level
†Combined North America and South America; only 1 country from South America
IRR= Incidence rate ratio, CI= confidence interval, IF= impact factor, HI= H-index, SS= sample size of isolates

96
Supplemental Table 5. Sensitivity univariate and multivariate analysis for tobit regression, excluding seven
papers with senior authors from >1 continent. Univariate Multivariate
Variables Coefficient 95% CI P-value Coefficient 95% CI P-value
IF
0-4.9999*
5-9.9999 0·04 -0·01, 0·09 0·14 0·02 -0·03, 0·08 0·34
10-19.9999 0·07 -0·02, 0·15 0·12 0·04 -0·04, 0·12 0·34
≥20 0·09 0·02, 0·16 0·01 0·06 -0·02, 0·13 0·13
HI 0·0001 -0·001, 0·001 0·86
Continent
Americas *†
Africa 0·04 -0·07, 0·15 0·45 0·03 -0·07, 0·13 0·59
Asia -0·05 -0·13, 0·02 0·17 -0·04 -0·12, 0·03 0·24
Europe -0·04 -0·10, 0·01 0·08 -0·05 -0·10, 0·00 0·05
Oceania -0·05 -0·15, 0·04 0·27 -0·01 -0·10, 0·08 0·85
SS
<30*
30-152 0·07 0·02, 0·13 0·01 0·06 0·01, 0·11 0·03
153-276 0·07 -0.01, 0·14 0·07 0·06 -0·02, 0·14 0·12
≥277 0·10 0·05, 0·16 < 0·0001 0·09 0·02, 0·15 0·01
*Reference level
†Combined North America and South America; only 1 country from South America
IRR= Incidence rate ratio, CI= confidence interval, IF= impact factor, HI= H-index, SS= sample size of isolates

97
Supplemental Table 6. Number of papers with unavailable raw genomic data per year.
Publication year Papers with unavailable raw genomic data Total papers
2009 0 1
2010 1 2
2011 0 1
2012 0 1
2013 0 9
2014 0 6
2015 3 18
2016 2 12
2017 3 17
2018 13 34
2019 3 13

98
Supplemental references 1. Liberati A, Altman DG, Tetzlaff J, et al. The PRISMA statement for reporting systematic reviews and
meta-analyses of studies that evaluate health care interventions: explanation and elaboration. Ann Intern Med 2009;
151(4): W65-W94.
2. Field N, Cohen T, Struelens MJ, et al. Strengthening the reporting of molecular epidemiology for infectious
diseases (STROME-ID): an extension of the STROBE statement. Lancet Infect Dis 2014; 14(4): 341-52.
3. Rao A, Brück K, Methven S, et al. Quality of reporting and study design of CKD cohort studies assessing
mortality in the elderly before and after STROBE: a systematic review. PLoS ONE 2016; 11(5): e0155078.
4. Adams AD, Benner RS, Riggs TW, Chescheir NC. Use of the STROBE checklist to evaluate the reporting
quality of observational research in obstetrics. Obstet Gynecol 2018; 132(2): 507-12.
5. Ghimire S, Kyung E, Lee H, Kim E. Oncology trial abstracts showed suboptimal improvement in reporting:
a comparative before-and-after evaluation using CONSORT for abstract guidelines. J Clin Epidemiol 2014; 67(6):
658-66.
6. Selman TJ, Morris RK, Zamora J, Khan KS. The quality of reporting of primary test accuracy studies in
obstetrics and gynaecology: application of the STARD criteria. BMC Women's Health 2011; 11(1): 8.
7. Mackinnon S, Drozdowska BA, Hamilton M, Noel-Storr AH, McShane R, Quinn T. Are methodological
quality and completeness of reporting associated with citation-based measures of publication impact? A secondary
analysis of a systematic review of dementia biomarker studies. BMJ Open 2018; 8(3): e020331.
8. Bhopal R, Rankin J, McColl E, et al. The vexed question of authorship: views of researchers in a British
medical faculty. BMJ 1997; 314(7086): 1009-12.
9. D Reisenberg GL. The order of authorship: who’s on first? JAMA 1990; (264): 1857.
10. Kuroki LM, Allsworth JE, Peipert JF. Methodology and analytic techniques used in clinical research:
associations with journal impact factor. Obstet Gynecol 2009; 114(4): 877-84.
11. Falagas ME, Kouranos VD, Michalopoulos A, Rodopoulou SP, Batsiou MA, Karageorgopoulos DE.
Original artile: comparison of the distribution of citations received by articles published in high, moderate, and low
impact factor journals in clinical medicine. Intern Med J 2010; 40(8): 587-91.
12. Jajou R, de Neeling A, van Hunen R, et al. Epidemiological links between tuberculosis cases identified
twice as efficiently by whole genome sequencing than conventional molecular typing: A population-based study.
PLoS One 2018; 13(5).
13. Ocheretina O, Shen L, Escuyer VE, et al. Whole genome sequencing investigation of a tuberculosis
outbreak in Port-au-Prince, Haiti caused by a strain with a “low-level" rpoB mutation L511P - insights into a
mechanism of resistance escalation. PLoS one 2015; 10(6): e0129207.
14. Witney AA, Bateson AL, Jindani A, et al. Use of whole-genome sequencing to distinguish relapse from
reinfection in a completed tuberculosis clinical trial. BMC Med 2017; 15(1): 71.
15. Wyllie D, Davidson J, Walker T, et al. A quantitative evaluation of MIRU-VNTR typing against whole-
genome sequencing for identifying Mycobacterium tuberculosis transmission: a prospective observational cohort
study. EBioMedicine 2018; 34: 122-30.
16. Cabibbe AM, Trovato A, De Filippo MR, et al. Countrywide implementation of whole genome sequencing:
an opportunity to improve tuberculosis management, surveillance and contact tracing in low incidence countries.
The Eur Respir J 2018.
17. Gurjav U, Outhred AC, Jelfs P, et al. Whole genome sequencing demonstrates limited transmission within
identified Mycobacterium tuberculosis clusters in New South Wales, Australia. PLoS ONE 2016; 11(10): e0163612.
18. Genestet C, Tatai C, Berland JL, et al. Prospective whole-genome sequencing in tuberculosis outbreak
investigation, France, 2017-2018. Emerg Infect Dis 2019; 25(3): 589-92.
19. Auld SC, Shah NS, Mathema B, et al. Extensively drug-resistant tuberculosis in South Africa: genomic
evidence supporting transmission in communities. Eur Respir J 2018; 52(4).
20. Mizukoshi F, Miyoshi-Akiyama T, Iwai H, et al. Genetic diversity of Mycobacterium tuberculosis isolates
from Tochigi prefecture, a local region of Japan. BMC Infect Dis 2017; 17(1): 365.
21. Bryant JM, Harris SR, Parkhill J, et al. Whole-genome sequencing to establish relapse or re-infection with
Mycobacterium tuberculosis: a retrospective observational study. Lancet Respir Med 2013; 1(10): 786-92.
22. Guerra-Assunçao JA, Houben RMGJ, Crampin AC, et al. Recurrence due to relapse or reinfection with
Mycobacterium tuberculosis: a whole-genome sequencing approach in a large, population-based cohort with a high
HIV infection prevalence and active follow-up. J Infect Dis 2015; 211(7): 1154-63.
99
23. Perez-Lago L, Comas I, Navarro Y, et al. Whole genome sequencing analysis of intrapatient
microevolution in Mycobacterium tuberculosis: potential impact on the inference of tuberculosis transmission. J Infect Dis 2014; 209(1): 98-108.
24. Casali N, Nikolayevskyy V, Balabanova Y, et al. Microevolution of extensively drug-resistant tuberculosis
in Russia. Genome Res 2012; 22(4): 735-45.
25. Kato-Maeda M, Ho C, Passarelli B, et al. Use of whole genome sequencing to determine the
microevolution of Mycobacterium tuberculosis during an outbreak. PLoS ONE 2013; 8(3): e58235.
26. Mehaffy C, Guthrie JL, Alexander DC, Stuart R, Rea E, Jamieson FB. Marked microevolution of a unique
Mycobacterium tuberculosis strain in 17 years of ongoing transmission in a high risk population. PLoS ONE 2014;
9(11): 0112928.
27. Ioerger TR, Koo S, No E-G, et al. Genome analysis of multi- and extensively-drug-resistant tuberculosis
from KwaZulu-Natal, South Africa. PLoS ONE 2009; 4(11): e7778.
28. Cohen KA, Abeel T, Manson McGuire A, et al. Evolution of Extensively Drug-Resistant Tuberculosis over
Four Decades: Whole Genome Sequencing and Dating Analysis of Mycobacterium tuberculosis Isolates from
KwaZulu-Natal. PLoS Medicine 2015; 12(9): e1001880.
29. Ioerger TR, Feng Y, Chen X, et al. The non-clonality of drug resistance in Beijing-genotype isolates of
Mycobacterium tuberculosis from the Western Cape of South Africa. BMC Genomics 2010; 11: 670.
30. Casali N, Broda A, Harris SR, Parkhill J, Brown T, Drobniewski F. Whole genome sequence analysis of a
large isoniazid-resistant tuberculosis outbreak in london: a retrospective observational study. PLoS Medicine 2016;
13(10): e1002137.
31. Eldholm V, Monteserin J, Rieux A, et al. Four decades of transmission of a multidrug-resistant
Mycobacterium tuberculosis outbreak strain. Nat Commun 2015; 6.
32. Comas I, Coscolla M, Luo T, et al. Out-of-Africa migration and Neolithic coexpansion of Mycobacterium
tuberculosis with modern humans. Nat Genet 2013; 45(10): 1176-82.
33. Luo T, Comas I, Luo D, et al. Southern East Asian origin and coexpansion of Mycobacterium tuberculosis
Beijing family with Han Chinese. Proc Natl Acad Sci U S A 2015; 112(26): 8136-41.
34. O'Neill MB, Shockey A, Zarley A, et al. Lineage specific histories of Mycobacterium tuberculosis dispersal
in Africa and Eurasia. Mol Ecol 2019; 28(13): 3241-56.
35. Stucki D, Brites D, Jeljeli L, et al. Mycobacterium tuberculosis lineage 4 comprises globally distributed and
geographically restricted sublineages. Nat Genet 2016; 48(12): 1535-43.
36. Chatterjee A, Nilgiriwala K, Saranath D, Rodrigues C, Mistry N. Whole genome sequencing of clinical
strains of Mycobacterium tuberculosis from Mumbai, India: A potential tool for determining drug-resistance and
strain lineage. Tuberculosis 2017; 107: 63-72.
37. Gautam SS, Mac Aogain M, Bower JE, Basu I, O'Toole RF. Differential carriage of virulence-associated
loci in the New Zealand Rangipo outbreak strain of Mycobacterium tuberculosis. Infect Dis 2017; 49(9): 680-8.
38. Koster K, Largen A, Foster JT, et al. Whole genome SNP analysis suggests unique virulence factor
differences of the Beijing and Manila families of Mycobacterium tuberculosis found in Hawaii. Plos One 2018;
13(7).
39. Casali N, Nikolayevskyy V, Balabanova Y, et al. Evolution and transmission of drug-resistant tuberculosis
in a Russian population. Nat Genet 2014; 46(3): 279-86.
40. Winglee K, Manson McGuire A, Maiga M, et al. Whole genome sequencing of Mycobacterium africanum
strains from Mali provides insights into the mechanisms of geographic restriction. PLoS Negl Trop Dis 2016; 10(1):
e0004332.
41. Malm S, Linguissi LSG, Tekwu EM, et al. New Mycobacterium tuberculosis complex sublineage,
Brazzaville, Congo. Emerg Infect Dis 2017; 23(3): 423-9.
42. Sobkowiak B, Glynn JR, Houben R, et al. Identifying mixed Mycobacterium tuberculosis infections from
whole genome sequence data. BMC Genomics 2018; 19(1): 613.

100
Chapter 6. Discussion
6.1. Summary
The objectives of this thesis were to systematically assess the extent to which genomic
epidemiology studies of TB reported STROME-ID criteria, as well as whether this improved
after publication of STROME-ID reporting guidelines, and to investigate whether there was an
association between reporting quality and study characteristics. The following was achieved:
1. The extent of STROME-ID guideline reporting was assessed among TB genomic
epidemiology studies, from the first published manuscript in this area in 2009 through to
2019. The average proportion of the completeness of STROME-ID reporting before and
after its publication was 51% (±11%) and 0·46% (±14%), respectively (Table 2). Overall,
completeness of reporting ranged from 16·3-75·0% (mean 49·9%, ± 11·88%).
2. HI did not meet inclusion criteria to be included in multivariate analysis. Significant
associations were not identified between reporting quality and IF, SS, and continent of
senior author’s primary affiliation. In the tobit model, only a minor association was
observed between larger samples (SS≥277) and a greater proportion of eligible criteria
completed in one analysis.
Although larger samples were found to be significantly associated with a higher proportion of
criteria met, this was not interpreted as an epidemiologically meaningful difference. This result
was only found in one of the analyses, and a significant association was not observed for
categories of other sample sizes. Moreover, as discussed in the manuscript, this association
represented only a minor increase, equivalent to only less than a 10% increase compared to the
reference of <30 samples.
Only one article explicitly referred to STROME-ID guidelines. 105 As briefly mentioned in the
manuscript, this may suggest lack of awareness regarding STROME-ID guidelines. Although
this has not been specifically examined for STROME-ID, a survey of author attitudes towards
STROBE guidelines found that 185 (18.2%) of participants were not aware of guidelines. 113
This is surprising given that STROBE guidelines had already been implemented at the time of

101
the survey for twelve years. Furthermore, this survey found that the majority of participants
(70.7%, n = 718) were not aware of any STROBE extensions, including STROME-ID, which
had also already been published, though for five years. 113 These findings reinforce that formal
journal endorsement may be needed to enforce reproducibility, which aligns with other studies
that have investigated CONSORT guidelines, including a review 114 and randomized control
trial. 115
Although few studies have examined quality per STROBE guidelines and the impact of journal
endorsement 116,117, they suggest that journal endorsement alone is not an effective policy
strategy. To achieve high reporting levels, constant enforcement by journal editors, reviewers,
and support by senior research investigators is likely needed to cultivate a strong culture of
responsibility, as use of reporting guidelines is influenced by a variety of individual,
professional, environmental and logistical factors.118
6.2. Strengths and limitations
A strength of this thesis is that it has addressed a neglected area of research by systematically
examining reporting levels in genomic epidemiology studies. This thesis has extended the work
of the few studies that have examined reporting quality per STROBE among observational
studies for infectious diseases.119,120
A limitation of this study is that this work did not account for possible “within-journal”
clustering, although it included articles from 43 unique journals. Another limitation concerns the
lag time period. In this thesis, a lag time of six months was used to account for articles in-press
after guideline publication, and sensitivity analyses was done with a twelve-month lag time.
However, these time periods may not have been long enough for guideline dissemination and
uptake, especially if there were other reporting frameworks that were also being promoted
around the same time. Eight other extensions were published in the same year after the release of
STROME-ID guidelines, according to the EQUATOR network.
6.3. Future directions for research It is unclear why there is low reporting among genomic epidemiology studies of TB. It is

102
possible that authors are still unaware of STROME-ID guidelines, or if they are, that the
guidelines are otherwise too difficult or time-consuming to complete. To investigate these
reasons, qualitative studies should be conducted to assess authors’ attitudes towards STROME-
ID guidelines, including any perceived barriers or facilitators to reporting compliance. These
qualitative studies may also help to identify other possible correlates of reporting quality. Lastly,
researchers should consider developing mandatory reporting guidelines for genomic data to
encourage higher reporting levels beyond social norm expectations among the scientific
community. Strengthening the evidence base about reporting quality would provide authors,
guideline developers and journal editors with more compelling reasons for supporting and using
STROME-ID reporting guidelines.118
Chapter 7. Conclusions
In order to realize the benefits of WGS technology in public health decision-making regarding
TB prevention and control, reporting quality among genomic epidemiology studies needs to be
improved. The impact of reporting guidelines on reporting quality and its correlates that were
investigated in this thesis highlights current gaps in STROME-ID reporting. Reproducibility and
data-sharing may be encouraged through more focused reporting criteria for WGS studies,
formal journal endorsement, and mandatory reporting of STROME-ID guidelines.

103
References
1. World Health Organization. Global tuberculosis control [WHO report]. Geneva,
Switzerland: World Health Organization; 2018. Available from:
http://www.who.int/tb/publications/global_report/en/.
2. Meehan CJ, Goig GA, Kohl TA, Verboven L, Dippenaar A, Ezewudo M, et al. Whole
genome sequencing of Mycobacterium tuberculosis: current standards and open issues. Nat Rev
Microbio. 2019;17(9):533-45.
3. Miyakawa T. No raw data, no science: another possible source of the reproducibility
crisis. Mol Brain. 2020;13(1):24.
4. McDonough KA, Kress Y, Bloom BR. Pathogenesis of tuberculosis: interaction of
Mycobacterium tuberculosis with macrophages. Infect Immun. 1993;61(7):2763-73.
5. Lin PL, Flynn JL. Understanding latent tuberculosis: a moving target. J Immunol.
2010;185(1):15-22.
6. Getahun H, Matteelli A, Chaisson RE, Raviglione M. Latent Mycobacterium tuberculosis
infection. N Engl J Med. 2015;372(22):2127-35.
7. Orme IM, Basaraba RJ. The formation of the granuloma in tuberculosis infection. Semin
Immunol. 2014;26(6):601-9.
8. Schraufnagel DE. “Latent tuberculosis infection” is a term that should go dormant, and
the significance of latent tuberculosis should be rethought. Ann Am Thorac Soc. 2016;13(5):593-
4.
9. Vynnycky E, Fine PEM. Lifetime risks, incubation period, and serial interval of
tuberculosis. Am J Epidemiol. 2000;152(3):247-63.
10. Horsburgh CR, Barry CE, Lange C. Treatment of tuberculosis. N Engl J Med.
2015;373(22):2149-60.
11. Piccazzo R, Paparo F, Garlaschi G. Diagnostic accuracy of chest radiography for the
diagnosis of tuberculosis (TB) and its role in the detection of latent TB Infection: a systematic
review. J Rheumatol. 2014;91:32-40.
12. World Health Organization. Chest radiography in tuberculosis detection: summary of
current WHO recommendations and guidance on programmatic approaches. Switzerland; 2016.

104
13. World Health Organization. Treatment of tuberculosis: guidelines for national programs.
4th edition. Geneva: WHO; 2010.
14. Daley CL. Molecular epidemiology: A tool for understanding control of tuberculosis
transmission. Clin Chest Med. 2005;26(2):217-31.
15. Hasnain SE, O'Toole RF, Grover S, Ehtesham NZ. Whole genome sequencing: A new
paradigm in the surveillance and control of human tuberculosis. Tuberculosis. 2015;95(2):91-4.
16. World Health Organization. WHO guidelines on tuberculosis infection prevention and
control: 2019 update. Geneva: World Health Organization; 2019.
17. Glaziou P, Floyd K, Raviglione MC. Global epidemiology of tuberculosis. Semin Respir
Crit Care Med. 2018;39(3):271-85.
18. Behr MA, Edelstein PH, Ramakrishnan L. Is Mycobacterium tuberculosis infection life
long? BMJ. 2019;367:l5770.
19. Sulis G, Roggi A, Matteelli A, Raviglione MC. Tuberculosis: epidemiology and control.
Mediterr J Hematol Infect Dis. 2014;6(1):e2014070-e.
20. Vachon J, Gallant V, Siu W. Tuberculosis in Canada, 2016. Can Commun Dis Rep.
2018;44(3-4):75-81.
21. Floyd K, Glaziou P, Houben RMGJ, Sumner T, White RG, Raviglione M. Global
tuberculosis targets and milestones set for 2016-2035: definition and rationale. Int J Tuberc Lung
Dis. 2018;22(7):723-30.
22. Huynh J, Marais BJ. Multidrug-resistant tuberculosis infection and disease in children: a
review of new and repurposed drugs. Ther Adv Infect Dis. 2019;6:2049936119864737-.
23. Al-ObaidiMJM, Suhali ZS, Desa MJM. Genotyping approaches for identification and
characterization of staphylococcus aureus. In: Abdurakhmonov I, editor. Genotyping:
IntechOpen; 2018.
24. Niemann S, Supply P. Diversity and evolution of Mycobacterium tuberculosis: moving to
whole-genome-based approaches. Cold Spring Harb Perspect Med. 2014;4(12):a021188-a.
25. Schürch AC, Arredondo-Alonso S, Willems RJL, Goering RV. Whole genome
sequencing options for bacterial strain typing and epidemiologic analysis based on single
nucleotide polymorphism versus gene-by-gene–based approaches. Clin Microbiol Infect.
2018;24(4):350-4.

105
26. van Dijk EL, Auger H, Jaszczyszyn Y, Thermes C. Ten years of next-generation
sequencing technology. Trends Genet. 2014;30(9):418-26.
27. National Tuberculosis Controllers Association/Centers for Disease Control and
Prevention Advisory Group on Tuberculosis Genotyping. Guide to the application of genotyping
to tuberculosis prevention and control. Atlanta, GA: US Department of Health and Human
Services; 2004.
28. Papaventsis D, Casali N, Kontsevaya I, Drobniewski F, Cirillo DM, Nikolayevskyy V.
Whole genome sequencing of Mycobacterium tuberculosis for detection of drug resistance: a
systematic review. Clin Microbiol Infect. 2017;23(2):61-8.
29. Hatherell H-A, Colijn C, Stagg HR, Jackson C, Winter JR, Abubakar I. Interpreting
whole genome sequencing for investigating tuberculosis transmission: a systematic review. BMC
Med. 2016;14(1):21.
30. Roetzer A, Diel R, Kohl TA, Ruckert C, Nubel U, Blom J, et al. Whole genome
sequencing versus traditional genotyping for investigation of a mycobacterium tuberculosis
outbreak: a longitudinal molecular epidemiological study. PLoS Med. 2013;10 (2): e1001387.
31. Köser CU, Ellington MJ, Cartwright EJP, Gillespie SH, Brown NM, Farrington M, et al.
Routine use of microbial whole genome sequencing in diagnostic and public health
microbiology. PLoS Pathog. 2012;8(8):e1002824-e.
32. Oakeson KF, Wagner JM, Mendenhall M, Rohrwasser A, Atkinson-Dunn R.
Bioinformatic analyses of whole-genome sequence data in a public health laboratory. Emerg
Infect Dis. 2017;23(9):1441-5.
33. Kwong JC, McCallum N, Sintchenko V, Howden BP. Whole genome sequencing in
clinical and public health microbiology. Pathology. 2015;47(3):199-210.
34. Ekblom R, Wolf JBW. A field guide to whole-genome sequencing, assembly and
annotation. Evolutionary Applications. 2014;7(9):1026-42.
35. Sandve GK, Nekrutenko A, Taylor J, Hovig E. Ten simple rules for reproducible
computational research. PLoS Comput Biol. 2013;9(10):e1003285.
36. Lubin IM, Aziz N, Babb LJ, Ballinger D, Bisht H, Church DM, et al. principles and
recommendations for standardizing the use of the next-generation sequencing variant file in
clinical settings. J Mol Diagn. 2017;19(3):417-26.
106
37. von Elm E, Altman DG, Egger M, Pocock SJ, Gøtzsche PC, Vandenbroucke JP. The
strengthening the reporting of observational studies in epidemiology (STROBE) statement:
guidelines for reporting observational studies. J Clin Epidemiol. 2008;61(4):344-9.
38. Field N, Cohen T, Struelens MJ, Palm D, Cookson B, Glynn JR, et al. Strengthening the
reporting of molecular epidemiology for infectious diseases (STROME-ID): an extension of the
STROBE statement. Lancet Infect Dis. 2014;14(4):341-52.
39. Armstrong GL, MacCannell DR, Taylor J, Carleton HA, Neuhaus EB, Bradbury RS, et
al. Pathogen genomics in public health. N Engl J Med. 2019;381(26):2569-80.
40. Baxevanis AD, Bateman A. The importance of biological databases in biological
discovery. Curr Protoc Bioinformatics. 2015;50(1).
41. Leinonen R, Akhtar R, Birney E, Bower L, Cerdeno-Tarraga A, Cheng Y, et al. The
European Nucleotide Archive. Nucleic Acids Res. 2011;39:D28-31.
42. Baker M. Is there a reproducibility crisis? A Nature survey lifts the lid on how
researchers view the 'crisis rocking science and what they think will help. Nature. 2016;533:452.
43. Glasziou P, Altman DG, Bossuyt P, Boutron I, Clarke M, Julious S, et al. Reducing waste
from incomplete or unusable reports of biomedical research. Lancet. 2014;383(9913):267-76.
44. Moher D. Reporting research results: a moral obligation for all researchers. Can J
Anaesth. 2007;54(5):331.
45. Phelan J, O’Sullivan DM, Machado D, Ramos J, Whale AS, O’Grady J, et al. The
variability and reproducibility of whole genome sequencing technology for detecting resistance
to anti-tuberculous drugs. Genome Med. 2016;8(1):132.
46. Wyres KL, Conway TC, Garg S, Queiroz C, Reumann M, Holt K, et al. WGS analysis
and interpretation in clinical and public health microbiology laboratories: what are the
requirements and how do existing tools compare? Pathogens. 2014;3(2):437-58.
47. Kanwal S, Khan FZ, Lonie A, Sinnott RO. Investigating reproducibility and tracking
provenance – A genomic workflow case study. BMC Bioinform. 2017;18(1):337.
48. O'Rawe J, Jiang T, Sun G, Wu Y, Wang W, Hu J, et al. Low concordance of multiple
variant-calling pipelines: practical implications for exome and genome sequencing. Genome
Med. 2013;5(3):28.

107
49. Jajou R, Kohl TA, Walker T, Norman A, Cirillo DM, Tagliani E, et al. Towards
standardisation: comparison of five whole genome sequencing (WGS) analysis pipelines for
detection of epidemiologically linked tuberculosis cases. Euro Surveill. 2019;24(50):1900130.
50. Selman TJ, Morris RK, Zamora J, Khan KS. The quality of reporting of primary test
accuracy studies in obstetrics and gynaecology: application of the STARD criteria. BMC
Women's Health. 2011;11(1):8.
51. Ghimire S, Kyung E, Lee H, Kim E. Oncology trial abstracts showed suboptimal
improvement in reporting: a comparative before-and-after evaluation using CONSORT for
Abstract guidelines. J Clin Epidemiol. 2014;67(6):658-66.
52. Jefferson T, Di Pietrantonj C, Debalini MG, Rivetti A, Demicheli V. Relation of study
quality, concordance, take home message, funding, and impact in studies of influenza vaccines:
systematic review. BMJ. 2009;338:b354.
53. Glujovsky D, Boggino C, Riestra B, Coscia A, Sueldo CE, Ciapponi A. Quality of
reporting in infertility journals. Fertil Steril. 2015;103(1):236-41.
54. Rao A, Brück K, Methven S, Evans R, Stel VS, Jager KJ, et al. Quality of reporting and
study design of CKD cohort studies assessing mortality in the elderly before and after STROBE:
a systematic review. PLoS ONE. 2016;11(5):e0155078.
55. Poorolajal J, Cheraghi Z, Irani AD, Rezaeian S. Quality of cohort studies reporting post
the strengthening the reporting of observational studies in epidemiology (STROBE) statement.
Epidemiol Health. 2011;33:e2011005-e.
56. Mackinnon S, Drozdowska BA, Hamilton M, Noel-Storr AH, McShane R, Quinn T. Are
methodological quality and completeness of reporting associated with citation-based measures of
publication impact? A secondary analysis of a systematic review of dementia biomarker studies.
BMJ Open. 2018;8(3):e020331.
57. Hirsch JE. An index to quantify an individual's scientific research output. PNAS USA.
2005;102(46):16569-72.
58. Costas R, Bordons M. The h-index: Advantages, limitations and its relation with other
bibliometric indicators at the micro level. J Informetr. 2007;1(3):193-203.
59. Hodge DR, Lacasse JR. Evaluating journal quality: is the h-index a better measure than
impact factors? Res Soc Work Pract. 2011;21(2):222-30.

108
60. Maleki F, Ovens K, McQuillan I, Kusalik AJ. Size matters: how sample size affects the
reproducibility and specificity of gene set analysis. Hum Genomics. 2019;13(1):42.
61. Fumagalli M. Assessing the effect of sequencing depth and sample size in population
genetics inferences. PLoS ONE. 2013;8(11):e79667-e.
62. Farrokhyar F, Chu R, Whitlock R, Thabane L. A systematic review of the quality of
publications reporting coronary artery bypass grafting trials. Can J Surg. 2007;50(4):266-77.
63. Lai TYY, Wong VWY, Lam RF, Cheng ACO, Lam DSC, Leung GM. Quality of
reporting of key methodological items of randomized controlled trials in clinical ophthalmic
journals. Ophthal Epidemiol. 2007;14(6):390-8.
64. Rios LP, Odueyungbo A, Moitri MO, Rahman MO, Thabane L. Quality of reporting of
randomized controlled trials in general endocrinology literature. J Clin Endocrinol Metab.
2008;93(10):3810-6.
65. van der Werf MJ, Ködmön C. Whole-genome sequencing as tool for investigating
international tuberculosis outbreaks: a systematic review. Front Public Health. 2019;7:87-.
66. Real J, Forné C, Roso-Llorach A, Martínez-Sánchez JM. Quality reporting of
multivariable regression models in observational studies: review of a representative sample of
articles published in biomedical journals. Medicine. 2016;95(20):e3653-e.
67. White IR, Carlin JB. Bias and efficiency of multiple imputation compared with complete-
case analysis for missing covariate values. Stat Med. 2010;29(28):2920-31.
68. Madden K, Phillips M, Solow M, McKinnon V, Bhandari M. A systematic review of
quality of reporting in registered intimate partner violence studies: where can we improve? J Inj
Violence Res. 2019;11(2):123-36.
69. Bastuji-Garin S, Sbidian E, Gaudy-Marqueste C, Ferrat E, Roujeau J-C, Richard M-A, et
al. Impact of STROBE statement publication on quality of observational study reporting:
interrupted time series versus before-after analysis. PLoS ONE. 2013;8(8):e64733.
70. Pouwels KB, Widyakusuma NN, Groenwold RHH, Hak E. Quality of reporting of
confounding remained suboptimal after the STROBE guideline. J Clin Epidemiol. 2016;69:217-
24.
71. Coxe S, West SG, Aiken LS. The analysis of count data: a gentle introduction to poisson
regression and its alternatives. J Pers Assess. 2009;91(2):121-36.

109
72. Zeviani WM, Ribeiro PJ, Bonat WH, Shimakura SE, Muniz JA. The Gamma-count
distribution in the analysis of experimental underdispersed data. J Appl Stat. 2014;41(12):2616-
26.
73. Sellers KF, Morris DS. Underdispersion models: models that are “under the radar”.
Commun Stat-Theor M. 2017;46(24):12075-86.
74. Zeviani WM, Ribeiro PJ, Jr., Bonat WH, Shimakura SE, Muniz JA. The Gamma-count
distribution in the analysis of experimental underdispersed data. J Appl Stat. 2014;41(12):2616-
26.
75. Ramalho EA, Ramalho JJS, Murteira JMR. Alternative estimating and testing empirical
strategies for fractional regression models. J Econ Surv. 2011;25(1):19-68.
76. Moeller MM. Methods for analyzing proportions [Thesis]: The University of Texas;
2013.
77. Schmid M, Wickler F, Maloney KO, Mitchell R, Fenske N, Mayr A. Boosted beta
regression. PLoS ONE. 2013;8(4):e61623.
78. Twisk J, Rijmen F. Longitudinal tobit regression: A new approach to analyze outcome
variables with floor or ceiling effects. J Clin Epidemiol. 2009;62(9):953-8.
79. Hussain A, Rigby R, Stasinopoulos M, Enea M. A flexible approach for modelling a
proportion response variable: Loss given default. Proceedings of the 31st International Workshop
on Statistical Modelling (France). 2016.
80. Edward Martey RMA-H, John K.M. Kuwornu. Commercialization of smallholder
agriculture in Ghana: a tobit regression analysis. Afr J Agric Res. 2012;7(14):2131-41.
81. Mujasi PN, Asbu EZ, Puig-Junoy J. How efficient are referral hospitals in Uganda? A
data envelopment analysis and tobit regression approach. BMC Health Serv Res. 2016;16(1):230.
82. Carter RE, Lipsitz SR, Tilley BC. Quasi-likelihood estimation for relative risk regression
models. Biostatistics. 2005;6(1):39-44.
83. Heinzl H, Mittlböck M. Pseudo R-squared measures for Poisson regression models with
over- or underdispersion. Comput Stat Data An. 2003;44(1):253-71.
84. Faraway JJ. Extending the linear model with R: generalized linear, mixed effects and
nonparametric regression models. Boca Raton: Chapman & Hall/CRC; 2006.
85. Wooldridge JM. Introductory econometrics: a modern approach. 3rd ed. Mason, OH:
South-Western, 2006.

110
86. Berg JS, Khoury MJ, Evans JP. Deploying whole genome sequencing in clinical practice
and public health: meeting the challenge one bin at a time. Genet Med. 2011;13(6):499-504.
87. Lee RS, Behr MA. The implications of whole-genome sequencing in the control of
tuberculosis. Ther Adv Infect Dis. 2016;3(2):47-62.
88. Peng RD, Dominici F, Zeger SL. Reproducible epidemiologic research. Am J Epidemiol.
2006;163(9):783-9.
89. Sorensen AA, Wojahn RD, Manske MC, Calfee RP. Using the strengthening the
reporting of observational studies in epidemiology (strobe) statement to assess reporting of
observational trials in hand surgery. J Hand Surg Am. 2013;38(8):1584-9.
90. Agha RA, Fowler AJ, Limb C, Whitehurst K, Coe R, Sagoo H, et al. Impact of the
mandatory implementation of reporting guidelines on reporting quality in a surgical journal: A
before and after study. Int J Surg. 2016;30:169-72.
91. da Costa BR, Cevallos M, Altman DG, Rutjes AWS, Egger M. Uses and misuses of the
STROBE statement: bibliographic study. BMJ Open. 2011;1(1).
92. Liberati A, Altman DG, Tetzlaff J, Mulrow C, Gotzsche PC, Ioannidis JPA, et al. The
PRISMA statement for reporting systematic reviews and meta-analyses of studies that evaluate
health care interventions: explanation and elaboration. Ann Intern Med. 2009;151(4):W65-W94.
93. Kuroki LM, Allsworth JE, Peipert JF. Methodology and analytic techniques used in
clinical research: associations with journal impact factor. Obstet Gynecol. 2009;114(4):877-84.
94. Falagas ME, Kouranos VD, Michalopoulos A, Rodopoulou SP, Batsiou MA,
Karageorgopoulos DE. Comparison of the distribution of citations received by articles published
in high, moderate, and low impact factor journals in clinical medicine. Intern Med J.
2010;40(8):587-91.
95. Cabibbe AM, Trovato A, De Filippo MR, Ghodousi A, Rindi L, Garzelli C, et al.
Countrywide implementation of whole genome sequencing: an opportunity to improve
tuberculosis management, surveillance and contact tracing in low incidence countries. The Eur
Respir J. 2018;51(6): 1800387.
96. Genestet C, Tatai C, Berland JL, Claude JB, Westeel E, Hodille E, et al. Prospective
whole-genome sequencing in tuberculosis outbreak investigation, France, 2017-2018. Emerg
Infect Dis. 2019;25(3):589-92.
111
97. Walker TM, Merker M, Knoblauch AM, Helbling P, Schoch OD, van der Werf MJ, et al.
A cluster of multidrug-resistant Mycobacterium tuberculosis among patients arriving in Europe
from the Horn of Africa: a molecular epidemiological study. Lancet Infect Dis. 2018;18(4):431-
40.
98. Parsons NR, Hiskens R, Price CL, Achten J, Costa ML. A systematic survey of the
quality of research reporting in general orthopaedic journals. J Bone Joint Surg Br.
2011;93(9):1154-9.
99. Hendriksma M, Joosten MHMA, Peters JPM, Grolman W, Stegeman I. Evaluation of the
quality of reporting of observational studies in otorhinolaryngology - based on the STROBE
statement. PLoS ONE. 2017;12(1):e0169316.
100. Sharp MK, Bertizzolo L, Rius R, Wager E, Gómez G, Hren D. Using the STROBE
statement: survey findings emphasized the role of journals in enforcing reporting guidelines. J
Clin Epidemiol. 2019;116:26-35.
101. Sharp MK, Tokalić R, Gómez G, Wager E, Altman DG, Hren D. A cross-sectional
bibliometric study showed suboptimal journal endorsement rates of STROBE and its extensions.
J Clin Epidemiol. 2019;107:42-50.
102. Sharp MK, Utrobicic A, Gomez G, Cobo E, Wager E, Hren D. The STROBE extensions:
protocol for a qualitative assessment of content and a survey of endorsement. BMJ Open.
2017;7(10).
103. Van Belkum A, Tassios PT, Dijkshoorn L, Haeggman S, Cookson B, Fry NK, et al.
Guidelines for the validation and application of typing methods for use in bacterial
epidemiology. Clin Microbiol Infect. 2007;13(s3):1-46.
104. Wyllie DH, Davidson JA, Grace Smith E, Rathod P, Crook DW, Peto TEA, et al. A
Quantitative evaluation of MIRU-VNTR typing against whole-genome sequencing for
identifying Mycobacterium tuberculosis transmission: a prospective observational cohort study.
EBioMedicine. 2018;34:122-30.
105. Martin MA, Lee RS, Cowley LA, Gardy JL, Hanage WP. Within-host Mycobacterium
tuberculosis diversity and its utility for inferences of transmission. Microb Genom. 2018;4(10).
106. Lee KP, Schotland M, Bacchetti P, Bero LA. Association of journal quality indicators
with methodological quality of clinical research articles. JAMA. 2002;287(21):2805-8.
112
107. Bornmann L, Williams R. Can the journal impact factor be used as a criterion for the
selection of junior researchers? a large-scale empirical study based on ResearcherID data. J
Informetr. 2017;11(3):788-99.
108. Retzer V, Jurasinski G. Towards objectivity in research evaluation using bibliometric
indicators – a protocol for incorporating complexity. Basic Appl Ecol. 2009;10(5):393-400.
109. Oswald A. An examination of the reliability of prestigious scholarly journals: evidence
and implications for decision-makers. Economica. 2007;74(293):21-31.
110. Waltman L, Costas R, Jan van Eck N. Some limitations of the h index: a commentary on
Ruscio and colleagues' analysis of bibliometric indices. Measurement. 2012;10(3):172-5.
111. Nekrutenko A, Taylor J. Next-generation sequencing data interpretation: enhancing
reproducibility and accessibility. Nat Rev Genet. 2012;13(9):667-72.
112. Reality check on reproducibility. Nature. 2016;533(7604).
113. Simoneau J, Dumontier S, Gosselin R, Scott MS. Current RNA-seq methodology
reporting limits reproducibility. Brief Bioinform. 2019.
114. Bryant JM, Schürch AC, van Deutekom H, Harris SR, de Beer JL, de Jager V, et al.
Inferring patient to patient transmission of Mycobacterium tuberculosis from whole genome
sequencing data. BMC Infect Dis. 2013;13(1):110.
115. Fleming PS, Buckley N, Seehra J, Polychronopoulou A, Pandis N. Reporting quality of
abstracts of randomized controlled trials published in leading orthodontic journals from 2006 to
2011. Am Journal Orthod Dentofacial Orthop. 2012;142(4):451-8.
116. Al-Ghafli H, Kohl TA, Merker M, Varghese B, Halees A, Niemann S, et al. Drug-
resistance profiling and transmission dynamics of multidrug-resistant Mycobacterium
tuberculosis in Saudi Arabia revealed by whole genome sequencing. Infect Drug Resist.
2018;11:2219-29.
117. Alaridah N, Hallback ET, Tangrot J, Winqvistz N, Sturegard E, Floren-Johanssons K, et
al. Transmission dynamics study of tuberculosis isolates with whole genome sequencing in
southern Sweden. Sci Rep. 2019;9.
118. Arandjelovic I, Merker M, Richter E, Kohl TA, Savic B, Soldatovic I, et al. Longitudinal
outbreak of multidrug-resistant tuberculosis in a hospital setting, Serbia. Emerg Infect Dis.
2019;25(3):555-8.

113
119. Arnold A, Witney AA, Vergnano S, Roche A, Cosgrove CA, Houston A, et al. XDR-TB
transmission in London: Case management and contact tracing investigation assisted by early
whole genome sequencing. J Infect. 2016;73(3):210-8.
120. Auld SC, Shah NS, Mathema B, Brown TS, Ismail N, Omar SV, et al. Extensively drug-
resistant tuberculosis in South Africa: genomic evidence supporting transmission in
communities. Eur Respir J. 2018;52(4).
121. Ayabina D, Ronning JO, Alfsnes K, Debech N, Brynildsrud OB, Arnesen T, et al.
Genome-based transmission modeling separates imported tuberculosis from recent transmission
within an immigrant population. Microb Genom. 2018; 4(10): e000219.
122. Bainomugisa A, Lavu E, Hiashiri S, Majumdar S, Honjepari A, Moke R, et al. Multi-
clonal evolution of multi-drug-resistant/extensively drugresistant Mycobacterium tuberculosis in
a high-prevalence setting of Papua New Guinea for over three decades. Microb Genom.
2018;4(2):000147.
123. Bouzouita I, Cabibbe AM, Trovato A, Daroui H, Ghariani A, Midouni B, et al. Whole-
genome sequencing of drug-resistant Mycobacterium tuberculosis strains, Tunisia, 2012-2016.
Emerg Infect Dis. 2019;25(3):547-50.
124. Bjorn-Mortensen K, Soborg B, Koch A, Ladefoged K, Merker M, Lillebaek T, et al.
Tracing Mycobacterium tuberculosis transmission by whole genome sequencing in a high
incidence setting: a retrospective population-based study in East Greenland. Sci Rep.
2016;6:33180.
125. Black PA, de Vos M, Louw GE, van der Merwe RG, Dippenaar A, Streicher EM, et al.
Whole genome sequencing reveals genomic heterogeneity and antibiotic purification in
Mycobacterium tuberculosis isolates. BMC Genomics. 2015;16(1):857.
126. Brown TS, Narechania A, Walker JR, Planet PJ, Bifani PJ, Kolokotronis S-O, et al.
Genomic epidemiology of Lineage 4 Mycobacterium tuberculosis subpopulations in New York
City and New Jersey, 1999-2009. BMC Genomics. 2016;17(1):947.
127. Bryant JM, Harris SR, Parkhill J, Dawson R, Diacon AH, van Helden P, et al. Whole-
genome sequencing to establish relapse or re-infection with Mycobacterium tuberculosis: A
retrospective observational study. Lancet Respir Med. 2013;1(10):786-92.
114
128. Bui DP, Oren E, Roe DJ, Brown HE, Harris RB, Knight GM, et al. A case-control study
to identify community venues associated with genetically-clustered, multidrug-resistant
tuberculosis disease in Lima, Peru. Clin Infect Dis. 2018;68(9):1547-55.
129. Casali N, Nikolayevskyy V, Balabanova Y, Ignatyeva O, Kontsevaya I, Harris SR, et al.
Microevolution of extensively drug-resistant tuberculosis in Russia. Genome Res.
2012;22(4):735-45.
130. Casali N, Nikolayevskyy V, Balabanova Y, Harris SR, Ignatyeva O, Kontsevaya I, et al.
Evolution and transmission of drug-resistant tuberculosis in a Russian population. Nat Genet.
2014;46(3):279-86.
131. Casali N, Broda A, Harris SR, Parkhill J, Brown T, Drobniewski F. Whole genome
sequence analysis of a large isoniazid-resistant tuberculosis outbreak in London: a retrospective
observational study. PLoS Med. 2016;13(10):e1002137.
132. Chatterjee A, Nilgiriwala K, Saranath D, Rodrigues C, Mistry N. Whole genome
sequencing of clinical strains of Mycobacterium tuberculosis from Mumbai, India: A potential
tool for determining drug-resistance and strain lineage. Tuberculosis. 2017;107:63-72.
133. Clark TG, Mallard K, Coll F, Preston M, Assefa S, Harris D, et al. Elucidating emergence
and transmission of multidrug-resistant tuberculosis in treatment experienced patients by whole
genome sequencing. PLoS ONE. 2013;8(12):e83012.
134. Cohen KA, Abeel T, Manson McGuire A, Desjardins CA, Munsamy V, Shea TP, et al.
Evolution of extensively drug-resistant tuberculosis over four decades: whole genome
sequencing and dating analysis of mycobacterium tuberculosis isolates from KwaZulu-Natal.
PLoS Med. 2015;12(9):e1001880.
135. Comas I, Hailu E, Kiros T, Bekele S, Mekonnen W, Gumi B, et al. Population genomics
of Mycobacterium tuberculosis in Ethiopia contradicts the virgin soil hypothesis for human
tuberculosis in sub-saharan Africa. Curr Biol. 2015;25(24):3260-6.
136. Comas I, Coscolla M, Luo T, Borrell S, Holt KE, Kato-Maeda M, et al. Out-of-Africa
migration and Neolithic coexpansion of Mycobacterium tuberculosis with modern humans. Nat
Genet. 2013;45(10):1176-82.
137. Coscolla M, Barry PM, Oeltmann JE, Koshinsky H, Shaw T, Cilnis M, et al. Genomic
epidemiology of multidrug-resistant Mycobacterium tuberculosis during transcontinental spread.
J Infect Dis. 2015;212(2):302-10.

115
138. Dheda K, Limberis JD, Pietersen E, Phelan J, Esmail A, Lesosky M, et al. Outcomes,
infectiousness, and transmission dynamics of patients with extensively drug-resistant
tuberculosis and home-discharged patients with programmatically incurable tuberculosis: a
prospective cohort study. Lancet Respir Med. 2017;5(4):269-81.
139. Dixit A, Freschi L, Vargas R, Calderon R, Sacchettini J, Drobniewski F, et al. Whole
genome sequencing identifies bacterial factors affecting transmission of multidrug-resistant
tuberculosis in a high-prevalence setting. Sci Rep. 2019;9.
140. Doroshenko A, Pepperell CS, Heffernan C, Egedahl ML, Mortimer TD, Smith TM, et al.
Epidemiological and genomic determinants of tuberculosis outbreaks in First Nations
communities in Canada. BMC Med. 2018;16.
141. Eldholm V, Monteserin J, Rieux A, Lopez B, Sobkowiak B, Ritacco V, et al. Four
decades of transmission of a multidrug-resistant Mycobacterium tuberculosis outbreak strain.
Nat Commun. 2015;6.
142. Fiebig L, Kohl TA, Popovici O, Muhlenfeld M, Indra A, Homorodean D, et al. A joint
cross-border investigation of a cluster of multidrug-resistant tuberculosis in Austria, Romania
and Germany in 2014 using classic, genotyping and whole genome sequencing methods: Lessons
learnt. Euro Surveill. 2017;22(2).
143. Gardy JL, Johnston JC, Sui SJ, Cook VJ, Shah L, Brodkin E, et al. Whole-genome
sequencing and social-network analysis of a tuberculosis outbreak. N Engl J Med.
2011;364(8):730-9.
144. Gautam SS, Aogain MM, Cooley LA, Haug G, Fyfe JA, Globan M, et al. Molecular
epidemiology of tuberculosis in Tasmania and genomic characterisation of its first known multi-
drug resistant case. PLoS ONE. 2018;13(2):e0192351.
145. Gautam SS, Mac Aogain M, Bower JE, Basu I, O'Toole RF. Differential carriage of
virulence-associated loci in the New Zealand Rangipo outbreak strain of Mycobacterium
tuberculosis. Infect Dis. 2017;49(9):680-8.
146. Glynn JR, Guerra-Assuncao JA, Houben RM, Sichali L, Mzembe T, Mwaungulu LK, et
al. Whole genome sequencing shows a low proportion of tuberculosis disease is attributable to
known close contacts in rural Malawi. PLoS ONE. 2015;10(7):e0132840.

116
147. Guerra-Assuncao JA, Crampin AC, Houben RM, Mzembe T, Mallard K, Coll F, et al.
Large-scale whole genome sequencing of M. tuberculosis provides insights into transmission in a
high prevalence area. eLife. 2015;4:03.
148. Guerra-Assunçao JA, Houben RMGJ, Crampin AC, Mzembe T, Mallard K, Coll F, et al.
Recurrence due to relapse or reinfection with Mycobacterium tuberculosis: a whole-genome
sequencing approach in a large, population-based cohort with a high HIV infection prevalence
and active follow-up. J Infect Dis. 2015;211(7):1154-63.
149. Guthrie JL, Delli Pizzi A, Roth D, Kong C, Jorgensen D, Rodrigues M, et al. Genotyping
and Whole-Genome Sequencing to Identify Tuberculosis Transmission to Pediatric Patients in
British Columbia, Canada, 2005-2014. J Infect Dis. 2018;218(7):1155-63.
150. Ho ZJM, Chee CBE, Ong RTH, Sng LH, Peh WLJ, Cook AR, et al. Investigation of a
cluster of multi-drug resistant tuberculosis in a high-rise apartment block in Singapore. Int J
Infect Dis. 2018;67:46-51.
151. Holden KL, Bradley CW, Curran ET, Pollard C, Smith G, Holden E, et al. Unmasking
leading to a healthcare worker Mycobacterium tuberculosis transmission. J Hosp Infect.
2018;100(4):E226-E32.
152. Holt KE, McAdam P, Thai PVK, Thuong NTT, Ha DTM, Lan NN, et al. Frequent
transmission of the Mycobacterium tuberculosis Beijing lineage and positive selection for the
EsxW Beijing variant in Vietnam. Nat Genet. 2018;50(6):849-56.
153. Huang H, Ding N, Yang T, Li C, Jia X, Wang G, et al. Cross-sectional whole-genome
sequencing and epidemiological study of multidrug-resistant Mycobacterium tuberculosis in
China. Clin Infect Dis. 2019; 69(30):405-413.
154. Ioerger TR, Koo S, No E-G, Chen X, Larsen MH, Jacobs WR, Jr., et al. Genome analysis
of multi- and extensively-drug-resistant tuberculosis from KwaZulu-Natal, South Africa. PLoS
ONE. 2009;4(11):e7778.
155. Ioerger TR, Feng Y, Chen X, Dobos KM, Victor TC, Streicher EM, et al. The non-
clonality of drug resistance in Beijing-genotype isolates of Mycobacterium tuberculosis from the
Western Cape of South Africa. BMC Genomics. 2010;11:670.
156. Ismail NA, Omar SV, Joseph L, Govender N, Blows L, Ismail F, et al. Defining
bedaquiline susceptibility, resistance, cross-resistance and associated genetic determinants: a
retrospective cohort study. EBioMedicine. 2018;28:136-42.
117
157. Jajou R, de Neeling A, Rasmussen EM, Norman A, Mulder A, van Hunen R, et al. A
predominant variable-number tandem-repeat cluster of Mycobacterium tuberculosis isolates
among asylum seekers in the Netherlands and Denmark, deciphered by whole-genome
sequencing. J Clin Microbiol. 2018;56(2).
158. Jajou R, De Neeling A, Van Hunen R, De Vries G, Schimmel H, Mulder A, et al.
Epidemiological links between tuberculosis cases identified twice as efficiently by whole
genome sequencing than conventional molecular typing: A population-based study. PLoS ONE.
2018;13(4):e0195413.
159. Jiang Q, Lu L, Wu J, Yang C, Prakash R, Zuo T, et al. Assessment of tuberculosis contact
investigation in Shanghai, China: An 8-year cohort study. Tuberculosis. 2018;108:10-5.
160. Kato-Maeda M, Ho C, Passarelli B, Banaei N, Grinsdale J, Flores L, et al. Use of whole
genome sequencing to determine the microevolution of Mycobacterium tuberculosis during an
outbreak. PLoS ONE. 2013;8 (3); e58235.
161. Koster K, Largen A, Foster JT, Drees KP, Qian LS, Desmond EP, et al. Whole genome
SNP analysis suggests unique virulence factor differences of the Beijing and Manila families of
Mycobacterium tuberculosis found in Hawaii. PLoS ONE. 2018;13(7).
162. Koster KJ, Largen A, Foster JT, Drees KP, Qian LS, Desmond E, et al. Genomic
sequencing is required for identification of tuberculosis transmission in Hawaii. BMC Infect Dis.
2018;18.
163. Kato-Miyazawa M, Miyoshi-Akiyama T, Kanno Y, Takasaki J, Kirikae T, Kobayashi N.
Genetic diversity of Mycobacterium tuberculosis isolates from foreign-born and Japan-born
residents in Tokyo. Clin Microbiol Infect. 2015;21(3):248.
164. Korhonen V, Smit PW, Haanpera M, Casali N, Ruutu P, Vasankari T, et al. Whole
genome analysis of Mycobacterium tuberculosis isolates from recurrent episodes of tuberculosis,
Finland, 1995-2013. Clin Microbiol Infect. 2016;22(6):549-54.
165. Lalor MK, Casali N, Walker TM, Anderson LF, Davidson JA, Ratna N, et al. The use of
whole-genome sequencing in cluster investigation of a multidrug-resistant tuberculosis outbreak.
Eur Respir J. 2018;51(6).
166. Lanzas F, Karakousis PC, Sacchettini JC, Ioerger TR. Multidrug-resistant tuberculosis in
panama is driven by clonal expansion of a multidrug-resistant mycobacterium tuberculosis strain

118
related to the KZN extensively drug-resistant m. tuberculosis strain from South Africa. J Clinl
Microbiol. 2013;51(10):3277-85.
167. Lee RS, Radomski N, Proulx JF, Manry J, McIntosh F, Desjardins F, et al. Reemergence
and amplification of tuberculosis in the Canadian Arctic. J Infect Dis. 2015;211(12):1905-14.
168. Lee RS, Radomski N, Proulx J-F, Levade I, Shapiro BJ, McIntosh F, et al. Population
genomics of Mycobacterium tuberculosis in the Inuit. Proc Natl Acad Sci USA.
2015;112(44):13609-14.
169. Luo T, Comas I, Luo D, Lu B, Wu J, Wei L, et al. Southern East Asian origin and
coexpansion of Mycobacterium tuberculosis Beijing family with Han Chinese. Proc Natl Acad
Sci USA. 2015;112(26):8136-41.
170. Luo T, Yang C, Peng Y, Lu L, Sun G, Wu J, et al. Whole-genome sequencing to detect
recent transmission of Mycobacterium tuberculosis in settings with a high burden of
tuberculosis. Tuberculosis. 2014;94(4):434-40.
171. Ma MJ, Yang Y, Wang HB, Zhu YF, Fang LQ, An XP, et al. Transmissibility of
tuberculosis among school contacts: An outbreak investigation in a boarding middle school,
China. Infect Genet Evol. 2015;32:148-55.
172. Macedo R, Pinto M, Borges V, Nunes A, Oliveira O, Portugal I, et al. Evaluation of a
gene-by-gene approach for prospective whole-genome sequencing-based surveillance of
multidrug resistant Mycobacterium tuberculosis. Tuberculosis. 2019;115:81-8.
173. Madrazo-Moya CF, Cancino-Munoz I, Cuevas-Cordoba B, Gonzalez-Covarrubias V,
Barbosa-Amezcua M, Soberon X, et al. Whole genomic sequencing as a tool for diagnosis of
drug and multidrug-resistance tuberculosis in an endemic region in Mexico. PLoS ONE.
2019;14(6).
174. Mai TQ, Martinez E, Menon R, Van Anh NT, Hien NT, Marais B, et al. Mycobacterium
tuberculosis drug resistance and transmission among human immunodeficiency virus-infected
patients in Ho Chi Minh City, Vietnam. Am J of Trop Med Hyg. 2018;99(6):1397-406.
175. Makhado NA, Matabane E, Faccin M, Pincon C, Jouet A, Boutachkourt F, et al.
Outbreak of multidrug-resistant tuberculosis in South Africa undetected by WHO-endorsed
commercial tests: an observational study. Lancet Infect Dis. 2018;18(12):1350-9.

119
176. Malm S, Linguissi LSG, Tekwu EM, Vouvoungui JC, Kohl TA, Beckert P, et al. New
Mycobacterium tuberculosis complex sublineage, Brazzaville, Congo. Emerg Infect Dis.
2017;23(3):423-9.
177. Manson AL, Abeel T, Galagan JE, Sundaramurthi JC, Salazar A, Gehrmann T, et al.
Mycobacterium tuberculosis whole genome sequences from Southern India suggest novel
resistance mechanisms and the need for region-specific diagnostics. Clin Infect Dis.
2017;64(11):1494-501.
178. Manson AL, Cohen KA, Abeel T, Desjardins CA, Armstrong DT, Barry CE, et al.
Genomic analysis of globally diverse Mycobacterium tuberculosis strains provides insights into
the emergence and spread of multidrug resistance. Nat Genet. 2017;49(3):395-402.
179. Mehaffy C, Guthrie JL, Alexander DC, Stuart R, Rea E, Jamieson FB. Marked
microevolution of a unique Mycobacterium tuberculosis strain in 17 years of ongoing
transmission in a high risk population. PLoS ONE. 2014;9(11):0112928.
180. Merker M, Blin C, Mona S, Duforet-Frebourg N, Lecher S, Willery E, et al. Evolutionary
history and global spread of the Mycobacterium tuberculosis Beijing lineage. Nat Genet.
2015;47(3):242-9.
181. Merker M, Barbier M, Cox H, Rasigade JP, Feuerriegel S, Kohl TA, et al. Compensatory
evolution drives multidrug-resistant tuberculosis in central Asia. eLife. 2018;7.
182. Merker M, Kohl TA, Roetzer A, Truebe L, Richter E, Rusch-Gerdes S, et al. Whole
genome sequencing reveals complex evolution patterns of multidrug-resistant Mycobacterium
tuberculosis Beijing strains in patients. PLoS ONE. 2013;8(12):e82551.
183. Mizukoshi F, Miyoshi-Akiyama T, Iwai H, Suzuki T, Kiritani R, Kirikae T, et al. Genetic
diversity of Mycobacterium tuberculosis isolates from Tochigi prefecture, a local region of
Japan. BMC Infect Dis. 2017;17(1):365.
184. Mokrousov I, Shitikov E, Skiba Y, Kolchenko S, Chernyaeva E, Vyazovaya A. Emerging
peak on the phylogeographic landscape of Mycobacterium tuberculosis in west Asia: definitely
smoke, likely fire. Mol Phylogenetics Evol. 2017;116:202-12.
185. Mortimer TD, Weber AM, Pepperell CS. Signatures of selection at drug resistance loci in
Mycobacterium tuberculosis. mSystems. 2018;3(1).

120
186. Nelson KN, Shah NS, Mathema B, Ismail N, Brust JCM, Brown TS, et al. Spatial
patterns of extensively drug-resistant tuberculosis transmission in KwaZulu-Natal, South Africa.
J Infect Dis. 2018;218(12):1964-73.
187. Norheim G, Seterelv S, Arnesen TM, Mengshoel AT, Tonjum T, Ronning JO, et al.
Tuberculosis Outbreak in an Educational Institution in Norway. J Clin Microbiol.
2017;55(5):1327-33.
188. Ocheretina O, Shen L, Escuyer VE, Mabou M-M, Royal-Mardi G, Collins SE, et al.
Whole genome sequencing investigation of a tuberculosis outbreak in Port-au-Prince, Haiti
caused by a strain with a "low-level" rpob mutation l511p - insights into a mechanism of
resistance escalation. PLoS ONE. 2015;10(6):e0129207.
189. O'Neill MB, Shockey A, Zarley A, Aylward W, Eldholm V, Kitchen A, et al. Lineage
specific histories of Mycobacterium tuberculosis dispersal in Africa and Eurasia. Mol Ecol.
2019;28(13):3241-56.
190. Otchere ID, Coscolla M, Sanchez-Buso L, Asante-Poku A, Meehan C, Osei-Wusu S, et
al. Comparative genomics of Mycobacterium africanum Lineage 5 and Lineage 6 from Ghana
suggests different ecological niches. Sci Rep. 2018;8;11269.
191. Outhred AC, Holmes N, Sadsad R, Martinez E, Jelfs P, Hill-Cawthorne GA, et al.
Identifying likely transmission pathways within a 10-year community outbreak of tuberculosis
by high-depth whole genome sequencing. PLoS ONE. 2016;11(3):e0150550.
192. Packer S, Green C, Brooks-Pollock E, Chaintarli K, Harrison S, Beck CR. Social network
analysis and whole genome sequencing in a cohort study to investigate TB transmission in an
educational setting. BMC Infect Dis. 2019;19.
193. Panossian B, Salloum T, Araj GF, Khazen G, Tokajian S. First insights on the genetic
diversity of MDR Mycobacterium tuberculosis in Lebanon. BMC Infect Dis. 2018;18.
194. Parvaresh L, Crighton T, Martinez E, Bustamante A, Chen S, Sintchenko V. Recurrence
of tuberculosis in a low-incidence setting: a retrospective cross-sectional study augmented by
whole genome sequencing. BMC Infect Dis. 2018;18.
195. Perdigao J, Silva H, Machado D, Macedo R, Maltez F, Silva C, et al. Unraveling genomic
diversity and evolution in Lisbon, Portugal, a highly drug resistant setting. BMC Genomics.
2014;15 (1); 991.

121
196. Perez-Lago L, Comas I, Navarro Y, Gonzalez-Candelas F, Herranz M, Bouza E, et al.
Whole genome sequencing analysis of intrapatient microevolution in Mycobacterium
tuberculosis: potential impact on the inference of tuberculosis transmission. J Infect Dis.
2014;209(1):98-108.
197. Regmi SM, Chaiprasert A, Kulawonganunchai S, Tongsima S, Coker OO, Prammananan
T, et al. Whole genome sequence analysis of multidrug-resistant Mycobacterium tuberculosis
Beijing isolates from an outbreak in Thailand. Mol Genet Genomics. 2015;290(5):1933-41.
198. Roycroft E, O'Toole RF, Fitzgibbon MM, Montgomery L, O'Meara M, Downes P, et al.
Molecular epidemiology of multi- and extensively-drug-resistant Mycobacterium tuberculosis in
Ireland, 2001-2014. J Infect. 2018;76(1):55-67.
199. Ruesen C, Chaidir L, van Laarhoven A, Dian S, Ganiem AR, Nebenzahl-Guimaraes H, et
al. Large-scale genomic analysis shows association between homoplastic genetic variation in
Mycobacterium tuberculosis genes and meningeal or pulmonary tuberculosis. BMC Genomics.
2018;19(1):122.
200. Rutaihwa LK, Menardo F, Stucki D, Gygli SM, Ley SD, Malla B, et al. Multiple
introductions of Mycobacterium tuberculosis lineage 2–Beijing into Africa over centuries. Front
Ecol and Evol. 2019;7(112).
201. Saelens JW, Lau-Bonilla D, Moller A, Medina N, Guzman B, Calderon M, et al. Whole
genome sequencing identifies circulating Beijing-lineage Mycobacterium tuberculosis strains in
Guatemala and an associated urban outbreak. Tuberculosis. 2015;95(6):810-6.
202. Satta G, Witney AA, Shorten RJ, Karlikowska M, Lipman M, McHugh TD. Genetic
variation in Mycobacterium tuberculosis isolates from a London outbreak associated with
isoniazid resistance. BMC Med. 2016;14:1-9.
203. Schurch AC, Kremer K, Daviena O, Kiers A, Boeree MJ, Siezen RJ, et al. High-
resolution typing by integration of genome sequencing data in a large tuberculosis cluster. J Clin
Microbiol. 2010;48(9):3403-6.
204. Senghore M, Otu J, Witney A, Gehre F, Doughty EL, Kay GL, et al. Whole-genome
sequencing illuminates the evolution and spread of multidrug-resistant tuberculosis in Southwest
Nigeria. PLoS ONE. 2017;12(9):e0184510.

122
205. Seraphin MN, Didelot X, Nolan DJ, May JR, Khan MSR, Murray ER, et al. Genomic
investigation of a Mycobacterium tuberculosis outbreak involving prison and community cases
in Florida, United States. Am J Trop Med Hyg. 2018;99(4):867-74.
206. Shah NS, Auld SC, Brust JCM, Mathema B, Ismail N, Moodley P, et al. Transmission of
extensively drug-resistant tuberculosis in south Africa. N Engl J Med. 2017;376(3):243-53.
207. Smit PW, Vasankari T, Aaltonen H, Haanpera M, Casali N, Marttila H, et al. Enhanced
tuberculosis outbreak investigation using whole genome sequencing and IGRA. Eur Resp J.
2015;45(1):276-9.
208. Sobkowiak B, Glynn JR, Houben R, Mallard K, Phelan JE, Guerra-Assuncao JA, et al.
Identifying mixed Mycobacterium tuberculosis infections from whole genome sequence data.
BMC Genomics. 2018;19(1):613.
209. Stucki D, Ballif M, Bodmer T, Coscolla M, Maurer AM, Droz S, et al. Tracking a
tuberculosis outbreak over 21 years: strain-specific single-nucleotide polymorphism typing
combined with targeted whole-genome sequencing. J Infect Dis. 2015;211(8):1306-16.
210. Stucki D, Ballif M, Egger M, Furrer H, Altpeter E, Battegay M, et al. Standard
genotyping overestimates transmission of Mycobacterium tuberculosis among immigrants in a
low-incidence country. J Clin Microbiol. 2016;54(7):1862-70.
211. Stucki D, Brites D, Jeljeli L, Coscolla M, Liu Q, Trauner A, et al. Mycobacterium
tuberculosis lineage 4 comprises globally distributed and geographically restricted sublineages.
Nat Genet. 2016;48(12):1535-43.
212. Tyler AD, Randell E, Baikie M, Antonation K, Janella D, Christianson S, et al.
Application of whole genome sequence analysis to the study of Mycobacterium tuberculosis in
Nunavut, Canada. PLoS ONE. 2017;12(10):e0185656.
213. Vaziri F, Kohl TA, Ghajavand H, Kamakoli MK, Merker M, Hadifar S, et al. Genetic
diversity of multi- and extensively drug-resistant mycobacterium tuberculosis isolates in the
capital of Iran, revealed by whole-genome sequencing. J Clin Microbiol. 2019;57(1).
214. Walker TM, Ip CL, Harrell RH, Evans JT, Kapatai G, Dedicoat MJ, et al. Whole-genome
sequencing to delineate Mycobacterium tuberculosis outbreaks: a retrospective observational
study. Lancet Infect Dis. 2013;13(2):137-46.
123
215. Walker TM, Lalor MK, Broda A, Ortega LS, Morgan M, Parker L, et al. Assessment of
Mycobacterium tuberculosis transmission in Oxfordshire, UK, 2007-12, with whole pathogen
genome sequences: an observational study. Lancet Respir Med. 2014;2(4):285-92.
216. Winglee K, Manson McGuire A, Maiga M, Abeel T, Shea T, Desjardins CA, et al. Whole
genome sequencing of Mycobacterium africanum strains from Mali provides insights into the
mechanisms of geographic restriction. PLoS Negl Trop Dis. 2016;10(1):e0004332.
217. Witney AA, Bateson AL, Jindani A, Phillips PP, Coleman D, Stoker NG, et al. Use of
whole-genome sequencing to distinguish relapse from reinfection in a completed tuberculosis
clinical trial. BMC Med. 2017;15(1):71.
218. Wollenberg KR, Desjardins CA, Zalutskaya A, Slodovnikova V, Oler AJ, Quinones M, et
al. Whole-genome sequencing of Mycobacterium tuberculosis provides insight into the evolution
and genetic composition of drug-resistant tuberculosis in Belarus. J Clin Microbiol.
2017;55(2):457-60.
219. Wyllie DH, Davidson JA, Smith EG, Rathod P, Crook DW, Peto TEA, et al. A
quantitative evaluation of miru-vntr typing against whole-genome sequencing for identifying
mycobacterium tuberculosis transmission: a prospective observational cohort study.
EBioMedicine. 2018;34:122-30.
220. Yang C, Luo T, Shen X, Wu J, Gan M, Xu P, et al. Transmission of multidrug-resistant
Mycobacterium tuberculosis in Shanghai, China: a retrospective observational study using
whole-genome sequencing and epidemiological investigation. Lancet Infect Dis. 2017;17(3):275-
84.
221. Yang CG, Lu LP, Warren JL, Wu J, Jiang Q, Zuo TY, et al. Internal migration and
transmission dynamics of tuberculosis in Shanghai, China: an epidemiological, spatial, genomic
analysis. Lancet Infect Dis. 2018;18(7):788-95.
222. Yimer SA, Namouchi A, Zegeye ED, Holm-Hansen C, Norheim G, Abebe M, et al.
Deciphering the recent phylogenetic expansion of the originally deeply rooted Mycobacterium
tuberculosis lineage 7. BMC Evol Biol. 2016;16(1):146.
223. Adams AD, Benner RS, Riggs TW, Chescheir NC. Use of the STROBE checklist to
evaluate the reporting quality of observational research in obstetrics. Obstet Gynecol.
2018;132(2):507-12.

124
224. Bhopal R, Rankin J, McColl E, Thomas L, Kaner E, Stacy R, et al. The vexed question of
authorship: views of researchers in a British medical faculty. BMJ. 1997;314(7086):1009-12.
225. Reisenberg D, Lundberg GD. The order of authorship: who’s on first? JAMA.
1990(264):1857.
226. Jajou R, de Neeling A, van Hunen R, de Vries G, Schimmel H, Mulder A, et al.
Epidemiological links between tuberculosis cases identified twice as efficiently by whole
genome sequencing than conventional molecular typing: a population-based study. PLoS One.
2018;13(4):e0195413.
227. Wyllie D, Davidson J, Walker T, Rathod P, Peto T, Robinson E, et al. A quantitative
evaluation of MIRU-VNTR typing against whole-genome sequencing for identifying
Mycobacterium tuberculosis transmission: a prospective observational cohort study.
EBioMedicine. 2018.
228. Gurjav U, Outhred AC, Jelfs P, McCallum N, Wang Q, Hill-Cawthorne GA, et al. Whole
genome sequencing demonstrates limited transmission within identified Mycobacterium
tuberculosis clusters in New South Wales, Australia. PLoS One. 2016;11(10): e0163612.
229. Moher D, Jones A, Lepage L, Group ftC. Use of the CONSORT statement and quality of
reports of randomized trials: a comparative before-and-after evaluation. JAMA.
2001;285(15):1992-5.
230. Cobo E, Cortés J, Ribera JM, Cardellach F, Selva-O'Callaghan A, Kostov B, et al. Effect
of using reporting guidelines during peer review on quality of final manuscripts submitted to a
biomedical journal: masked randomised trial. BMJ. 2011;343:d6783-d.
231. Ramke J, Palagyi A, Jordan V, Petkovic J, Gilbert CE. Using the STROBE statement to
assess reporting in blindness prevalence surveys in low and middle income countries. PLoS One.
2017;12(5):e0176178-e.
232. Fuller T, Pearson M, Peters J, Anderson R. What affects authors’ and editors’ use of
reporting guidelines? findings from an online survey and qualitative interviews. PLoS One.
2015;10(4):e0121585.
233. Huynh N, Baumann A, Loeb M. Reporting quality of the 2014 Ebola outbreak in Africa:
a systematic analysis. PLoS One. 2019;14(6):e0218170-e.
234. Lo C, Mertz D, Loeb M. Assessing the reporting quality of influenza outbreaks in the
community. Influenza Other Respir Viruses. 2017;11(6):556-63.

125
Appendix
Appendix 1. Distribution of H-index in included papers
Few eligible papers had a H-index >80. Most eligible papers had a h-index between 10 to 40.
Appendix 2. Distribution of count of eligible criteria met in included papers
The number of fulfilled STROME-ID eligible criteria varied. Few papers completed >10 of all eligible STROME-ID criteria. Appendix 3. Distribution of proportion of all criteria met in included papers
Most papers reported a proportion of approximately 0.50 of all STROME-ID criteria, with few
papers completing a proportion of <0.2 or >0.70.