Embed Size (px)
Citation preview

Chemometrics- a personal view

Chemometrics is:
• a philosophical discipline within analytical chemistry
• a way to perceive nature (a way to think …)
• to think ‘phenomena’ instead of ‘details’
• finding and utilizing latent structures in ‘chaos’
• using latentics on chemical data
Latentics is:
The science of the hidden
Extraction of hidden phenomena from the apparent chaos

Classical wet-chemical analysis
many objects
few variables
data structure is ”vertical"
• Much labour pr. sample (extraction, masking, precipitation ...)• One expensive but selective signal pr. sample (interferences are removed)

Modern instrumental analysis
• Little work pr. sample• Many cheap, but in-selective signals pr. sample (interferences present)
few objects
many variables
data structure is ”horizontal"

many objects
few variablesBefore:
Classical statistics is based on a “vertical” data structure (e.g. 100 equations with 4 unknowns can easily be solved)
few objects
many variables
To day:
Chemometrics is especially developed to “horizontal" data structures(e.g. 4 equations with 100 unknowns can not be solved)
chemometrics is the art of solving 4 equations with 100 unknowns …

An well-known example of horizontal data
and how to make use of it …

21.7%
14.3%
16.1%
12.9%
18.9%
NIR-spectra laboratory
Calibration X-data <-> Y-datamodel
Prediction
15.8%
New X-data -> Y-datamodel
10 seconds 10 days
10.1 seconds
21.7%
14.3%
16.1%
12.9%
18.9%
NIR-spectra laboratory
X-data <-> Y-datamodel
15.8%
New X-data -> Y-datamodel
10 seconds 10 days
10.1 seconds
How:• by deduction• by induction

The deductive way …

non-selective data in
knowledgehypothesesassumptionstheoryingenuity
Law-based mathematical model
information out

The inductive way …

non-selective data in
information out
a ”black box" --->
Chemometrics

non-selective data in
information out
PLS
** *
*** *
ooo
oo oo o
** *
*** *
ooo
oo oo oChemometrics
WARNING
OK
benigncronicacutemalign
bilirubineglucose
patient-info
variable-info

non-selective data in
Chemometrics
informationknowledgehypotheses
induction
data
theory

InvasiveDestructiveSlowUnivariate
Data preparation!
Traditional data analysis is deductive:("hard" models)
set up a hypothesis about the relation between variables calculate the model parameters
kill the dragon cut it into pieces throw away the most of it assume a correlation between the leavings

RemoteNon-destructiveFastMultivariate
Chemometric data analysis is inductive:(“soft" models)
Analyse the data without assuming anything about correlations between variables
watch the dragon at distance observe what it does compare with experiences from other animals describe phenomena
Returning to the problem of
data structure

many objects
few variables
Classical statistics is based on a vertical data structure
few objects
many variables
Chemometrics is especially developed to horizontal data structures

n
p
n << p
X-datastatistics (MLR)
classicalchemometrics
a
nn>a
scores Y-data
horizontal data vertical data
the unsolvable problem!
Multivariate instrumental data (e.g. IR-spectra)
Reference data (fat, protein, etc.)
’Modern’ data
This simplifies to …

n
p
n << p
X-data Y-data
Multivariate instrumental data (e.g. IR-spectra)
Reference data (fat, protein, etc.)
chemometrics
explorative data analysis
information about hidden coherencies in data
outlier-detection
robust handling of interferences
…
’Modern’ data

Find a hidden phenomena in this picture!
The latent phenomena is “Age”
An example of multivariate data ...

Find the hidden phenomena in this “picture”!
Another example of multivariate data ...
Marks from primary school for students at an commercial school
Failed!
Passed!
By chemometrics (latentics), we transform the numbers into graphics (a picture) ... like musicians transforms notes to music

passed/failed not included as a variable!
A hidden phenomena (in the table) is ‘Passed’ (to the left) and ‘Failed’ (to the right)

Looking for reasons …These variables are positively correlated to ‘Passed’ … the group can be split into two phenomena
“Linguistic”
“Science”

So, that’s how it looks
“Linguistic”
“Science”

non-selective data in
LATENTICS
informationknowlegdegrounded theoryhypothesis
induction
By induction we state the hypothesis, that you can – roughly - divide students into two major groups: those having linguistic skills, and those having science skills

How does it work, then??

A key question: Is chaos always chaotic?Chaos-plot
Political subject
Opi
nio
n
Totally agree
Totally disagree
10 political parties are asked about their opinion on 25 political issues:

10 political parties are asked about their opinion on 25 political issues:
Kilde: Jyllandsposten

5 Helt enig4 Delvis enig3 Hverken enig eller uenig2 Delvis uenig1 Helt uenig
Spørgsmål Sp1 Sp2 Sp3 Sp4 Sp5 Sp6 Sp7 Sp8 Sp9 Sp10 Sp11 Sp12 Sp13 Sp14 Sp15 Sp16 Sp17 Sp18 Sp19 Sp20 Sp21 Sp22 Sp23 Sp24 Sp25A 3 1 1 1 3 1 4 4 3 5 1 1 3 5 1 1 5 3 4 1 5 3 1 3 5B 2 1 4 2 1 2 5 4 3 4 1 1 5 5 2 2 4 5 2 2 5 3 2 3 5C 5 5 1 2 1 4 5 3 1 5 1 1 4 5 4 5 3 5 5 5 2 5 5 4 5D 2 1 1 4 4 4 5 3 2 4 1 1 4 5 2 4 2 3 3 1 4 4 3 2 5F 3 1 1 1 2 1 1 5 4 5 2 3 1 5 1 2 5 2 4 1 4 5 2 4 5O 5 5 1 5 3 2 1 4 1 5 3 1 4 4 3 5 2 4 5 2 4 4 2 2 4V 5 3 1 5 1 3 5 3 1 5 1 1 5 5 3 5 4 5 4 4 5 4 1 4 3Q 2 1 3 4 1 4 1 4 2 5 1 2 4 5 3 4 2 3 4 4 4 4 5 3 4Z 5 5 5 5 1 4 2 1 2 2 4 1 5 2 5 5 1 5 5 5 2 5 5 4 5Ø 1 1 1 1 3 1 1 5 5 5 1 1 1 3 1 1 5 1 5 1 5 1 1 3 4P1 4 2 3 2 3 2 1 5 3 5 2 1 4 3 4 3 4 4 2 3 4 4 4 3 5P2 4 3 3 4 1 4 2 4 2 2 1 1 2 4 2 3 2 4 3 4 5 3 2 4 5P3 2 1 4 4 1 1 2 5 3 5 4 1 1 5 2 2 2 4 4 4 5 4 4 3 5P4 2 1 2 4 5 1 2 5 3 3 3 1 2 5 2 2 4 2 3 3 4 2 2 5 5
Political subject
Opi
nio
n
Totally agree
Totally disagree

Political subject
Opi
nio
n
Totally agree
Totally disagree
Plotting your answers (or the 2.5 million Danish voters) leads to even more CHAOS!
In Denmark, however, we only have 10 political parties because we only have ca. 10 different latent political structures in the Danish society
Some latent political structures have names (conservatism, liberalism, socialism, etc.) and come in different blends and flavours known as ‘party programs’

Chaos-plot
Political subject
Opi
nio
n
The party programme of the two largest parties
Totally agree
Totally disagree
This is the opinion of the Social Democratic Party
… and this is the opinion of the Liberal Party
What’s going on inside your head when you are voting?
Something like: “Calculate the correlation coefficient between mine and the parties profiles”
But what is a “Social Democrat”?OR: “How much does the parties – in my opinion - score?”

A plot of the correlation coefficients with A and V
“A” have a high score on itself
“V” have a high score on itself

This plot only takes two parties into account (what about the other parties??)
We actually use a more democratic method when we vote!
… taking all parties into account
Instead of using the two most powerful parties for comparison, let all parties nominate common candidates, i.e. ‘common party programmes’ which resembles most parties as much as possible.
These common candidates are what we call eigenvectors or loadings
… and can be calculated by e.g. Principal Component Analysis (PCA)
Let’s calculate these and plot correlations (which we call scores)

A plot of the correlation coefficients with p1 and p2

Summary
IF you can find some – for the individuals – common latent structures, e.g. conservatism, liberalism, socialism (or party programs)
THEN you can create an overview in the apparent ‘chaos’
Overview
That’s the principle of latentics, and thus chemometrics!
Chaos
latentics

Now to something (not completely) different …

Raw data (from a chemical reaction)
Raw data (from the composer)
Con
cen
tra
tion
(M
)
Time (seconds)

Con
cen
tra
tion
(M
)
Time (seconds)
Too complicated – let’s try something more simple …

Con
cen
tra
tion
(M
)
Time (seconds)
Too simple – let’s try something more musically …

let’s try without the melody …
Con
cen
tra
tion
(M
)
Time (seconds)

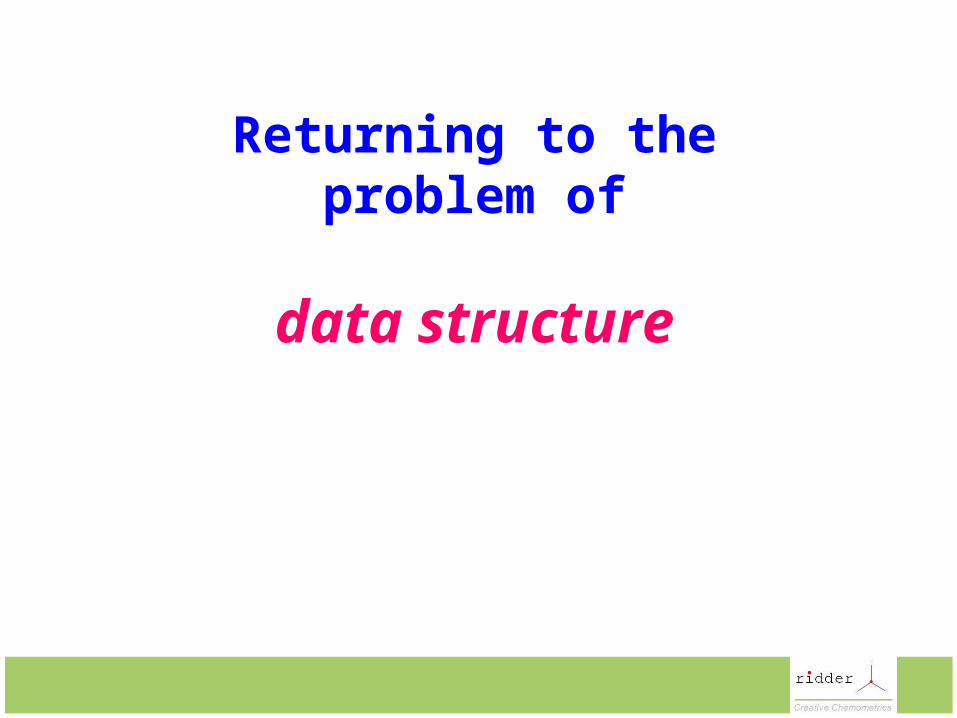
What is the score of the harmonies in this melody?
Using latentics on melodies
spectrum
loadings
C is used in 44% of the melodyG7 is used in 25% of the melodyF/Dm is used in 19% of the melody

C
G7FDmAmEmHm7b5D7
etc.
The principal harmonies or latent structures (loadings)arranged by importance ("orthogonal" harmonies)
Se den lille kattekilling
Jeg ved en lærkeredeJeg ved en lærkeredeSolen er så rød, morMester JakobHøjt på en grenOles nye autobilMæ, si'r det lille lamJuletræet med sin pyntTommelfinger, ...Nu lukker sig mit øjeDen lille Ole
Amount of principal harmoniesHow much scores each harmony?
C G7 F Dm Am Em . . . .
Can melodies be classified by their latent structure?

Where would a Turkish or Chinese song be in this plot?(belongs to other populations => 'outlier')
20 40 60 80 100
0
10
20
30
40
50
Jeg ved en lærkerede (bog)
Højt på en gren en krage
Stork, stork langeben
Mæ, bæ hvide lamMæ, si'r det lille lam
Se den lille kattekilling
Den lille Ole
Solen er så rød mor Jeg en gård jeg bygge vil
Oles nye autobil
Tommelfinger, tommelfinger
Mester Jakob
Nu lukker sig mit øje
Juletræet med sin pynt
Content of C (55% of variation)
Co
nte
nt
of
G7
(24%
of v
aria
tion)
Scores-plot(amount of PH1 vs. amount of PH2 = 79% of variation)
Jeg ved en lærkerede (CR) mean
Principal harmonies
Juletræet med sin pynt
Jeg ved en lærkerede (CR)Højt på en gren en krageStork, stork langebenMæ, bæ hvide lamMæ, si'r det lille lamSe den lille kattekillingDen lille OleSolen er så rød morJeg en gård jeg bygge vilOles nye autobilTommelfinger, tommelfingerMester JakobNu lukker sig mit øje
Jeg ved en lærkerede (bog)
meancumulated mean
...
...C1
50
55%55%
G72
31
24%79%
F3
6
8%87%
Dm4
0
4%91%
Am5
6
5%96%
Em6
4465396370564631506781753734
25203625254429162821
60
2926
130
1113
008684
1325
615
6570000
236000
130
6500508968008
15
00400000000000
0
0%96%

The optimal harmonies are latent (musical) structures in the melody
… like party programs are latent (political) structures in the society
… like loadings are latent (chemical) structures in NIR-spectra
The latent structures are common to all objects (melodies, persons, spectra)
Each object have different scores (or preferences) for the different latent structures
The latent structures have varying importance:
• Music: In the key of ‘C’ the sequence of importance is the harmonies C, G, F/Dm, Am, … (the circle of fifth)
• Politics: The sequence of importance is the largest political ism, the second largest political ism, etc.
• Chemometrics: The sequence of importance is the first principal component, the second principal component, etc.

Validation
… finding the optimal complexity

The optimal harmonies are latent (musical) structures in the melodies
In music you find the optimum by using your ears
In chemometrics you find the optimum by using e.g. cross validation
… beware of both under- and over-fit!
In politics you tune the optimum by changing the electoral threshold

A summary of chemometric data analysis
• listen to the melodies measure the spectra
• go to the piano go to the computer
• find the harmonies calculate loadings (PCA-model)
• count the harmonies calculate scores
• enjoy … ! make plots, extract information … !

Chemometrics does not form a contrast to classical statistics
On the contrary, chemometrics makes it possible to use classical statistical method on ‘modern’ data
This is achieved by the introduction and exploitation of the fundamental and natural concept of latent structures
... and as a by-product a world of information opens up!
Conclusion

Thank you for your attention!