Embed Size (px)
Citation preview

Chemistry M11 Laboratory Manual
Compiled by the Department ofChemistry at Moorpark College
Laboratory Experiments for General, Organic, and Biochemistry
Spring 2010 - Present
CoN N
N N
NH2
O
NH2O
NH2
OH2N
O
HNO
O
N
N
O
HO
OP
O O
CH2OH
The Vitamin B12 molecule shown is useful in the treatment of
pernicious anemia and other diseases. Enzymes derived from
vitamin B12 accelerate a large range of important reactions
including those involved in producing red blood cells.
CN

2
EXPERIMENT 1 ...................................................................................................................................... 3
SEPARATION OF COPPER(II) SULFATE FROM SAND ............................................................................................... 3
EXPERIMENT 2 ...................................................................................................................................... 6
MEASUREMENTS ............................................................................................................................................ 6
EXPERIMENT 3 .................................................................................................................................... 14
PROPERTIES OF SOLUTIONS ............................................................................................................................ 14
EXPERIMENT 4 .................................................................................................................................... 21
DOUBLE DISPLACEMENT REACTIONS ................................................................................................................ 21
EXPERIMENT 5 .................................................................................................................................... 26
SINGLE DISPLACEMENT REACTIONS ................................................................................................................. 26
EXPERIMENT 6 .................................................................................................................................... 30
PRECIPITATION OF STRONTIUM SULFATE .......................................................................................................... 30
EXPERIMENT 7 .................................................................................................................................... 34
IONIZATION AND THE NATURE OF ACIDS, BASES, AND SALTS ............................................................................... 34
EXPERIMENT 8 .................................................................................................................................... 44
ACID/BASE TITRATIONS ................................................................................................................................ 44
EXPERIMENT 9 .................................................................................................................................... 50
STRUCTURE IN INORGANIC AND ORGANIC COMPOUNDS ..................................................................................... 50
EXPERIMENT 10 ................................................................................................................................... 60
STEREOCHEMISTRY AND USE OF MOLECULAR MODELS ........................................................................................ 60
EXPERIMENT 11 ................................................................................................................................... 66
PAPER CHROMATOGRAPHY ............................................................................................................................ 66
EXPERIMENT 14 ................................................................................................................................... 82
SYNTHESIS AND CHARACTERIZATION OF ACETYLSALICYLIC ACID ............................................................................ 82
EXPERIMENT 18 ................................................................................................................................. 104
SPECTROPHOTOMETRIC ANALYSIS OF BLOOD GLUCOSE ..................................................................................... 104

EXPERIMENT 1
Separation of Copper(II) Sulfate from Sand Discussion Mixtures are a combination of substances in which the components keep their individual characteristics. Mixtures have variable proportions and can be separated by simple physical means. The mixture’s components have different physical properties like melting point, boiling point, or solubility that allow us to selectively remove individual components from the mixture. Once separated, the percentage of each component in the original mixture can be calculated. In this experiment, you will separate a mixture of copper(II) sulfate and sand using the physical property of solubility. You will learn about certain methods of separation that include decantation, filtration, and evaporation. Finally, the Law of Conservation of Mass will be applied to check the validity of your final calculations. Procedure 1. Weigh about 4 –5 grams of the CuSO4/sand mixture in a 100 mL beaker on the
laboratory balance by taring (your instructor will explain and demonstrate). 2. Add 10-15 mL of D.I. water to the beaker, and swirl. Next, weigh and record the
weight of a piece of filter paper AND an evaporating dish separately. Then assemble the filter apparatus as demonstrated by the instructor, filter the mixture, and collect the filtrate (liquid) onto the evaporating dish. Use your wash bottle (filled with D.I. water) to transfer all the undissolved solid from the beaker to the filter paper. After all the liquid has drained through the filter, wash the filter with small portions of D.I. water from the wash bottle until the washings are colorless. Again, make sure you collect ALL the filtrate and washings in the evaporating dish. Try to use small amounts of water. You will be evaporating the liquid; the more water you add, the longer it will take!
3. Prepare a steam bath by placing a 250 mL beaker, 2/3 full of water with 4 – 5 boiling
chips, on a wire screen on a ring stand. Place the evaporating dish carefully on the beaker and heat the water to boiling. Heat the steam bath until the filtrate has completely evaporated. Do NOT let the steam bath boil to dryness; you may have to refill the water in the beaker occasionally. If the beaker goes dry, it must be cooled before adding water to prevent the beaker from cracking!
4. Open the filter paper onto a large watch glass. Dry the solid on the filter paper in the
drying oven for 20 minutes. 5. Once your equipment has cooled, weigh both the evaporating dish and filter paper
separately. Compute the weight of the CuSO4 sample and sand by difference. Calculate the weight percent CuSO4 and sand in the sample.
4
Name: _________________________________ Data and Calculations for Experiment 1 Mass of CuSO4/sand mixture _______________ Mass of empty evaporating dish _______________ Mass of evaporating dish and dry CuSO4 _______________ Mass of CuSO4 _______________ Mass of empty filter paper _______________ Mass of filter paper and sand _______________ Mass of sand _______________ Total mass of products _______________ Calculated total percent yield _______________ Percent by mass of CuSO4: Show Calculation _______________ Percent by mass of sand: Show Calculation _______________
5
Questions 1. Many students do NOT recover 100% of the original mixture. Describe at least TWO possible problems that could cause LESS than 100% recovery of the mixture. 2. A student obtained the following data: Mass of beaker 25.87 g Mass of beaker with mixture sample 28.12 g Mass of evaporating dish 146.36 g Mass of evaporating dish with dried salt 147.10 g Mass of beaker with dried sand ??? However, this student spills her sand sample out of the evaporating dish before weighing it. If the student believes in the Law of Conservation of Mass, what should have been the weight of the beaker with the dried sand in it? Show all your work. 3. A student receives a sample of a mixture with three components: (1) solid iodine that is first removed from the mixture by evaporation, (2) solid salt that is dissolved to separate it from the third component, and (3) solid sand. The salt and sand are dried and weighed, but the iodine escapes as a gas and is not recovered. The student starts with 4.25 g of the mixture and recovers 1.16 g of salt and 2.40 g of sand. What is the percent of each component in the original mixture? Show all your work.

6
EXPERIMENT 2
Measurements Discussion Experimental sciences, such as Chemistry, depend on making and using measurements properly. The SI system of units (sometimes called the metric system) is used almost exclusively. This system is very similar to our monetary system: $1 = 10 dimes = 100 cents = 1000 mils. In chemistry, the basic units of length, mass, and volume are the meter, gram, and liter, respectively. They all are divided the same way. For example, 1 meter = 10 decimeters = 100 centimeters = 1000 millimeters. The kilo is also commonly used; it equals 1000 of the basic unit. For example, 1 kilogram = 1000 grams. Often you will be asked to compare your experimental or calculated value to an “accepted” or theoretical value. The closer you are to the accepted value, the greater the accuracy of your experiment. Percent error is a common method used for calculating accuracy: % error = 100 x difference/accepted value. The accepted value could be located in a reference such as the Handbook of Chemistry and Physics. The difference between your value and the accepted value is then divided by the accepted value and multiplied by 100 to calculate the percent error. The smaller the percent error, the more accurate your experimental value. In science, an experimenter is allowed to estimate one more digit past what can be measured exactly on an instrument. For example, if the smallest lines on a ruler are centimeters, and an object’s length falls between 2 lines, more precision is gained by estimating between the lines. Therefore, the length of an object might be reported as 25.5 cm. The reported numbers are called “significant figures”, and the more precise the instrument, the more significant figures it can produce. A calculation cannot be any more precise than the least precise measurement. For example, density is calculated by dividing the mass of an object by its volume. Therefore, the density of an object might be 23.57 g/ 4.2 mL = 5.61190476 g/mL. But, the least precise measurement (the volume) only has a precision of 2 significant figures. Therefore, the density must be reported as 5.6 g/mL. Procedure Record your data on the report form as you complete the measurements.
A. Temperature 5 beakers with thermometers have been set up for you: (1) room temperature water, (2) boiling water, (3) a mixture of ice and water, (4) a stirred mixture of ice and water, and (5) a stirred mixture of ice, water and salt. Observe and record all temperatures to the nearest 0.1 oC.

7
B. Mass When using any measuring device, never round off your raw data. If the balance fluctuates on the last digit, estimate that value. Weigh a (1) 100-mL beaker, (2) a 250-mL Erlenmeyer flask, (3) a plastic empty weighing boat, and (4) and then add approximately 2 grams of sodium chloride to the weighing boat. Calculate the mass of the sodium chloride added.
C. Length Using a metric ruler, measure the following in centimeters, remembering to estimate one extra digit: (1) the length of the double arrow on the report sheet, (2) the length of the external height of a 250-mL beaker, and (3) the length of a medium sized test tube.
D. Volume
The graduated cylinder is the most accurate equipment in your locker for measuring volume and can give a precision of 0.1 mL. Water is attracted to the glass sides of the cylinder, causing a curved effect called the meniscus. The cylinder should be read at eye level using the bottom of the meniscus. In theory, a 250-mL Erlenmeyer flask with a marking for 200 mL should have a volume of 200 mL at that mark! However the problem is that volumes marked on beakers and flasks are only approximate values. Therefore, fill a 250-mL Erlenmeyer flask to the 200 mL mark with water, transfer this volume of water to a 250-mL graduated cylinder, and determine the exact volume.
It is often convenient to estimate volumes of 5 and 10 mL simply by observing the height of a liquid in a test tube. Use your graduated cylinder to place 5 and 10 mL of water in a medium-sized test tube and measure the heights in cm.
E. Density Density measures the “compactness” of material. For example, lead has a high density, and Styrofoam has a low density. Mathematically, this compactness is expressed as mass per unit volume. In chemistry, we use grams and milliliters: D = g/mL. Density is an intrinsic value; it does not depend on the amount of sample taken. We will take advantage of this by measuring the density of various sample sizes and averaging their densities: 1. Obtain 5 pieces of the same object and record its name on the data sheet. 2. Keep track of the 5 objects by placing them in numbered test tubes. 3. Weigh each object and record the values on the data sheet. 4. Choose the appropriate size graduated cylinder (smallest size that will hold the object plus enough water). Add enough water to the graduated cylinder to

8
be able to cover your largest sample. Record the volume to the highest precision (0.1 mL or better). 5. Carefully add the sample to the graduated cylinder. There are two things to watch out for: breaking the cylinder and splashing water out. Tilting the cylinder and gently sliding the object in minimize both of these risks. Record the new volume. 6. Repeat with each sample piece. If the sample pieces are small, the pieces can remain in the graduated cylinder until all sample pieces have been added to the cylinder. 7. Determine the density of each piece and the average density. 8. Graph the cumulative data. Use the largest values of mass and volume to determine your x and y scales. Choose the scale to use most of the available graph. Place a data point at the origin (0.00 grams and 0.00 mL), then place all your other cumulative data points. 9. Using a straight edge, draw the best-fit line through the data points (through the center of the points, include the origin on the line). 10. Choose a point on the line near the high end of the line that passes through the graph’s cross hairs. The slope is the mass of this point divided by its volume. The slope of this graph is another way of determining the average density of the data points.
9
Name: _________________________________ Data and Calculations for Experiment 2 Measurements
A. Temperature 1. Water at room temperature _______________ oC 2. Boiling point _______________ oC 3. Ice water
Unstirred _______________ oC Stirred _______________ oC 4. Ice water with salt added _______________ oC
B. Mass 1. 100 mL beaker ________________ g 2. 250 mL Erlenmeyer flask ________________ g 3. Weighing boat ________________ g 4. Mass of weighing boat + sodium chloride ________________ g Mass of sodium chloride (show calculation setup) ________________ g
C. Length 1. Length of _______________ cm 2. Height of 250 mL beaker _______________ cm 3. Length of test tube _______________ cm
D. Volume 1. 200 mL mark (from Erlenmeyer flask) water transfer to graduated cylinder ______________ mL 2. Height of 5.0 mL of water in test tube ______________ cm 3. Height of 10.0 mL of water in test tube ______________ cm

10
E. Data Sheet for Density of an Object
Name of Object _________________
Sample
#
Object
Mass
(g)
Initial
mL
H2O
mL
H2O
w/
object
Volume
object
(mL)
Density
(g/mL)
Cumulative
Sample #s
Cumulative
object
mass (g)
(y-axis)
Cumulative
volume
(mL)
(x-axis)
1 1
2 1+2
3 1+2+3
4 1+2+3+4
5 1+2+3+4+5
Average Density = __________

Graph of Cumulative Mass versus Cumulative Volume
Average density of sample from calculated data: _________________________
Average density from graph: _________________________

13
Questions
1. Which would work better in this experiment as an unknown solid whose density is to be determined, wood chips or small quartz rocks? Explain your choice.
2. Why is it best to use a smaller graduated cylinder as opposed to a larger graduated cylinder for this experiment?
3. How well does the average density from the table and density from the slope of the graph compare? Which value is closer to the accepted density of your metal? (Refer to the Handbook of Chemistry and Physics). Calculate the percent error between your better value and the handbook value.
4. What is the density of a 9.343 gram piece of metal that causes the level of water in a graduated cylinder to rise from 5.1 to 8.1 mL when the metal is emerged in the water? Consider significant figures when doing the calculation.
14
EXPERIMENT 3
Properties of Solutions Discussion In today’s lab, you’ll investigate the qualitative nature of solutions. The first step is learning some common terms. Solute refers to a compound that dissolves in a solvent to form a solution. A solution can have one or more solutes, but only one solvent. The solvent is the compound that is predominant in the solution. A solute is said to be dissolved when it forms a clear, but not necessarily colorless, liquid. Thus, sugar dissolves in water, but fine sand and dust form suspensions which are not true solutions. Solvents can be sorted by their polarity. Water is very polar, while benzene, decane, and gasoline are considered non-polar. The term organic solvent refers to most solvents other than water that are carbon-containing. Organic solvents can be either polar or non-polar, depending upon their structure. For example, methanol and ethanol are polar organic solvents, while ether and acetone are less polar, and decane and benzene are considered non-polar organic solvents. Solubility is a measure of how much of a compound can eventually dissolve in a solvent. If a solid does not dissolve, the compound is said to be insoluble. It can also be described as slightly soluble, moderately soluble, or very soluble. If the compound is a liquid (not a solid) it can dissolve and is described as miscible, or instead forms two layers and is called immiscible. Ethanol and water are miscible, while oil and water are immiscible. Concentration refers to the amount of solute relative to the total volume of solution. A dilute solution has little solute per 100 grams of solution, while a concentrated solution has more solute. A solution is considered saturated when no more solute can dissolve in that solution without it precipitating thereafter. A supersaturated solution is a solution that holds more solute than it normally can hold at that temperature. Given time, some solute will precipitate out of solution. In other words, the solution is unstable over time. Concentration can be measured using several terms. “Proof” is used to measure alcohol content in liquor and beer. Chemists tend to use mass percent and molarity which are defined below. Remember that mass percentages range from 0 to 100%, and molarities are generally less than 18 M. Very few compounds can form solutions with higher concentrations.
Mass percent of X =mass of X
mass of X + mass of solventx 100
=moles of X
Liter of total solutionMolarity of X

15
Procedure A. Concentration of a saturated solution. In this section, you’ll figure out how many grams of potassium chloride per mL of solution were present in a pre-made saturated solution of KCl.
1. Weigh a clean, dry evaporating dish. In this dish, add 6.0 mL of solution and place the dish in a 250-mL beaker of boiling water. Evaporate the solution until a white solid is present in the dish. Don’t let the boiling water bath go dry. This step will take approximately half an hour.
2. Remove the dish from the boiling water with tongs. Place the dish on a wire mesh and gently heat with a Bunsen burner. If you heat too strongly, the solid may “pop” and you will lose some. 3. Let the dish cool until it can be touched safely. Weigh the flask to find out how many grams of potassium chloride are present. Cleanup: Wash the solid down the drain. B. Relative Solubility of a Solute In this section, you will determine whether iodine, a reddish solid, dissolves better in water or decane. 1. Take a test tube and add about 5 mL of water and 2 mL of decane. Stopper the test tube and give it a gentle shake. Note which layer was on top. 2. To this tube, add 5 mL of saturated iodine-water solution. Gently shake again and see which layer has more color. Cleanup: Empty the test tube into the waste labeled “Decane Waste”. C. Miscibility of Liquids In this section, you will find out what liquids are miscible with water. Take three dry test tubes and add the following pair of liquids. Stopper the test tubes and gently shake them. Are there two layers or one?
1. 1 mL of kerosene and 1 mL of isopropyl alcohol
2. 1 mL of kerosene and 1 mL of water 3. 1 mL of isopropyl alcohol and 1 mL of water Dispose of the first two kerosene mixtures in the “Kerosene Waste” container.
16
D. Effect of Particle Size on Rate of Dissolution 1. Fill a test tube with about 0.5 cm of fine crystals of sodium chloride. Fill a second test tube with about 0.5 cm of coarse crystals of sodium chloride. Add 10 mL of water to each tube and shake both tubes an equal number of times. Shake both tubes equally. Time how long it takes to dissolve each. These solutions can be disposed of down the sink. E. Effect of Temperature on Dissolution
1. Weigh out two 0.5 g samples of fine sodium chloride crystals. Take two 250-mL beakers and add 50 mL of water to them. Heat one of the beakers to boiling, then let it cool for one minute.
2. Add the salt samples to each beaker and time how long it takes to dissolve each. 3. As soon as the salt dissolves, gently swirl the hot water and observe the denser salt layer in the bottom of the flask. Repeat the process with the cold water. These solutions can be disposed of down the sink. F. Solubility versus Temperature; Saturated and Unsaturated Solutions 1. Weigh out 1.0 g of NaCl and 1.0 g of NH4Cl and place them in separate, labeled test tubes and add 5 mL of water. Stopper the test tubes and shake the tubes until the salts dissolve. 2. Add another 1.4 g of NaCl to the NaCl solution, and another 1.4 g of NH4Cl to the NH4Cl solution. Stopper and shake the tubes for 3 minutes. Note whether or not the salts dissolved. 3. Remove the stoppers and place both tubes in a beaker of boiling water, gently shaking occasionally, and note the results after 5 minutes. 4. Remove the tubes and cool with running tap water for one minute and record your observations. Let the solutions stand for a few minutes and record your observations. Pour the solutions down the drain.

17
G. Ionic Reactions in Solution 1. Place a small lump of pea-sized quantities of a) barium chloride, b) sodium sulfate, c) sodium chloride, and d) barium sulfate into four separate labeled test tubes. 2. Add 5 mL of water, stopper the tubes, and shake them. Which sample(s) do(es) not dissolve? 3. Mix the barium chloride and sodium sulfate together and note the results. 4. Write an equation that describes the results of these test tubes being mixed. Dispose of all solutions in the “Barium waste” container.

18
Name: _________________________________ Data and Calculations for Experiment 3 A. Concentration of a Saturated Solution (record all masses as x.xxx g) 1. a) Mass of evaporating dish ____________ b) Mass of evap. dish and potassium chloride solution ____________ c) Mass of evap. dish and residue ____________ 2. Calculate: (show setups) a) Mass of potassium chloride solution ____________ b) Mass of residue ____________ c) Mass of water in potassium chloride solution ____________ d) Mass percent of potassium chloride in the solution ____________ e) Grams of potassium chloride per 100 g of water in the solution ____________ B. Relative Solubility of a Solute in Two Solvents 1. a) Which liquid is denser, decane or water? ____________ b) How did you decide which layer was water? 2. What is the color of iodine in water? ____________ What is the color of iodine in decane? ____________ 3. Which solvent dissolves more iodine? How did you decide this?

19
C. Miscibility of Liquids 1. Which liquids were miscible with each other? 2. Which liquids were immiscible with each other? D. Particle Size and Dissolution Rates 1. How long did it take the fine salt crystals to dissolve? 2. How long did it take the coarse salt crystals to dissolve? E. Temperature and Dissolution Rates 1. How long did it take the salt crystals to dissolve in hot water? 2. How long did it take the salt crystals to dissolve in cold water? F. Temperature and Solubility 1. Was the solution with 1.0 g of NaCl in 5.0 mL water saturated at room temperature? 2. Was the solution with 1.0 g of NH4Cl in 5.0 mL water saturated at room temperature? 3. Was the solution with 2.4 g of NaCl in 5.0 mL water saturated at room temperature?

20
4. Was the solution with 2.4 g of NH4Cl in 5.0 mL water saturated at room temperature? 5. Which salt was least soluble at higher temperatures? 6. At the higher temperatures, was the NaCl solution saturated? 7. At the higher temperatures, was the NH4Cl solution saturated? 8. What happened to the NaCl solution when it was cooled back to room temperature? 9. What happened to the NH4Cl solution when it was cooled back to room temperature? G. Ionic Reactions in Solution 1. Write the formulas for the following: barium sulfate _________ barium chloride _________ sodium sulfate _________ sodium chloride _________ 2. Write the equation that shows the reaction of barium chloride and sodium sulfate. Use state indicators such as (aq) and (s) for all compounds. 3. Which compound is the white precipitate? How do you know this?

21
EXPERIMENT 4
Double Displacement Reactions Discussion In this experiment, double displacement reactions will be studied, where two water solutions, each containing positive and negative ions, will be combined. Consider the generalized reaction shown below:
AB + CD → AD + CB
where AB exists as A+ and B- ions in solution, and CD exists as C+ and D- ions in solution. Each of the positive ions can combine with the negative ion of the other compound as shown above. But the question then becomes: has there been a reaction? To answer this question, we look at the products. Is either one an insoluble compound giving a precipitate (information available from a solubility table), is either one a gas or producer of a gas, or would a temperature change be predicted? Has a weak electrolyte such as a weak acid been formed? If no to all of these, then no reaction occurs; this is simply a mixture. If yes to any one or more of these, then a reaction occurs. Procedure Each part of the experiment below consists of mixing equal volumes of two solutions from dropper bottles in a 24 well-plate. Place 5 drops of each indicated chemical in the well-plate. Write your observations on the report sheet. Note the formation of any precipitate or gas. If neither results, test the well-plate with a thermometer for any temperature change. If no change is noted, write NR (No Reaction) for the mixture. Note: NH3(aq) = NH4OH(aq) 1. Mix 5 drops of 0.1 M NaCl(aq) with 5 drops of 0.1 M KNO3(aq). 2. Mix 5 drops of 0.1 M NaCl(aq) with 5 drops of 0.1 M AgNO3(aq). 3. Mix 5 drops of 10% NaOH(aq) with 5 drops of dilute 6 M HCl(aq). 4. Mix 5 drops of 0.1 M BaCl2(aq) with 5 drops of dilute 3 M H2SO4(aq). 5. Mix 5 drops of dil. 6 M NH3(aq) with 5 drops of dilute 3 M H2SO4(aq). 6. Mix 5 drops of 0.1 M CuSO4(aq) with 5 drops of 0.1 M Zn(NO3)2(aq). 7. Mix 5 drops of 0.1 M Na2CO3(aq) with 5 drops of 0.1 M CaCl2(aq). 8. Mix 5 drops of 0.1 M CuSO4(aq) with 5 drops of 0.1 M NH4Cl(aq). 9. Mix 5 drops of 10% NaOH(aq) with 5 drops of dilute 6 M HNO3(aq). Dispose of all solutions in the appropriate WASTE CONTAINER in the hood.
22
Name: _________________________________ Data for Experiment 4 Record your observations for each combination below. If a reaction occurs, write balanced MOLECULAR and NET-IONIC equations. If no reaction occurs, write NR. Make sure to include the physical states of all the products. 1. NaCl(aq) and KNO3(aq) Observations: Molecular: Net-Ionic: 2. NaCl(aq) and AgNO3(aq) Observations: Molecular: Net-Ionic: 3. NaOH(aq) and HCl(aq) Observations: Molecular: Net-Ionic:

23
4. BaCl2(aq) and H2SO4(aq) Observations: Molecular: Net-Ionic: 5. NH4OH(aq) and H2SO4(aq) Observations: Molecular: Net-Ionic: 6. CuSO4(aq) and Zn(NO3)2(aq) Observations: Molecular: Net-Ionic: 7. Na2CO3(aq) and CaCl2(aq) Observations: Molecular: Net-Ionic:
24
8. CuSO4(aq) and NH4Cl(aq) Observations: Molecular: Net-Ionic: 9. NaOH(aq) and HNO3(aq) Observations: Molecular: Net-Ionic: Questions 1. For each of the reactions listed below, write balanced molecular and net-ionic equations. If no reaction occurs, write NR. Assume all reactants are aqueous unless otherwise noted. Include all physical states.
A. Lead(II) nitrate and magnesium sulfate solutions are combined. Molecular: Net-Ionic:
B. Zinc chloride solution is poured into a solution of ammonium carbonate. Molecular: Net-Ionic:
25
C. Magnesium chloride solution is mixed with nickel(II) nitrate solution. Molecular: Net-Ionic:
D. Cobalt(II) sulfate and lithium sulfide solutions are combined. Molecular: Net-Ionic:
E. Sodium hydroxide solution is poured into a solution of cobalt(II) chloride. Molecular: Net-Ionic:
F. Solid zinc bromide is mixed with a solution of potassium phosphate. Molecular: Net-Ionic:
G. Solutions of ammonium sulfate and sodium chloride are combined. Molecular: Net-Ionic:
26
EXPERIMENT 5
Single Displacement Reactions Discussion The chemical reactivity of an element is related to its tendency to lose or gain electrons. In theory, it is possible to arrange nearly all the elements into a single series in order of their reactivities. A series of this kind indicates which free elements are capable of displacing other elements from their compounds, known as the activity series. To illustrate the preparation of such a list, we will examine certain single displacement reactions, symbolized generically below:
A + BC → B + AC where metal (A) comes into contact with a solution of a metal salt, acid, or water (BC). Metal (B) and metal salt (AC) are formed if A is the more active metal. If metal B is more active than element A, no reaction occurs. Procedure Obtain a 24 well-plate and place it on a sheet of white paper. Fill wells 1 to 6 with the following solutions (each well should be approximately ½ full of solution). Well 1: Silver nitrate, AgNO3 Well 2: Copper(II) nitrate, Cu(NO3)2 Well 3: Lead(II) nitrate, Pb(NO3)2 Well 4: Magnesium sulfate, MgSO4 Well 5: 3 M sulfuric acid, H2SO4 Well 6: 3 M sulfuric acid, H2SO4 Clean the metal pieces with fine sandpaper to expose fresh metal surfaces. Place copper in well 1, lead in well 2, zinc in both wells 3 and 4, copper in well 5, and another piece of zinc in well 6. Observe the contents of each carefully and record any evidence of a chemical reaction. Some of these reactions may be slow or no reaction may occur. Take your time. Once the experiment is completed, remove the metal strips with your forceps and place them in the appropriate waste boat located along the lab bench top. DO NOT allow the metal strips to go into the sink. Then pour the solutions from the well plate into the appropriate waste containers in the hood. DO NOT pour the solutions down the drain as they contain heavy metals that can be toxic.
27
Name: _________________________________ Data for Experiment 5 Record your observations for each combination below. If a reaction occurs, write balanced MOLECULAR and NET-IONIC equations. If no reaction occurs, write NR. Make sure to include the physical states of all the products. 1. Cu(s) and AgNO3(aq) Observations: Molecular: Net-Ionic: 2. Pb(s) and Cu(NO3)2(aq) Observations: Molecular: Net-Ionic: 3. Zn(s) and Pb(NO3)2(aq) Observations: Molecular: Net-Ionic: 4. Zn(s) and MgSO4(aq) Observations: Molecular: Net-Ionic:

28
5. Cu(s) and H2SO4(aq) Observations: Molecular: Net-Ionic: 6. Zn(s) and H2SO4(aq) Observations: Molecular: Net-Ionic: Questions 1. Complete the following table by writing the symbols of the two elements whose reactivities are being compared in each test:
Well # 1 2 3 4 5 6 Greater Activity
Lesser Activity
2. Based upon the comparisons in the table above, draw further conclusions by:
A. arranging Pb, Mg, and Zn in order of decreasing activity (most active first). _________________ > _________________ > _________________
B. arranging Cu, Ag, and Zn in order of decreasing activity (most active first). _________________ > _________________ > _________________
C. arranging Mg, H, and Ag in order of decreasing activity (most active first). _________________ > _________________ > _________________

29
3. Now arrange the five metals from Question #2 above in order of decreasing activity. Explain why the position of hydrogen (H2) cannot be exactly assigned.
___________ > ___________ > ___________ > ___________ > ___________ 4. What additional test(s) would be required to determine the exact position of hydrogen in the activity series of elements in this study? 5. Would silver react with dilute hydrochloric acid? Briefly explain why or why not. 6. Would magnesium react with dilute sulfuric acid? Briefly explain why or why not.

30
EXPERIMENT 6
Precipitation of Strontium Sulfate In this experiment, you will study a precipitation reaction between sodium sulfate and strontium chloride. You will collect, dry, and weigh the precipitate and compare this experimental yield to the theoretical yield. Procedure
Weigh a clean, dry, 100-mL beaker. Add about 0.25 g (0.350 g max!) of solid sodium sulfate to the beaker and weigh it again. Dissolve the sodium sulfate in about 20 mL of D.I. water. Add 5 mL of 0.5 M strontium chloride solution and heat for fifteen minutes. Try to keep the mixture from boiling.
After the heating period has passed for the mixture, set it aside so as to return to room
temperature, and then cool it further by putting the beaker in a cold water bath. Your precipitate should settle to the bottom, leaving a relatively clear solution above it. Obtain a piece of filter paper and weigh it on the analytical balance.
Set up a vacuum filtration apparatus with a Büchner funnel and your weighed filter
paper (your instructor will show you how). Using a stirring rod to guide the stream of liquid, pour the contents of the beaker into the Büchner funnel. Use your wash bottle (filled with D.I. water) to rinse any solid out of the beaker and into the filter. Make sure no precipitate remains in the beaker or on the stirring rod. Fill the beaker with 15 mL of D.I. water, swirl it around, and then pour it into the filter. Repeat the washing process, and then draw air through the funnel for a few minutes to help dry the crystals.
Turn off the vacuum, carefully remove the filter paper containing your precipitate with a
spatula, and place it over a watch glass. Fill a 100-mL beaker half-way with water, place the watch glass with filter paper over the beaker, and heat to boil for twenty minutes to dry the precipitate (alternatively, you can place the watch glass with filter paper in a drying oven at 130 °C for twenty minutes).
Allow to cool, then determine the mass of your precipitate. Heat for another five
minutes, cool, and reweigh. The two weights should agree within +0.05 g or a third heating should be done.
31
Name: _________________________________ Data and Calculations for Experiment 6 1. Weight of empty beaker ________________
2. Weight of beaker and sodium sulfate ________________
3. Weight of sodium sulfate
Show Calculation ________________
4. Moles of sodium sulfate
Show Calculation ________________
5. Moles of strontium chloride
moles SrCl2 = (5 mL)(10-3/m)(0.5 M)
Show Calculation ________________
6. Write a balanced MOLECULAR equation for the reaction:
7. Write a balanced NET-IONIC equation for the reaction:
8. Weight of empty filter paper ________________
9. Weight of filter paper and dried precipitate (first time) ________________
Weight of filter paper and dried precipitate (second time) ________________
Weight of filter paper and dried precipitate (third time) ________________
10. Weight of precipitate
Show Calculation ________________

32
11. Determine the theoretical yield (in grams) of strontium sulfate. What is your limiting reactant and excess reactant?
Limiting Reactant: ________________ Excess Reactant: ________________ Show Calculation (theoretical product yield) ________________ 12. Determine the percentage yield of your reaction. Show Calculation ________________ 13. What would have resulted from using half as much SrCl2(aq)? Show Calculation ________________ 14. What would have resulted from using twice as much SrCl2(aq)? Show Calculation ________________
33
15. Briefly describe how you could have improved your percentage yield in this experiment.
16. In your own words, write a cohesive, well-written summary of the background
material and underlying chemical principles pertinent to this experiment. If additional space is needed, please use the back of this page. (For additional guidelines on writing this introduction, please refer to the Moorpark College Chemistry Department Laboratory Report Rubric found in the lab manual and department website.)
34
EXPERIMENT 7
Ionization and the Nature of Acids, Bases, and Salts Discussion
Compounds were defined by Sven Arrhenius to be acids if they release H+ ions in solution when dissolved. This modern definition replaced older definitions based on taste (i.e acids tend to be sour tasting) or if they changed litmus paper’s color. Bases (which tend to taste bitter) were defined as compounds that give up OH- (hydroxide) ions in water. This definition was limited to compounds in water and gives way to Brnsted-Lowry acid-base theory. Brnsted-Lowry acid-base theory keeps the definition of an acid as something that donates an H+ ion and defines bases as anything that accepts the H+ ion. Acids become proton donors; bases become proton acceptors. In any acid-base equation, there will be one acid and one base on each side of the equation. Which compound is an acid depends on whether that compound is donating or accepting a proton.
NH3 + H2O → NH4+ + OH-
Base Acid Conj. Acid Conj. Base
HCl + H2O → Cl- + H3O+ Acid Base Conj. Base Conj. Acid
Water can function as both an acid and a base, depending on the other reagents! HCl(aq) Hydrochloric acid H2SO4 Sulfuric acid HBr(aq) Hydrobromic acid HC2H3O2 Acetic acid HI(aq) Hydroiodic acid H2CO3 Carbonic acid H3PO4 Phosphoric acid HNO3 Nitric acid
Many common strong bases contain hydroxides (OH-) and a metal. NaOH Sodium hydroxide KOH Potassium hydroxide Ca(OH)2 Calcium hydroxide Mg(OH)2 Magnesium hydroxide NH4OH Ammonium hydroxide (best written as NH3
.H2O) Solutions that contain bases are called alkali or alkaline, from an Arabic word for “ashes”. Campfire ashes (“bitter ashes”) contain hydroxides and carbonates of potassium and sodium, which form basic or alkaline solutions. Compounds from plants that dissolve in water to form alkaline solutions are called alkaloids. A common example of a bitter-tasting alkaloid is caffeine.
35
The term pH is used to measure the concentration of an acid in water. Thus, it is important to remember that one acid can produce a range of pH values, depending upon the amount of acid relative to the volume of solution. pH is defined by the equation pH = -log [H+]. Therefore, a solution of 1.0 M HCl will produce 1.0 M H+ ions, assuming the HCl breaks up entirely. Since log [1.0] = 0, the pH of this solution is 0. The pH of pure water will be 7.0, while the pH of a very basic solution can be above 14.
pH > 7 basic solution pH = 7 neutral solutionpH < 7 acidic solutions
When acids react with bases, the H+ from the acid and the OH- from the bases “cancel” each other and form water molecules (“HOH”). The anions of the acid and the cations from the base combine to form ionic compounds or salts. For example, consider the reaction of sulfuric acid with sodium hydroxide:
H2SO4(aq) + 2NaOH(aq) → Na2SO4(aq) + 2H2O(l)
Reactions of Oxides with Water The oxides of elements often react with water to form new compounds. Depending upon which family the element is in, the new compound may be acidic or basic. For example, sulfur can be oxidized to form sulfur trioxide, which reacts with water to make sulfuric acid. Consider the following balanced equations:
S + O2 → SO2
2SO2 + O2 → 2SO3
SO3 + H2O → H2SO4 Carbon dioxide reacts with water to form carbonic acid as follows:
CO2 + H2O → H2CO3 The metal oxides react with water to form basic compounds. Calcium oxide reacts with water to form calcium hydroxide, while magnesium oxide reacts with water to form magnesium hydroxide:
CaO + H2O → Ca(OH)2
MgO + H2O → Mg(OH)2
36
Electrolytes Surprisingly, pure distilled water does not conduct electricity. In order for a charge to pass through water, it needs to be carried by positive and negative charges. The more charges, the more current can pass. If the charges cannot move, as in solid salts with no water present, then electricity cannot be conducted. Compounds can be divided into strong electrolytes, weak electrolytes, and non-electrolytes depending upon how well they conduct electricity when dissolved in solution. Remember that compounds that don’t dissolve in the solvent shouldn’t be called electrolytes at all. For example, iron bars, wood, or plastics are not electrolytes regardless of whether they conduct electricity or not. In a strong electrolyte, the compound breaks up into cations or anions in a process called “dissociation”. In a weak electrolyte, some of the compound dissociates into ions, even though the entire compound dissolves. In non-electrolytes, the compound dissolves but does not break up at all. Procedure A. Electrolytes In this part of the experiment, your instructor will demonstrate the conductivity of various solutions and reactions. B. Investigating Acids 1. Reactions of Acids with Metals a. Take four separate test tubes and place 5 mL of 6 M HCl in tube #1, 3 M H2SO4 in tube #2, 6 M HNO3 in tube #3, and 6 M acetic acid in tube #4. b. Put roughly a 2 cm strip of magnesium metal into each tube. Record the results. c. As the metal is still bubbling, place a glowing piece of wood (splint) into the test tube. 2. Measurement of pH and Acidity a. Place 5 mL of water in a test tube and add 2 drops of a phenolphthalein indicator solution in it. Add a few drops of dilute hydrochloric acid and record what happens. b. There are three solutions of HCl prepared in front of the classroom. The most concentrated, 0.1 M HCl, is one hundred times more concentrated than the weakest solution, the 0.001 M HCl. Use the pH meter to record the pH’s of the three solutions.

37
3. Reactions of Acids with Carbonates and Bicarbonates a. Take a 100 mL beaker and just cover the bottom with a thin layer of sodium bicarbonate (baking soda). Add about 4 to 5 mL of diluted (6 M) HCl to the beaker. Record the results. Lower a lit match into the beaker and record what happens. b. Try the above reaction again with a chip of calcium carbonate (limestone, marble). Let the reaction go for about 2 minutes before lowering a lit match into it. When completed, throw them in the labeled water container; DO NOT CLOG THE DRAIN! 4. Neutralizing Acids with Base: Using Indicators In this experiment, you will make water acidic and then basic to see how the pH affects a common indicator solution. Add 25 mL of water and 3 drops of a phenolphthalein solution to a 100 mL beaker, and then add 5 drops of 6 M hydrochloric acid. To this solution, add 10 percent sodium hydroxide solution drop by drop until the indicator changes color. Once you’ve gotten this color change, reverse it by adding more dilute acid dropwise. 5. Reaction of a Non-Metal Oxide and Water In this section, you’ll investigate what happens when an oxide of a non-metal, sulfur, reacts with water. a. This part of the experiment must be done in the fume hood! Place a small lump of sulfur in a deflagrating spoon (which looks like a ladle with a long handle) and set it on fire with a Bunsen burner. Once the sulfur is burning, lower the spoon into a bottle containing 15 mL of water; this will allow the fumes of combustion to fill the air space of the bottle. After 2 minutes, remove the sulfur and cover the bottle with a glass plate. Shake the bottle to mix the gas and water. Is the water acidic or basic?
. .
burning sulfur
water
.
.
.
.
38
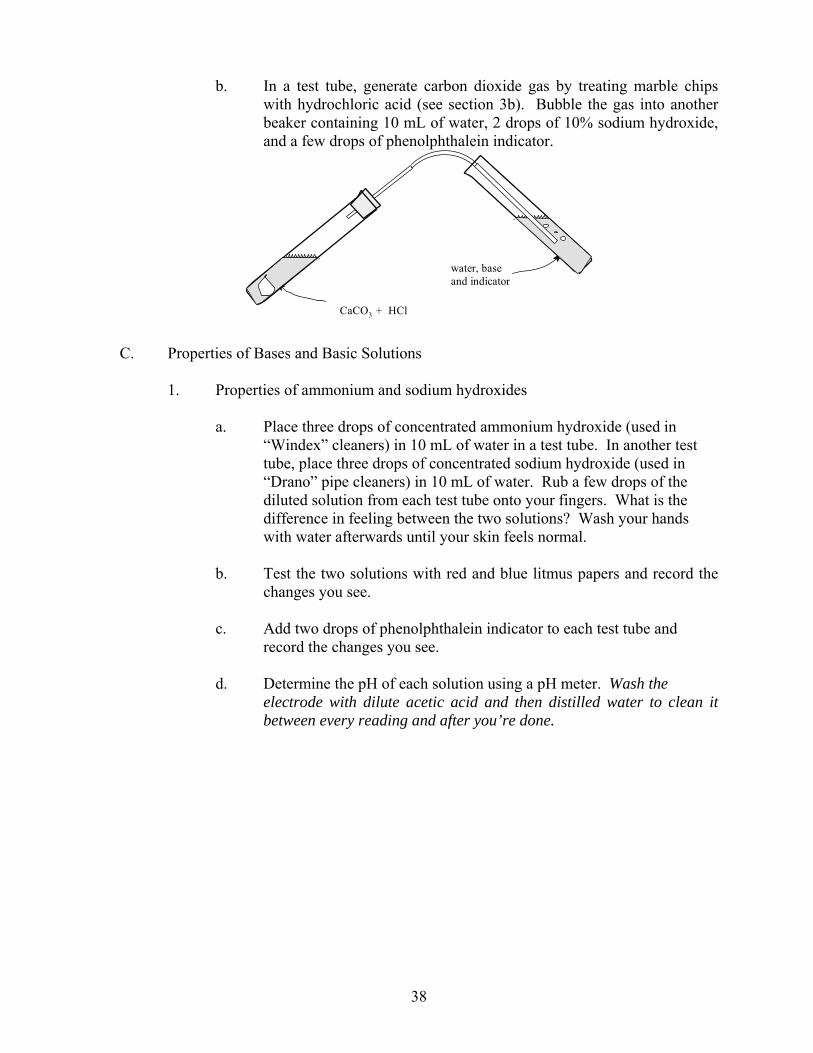
b. In a test tube, generate carbon dioxide gas by treating marble chips with hydrochloric acid (see section 3b). Bubble the gas into another beaker containing 10 mL of water, 2 drops of 10% sodium hydroxide, and a few drops of phenolphthalein indicator.
. .
CaCO3 + HCl
. .
water, baseand indicator
C. Properties of Bases and Basic Solutions 1. Properties of ammonium and sodium hydroxides a. Place three drops of concentrated ammonium hydroxide (used in “Windex” cleaners) in 10 mL of water in a test tube. In another test tube, place three drops of concentrated sodium hydroxide (used in “Drano” pipe cleaners) in 10 mL of water. Rub a few drops of the diluted solution from each test tube onto your fingers. What is the difference in feeling between the two solutions? Wash your hands with water afterwards until your skin feels normal. b. Test the two solutions with red and blue litmus papers and record the changes you see. c. Add two drops of phenolphthalein indicator to each test tube and record the changes you see. d. Determine the pH of each solution using a pH meter. Wash the electrode with dilute acetic acid and then distilled water to clean it between every reading and after you’re done.

39
2. The Reaction of Metal Oxides and Water a. In three test tubes, place 10 mL of water, 2 drops of phenolphthalein, and a pinch of calcium hydroxide, magnesium hydroxide, or calcium oxide. Record the color changes. In this last section, you will explore the reaction that occurs when you heat limestone (“slaking lime”) to make a compound known as “quicklime”, which is used in the manufacture of concrete: b. Take a small piece of iron wire and wrap it around a small chip of calcium carbonate (marble chip). Heat the chip until it is white hot with a Bunsen burner, for about 2 minutes. Let the chip cool and drop it into a beaker with 15 mL of water and a few drops of phenolphthalein. Compare this result to an unheated chip.
40
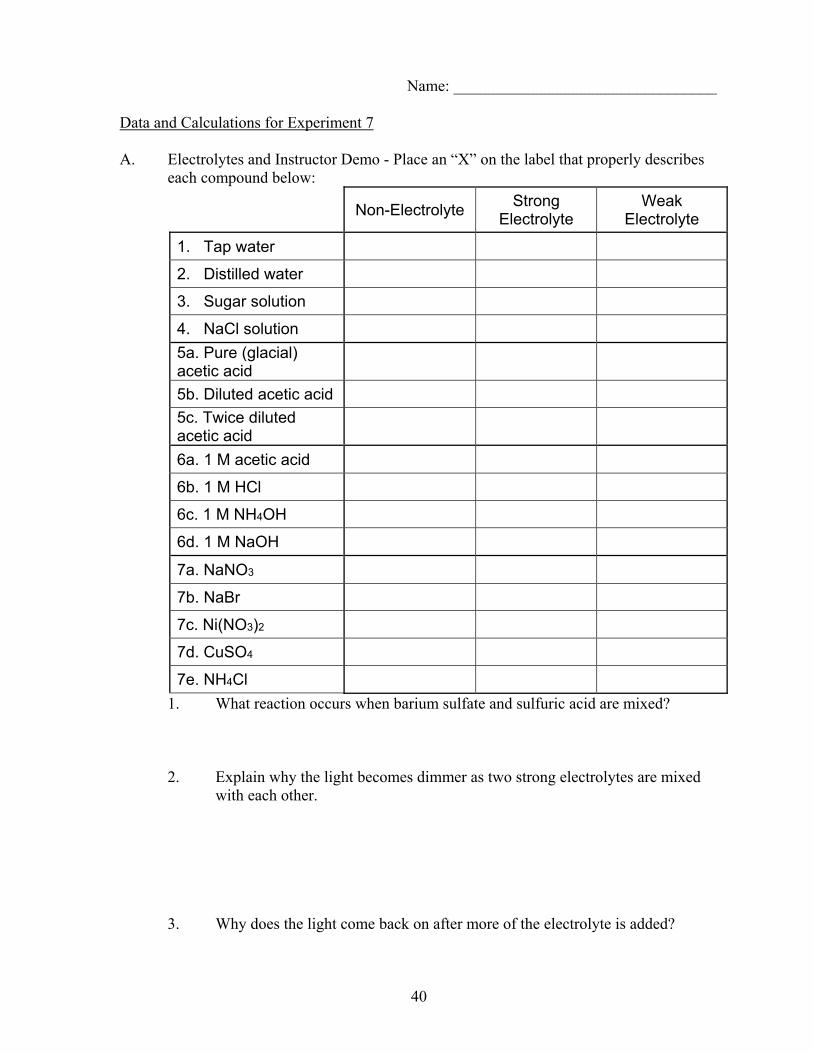
Name: _________________________________ Data and Calculations for Experiment 7 A. Electrolytes and Instructor Demo - Place an “X” on the label that properly describes each compound below:
Non-Electrolyte Strong
Electrolyte Weak
Electrolyte
1. Tap water
2. Distilled water
3. Sugar solution
4. NaCl solution
5a. Pure (glacial) acetic acid
5b. Diluted acetic acid
5c. Twice diluted acetic acid
6a. 1 M acetic acid
6b. 1 M HCl
6c. 1 M NH4OH
6d. 1 M NaOH
7a. NaNO3
7b. NaBr
7c. Ni(NO3)2
7d. CuSO4
7e. NH4Cl
1. What reaction occurs when barium sulfate and sulfuric acid are mixed? 2. Explain why the light becomes dimmer as two strong electrolytes are mixed with each other. 3. Why does the light come back on after more of the electrolyte is added?

41
4. What happens to the glacial acetic acid as it is diluted? How does this explain the changes in light intensity? B. Properties of Acids 1. Reactions of Acids with Metals a) Which acids reacted with the magnesium? b) Represent the reaction between the metal and ONE acid that occurred with an equation. 2. Measurement of pH and Acidity a) Acids turned the red litmus paper ____________ . b) Acids turned the blue litmus paper ____________ . c) What is the color of phenolphthalein in acidic solution? ____________ d) What is the pH of the 0.1 M solution? ____________ What is the pH of the 0.01 M solution? ____________ What is the pH of the 0.001 M solution? ____________ e) Which solution has the greatest concentration of H+? f) Calculate the H+ concentration of a pH = 4.6 solution. Write the answer in scientific notation. 3. Reactions of Acids with Carbonates and Bicarbonates a) What is the name and formula of the gas formed in this reaction? b) What happened to the burning stick when it was placed in the beaker?
42
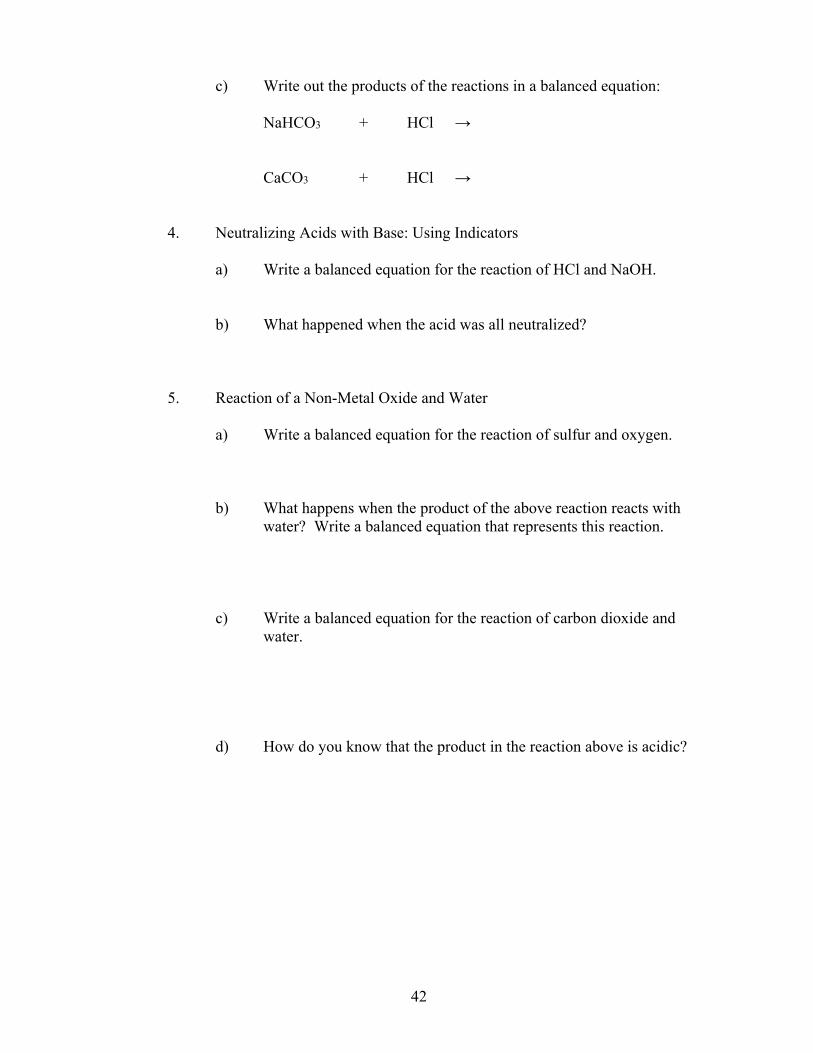
c) Write out the products of the reactions in a balanced equation: NaHCO3 + HCl → CaCO3 + HCl → 4. Neutralizing Acids with Base: Using Indicators a) Write a balanced equation for the reaction of HCl and NaOH. b) What happened when the acid was all neutralized? 5. Reaction of a Non-Metal Oxide and Water a) Write a balanced equation for the reaction of sulfur and oxygen. b) What happens when the product of the above reaction reacts with water? Write a balanced equation that represents this reaction. c) Write a balanced equation for the reaction of carbon dioxide and water. d) How do you know that the product in the reaction above is acidic?

43
C. Properties of Bases 1. Properties of ammonium and sodium hydroxides a) What did the sodium hydroxide feel like? b) What did the ammonium hydroxide feel like? c) Bases turned the red litmus paper ____________ . d) Bases turned the blue litmus paper ____________ . e) What is the pH of the ammonium hydroxide solution? ________ f) What is the pH of the sodium hydroxide solution? ________ g) What is the concentration of H+ in the more basic solution? ________ 2. The Reaction of Metal Oxides and Water a) What is the color of phenolphthalein with CaO? ______________ What is the color of phenolphthalein with MgO? ______________ What is the color of phenolphthalein with Ca(OH)2? ______________ b) Write the balanced equations for the following reactions: CaO + H2O → MgO + H2O → c) Marble is calcium carbonate (CaCO3). Write a balanced equation for the reaction that occurs when you heat the marble chip. d) Write a balanced equation for the reaction that occurs when you put the heated marble chip in water.

44
EXPERIMENT 8
Acid/Base Titrations Discussion This experiment demonstrates an analytical technique known as titration, where a solution is delivered from a buret until it completely consumes another solution in a flask. Consider the following:
First, the concentration of a base solution (standard) will be determined; this data will be used to determine the concentration of unknown acid solutions. To standardize the NaOH solution, it will be reacted with potassium hydrogen phthalate, KHC8H4O4 (abbreviated KHP). The molar mass of KHP is 204.2 g/mol. The reaction of KHP with NaOH is known to be:
KHC8H4O4(aq) + NaOH(aq) → KNaC8H4O4(aq) + H2O(l) Starting with a known mass of KHP and recording the volume of NaOH required to reach the endpoint, the molarity of the base can be determined. The indicator to be used, phenolphthalein, is colorless in acidic solution and rosy pink when slightly basic. Even though the endpoint is slightly overshot in order to make the color change, the goal is to use as little excess base as possible. Therefore, the titrated solution should be very pale pink, not bright rosy red, at the endpoint. Once the concentration of the NaOH solution is known, one can: (1) determine the concentration of a hydrochloric acid solution and/or (2) determine the molarity and mass percent of acetic acid in a sample of vinegar.
5 0
4 0
3 0
2 0
1 0
0
Acid-base titrations are an example of volumetric analysis, a technique in which one solution is used to analyze another. The solution used to carry out the analysis is called the titrant and is delivered from a device called a buret, which measures the volume accurately. The point in the titration at which enough titrant has been added to react exactly with the substance being determined is called the equivalence point (or stoichiometric point). This point is often marked by the change in color of a chemical called an indicator. The titration set-up is illustrated in the schematic shown left.
45
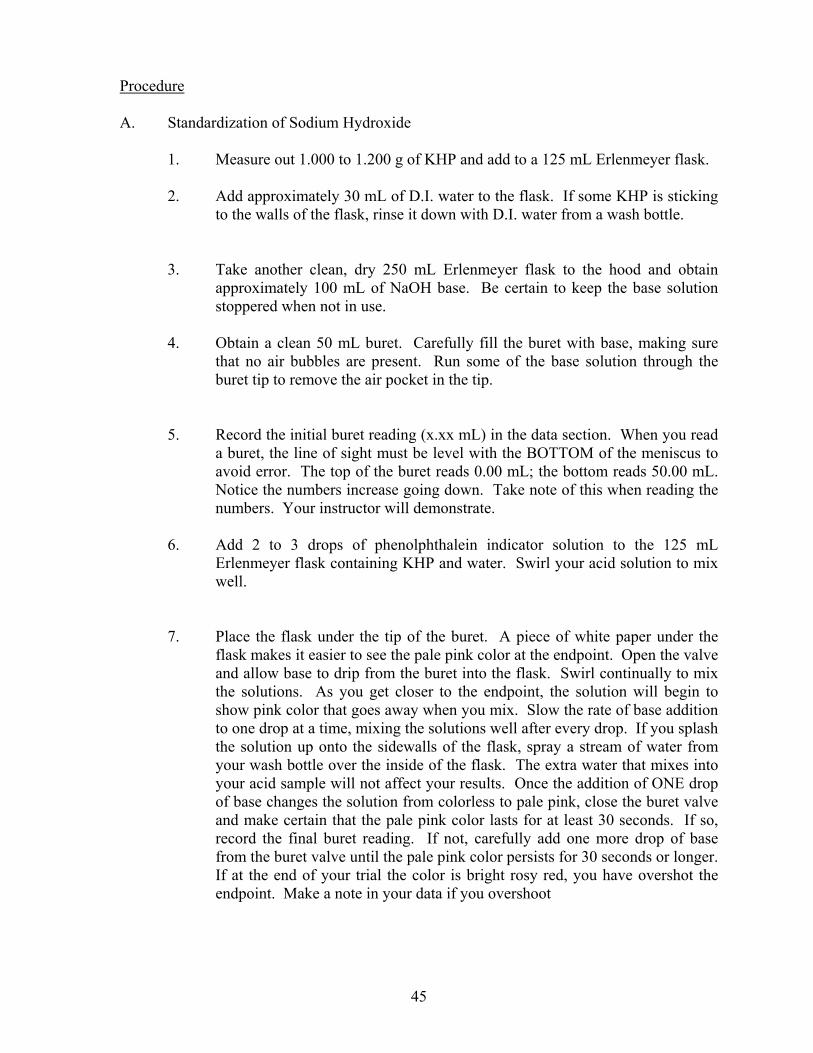
Procedure A. Standardization of Sodium Hydroxide
1. Measure out 1.000 to 1.200 g of KHP and add to a 125 mL Erlenmeyer flask.
2. Add approximately 30 mL of D.I. water to the flask. If some KHP is sticking to the walls of the flask, rinse it down with D.I. water from a wash bottle.
3. Take another clean, dry 250 mL Erlenmeyer flask to the hood and obtain approximately 100 mL of NaOH base. Be certain to keep the base solution stoppered when not in use.
4. Obtain a clean 50 mL buret. Carefully fill the buret with base, making sure that no air bubbles are present. Run some of the base solution through the buret tip to remove the air pocket in the tip.
5. Record the initial buret reading (x.xx mL) in the data section. When you read a buret, the line of sight must be level with the BOTTOM of the meniscus to avoid error. The top of the buret reads 0.00 mL; the bottom reads 50.00 mL. Notice the numbers increase going down. Take note of this when reading the numbers. Your instructor will demonstrate.
6. Add 2 to 3 drops of phenolphthalein indicator solution to the 125 mL Erlenmeyer flask containing KHP and water. Swirl your acid solution to mix well.
7. Place the flask under the tip of the buret. A piece of white paper under the flask makes it easier to see the pale pink color at the endpoint. Open the valve and allow base to drip from the buret into the flask. Swirl continually to mix the solutions. As you get closer to the endpoint, the solution will begin to show pink color that goes away when you mix. Slow the rate of base addition to one drop at a time, mixing the solutions well after every drop. If you splash the solution up onto the sidewalls of the flask, spray a stream of water from your wash bottle over the inside of the flask. The extra water that mixes into your acid sample will not affect your results. Once the addition of ONE drop of base changes the solution from colorless to pale pink, close the buret valve and make certain that the pale pink color lasts for at least 30 seconds. If so, record the final buret reading. If not, carefully add one more drop of base from the buret valve until the pale pink color persists for 30 seconds or longer. If at the end of your trial the color is bright rosy red, you have overshot the endpoint. Make a note in your data if you overshoot
46
8. Discard the titrated solution into the sink, rinse the flask with D.I. water, and then titrate another new sample of KHP following the same procedure above. Do at least TWO successful titrations that achieve a pale pink color of the indicator.
9. Calculate the average molarity of the base from your two successful trials and check with your instructor for verification before proceeding to parts B and/or C below.
B. Molarity Determination of a Hydrochloric Acid Solution
1. From the hood, half fill a medium test tube with the unknown hydrochloric acid. Using a volumetric pipet, transfer 10.00 mL of the acid sample to a clean Erlenmeyer flask (your instructor will demonstrate).
2. Add 2 to 3 drops of phenolphthalein indicator solution and approximately 25 mL of D.I. water to the flask containing the 10.00 mL acid and swirl.
3. Refill the buret with NaOH and record the initial buret reading.
4. Place the flask under the buret and add base until you reach the endpoint as outlined in Part A above. Record the final buret reading, discard the sample in
the sink, and repeat the titration until you have TWO successful trials. Determine the average molarity of the hydrochloric acid solution from your two successful trials and check with your instructor for verification.
47
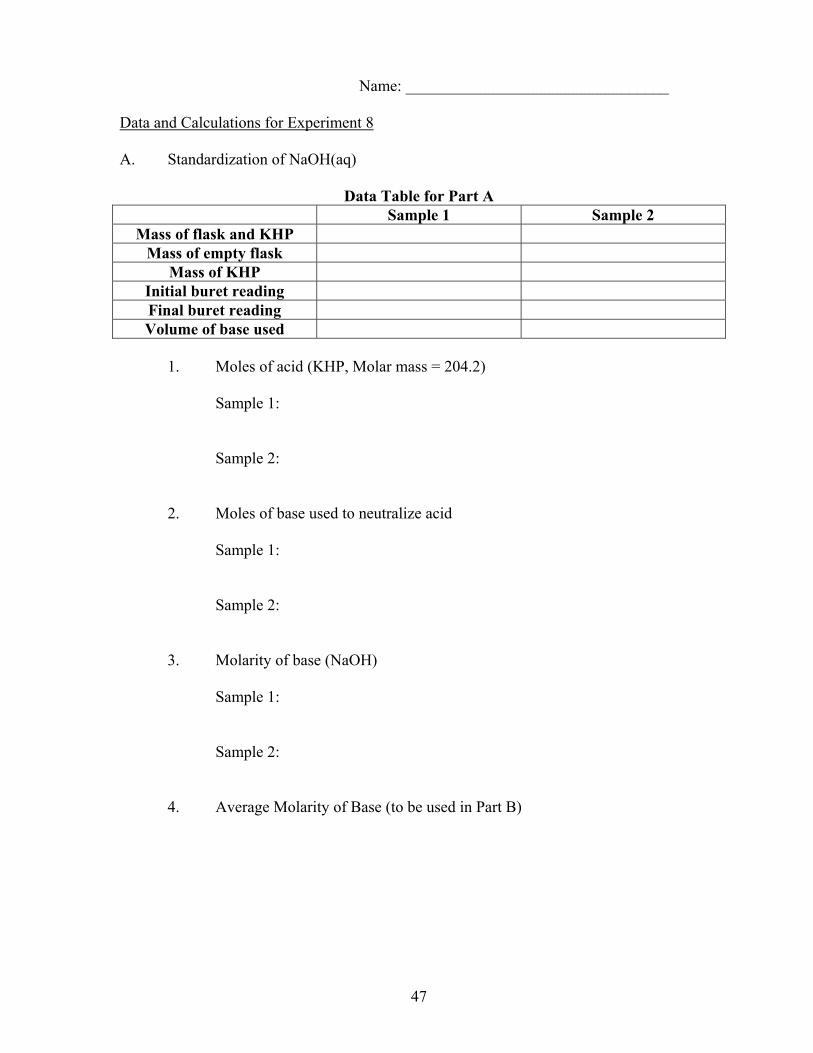
Name: _________________________________ Data and Calculations for Experiment 8 A. Standardization of NaOH(aq)
Data Table for Part A Sample 1 Sample 2
Mass of flask and KHP Mass of empty flask
Mass of KHP Initial buret reading Final buret reading Volume of base used
1. Moles of acid (KHP, Molar mass = 204.2)
Sample 1: Sample 2:
2. Moles of base used to neutralize acid Sample 1: Sample 2:
3. Molarity of base (NaOH) Sample 1: Sample 2:
4. Average Molarity of Base (to be used in Part B)
48
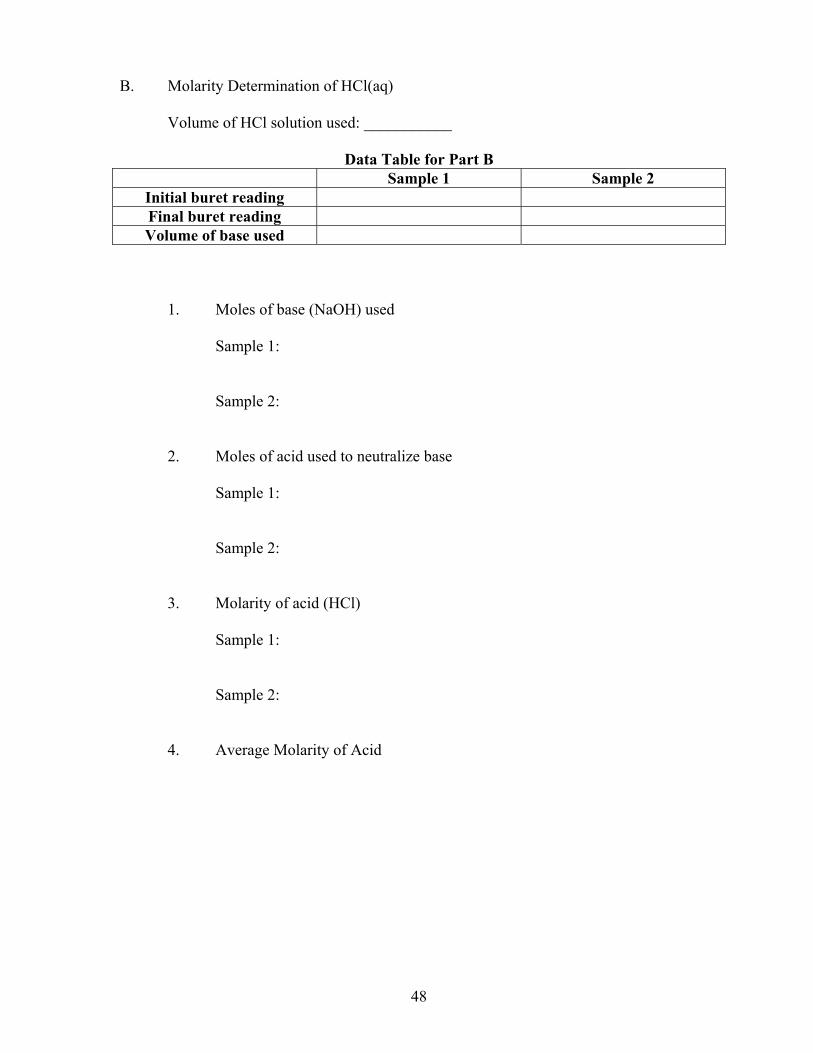
B. Molarity Determination of HCl(aq)
Volume of HCl solution used: ___________
Data Table for Part B Sample 1 Sample 2
Initial buret reading Final buret reading Volume of base used
1. Moles of base (NaOH) used Sample 1: Sample 2:
2. Moles of acid used to neutralize base Sample 1: Sample 2:
3. Molarity of acid (HCl) Sample 1: Sample 2:
4. Average Molarity of Acid

49
Questions 1. A titration required 13.42 mL of 0.1638 M NaOH solution. How many moles of NaOH were in this volume? 2. A student weighed a sample of KHP and found it weighed 1.396 g. Titration of this KHP required 21.36 mL of base (NaOH). Calculate the molarity of the base. 3. Write and balance the equation for the neutralization of a sulfuric acid solution of unknown concentration by sodium hydroxide. Calculate the molarity of an unknown sulfuric acid solution if a 25.0 mL sample of the acid solution consumes 27.2 mL of 0.138 M NaOH solution in a titration. 4. What might happen to your calculated NaOH molarity if you used tap water instead if D.I. water to dissolve the KHP crystals or to rinse down the walls of the flask during the titration? Hint: Tap water contains some calcium carbonate. 5. In your own words, use the back of this page to write a cohesive, well-written
summary of the background material and underlying chemical principles pertinent to this experiment. (For additional guidelines on writing this introduction, please refer to the Moorpark College Chemistry Department Laboratory Report Rubric found in the lab manual and department website.)
50
EXPERIMENT 9
Structure in Inorganic and Organic Compounds Discussion The Valence Shell Electron Pair Repulsion Theory (VSEPR) states that bonds and lone pairs are regions of high electron density in an atom that repel each other until they get as far apart as possible. This effect determines the atom’s geometry and bond angles. Two regions will be 180° apart, three regions will be 120° apart, and four regions will be 109.5° apart. Geometry Determination
A. Determine the Lewis dot structure of the molecule or ion.
B. For each central atom in the structure, determine the areas of electron density that lie directly on that atom. An area of electron density may be: a. a lone pair that lies on the central atom. (Lone pairs on other atoms don’t count.) b. a single bond. c. a double bond. d. a triple bond.
C. Assign geometry according to the table on the next page. Procedure
For each of the ions or molecules listed:
A. Draw the Lewis dot structure, including all resonance where appropriate.
B. Use the model kit to build the structure. • Use yellow balls for hydrogens. • Use black balls for other atoms. • Use short sticks for nonbonded electron pairs • Use long sticks for single bonds. • Use springs for double and triple bonds. Two springs form a double bond. Three
springs form a triple bond.
C. Sketch the shape of the structure in three dimensions. This is called the VSEPR structure.
D. Draw dipole moments on the VSEPR structure to show all polar bonds.
E. Give the name of the molecular geometry.
F. State whether the molecule is polar, nonpolar, or ionic.
G. Determine the approximate bond angle on the central atom(s).

51
# of areas
# of bonds
# of lone pairs
Geometry and bond
angles
Example
4 2 2 Angular or bent (109.5°)
OH H
4 3 1 Pyramidal (109.5°)
NH
HH
4 4 0 Tetrahedral (109.5°) N
HH
H
H
3 2 1 Bent (120°)
SO O
S OO
2 resonance forms
3 3 0 Trigonal (120°) N
O
OON
O
OON
O
OO
3 resonance forms
2 2 0 Linear (180°)
H C N
1 any Linear (Must be
three or more atoms to form
an angle.)
O O
Notice the convention for drawing bonds in 3-D space, where:
the wedge ( ) represents a bond coming out of the paper, and the dash ( ) represents a bond going behind the paper.
Finally, isomers will also be studied, or molecules having the same chemical formula but different connectivity of the atoms. Be sure not to confuse this phenomenon with resonance, where atoms are in the same place but electrons are delocalized throughout. For example, two isomers are possible for a molecule with the formula C4H10:
C C C CH
H
H H
H
H
H
H
H
H C C CH
H
H C
H
H
H
H
H H
H
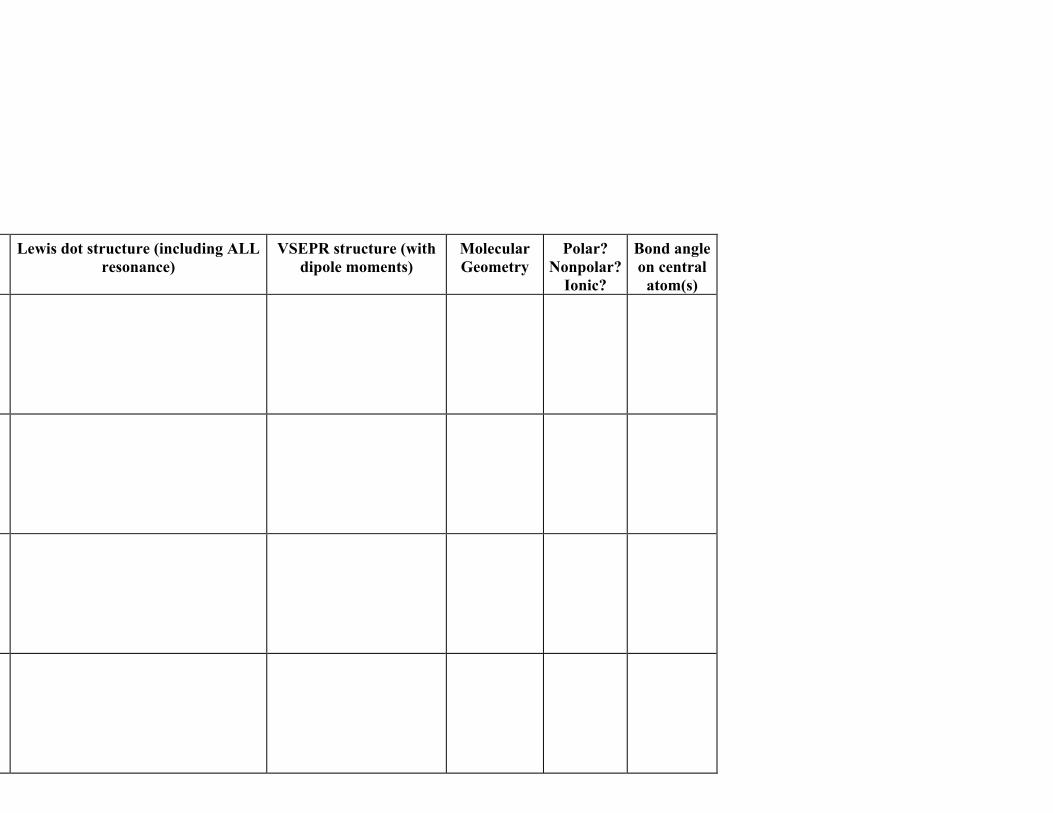
Lewis dot structure (including ALL resonance)
VSEPR structure (with dipole moments)
Molecular Geometry
Polar? Nonpolar?
Ionic?
Bond angle on central
atom(s)

53
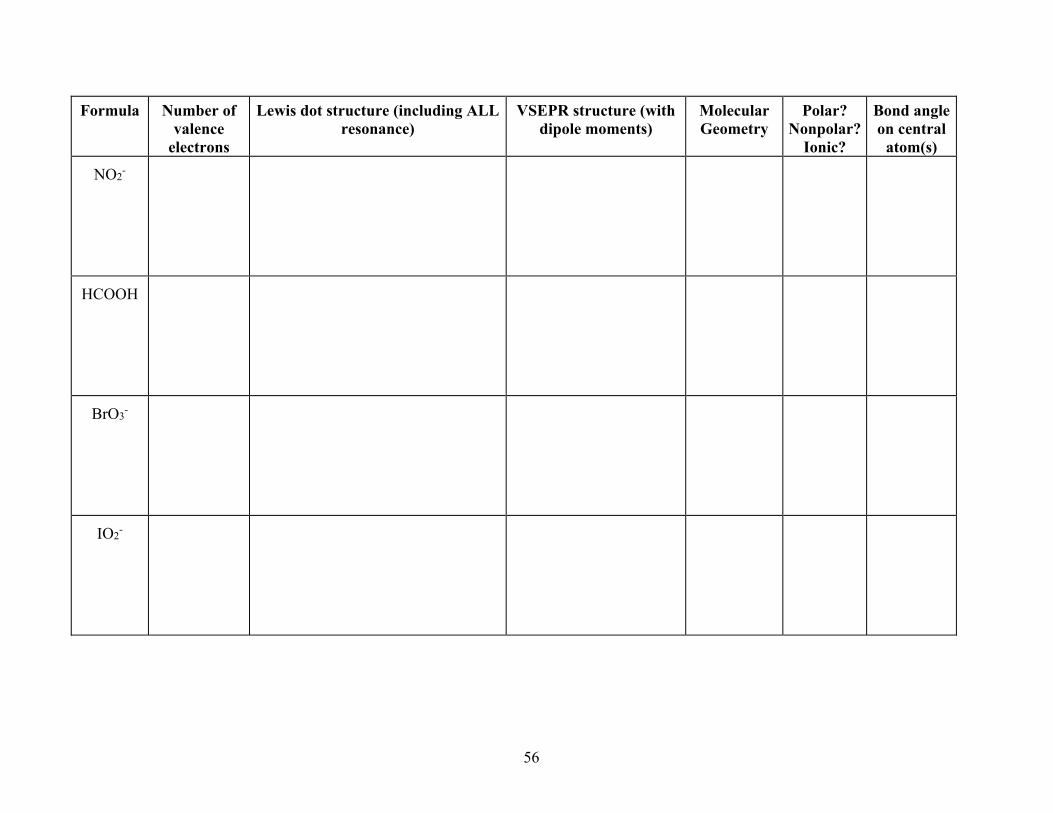
Formula Number of valence
electrons
Lewis dot structure (including ALL resonance)
VSEPR structure (with dipole moments)
Molecular Geometry
Polar? Nonpolar?
Ionic?
Bond angle on central
atom(s)
H2S
PBr3
ClO4-
CS2

54
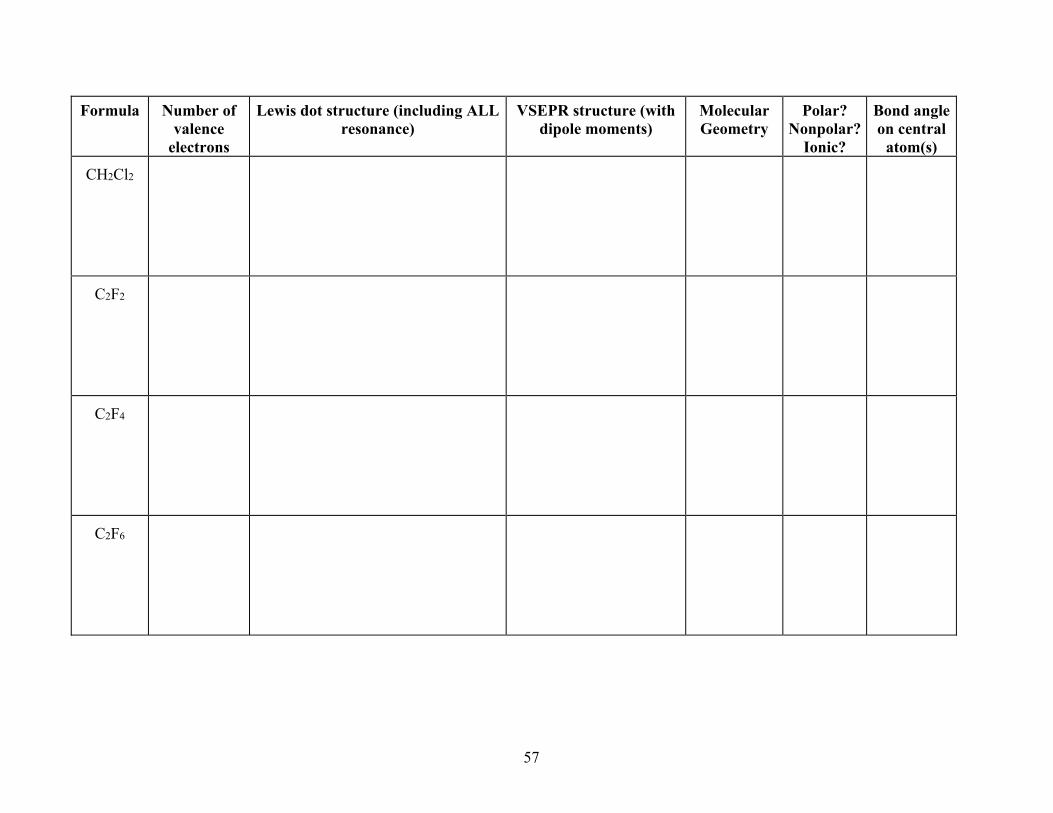
Formula Number of valence
electrons
Lewis dot structure (including ALL resonance)
VSEPR structure (with dipole moments)
Molecular Geometry
Polar? Nonpolar?
Ionic?
Bond angle on central
atom(s)
CHCl3
PO3-3
PO4 -3
CH2O

55
Formula Number of valence
electrons
Lewis dot structure (including ALL resonance)
VSEPR structure (with dipole moments)
Molecular Geometry
Polar? Nonpolar?
Ionic?
Bond angle on central
atom(s)
SO3
SO3-2
SO4-2
SCN-
56
Formula Number of valence
electrons
Lewis dot structure (including ALL resonance)
VSEPR structure (with dipole moments)
Molecular Geometry
Polar? Nonpolar?
Ionic?
Bond angle on central
atom(s)
NO2-
HCOOH
BrO3-
IO2-
57
Formula Number of valence
electrons
Lewis dot structure (including ALL resonance)
VSEPR structure (with dipole moments)
Molecular Geometry
Polar? Nonpolar?
Ionic?
Bond angle on central
atom(s)
CH2Cl2
C2F2
C2F4
C2F6
58
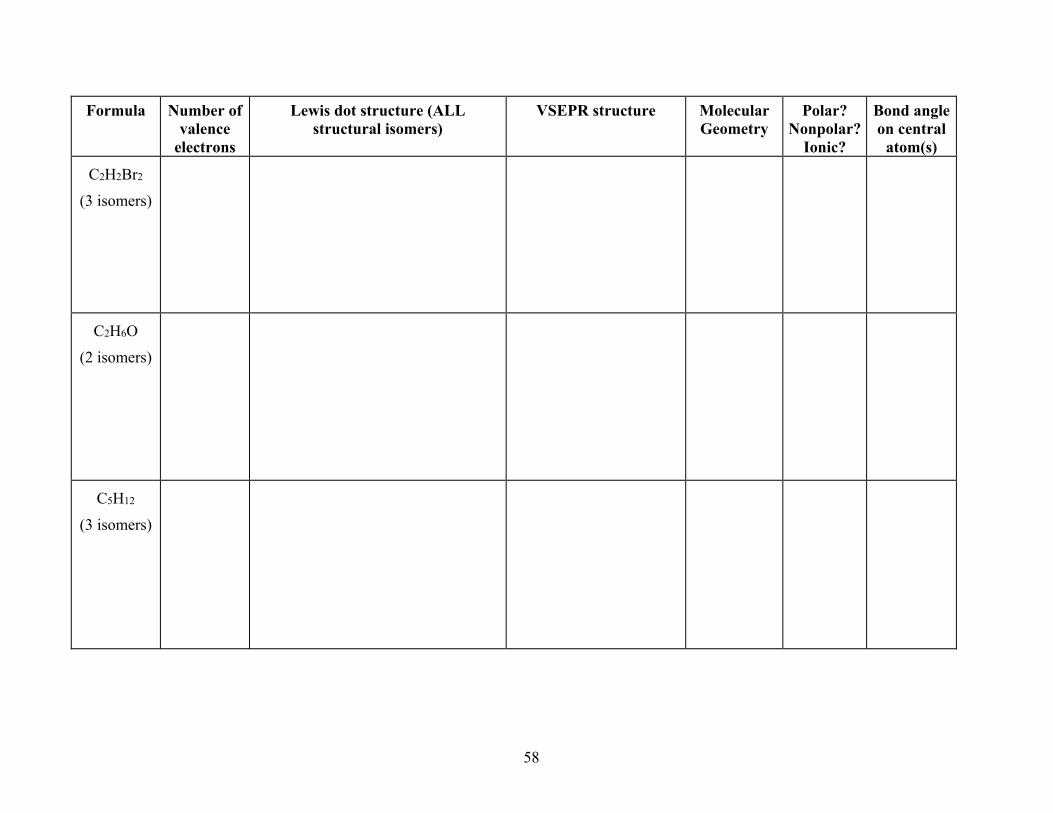
Formula Number of valence
electrons
Lewis dot structure (ALL structural isomers)
VSEPR structure Molecular Geometry
Polar? Nonpolar?
Ionic?
Bond angle on central
atom(s)
C2H2Br2
(3 isomers)
C2H6O
(2 isomers)
C5H12
(3 isomers)

59

EXPERIMENT 10
Stereochemistry and Use of Molecular Models Discussion This lab will help you discover and learn about stereochemistry and the various terms associated with it. You will be provided with a model kit. Bring your course guide to help you with some of these concepts. Answer the questions below each section at the end of this lab (to be submitted to your instructor). Construct a model (called structure A) in which a carbon atom (represented by a black ball) has four different colored balls attached to it – yellow, green, orange, and purple – representing four different substituents attached to the central carbon. The yellow ball represents hydrogen, the green ball represents chlorine, the orange ball represents bromine, and the purple ball represents iodine. The carbon of structure A is called a stereocenter. Q-1) Using wedges and dashes, draw this molecule in at least four different orientations. In each orientation that you draw, the same two atoms should NOT both be on wedges and dashes. Practice rotating the molecule in your hands and on paper, until you are comfortable with viewing molecules in three dimensions. Q-2) Does molecule A have a plane of symmetry? Replace the orange ball with a green one. Q-3) Does the revised model have a plane of symmetry now? Find an orientation in which it is easy to draw this plane of symmetry, then draw the molecule using wedges and dashes and draw a dotted line representing the plane of symmetry. Now reconstruct structure A. Put the model on a flat surface so that the yellow ball points up. Look straight down the model and, starting with the green ball and proceeding clockwise, record the order of the balls. Now, construct a model (structure B) which is a mirror image of structure A. Place structure B on a flat surface adjacent to structure A with the yellow ball of both pointing at the ceiling. Q-4) Try superposing (aligning) all five atoms at the same time. Can you superpose structure B and structure A? How many atoms can you superpose at one time? Try to improve on this number until you think that you cannot get any more atoms to superpose at any one time. Q-5) Are structure A and structure B identical? Q-6) How do the structures differ? The two structures A and B are chiral molecules. A chiral molecule does not have a plane of symmetry and has a non-superposable mirror image. The pair of structures that are non-superposable mirror images are called enantiomers. These two compounds differ only in the way they rotate plane-polarized light. Each enantiomer is said to be optically active.
61
On both structures A and B, replace the orange ball with a green ball and call the new structures C and D. Q-7) Are structures C and D still mirror images of each other? Q-8) Do C and D have internal planes of symmetry? Q-9) Can you superpose structures C and D? Are these molecules identical or different? Structures C and D represent achiral molecules. Achiral molecules have a superposable mirror image, a plane of symmetry, and do not rotate plane-polarized light. Achiral molecules are optically inactive. (Remember: the prefix a- means the same as non-) The R/S convention is used to designate the configurations at stereocenters. The attached atoms to the stereocenter are arranged in order of increasing atomic number. Thus, higher atomic number means higher priority. If two atoms have the same priority, you move to the next atom out and compare those atoms. Continue this until you break the tie. Look at the molecule from the side opposite the group with the lowest priority. If you count the highest to lowest priority and you go in a clockwise direction, you have the R configuration. If you move counterclockwise, the stereocenter is the S configuration. Rebuild structures A and B. In our model kits, the black balls represent carbon atoms, the yellow balls represent hydrogen atoms, the green balls represent chlorine atoms, the orange balls represent bromine atoms, and the purple balls represent iodine atoms. Q-10) Using wedges and dashes, draw molecules A and B. Working with structure A, interchange any two balls attached to the stereocenter. Call this molecule E. Q-11) What happened to the configuration at the stereocenter? How does molecule E compare to molecule B? In your molecule E, change two different balls (not the same ones as you did in the previous step). Call this molecule F. Q-12) How does molecule F compare to molecule B? How does it compare to your original molecule A? Q-13) Repeat this process by swapping two groups at a time several more times. How many different stereoisomers do you find through this process?

62
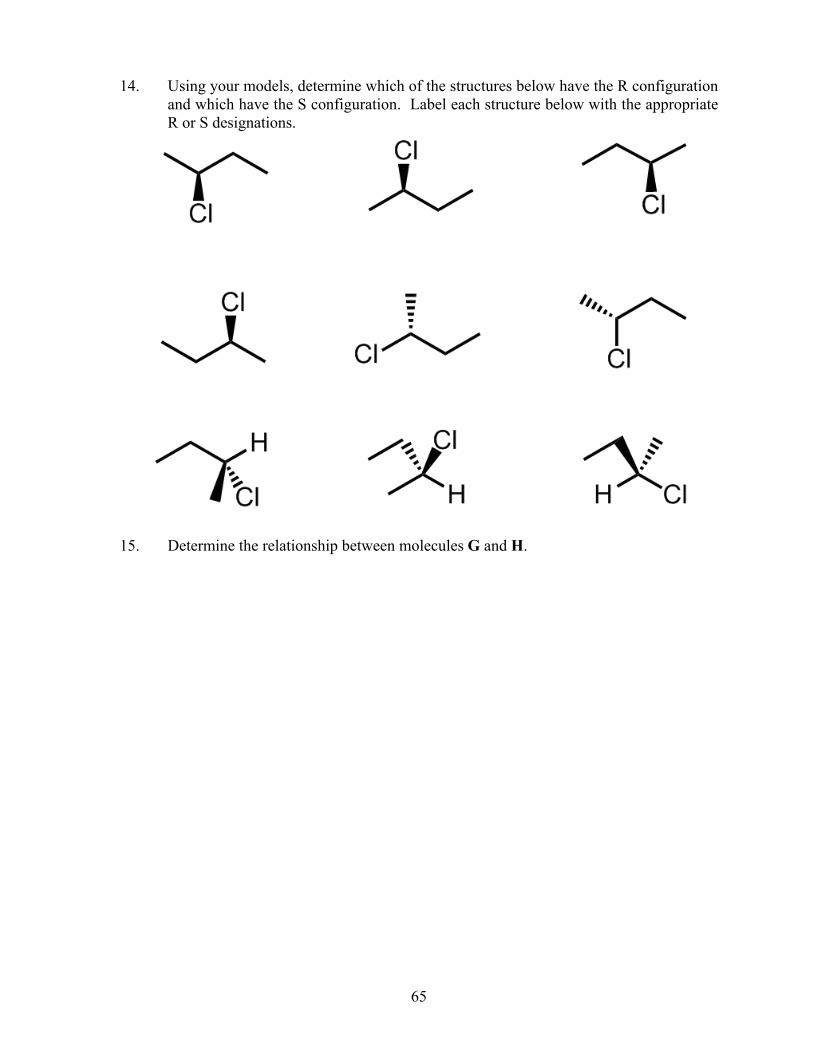
Build a model of (R)-2-chlorobutane and a model of (S)-2-chlorobutane Q-14) Using your models, determine which of the structures below have the R configuration and which have the S configuration. To verify your answer, rotate each model to align it with the structure that is drawn below. Label each structure in your Report Form along with the appropriate R or S designations.
Two compounds with the same molecular formula but a different arrangement in space are called stereoisomers. A stereoisomer that has a non-superposable mirror image is called an enantiomer. A stereoisomer with a non-superposable non-mirror image is called a diastereomer. Diastereomers usually have two or more stereocenters. Now build the following two molecules: (2R, 3R)-2,3-dichlorobutane = Molecule G (2S, 3S)-2,3-dichlorobutane = Molecule H Label each model with a piece of tape that has the molecule’s letter (G or H). Q-15) Determine the relationship between molecules G and H. Please put your model kit away exactly the way that you found it. There is a sample model kit at the front of the room if you’ve forgotten where everything goes.
63
Name: __________________________
Data and Questions for Experiment 10
1. Using wedges and dashes, draw this molecule in at least four different orientations. In each orientation that you draw, the same two atoms should NOT both be on wedges and dashes. Practice rotating the molecule in your hands and on paper, until you are comfortable with viewing molecules in three dimensions.
2. Does molecule A have a plane of symmetry? Briefly explain. 3. Does the revised model have a plane of symmetry now? Find an orientation in which
it is easy to draw this plane of symmetry, then draw the molecule using wedges and dashes and draw a dotted line representing the plane of symmetry.
4. Try superposing (aligning) all five atoms at the same time. Can you superpose
structure B and structure A? How many atoms can you superpose at one time? Try to improve on this number until you think that you cannot get any more atoms to superpose at any one time.
5. Are structure A and structure B identical? Mark ONE: Yes No 6. How do the structures differ? 7. Are structures C and D still mirror images of each other? Yes No 8. Do C and D have internal planes of symmetry? Yes No
64
9. Can you superpose structures C and D? Are these molecules identical or
different?Yes No Identical Different 10. Using wedges and dashes, draw molecules A and B. 11. What happened to the configuration at the stereocenter? How does molecule E
compare to molecule B? 12. How does molecule F compare to molecule B? How does it compare to your original
molecule A? 13. Repeat this process by swapping two groups at a time several more times. How many
different stereoisomers do you find through this process?
65
14. Using your models, determine which of the structures below have the R configuration and which have the S configuration. Label each structure below with the appropriate R or S designations.
15. Determine the relationship between molecules G and H.
66
EXPERIMENT 11
Paper Chromatography Discussion In addition to recrystallization and distillation, chromatography can also be used to separate the components of a homogeneous mixture. Initially, chromatography was used to separate colored substances, hence the name (Greek chroma, color). The colors of the components of the mixture are observed as they separate. This technique can also be used with colorless substances if they fluoresce when exposed to ultraviolet light or if they react with a second reagent to produce colored products. Separation of substances by chromatography depends on the differences between the adsorptive characteristics of the substances with respect to a stationary phase material such as paper. The components of the mixture are adsorbed onto the stationary phase. Continued passage of a solvent in the stationary phase dissolves the adsorbed components of the mixture and moves them along the paper, known as the mobile phase. Each component moves at its own rate; after a given time interval, each component has moved a different distance across the stationary phase. In this experiment, amino acids will be placed on a sheet of paper and the solvent allowed to travel along the paper by capillary action for a given period of time. The paper serves as the stationary phase, and the amino acids will move along the paper at rates that depend on their structures. Students will determine the distance traveled by certain amino acids; ultimately, an unknown mixture will be analyzed for amino acid(s) present. The ratio of the distance traveled by an amino acid relative to that traveled by the solvent is the Rf value for the amino acid.
Rf = solventby traveleddistance
compoundby traveleddistance
Since amino acids are colorless, identification of their positions at the end of the experiment is necessary. Ninhydrin will be used to develop a spot of color at the point to which each amino acid has moved. Procedure CAUTION! 2% ninhydrin in ethanol will strongly stain the amino acids on your skin. Avoid spilling the ninhydrin solution on yourself. Prepare a solution of 10 mL 2% aqueous ammonia in 20 mL 2-propanol. The solution should be placed in a 600 mL beaker and covered with aluminum foil. This is your solvent that will be used to flush the known and unknown mixtures along the stationary phase.
67
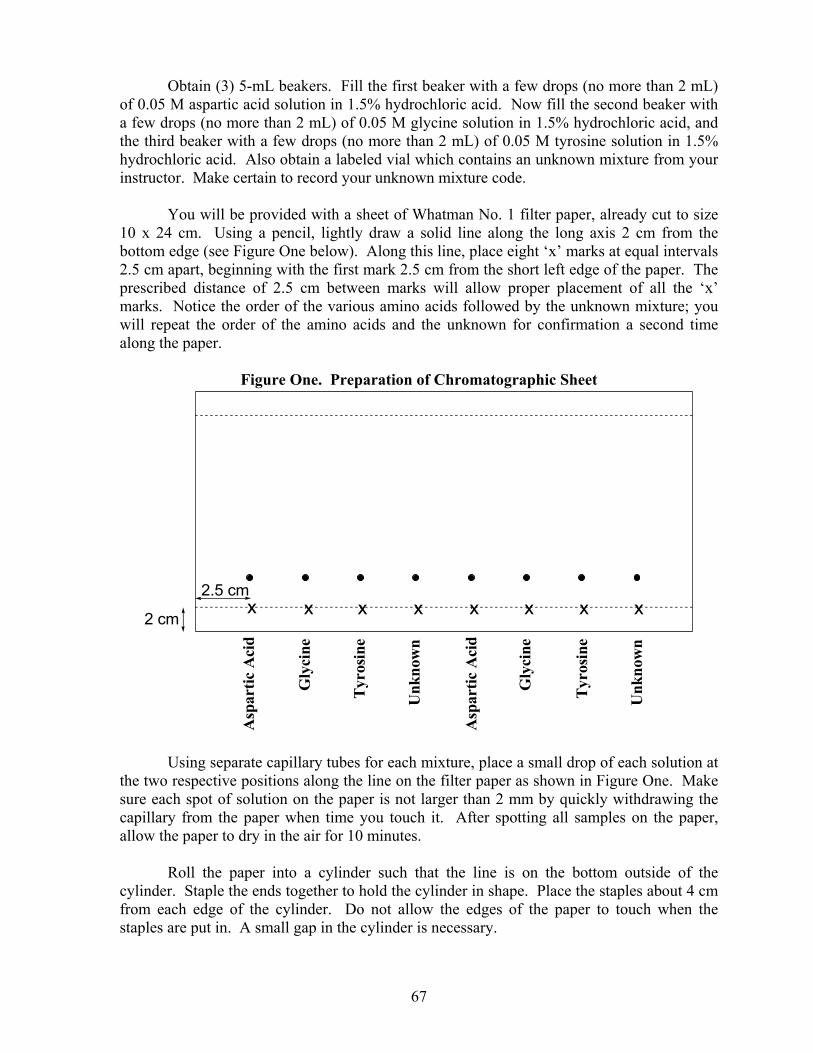
Obtain (3) 5-mL beakers. Fill the first beaker with a few drops (no more than 2 mL) of 0.05 M aspartic acid solution in 1.5% hydrochloric acid. Now fill the second beaker with a few drops (no more than 2 mL) of 0.05 M glycine solution in 1.5% hydrochloric acid, and the third beaker with a few drops (no more than 2 mL) of 0.05 M tyrosine solution in 1.5% hydrochloric acid. Also obtain a labeled vial which contains an unknown mixture from your instructor. Make certain to record your unknown mixture code. You will be provided with a sheet of Whatman No. 1 filter paper, already cut to size 10 x 24 cm. Using a pencil, lightly draw a solid line along the long axis 2 cm from the bottom edge (see Figure One below). Along this line, place eight ‘x’ marks at equal intervals 2.5 cm apart, beginning with the first mark 2.5 cm from the short left edge of the paper. The prescribed distance of 2.5 cm between marks will allow proper placement of all the ‘x’ marks. Notice the order of the various amino acids followed by the unknown mixture; you will repeat the order of the amino acids and the unknown for confirmation a second time along the paper.
Figure One. Preparation of Chromatographic Sheet
Asp
arti
c A
cid
Unk
now
n
Asp
arti
c A
cid
Gly
cine
Gly
cine
Tyr
osin
e
Tyr
osin
e
Unk
now
n
x x x xxx x x2 cm
2.5 cm
Using separate capillary tubes for each mixture, place a small drop of each solution at the two respective positions along the line on the filter paper as shown in Figure One. Make sure each spot of solution on the paper is not larger than 2 mm by quickly withdrawing the capillary from the paper when time you touch it. After spotting all samples on the paper, allow the paper to dry in the air for 10 minutes. Roll the paper into a cylinder such that the line is on the bottom outside of the cylinder. Staple the ends together to hold the cylinder in shape. Place the staples about 4 cm from each edge of the cylinder. Do not allow the edges of the paper to touch when the staples are put in. A small gap in the cylinder is necessary.
68
Placed the stapled chromatogram paper into the 600 mL beaker, base line down, along the solvent surface BUT NOT COVERED BY IT. Avoid splashing the solvent on the paper. Make sure the paper does not touch the sides of the beaker. Allow the solvent front to migrate up to 1 cm below the edge of the paper (top) for at least 90 minutes. Afterwards, remove the paper from the cylinder, mark the edge of the wet part of the paper, and allow it to air dry on the lab bench top. Once the cylinder is essentially dry, remove the staples and hang it in the hood. Your instructor will spray the paper with a solution of 2% ninhydrin in ethanol. After the spray dries, place the paper in an oven at 100 ºC for 10-15 minutes. Note the spots and circle each one. Measure the distances from the ‘x’ to each spot and the distance traveled by the solvent. The distance traveled by the solvent is the distance from the liquid level in the beaker to the edge of the wet portion of the paper. Calculate the Rf values and determine the identity of your unknown.

69
Name: _________________________________ Data and Calculations for Experiment 11
UNKNOWN CODE: _________________
Solution Distance Traveled by Amino Acid (cm)
Distance Traveled by Solvent (cm)
Rf value
Aspartic Acid Glycine Tyrosine Unknown
Post-lab Questions 1. How might it be possible to quantitatively determine the composition of an amino
acid mixture? You may need to research this question a bit! 2. If two amino acids have the same Rf values in 2-propanol, how might they be
separated? 3. Identify the component(s) of your mixture, then draw the structure(s) of the amino
acid(s) present. Refer to your Biochemistry notes from lecture for the structures of the various amino acids.

70
EXPERIMENT 12
Identification of Hydrocarbons Discussion The number of known organic compounds totals into the millions. Of these compounds, the simplest types are those that contain only hydrogen and carbon atoms. These are known as hydrocarbons. Because of the number and variety of hydrocarbons that can exist, some means of classification is necessary. One means of classification depends on the way in which carbon atoms are connected. Chain aliphatic hydrocarbons are compounds consisting of carbons linked either in a single chain or in a branched chain. Cyclic hydrocarbons are aliphatic compounds that have carbon atoms linked in a closed polygon (also referred to as a ring). For example, hexane (single) and 2-methylpentane (branched) are chain aliphatic molecules, while cyclohexane is a cyclic aliphatic compound.
hexane 2-methylpentane cyclohexane Another means of classification depends on the type of bonding that exists between carbons. Hydrocarbons that contain only carbon-to-carbon single bonds are called alkanes. These are also referred to as saturated molecules. Hydrocarbons containing at least one carbon-to-carbon double bond are called alkenes, and compounds with at least one carbon-to-carbon triple bond are called alkynes. Alkenes and alkynes are referred to as unsaturated molecules. Finally, a class of cyclic hydrocarbons that contain a closed loop (sextet) of electrons is called aromatic. With so many compounds possible, identification of the bond type is an important step in establishing the molecular structure. Quick, simple tests on small samples can establish the physical and chemical properties of the compounds by class. Some of the observed physical properties of hydrocarbons result from the nonpolar character of the compounds. In general, hydrocarbons do not mix with polar solvents such as water or ethanol (ethyl alcohol). On the other hand, hydrocarbons mix with relatively nonpolar solvents such as ligroin (a mixture of alkanes), carbon tetrachloride (CCl4), or dichloromethane (CH2Cl2). Because the density of most hydrocarbons is less than that of water, they will float. Crude oil and crude oil products (home heating oil and gasoline) are mixtures of hydrocarbons; when spilled on water, these substances spread quickly along the surface because they are insoluble in water. The chemical reactivity of hydrocarbons is determined by the type of bond in the compound. Unsaturated hydrocarbons (i.e., alkenes and alkynes) react by addition of reagents to the double or triple bonds. The addition products become saturated, with fragments of the reagent becoming attached the carbons of the multiple bond. Aromatic compounds, with a higher carbon-to-hydrogen ratio than nonaromatic compounds, undergo substitution in the presence of catalysts rather than an addition reaction.
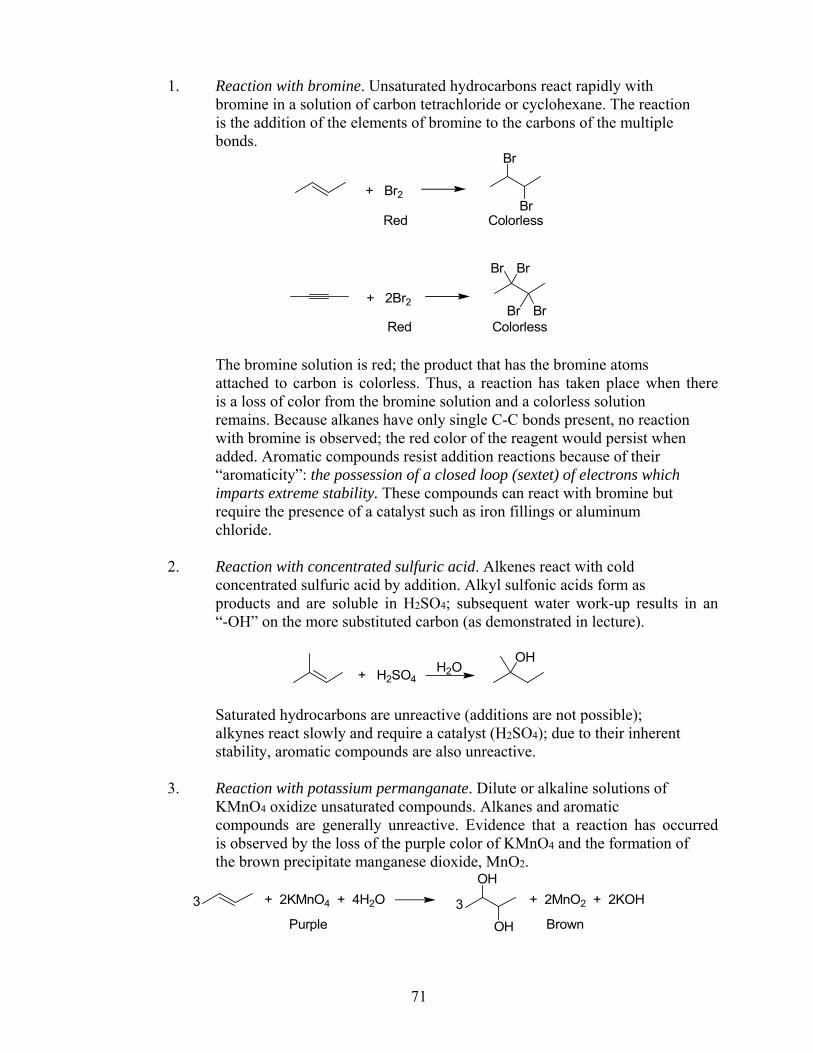
71
1. Reaction with bromine. Unsaturated hydrocarbons react rapidly with bromine in a solution of carbon tetrachloride or cyclohexane. The reaction is the addition of the elements of bromine to the carbons of the multiple bonds.
+ Br2
Br
BrRed Colorless
+ 2Br2
Br Br
Br BrRed Colorless
The bromine solution is red; the product that has the bromine atoms attached to carbon is colorless. Thus, a reaction has taken place when there is a loss of color from the bromine solution and a colorless solution remains. Because alkanes have only single C-C bonds present, no reaction with bromine is observed; the red color of the reagent would persist when added. Aromatic compounds resist addition reactions because of their “aromaticity”: the possession of a closed loop (sextet) of electrons which imparts extreme stability. These compounds can react with bromine but require the presence of a catalyst such as iron fillings or aluminum chloride. 2. Reaction with concentrated sulfuric acid. Alkenes react with cold concentrated sulfuric acid by addition. Alkyl sulfonic acids form as products and are soluble in H2SO4; subsequent water work-up results in an “-OH” on the more substituted carbon (as demonstrated in lecture).
+ H2SO4H2O
OH
Saturated hydrocarbons are unreactive (additions are not possible); alkynes react slowly and require a catalyst (H2SO4); due to their inherent stability, aromatic compounds are also unreactive. 3. Reaction with potassium permanganate. Dilute or alkaline solutions of KMnO4 oxidize unsaturated compounds. Alkanes and aromatic compounds are generally unreactive. Evidence that a reaction has occurred is observed by the loss of the purple color of KMnO4 and the formation of the brown precipitate manganese dioxide, MnO2.
3 + 2KMnO4 + 4H2O 3 + 2MnO2 + 2KOH
Purple Brown
OH
OH

72
Note that the product formed (which contains two “-OH” groups) is called a glycol. Procedure Assume the organic compounds are highly flammable. Use only small quantities. Keep away from open flames. Assume the organic compounds are toxic and can be absorbed through the skin. Avoid contact; wash if any chemical spills on your person. Handle concentrated sulfuric carefully. Flush with water if any spills on your person. Potassium permanganate and bromine are toxic; bromine solutions are also corrosive. Although the solutions are diluted, they may cause burns to the skin. Wear gloves when working with these chemicals. Also consider the following: 1. The hydrocarbons hexane, cyclohexene, and toluene (alkane, alkene and aromatic,
respectively) are available in dropper bottles. 2. The reagents 1% Br2 in cyclohexane, 1% aqueous KMnO4, and concentrated H2SO4
are available in dropper bottles. 3. Unknowns are in dropper bottles labeled A, B, and C. They may include an alkane, an
alkene, and/or an aromatic compound. 4. Test tubes will be suitable for all the tests; mix thoroughly. 5. Dispose of all organic wastes as directed by the instructor. Do not pour them into the sink! Physical Properties of Hydrocarbons 1. Water solubility of hydrocarbons. Label six test tubes with the name of the substance
to be tested. Place into each test tube 5 drops of the appropriate hydrocarbon: hexane, cyclohexene, toluene, unknown A, unknown B, and unknown C. Add about 5 drops of water dropwise into each test tube. Water is a polar solvent. Is there any separation of components? Which component is on the bottom; which component is on the top? Mix the contents. What happens when the contents are allowed to settle? What do you conclude about the density of the hydrocarbon? Is the hydrocarbon more dense than water or less dense than water? Record your observations. Save these solutions for comparison with the next part.
2. Solubility of hydrocarbons in ligroin. Label six test tubes with the name of the
substance to be tested. Place into each test tube 5 drops of the appropriate hydrocarbons: hexane, cyclohexene, toluene, unknown A, unknown B, and unknown C. Add about 5 drops of ligroin dropwise into each test tube. Ligroin is a nonpolar solvent. Is there a separation of components? Is there a bottom layer and a top layer? Mix the contents. Is there any change in the appearance of the contents before and after mixing? Compare these test tubes with those from the previous part. Record your observations. Can you make any conclusion about the density of the hydrocarbons from what you actually see?
Chemical Properties of Hydrocarbons 1. Reaction with bromine. Results provided on data sheet.
73
2. Reaction with KMnO4. Label six clean, dry test tubes with the name of the substance to be tested. Place into each test tube 5 drops of the appropriate hydrocarbon: hexane, cyclohexene, toluene, unknown A, unknown B, and unknown C. Carefully add (dropwise) 1% aqueous KMnO4 solution; after each drop, shake to mix the solutions. Keep count of the number of the drops needed to have the color of the permanganate solution persist; do not add more than 10 drops. Record your observations.
3. Reaction with concentrated H2SO4. Label six clean, dry test tubes with the name of
the substance to be tested. Place into each test tube 5 drops of the appropriate hydrocarbon: hexane, cyclohexene, toluene, unknown A, unknown B, and unknown C. Place all of the test tubes in an ice bath. Wear gloves and carefully add (with shaking) 3 drops of cold, concentrated sulfuric acid to each test tube. Note whether the solution has become homogeneous or whether a color is produced. (The evolution of heat, the formation of a homogeneous solution, or the appearance of a color is evidence that a reaction has occurred.) Record your observations.
4. Unknowns: By comparing the observations you made for your unknowns with that of
the known hydrocarbons, you can identify unknowns A, B, and C. Record their identities on your data sheet.
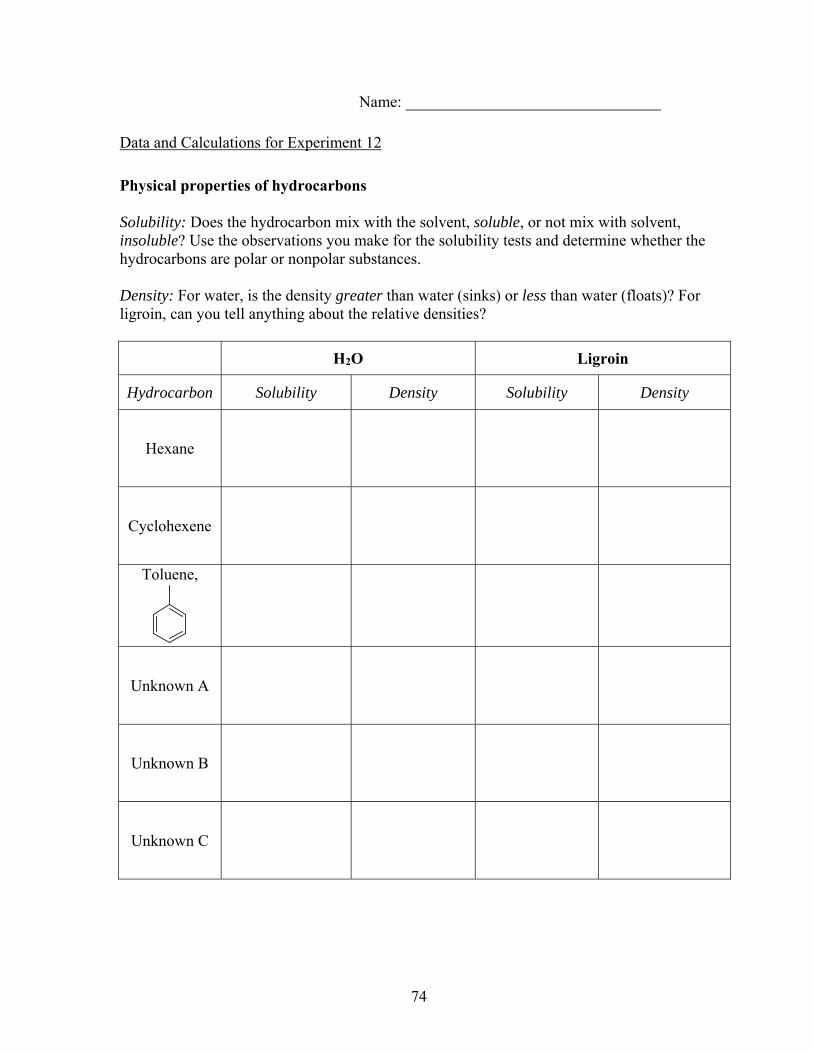
74
Name: ________________________________
Data and Calculations for Experiment 12 Physical properties of hydrocarbons Solubility: Does the hydrocarbon mix with the solvent, soluble, or not mix with solvent, insoluble? Use the observations you make for the solubility tests and determine whether the hydrocarbons are polar or nonpolar substances. Density: For water, is the density greater than water (sinks) or less than water (floats)? For ligroin, can you tell anything about the relative densities?
H2O Ligroin
Hydrocarbon Solubility Density Solubility Density
Hexane
Cyclohexene
Toluene,
Unknown A
Unknown B
Unknown C
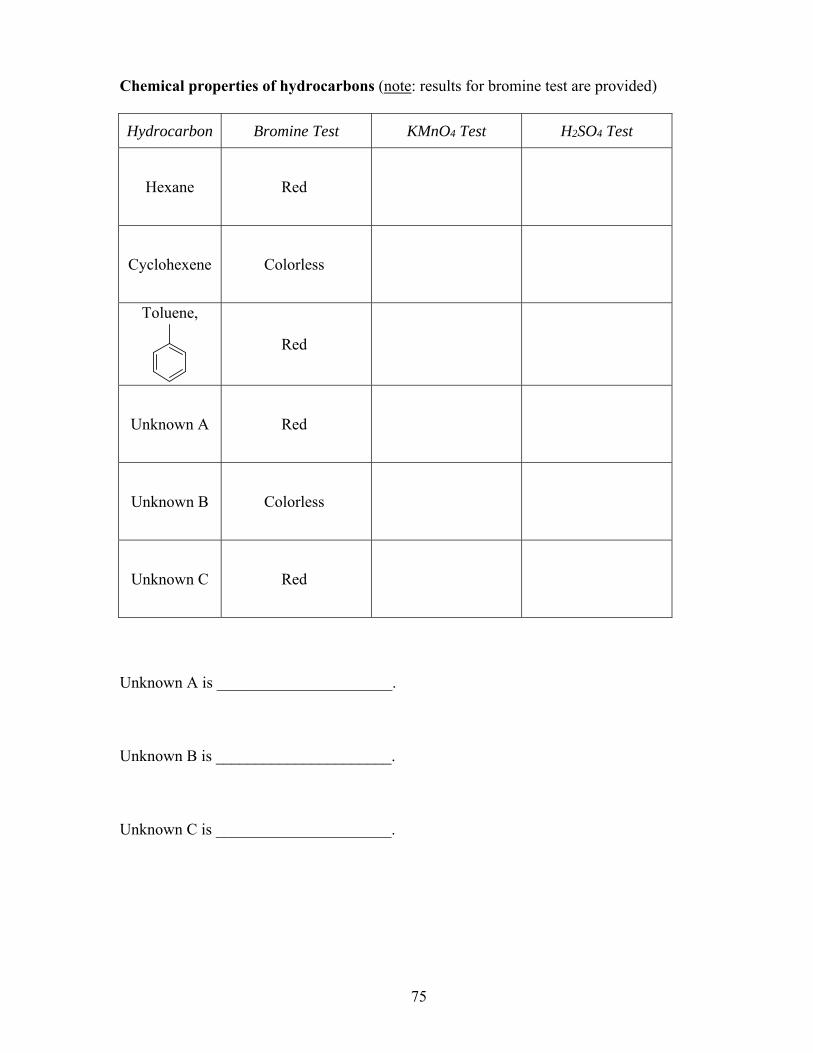
75
Chemical properties of hydrocarbons (note: results for bromine test are provided)
Hydrocarbon Bromine Test KMnO4 Test H2SO4 Test
Hexane Red
Cyclohexene Colorless
Toluene,
Red
Unknown A Red
Unknown B Colorless
Unknown C Red
Unknown A is ______________________. Unknown B is ______________________. Unknown C is ______________________.
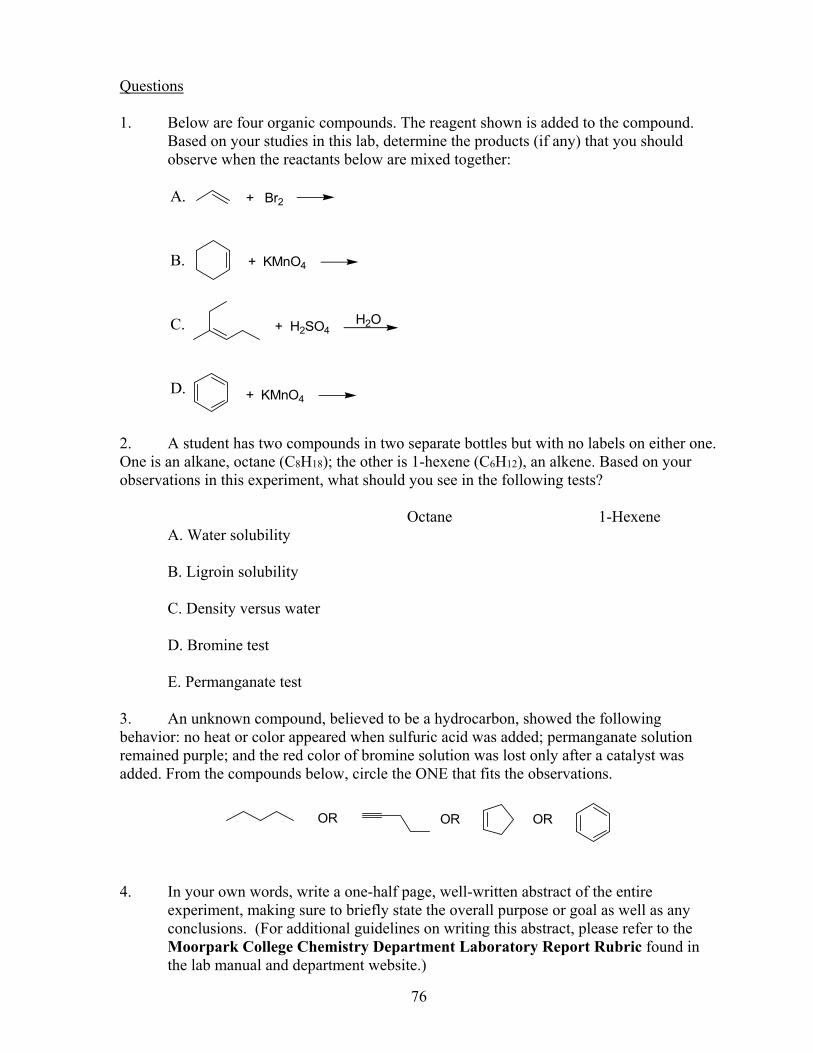
76
Questions 1. Below are four organic compounds. The reagent shown is added to the compound. Based on your studies in this lab, determine the products (if any) that you should observe when the reactants below are mixed together:
+ Br2
+ KMnO4
+ H2SO4H2O
+ KMnO4
A.
B.
C.
D.
2. A student has two compounds in two separate bottles but with no labels on either one. One is an alkane, octane (C8H18); the other is 1-hexene (C6H12), an alkene. Based on your observations in this experiment, what should you see in the following tests? Octane 1-Hexene A. Water solubility B. Ligroin solubility C. Density versus water D. Bromine test E. Permanganate test 3. An unknown compound, believed to be a hydrocarbon, showed the following behavior: no heat or color appeared when sulfuric acid was added; permanganate solution remained purple; and the red color of bromine solution was lost only after a catalyst was added. From the compounds below, circle the ONE that fits the observations.
OROR OR
4. In your own words, write a one-half page, well-written abstract of the entire experiment, making sure to briefly state the overall purpose or goal as well as any conclusions. (For additional guidelines on writing this abstract, please refer to the Moorpark College Chemistry Department Laboratory Report Rubric found in the lab manual and department website.)
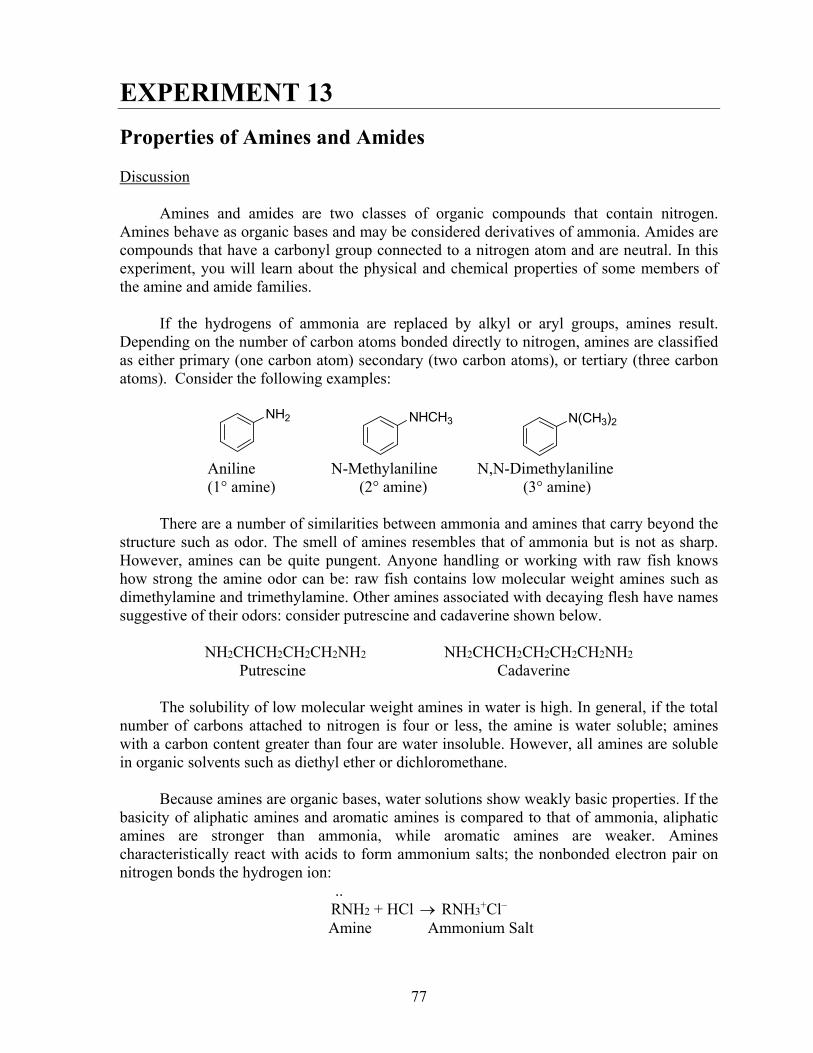
77
EXPERIMENT 13
Properties of Amines and Amides Discussion
Amines and amides are two classes of organic compounds that contain nitrogen. Amines behave as organic bases and may be considered derivatives of ammonia. Amides are compounds that have a carbonyl group connected to a nitrogen atom and are neutral. In this experiment, you will learn about the physical and chemical properties of some members of the amine and amide families.
If the hydrogens of ammonia are replaced by alkyl or aryl groups, amines result.
Depending on the number of carbon atoms bonded directly to nitrogen, amines are classified as either primary (one carbon atom) secondary (two carbon atoms), or tertiary (three carbon atoms). Consider the following examples:
NH2 NHCH3 N(CH3)2
Aniline N-Methylaniline N,N-Dimethylaniline (1° amine) (2° amine) (3° amine)
There are a number of similarities between ammonia and amines that carry beyond the
structure such as odor. The smell of amines resembles that of ammonia but is not as sharp. However, amines can be quite pungent. Anyone handling or working with raw fish knows how strong the amine odor can be: raw fish contains low molecular weight amines such as dimethylamine and trimethylamine. Other amines associated with decaying flesh have names suggestive of their odors: consider putrescine and cadaverine shown below.
NH2CHCH2CH2CH2NH2 NH2CHCH2CH2CH2CH2NH2
Putrescine Cadaverine The solubility of low molecular weight amines in water is high. In general, if the total
number of carbons attached to nitrogen is four or less, the amine is water soluble; amines with a carbon content greater than four are water insoluble. However, all amines are soluble in organic solvents such as diethyl ether or dichloromethane.
Because amines are organic bases, water solutions show weakly basic properties. If the
basicity of aliphatic amines and aromatic amines is compared to that of ammonia, aliphatic amines are stronger than ammonia, while aromatic amines are weaker. Amines characteristically react with acids to form ammonium salts; the nonbonded electron pair on nitrogen bonds the hydrogen ion:
.. RNH2 + HCl RNH3
+Cl–
Amine Ammonium Salt

78
If an amine is insoluble, reaction with an acid produces a water-soluble salt. Because ammonium salts are water soluble, many drugs containing amines are prepared as ammonium salts. After working with fish in the kitchen, a convenient way to rid one’s hands of fish odor is to rub a freshly cut lemon over the hands. The citric acid found in the lemon reacts with the amines found on the fish; a salt forms that can be easily rinsed away with water.
Amides are carboxylic acid derivatives. The amide group is recognized by the nitrogen
connected to the carbonyl group. Amides are neutral compounds. Under suitable conditions, amide formation can take place between an amine and a carboxylic acid. Along with ammonia, primary and secondary amines yield amides with carboxylic acids. For example:
CH3NH2 +H3C OH
Oheat
H3C NH
CH3
O+ H2O
Hydrolysis of amides can take place in either acid or base. Primary amides hydrolyze
in acid to ammonium salts and carboxylic acids. Neutralization of the acid and ammonium salts releases ammonia, which can be detected by odor or by litmus.
R OH
O
R NH2
O+ HCl + H2O + NH4Cl
NH4Cl + NaOH → NH3 + NaCl + H2O
Secondary and tertiary amides would release the corresponding alkyl ammonium salts which, when neutralized, would yield the amine.
In base, primary amides hydrolyze to carboxylic acid salts and ammonia. The
presence of ammonia (or amine from corresponding amides) can be detected similarly by odor or litmus. The carboxylic acid would be generated by neutralization with acid.
R NH2
O
+ HCl
+ NaOH
R OH
O+ NaCl
R O
O
Na+ + NH3
R O
O
Na+

79
Procedure Caution: Amines are toxic chemicals. Avoid excessive inhaling of the vapors and use gloves to avoid direct skin contact. Anilines are more toxic than aliphatic amines and are readily absorbed through the skin. Wash any amine or aniline spill with large quantities of water. Diethyl ether is extremely flammable. Be certain there are NO open flames in the immediate area. Discard all solutions in properly labeled organic waste containers.
Properties of Amines 1. Place 5 drops of liquid or 0.1 g of solid from the compounds listed in the following table
into labeled clean, dry test tubes (100 x 13 mm).
Test Tube No Nitrogen Compound 1 6 M NH3 2 Triethylamine 3 Aniline 4 N,N - Dimethylaniline 5 Acetamide
2. Carefully note the odors of each compound. Do not inhale deeply. Merely wave your hand across the mouth of the test tube toward your nose (i.e., wafting motion) in order to note the odor. Record your observations on your data sheet.
3. Add 2 mL of distilled water to each of the labeled test tubes. Mix thoroughly by sharply tapping the test tube with your finger. Note on the data sheet whether the amines are soluble or insoluble.
4. Take a glass rod and test each solution for its pH. Carefully dip one end of the glass rod into a solution and touch a piece of pH paper. Between each test, be sure to clean and dry the glass rod. Record the pH by comparing the color of the paper with the chart on the dispenser.
5. Carefully add 2 mL of 6 M HCl to each test tube. Mix thoroughly by sharply tapping the test tube with your finger. Compare the odor and solubility of this solution with previous observations.
6. Place 5 drops of liquid or 0.1 g of solid from the compounds listed in the table into labeled clean, dry test tubes (100 x 13 mm). Add 2 mL of diethyl ether to each test tube. Stopper with a cork and mix thoroughly by shaking. Record the observed solubilities.
7. IN THE HOOD, carefully place a drop of triethylamine and a drop of concentrated HCl on a watch glass, side by side without touching. Record your observations.
Hydrolysis of Acetamide 1. Dissolve 0.5 g of acetamide in 5 mL of 6 M H2SO4 in a large test tube (150 x 18 mm).
Heat the solution in a boiling water bath for 5 min. 2. Hold a small strips of moist pH paper just inside the mouth of the test tube WITHOUT
touching the sides, note any changes in color; record the pH reading. Remove the test tube from the water bath, holding it with a test tube holder. Carefully note any odor.
3. Place the test tube in an ice water bath until cool to the touch. Now carefully add, dropwise with shaking, 6 M NaOH to the cool solution until basic. (You will need more than 7 mL of base). Hold a piece of moist pH paper just inside the mouth of the test tube without touching the sides. Record the pH reading. Carefully note any odor.

80
Name:_____________________________
Data and Calculations for Experiment 13 Properties of amines Odor Solubility pH Original Soln with HCl H2O Ether HCl H2O 6 M NH3
Triethylamine
Aniline
N,N – Dimethylaniline
Acetamide
Triethylamine and concentrated hydrochloric acid observation: Write the chemical equation for the reaction of triethylamine with concentrated hydrochloric acid:
Hydrolysis of acetamide, H3CC
NH2
O
Solution pH Reading Odor Noted
1. Acid
2. Base

81
Questions 1. Effective mosquito repellents contain DEET (N,N–diethyl–3–methylbenzamide). If you
were to synthesize this compound, what carboxylic acid and amine would you begin with?
N
O
DEET
2. Metadone, a narcotic analgesic shown below, is dispensed as its hydrochloride salt.
Explain the usefulness of the salt rather than the amine.
O
N
Metadone
3. Nicotine is an alkaloid, meaning base–like. What structural feature is present in the
molecule that would make it react as a base?
N
N
Nicotine
4. Write the equations that account for what happens in the hydrolysis of the acetamide
solution in (A) acid and in (B) base. See the data sheet for the structure of acetamide. A. B.
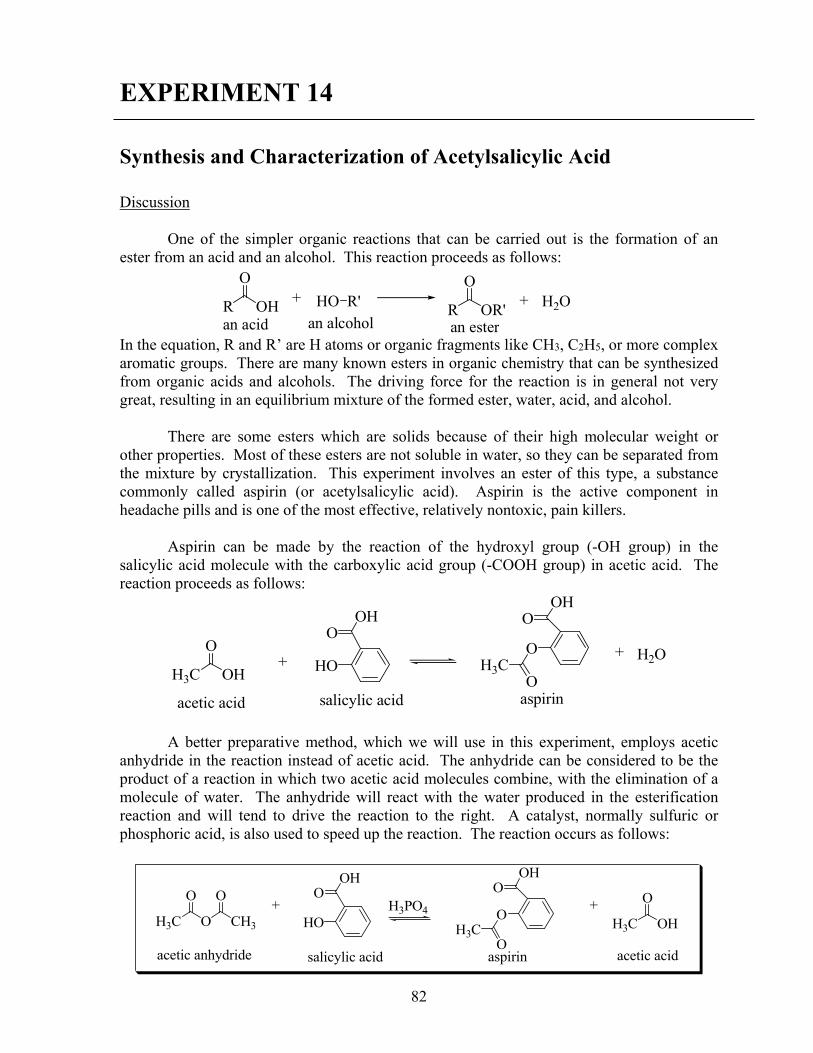
82
EXPERIMENT 14
Synthesis and Characterization of Acetylsalicylic Acid Discussion One of the simpler organic reactions that can be carried out is the formation of an ester from an acid and an alcohol. This reaction proceeds as follows:
In the equation, R and R’ are H atoms or organic fragments like CH3, C2H5, or more complex aromatic groups. There are many known esters in organic chemistry that can be synthesized from organic acids and alcohols. The driving force for the reaction is in general not very great, resulting in an equilibrium mixture of the formed ester, water, acid, and alcohol. There are some esters which are solids because of their high molecular weight or other properties. Most of these esters are not soluble in water, so they can be separated from the mixture by crystallization. This experiment involves an ester of this type, a substance commonly called aspirin (or acetylsalicylic acid). Aspirin is the active component in headache pills and is one of the most effective, relatively nontoxic, pain killers. Aspirin can be made by the reaction of the hydroxyl group (-OH group) in the salicylic acid molecule with the carboxylic acid group (-COOH group) in acetic acid. The reaction proceeds as follows:
H3C OH
O+ HO
OHO
+ H2O
acetic acid salicylic acid aspirin
OHO
OH3C
O
A better preparative method, which we will use in this experiment, employs acetic anhydride in the reaction instead of acetic acid. The anhydride can be considered to be the product of a reaction in which two acetic acid molecules combine, with the elimination of a molecule of water. The anhydride will react with the water produced in the esterification reaction and will tend to drive the reaction to the right. A catalyst, normally sulfuric or phosphoric acid, is also used to speed up the reaction. The reaction occurs as follows:
OHO
OH3C
O
H3C O CH3
O O
HO
OHO
salicylic acid aspirin
+ +H3C OH
O
acetic acidacetic anhydride
H3PO4
R OH
O+ HO R' R OR'
O+ H2O
an acid an alcohol an ester

83
The aspirin you will prepare in this experiment is somewhat impure and should certainly not be taken internally, even if the experiment gives you a bad headache. We will attempt to purify the aspirin via recrystallization with ethanol. If any salicylic acid remains unreacted, its presence can be detected with a 1% iron(III) chloride solution. Salicylic acid has a phenol group in the molecule. The iron(III) chloride gives a violet color with any molecule possessing a phenol group. Notice the aspirin no longer has the phenol group. Thus, a pure sample of aspirin will not give a purple color with 1% iron(III) chloride solution. Wear gloves and safety goggles! Both phosphoric acid and acetic anhydride are corrosive! They will burn skin! Salicylic acid is also a skin irritant. Procedure Prepare a 250 mL beaker of approximately 1/4 full of water. Place it on a hot plate and heat to 80 ºC. Weigh out approximately 500 mg salicylic acid in a 25 mL Erlenmeyer flask. Perform the next operation in the fume hood: pipet 1.0 mL of acetic anhydride and pour it into the flask in such a way as to wash any crystals of salicylic acid on the walls down to the bottom. Add 5 drops of 85% phosphoric acid to the mixture to serve as a catalyst. Clamp the flask in the water bath, and immerse it in the hot water bath for 10 minutes, stirring the liquid in the flask occasionally with a stirring rod. Once the reaction is complete, remove the flask from the water bath, and CAUTIOUSLY add 10 – 20 drops of water to the mixture to destroy any excess acetic anhydride. There will be some hot acetic acid vapor evolved as a result of the decomposition of any unreacted acetic anhydride. Let the flask cool for a few minutes in air, during which time crystals of aspirin should begin to form. Put the flask in an ice bath to hasten crystallization and increase the yield of product. If crystals are slow to appear, it may be helpful to scratch the inside of the flask with a glass rod. Collect the aspirin by vacuum filtration. Pour distilled water over the crystals; repeat the washing process, and then draw air through the funnel for a few minutes to help dry the crystals. Determine the mass of your impure aspirin. To purify your synthesized aspirin, transfer it to a 10 mL beaker and add 2 mL of ethyl alcohol using a plastic pipet. Warm the solution to 60 ºC. Cover the solution and allow it to cool undisturbed to room temperature. Then set the beaker in an ice bath and once again scratch the inside of the flask with a glass rod to induce recrystallization. Collect the purified aspirin by vacuum filtration, and let the crystals dry for a few minutes before weighing them. Determine the mass of your dry purified aspirin. Finally, we will test the purity of your synthesized aspirin with 1% iron(III) chloride solution and compare with a commercial aspirin and salicylic acid. Label three test tubes; place a few crystals of salicylic acid into test tube no. 1, a small sample of your aspirin into test tube no. 2, and a small sample of a crushed commercial aspirin into test tube no. 3. Add 5 mL of DI water to each test tube and swirl to dissolve the crystals. Add 10 drops of 1% aqueous iron(III) chloride to each test tube. Record your results. The formation of a purple color indicates the presence of salicylic acid. The intensity of the color qualitatively tells how much salicylic acid is present.
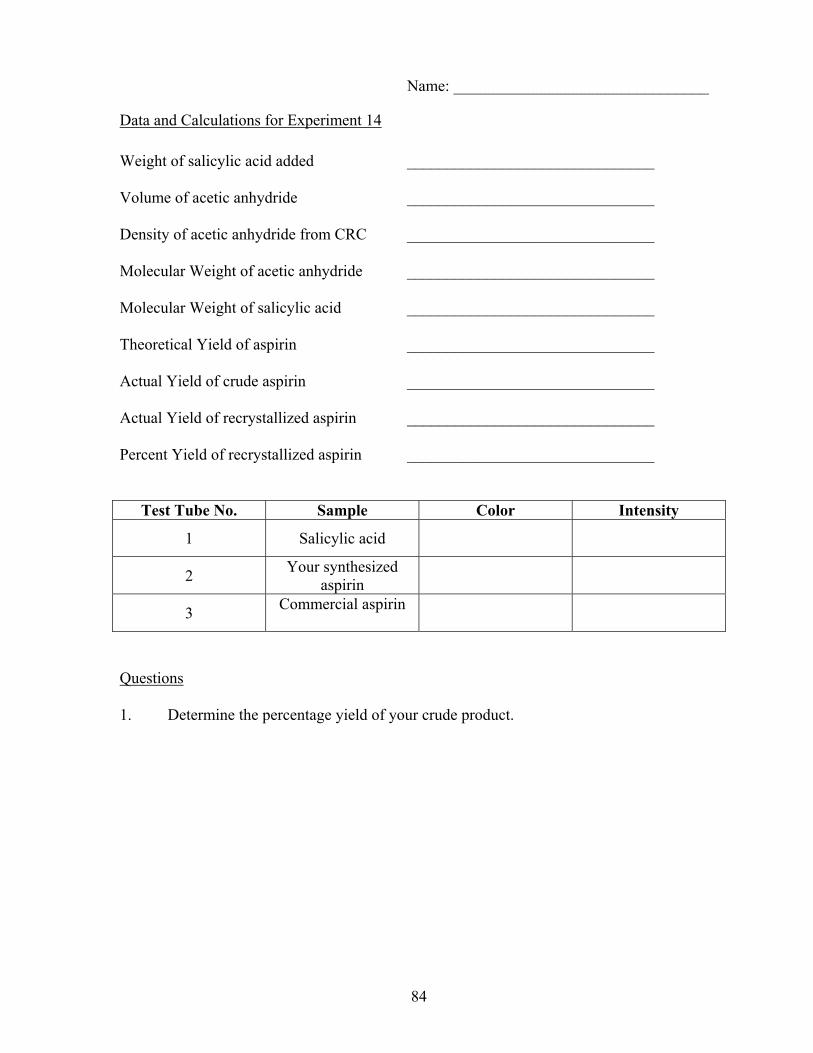
84
Name: ________________________________
Data and Calculations for Experiment 14
Weight of salicylic acid added _______________________________ Volume of acetic anhydride _______________________________ Density of acetic anhydride from CRC _______________________________ Molecular Weight of acetic anhydride _______________________________ Molecular Weight of salicylic acid _______________________________ Theoretical Yield of aspirin _______________________________ Actual Yield of crude aspirin _______________________________ Actual Yield of recrystallized aspirin _______________________________ Percent Yield of recrystallized aspirin _______________________________
Test Tube No. Sample Color Intensity
1 Salicylic acid
2 Your synthesized
aspirin
3 Commercial aspirin
Questions 1. Determine the percentage yield of your crude product.
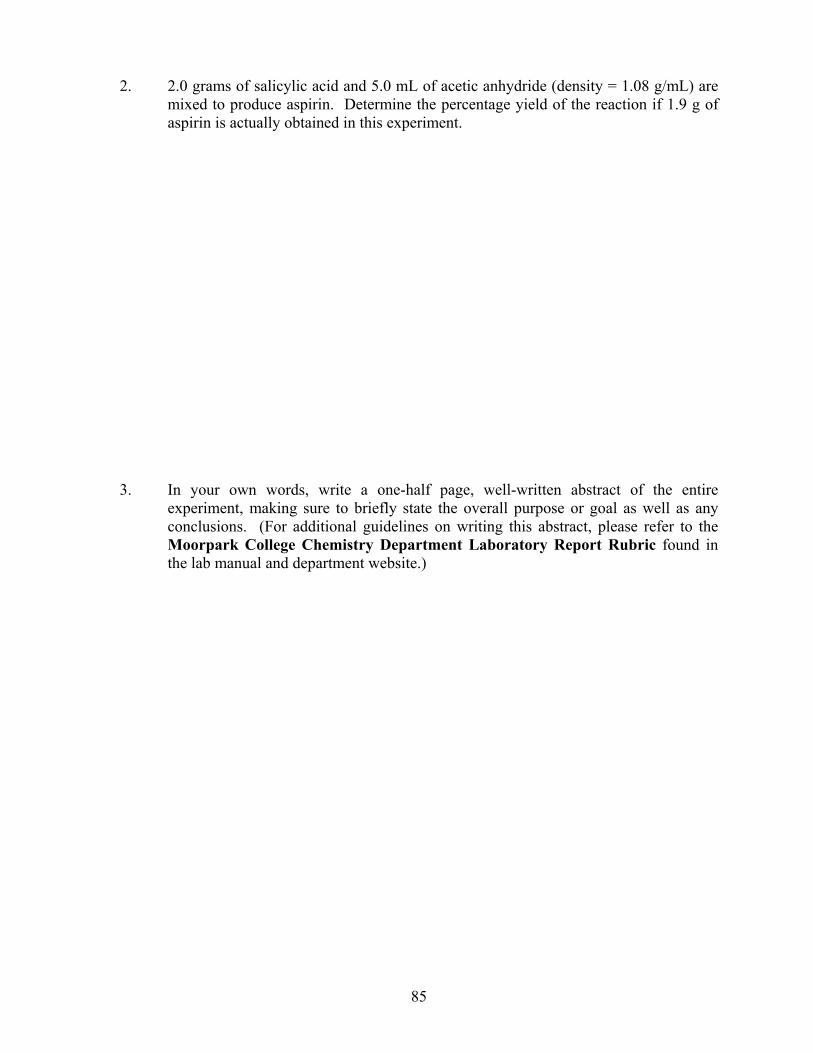
85
2. 2.0 grams of salicylic acid and 5.0 mL of acetic anhydride (density = 1.08 g/mL) are mixed to produce aspirin. Determine the percentage yield of the reaction if 1.9 g of aspirin is actually obtained in this experiment.
3. In your own words, write a one-half page, well-written abstract of the entire
experiment, making sure to briefly state the overall purpose or goal as well as any conclusions. (For additional guidelines on writing this abstract, please refer to the Moorpark College Chemistry Department Laboratory Report Rubric found in the lab manual and department website.)
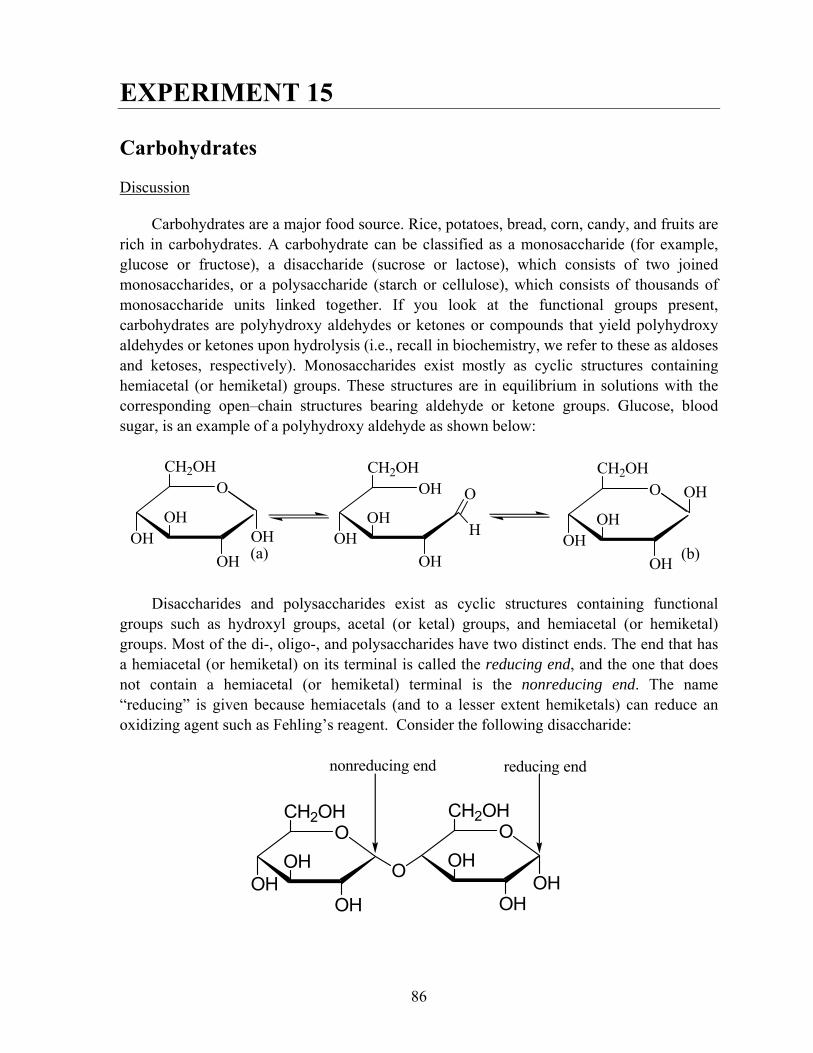
86
EXPERIMENT 15 Carbohydrates Discussion
Carbohydrates are a major food source. Rice, potatoes, bread, corn, candy, and fruits are rich in carbohydrates. A carbohydrate can be classified as a monosaccharide (for example, glucose or fructose), a disaccharide (sucrose or lactose), which consists of two joined monosaccharides, or a polysaccharide (starch or cellulose), which consists of thousands of monosaccharide units linked together. If you look at the functional groups present, carbohydrates are polyhydroxy aldehydes or ketones or compounds that yield polyhydroxy aldehydes or ketones upon hydrolysis (i.e., recall in biochemistry, we refer to these as aldoses and ketoses, respectively). Monosaccharides exist mostly as cyclic structures containing hemiacetal (or hemiketal) groups. These structures are in equilibrium in solutions with the corresponding open–chain structures bearing aldehyde or ketone groups. Glucose, blood sugar, is an example of a polyhydroxy aldehyde as shown below:
OH
OH
OH
OH
CH2OH
O
H
O
OH
OH
OH
CH2OH
OH
O
OH
OH
OH
CH2OH
OH
(a) (b)
Disaccharides and polysaccharides exist as cyclic structures containing functional
groups such as hydroxyl groups, acetal (or ketal) groups, and hemiacetal (or hemiketal) groups. Most of the di-, oligo-, and polysaccharides have two distinct ends. The end that has a hemiacetal (or hemiketal) on its terminal is called the reducing end, and the one that does not contain a hemiacetal (or hemiketal) terminal is the nonreducing end. The name “reducing” is given because hemiacetals (and to a lesser extent hemiketals) can reduce an oxidizing agent such as Fehling’s reagent. Consider the following disaccharide:
O
OH
OH
CH2OH
OHO
O
OH
OH
CH2OH
OH
reducing endnonreducing end
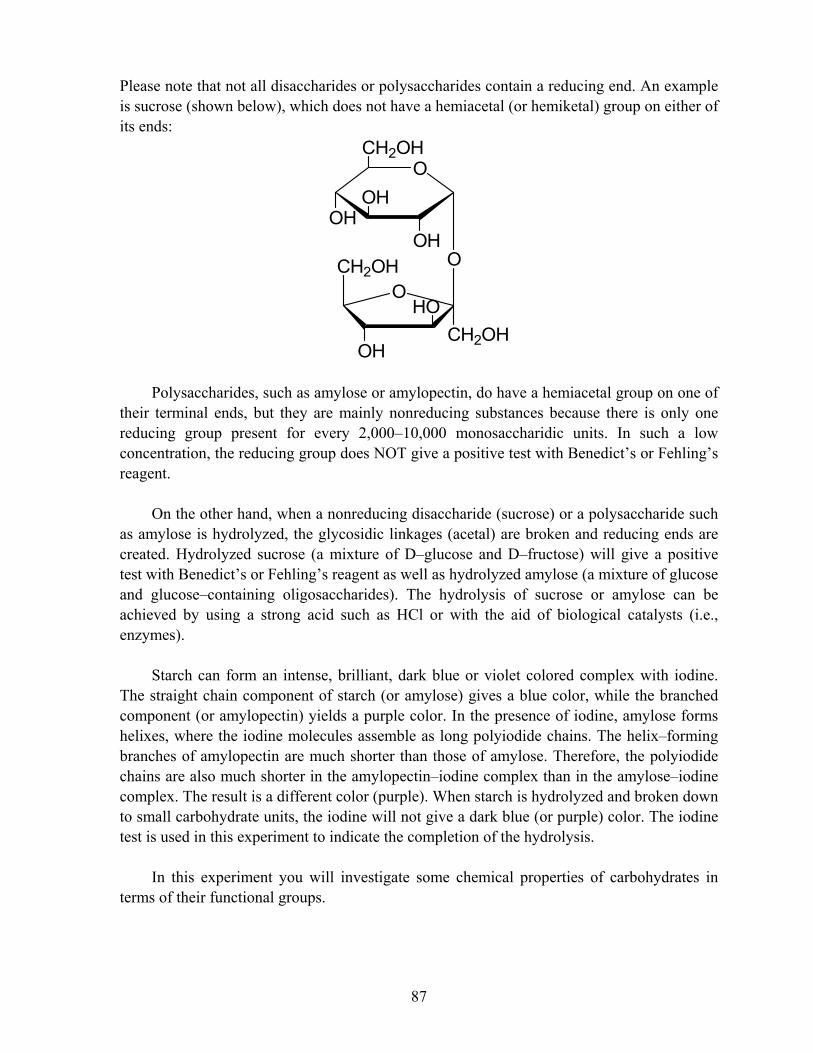
87
Please note that not all disaccharides or polysaccharides contain a reducing end. An example is sucrose (shown below), which does not have a hemiacetal (or hemiketal) group on either of its ends:
CH2OH
OCH2OH
OH
HOO
O
OHOH
OH
CH2OH
Polysaccharides, such as amylose or amylopectin, do have a hemiacetal group on one of
their terminal ends, but they are mainly nonreducing substances because there is only one reducing group present for every 2,000–10,000 monosaccharidic units. In such a low concentration, the reducing group does NOT give a positive test with Benedict’s or Fehling’s reagent.
On the other hand, when a nonreducing disaccharide (sucrose) or a polysaccharide such
as amylose is hydrolyzed, the glycosidic linkages (acetal) are broken and reducing ends are created. Hydrolyzed sucrose (a mixture of D–glucose and D–fructose) will give a positive test with Benedict’s or Fehling’s reagent as well as hydrolyzed amylose (a mixture of glucose and glucose–containing oligosaccharides). The hydrolysis of sucrose or amylose can be achieved by using a strong acid such as HCl or with the aid of biological catalysts (i.e., enzymes).
Starch can form an intense, brilliant, dark blue or violet colored complex with iodine.
The straight chain component of starch (or amylose) gives a blue color, while the branched component (or amylopectin) yields a purple color. In the presence of iodine, amylose forms helixes, where the iodine molecules assemble as long polyiodide chains. The helix–forming branches of amylopectin are much shorter than those of amylose. Therefore, the polyiodide chains are also much shorter in the amylopectin–iodine complex than in the amylose–iodine complex. The result is a different color (purple). When starch is hydrolyzed and broken down to small carbohydrate units, the iodine will not give a dark blue (or purple) color. The iodine test is used in this experiment to indicate the completion of the hydrolysis.
In this experiment you will investigate some chemical properties of carbohydrates in
terms of their functional groups.

88
Reducing and Nonreducing Properties of Carbohydrates 1. Aldoses (polyhydroxy aldehydes). All aldoses are reducing sugars because they contain
free aldehyde functional groups. The aldehydes are oxidized by mild oxidizing agents (e.g., Benedict’s or Fehling’s reagent) to the corresponding carboxylates. For example:
R-CHO + 2Cu+2 NaOH
R-COO-Na+ + Cu2O(s) (from Fehling’s reagent) (red precipitate)
2. Ketoses (polyhydroxy ketones). All ketoses are reducing sugars because they have a
ketone functional group next to an alcohol functional group.
3. Hemiacetal functional group (potential aldehydes). Carbohydrates with hemiacetal functional groups can reduce mild oxidizing agents such as Fehling’s reagent because hemiacetals can easily form aldehydes through mutarotation.
Hydrolysis of Acetal Groups
Disaccharides and polysaccharides can be converted into monosaccharides by hydrolysis. For example:
Lactose + H2O catalyst D-galactose + D-glucose
Procedure Reducing or Nonreducing Carbohydrates 1. Place approximately 2 mL (approximately 40 drops) of Fehling’s solution (20 drops each
of solution part A and solution part B) into each of five labeled test tubes. 2. Add 10 drops of each of the following carbohydrates to the corresponding test tubes as
shown in the following table.
Test Tube No Name of Carbohydrate 1 Glucose 2 Fructose 3 Sucrose 4 Lactose 5 Starch
3. Place the test tubes in a boiling water bath for 5 min. A 600 mL (or any available large)
beaker containing about 200 mL of tap water and a few boiling stones is used as the bath. Record your results on your data sheet. Which of those carbohydrates are reducing carbohydrates? Caution: Remember to use boiling stones; they prevent bumping. Handle the hot test tubes with a test tube holder and the hot beaker with beaker tongs.

89
Hydrolysis of Carbohydrates Hydrolysis of sucrose (acid versus base) 1. Place 3 mL of 2% sucrose solution in each of two labeled test tubes. To the first test tube
(#1), add 3 mL of water and 3 drops of dilute sulfuric acid solution (3 M H2SO4). To the second test tube (#2), add 3 mL of water and 3 drops of dilute sodium hydroxide solution (3 M NaOH). Caution: To avoid burns from the acid or the base, use gloves when dispensing these reagents.
2. Heat the test tubes in a boiling water bath for about 5 min. Then allow both solutions to cool to room temperature by carefully placing in a test tube rack.
3. To the contents of test tube #1, add dilute sodium hydroxide solution (3 M NaOH) (about ten drops) until red litmus paper turns blue. When using litmus paper, do NOT place the litmus into your solution; instead, use your glass stirring rod, dipped into the test tube solution, to spot the litmus.
4. Test a few drops of each of the two solutions (test tubes #1 and #2) with Fehling’s reagent following the procedure that is described for carbohydrates above. Record your results on your data sheet.
Acid–catalyzed hydrolysis of starch 1. Place 5.0 mL of starch solution in a 150 x 15 – mm test tube and add 1.0 mL of dilute
sulfuric acid (3 M H2SO4). Mix it by gently shaking the test tube. Heat the solution in a boiling water bath for about 5 min.
2. Using a clean medicine dropper, transfer about 3 drops of the starch solution into a white spot plate and then add 2 drops of iodine solution. Observe the color of the solution. If the solution gives a positive test with iodine solution (the solution should turn blue), the hydrolysis is not complete and you should continue heating.
3. Transfer about 3 drops of the boiling solution at 5 min. intervals for an iodine test (Note: Rinse the medicine dropper very thoroughly before each test). When the solution no longer gives the characteristic blue color with iodine solution, stop heating and record the time needed for the completion of hydrolysis on the data sheet.

90
Name:_____________________________
Data and Calculations for Experiment 15 Reducing or nonreducing carbohydrates
Test Tube No. Substance Color Observation Reducing or Nonreducing
Carbohydrates
1 Glucose
2 Fructose
3 Sucrose
4 Lactose
5 Starch
Hydrolysis of carbohydrates
Sample Hydrolysis of sucrose (acid versus base catalysis)
Condition of Hydrolysis Color Observation
Fehling’s Test (positive or negative)
1 Acidic (H2SO4)
2 Basic (NaOH)

91
Questions 1. How does the iodine test distinguish between amylose and amylopectin?
2. Why is sucrose a nonreducing sugar? Identify the glycosidic linkage present. 3. How can you tell when the hydrolysis of starch is complete? Why does the test work
this way? What is the monosaccharide that results at the end? 4. Why does amylose give a negative test with Fehling’s solution?
Sample Acid–catalyzed hydrolysis of starch
Heating Time (min) Color
Observation Iodine Test
(positive or negative)
1 5
2 10
3 15
4 20
5 25
6 30
92
5. In your own words, write a logical, coherent conclusion which demonstrates a thorough working knowledge and understanding of important concepts and underlying chemical principles pertinent to this experiment, forms appropriate conclusions based on interpretations of results, includes applications of and improvements in the experiment, and demonstrates accountability by providing justification for any errors. If additional space is needed, please use the back of this page. (For additional guidelines on writing this conclusion, please refer to the Moorpark College Chemistry Department Laboratory Report Rubric found in the lab manual and department website.)
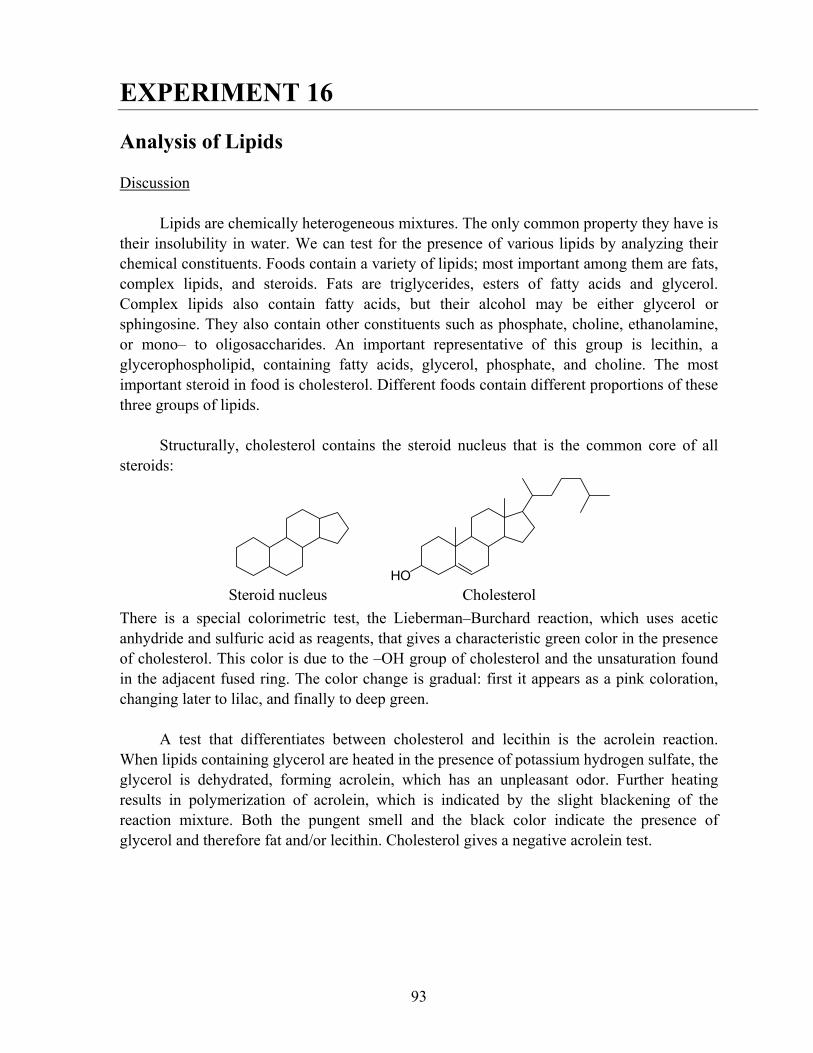
93
EXPERIMENT 16
Analysis of Lipids Discussion
Lipids are chemically heterogeneous mixtures. The only common property they have is their insolubility in water. We can test for the presence of various lipids by analyzing their chemical constituents. Foods contain a variety of lipids; most important among them are fats, complex lipids, and steroids. Fats are triglycerides, esters of fatty acids and glycerol. Complex lipids also contain fatty acids, but their alcohol may be either glycerol or sphingosine. They also contain other constituents such as phosphate, choline, ethanolamine, or mono– to oligosaccharides. An important representative of this group is lecithin, a glycerophospholipid, containing fatty acids, glycerol, phosphate, and choline. The most important steroid in food is cholesterol. Different foods contain different proportions of these three groups of lipids.
Structurally, cholesterol contains the steroid nucleus that is the common core of all
steroids:
HO
Steroid nucleus Cholesterol There is a special colorimetric test, the Lieberman–Burchard reaction, which uses acetic anhydride and sulfuric acid as reagents, that gives a characteristic green color in the presence of cholesterol. This color is due to the –OH group of cholesterol and the unsaturation found in the adjacent fused ring. The color change is gradual: first it appears as a pink coloration, changing later to lilac, and finally to deep green.
A test that differentiates between cholesterol and lecithin is the acrolein reaction. When lipids containing glycerol are heated in the presence of potassium hydrogen sulfate, the glycerol is dehydrated, forming acrolein, which has an unpleasant odor. Further heating results in polymerization of acrolein, which is indicated by the slight blackening of the reaction mixture. Both the pungent smell and the black color indicate the presence of glycerol and therefore fat and/or lecithin. Cholesterol gives a negative acrolein test.
94
Procedure The Acrolein Test for Glycerol 1. Place 1 g of potassium hydrogen sulfate, KHSO4, in each of seven clean and dry test
tubes (100 x 13 mm). Label them 1 through 7. To the first test tube, add a few grains of pure lecithin; to test tube #2, add a few grains of cholesterol. To test tubes #3 - #6, add one separate drop (which measures approximately 0.1 g) of glycerol (to #3), corn oil (to #4), butter (to #5), and egg yolk (to #6). To the seventh test tube, add a few crystals of sucrose.
2. Set up your Bunsen burner near a hood. Caution: Perform this test near the hood due to the pungent odor of the acrolein. When asked to smell the test tubes, do not inhale the fumes directly. Smell the test tubes by moving them sideways under your nose or by wafting the vapors toward your nose with a cupped hand.
3. Gently heat each test tube, one at a time, over a Bunsen burner flame, shaking it continuously from side to side. When the mixture melts and slightly blackens, you will notice the evolution of fumes. Stop the heating. Carefully smell the test tubes; pay attention to the Caution above. A pungent odor, resembling burnt hamburgers, is a positive test for glycerol. Sucrose in the seventh test tube will also be dehydrated and give a black color. However, its smell is different and thus is not a positive test for acrolein. Do not overheat the test tubes, for the residue will become hard, making it difficult to clean the test tubes. Record your observations on your data sheet.
Lieberman–Burchard Test for Cholesterol 1. Take six clean and dry test tubes (150 x 18 mm). Label them 1 through 6. Place a few
grains of your cholesterol and lecithin (separately) in the first two test tubes. Similarly, add about 0.1 g samples of glycerol, corn oil, butter, and egg yolk (separately) to the other four test tubes.
2. Transfer 3 mL of chloroform and 1 mL of acetic anhydride to each test tube. Finally, carefully add 1 drop of concentrated sulfuric acid to each mixture. Mix the contents and record the color changes, if any. Wait 5 min. Record again the color of your solutions. Record your observations on your data sheet.
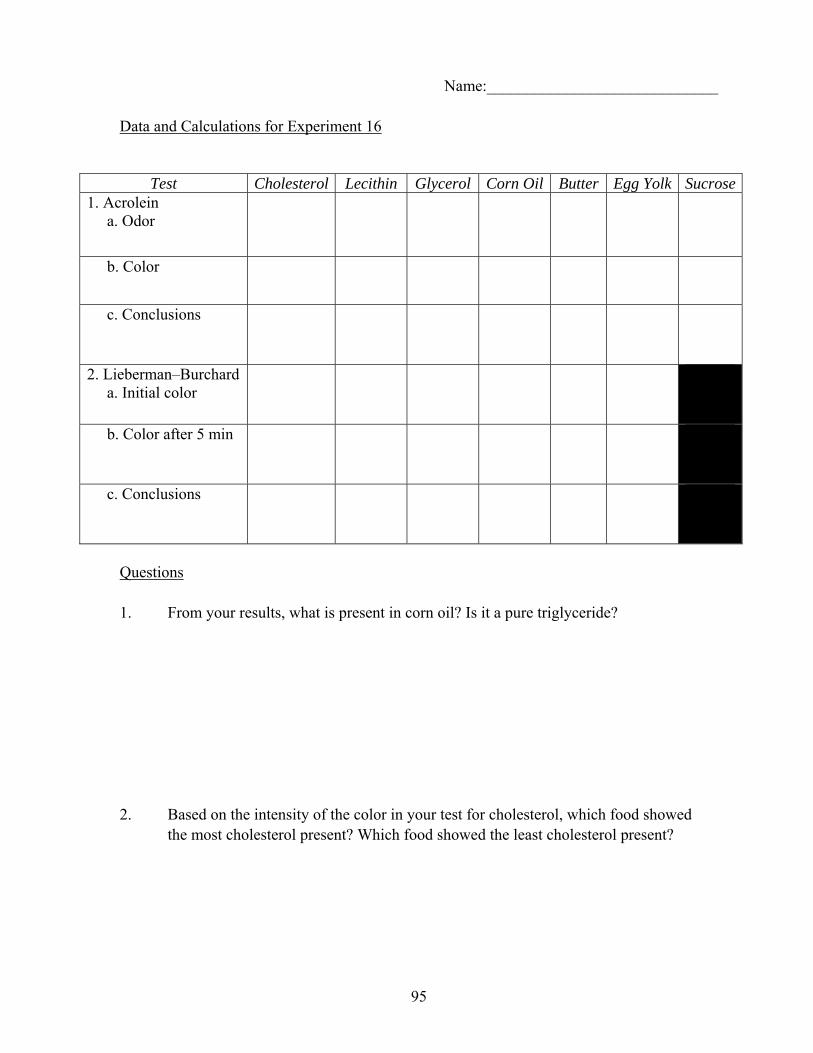
95
Name:_____________________________
Data and Calculations for Experiment 16
Test Cholesterol Lecithin Glycerol Corn Oil Butter Egg Yolk Sucrose1. Acrolein a. Odor
b. Color
c. Conclusions
2. Lieberman–Burchard a. Initial color
b. Color after 5 min
c. Conclusions
Questions 1. From your results, what is present in corn oil? Is it a pure triglyceride? 2. Based on the intensity of the color in your test for cholesterol, which food showed the most cholesterol present? Which food showed the least cholesterol present?

96
3. Consider the steroid structures shown below. Would any of these structures give a positive Lieberman-Burchard test? Briefly explain.
O
Progesterone Testosterone Estradiol
O
OOH
HO
OH
4. Cholesterol is an alcohol that can dehydrate to form a carbon-carbon double bond. Draw the structure cholesterol forms upon dehydration. Would this dehydration compound give a positive Lieberman-Burchard test? Briefly explain.

97
EXPERIMENT 17
Viscosity and Secondary Structure of DNA Discussion
In 1953, James Watson and Francis Crick proposed a three–dimensional structure of
DNA that is a cornerstone in the history of biochemistry and molecular biology. The double helix they proposed for the secondary structure of DNA gained immediate acceptance, partly because it explained all know facts about DNA, and partly because it provided a beautiful model for DNA replication.
In the DNA double helix, two polynucleotide chains run in opposite directions. This
means that at each end of the double helix, there is one 5’–OH and one 3’–OH terminal. The sugar phosphate backbone is on the outside, and the bases point inward. The bases are paired so that for each adenine (A) on one chain, a thymine (T) is aligned opposite it on the other chain. Each cytosine (C) on one chain has a guanine (G) aligned with it on the other chain. The AT and GC base pairs form hydrogen bonds with each other. The AT pair has two hydrogen bonds; the GC pair has three hydrogen bonds.
Most of the DNA in nature has the double helical secondary structure. The hydrogen
bonds between the base pairs provide the stability of the double helix. Under certain conditions, the hydrogen bonds are broken. During the replication process itself, this happens, and parts of the double helix unfold. Under separate conditions, the whole molecule unfolds, becomes single stranded, and assumes a random coil conformation. This can happen in denaturation processes aided by heat, extreme acidic or basic conditions, etc. Such a transformation is often referred to as helix–to–coil transition. There are a number of techniques that can monitor such a transition. One of the most sensitive is the measurement of viscosity of DNA solutions.
Viscosity is the resistance to flow of a liquid. Honey has a high viscosity and gasoline
a low viscosity at room temperature. In a liquid flow, the molecules must slide past each other. The resistance to flow comes from the interaction between the molecules as they slide past each other. The stronger this interaction, the greater the resistance and the higher the viscosity.
Figure 1: Surface area of interaction between molecules of different shapes Even more than the nature of the intermolecular interaction, the size and the shape of the molecules influence their viscosity. A large molecule has greater surface over which it interacts with other molecules than does a small molecule. Therefore, its viscosity is greater than that of a small molecule. If two molecules have the same size and the same interaction
Needle shape (ellipsoid) Spherical

98
forces but have different shapes, their viscosity will be different. For example, needle–shaped molecules, when aligned parallel by the flow of liquid, have greater surfaces of interaction than spherical molecules of the same molecular weight (see Figure 1). The needle–shaped molecule will have a higher viscosity than the spherical molecule. The DNA double helix is a rigid structure held together by hydrogen bonds. Its long axis along the helix exceeds by far its short axis perpendicular to it. Thus, the DNA double helix has large surface area and consequently high viscosity. When the hydrogen bonds are broken and the DNA molecule becomes single stranded, it assumes a random coil shape, which has much lower surface area and lower viscosity. Thus a helix–to–coil transition is accompanied by a drop in viscosity.
In practice, we can measure viscosity by the efflux time of a liquid in a viscometer (your instructor will demonstrate in lecture). PLEASE BE CAREFUL WHEN USING THESE VISCOMETERS; THEY ARE VERY DELICATE AND EXPENSIVE. The capillary viscometer is made of two bulbs connected by a tube in which the liquid must flow through a capillary tube. The capillary tube provides a laminary flow, in which concentric layers of the liquid slide past each other. Originally, the liquid is placed in the storage bulb. By applying suction above the capillary, the liquid is sucked up past the upper calibration mark. With a stopwatch in hand, the suction is released, and the liquid is allowed to flow under the force of gravity. The timing starts when the meniscus of the liquid hits the upper calibration mark. The timing ends when the meniscus of the liquid hits the lower calibration mark of the viscometer. The time elapsed between these two marks is the efflux time.
With dilute solutions such as the DNA in this experiment, the viscosity of the solution
is compared to the viscosity of the solvent. The efflux time of the solvent (aqueous buffer) is to, and that of the solutions is ts. The relative viscosity of the solution is:
rel = ts/to The viscosity of a solution also depends on the concentration; the higher the
concentration, the higher the viscosity. In order to make the measurement independent of concentration, a new viscometric parameter is used, which is called intrinsic viscosity, []. This number is calculated by:
[] = (log rel) / c which is almost a constant for a particular solute (DNA in our case) in very dilute solutions. Please note that c represent the concentration of the DNA solution; log represents the logarithm mathematical function as discussed earlier in lecture.
In this experiment, we follow the change in the viscosity of a DNA solution when we change the pH of the solution from the very acidic (pH 2.0) to very basic (pH 12.0). At extreme pH values, we expect that the hydrogen bonds will break, and the double helix will become single–stranded random coils. A change in the viscosity will tell at what pH this happens. We shall also determine whether two acid–denatured single stranded DNA molecules can refold themselves into a double helix when we neutralize the denaturing acid.
99
Procedure Because of the limited number and cost of the viscometers, students may work in groups of 5 – 6. Each group will need two viscometers.
Viscosity of DNA Solutions 1. To 3 mL of a buffer solution, add 1 drop of 1.0 M HCl using a Pasteur pipet. Measure its
pH with a universal pH paper. If the pH is above 2.5, add another drop of 1M HCl. Measure the pH again. Record the pH on your data sheet (as #1).
2. Clamp one clean and dry viscometer on a stand. Pipet 3 mL of your acidified buffer
solution into bulb A of your viscometer. Using a suction bulb of a Spectroline pipet filler, raise the level of the liquid in the viscometer above the upper calibration mark. Release the suction by removing the suction bulb and time the efflux time between the two calibration marks. Record this as to on your data sheet (as #2). Remove all the liquid from your viscometer by pouring the liquid out from the wide arm. Then apply pressure with the suction bulb on the capillary arm of the viscometer and blow out (NOT WITH YOUR MOUTH!) any remaining liquid into the storage bulb; pour out this residual liquid.
3. Take 3 mL of the prepared DNA solution. Add the same amount of 1 M HCl as above (1
or 2 drops). Mix it thoroughly by shaking the solution. Test the pH of the solution with a universal pH paper and record the pH (as #3) and the DNA concentration of the prepared solution on your data sheet (as #4).
4. Pour the acidified DNA solution into the wide arm of your viscometer. Using a suction
bulb, raise the level of your liquid above the upper calibration mark. Release the suction by removing the suction bulb and measure and record the efflux time of the acidified DNA solution on your data sheet (as #5).
5. Add the same amount (1 or 2 drops) as above of neutralizing 1M NaOH solution to the
liquid in the wide arm of your viscometer. With the suction bulb on the capillary arm, blow a few air bubbles through the solution to mix the ingredients. Repeat the measurement of the efflux time, and record it on your data sheet (as #6). For the next 100 min or so, repeat the measurement of the efflux time every 20 min, and record the results on your data sheet (as #7 – #11).
pH Dependence of the Viscosity of DNA Solutions 6. While the efflux time measurements in viscometer no.1 are repeated every 20 min,
another dry and clean viscometer will be used for establishing the pH dependence of the viscosity of DNA solutions. First, measure the pH of the buffer solution with a universal pH paper. Record it on your data sheet (as #12). Second, transfer 3 mL of the buffer into viscometer no. 2 and measure its efflux time on your data sheet (as #13). Empty the viscometer as instructed in step 2 above. Test the pH of the DNA solution with a universal pH paper (as #14) and transfer 3 mL into the viscometer. Measure its efflux time, and record it on your data sheet (as #15). Empty your viscometer.

100
7. Repeat the procedure described in step 6, but this time, with the aid of a Pasteur pipet, add one drop of 0.1 M HCl to the 3 mL buffer solution as well as to the 3 mL DNA solution. Measure the pH and the efflux times of both buffer and DNA solutions and record them (as #16 – #19) on your data sheet. Make sure that you carefully empty the viscometer after each viscosity measurement.
8. Repeat the procedure described in step 6, but this time, add one drop of 0.1 M NaOH
solution to both the 3 mL buffer and 3 mL DNA solutions. Measure their pH and efflux time and record them on your data sheet (as #20 – #23).
9. Repeat the procedure described in step 6, but this time, add 2 drops of 1 M NaOH to both
buffer and DNA solutions (3 mL of each solution). Measure and record their pH and efflux times on your data sheet (as #24 – #27).
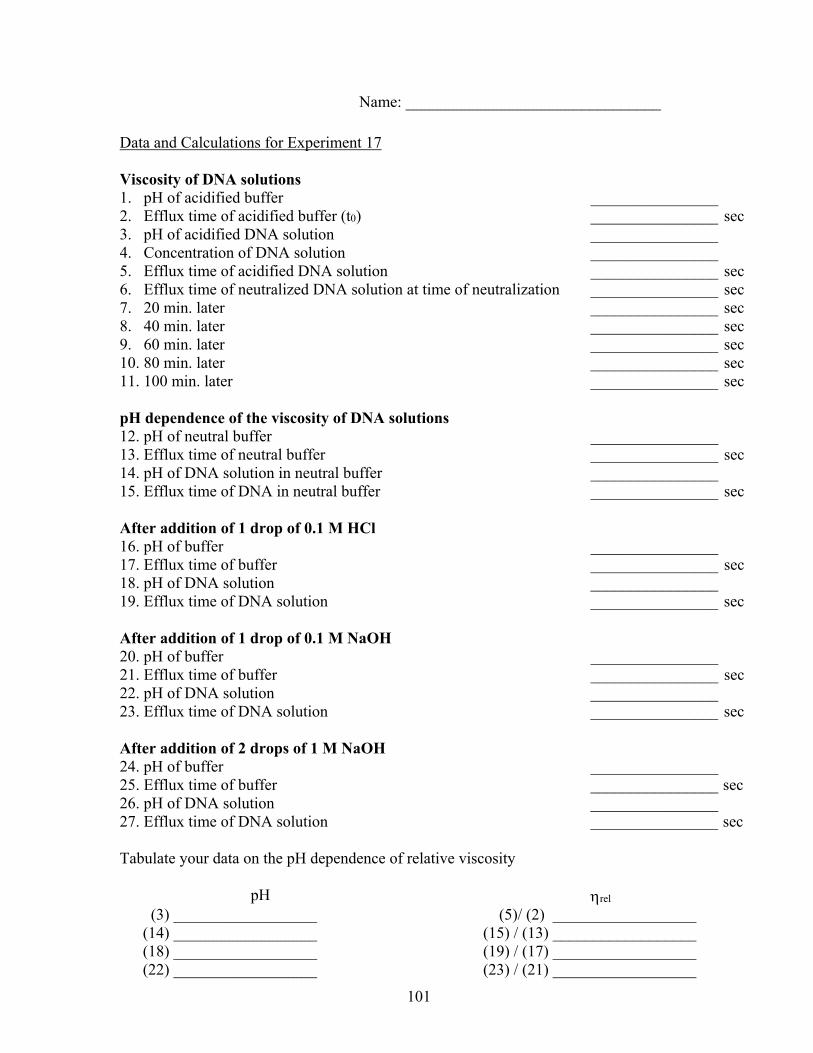
101
Name: ________________________________
Data and Calculations for Experiment 17 Viscosity of DNA solutions 1. pH of acidified buffer ________________ 2. Efflux time of acidified buffer (t0) ________________ sec 3. pH of acidified DNA solution ________________ 4. Concentration of DNA solution ________________ 5. Efflux time of acidified DNA solution ________________ sec 6. Efflux time of neutralized DNA solution at time of neutralization ________________ sec 7. 20 min. later ________________ sec 8. 40 min. later ________________ sec 9. 60 min. later ________________ sec 10. 80 min. later ________________ sec 11. 100 min. later ________________ sec pH dependence of the viscosity of DNA solutions 12. pH of neutral buffer ________________ 13. Efflux time of neutral buffer ________________ sec 14. pH of DNA solution in neutral buffer ________________ 15. Efflux time of DNA in neutral buffer ________________ sec After addition of 1 drop of 0.1 M HCl 16. pH of buffer ________________ 17. Efflux time of buffer ________________ sec 18. pH of DNA solution ________________ 19. Efflux time of DNA solution ________________ sec After addition of 1 drop of 0.1 M NaOH 20. pH of buffer ________________ 21. Efflux time of buffer ________________ sec 22. pH of DNA solution ________________ 23. Efflux time of DNA solution ________________ sec After addition of 2 drops of 1 M NaOH 24. pH of buffer ________________ 25. Efflux time of buffer ________________ sec 26. pH of DNA solution ________________ 27. Efflux time of DNA solution ________________ sec Tabulate your data on the pH dependence of relative viscosity
pH rel
(3) __________________ (14) __________________ (18) __________________ (22) __________________
(5)/ (2) __________________ (15) / (13) __________________ (19) / (17) __________________ (23) / (21) __________________
102
(26) __________________ (27) / (25) __________________ Questions 1. Plot your tabulated data: relative viscosity on the y–axis, and pH on the x–axis.
2. At what pH values did you observe helix-to-coil transitions? 3. Now plot your data on the refolding of DNA double helix (5) – (11) using Microsoft
Office Excel®. Plot time on the x–axis (i.e., time after neutralization in min.) and the efflux times on the y–axis (in sec.). Make sure to include this graph with your report. See Experiment #18 for directions on using Excel®. Include the best-fitting line for the data points; please note that this graph is NOT linear.
4. Was there any indication that, upon neutralization of the denaturing acid, the DNA did
refold into a double helix? Explain. 5. Compare the efflux time of the neutral DNA (15) to that of the denatured DNA 100 min.
after neutralization (11). What does the difference between these two efflux times tell you regarding the refolding process?

103
6. Calculate the intrinsic viscosity of your DNA at:
a. Neutral pH = 2.3 x {log [(15) / (13)]} / (4) = b. Acidic pH = 2.3 x {log [(5) / (2)]} / (4) =
c. Basic pH = 2.3 x {log [(27) / (25)]} / (4) =
d. Neutral pH 100 min. after neutralization = 2.3 x {log [(11) / (13)]} / (4) =
7. A high intrinsic viscosity implies a double helix; a low intrinsic viscosity means a random coil. What do you think is the shape of the DNA after acid denaturation and subsequent neutralization? (See 6d above.) Explain your answer.
104
EXPERIMENT 18
Spectrophotometric Analysis of Blood Glucose Discussion The normal concentration of glucose in the blood should lie within the range 65 – 95 mg glucose per 100 mL blood. The units typically used in clinical analysis are mg/dL. The blood glucose level may decrease temporarily during strenuous exercise because the glucose may not be replenished rapidly enough from liver glycogen or by gluconeogenesis. A condition of low blood glucose is called hypoglycemia. It is characterized by a rapid heartbeat, general weakness, trembling, perspiration, whitening of the skin, and loss of consciousness. The loss of consciousness is due to the deprivation of brain cells of the necessary glucose. A condition of high blood glucose is called hyperglycemia. The digestion of carbohydrates may result in absorption of glucose into the blood faster than glycogen can be formed by the process of glycogenesis. As the blood glucose level increases, the body also transforms glucose into fat and stores the fat as adipose tissue. When blood glucose levels reach 140 – 160 mg per 100 mL of blood, neither glycogen nor fat can be formed rapidly enough to decrease the glucose level. The condition in which glucose is then excreted by the kidneys and eliminated in the urine is called glucosuria. Tests for the concentration of glucose in blood and urine are done in clinical laboratories. Modern methods use automated analytical procedures that rapidly produce colored products that can be analyzed by spectrophotometers. If a liquid is colored, it is because some component of the liquid absorbs visible light of a certain wavelength. In a solution, the greater the concentration of the light-absorbing substance, the more light absorbed and the greater the intensity of the solution. The quantity of light absorbed by a substance can be measured using a spectrophotometer. The instrument consists of: (1) a source that emits all wavelengths of light in the visible region (wavelengths 400 to 700 nm); (2) a monochromator which selects a given wavelength of light; (3) a sample holder for the solution being measured; and (4) a detector which compares the intensity of incident light Io to the intensity of light after it has passed through the sample I. When a beam of light passes through a substance, some of the energy is often absorbed by the substance. This causes a decrease in the intensity of the transmitted beam. The ratio I/Io is called the transmittance, T, a measure of the fraction of light that passes through the sample holder (or cuvette) which contains the absorbing solution. The amount of light absorbed by the solution is given by the absorbance, A, where:
A = -log (I/Io) = -log T

105
Io I
b
Absorbing Solutionof concentration c
T = I/Io
A = -log (I/Io) = -log T
%T = 100% T
The distance, b, the light travels through the solution (in cm) and the concentration, c, of the absorbing species are represented in the schematic above. A beam of parallel radiation with an intensity is shown before (Io) and after (I) it has passed through a layer of solution with a measured thickness at a certain concentration. The Beer-Lambert law is the basis for using spectroscopy in quantitative analysis which relates absorbance (A) to the concentration of the absorbing solution (c) and the path length of the cuvette (b). That is:
A = ε b c where ε is the molar absorptivity or the molar extinction coefficient. Each pure substance has its own unique extinction coefficient. Note that during the experiment, the same cuvette should be used for all measurements. This experiment uses specifically prepared aqueous glucose solutions (rather than body fluids) and Benedict’s solution. Glucose reacts with the Cu+2 complex ion of Benedict’s solution to give solid Cu2O. As a result of this reaction, the concentration of the Cu+2 ion decreases. The resulting decrease in the absorbance of the solution at the wavelength of maximum intensity for the Cu+2 is directly proportional to the glucose concentration. You will determine the linear relationship between absorbance (y-axis) and concentration (x-axis in units of mg glucose per 100 mL) using solutions generated by the reaction of various known concentrations of glucose with Benedict’s solution. Using this calibration line (to be constructed using Microsoft Office Excel®), you can then determine the concentration of a solution of glucose of unknown concentration. Procedure Turn on the power switch by rotating it clockwise. The pilot light will glow red when the machine is on. Note that the power switch is also the zero control knob (left side knob). Set the wavelength control to 730 nm and allow the spectrophotometer to warm up for 15 minutes. Adjust the zero control knob so that it reads 0% T. Prior to making all absorbance readings, a spectrophotometer must be calibrated using a blank solution, which is comprised of a cuvette filled with 2/3 full D.I. water for this experiment. Insert the cuvette into the sample holder, aligning the mark on the test tube with the line on the sample compartment and close the cover. Adjust the transmittance/absorbance control (right side knob) until the meter reads 100% T. Obtain an unknown solution sample from your instructor. Mark the unknown code on your data sheet. Prepare and number six test tubes, and carefully pipet 5.00 mL of the dilute Benedict’s solution into each tube. Now obtain a different pipet for each subsequent
106
addition: into tube 1, pipet 5.00 mL of D.I. water; into tubes 2 through 5, pipet 5.00 mL of the different standard glucose solutions found in the hood. Into tube 6, pipet 5.00 mL of your unknown glucose solution. Gently agitate each test tube to ensure complete mixing. Place all tubes in a 400 mL beaker containing 200 mL of hot water maintained at a gentle boil via a Bunsen burner with boiling chips. After 30 minutes, remove the test tubes and place them in a test tube rack to cool. If the Cu2O formed in the reaction settles to the bottom of the test tubes, it will be possible to decant the solution; otherwise, you will have to centrifuge the mixture to separate the solid from the solution before decanting. Obtain two cuvettes from your instructor, calibrate the spectrophotometer with the blank solution, and record your absorbance measurements for the six solutions. Make certain to rinse the sample cuvette several times with small amounts of the new solution prior to recording its absorbance. Record your results in the data section of this report. Excel® Guidelines Once you have obtained your absorbance readings, you will construct a best-fitting line using Excel®. If using Microsoft Office Excel® 2007, begin by typing the data onto your Excel® spreadsheet in (x, y) form. To plot the data, highlight the x/y coordinates, select Insert from the display menu followed by Scatter, choose X Y (Scatter), and click OK. To label the graph and coordinate axes, use the Layout function from the toolbar and select the appropriate Labels. If using Microsoft Office Excel® 97-2003, begin by typing the data onto your Excel® spreadsheet in (x, y) form. To plot the data, highlight the x/y coordinates and select the Chart Wizard icon from the display menu. Work through the four steps of the Chart Wizard as shown below: 1. Chart Wizard – Step 1 of 4: Select XY (Scatter) and hit Next>. 2. Chart Wizard – Step 2 of 4: Hit Next> a second time. 3. Chart Wizard – Step 3 of 4: Select Titles and give your graph an appropriate title, making sure to label both the x-axis and y-axis WITH UNITS IN PARENTHESES! Other options are available via various menu options, including the ability to delete the legend. When completed, hit Next>. 4. Chart Wizard – Step 4 of 4: All graphs should be incorporated into your laboratory reports as full sheet inserts. Therefore, select the As new sheet: option. Once your data is plotted, you can draw a best-fitting line for the data utilizing the trendline function. Place the mouse cursor on one of the data points and proceed to right-click. All the data points corresponding to a particular data set should now be highlighted. Right-click again, and various menu options will pop up; select Add Trendline… utilizing the left-click. If your graph involves a linear function, select Linear. If your graph involves a non-linear function, select Power. Under the options menu, you can display an equation on your graph by selecting Display Equation on chart. Finally, click on OK (or Close) and print your graph. Make sure to submit the printout of your graph with this report.

107
Name: ________________________________
Data and Calculations for Experiment 18
Test Tube Initial glucose concentration (from bottle) Absorbance at 730 nm
1
2
3
4
5
Unknown Code ______
To be determined in Question #1 below
Based on your Excel® graph, what is the equation of the line? _________________________ Questions 1. Using your unknown absorbance value and calibration line, what is the concentration of your unknown solution? Show your work below. 2. The following absorbance values for four solutions with known MnO4
- concentrations were measured using a spectrophotometer:
Solution [MnO4-] Absorbance
1 7.00 x 10⁻⁵ M 0.175 2 1.00 x 10⁻⁴ M 0.250 3 2.00 x 10⁻⁴ M 0.500 4 3.50 x 10⁻⁴ M 0.875
Plot a graph of Absorbance vs. Concentration of MnO4
- using Microsoft Excel® (be sure to include your graph with this report). Determine the concentration of an unknown MnO4
- sample whose absorbance is found to be 0.780.
108
3. In your own words, write a logical, coherent conclusion which demonstrates a thorough working knowledge and understanding of important concepts and underlying chemical principles pertinent to this experiment, forms appropriate conclusions based on interpretations of results, includes applications of and improvements in the experiment, and demonstrates accountability by providing justification for any errors. If additional space is needed, please use the back of this page. (For additional guidelines on writing this conclusion, please refer to the Moorpark College Chemistry Department Laboratory Report Rubric found in the lab manual and department website.)

109