Embed Size (px)
Citation preview

Chemicals in Europe:
the way forward
Balancing the equation with
customized innovation and
strategy

2 Chemicals in Europe: the way forward
Co
nte
nts
Executive summary 3
The European chemicals industry today 4
What is slowing the growth of European chemicals? 5
What gives Europe a favourable business environment? 7
What are the global chemicals leaders doing in Europe? 9
What strategies can the chemicals players in Europe consider in future? 13
Why EY? 17
References 18
Contacts 19

3 Chemicals in Europe: the way forward
The competitive advantage of the European chemicals industry
appears to decline, as the US and Asia develop low-cost
production for chemicals. Furthermore, with demand growth
shifting to the emerging markets of Asia and Latin America,
manufacturing facilities have been moving to these regions and
the chemicals producers are following suit. In addition, stringent
regulations in the European chemicals industry, heavy green
taxes and slow take up of alternate feedstock technology (shale
etc.) contribute to the slow growth of the industry.
However, Europe continues to be a major contributor to global
chemicals with a favorable environment for innovation, expertise
in specialized chemicals and a strong infrastructure to support
business. Moreover, the recent decline in oil prices may help
Europe retain cost competitiveness in chemicals production.
Nonetheless, the reduction of its share in the global chemicals is
a cause for concern for the chemicals companies in the region.
We tracked the initiatives by major chemicals players in Europe
and arrived at the crucial strategic considerations that can help
them on their evolutionary path.
As the global environment becomes all the more volatile,
chemical players in Europe can consider developing a strategy
that enables constant evolution to optimize market share and
margin growth. In an environment where uncertainty regarding
feedstock prices, demand growth, currency fluctuations and
regulations pose varied challenges every day, companies need
to be ready to adapt to the changing environment to improve
their competitive position.
Chemicals companies need to differentiate their strategies
according to their business segments and targeted market
position. For instance, for a commodity chemicals business,
which is highly feedstock intensive, optimized feedstock strategy
and innovation in developing low-cost processes should be the
imperative. While, for a specialty chemicals business, alignment
with the customer’s business and collaborative innovation would
be the crucial differentiator.
Five-point strategy: key imperatives for companies in Europe
Commodity Specialty
How should business be
structured to compete in the
marketplace?
A business model with a value chain
integrated with the raw materials or feedstock
A business model with dedicated sales team,
which has a high level of collaboration with end-
clients
Which is the optimum feedstock
blend for the given product
portfolio?
Strategic partnerships to identify and acquire
alternate or low-cost feedstock
Partnering with peers for acquiring chemicals
raw materials; developing a supply chain model
with high frequency and low order sizes
What combination of product
portfolio will be ideal to meet
anticipated future state?
Increasing the share of products used in
industries with high-growth potential
Focusing on products with a stable renewal
demand
Where should the R&D
expenditure and innovation be
directed to?
Innovation in alternate technology or
feedstock (e.g., coal-to-olefins (CTO), bio-
based etc.) to reduce cost and facilitate
sustainability
Customer-oriented innovation; new applications
for their products
How to procure the suitable skill
set and talent mix?
Hiring a higher share of technology and
feedstock experts to reduce costs
Recruiting product and research experts to
develop new products and applications
Executive summary
4 Chemicals in Europe: the way forward
Chem
icals
industr
y p
erf
orm
ance
Business environment stability
Europe
RoW
South
America
North America
Asia
HighLow
High
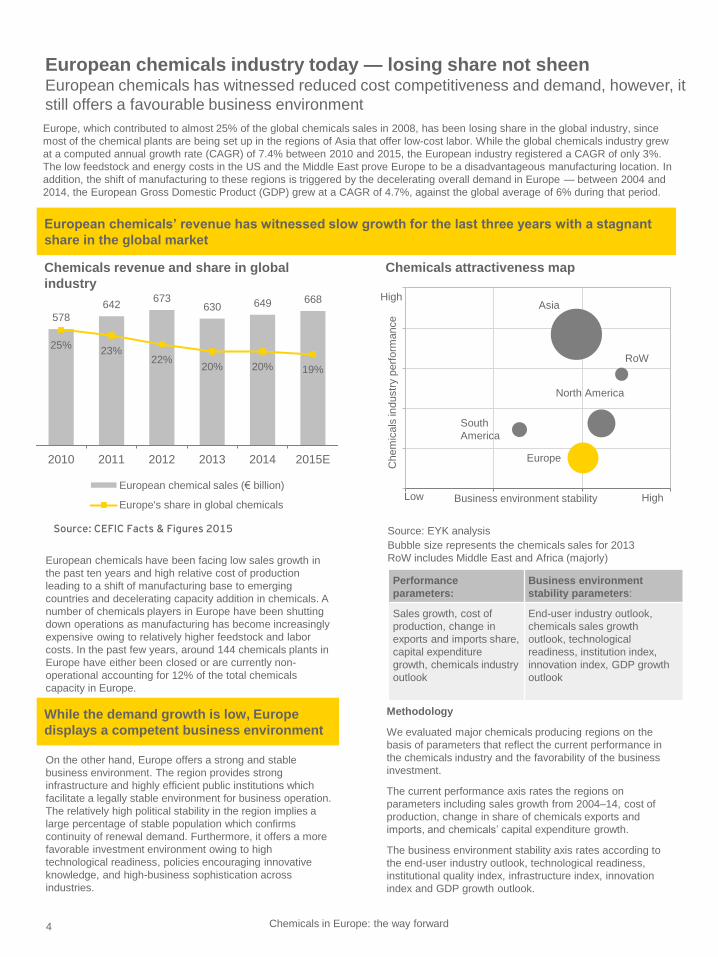
European chemicals industry today — losing share not sheenEuropean chemicals has witnessed reduced cost competitiveness and demand, however, it
still offers a favourable business environment
While the demand growth is low, Europe
displays a competent business environment
European chemicals’ revenue has witnessed slow growth for the last three years with a stagnant
share in the global market
Europe, which contributed to almost 25% of the global chemicals sales in 2008, has been losing share in the global industry, since
most of the chemical plants are being set up in the regions of Asia that offer low-cost labor. While the global chemicals industry grew
at a computed annual growth rate (CAGR) of 7.4% between 2010 and 2015, the European industry registered a CAGR of only 3%.
The low feedstock and energy costs in the US and the Middle East prove Europe to be a disadvantageous manufacturing location. In
addition, the shift of manufacturing to these regions is triggered by the decelerating overall demand in Europe — between 2004 and
2014, the European Gross Domestic Product (GDP) grew at a CAGR of 4.7%, against the global average of 6% during that period.
On the other hand, Europe offers a strong and stable
business environment. The region provides strong
infrastructure and highly efficient public institutions which
facilitate a legally stable environment for business operation.
The relatively high political stability in the region implies a
large percentage of stable population which confirms
continuity of renewal demand. Furthermore, it offers a more
favorable investment environment owing to high
technological readiness, policies encouraging innovative
knowledge, and high-business sophistication across
industries.
578
642673
630 649 668
25%23%
22%20% 20% 19%
2010 2011 2012 2013 2014 2015E
European chemical sales (€ billion)
Europe's share in global chemicals
Source: CEFIC Facts & Figures 2015 Source: EYK analysis
Bubble size represents the chemicals sales for 2013
RoW includes Middle East and Africa (majorly)
Performance
parameters:
Business environment
stability parameters:
Sales growth, cost of
production, change in
exports and imports share,
capital expenditure
growth, chemicals industry
outlook
End-user industry outlook,
chemicals sales growth
outlook, technological
readiness, institution index,
innovation index, GDP growth
outlook
Methodology
We evaluated major chemicals producing regions on the
basis of parameters that reflect the current performance in
the chemicals industry and the favorability of the business
investment.
The current performance axis rates the regions on
parameters including sales growth from 2004–14, cost of
production, change in share of chemicals exports and
imports, and chemicals’ capital expenditure growth.
The business environment stability axis rates according to
the end-user industry outlook, technological readiness,
institutional quality index, infrastructure index, innovation
index and GDP growth outlook.
European chemicals have been facing low sales growth in
the past ten years and high relative cost of production
leading to a shift of manufacturing base to emerging
countries and decelerating capacity addition in chemicals. A
number of chemicals players in Europe have been shutting
down operations as manufacturing has become increasingly
expensive owing to relatively higher feedstock and labor
costs. In the past few years, around 144 chemicals plants in
Europe have either been closed or are currently non-
operational accounting for 12% of the total chemicals
capacity in Europe.
Chemicals attractiveness mapChemicals revenue and share in global
industry
5 Chemicals in Europe: the way forward
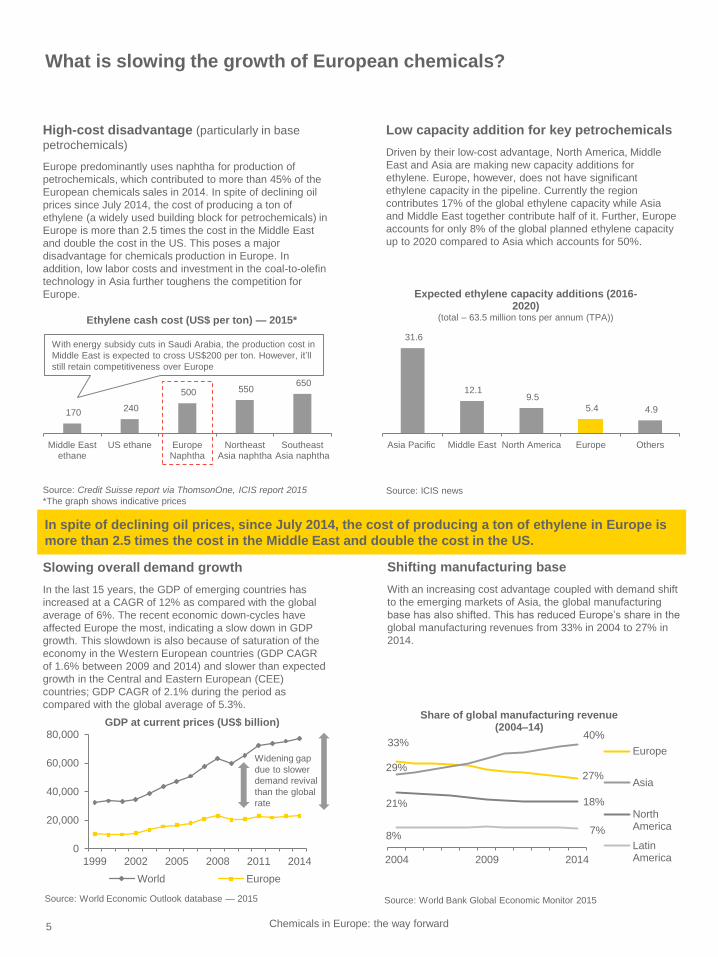
High-cost disadvantage (particularly in base
petrochemicals)
Europe predominantly uses naphtha for production of
petrochemicals, which contributed to more than 45% of the
European chemicals sales in 2014. In spite of declining oil
prices since July 2014, the cost of producing a ton of
ethylene (a widely used building block for petrochemicals) in
Europe is more than 2.5 times the cost in the Middle East
and double the cost in the US. This poses a major
disadvantage for chemicals production in Europe. In
addition, low labor costs and investment in the coal-to-olefin
technology in Asia further toughens the competition for
Europe.
Shifting manufacturing base
With an increasing cost advantage coupled with demand shift
to the emerging markets of Asia, the global manufacturing
base has also shifted. This has reduced Europe’s share in the
global manufacturing revenues from 33% in 2004 to 27% in
2014.
33%
27%29%
40%
21% 18%
8%7%
2004 2009 2014
Share of global manufacturing revenue (2004–14)
Europe
Asia
NorthAmerica
LatinAmerica
Source: World Bank Global Economic Monitor 2015
Slowing overall demand growth
In the last 15 years, the GDP of emerging countries has
increased at a CAGR of 12% as compared with the global
average of 6%. The recent economic down-cycles have
affected Europe the most, indicating a slow down in GDP
growth. This slowdown is also because of saturation of the
economy in the Western European countries (GDP CAGR
of 1.6% between 2009 and 2014) and slower than expected
growth in the Central and Eastern European (CEE)
countries; GDP CAGR of 2.1% during the period as
compared with the global average of 5.3%.
0
20,000
40,000
60,000
80,000
1999 2002 2005 2008 2011 2014
GDP at current prices (US$ billion)
World Europe
Widening gap
due to slower
demand revival
than the global
rate
Source: World Economic Outlook database — 2015
Low capacity addition for key petrochemicals
Driven by their low-cost advantage, North America, Middle
East and Asia are making new capacity additions for
ethylene. Europe, however, does not have significant
ethylene capacity in the pipeline. Currently the region
contributes 17% of the global ethylene capacity while Asia
and Middle East together contribute half of it. Further, Europe
accounts for only 8% of the global planned ethylene capacity
up to 2020 compared to Asia which accounts for 50%.
4.9 5.4
9.5 12.1
31.6
OthersEuropeNorth AmericaMiddle EastAsia Pacific
Expected ethylene capacity additions (2016-2020)
(total – 63.5 million tons per annum (TPA))
Source: ICIS news
In spite of declining oil prices, since July 2014, the cost of producing a ton of ethylene in Europe is
more than 2.5 times the cost in the Middle East and double the cost in the US.
170 240
500 550 650
Middle Eastethane
US ethane EuropeNaphtha
NortheastAsia naphtha
SoutheastAsia naphtha
Ethylene cash cost (US$ per ton) — 2015*
Source: Credit Suisse report via ThomsonOne, ICIS report 2015
*The graph shows indicative prices
With energy subsidy cuts in Saudi Arabia, the production cost in
Middle East is expected to cross US$200 per ton. However, it’ll
still retain competitiveness over Europe
What is slowing the growth of European chemicals?
6 Chemicals in Europe: the way forward
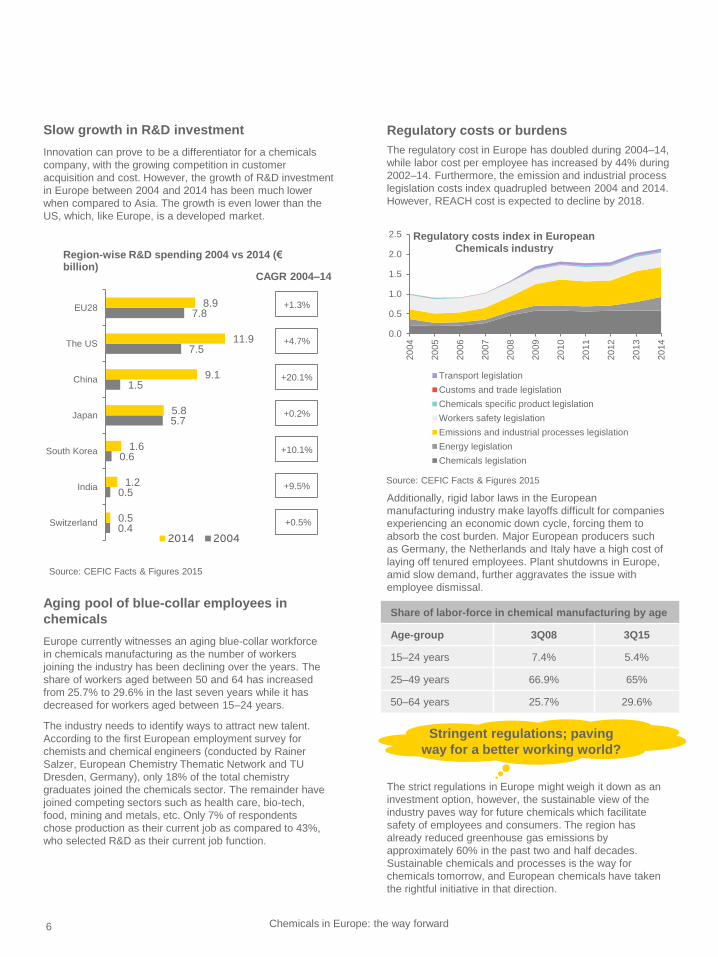
Slow growth in R&D investment
Innovation can prove to be a differentiator for a chemicals
company, with the growing competition in customer
acquisition and cost. However, the growth of R&D investment
in Europe between 2004 and 2014 has been much lower
when compared to Asia. The growth is even lower than the
US, which, like Europe, is a developed market.
0.4
0.5
0.6
5.7
1.5
7.5
7.8
0.5
1.2
1.6
5.8
9.1
11.9
8.9
Switzerland
India
South Korea
Japan
China
The US
EU28
Region-wise R&D spending 2004 vs 2014 (€billion)
2014 2004
+1.3%
+0.2%
+4.7%
+20.1%
+10.1%
+0.5%
+9.5%
CAGR 2004–14
Source: CEFIC Facts & Figures 2015
Regulatory costs or burdens
The regulatory cost in Europe has doubled during 2004–14,
while labor cost per employee has increased by 44% during
2002–14. Furthermore, the emission and industrial process
legislation costs index quadrupled between 2004 and 2014.
However, REACH cost is expected to decline by 2018.
The strict regulations in Europe might weigh it down as an
investment option, however, the sustainable view of the
industry paves way for future chemicals which facilitate
safety of employees and consumers. The region has
already reduced greenhouse gas emissions by
approximately 60% in the past two and half decades.
Sustainable chemicals and processes is the way for
chemicals tomorrow, and European chemicals have taken
the rightful initiative in that direction.
Stringent regulations; paving
way for a better working world?
Aging pool of blue-collar employees in
chemicals
Europe currently witnesses an aging blue-collar workforce
in chemicals manufacturing as the number of workers
joining the industry has been declining over the years. The
share of workers aged between 50 and 64 has increased
from 25.7% to 29.6% in the last seven years while it has
decreased for workers aged between 15–24 years.
The industry needs to identify ways to attract new talent.
According to the first European employment survey for
chemists and chemical engineers (conducted by Rainer
Salzer, European Chemistry Thematic Network and TU
Dresden, Germany), only 18% of the total chemistry
graduates joined the chemicals sector. The remainder have
joined competing sectors such as health care, bio-tech,
food, mining and metals, etc. Only 7% of respondents
chose production as their current job as compared to 43%,
who selected R&D as their current job function.
Share of labor-force in chemical manufacturing by age
Age-group 3Q08 3Q15
15–24 years 7.4% 5.4%
25–49 years 66.9% 65%
50–64 years 25.7% 29.6%
0.0
0.5
1.0
1.5
2.0
2.5
20
04
20
05
20
06
20
07
20
08
20
09
20
10
20
11
20
12
20
13
20
14
Regulatory costs index in European Chemicals industry
Transport legislation
Customs and trade legislation
Chemicals specific product legislation
Workers safety legislation
Emissions and industrial processes legislation
Energy legislation
Chemicals legislation
Additionally, rigid labor laws in the European
manufacturing industry make layoffs difficult for companies
experiencing an economic down cycle, forcing them to
absorb the cost burden. Major European producers such
as Germany, the Netherlands and Italy have a high cost of
laying off tenured employees. Plant shutdowns in Europe,
amid slow demand, further aggravates the issue with
employee dismissal.
Source: CEFIC Facts & Figures 2015

7 Chemicals in Europe: the way forward
-1.1
-1.0
-0.8
-0.8
-0.5
-0.2
0.0
0.3
0.4
0.4
0.5
0.5
0.6
0.7
0.8
0.9
1.0
1.0
1.2
1.2
South Korea
India
Russia
Mexico
China (mainland)
Saudi Arabia
Brazil
Spain
France
UK
Chile
Italy
US
Belgium
Taiwan
Germany
Japan
Netherlands
Canada
Singapore
Political stability index in 25 top chemicals markets (–2.5: weak governance to 2.5: strong governance)
Source: CEFIC Facts & Figures 2014, World Bank World
Government Indices survey 2014
Global
average: -
0.23
Favorable environment for innovation
European countries enjoy a high innovation index reflecting
high-quality research institutes, increased share of company
spending on R&D, Patent Co-operation Treaties (PCT) and
availability of highly skilled research professionals as
compared to other regions. The EU spent around 1.6% of its
chemicals investment on R&D, while China spent only 0.8%^
in 2014. A strong R&D base in Europe provides the region
with a favorable environment and prospects for innovation,
thereby, facilitating products with a higher value-add for the
customers.
Access to suitable skills
European chemicals industry is increasingly focusing on
producing high-value specialty products. The success of
specialty chemicals industry depends on the extent and
frequency of innovation in products. For an innovation-driven
industry, criteria such as access to suitable talent is often
more important than any other. We compared the availability
of scientists and engineers and quality of education as the
two parameters to measure the access to skilled labor for
top-15 chemicals-producing countries — European countries
such as Belgium and the Netherlands score high on quality
of education while Germany and Spain have a large pool of
scientists and engineers available.
Well-established infrastructure
The major European chemicals-producing countries enjoy
better chemical–related infrastructure (than Asia and Latin
America) including transportation, supply chain, logistics,
energy supply to support business activities. The Global
Competitive Index rates major European producers
(including Germany, the Netherlands, France etc.) between
4.8 and 6.2 (out of 7) in terms of infrastructure while Asian
producers such as India and China are rated 3.6 and 4.7,
respectively.Source: CEFIC Facts & Figures 2014, World Economic Forum – GCI
dataset 2005-15
Size of the bubble represents 2013 sales
European countries
3
4
5
6
3 4 5 6
Access to skilled workforce in top 15 chemicals-producing nations (WEF GCI ratings — 0 to 7, 7 being best)
Top six European countries (contributing 12.5% to the global chemicals industry revenues) have relatively greater access to the skilled workforce
Qualit
y of
education
Availability of scientists and engineers
Germany
Spain
France UK
Netherlands
Belgium
China
US
Japan
Brazil
- Source: CEFIC Facts & Figures 2016
What gives Europe a favourable business environment?
High level of political stability
Seven out of eight (except Russia) major European
chemicals producers enjoy strong governance and political
stability, higher than major manufacturing hubs such as
China and India. The European countries above the global
average score (-0.23) of political stability index together
constitute approximately 14% of global chemicals sales.

8 Chemicals in Europe: the way forward
Growing demand in the emerging and low-to
medium-income countries of Europe
The average GDP growth of emerging Europe*, in the next
five years, is expected to be 5.9%, according to World
Economic Outlook, above the global average of 5.4%. The
demand for chemicals and their end-user industries in these
regions are expected to witness strong growth reflecting an
overall growth in the GDP.
According to the American Chemistry Council report for
2015, the chemicals output for CEE, (includes the emerging
Europe countries and Germany) is expected to grow at a
CAGR of 4% by 2025 as compared with 3.6% for the global
chemicals output and 2% for Western Europe chemicals.
More than 50% of the planned chemicals capacity in
Europe* in the next four to seven years will be in low and
medium income countries of Central and Eastern Europe
(Poland, Hungary, Croatia Romania, Belarus, etc.)
► Poland — growth in pharmaceuticals, plastic products
and organic chemicals
► Croatia — chemicals, rubbers and plastic form more
than 7% of the country’s exports
Integrated cost-efficient chemicals clusters
Europe has strong competitive clusters which are the
backbone of the European chemicals industry. According to
European Chemical Site Promotion Platform (ECSPP),
Europe has 95 active chemicals clusters or parks with an aim
to position Europe as an attractive region for new chemicals
investment. European chemicals parks provide stable
production conditions and reliable infrastructure owing to their
long production history and highly professional site operators.
The main advantage of European chemicals parks and
industrial parks is the availability of well-qualified personnel at
all levels.
Overall, investment cost levels are higher than at Asian sites
because of higher material, construction and engineering
costs. However, these costs are lower than those in the
Middle East. Continuous improvement of parks'
competitiveness and attractiveness enable European
chemicals industry to be prepared for increased competition
from China, Southeast Asia and the Middle East.
Europe can be expected to retain its position as a significant
chemicals player given the favorable business environment,
coupled with opportunities from TTIP. Furthermore, market
dynamics such as the low-oil prices and depreciating Euro will
also affect the competitiveness of Europe. Assuming that the
low-oil price scenario continues, Europe will begin to regain
its market share. Moreover, strategic options to acquire low-
cost feedstock — by exploring shale-based options
(particularly for large integrated players) in Europe or
importing from the US — can also offer further growth
opportunities.
However, the global and European demand outlook scenario
continues to be a concern for Europe. We analyze the steps
taken by several chemicals majors to improve their market
competency in Europe and other regions and list the crucial
strategic steps which can be considered by these players.
Countries in Emerging Europe – Albania, Armenia, Azerbaijan, Belarus, Bosnia Herzegovina, Bulgaria, Croatia, Czech Republic, Estonia, Georgia,
Hungary, Kosovo, Latvia,
Lithuania, Moldova, Montenegro, Poland, Republic of Macedonia, Romania, Serbia, Slovakia, Slovenia – Emerging Europe
*Excluding Russia
The Transatlantic Trade and Investment Partnership (TTIP)
is expected to enhance demand in European industries
particularly in the manufacturing sector with reduced tariffs
and lesser bureaucracy.
Industries that would benefit the most include chemicals,
metals and metal products, food processing and automotive.
The resultant higher trade activity, besides increasing
demand, will also imply uniform global standards, thereby
enhancing innovation.
Further, tariff elimination under TTIP is expected to save
€168 million in duties for the chemicals sector, according to
IHS Chemical Week. The European chemicals sector could
benefit from US export supplies of shale gas (in the wake of
recent natural gas boom) to help their crackers become
more competitive in the global market. This will particularly
boost the trade of specialty chemicals and agrochemicals
from Europe as the global population continues to grow.
TTIP expected to increase EU’s
attractiveness

9 Chemicals in Europe: the way forward
Amidst the cost and demand challenges, companies operating in Europe are finding ways to tackle the situation. The corrective
measures include a range of solutions from portfolio optimization to maintaining operational excellence through shutting down plants
for high-cost, low-margin products. Most of the solutions include using one or more of these five levers: identifying the right
feedstock, restructuring business operations, portfolio optimization, moving to high-growth regions and markets, and growing
innovation capacity.
Strategizing around feedstock or raw material costs
Some other notable measures by chemical players in Europe include:
► LyondellBasell is expanding multi-plant ethylene capacity, which benefits from shale gas production.
► Annual ethylene capacity expansion by 839,000 tons (1.85 billion pounds)
► Investment of €1.17 billion (US$1.3 billion)
► In April 2015, SABIC has announced plans to import ethane to its Teesside plant in UK to secure the future of its cracker at Wilton
and to keep it competitive.
► INEOS Europe AG has entered into ethane purchase agreements with CONSOL Energy (2014), Royal Dutch Shell and
ExxonMobil (2015) for long-term sourcing of low-price US ethane for its European crackers.
► In 2014, BASF announced to invest €1.2 billion (US$1.4 billion) in US shale gas. BASF aims to produce on-purpose propylene by
leveraging low cost US shale gas to meet internal demand for propylene in North America.
Further, European companies are developing technologies to use sustainable feedstock or processes for chemicals production:
► In 2014, BASF and Corbion Purac JV — Succinity, started its first commercial production facility (capacity ~10,000 TPA for bio-
based succinic acid at Corbion Purac's Montmeló, Spain, site.
► Novozymes and Cargill are jointly developing a bio-based process for producing 3-hydroxypropionic (3-HP) acid and acrylic acid
from renewable raw material.
► Evonik and AkzoNobel have started constructing membrane electrolysis plant in Germany. The plant will produce 130,000 TPA of
potassium hydroxide solution and 82,000 TPA of chlorine. The plant, to be operational in 2017, is expected to improve its
ecological footprint by 25% to 30% for each ton of chlorine.
Since feedstock forms the major chunk (~40%) of the chemicals production costs, chemicals companies continuously work on
optimizing their feedstock strategy. Furthermore, with increasing environmental concerns and regulations, sustainable feedstock is
the need of the hour. Overall, key success factors for an optimal feedstock strategy are proximity to the low-cost feedstock region,
access to the latest technology and a sustainable feedstock for long term. Therefore, chemicals players are moving closer to the low-
cost regions and deploying alternate feedstock technology (such as coal-to-olefins, methane-to-propylene).
European companies are increasingly investing in these regions to diversify their feedstock mix. If the oil prices rebound in the
medium term, importing ethane from the US to feed plants in Europe will continue to be an attractive option for the chemicals players
in the region. As of 2014, ethylene cost saving set by naphtha-ethane price spread and cost of investment (around €175 million) was
approximately €328.8 (US$ 375) per ton ethylene. However, the decision to invest in conversion will also depend on location, current
cracker products, ease of ethane conversion, major business portfolio and capital expenditure.
However, in case of sustained low-oil price scenario, using the existing naphtha-based crackers in Europe will be a better option. As
a result, the need for flexible feedstock or supply chain arises; companies need to develop technologies to be able to shift to a
different feedstock without losing output or increasing costs.
Initiatives of European chemicals companies
Leveraging low-cost feedstock available from shale
(the US)Developing mixed feed
crackers
Importing ethane from the
US
Expanding capacity of ethane
crackers in the US and Europe
Investing in propane
dehydrogenation plants
in the US
Developing technology for
methane to propylene plants in
the US and Europe
Developing sustainable
feedstock technologies
Using biomass for
chemicals production
What are the global chemicals leaders doing in Europe?
10 Chemicals in Europe: the way forward
In an environment of rising costs and declining pricing power, it is imperative for European chemicals companies to focus on cost and
efficiency management to increase their profitability. One of the most used strategic initiatives to improve business efficiency is to
target operational excellence for accomplishing cost leadership. Automation of manufacturing processes, integration of business
operations (vertically and horizontally), enhancing supply chain efficiency and deploying cost saving programs are being used by
chemicals players to achieve this.
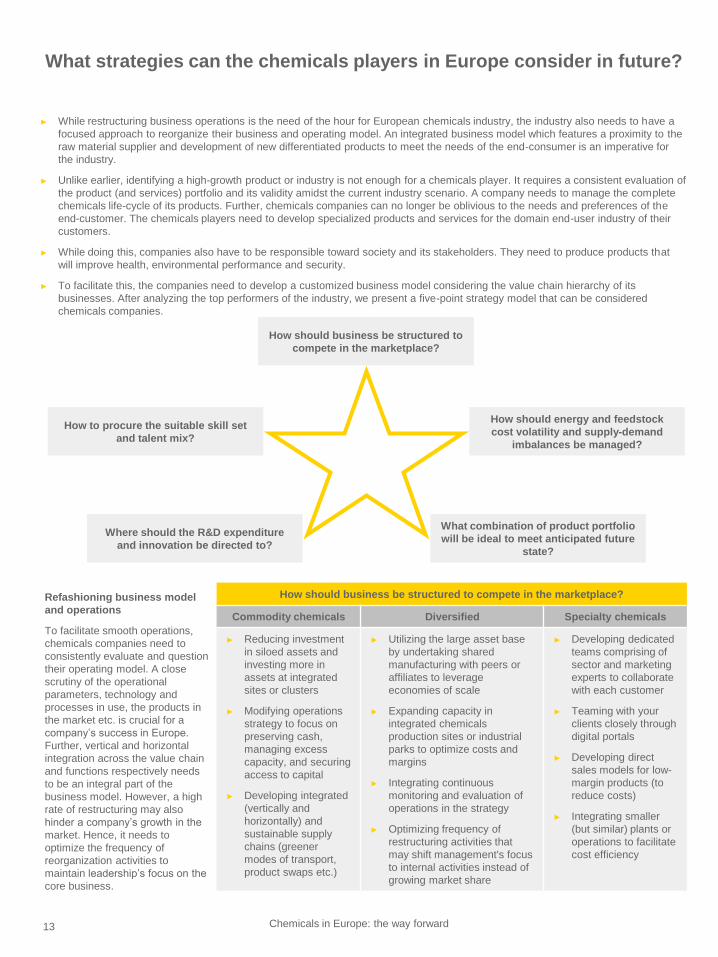
► In November 2015, BASF opened a new 300,000 TPA toluene di-isocyanate (TDI) plant at its Ludwigshafen site (Germany) with
an investment of over €1 billion. It is an integrated plant having all the most competitive facilities in the world. BASF also
implemented a cost excellence program STEP between 2012 -15 with a targeted cost-saving of €1.3 billion. The company is now
initiating its new commercial excellence program –’Drive Efficiency’ (DrivE) – with a target savings of €1 billion between 2016 and
2018.
► During 2010–14, Clariant’s excellence initiative resulted in positive effects of €380 million owing to cost reduction and additional
sales. Furthermore, Clariant has also popularized a culture of continuous performance improvements at business unit level (six
sigma).
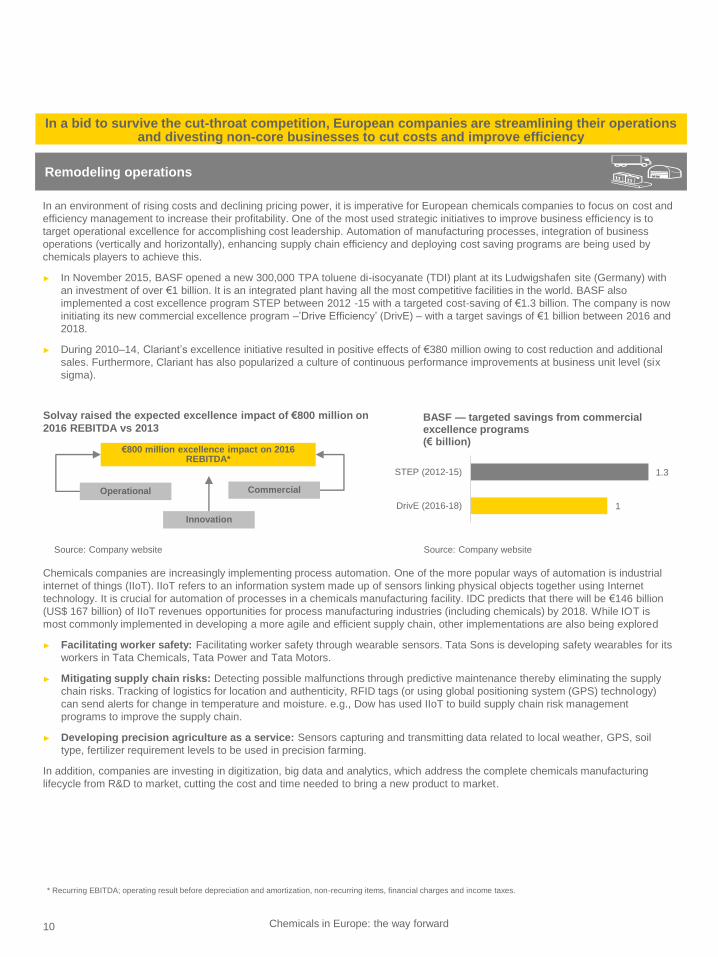
Remodeling operations
Solvay raised the expected excellence impact of €800 million on
2016 REBITDA vs 2013
Operational
Innovation
Commercial
€800 million excellence impact on 2016 REBITDA*
Chemicals companies are increasingly implementing process automation. One of the more popular ways of automation is industrial
internet of things (IIoT). IIoT refers to an information system made up of sensors linking physical objects together using Internet
technology. It is crucial for automation of processes in a chemicals manufacturing facility. IDC predicts that there will be €146 billion
(US$ 167 billion) of IIoT revenues opportunities for process manufacturing industries (including chemicals) by 2018. While IOT is
most commonly implemented in developing a more agile and efficient supply chain, other implementations are also being explored
► Facilitating worker safety: Facilitating worker safety through wearable sensors. Tata Sons is developing safety wearables for its
workers in Tata Chemicals, Tata Power and Tata Motors.
► Mitigating supply chain risks: Detecting possible malfunctions through predictive maintenance thereby eliminating the supply
chain risks. Tracking of logistics for location and authenticity, RFID tags (or using global positioning system (GPS) technology)
can send alerts for change in temperature and moisture. e.g., Dow has used IIoT to build supply chain risk management
programs to improve the supply chain.
► Developing precision agriculture as a service: Sensors capturing and transmitting data related to local weather, GPS, soil
type, fertilizer requirement levels to be used in precision farming.
In addition, companies are investing in digitization, big data and analytics, which address the complete chemicals manufacturing
lifecycle from R&D to market, cutting the cost and time needed to bring a new product to market.
* Recurring EBITDA; operating result before depreciation and amortization, non-recurring items, financial charges and income taxes.
In a bid to survive the cut-throat competition, European companies are streamlining their operations and divesting non-core businesses to cut costs and improve efficiency
1.3
1
STEP (2012-15)
DrivE (2016-18)
BASF — targeted savings from commercial excellence programs (€ billion)
Source: Company website Source: Company website

11 Chemicals in Europe: the way forward
There has been a fierce competition in the chemicals markets from the emerging countries. To survive in these rough times and to
retain their market share, particularly in their core business, companies are streamlining their portfolios to confirm focus on core. This
is leading the companies to divest non-core businesses and increase investment in business that aligns with their strategy.
► In February 2016, BASF announced the sale of its industrial coatings segment to AkzoNobel for €475 million (£368 million). Both
the companies will benefit from this:
► BASF’s coatings division will now focus on automotive coatings and decorative paints.
► AkzoNobel is expected to benefit since industrial coatings is one of its four focus end-user segments.
► In February 2016, Lanxess started its second production line for high-performance plastics at its facility in North Carolina, the US,
doubling the production capacity from 20,000 to 40,000 TPA. It entailed an investment of around €13.3 million (US$15 million) and
it will cater to the growing US automotive industry. This investment is aligned to the company’s strategy to focus on high-
performance compounds and to move toward high-growth markets.
► In December 2015, Solvay acquired automotive composites business (Cytec). This acquisition adds value because Cytec
complements Solvay’s specialty formulations in mining and oil and gas chemicals and has a similar service-oriented business
model.
► In September 2015, the Bayer group separated its material science business and formed a new entity “Covestro”. Covestro may
consider bolt-on acquisitions to grow its business.
► In July 2015, DuPont spun-off its struggling performance chemicals business into a separate public company, Chemours.
► Dow Chemical targeted to raise €7.6 billion (US$8.5 billion), from the sale of non-core assets by mid-2016.
► INEOS’s purchase of BASF’s stake in Styrolution and its formation of a PVC partnership with Solvay in November 2014, will grow INEOS’s core basic plastics businesses and help BASF and Solvay home in on specialties.
Strengthening core business
Dow-DuPont mergerThe recently announced Dow-DuPont mega-
merger is expected to create a combined
entity with a market cap of €117 billion
(US$130 billion). It will be further split into
three entities with each focussing on
advanced materials, specialty chemicals and
agrochemicals, respectively, another
instance of retaining focus on the core
competencies.
18.4
11.8
7.4
6.4
4.4
Performance plastics
Performance materials, chemicals
Infrastructure solutions
Agricultural sciences
Consumer solutions
Dow Chemicals: Sales by segment — 2015 (US$ billion)
9.8
5.3
3.5
3.3
2.1
1.2
Agriculture
Performance materials
Safety and protection
Nutrition and health
Electronic and commmunication
Industrial biosciences
DuPont: Sales by segment — 2015 (US$ billion)
+DowDupont
Pro forma: US$74 billion
Agriculture (US$16 billion) Materials (US$46 billion) Specialty products (US$12 billion)
DuPont: Agriculture
Dow: Agriculture sciences
DuPont: Performance materials
Dow: Performance plastics,
Performance materials and
Chemicals, Infrastructure solutions,
Consumer solutions (excluding
Electronic materials)
DuPont: Nutrition and health, Industrial
biosciences, Safety and protection and
Electronics and communications
Dow: Electronic materials business
(Consumer solutions)
Mega-deal may trigger consolidation in European AgrochemicalsAmidst declining crop sales and thereby prices globally, the merger is expected to
create increased competition for their European agrochemicals rivals (BASF,
Syngenta, etc.) in Americas as the combined companies would sell around 16%
of the world’s pesticides and become the third-largest crop chemicals player.
Besides, the merger may have boosted consolidation in global agrochemicals
industry with ChemChina planning to acquire Syngenta and Bayer bidding to buy
Monsanto. However, European companies (such as BASF, Clariant and Bayer)
would have opportunities to buy more assets that may be on sale arising from
anti-trust issues related to the deal.

12 Chemicals in Europe: the way forward
Further, European companies are increasingly directing their investments towards high-growth end markets and emerging markets
The emerging markets contributed more than 40% in the
global chemicals sales in 2014 and the share is only
expected to go up with the high GDP growth outlook.
Hence, European companies are strategizing to expand
their share in emerging regions to capitalize on the growth
opportunities. This is evident from the increasing revenue
share and capital spending in these regions.
► BASF increased its planned capital expenditure in Asia
Pacific from 14% over 2010–14 to 18% in 2015–19. It is
also investing €3.68 billion (US$4 billion) in a
petrochemicals plant in Iran, seeking to more than
double its capacity in the next decade after the lifting of
sanctions.
► Leading soda ash producer Solvay witnessed trebling of
its revenues from Asia-Pacific during 2010–14 with the
region’s share increasing from 14% to 33% in 2015.
In addition, many companies have made organic and inorganic investments in the emerging markets during the last few years:
► Clariant is investing €9.22 million (CHF10 million) in a healthcare packaging manufacturing plant in Tamil Nadu, India. The company is also constructing a masterbatch plant in Saudi Arabia to serve the growing Middle East and African markets.
► Clariant invested about 62% of its total investments in North America and emerging markets in 2014.
► In 2015, LyondellBasell acquired polypropylene compounding assets of Zylog Plastalloys Pvt. Ltd with plans to further expand its India operations.
100 250 100 50
600550 700
370
average 2011–2013
2014 2015E 2016E
Linde’s total capex of major committed projects (in € million)
Mature markets Growth markets
Source: The Linde Group, 1H15 Presentation
6.1 7.1
1.03.5
2010 2015
Solvay – revenue by region
Other regions*
Asia-Pacific
Source: Solvay annual reports€10.6 billion€7.1 billion
Targeting high growth markets
Industrial gases major Linde is extensively investing in their
growth markets (Eastern Europe, Africa, South & East Asia
and Greater China) and North America to achieve its target
of long-term profitable growth.
Driving growth through innovation
While innovation spearheads the growth for every
manufacturing industry, it has become increasingly pivotal for
the chemicals market amid increasing cost competition and
increasing commoditization of chemicals. Global leaders in
chemicals are not only investing in developing innovative
products, but are also taking a more customer-centric
approach to R&D.
Interestingly, European chemicals and plastics makers are
also reducing in-house research and collaborating with
industrial customers to develop customized solutions while
saving on R&D budgets. This often implies partnering with
exclusive supplier contracts.
► BASF has started working with sportswear maker Adidas to make running shoe soles more bouncy.
► Solvay is collaborating with an oil-producing company to develop polymer linings for corroded pipelines
► Lanxess is partnering with VW unit Skoda for innovation related to car parts by developing light-weight materials.
Further, innovation for sustainability, i.e. new and greener
feedstock, sustainable production processes and expanding
portfolios to include greener products are major initiatives by
several chemicals players.
Moreover, stringent regulations in Europe are pushing the
companies to develop eco-friendly products.
► As in September 2014, more than 20% of BASF’s products analyzed (by sales) are contributing significantly to sustainability
As the emerging economies are taking over production of
commodity chemicals business, chemicals players in Europe
are investing in R&D to retain their competitive edge by
supplying products which offer a higher value-add.
*Other regions include Europe, North America and Latin America
13 Chemicals in Europe: the way forward
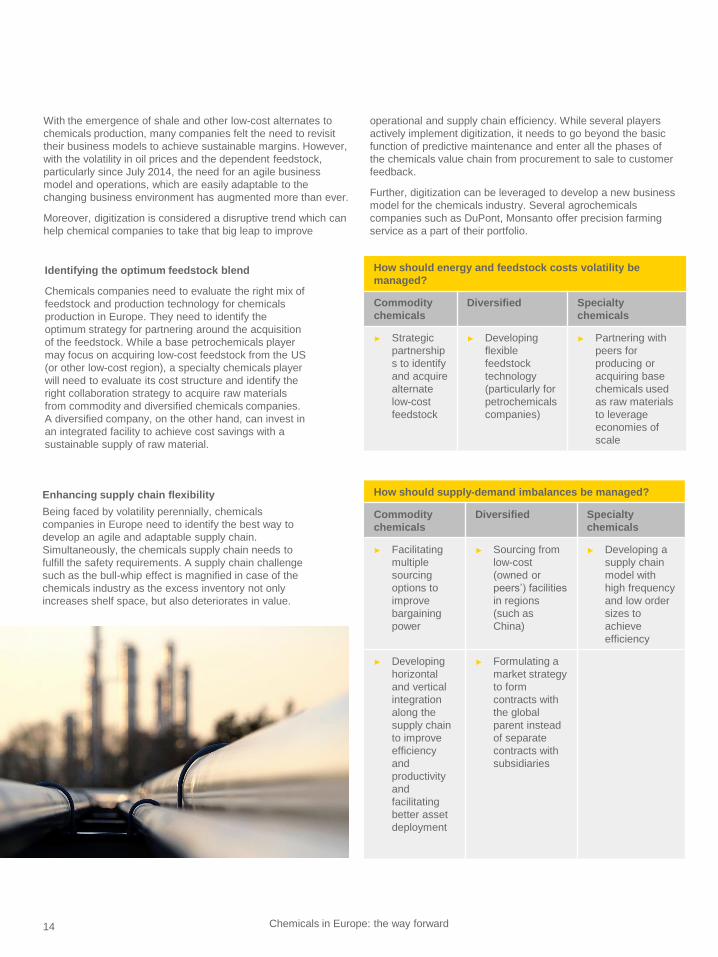
► While restructuring business operations is the need of the hour for European chemicals industry, the industry also needs to have a
focused approach to reorganize their business and operating model. An integrated business model which features a proximity to the
raw material supplier and development of new differentiated products to meet the needs of the end-consumer is an imperative for
the industry.
► Unlike earlier, identifying a high-growth product or industry is not enough for a chemicals player. It requires a consistent evaluation of
the product (and services) portfolio and its validity amidst the current industry scenario. A company needs to manage the complete
chemicals life-cycle of its products. Further, chemicals companies can no longer be oblivious to the needs and preferences of the
end-customer. The chemicals players need to develop specialized products and services for the domain end-user industry of their
customers.
► While doing this, companies also have to be responsible toward society and its stakeholders. They need to produce products that
will improve health, environmental performance and security.
► To facilitate this, the companies need to develop a customized business model considering the value chain hierarchy of its
businesses. After analyzing the top performers of the industry, we present a five-point strategy model that can be considered
chemicals companies.
How should business be structured to
compete in the marketplace?
How should energy and feedstock
cost volatility and supply-demand
imbalances be managed?
Where should the R&D expenditure
and innovation be directed to?
How to procure the suitable skill set
and talent mix?
What combination of product portfolio
will be ideal to meet anticipated future
state?
Refashioning business model
and operations
To facilitate smooth operations,
chemicals companies need to
consistently evaluate and question
their operating model. A close
scrutiny of the operational
parameters, technology and
processes in use, the products in
the market etc. is crucial for a
company’s success in Europe.
Further, vertical and horizontal
integration across the value chain
and functions respectively needs
to be an integral part of the
business model. However, a high
rate of restructuring may also
hinder a company’s growth in the
market. Hence, it needs to
optimize the frequency of
reorganization activities to
maintain leadership’s focus on the
core business.
How should business be structured to compete in the marketplace?
Commodity chemicals Diversified Specialty chemicals
► Reducing investment
in siloed assets and
investing more in
assets at integrated
sites or clusters
► Modifying operations
strategy to focus on
preserving cash,
managing excess
capacity, and securing
access to capital
► Developing integrated
(vertically and
horizontally) and
sustainable supply
chains (greener
modes of transport,
product swaps etc.)
► Utilizing the large asset base
by undertaking shared
manufacturing with peers or
affiliates to leverage
economies of scale
► Expanding capacity in
integrated chemicals
production sites or industrial
parks to optimize costs and
margins
► Integrating continuous
monitoring and evaluation of
operations in the strategy
► Optimizing frequency of
restructuring activities that
may shift management's focus
to internal activities instead of
growing market share
► Developing dedicated
teams comprising of
sector and marketing
experts to collaborate
with each customer
► Teaming with your
clients closely through
digital portals
► Developing direct
sales models for low-
margin products (to
reduce costs)
► Integrating smaller
(but similar) plants or
operations to facilitate
cost efficiency
What strategies can the chemicals players in Europe consider in future?
14 Chemicals in Europe: the way forward
Identifying the optimum feedstock blend
Chemicals companies need to evaluate the right mix of
feedstock and production technology for chemicals
production in Europe. They need to identify the
optimum strategy for partnering around the acquisition
of the feedstock. While a base petrochemicals player
may focus on acquiring low-cost feedstock from the US
(or other low-cost region), a specialty chemicals player
will need to evaluate its cost structure and identify the
right collaboration strategy to acquire raw materials
from commodity and diversified chemicals companies.
A diversified company, on the other hand, can invest in
an integrated facility to achieve cost savings with a
sustainable supply of raw material.
How should energy and feedstock costs volatility be
managed?
Commodity
chemicals
Diversified Specialty
chemicals
► Strategic
partnership
s to identify
and acquire
alternate
low-cost
feedstock
► Developing
flexible
feedstock
technology
(particularly for
petrochemicals
companies)
► Partnering with
peers for
producing or
acquiring base
chemicals used
as raw materials
to leverage
economies of
scale
Enhancing supply chain flexibility
Being faced by volatility perennially, chemicals
companies in Europe need to identify the best way to
develop an agile and adaptable supply chain.
Simultaneously, the chemicals supply chain needs to
fulfill the safety requirements. A supply chain challenge
such as the bull-whip effect is magnified in case of the
chemicals industry as the excess inventory not only
increases shelf space, but also deteriorates in value.
How should supply-demand imbalances be managed?
Commodity
chemicals
Diversified Specialty
chemicals
► Facilitating
multiple
sourcing
options to
improve
bargaining
power
► Sourcing from
low-cost
(owned or
peers’) facilities
in regions
(such as
China)
► Developing a
supply chain
model with
high frequency
and low order
sizes to
achieve
efficiency
► Developing
horizontal
and vertical
integration
along the
supply chain
to improve
efficiency
and
productivity
and
facilitating
better asset
deployment
► Formulating a
market strategy
to form
contracts with
the global
parent instead
of separate
contracts with
subsidiaries
With the emergence of shale and other low-cost alternates to
chemicals production, many companies felt the need to revisit
their business models to achieve sustainable margins. However,
with the volatility in oil prices and the dependent feedstock,
particularly since July 2014, the need for an agile business
model and operations, which are easily adaptable to the
changing business environment has augmented more than ever.
Moreover, digitization is considered a disruptive trend which can
help chemical companies to take that big leap to improve
operational and supply chain efficiency. While several players
actively implement digitization, it needs to go beyond the basic
function of predictive maintenance and enter all the phases of
the chemicals value chain from procurement to sale to customer
feedback.
Further, digitization can be leveraged to develop a new business
model for the chemicals industry. Several agrochemicals
companies such as DuPont, Monsanto offer precision farming
service as a part of their portfolio.
15 Chemicals in Europe: the way forward
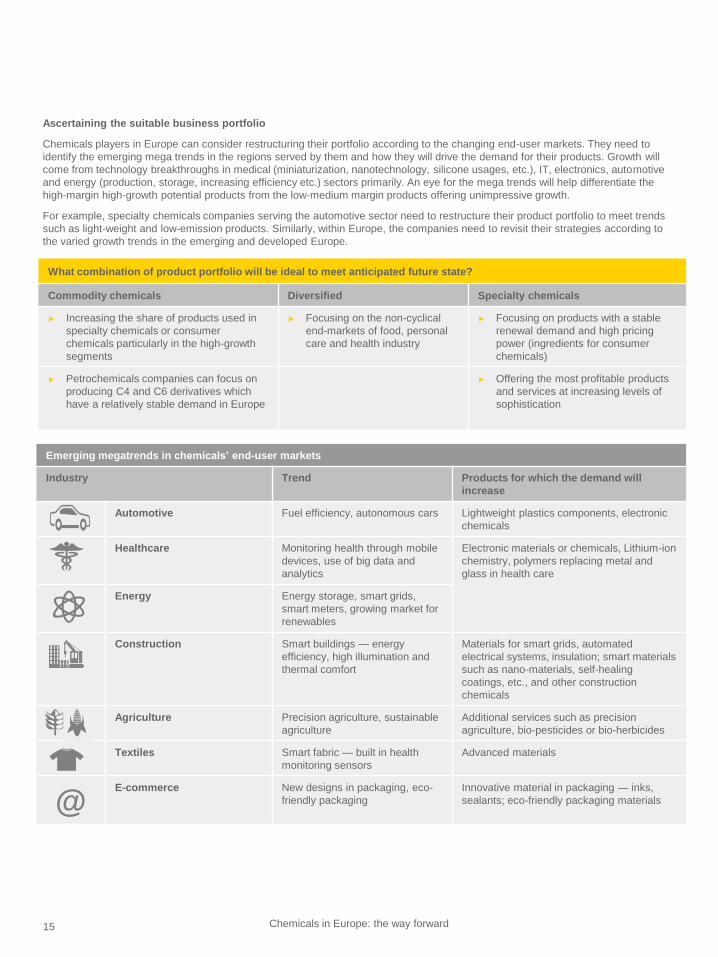
Ascertaining the suitable business portfolio
Chemicals players in Europe can consider restructuring their portfolio according to the changing end-user markets. They need to
identify the emerging mega trends in the regions served by them and how they will drive the demand for their products. Growth will
come from technology breakthroughs in medical (miniaturization, nanotechnology, silicone usages, etc.), IT, electronics, automotive
and energy (production, storage, increasing efficiency etc.) sectors primarily. An eye for the mega trends will help differentiate the
high-margin high-growth potential products from the low-medium margin products offering unimpressive growth.
For example, specialty chemicals companies serving the automotive sector need to restructure their product portfolio to meet trends
such as light-weight and low-emission products. Similarly, within Europe, the companies need to revisit their strategies according to
the varied growth trends in the emerging and developed Europe.
What combination of product portfolio will be ideal to meet anticipated future state?
Commodity chemicals Diversified Specialty chemicals
► Increasing the share of products used in
specialty chemicals or consumer
chemicals particularly in the high-growth
segments
► Focusing on the non-cyclical
end-markets of food, personal
care and health industry
► Focusing on products with a stable
renewal demand and high pricing
power (ingredients for consumer
chemicals)
► Petrochemicals companies can focus on
producing C4 and C6 derivatives which
have a relatively stable demand in Europe
► Offering the most profitable products
and services at increasing levels of
sophistication
Emerging megatrends in chemicals’ end-user markets
Industry Trend Products for which the demand will
increase
Automotive Fuel efficiency, autonomous cars Lightweight plastics components, electronic
chemicals
Healthcare Monitoring health through mobile
devices, use of big data and
analytics
Electronic materials or chemicals, Lithium-ion
chemistry, polymers replacing metal and
glass in health care
Energy Energy storage, smart grids,
smart meters, growing market for
renewables
Construction Smart buildings — energy
efficiency, high illumination and
thermal comfort
Materials for smart grids, automated
electrical systems, insulation; smart materials
such as nano-materials, self-healing
coatings, etc., and other construction
chemicals
Agriculture Precision agriculture, sustainable
agriculture
Additional services such as precision
agriculture, bio-pesticides or bio-herbicides
Textiles Smart fabric — built in health
monitoring sensors
Advanced materials
@E-commerce New designs in packaging, eco-
friendly packaging
Innovative material in packaging — inks,
sealants; eco-friendly packaging materials

16 Chemicals in Europe: the way forward
Attracting the right skill set
To achieve growth in market share
along with margins, a chemicals
company requires three integrated
elements in its talent pool — scientists
who develop innovative products,
industry experts which identify the
emerging need of the dynamic end-user
industry and technology experts which
facilitate consistent upgrading of the
company’s technology to optimize costs.
Companies need to modify their
compensation, HR and employee safety
policies to facilitate a better working
environment so as to position their
companies a lucrative option for
chemical graduates.
How to procure the suitable skill set and talent mix?
Commodity chemicals Diversified Specialty chemicals
► Hiring high share of
technology or
resources experts to
reduce costs
► Hiring major share of
chemicals value chain
experts to facilitate
optimum integration of
manufacturing, supply
chain, logistics etc.
► Investment in
recruiting industry and
research experts to
develop new products
and applications
► Developing safe and
secure working
environment for the
employees
► Providing advanced
skill training to the
existing employees
Reshaping innovation strategy
around the margin driver
Chemicals players in Europe need to
differentiate their innovation investment
strategy according to their customers.
For instance, a commodity chemicals
company which is highly energy- and
feedstock-intensive should invest in
innovation in raw material which
reduces the overall costs and facilitates
sustainable products. Further, the
chemicals players in Europe need to
develop innovation roadmaps with
specific R&D targets for the company in
each — feedstock, processes and
products and solutions — thereby
facilitating a premeditated
apportionment of limited resources.
Where should the R&D expenditure and innovation be directed to?
Commodity chemicals Diversified Specialty chemicals
Feedstock and process
oriented innovation
► Investing in innovation
in alternate technology
or feedstock ( e.g.,
CTO, bio-based) to
reduce cost and
facilitate sustainability
Product-oriented
innovation
► Adopt the ‘innovate to
differentiate’ strategy
facilitating value
addition to its
customers
Solution-oriented
innovation
► Investing in customer-
oriented innovation
and new applications
for their products
► Developing R&D
clouds for leveraging
the expertise available
across the industry
(knowledge sharing)
► Developing local R&D
and technical
capability in the
emerging markets
► Directing innovation to
the high-growth high-
margin products, such
as raw materials for
sustainable products
(light-weight vehicles,
novel solar
photovoltaic
technologies)
17 Chemicals in Europe: the way forward
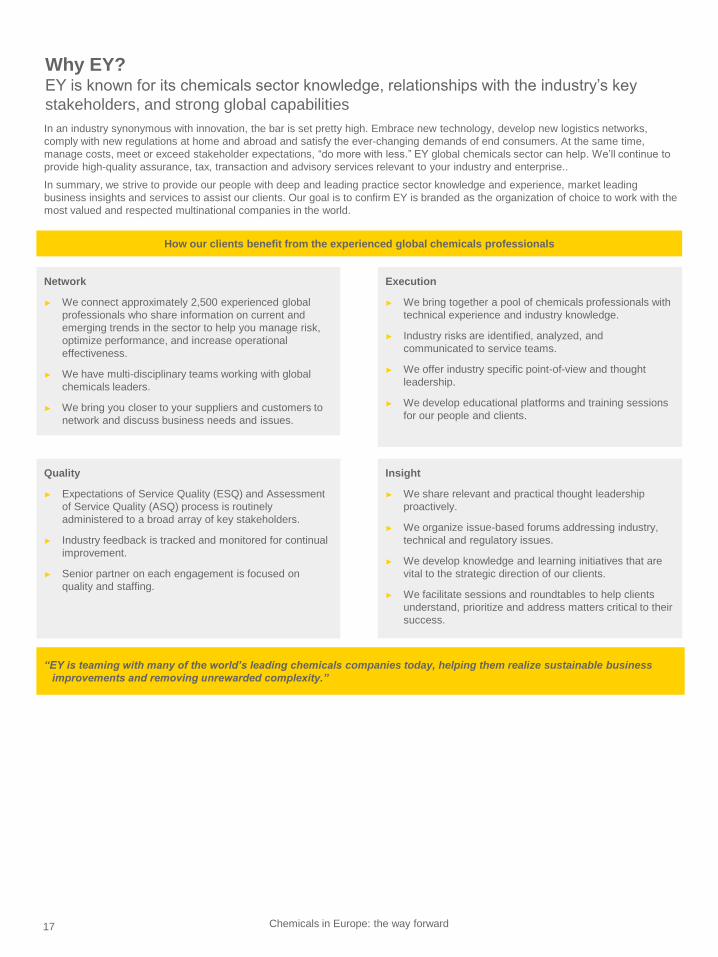
In an industry synonymous with innovation, the bar is set pretty high. Embrace new technology, develop new logistics networks,
comply with new regulations at home and abroad and satisfy the ever-changing demands of end consumers. At the same time,
manage costs, meet or exceed stakeholder expectations, “do more with less.” EY global chemicals sector can help. We’ll continue to
provide high-quality assurance, tax, transaction and advisory services relevant to your industry and enterprise..
In summary, we strive to provide our people with deep and leading practice sector knowledge and experience, market leading
business insights and services to assist our clients. Our goal is to confirm EY is branded as the organization of choice to work with the
most valued and respected multinational companies in the world.
“EY is teaming with many of the world’s leading chemicals companies today, helping them realize sustainable business
improvements and removing unrewarded complexity.”
Network
► We connect approximately 2,500 experienced global
professionals who share information on current and
emerging trends in the sector to help you manage risk,
optimize performance, and increase operational
effectiveness.
► We have multi-disciplinary teams working with global
chemicals leaders.
► We bring you closer to your suppliers and customers to
network and discuss business needs and issues.
Execution
► We bring together a pool of chemicals professionals with
technical experience and industry knowledge.
► Industry risks are identified, analyzed, and
communicated to service teams.
► We offer industry specific point-of-view and thought
leadership.
► We develop educational platforms and training sessions
for our people and clients.
Quality
► Expectations of Service Quality (ESQ) and Assessment
of Service Quality (ASQ) process is routinely
administered to a broad array of key stakeholders.
► Industry feedback is tracked and monitored for continual
improvement.
► Senior partner on each engagement is focused on
quality and staffing.
Insight
► We share relevant and practical thought leadership
proactively.
► We organize issue-based forums addressing industry,
technical and regulatory issues.
► We develop knowledge and learning initiatives that are
vital to the strategic direction of our clients.
► We facilitate sessions and roundtables to help clients
understand, prioritize and address matters critical to their
success.
Why EY? EY is known for its chemicals sector knowledge, relationships with the industry’s key
stakeholders, and strong global capabilities
How our clients benefit from the experienced global chemicals professionals
18 Chemicals in Europe: the way forward
1. “Facts and Figures reports and brochures ,” CEFIC website,
http://www.cefic.org/Facts-and-Figures/, accessed 10 January 2016.
2. “European Chemical Industry Facts and Figures Report 2016,” CEFIC
website, http://www.cefic.org/Facts-and-Figures/, accessed 7 May 2016.
3. “World Economic and Financial Surveys,” IMF website,
https://www.imf.org/external/pubs/ft/weo/2015/01/weodata/download.aspx,
accessed 12 May 2016.
4. “The European Chemicals Industry – Facts and Figures 2016” CEFIC
website, http://www.cefic.org/Facts-and-Figures/, accessed 12 May 2016.
5. “Global Economic Databank,” Oxford Economics website,
https://www.oxfordeconomics.com/forecasts-and-models/countries/data-and-
forecasts/global-economic-databank/overview, accessed 19 May 2016.
6. “Global Automotive Sales Forecast Q3 2015,” LMC Automotive Limited.
7. “Global Construction Outlook: Executive Outlook Fourth Quarter 2013,” IHS
Economics,
https://www.ihs.com/pdf/IHS_Global_Construction_ExecSummary_Feb2014
_140852110913052132.pdf, accessed 1 December 2015.
8. “Dataset: OECD-FAO Agricultural Outlook 2014-2023” OECD Agri-Outlook
website , http://www.agri-outlook.org/, accessed 15 November 2015.
9. “The Global Competitiveness Report 2015-2016 - Competitiveness Dataset,”
World Economic Forum website, http://reports.weforum.org/global-
competitiveness-report-2015-2016/, accessed 2 December 2015.
10. “Asia Refining & Chemicals 2015 Outlook,” Credit Suisse, 27 January 2015,
via ThomsonOne.
11. “Plants” ICIS website, https://www.icis.com/subscriber/plants-and-projects/,
accessed 12 February 2016.
12. “World Economic and Financial Surveys,” IMF website,
https://www.imf.org/external/pubs/ft/weo/2015/01/weodata/download.aspx,
accessed 12 May 2016.
13. “Global Economic Monitor – Data Extract,” World Bank website,
http://data.worldbank.org/data-catalog/global-economic-monitor, accessed
29 November 2015.
14. “European Chemical Industry Facts and Figures Report 2016,” CEFIC
website, http://www.cefic.org/Facts-and-Figures/, accessed 7 May 2016.
15. “Europe’s Global REACH : Costly for the World; Suicidal for Europe,”
https://cei.org/sites/default/files/Angela%20Logomasini%20-
%20Europe%E2%80%99s%20Global%20REACH%20Costly%20for%20the
%20World%20Suicidal%20for%20Europe.pdf, accessed 10 January 2015.
16. A CEFIC publication notes: «Already today, bringing a new chemicals to the
EU market takes three times longer and costs 10 times as much as in the
US.
17. “New projects may raise US ethylene capacity by 52%, PE by 47%,” ICIS
News website,
http://www.icis.com/resources/news/2014/01/16/9744545/new-projects-may-
raise-us-ethylene-capacity-by-52-pe-by-47-/, 16 January 2014.
18. “Eurostat database- Employment by sex, age and detailed economic
activity,” EuroStat website, http://ec.europa.eu/eurostat/data/database,
accessed 28 March 2016.
19. “Guest Editorial: The Professional Status of European Chemists and
Chemical Engineers,” Wiley Online library,
http://onlinelibrary.wiley.com/doi/10.1002/chem.201501364/full, accessed 27
March 2016.
20. “Europe Seeks Chemists,” Chemical & Engineering news website,
http://cen.acs.org/articles/93/i24/Europe-Seeks-Chemists.html, 15 June
2015.
21. “LABOR MARKET REGULATION DATA,” Doing Business Database,
http://www.doingbusiness.org/data/exploretopics/labor-market-regulation,
accessed 17 November 2015.
22. “Worldwide Governance Indicators - Political Stability and Absence of
Violence,” World Bank website,
http://info.worldbank.org/governance/wgi/index.aspx#home, accessed 25
September 2015.
23. “Landscape of European chemical industry,” CEFIC website,
http://www.cefic.org/Documents/Landscape-European-chemical-
industry/Croatia%20-%20Landscape-of-the-European-Chemical-Industry-
March-2014.pdf, accessed 2 February 2016.
24. “Chemical Parks in Europe,” ECSPP, https://chemicalparks.eu/parks,
accessed 29 January 2016.
25. “European Chemical Industry Parks, Chem Manager online,
http://www.chemanager-online.com/en/topics/industrial-sites/european-
chemical-industry-parks, accessed 30 January 2016.
26. “Clariant sets its course,” Specialty Chemicals magazine,
http://www.specchemonline.com/articles/view/clariant-sets-its-
course#.VpTzo_l97IV, 11 October 2015.
27. “Saudi’s Largest Petrozchemicals Company is Investing in U.S. Shale Gas,”
Oil & Gas 360, http://www.oilandgas360.com/saudis-largest-petrochemical-
company-is-investing-in-u-s-shale-gas, 27 July 2015.
28. “CEO Perspective: The Internet of Things for Chemicals,”
http://www.iotsworldcongress.com/documents/4643185/e5b74e77-cd4e-
43ee-a776-3ea0bd60003b, accessed 10 January 2015.
29. “BASF US methane-to-propylene plant targets '19 start-up,” ICIS,
http://www.icis.com/resources/news/2014/05/02/9777829/basf-us-methane-
to-propylene-plant-targets-19-start-up/, 2 May 2014.
30. “BASF Chemical Evaluates Investment in World-Scale Methane-to-
Propylene Complex on U.S. Gulf Coast,” IHS Chemical,
https://www.ihs.com/pdf/Research-Note-BASF-
Propylene_186332110913049832.pdf, 5 May 2014.
31. “Novozymes, Cargill continue bio-acrylic acid partnership as BASF exits,”
Novozymes website, http://www.novozymes.com/en/news/news-
archive/Pages/Novozymes-Cargill-continue-bio-acrylic-acid-partnership-
BASF-exits.aspx, 27 January 2015.
32. “BASF-Purac JV Starts Bio-Succinic Acid Plant in Spain, Chem Manager,
http://www.chemanager-online.com/en/news-opinions/headlines/basf-purac-
jv-starts-bio-succinic-acid-plant-spain, 5 May 2014.
33. “Biomass for chemicals manufacture in India,” Chemicals weekly, 16th
Annual business outlook conference, 14 April 2014.
34. “TTIP has significant benefits for US, EU Chemical Industries,” HIS Chemical
Week website, http://www.chemweek.com/chem_ideas/Guest-Author/TTIP-
has-significant-benefits-for-US-EU-Chemical-Industries_73833.html,
accessed 27 January 2016.
35. “Reliance Industries to save $450 million/year by importing ethane from US,”
Economic Times website, http://articles.economictimes.indiatimes.com/2014-
08-27/news/53285000_1_reliance-industries-clsa-feedstock, 27 April 2014.
36. “US Ethane Export “Activity, Challenges and Outlook,” Platts website,
http://www.platts.com/IM.Platts.Content/ProductsServices/ConferenceandEv
ents/2014/pc434/presentations/Peter_Manning.pdf, September 2014.
37. “INEOS signs agreement with ExxonMobil Chemical Limited and Shell
Chemicals Europe BV to supply ethane from US shale gas from
Grangemouth to the Fife Ethylene Plant in Scotland.” INEOS press release,
http://www.ineos.com/news/ineos-group/ineos-signs-agreement-with-
exxonmobil-chemical-limited-and-shell-chemicals-europe-bv, 9 November
2015.
38. “INEOS Signs Second Deal To Ship More Ethane To Europe – And Orders
More Ships,” INEOS magazine, http://www.ineos.com/inch-
magazine/articles/issue-6/ineos-signs-second-deal-to-ship-more-ethane-to-
Europe, accessed 9 June 2016.
39. “CEO Perspective: The Internet of Things for Chemicals,”
http://www.iotsworldcongress.com/documents/4643185/e5b74e77-cd4e-
43ee-a776-3ea0bd60003b, accessed 10 January 2015.
40. “Clariant sets its course,” Specialty Chemicals magazine,
http://www.specchemonline.com/articles/view/clariant-sets-its-
course#.VpTzo_l97IV, 11 October 2015.
41. “Saudi’s Largest Petrozchemical Company is Investing in U.S. Shale Gas,”
Oil & Gas 360, http://www.oilandgas360.com/saudis-largest-petrochemical-
company-is-investing-in-u-s-shale-gas, 27 July 2015.
42. “CEO Perspective: The Internet of Things for Chemicals,”
http://www.iotsworldcongress.com/documents/4643185/e5b74e77-cd4e-
43ee-a776-3ea0bd60003b, accessed 10 January 2015.
43. “Clariant Excellence,” Clariant Annual report 2011, http://annual-
report.clariant.com/uploads/tx_szmediacenter/Clariant_Excellence.pdf.
44. “Clariant Excellence Initiative Produces Corporate-wide Shake-up,” Process
worldwide, http://www.process-worldwide.com/clariant-excellence-initiative-
produces-corporate-wide-shake-up-a-354470/, 19 March 2012.
45. “The Internet Of Things: 5 Real-World Examples Of What It Means For The
Chemicals Industry (Part 1),” Digitalist magazine website,
http://www.digitalistmag.com/industries/chemicals/2014/12/09/the-internet-
of-things-what-it-means-for-the-chemicals-industry-01862495, 9 December
2014.
46. “Tata Sons CTO sets the agenda for tech innovation,” Business Standard
website, http://www.business-standard.com/article/companies/tata-sons-cto-
sets-the-agenda-for-tech-innovation-115052001194_1.html, 21 May 2015.
47. “UPDATE 1-BASF prepares for new cutbacks, slows investment spend,”
Reuters website, http://www.reuters.com/article/basf-se-outlook-
idUSL5N11Y1A720150928, 28 September 2015.
48. “INEOS to acquire BASF’s share in Styrolution,” INEOS press release,
http://www.ineos.com/news/ineos-group/ineos-to-acquire-basfs-share-in-
styrolution, accessed 16 June 2016
49. “MERGER UPDATE & FORM S-4 HIGHLIGHTS,” DuPont company website,
http://s2.q4cdn.com/752917794/files/doc_presentations/2016/presentation/S
-4-Presentation-FINAL.pdf, 1 March 2016.
50. “Future: Focused,” The Dow Chemical Company 2015 Annual Report, The
Dow Chemical Company.
References
19 Chemicals in Europe: the way forward
EY Europe
Michiel Swets
Partner – TAX
+31 88 40 78517
The Netherlands
Frank Leenders
Partner – Advisory
+31 88 40 78812
The Netherlands
Tobias Broeders
Senior Manager – TAS
+31 88 40 79123
The Netherlands
Steve Whicher
Energy & Resources BD Leader, EMEIA
+31 6 2125 1389
The Netherlands
EY Americas
Jade Rodysill
Partner – Advisory
+12149698650
The US
Bradley Newman
Partner – Advisory
+17732307793
The US
EY Asia-Pacific
Shiju Suto
Partner – Assurance
+81 3 3503 1100
Japan
Acknowledgements
Daksh Tyagi
Bhavna Pruthi
Jiwanjot Singh
EY India
Devinder Chawla
Partner – Advisory
+91 124 6714610
India
Paolo Prisco
Partner – Advisory
+41 58 286 8544
India
Contacts
EY | Assurance | Tax | Transactions | Advisory
About EY
EY is a global leader in assurance, tax, transaction and advisory services.
The insights and quality services we deliver help build trust and
confidence in the capital markets and in economies the world over. We
develop outstanding leaders who team to deliver on our promises to all of
our stakeholders. In so doing, we play a critical role in building a better
working world for our people, for our clients and for our communities.
EY refers to the global organization, and may refer to one or more, of the
member firms of Ernst & Young Global Limited, each of which is a
separate legal entity. Ernst & Young Global Limited, a UK company limited
by guarantee, does not provide services to clients. For more information
about our organization, please visit ey.com.
© 2016 EYGM Limited.
All Rights Reserved.
EYG no. 01612-162Gbl
ED None
This material has been prepared for general informational purposes only and is not
intended to be relied upon as accounting, tax, or other professional advice. Please
refer to your advisors for specific advice.
ey.com