Embed Size (px)
Citation preview

OAK RIDGE NATIONAL LABORATORY LIBRARIES
(1((1lllllllI(lll//llllllllllllllllllllllllllll1l1ll!llllllI 3 L(L(5b 05b9808 2
CHEMICALS FOR ENHANCED OIL RECOVERY
Biennial Report April 1978 - March 1980
Work Performed for the Department of Energy Under Contract W-7405-eng-26
Date Published-March 1981
Oak Ridge National Laboratory Oak Ridge, Tennessee
-1 1
*
ORNL INFORMATION DIVISION TECHNICAL LIBRARY
Documcnt Rc[erence Section Building 971 1-1, Y-12
LOAN COPY ONLY ~
Do NOT transfer this document to ony other perron. I f you wont others to see it. attach their names.. return the document. ond the Library will arrange the loan os requested.
UCN-I620 (3 12-79)
U. S. DEPARTMENT OF ENERGY

D ISC LA1 ME R
"This book was prepared as an account of work sponsored by an agency of the United States Government. Neither the United Stares Government nor any agency thereof, nor any of their employees, makes any warranty, express or implied, or assumes any legal liability or responsibility for the accuracy, completeness, or usefulness of any information, apparatus, product, or process disclosed, or represents that i t s use would not infringe privately owned rights. Reference herein to any spectfic commercial product, process, or service by trade name, trademark, manufacturer, or otherwise, does nor necessarily constitute or imply i t s
endorsement, recommendation, or favoring by the United States Government or any agencv thereof. The views and opinions of authors expressed herein do not necessarily state or reflect those of the United States Government or any agency thereof."
Available from the National Technical Information Service, U.S. Department of Commerce, Springfield, Virginia 22161.
NTIS price codes Paper copy: $11.00 Microfiche copy: $ 3.50
D O E / B E T C / O R - l l Distribution Category UC-92a
CHEMICALS FOR ENHANCED OIL RECOVERY Biennial Repor t for the Period
April 1978-M~~h 1980
BY
A. L. Compere J. M. Crenshaw
S. V. Greene W. L. Griffith J. E. Hall, Jr .
J. S. Johnson, Jr. R. M. Jones L. J. Magid R. Triolo
C. G. Westmoreland
James S . Johnson, Jr., Principal Investigator Oak Ridge National Laboratory
Chemistry Division P.O. Box X
Oak Ridge, Tennessee 37830
Fred W. Burtch, Technical Project Officer Bartlesville Energy Technology Center
P.O. Box 1 3 9 8 Bartlesville, Oklahoma 74003
Date hbl ished-March 1981
Work Performed for t h e Department of Energy Under Contract W-7405-eng-26 with t h e Union Carbide Corporation
Research Sponsored by the Division of Fossil Fuel Extraction
U. S. DEPARTMENT OF ENERGY

Preface
This report was prepared with the support of Fossil Fuel Extraction / Department of Energy. It represents work performed under the Chemicals ,for Enhanced Oil Recovery program at Oak Ridge National Laboratory. Dr. Fred W. Burtch, of the Bartlesville Energy Technology Center, is the contract monitor for this research.
I’
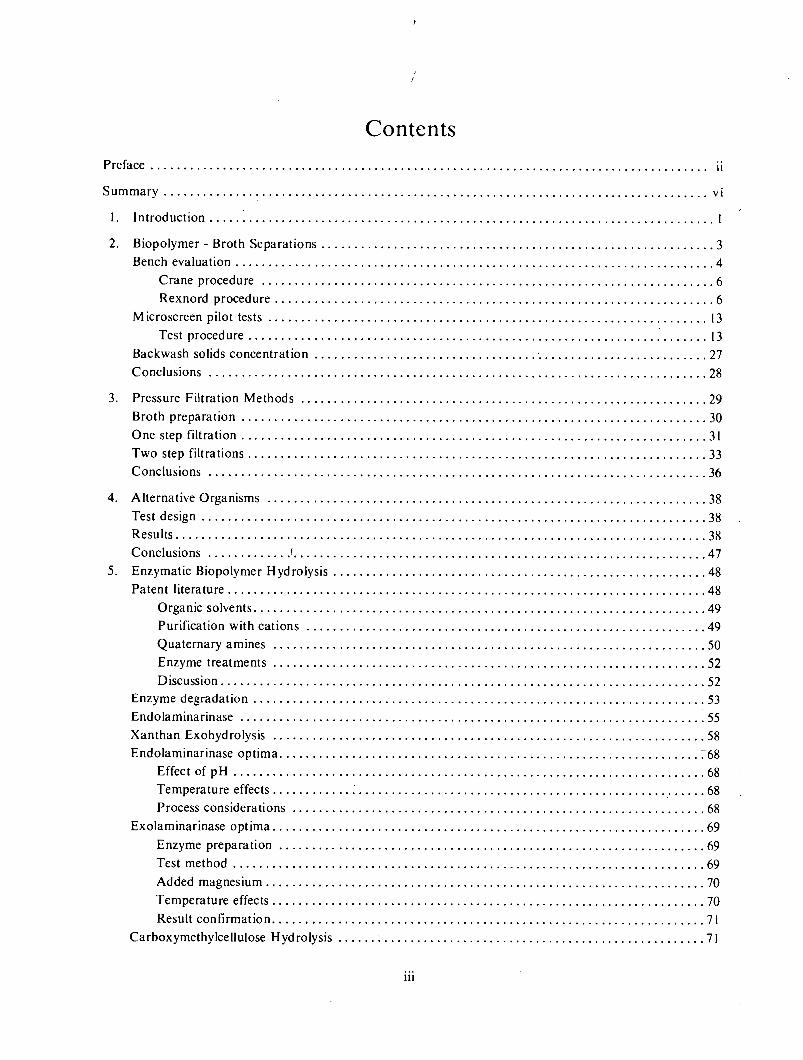
Contents Preface ..................................................................................... I I
Summary ................................................................................... v i
1 . Introduction ............................................................................. i
2 . Biopolymer . Broth Separations ............................................................ 3 Bench evaluation ......................................................................... 4
Crane procedure ..................................................................... 6 Rexnord procedure ................................................................... 6
13 Test procedure 13
Conclusions ............................................................................ 28
3 . Pressure Filtration Methods 29 Broth preparation ....................................................................... 30 One step filtration ....................................................................... 31
Conclusions ............................................................................ 3.
4 . Alternative Organisms 38 Test design 38
M icroscreen pilot tests ...................................................................
Backwash solids concentration ................................. . I .......................... 27 ......................................................................
..............................................................
Two step filtrations ...................................................................... 33
................................................................... .............................................................................
Results ................................................................................. 38 Conclusions . . . . . . . . . . . . . !. .............................................................. 47
Enzymatic Biopolymer Hydrolysis ......................................................... 48
Organic solvents ..................................................................... 49 Purification with cations ............................................................. 49
Enzyme treatments .................................................................. Discussion .......................................................................... 52
Xanthan Exohydrolysis .................................................................. 58 Endolaminarinase optima ................................................................ 1.68
Temperature effects ............................................................ .. . . . . . 68 Process considerations ............................................................... 68
Exolaminarinase optima .................................................................. 69 Enzyme preparation ................................................................. 69
Added magnesium ................................................................... 70 Tempera tu re effects .................................................................. 70 Result confirmation .................................................................. 71
Carboxymethylcellulose Hydrolysis ........................................................ 71
5 . ......................................................................... Patent literature 48
Quaternary amines .................................................................. 50 52
Enzyme degradation ..................................................................... 53 Endolaminarinase ....................................................................... 55
Effect of pH ........................................................................ 68
. .
Test method ........................................................................ 69

6 .
7 .
8 .
9 .
.
IO .
I I .
I2 .
13 .
14 .
15 .
Sclerotium Salinity Tolerance ............................................................. 72 Results ................................................................................. 72 Conclusions ............................................................................ 75
Innoculum Production ................................................................... 76
Neutral Solvents Production .............................................................. 79 Preliminary experiments with wood wastes ................................................. 80 Operating plant comparison .............................................................. 82 Process energy balance ................................................................... 83
Phase Behavior and Interfacial Tensions of Aqueous-Hydrocarbon Systems Containing Alkyl Substituted Sodium-Oleates ............................................... 85 Phase benavior and interfacial tensions of systems containing sodium- 2-e t hy lo lea te ............................................................................ 86
Phase volumes ...................................................................... 87 Interfacial tension ................................................................... 95 Salinity effects ...................................................................... 98 Phase behavior of systems containing sodium oleate having other substituents next to the carboxylate ................................................................... 99
Interfacial Tension and Phase Behavior of Tall Oil Components .............................. 102 Sodium oleate ......................................................................... 102 Tall oil ................................................................................ 105 Sulfonated tall oils ...................................................................... 105 Phase Behavior in Multicomponent Systems Containing Tall Oil Ethoxylates and Related Surfactants ................................................................ 107
Mixtures of Ethoxylated Tall Oils and Petrostep 465 ........................................ 1 IO
Aggregation Properties of Branched Chain Sodium Alkylbenzenesulfonates in Water . . . . . . . . . . . . 113
Sacrificial Agents ....................................................................... 115 Experimental .......................................................................... 117 Results ................................................................................ 118
Adsorption of surfactant o n solids .................................................... 119 Comparison of various substances generated in the pulping of wood ...................... 123 Caustic extract and montmorillonite .................................................. 124 Caustic extract and kaolin ........................................................... 129 Caustic extract and berea sandstone .................................................. 129 Effect of caustic extract o n interfacial tensions .......................... i .............. 131
Discussion .............................................................................. 131
n;liscella.nea ............................................................................ 133
..... . .
16 . Materials and Methods .................................................................. 134 Chemical analyses ...................................................................... 134
Biomass and polymer determinations .................................................. 134 Brookfield viscosity ................................................................. 134
iv

Fatty acid analyses ................................................................. I34 Neutral solvents determinations ...................................................... i35 Nitrate specific electrode ............................................................ i35
Plugging ........................................................................... 135
Suspended solids ................................................................... 135 Two phase titration method for determination of anion active detergent ................... 135
Culture management ..................................................................... I36 Biopolymer broth production ........................................................ 136 Biopolymer media .................................................................. 136
Enzyme production medium ......................................................... 136 Enzyme purification from fungal cultures .............................................. 136 Enzyme purification from HP-I 50 .................................................... 137 Enzyme incubation ................................................................. 137 Fungal culture preservation .......................................................... 137 One-liter fermentations .............................................................. 137 Ten-liter fermentations .............................................................. 137 360-liter fermentations .............................................................. 137
Filtration and screening ................................................................. 137 Axial filtration ..................................................................... 137
Batch microscreen tests .................................................................. 139
Envirex procedure .................................................................. 139 Microscreen pilot procedure ............................................................. 139 Organic Synthesis ...................................................................... 140
Oleic acid ......................................................................... 140 Synthesis and purification of 2-substituted oleic acids ................................... 140
Petroleum sulfonate purification ....................................................
. Publications 148
pH ............................................................................... 135
Reducing sugar .................................................................... 135
Clostridia ......................................................................... 136
Crane procedure ................................................................... 139
. 142
17 . References t 143
18 ........................................................................... .......................................................................... . .
V

Summary Biopolymers. Important improvements in the economics of biopolymer production, particularly field
products, would be realized by better methods of separation of polymers from fermentation broths and by removing constituents which tend to plug formations. Microscreens are rotating low-pressure filters on drums. Because their operation is continuous and they produce a solids stream which might find further use as a byproduct, we investigated microscreens for potential use in filtration of biomass from biopolymer. We performed manufacturer’s bench tests on Crane and Rexnord microscreens ranging between 1 and 60 pm aperture, in both stainless steel and dacron polyester. Based on the test results we secured the cooperation of Rexnord in tests with their pilot microscreen unit. We carried out two 360 liter fermentations with the ORNL Biology Division a t their Large Fermenter Facility, and performed continuous separations on diluted broth using I , 6, and 21 pm polyester media. We found no apparent polymer loss in a straight through separation, and obtained gross fractional removal of biomass ranging between 0.5 and 0.8 for the runs; Rexnord indicates that separations improve slightly with larger equipment. Further concentration of microscreen backwash solids by centrifugation was successful. M icroscreens compare favorably in installed cost and operating energy to diatomaceous earth (DE) filtration and centrifugation for gross biomass removal.
Tests of tangential filtration methods, which permit continuous removal of solids during filtration and which d o not generally require body feed or precoat, as a polishing step gave promising results. The effluents produced had low plugging rates. In favorable cases, there was little difference in viscosity between feed and filtrate. However, a more thorough investigation of these methods in conjunction with pilot microscreen tests are needed to optimize flows, pretreatment, and plugging tests, so that good cost estimates can be prepared.
Seven fungi from genera other than Sclerotium, Helotium, or Stromatinia were tested as potential biopolymer producers. Although gum production was low, four of the organisms appeared to be potential candidates for further study. Six of the organisms which were tested are from genera which are currently accepted as commercially produced edible mushrooms. Use of such alternative organisms could decrease the clearance problems associated with feed use of fungal biomass.
Batch and continuous methods for the enzymatic hydrolysis of scleroglucan and xanthan to increase the flux of these materials through porous media without decreasing their viscosity were developed. These methods use enzymes which make controlled mid-chain polymer breaks. Methods of hydrolyzing polymers sequentially from the ends were also investigated, and pH and temperature optima for these were obtained. In the case of scleroglucan, a bound enzyme column was successfully used for hydrolysis.
Several short tests on Scleroiium media were performed. Based on one liter tests with NaCl and synthetic seawater, it appears that media containing either NaCl or synthetic sea salts near seawater salinities are suitable for growth and polymer production by Sclerotium. If confirmed in larger fermentations, use may be advantageous in areas where water quality or salinity is a major factor.
We have investigated the production of frozen innocula for use in field fermentation, because they could be less costly for field installations than on-site production of starter culture. It appears that use of doubled nitrogen and phosphorus together or doubled phosphorus alone increases the amount ofculture biomass without greatly increasing the culture viscosity. Increasing the amount of oxygen in sparge gas increases culture polymer production relative to culture biomass production.
Cosurfactant. Coagent synthesis from a variety of wood wastes was investigated. Coagent alcohols and alcohol-ketone mixture were readily produced from weak acid sulfite liquor, condenser effluent, and thermomechanical effluent streams. Weak acid sulfite liquor appeared the most promising because of concentration, lower toxicity, and availability. Cost evaluations and computer simulations indicate that the neutral solvents mixtures which can be produced from wood waste streams are potentially easier and cheaper to separate from fermentation media than ethanol.
Surfactants. Emphasis continued on sodium oleates and derivatives of this fatty-acid salt, because of the wide occurrence of this compound in natural products, including tall oils from the pulping of softwoods. Shifts reported earlier in the optimal alkane with concentration of sodium 2-ethyloleate with surfactant concentration were found to arise from impurities. Preparations of pure sodium oleate and a number of derivatives with substituents on the carbon next to the carboxylate were carried out and their phase behavior in systems containing a fixed cosurfactant were compared as a function of alkane molecular weight and of NaCl
vi
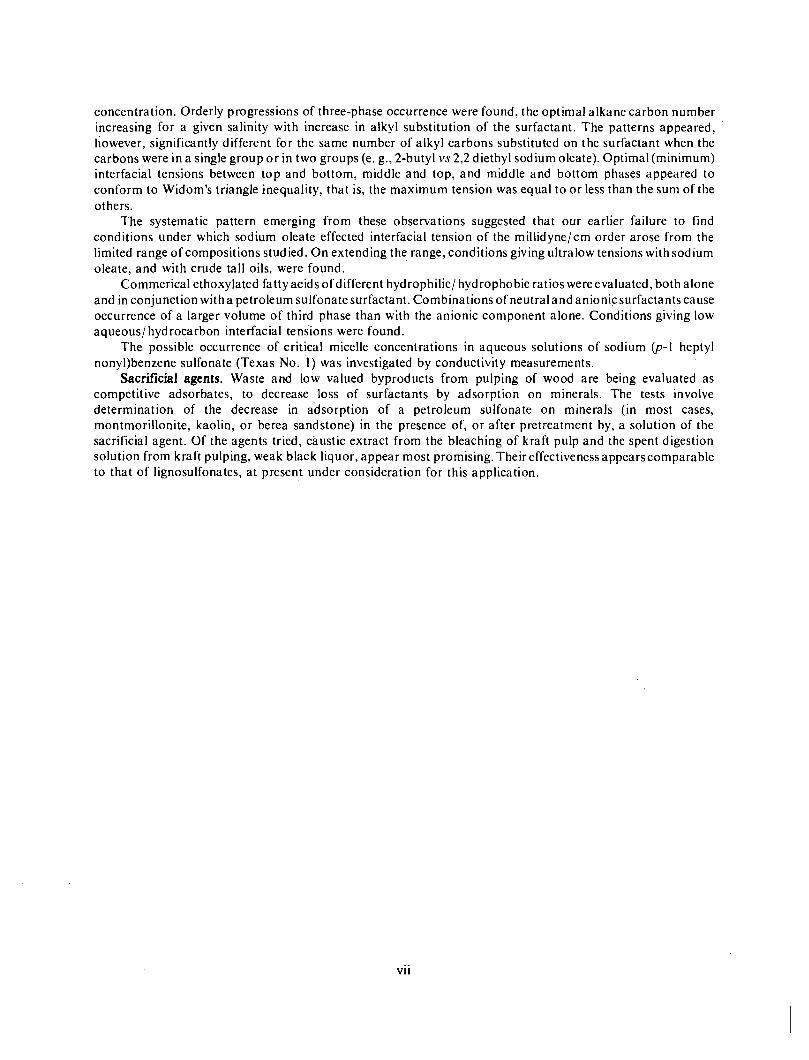
concentration. Orderly progressions of three-phase occurrence were found, the optimal alkane carbon number increasing for a given salinity with increase in alkyl substitution of the surfactant. The patterns appeared, however, significantly different for the same number of alkyl carbons substituted on the surfactant when the carbons were in a single group o r in two groups (e. g., 2-butyl vs 2,2 diethyl sodium oleate). Optimal (minimum) interfacial tensions between top and bottom, middle and top, and middle and bottom phases appeared to conform to Widom’s triangle inequality, that is, the maximum tension was equal to or less than the sum of the others.
The systematic pattern emerging from these observations suggested that our earlier failure to find conditions under which sodium oleate effected interfacial tension of the millidynelcm order arose from the limited range of compositions studied. O n extending the range, conditions giving ultralow tensions with sodium oleate, and with crude tall oils, were found.
Commerical ethoxylated fatty acids of different hydrophilic/ hydrophobic ratios were evaluated, both alone and in conjunction with a petroleum sulfonate surfactant. Combinations of neutral and anionic surfactants cause occurrence of a larger volume of third phase than with the anionic component alone. Conditions giving low aqueous/ hydrocarbon interfacial tensions were found.
The possible occurrence of critical micelle concentrations in aqueous solutions of sodium (p- I heptyl nony1)benzene sulfonate (Texas No. 1) was investigated by conductivity measurements.
Sacrificial agents. Waste and low valued byproducts from pulping of wood are being evaluated as competitive adsorbates, to decrease loss of surfactants by adsorption on minerals. The tests involve determination of the decrease in adsorption of a petroleum sulfonate on minerals (in most cases, montmorillonite, kaolin, o r berea sandstone) in the presence of, o r after pretreatment by, a solution of the sacrificial agent. Of the agents tried, caustic extract from the bleaching of kraft pulp and the spent digestion solution from kraft pulping, weak black liquor, appear most promising. Their effectiveness appearscornparable to that of lignosulfonates, at present under consideration for this application.
vii


1. Introduction
The objective of Chemicals.for Enhanced Oil Recovery is to lower barriers to implementation of the micellar flood ap- proach by decreasing cost and increasing availability of chemicals used in the process. We attempt to d o this by finding alternative feedstocks in wastes o r low valued organic byproducts and by development of lower cost production procedures. For biopolym- ers in particular, we have emphasized developments important for field produc- tion, to obviate the expense necessary for preparation of a dry product, feasible for shipping, and of redispersion for injection into formations.
Because of the large quantities of waste and low valued byproducts generated by the paper industry, wood pulping streams have received particular attention. We have been interested not only in surfactants and mobility control polymers, but also in cosurfactants, sequestering agents for con-
trol of hardness, and competitive adsor- bates.
This report is for the period 1 April 1978 to 30 March 1980. It summarizes the results obtained on this program since those in Report BETC/W26-4 for April 1977 to April 1978. This work has been previously covered in letter monthly reports during calendar 1978 and in quarterly reports during 1979. With the concurrence of our sponsor, results obtained in the January- March 1980 (Winter) quarter are also included, and there will not be a separate report issued for that period.
Topics of particular interest during the quarter covered by this report are men- tioned in the Summary. For the benefit of those who may wish more information, listed below are people who are particularly involved in the various areas, along with their phone numbers.
Contacts for further information.
Research area Contact FTS phone Commercial phone
Alcohol coagents Biopolymers Competitive ad sorbates Membrane filter modules
M icroscreens Tall oils:
Substituted sodium oleate Tall oil related
Micelle structure non-ionic surfactants
A. L. Compere, W. L. Griffith A. L. Compere, W. L. Griffith J . S. Johnson, J r . W. L. Griffith J . S. Johnson, Jr . W. L. Griffith, A. L. Compere
R. M. .Iones' L. Magid (ORNL) L. Magid (UT) R. Triolo
624-4970 624-4970 624-4982 624-4970 624-4982 624-4970
6244990 855-8 I 19 624-5042
6 15-574-4970 61 5-5744970 6 15-574-4982 6 15-574-4970 6 15-574-4982 6 15-574-4970 9 19-76 I -5758
6 15-574-4990 6 I 5-974-8 I I9 6 15-574-5042
'NOW at Department of Chemistry, Wake Forest University, Winston-Salem, N . C. 27109.
I

We continue our previous practice of main categories are separation of biopolym- including accounts of research likely to be of ers from fermentation broth and phase and interest to readers of this report, carried out interfacial studies of systems containing under support of the Division of Chemical substituted sodium oleates and other sur- Sciences, Basic .. Energy Sciences, DOE. - - The factants.
2

2. Biopolymer - Broth Separations
Microbial polysaccharides are being increasingly used a s high viscosity polymers in micellar flooding. However, present costs of biopolymer at the wellhead are relatively high. Field production is under considera- tion to avoid the cost of preparing the polymer in a dry form suitable for shipment over large distances as well as problems in redispersion of polymer for injection.
Whether or not the biopolymer is precipi- tated prior to field use, separation of biomass from the fermentation broth is a major consideration in polymer quality. During passage through a porous oil bearing formation, the final polymer solu- tion may be required to travel through hundreds of meters of passages of micron diameter without plugging those passages. In the production of scleroglucan, a fungal biopolymer, separation of biomass from broth is generally accomplished by diatoma- ceous earth filtration (Rogers 1973). In the case of xanthan gum, a bacterial polysac- charide, centrifugation has been used (Rogovin, Anderson, and Cadmus 1961). Other methods of biomass-broth separation which have been investigated include foam fractionation, flocculation, and electro- phoresis. These methods were reviewed by Freeman (1964) and Wang and Sinskey (1970). Among the difficulties encountered with conventional filtration methods are partial loss of the polymer from the solution along with the biomass and the production of large quantities of waste when filter aids are used to increase cake permeability. Elimination of diatomaceous earth filtra- tion would not only save the purchase and disposal costs of filter aid, but would avoid contamination of biomass with material which might interfere with its beneficial use as a byproduct. Byproduct uses of fungal biomass could include supplementation of
animal feeds as a replacement for current organic nitrogen sources.
Results with tangential flow filtration methods (Chapter 3) using the axial filter and the Gelman tangential flow cartridge inclined us to the view that _ _ - the separation may be best carried out in two steps: a prescreening to remove most of the biomass, followed by passage through a filter sheet having pores on the order of micrometers. In both steps, movement of the filter relative to feed, either by mounting the filter on a rotor (axial filtration) o r by pumping the feed past the filter surface (crossflow filtration), has been found to be beneficial in retarding buildup of filter cake. Filter cake buildup can decrease flux and result in loss of polymer in passage through the filter.
Microscreens are gravity filters consisting of a slowly rotating horizontal drum whose cylindrical surface is covered with a porous medium. Fig. 2.1 shows fluid flow through an operating microscreen unit mounted in a concrete or metal vessel. Fluid enters the drum a t one end and flows out radially through the filter fabric. Solids are retained on the inner surface of the drum as the flow passes through the drum. These solids form a layer of material which intercepts even
- -~ -
ORNL 016 7 9 - 9 4 4
Fig. 2.1. Schematic of conventional wastewater microscreen.
3

smaller size particles. Filter cake is con- trolled by a short backwash cycle, once each rotation. During the backwash cycle the accumulated solids are removed from the medium by a pressurized spray wash system mounted over the top of the drum. Gener- ally, screened effluent is used for this purpose although water or compressed air are sometimes utilized.
The important process design variables are drum size, rotational speed, media used, pore size, hydraulic head, and backwash rate. In order to assess these variables and to make possible estimates of the utility and potential cost of microscreening as a method for gross biomass removal, bench tests were conducted using procedures developed by the Crane Company and by Rexnord, Incorporated, two suppliers of this type of equipment. These procedures allow esti- mates of the size of equipment which would be necessary for a given throughput and provide information on suspended solids removal. They d o not produce enough filtrate for either plugging or second stage filtration tests.
BENCH EVALUATION
Viscosity and flow characteristics of the culture broth are not linear functions of polymer concentration. Since the required microstraining might be expected to vary with concentration of biopolymer and solids, existence of a minimax point corre- sponding to an optimal biopolymer solution concentration range is possible. Initially, polymer concentrations of 0.5, 1, 2, and 4 g/ liter were tested as shown in Fig. 2.2. using a procedure, - liquid holder, and three stainless steel filters kindly provided by E. W. .I. Diaper, J r . of Crane. Although the screen apertures were larger than we would have desired - 23, 35, and 60 p m - they are commercially available for wastewater
ORNL D W G 79 -776
2 " I O I 4 . 5 " P L E X I G L A S
R U B B E R O - R I N G S
b-* S T A I N L E S S - S T E E L MEDIA
Fig. 2.2. Apparatus developed by Crane Company to estimate microscreen requirements.
treatment units. Another reason for testing them was that a larger functional screen size would probably achieve a higher flowrate a t a given hydraulic head. The mean volume of filtrate in 9 sec wasmeasured for each screen size at each polymer concentration. Sus- pended solids (dried and ashed residue) tests and viscosities were performed on small influent and effluent samples. The culture broth used was first neutralized with KOH to a pH between 6 and 8. The neutralized broth was heated to 80 C for 30 min and blended in a Waring blender for at least 2 min. After cooling to 25 C, culture broth was diluted prior to filtration and reblended.
The apparatus used in the Rexnord procedure is shown in Fig. 2.3. Although the test is conducted in an similar manner, the Rexnord apparatus was designed to provide a large surface area at the top to maintain a more constant head on the filter and eliminate turbulence due to refilling. Use of a close fitting plug to, minimize dead space
4

ORNL-DWG 79-856
MULTIPLE TUBES FOR DIFFERENT HL
--SCREEN SAMPLE /7 gapLuG
Fig. 2.3. Apparatus developed by Rexnord to estimate microscreen requirements.
under the media before the start of the run was important when small permeate vo- lumes were collected. In addition the filter head can bevaried by changing pipe sections above the filter. Test intervals of 10 or 25 sec were used, but flow usually ceased earlier. Hydraulic head was maintained at either 11.0 or 20.5 in. of broth. The stainless-steel media included the media utilized with the Crane procedure and a 15 pm screen which was not available for the Crane test. Polyester media sizes of 1, 6, 17, and 21 pm were tested. Filtrates from several flow trials were collected for the same run conditions. It was necessary to pool these filtrates to obtain sufficient sample to determine the biomass removal efficiencies. Culture broth neutralization and heating was used as a preprocess treatment for all of the tests which used the Crane procedure. Treatment of culture broth was varied during the tests using the Rexnord procedure. Tests of five different preprocess treatments: 1) neutrali-
zation and blending (NB), 2) neutralization, blending, and autoclaving (NBA), 3) neu- tralization, blending, autoclaving, and blending (NBAB) as in the Crane tests, 4) neutralization, blending, autoclaving, blending, and reautoclaving (NBABA), and 5) neutralization, blending, autoclaving, blending, reautoclaving, with filtration performed on 40 C (hot) broth (NBABH). All runs were made with a 1O: l dilution of the broth after treatment This corresponds to a polymer concentration of 1.8 g/liter based on direct recovery from a sample of the culture broth by alcohol precipitation.
Both tests were performed on broth from a Sclerotium rolfsii ATCC 15203 culture grown on 5% glucose-nitrate medium. The culture was started from a frozen innocu- lum, and was harvested a t 2.5 days. The residual reducing sugar in the broth was 0.5% w/v. The media and methods for culture maintenance and growth are given in Materials and Methods. Biomass concen- tration was measured a s volatile suspended solids, which is conventional in bioprocess industries. Volatile suspended solids is a measure of the difference in dry and fired weight of solution filterable residue. Drying is performed at 102 C and firing, at 550 C. The methods used, which correspond to- those of Standard Methods for the Exami- nation of Water and Wastewater are given in Materials and Methods in detail. It is possible that this method is influenced by small particles of calcium oxalate in the broth.
A comparison of feed and filtrate viscos- ity was used as an indication of polymer rejection by the media during screening. Samples were centrifuged at 11,000 X g for 15 min in a Sorvall centrifuge to remove suspended solids before viscosities were determined. Viscosity was determined at 25 C for the following shear rates: 2.25, 4.5, 11.25, 22.5, 45, 90, and 225 sec-' using a
5

Brookfield LVT microviscometer fitted with a 0.8" cone.
Full details of all of the methods used are given in Materials and Methods.
Statistical analyses of the results were carried out using the GLM procedure of SAS76 developed by Barr, Goodnight, Sall, and Helwig (1976). This procedure uses the principle of least squares to fit a fixed-effects linear model to virtually any type of data. The procedure performs linear regression, analysis of variance, and correlation analy- sis as needed.
The principal concern in this study was the efficient and economical removal and recovery of biomass from the treated culture broth without significant loss of solution viscosity.
I -
Polymer. g liter
Crane Procedure
On the basis of tests using the Crane procedure, the estimated flow rate as shown in Fig. 2.4. provided by the screens was comparable t o many wastewaters. At a concentration of 2 g/liter the filtrate volume ranged from 62 to 180 ml in 9 sec for the three stainless steel screens tested under a hydraulic head of 4.5 in. Some experimental difficulties encountered were keeping the reservoir full without causing scouring the filter cake by turbulence and eliminating dead space under the media before start of a run. These difficulties were eliminated in the tests conducted with the Rexnord proce- dure. Also some difficulties were encoun- tered in backwashing the stainless media.
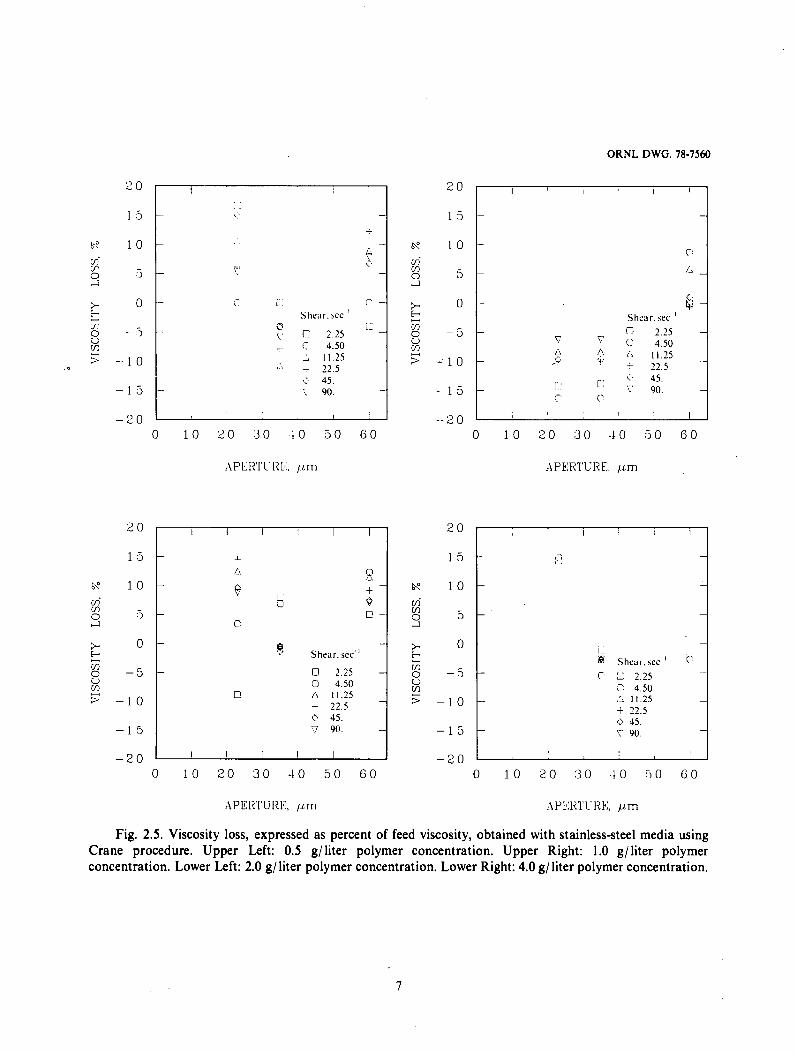
As shown in Fig. 2.5., there were differences in viscosity between the influent and effluent samples, however, these differ- ences were small and not statistically significant a t the 95% confidence level for any of the shear rates employed.
The efficiency of the screens as measured by volatile suspended solids removal is
ORNL DWG. 78-7559
4 0 0 +
E g 3 0 0
0 > 2 + z o o s ti4
1 0 0
13 0.5 0 1.0 h 2.0 5 4.0
0 C
- A
0 0
- - n A i
I I I +
I + I 0 0 1 0 2 0 3 0 4 0 50 6 0
APERTURE, p m
Fig. 2.4. Filtrate volume collected using Crane method as a function of media aperture and polymer concentration.
presented in Fig. 2.6. Although biomass removal was regarded as poor, these large mesh screens were most effective a t the 2 g/ liter polymer concentration level. At this level about 42% of the biomass was removed with the 35 p m screen, although screen size was not significant a t the 95% level. It is noteworthy that the filterable solids con- tained significant amounts of fixed solids presumed to be inorganic salts of metabo- lites present in the culture broth. The filterable solid samples obtained with the Rexnord procedure below contained little fixed material.
Rexnord Procedure
Tests run with the Rexnord procedure were with culture broth diluted lO:l, which was equivalent to 1.8 glliter of polymer. Since there appeared to be considerable disruption of the mycelial macrostructure
6
ORNL DWG. 78-7560
2 0
1 3
1 0
- D
0
- 2
- - 1 0
- 1 3
- 2 0
s: bf 1 0
5
0
-5
- 1 0
- 1 5
- 2 0
r n R
c A + r: c
r i r.
0 1 0 2 0 3 0 4 0 50 6 0
AP E:R'l'L HF:. /,L rn
1 5
1 0
2
0
-5
- 1 0
- 1 5
- 2 0
- e L
i-
P o e &
C
bf 1 0
5
0
-5
1 0
S h e a r . s e c - ' _ . I- s S h e a r . w ' C C 2.25
:c 4.50 A 11.25 + 22.5 c' 45. Y 90.
0 2.25 0 4.50
0 A 11.25 + 22.5 e 45. 7 90.
3 -
- 1 5 1 - 2 0 I I
0 1 0 2 0 3 0 . L O 50 G O 0 1 0 2 0 3 0 40 50 6 0
APEK'I'UHE:, /Am .A P K H1'C- I? K , p m
Fig. 2.5. Viscosity loss, expressed as percent of feed viscosity, obtained with stainless-steel media using Crane procedure. Upper Left: 0.5 g/liter polymer concentration. Upper Right: 1.0 g/ liter polymer concentration. Lower Left: 2.0 g/ liter polymer concentration. Lower Right: 4.0 g/ liter polymer concentration.
7

ORNL DWG. 78-7561
I I I I 1 I Polymer. g liter 0 0.5 0 1.0 6 2.0 + 4.0
A
I5 0 + 2
G +
0 1 0 2 0 3 0 4 0 5 0 6 0
APERTURE, p m
Fig. 2.6. Volatile suspended solids removal efficiencies of stainless-steel media using Crane procedure.
presumably caused by the shear exerted by the Waring blender used, equivalent tests were performed after each step in the culture conditioning procedure to determine the best point to'remove the gross biomass from the culture broth. Photomicrographs of the mycelial microstructure after each treat- ment are presented in Fig. 2.7. The neutral- ized and blended broth, as shown, had relatively small amounts of particles other than mycelium. The mycelium fibrils had frequent branching, and aggregated to- gether in loose tangles. After autoclaving, the tangles of mycelial fibrils became more closely packed, and the fibrils themselves became shorter. Further blending broke up the tight aggregates produced by autoclav- ing, and resulted in the accumulation of moderate amounts of small particulate material, presumably cell fragments, in solution. Further autoclaving resulted in the increased breakdown of cell fibrils, with the apparent accumulation of large amounts of
relatively fine particles in solution. As noticed with the previous autoclaving step, some aggregation of fibrils appears to have occurred.
Mean filtrate volumes collected for each treatment and media size are presented in Table 2.1. Filtrate volumes collected are plotted for each feed treatment in Fig. 2.8. Filtrate volume increased with increasing broth treatment prior to screening. For example, the polyester 6 p m media, the mean filtrate volumes collected were 13.8,
0 .
Table 2.1. Summary of Rexnord static test results.
Aperture. Head, Flow, Flux Treatment Media pm in. ml gpm/ft2
N B
N B NB N U N HA N BA N BA N BA N BA N BA NBAB NBAB N B A B NBAB NBAB N B A B NBAB NBABA NBABA NBABA NBABA NBABA NBABA NBABA NBABH NBABH NBABH NBABH NBABH NBABH NBABH NBABH
N n PE ss PE PE ss PE ss PE PE ss ss PE PE ss PE PE ss ss PE PE ss PE PE ss ss PE PE PE PE PE PE PE PE
6 15 17 21 23 6
15 17 21 23 60
I 6
15 17 21 23 60 I 6
15 17 21 23 60
I 6
17 21
I 6
17 21
11.0 11.0 11.0 11.0 11.0 11.0 11.0 11.0 11.0 11.0 11.0 11.0 11.0 11.0 11.0 11.0 11.0 11.0 11.0 11.0 11.0 11.0 11.0 11.0 11.0 11.0 11.0 11.0 11.0 20.5 20.5 20.5 20.5
13.8 9.5
14.6 14.2 13.0 16.4 15.0 23.5 24.5 17.0 60.0
7.9 23.3 19.2 35.3 41.0 27.2
129.0 9.4
29.0 12.8 20.0 41.5 34.4
204.0 10.8 34.5 21.8 45.0 15.9 49.5 61.0 73.0
I .oo 0.80 I .06 I .02 0.94 1.18 I .ox I .70 I .77 I .23 4.34 0.57 I .69 I .39 2.55 2.57 I .97 9.33 0.68 2. I O 0.93 I .45 3.00 2.49
14.76 0.78 2.50 I .58 3.26 1.15 3.58 4.41 5.28
PE = dacron polyester filter media. SS = woven stainless steel filter media.
8

ORNL PHOTO 81-5005
i' 4 IOQ p
9

ORNL DWG. 78-7562
1 I I I I
Aperture. pm @
0 1 O b A 15 + 17 0 21
0360 v 23 @
63
NH NBA NBAB NHAHA NHABH
TREATMENT
2 0 0
1 5 0
2 3
z 1 0 0
4 h
5 0
0
i I 1 I I
- Aperture.pm
0 1 0 6 A 15
- + 17 0 21
0 + 0 -
+ n
NH NBA NBAB KBABA NBABH
TREATMENT
Fig. 2.8. Filtrate volumes collected using Rexnord procedure as a function of culture broth treatment. Left: hydraulic head 11.0 in. Right: hydraulic head 20.5 in.
16.4, 23.3, 29.0, and 34.5 ml for feed treatments NB, NBA, NBAB, NBABA, NBABH respectively. A least squares analysis of the filtrate volumes collected showed significantly less flux for treatments NB, NBA, and NBAB. Little difference in filtrate volumes was observed between types of media material tested. These differences were not regarded as significant, although stainless-steel media were more difficult to backwash than polyester material. The difficulty in backwashing stainless-steel media has been partially attributed to roughness of the wire surface by Cravens and Kormanik (1979). A possible solution to this problem, suggested by W. K. Begg of Begg, Cousland and Company, Ltd., was t o electropolish the wire prior to weaving.
As shown in Fig. 2.9, increasing the media size also generally increased the filtrate volume collected. For neutralized, blended, autoclaved, and blended (NBAB) feed, the filtrate volumes were 7.9, 23.3,35.3,41.0 ml for 1, 6, 17, and 21 p m polyester media.
Although runs were made only on hot, fully blended broth, significantly better flows were observed a t 1 1 in. hydraulic head than at 20.5 in. hydraulic head.
The filtrate volumes obtained with the Rexnord procedure were somewhat less than obtained with the Crane procedure, however, it is believed that this was partly due to the turbulence caused by refilling the test Crane apparatus to maintain a constant hydraulic head on the filter media.
Poorer biomass removal efficiencies calculated as the fraction of volatile solids removed by the media were attained with increasing broth treatment as shown in Fig. 2.10. Autoclaved, neutralized and blended broth (NBA) followed by blending (NBAB) resulted in poorer biomass removal efficien- cies than was obtained with unautoclaved neutralized and blended broth (NB). Addi- tional autoclaving after the second blend (NBAB), did not further reduce the removal efficiency. Slightly higher removal efficien- cies were obtained for 1 pm media. This was
I O
ORNL DWG. 78-7563
2 0 0
3 1 5 0 L i i 2 2 9 1 0 0
5 4 h
5 0
0
- - 1-reatment
C S B C S B A A SBAB + SHABA Q SBABH
-
-
0
3 -
A +
J l $$y I 1 I
APERTURE. pm
I
Treatment c: SH C SHA A SHAH f SBAHA 0 SHAHH
0 0
0
0
"
0 1 0 2 0 30 4 0 5 0 6 0
APERTURE. pm
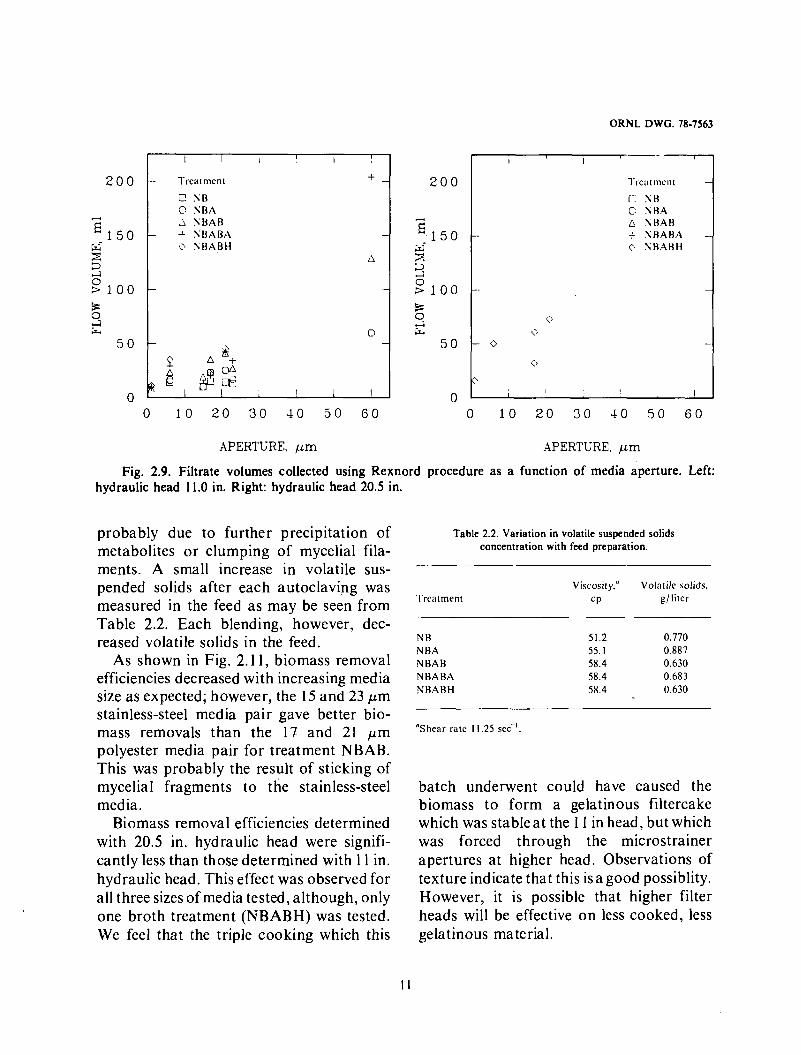
Fig. 2.9. Filtrate volumes collected using Rexnord procedure as a function of media aperture. Left: hydraulic head 11.0 in. Right: hydraulic head 20.5 in.
probably due to further precipitation of metabolites or clumping of mycelial fila- ments. A small increase in volatile sus- pended solids after each autoclaving was measured in the feed as may be seen from Table 2.2. Each blending, however, dec- reased volatile solids in the feed.
As shown in Fig. 2.1 1, biomass removal efficiencies decreased with increasing media size as expected; however, the 15 and 23 pm stainless-steel media pair gave better bio- mass removals than the 17 and 21 p m polyester media pair for treatment NBAB. This was probably the result of sticking of mycelial fragments to the stainless-steel media.
Biomass removal efficiencies determined with 20.5 in. hydraulic head were signifi- cantly less than those determined with 11 in. hydraulic head. This effect was observed for all three sizes of media tested, although, only one broth treatment (NBABH) was tested. We feel that the triple cooking which this
Table 2.2. Variation in volatile suspended solids concentration with feed preparation.
Viscosity." Volatile solids. Treatment CP glliter
NB N BA NBAH NBABA NHABH
51.2 0.770 55. I 0.887 58.4 0.630 58.4 0.683 58.4 0.630
"Shear rate 11.25 sec".
batch underwent could have caused the biomass to form a gelatinous filtercake which was stable at the 1 I in head, but which was forced through the microstrainer apertures a t higher head. Observations of texture indicate that this isa good possiblity. However, it is possible that higher filter heads will be effective on less cooked, less gelatinous material.

1 0 0
8 0
6 0
4 0
2 0
0
I I I I I
0 + - 0
0 0 9 a
@ + E3
Aperture.um -k - 0 1
0 6 A I 5 + 17
- 0 21
@ 60
@ V 23 0
@ I I I I I
N B NBA N B A B N B A B A N B A B H
T R E ATM E NT
1 0 0
8 0
6 0
4 0
2 0
0
ORNL DWG. 78-7564
I I I
J +
Fig. 2.10. Biomass removal efficiencies. Left: effect of media aperture at 11.0 in. hydraulic head. Right: effect of media aperture at 20.5 in. hydraulic head.
I I I ! I I
c r;
' C 0 0 +
0 + 0 L
o c 1-reatment 0 N B
0 NBA A N B A B -I NBABA +
A 0 0 N B A B H
I I I I I I
0 1 0 2 0 3 0 .LO 50 6 0
APERTLRE, /*m
ORNL DWG. 78-7564
I L O O I I I
Treat men I
c SBA A NHAB
r sn 8 0
6 0
0 1 0 2 0 30 10 50 6 0
APERTURE, /*m
Fig. 2.11. Biomass removal efficiencies. Left: effect of media aperture at 11.0 in. hydraulic head. Right: effect of media aperture at 20.5 in. hydraulic head.
12

Apparent changes in viscosity as a result of screening are presented in Fig. 2.12. The viscosity loss, calculated a s the difference between the filtrate viscosity and the feed viscosity and expressed a s a percentage of the feed viscosity, ranged from + 12 to - 12%. In order to determine the important vari- ables, a statistical analysis was performed. The variables tested by a general least squares procedure for significnce, based on results shown in Fig. 2.12, were: media size, media type, broth treatment, and hydraulic head. No significant loss of viscosity as a result of screening was measured for any of the shear rates employed nor was media size or type significant. However, broth treat- ment and hydraulic head appeared to be highly significant. The effect of treatment appears to have been caused by the formation of biomass clumps after autoclav- ing and the presence of fine particles other than mycelia. Blending after autoclaving fragmented the mycelial mass. Double blending of the culture broth prior to screening showed a small improvement in viscosity; however, this benefit was proba- bly more than offset by the loss of screening efficiency observed.
Results obtained with the smaller aper- ture polyester media were promising. Tests using a rotating microscreen were made to estimate the requirements of a field-scale pilot plant and better understand the filtration problems involved with a rotating filter.
MICROSCREEN PILOT TESTS
The important process design variables are drum size, rotational speed, media material, pore size, hydraulic head, and backwash rate. In order to assess these variables and to make possible estimates of the utility and potential cost of biomass removal by microscreening, tests were conducted with a small trailer-mounted unit
using procedures developed by Envirex, Incorporated, a Rexnord Company.
Test Procedure
The runs were performed using an Envirex pilot microscreen similar to the one shown in Fig. 2.1 3. The unit uses a backwash cycle which can employ filtrate, water, or compressed air, singly or in combination, to clean the filtration media and strip the solids for further use. The backwashcycle isshown in Fig. 2.14. The services of this small 2 ft X 4 ft, trailer-mounted unit were kindly provided by P. R. Erickson of Rexnord- Envirex, and the unit was operated by J. B. Cravens, of Envirex.
From the bench-scale tests, it was appar- ent that it would be impractical to operate the microscreen in these tests on a once through feed basis because of the large number of fermenter batches necessary to produce the volume of microscreen feed needed to reach steady-state operation. Therefore, a recycle arrangement was devised whereby the filtrate from the microscreen and the backwash stream were returned to a continuously stirred, 4000-liter feed tank. With this arrangement, enough diluted feed could be prepared from a 360-. liter fermenter batch to operate the filter on a continuous basis. Our principal reservation about this arrangement was that some of the biomass might be broken up or lysed by being filtered more than once. Two 360-liter fermenter batches were prepared. Diluted feed prepared from Batch 1 was used to test the 1 and 6 pm media, and feed prepared from Batch 2 was used to test the 21 pm media and to provide effluent for the two- stage microscreen run. The details of the fermentation broth preparation, and micro- screen operation described in detail in the Materials and Methods.
Table 2.3 lists the operating conditions tested in the series of runs performed with 1
13

ORNL DWG. 78-7565
I I I I I
- Shear, sec-' -
2 0
1 5
1 0
5
0
-5
-10
- 1 5
- 2 0
2 0
1 5
6\0 1 0
* 0 e -5
E 3 - 1 0
V
t
0 2.25 0 4.50 A 11.25 + 22.5 0 45. V 90.
bp
2 0
1 5
1 0
5
0
- 5
- 1 0
-15
- 2 0 0 1 0 2 0 3 0 4 0 5 0 6 0 0 1 0 2 0 3 0 4 0 50 6 0
APERTURE, pm APERTURE, Mum
0
P 6
0
0 2.25 0 4.50 A 11.25 + 22.5 0 45. V 90.
-15
- 2 0 NB NBA NBAB NBABA NBABH
TREATMENT
2 0
1 5
R 1 0 m-
5 rn 0 c-1
* 0 e !L? 3 - 1 0
in 8 - 5
- 1 5
- 2 0 KH NHA WHAH N H A H A K H A H H
TR E A' IM E R"1
Fig. 2.12. Viscosity loss, expressed as a percent of treated feed viscosity. Upper Left: effect of media aperture a t 11.0 in. hydraulic head. Upper Right: effect of media aperture at 20.5 in. hydraulic head. Lower Left: effect of broth treatment at 11.0 in. hydraulic head. Lower Right: effect of broth treatment at 20.5 in. hydraulic head.
14

Table 2.3. Micros
Back- wash, psi+
batch 1, 1
20w 20E 19E 20 E
20E.'A 40E
38W,rA 40W:A
40 E 30E 36E
batch 1, 6
40E 30E 30E 30E 30E
batch I , 1
40E 30E 24 E 24 E 30E 30E 30E 30E 30E 30 E 30E
I .v V.ULL
32.0 0.042 36.0 0.056 40.0 0.040
batch 2, 21 pm polyester cloth
30E 0.0 30E 2.0 30 E 5.0 0.028 30E 8.0 0.034 30E 10.0 0.034
batch 2, I pm polyester cloth Feed: 21 pm effluent
0.0 -?n n ntn
30E 30E 30E 30E 30E
u. I LJ
0.310 0.290 0.390
0.320 0.340 0.340
n ? I n 1.v v.v I Y U.MU
12.0 0.023 0.470 17.0 0.025 0.400 19.5 0.025 0.400
ter. and L -..,..-....
had merely been sodium and pasteurized in the
i r to discharge. Exerted shear ner broth arose from three

main sources: continuous mixing in the feed tank, transfer pumping, and the drum backwash spray system. Although previous literature indicates that passage of a sclerog- lucan broth through a high shear is a major part of commercial polymer recovery from a broth, we did not find high shear necessary when a microscreen type operation, which washes the mycelium, was used (Ferguson and Westover 1969). A major reason for the relatively low use of shear in broth process- ing was the apparent increase in suspended solids removal with decreasing shear treat- ment of the broth in bench tests.
In addition to sampling the influent in the feed reservoir of the filter and the filtrate from the filter as was done in the static tests, samples from the inside of the rotating drum, the backwash stream containing the removed biomass, and the 4,000 liter feed storage tank were also withdrawn. Biomass as volatile suspended solids, polymer con- centration, and viscosity were determined on these samples.
As shown in Fig. 2.15, the 6 pm screen was able to remove better than 80% of the influent biomass as volatile suspended solids in most cases. The biomass removal effi- ciency was computed relative to the influent feed concentration as was done for the static tests, however, it is noteworthy that the removal efficiencies reported generally would have been higher if they were computed relative to the biomass concentra- tion inside the rotating drum. It appears that a 6 pm screen would require subsequent polishing filtration to remove the remaining suspended solids; however, the size of the polishing filtration equipment and the amount of filter aid or diatomaceous earth would be substantially reduced by the microscreening step. Although mixing was somewhat incomplete during the earlier stages of this run, it appears that the concentrations of volatile solids in the tank,
ORNL DWG 80-50
U
cn o, 2*oo t+ 0 1.75 J 0
1.50 W
z W
Cn
0 1.25
Q, 1.00
cn 0.75 W J F 0.50 a J 9 0.25
0
+
0 . + .. - 0 10
TIME ( h ) Fig. 2.15. Volatile solids concentrations with 6pm
filter media. Legend: (0) feed tank; (0) influent; (0) effluent; (A) inside rotating drum near center; and (+) backwash.
filter drum, and influent chamber were similar. The solids from the hopper, which were recirculated to feed makeup, however, showed a marked increase over both the effluent and the tank, drum, and influent concentrations.
Macromolecules may be partially rejected in passage through a filtration medium, i. e. the filtrate will be less concentrated in polymer than the feed. To determine whether rejection occurs during micro- screening, the polymer concentrations in the different sample points were followed. Although it appears that mixing was incomplete at the start of the 6 pm runs, as shown by the difference between thevarious
16

polymer concentrations in Fig. 2.16, it appears that influent and effluent polymer concentrations tended to reach comparable values by the end of the run. The absence of observed polymer rejection by the 6 pm screen confirmed the idea of low polymer rejection, probably due to rapid media regeneration and low filter cake buildup, for microscreens. This is important because the field requirement is for a given injection fluid viscosity, and high o r varying rejection could decrease the amount of delivered biopolymer from a given batch or increase
ORNL-DWG 79-1957R 1.2
h 1 . 1
1.0 - \
v
g 0.9 - 2 0.8
$ 0.7
8 0.6 Z 0 o 0.5 U W 0.4 I 5 0.3 0
0.2 a
0.1
0
U
A g A g o
+
0 10
TIME (h r )
Fig. 2.16. Polymer concentrations with 6pm filter media. Legend: (0) feed tank; (0) influent; (0) effluent; (A) inside rotating drum near center; and (+) backwash.
process control difficulties. Other process conditions also affect viscosity. Shear and biodegradation, for example, have been known to have a major effect on polymer viscosity.
As shown in Fig. 2.17, the viscosities of the biopolymer solutions at the various sample points tended toward each other as complete mixing was approached. It should be noted that the viscosities were measured on centrifuged samples to eliminate the increase in apparent viscosity which can be caused by particles.
In filtration by 1 pm media, as shown in Fig. 2.18, rejection of scleroglucan biopo- lymer was limited o r absent during the 40 hr
55
50
45
40 a v 35
>- 30
25
5 20
15
10
5
0
A
Y
I- -
0 v)
ORNL-DWG 80-60
-X ot 8 -+ 1 At
0
0 10
TIME (h)
Fig. 2.17. Viscosities with 6km filter media. Legend: (0) feed tank; (0) influent; (0) effluent; (A). inside rotating drum near center; and (+) backwash.
17
ORNL- DWG 79- f956R 1.2
4 . 1
0 1.0
z 0.9 o_ 2 0.8 [L + 0.7 Z
0.6 z 0 0 0.5 [L w 0.4 z 5 0.3 0 a 0.2
0.1
0
- \ -
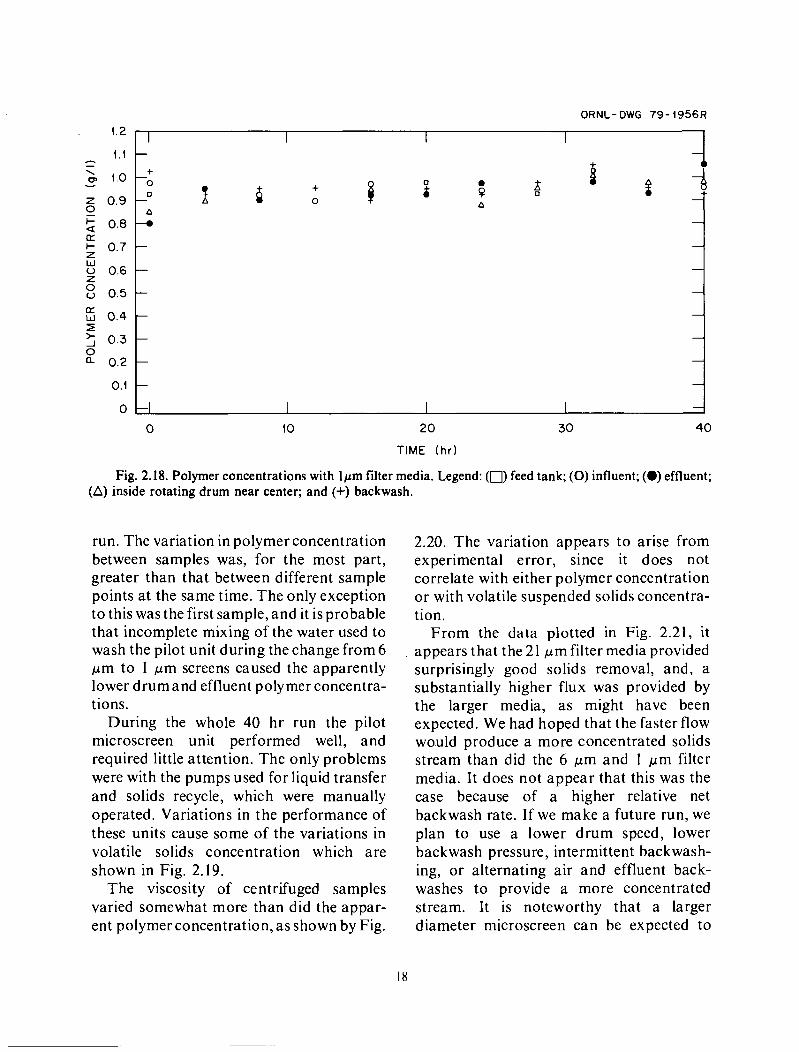
Fig. 2.18. Polymer concentrations with lpm filter media. Legend: (0) feed tank; (0) influent; (0) effluent; (A) inside rotating drum near center; and (+) backwash.
run. The variation in polymer concentration between samples was, for the most part, greater than that between different sample points at the same time. The only exception to this was the first sample, and it is probable that incomplete mixing of the water used to wash the pilot unit during the change from 6 pm to 1 p m screens caused the apparently lower drum and effluent polymer concentra- tions.
During the whole 40 hr run the pilot microscreen unit performed well, and required little attention. The only problems were with the pumps used for liquid transfer and solids recycle, which were manually operated. Variations in the performance of these units cause some of the variations in volatile solids concentration which are shown in Fig. 2.19.
The viscosity of centrifuged samples varied somewhat more than did the appar- ent polymer concentration, as shown by Fig.
2.20. The variation appears to arise from experimental error, since it does not correlate with either polymer concentration or with volatile suspended solids concentra- tion.
From the data plotted in Fig. 2.21, it appears that the21 p m filter media provided surprisingly good solids removal, and, a substantially higher flux was provided by the larger media, as might have been expected. We had hoped that the faster flow would produce a more concentrated solids stream than did the 6 pm and I p m filter media. It does not appear that this was the case because of a higher relative net backwash rate. If we make a future run, we plan to use a lower drum speed, lower backwash pressure, intermittent backwash- ing, or alternating air and effluent back- washes to provide a more concentrated stream. It is noteworthy that a larger diameter microscreen can be expected to

ORNL DWG 80-51
h 2 75 7 I I 1 -I +
55 I 1 I -
e
-+ 0 0
50 - 45 - 0
40 -A 0 A -
- 0 0 A
8
0 -+
e
b- A
a P A - +
4- 6 8 A
x a 0 - 35 --:
25 -
30- m 0
E > 20 -
15 - 40 - 5 -
- - - - -
0 ' I 1
$ 2.50 v)
A 0 v)
W
z W
a -
a a
a
2.25
1.50
1.25
+
+ +
+ +
+ -A
I 2 v) t.00 1 2 + A A -I
0 1 A A - 0 . 7 5 t
A A
5 -I 0 . 5 0 b 0 0
0 8
0 0
i3 +
+ 1 . a e e e 0.25 >
e e e l e e 10 2? 30 40 O L
0 TIME ( h )
Fig. 2.19. Volatile solids concentrations with 1pm filter media. Legend: (0) feed tank; (0) influent; (0) effluent; (A) inside rotating drum near center; and (+) backwash.
19

ORNL DWG 80-52 1.6 -7 - 1.5
cn - + 1.3
0 1.2
- - & 1.4 - + W
-
W
z W CL v>
n
3 v,
A
A
.i 0 0.1 1 o> 0.2
0 ' I 0 10
TIME (h) Fig. 2.21. Volatile solids concentrations with 21pm
filter media. Legend: (0) feed tank; (0) influent; (0) effluent; (A) inside rotating drum near center; and (+) backwash.
produce a proportionally more concen- trated backwash stream for a given back- wash rate since the same amount of backwash will penetrate the media per unit length of screen while a proportionally larger amount of cake is produced.
Polymer concentration with time is shown in Fig. 2.22. As with the smaller media sizes, it appears that there is not much variation in the concentration of polymer as measured by alcohol precipitation between different samples taken a t the time. How- ever, there is substantially more variation in the solution viscosity, as shown in Fig. 2.23,
than there is in either the polymer or volatile suspended solids concentrations.
We were surprised a t how well the larger microscreen size performed, and felt that it might be possible to use a combination of media sizes to provide increased removal and higher flux. We decided to try a 21 p m media effluent through a 1 pm screen t o test this approach.
As shown in Fig. 2.24, it appeared that effluent suspended solids levels in the 1 p m screen treating 21 p m effluent were a little less than those observed with a single pass 1 p m screen treatment. Solids concentrations in the backwash stream, however, were lower than previously observed. This might
5 0.9 - 2 0.8 [r 5 0.7 W $ 0.6 0 c) 0.5
0.2
0.1
0 0 10
TIME (hr)
Fig. 2.22. Polymer concentrations with 21pm filter media. Legend: (0) feed tank; (0) influent; (0) effluent; (A) inside rotating drum near center; and (+) backwash.
20

I
g O 7 - 0 6 - 0 5 -
E 0.4 -I 0 3 -
0 . t 0
>
x 0 2 -
ORNL-DWG 80-6f ORNL-DWG 79-4964R
- - -
- -
- - I
.. - >
0
0
A +
35 0
30
25
20
15
10
5
? 0
8 8 +
0 0 40
TIME (h)
Fig. 2.23. Viscosities with 21pm filter media. Legend: (0) feed tank; (0) influent; (0) effluent; (A) inside rotating drum near center; and (+) backwash.
indicate that, under the operating condi- tions used, there was little filter cake buildup on the media. If future experiments are performed, it might be desirable to use either intermittent or air and liquid combined backwashing to increase filter cake and recovered solids concent rat ion.
It appears that, possibly due to the low amount of solids in the feed, there was a slight amount of polymer rejection when the 1 p m media was used. As shown in Fig. 2.25, the slurry returned by the backwash system and the process drum itself contained higher polymer concentrations than did the efflu- ent.
0.9
0.7
0.6 - -I
0
z 0.5
E 0.4 * 0.3 3
W
2 0.2 U -J
9 0.1
0 0
+
10
TIME ( h r )
20
Fig. 2.24. Volatile solids concentrations with l p m filter media on 21pm filter effluent. Legend: (0) feed tank; (0) influent; (0) effluent; (A) inside rotating drum near center; and (+) backwash.
ORNL DWC 00-53 1 . 5 I 1 1
B 0
Although the polymer viscosities in Fig. 2.26 show more variation than do the polymer concentrations, they appear to follow a somewhat similar pattern in that
21

ORNL DWG 80-54
80
0
A + +
A 0 e
2o 10 1 O L I I
0 10 20 TIME ( h )
Fig. 2.26. Viscosities with lpm filter media on 21pm effluent. Legend: (0) feed tank; (0) influent; (0) effluent; (A) inside rotating drum near center; and (+) backwash.
the higher values are generally in the process drum and solids return samples. This is consistent with a picture of mild polymer rejection in this run.
Fig. 2.27 shows the volatile suspended solids removal efficiencies which were obtained with the different filter media. From this figure, it appears that the 1 pm and 6 pm filter media are similar in effectiveness. The 21 pm screen provided less volatile solids removal. Two-stage filtration did not greatly improve the overall removal efficiency.
Envirex experience indicates that the small amount of apparent difference be- tween the l p m and 6 p m media may have been due to the slight leakage through the rotating drum seal a t the influent entrance into the drum. At low fluxes, this became important. The leakage has been solved by the development of a special teflon rotating seal which is used in larger microscreens; however, the improved seal was not been installed in the small pilot test units.
However, at worst volatile suspended solids removal was above half of the amount contained in the influent in the two-stage run, and, at best, comparable to that by the 6 pm screen.
It appears that the 21 p m filter media provided slightly less volatile solids removal than did the 1 pm o r 6 pm media; however, a substantially higher flux was provided by the larger media, as might have been expected. We had hoped that the faster flow would produce a more concentrated solids stream than did the 6 p m and 1 pm filter media. It does not appear that this was the case because of a higher relative net backwash rate. If we perform further pilot unit tests, we will attempt to modify the conditions used to provide a more concen- trated solids stream.
Correlation of the ratio of volatile suspended solids concentration in the microscreen drum, X'p to volatile suspended solids in influent, X'I with the backwash conditions is presented in Fig. 2.28. As expected, the drum solids concentration decreased with increasing amounts of backwash. The amount of backwash as presented i n . Fig. 2.28 was double over a range from a single header of spray nozzles at 30 psi to dual banks of spray nozzles a t 30 psi (30/ 30). The efficiency of washwater use (yield) was computed as the ratio of the filtrate effluent rate, QE, minus the washwa- ter effluent rate, Qw, to the effluent filtrate rate, QE in consistent units. The yield increased with increasing specific effluent flowrate (flux) as shown in Fig. 2.29. This means that a larger percentage of the effluent was used as backwash where low fluxes were obtained. No significant polymer rejection was observed except in the two-stage run with 1 pm media as shown in Fig. 2.30. As was shown in Fig. 2.19, a ratio of backwash volatile suspended solids concentration to influent volatile suspended
22

0 0
5
5
2
ORNL DWG 80-47
Z I 2 2.5A- ~ - a urn a b
w o 5 2.0 -
2 5 ; l . 5 -
a i &? 1 . 0 - W I -
= Z 0 2
coo
0.5 - z
I 1 1
+ 0 c, 0
0 0 A + +
0 0
7-
0
a A 0 L l
a -
0 -
0
I
0
10 20 TIME ( h )
30 40
Fig. 2.27. Volatile suspended solids removal efficiencies for various media. Legend: (+) 6pm; (0) lpm; (A). 21pm; and (0) lpm following 2lpm.
ORNL DWG 80-600
3.0 ~
A
ORNL D I G 80 -679
1 . 0 0
0 0 5 10 15 20
SPECIFIC EFFLUENT FLOW, l i ters min-’ m-2
Fig. 2.29. Effluent yield as a function of flux. Plotting symbols: 0 = Run 2, batch 1,6pm; A = Run 3, batch 1, lpm;O=Runl,batch2,21pm;andX= Run 2, batch 2, l p m on filtrate from 21pm media (Run 1, batch 2).
23

0 1 I
30 30120 30130 BACKWASH PRESSURE
Fig. 2.30. Polymer rejection with pilot micro- screen. Plotting symbols: 0 = Run 2, batch 1,6pm; A = Run 3, batch 1, lpm; = Run 1, batch 2,21pm media.
solids concentration as high as 6.5 was attained at a drum speed of 2 rpm (surface presentation rate, S = 1.6 m2 washed surfacelmin) with the I pm media using the 4 f t diameter microscreen. With a 10 ft diameter microscreen, backwash-influent biomass ratios 2.5 times as large can be expected. Increased hydraulic resistance was observed with increased solids loading as shown in Fig. 2.31 using the hydraulic resistance parameter ( X ' p H A / p S , where H L is the headloss across the screen, A is the submerged screen area, and p is the density of the solids, p = 1.05 g/ml) developed by Engineering-Science, Inc. (1971), in a model of microscreening parameter interaction.
Results of plugging tests on the effluents obtained under steady state conditions with the 1, 6, and 21 pm aperture media are shown in Fig. 2.32. Also shown for compa- rison are results of a plugging test on the unfiltered influent culture broth. Although the microscreen was effective in removing the culture biomass, little improvement in plugging characteristics was observed in the microscreened effluent. Attempts to im-
" ORNL DWG 80-602R - 5 800
SOLIDS LOADING ( g / m 2 )
Fig. 2.3 1. Hydraulic resistance of the microscreen media. Plotting symbols: 0 = R u n 2, batch 1,6pm; A = Run 3, batch 1, lpm; 0 = Run 1, batch 2,21pm; and X = Run 2, batch 2, l p m on filtrate from 21pm media (Run 1, batch 2).
ORRL DWG *L13>16
I I ! I I I I I I I I I I 1 0 1 1 1 I
I I ! I I ! I l l ! I I I I I l l 1 I I loo 10' lo2
ELAPSED TIME (min)
Fig. 2.32. Permeate rates in plugging tests on single-stage microscreen effluents. Also shown for comparison are fluxes obtained with influent to microscreen.
24
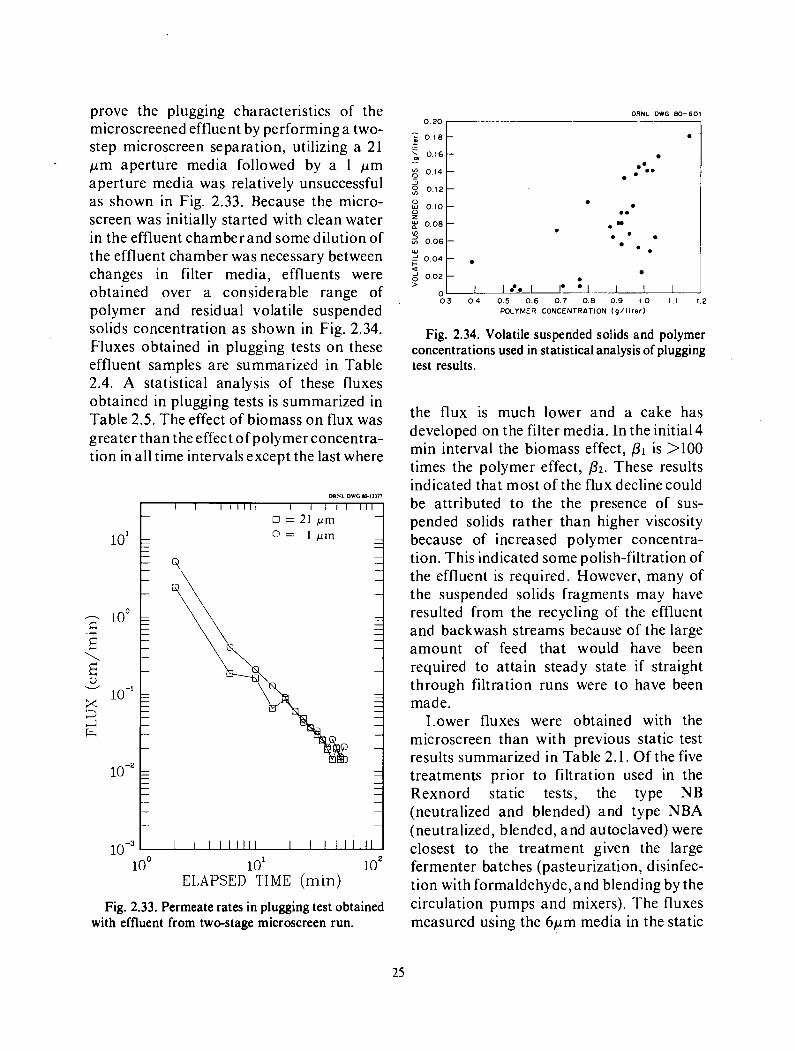
prove the plugging characteristics of the microscreened effluent by performing a two- step microscreen separation, utilizing a 21 p m aperture media followed by a 1 p m aperture media was relatively unsuccessful as shown in Fig. 2.33. Because the micro- screen was initially started with clean water in the effluent chamber and some dilution of the effluent chamber was necessary between changes in filter media, effluents were obtained over a considerable range of polymer and residual volatile suspended solids concentration as shown in Fig. 2.34. Fluxes obtained in plugging tests on these effluent samples are summarized in Table 2.4. A statistical analysis of these fluxes obtained in plugging tests is summarized in Table 2.5. The effect of biomass on flux was greater than the effect of polymer concentra- tion in all time intervals except the last where
0 20
0 1 8
5 016-
0 1 4 -
- - - - --I 2 0 1 2 -
E OlO- f 008- a
v)
2 006- d 0 0 4 - a
W
g 002- >
0
ORNL DWG S I 3 1 7 7
I I I 1 I I I l l / I I I I 1 1 1 1 1 1
-
:**.
.. . 0 -
0 .
* .
I 1. I I f . I I I I
loo 10' lo2 ELAPSED TIME (min)
Fig. 2.33. Permeate rates in plugging test obtained with effluent from two-stage microscreen run.
the flux is much lower and a cake has developed on the filter media. In the initial4 min interval the biomass effect, p1 is >IO0 times the polymer effect, p2. These results indicated that most of the flux decline could be attributed to the the presence of sus- pended solids rather than higher viscosity because of increased polymer concentra- tion. This indicated some polish-filtration of the effluent is required. However, many of the suspended solids fragments may have resulted from the recycling of the effluent and backwash streams because of the large amount of feed that would have been required to attain steady state if straight through filtration runs were to have been made.
Lower fluxes were obtained with the microscreen than with previous static test results summarized in Table 2.1. Of the five treatments prior to filtration used in the Rexnord static tests, the type NB (neutralized and blended) and type NBA (neutralized, blended, and autoclaved) were closest to the treatment given the large fermenter batches (pasteurization, disinfec- tion with formaldehyde, and blending by the circulation pumps and mixers). The fluxes measured using the 6pm media in the static
25

Table 2.4. Summary of plugging tests on microscreen effluents used in statistical analysis.
Biomass Polymcr M can pluggi ng-test I7 tis. c m ni in nvcr 4-mi 11-i ntcrv:~ Is.
Time concn concn
h r g/litcr &liter 0-4 4-8 8-12 12-16 16-20 20-24 24-28 28-32 32-36 36-40 40-44 44-48 4X-52 52-56 56-60
1.0 0.037 0.392 1.5 0.010 0.540 2.0 0.003 0.560 2.5 0.006 0.532 3.0 0.008 0.705 4.0 0.010 0.765 4.5 0.016 0.765 5.0 0.025 0.987 6.5 0.047 1.019
6.076 7.118 5.208 5.382 6.597 4.340 5.382 5.208 3.993
1 . 1 12 1.069 0.788 0.678 1.127 0.636 0.760 0.63 I 0.445
0.590 0.570 0.417 0.379 0.598 0.341 0.387 0.340 0.264
Run I, batch I , lpm polyester cloth
0.403 0.376 0.289 0.27 I 0.402 0.231 0.268 0.238 0. I89
0.303 0.284 0.226 0.218 0.31 I 0.183 0.205 0. I83 0.130
0.241 0.224 0.179 0. I74 0.255 0. I42 0. I62 0.139 0.109
0.206 0.185 0.155 0.147 0.207 0. 109
0.133 0.115 0.09 I
0.171 0.161 0.126
0.126 0. I86
0.099 0. IO9 0.096 0.068
0.171 0.135 0.161 0.108 0.126 0.085 0.126 0.094 0.186 0.146 0.099 0.066
0.109 0.081
0.096 0.064 0.068 0.044
0. I18 0.099 0.084 0.083 0. I22 0.057 0.069 0.056 0.036
0.'102 0.090 0.065
0.067 0. IO9 0.049 0.049 0.048 0.03 I
0.0x5
0.074 0.059 0.059
0. IO4 0.040 0.059 0.035 0.024
0.077 O.0hX
0.066 0.057 0.050 0 . 0 4 ~ 0.059 0.042 0.090 0.085
0.032 0.025 0.038 0.044 0.035 0.028 0.023 0.017
Run 2, batch I , 6pm polyester cloth
0.0 0.072 0.692 1.563 0.397 0.229 0.182 0.234 0.083 0.065 0.049 0.049 0.032 0.027 0.027 0.022 0.019 0.017 2.0 0.075 0.881 3.819 0.539 0.291 0.207 0.148 0.1 17 0.091 0.073 0.073 0.051 0.043 0.038 0.033 0.024 0.024 3.2 0.098 0.959 2.778 0.333 0.218 0.154 0.101 0.090 0.072 0.050 0.050 0.035 0.028 0.028 0.022 0.018 0.021 4.0 0.093 0.940 5.035 0.532 0.304 0.216 0.170 0.132 0.101 0.086 0.086 0.058 0.051 0.039 0.033 0.027 0.027
Run 3, batch I , lpm polyester cloth
0.0 4.0 8.0
12.0 16.0 20.0 24.0 28.0 36.0 40.0
0.106 0.070 0.062 0.093 0.092 0.08 I 0. I35 0. I46 0. I32 0.065
0.800 0.95 I 0.893 0.939 0.9 I7 0.9 I3 0.972 0.976 0.927 1.044
3.299 4.688 4.167 3.038 4.861 3.646 2.604 3.559 3.212 5.729
0.392 0.400 0.445 0.319 0.432 0.305 0.287 0.256 0.2 I6
0.331
0.233 0.159 0.213 0.132 0.224 0.139 0.183 0.120 0.237 0.158 0.179 0.125 0.150 0.081 0.141 0.086 0.103 0.057 0.134 0.065
0.1 I6
0.086 0.086 0.084 0.103 0.082 0.049 0.067 0.043 0.040
0.089 0.062 0.067 0.065 0.ox I 0.064 0.04 I 0.042 0.035 0.027
0.069 0.047 0.045 0.041 0.055 0.047 0.027 0.04 I 0.029 0.027
0.053
0.040 0.037 0.039 0.044 0.032 0.027 0.027 0.023 0.02 I
0.053 0.038 0.040 0.022 0.037 0.030 0.039 0.024 0.044 0.029 0.032 0.031 0.027 0.020 0.027 0.026 0.023 0.023 0.021 0.022
0.028 0.022
0.024 0.024 0.024 0.0 I6
0.014 0.020 0.0 I7
0.0 I 6
0.028 0.022 0.029 0.0 I7 0.019 0.023 0.019 0.0 I9 0.0 I7 0.022
0.024 0.022 0.023 0.0 I 7 0.024 0.0 I 7 0.014 0.0 I9 0.0 I 7 0.016
0.024 0.019 0.016 0.022
0.017 0.017 0.014 0.019
0.014 0.014
0.023 0.024
0.022 0.017
0.020 0.018 0.017 0.017 0.016 0.016
Run I , batch 2, 21pm polyester cloth
1.5 0.078 0.916 1.906 0.245 0.133 0.077 0.050 0.042 0.029 0.029 0.029 0.023 0.023 0.723 0.017 0.023 0.017 5.0 0.155 1.045 1.836 0.185 0.089 0.057 0.040 0.031 0.027 0.021 0.021 0.017 0.021 0.017 0.012 0.017 0.017 8.0 0.150 1.004 1.285 0.172 0.094 0.061 0.040 0.032 0.023 0.018 0.018 0.017 0.018 0.018 0.018 0.013 0.014
10.0 0.181 1.164 2.431 0.170 0.165 0.066 0.086 0.061 0.048 0.037 0.037 0.025 0.019 0.014 0.020 0.014 0.014
Run 2, batch 2, Ipm polyester cloth
12.0 0.138 1.029 2.604 0.254 0.146 0.091 0.056 0.040 0.034 0.024 0.024 0.018 0018 0.018 0.013 0.019 0.013
17.0 0.138 1.012 2.778 0.220 0.1 18 0.069 0.052 0.035 3.025 0.025 0.025 0.020 0.020 0.020 0.015 0.020 0.015 19.5 0.055 0.916 5.208 0.410 0.213 0.131 0.092 0.061 0.043 0.038 0.038 0.026 0.021 0.026 0.021 0.016 o.mi

Table 2.5. Statistical analysis summary of plugging tests for all microscreen runs".
Table 2.6. Cost and energy of processes for a for a IO3 kg/day (lo6 liters/day) installation.
Least squares parameters
Flux Polymer Biomass Time-interval ,min Intercept concn concn
P o P2 PI
0- 4 4- 8 8-12 12-16 16-20 20-24 24-28 28-32 32-36 36-40 40-44 44-48 48-52 52-56 56-60
5.922 1.312 0.702 0.497 0.4 I3 0.303 0.256 0.218 0. I95 0.164 0. I48 0. I24 0. IO9 0.097 0.082
-0.205t 4.740 4.403 4.297 4.276 4.189 -0. I67 4.141 -0. I34 -0. I14 4 . 1 1 1 -0.086 -0.076 4.070 -0.064
-22.272 -2.49 I
-0.868 -0,546 -0.519 4.412 4.376 -0.279 -0.223 -0. I76t -0. I56 4.134 -0.09 I t -0.0287
-1.185
Model fitted: J = PO + P X i + PIPE. where .I is the mean flux obtained in the time interval, X i is the effluent biomass concentration, and P, is the effluent polymer concentration.
t Not statistically significant.
tests were three to four times greater than were measured in the larger scale micro- screen tests. Similar differences were ob- served under all comparable conditions. We believe the differences are primarily due to dead space below the filter media and above the plug in the static test apparatus which tended to cause a positive bias in the amount of filtrate obtained. Based on the lower fluxes obtained, the microscreen area requirements necessary to filter the lo6 liters of diluted culture broth providing 1,000 kg/day of polymer were estimated to be a 10 ft X 16 ft microscreen unit using the 6pm media at an estimated cost of $80,000. Comparisons with the estimated cost and energy requirements for diatomaceous earth (DE) filters or centrifuges are presented in Table 2.6. It appears that microscreens are less expensive and require far less energy than either process alternative although polish-filtration of microscreen effluent appears necessary.
Capital Process cost, io3 $ Power, hp
DE filter 155 Centrifuge' I07 M icroscreen' 80
I80 40
8
'Maximum power demands up to 60 hp. 2 Polishing step required.
BACKWASH SOLIDS CONCENTRATION
One of the possible advantages of using a microscreen for gross solids removal is byproduct or animal feed use of fungal biomass and other culture broth solids. This also provides for decreased waste disposal. However, solids will have t o be concentrated to a suitable level prior to further use.
The concentration of backwash solids was investigated using a 12 in. DeLaval basket centrifuge which operated at a constant 2,800 X g. Tests with the backwash from several different microscreening runs were made. The data from runs 5 and 6 are reported in Table 2.7. Based on these results, it appears possible to concentrate the backwash solids to a level of 2 or 3% volatile suspended solids, which corresponds to roughly 10 times the weight of wet solids. The centrifuge cake is a relatively pasty material which could be either dried or used directly as animal feed. Bench tests reported under Miscellanea cover rat feeding with solids. Centrifugation of microscreen back- wash is a relatively low energy, low cost operation, adding $10,000 capital cost to the 1,000 kg/day pilot described in Table 2.6, and using about 2 hp energy.
27

Table 2.7. Summary of microscreen backwash stream centrifugation tests"
Feed. Biomass. Run gpm Stream g,'liter VSS Comment
~ ~ ~ ~ ~~~~~~
6 10.0 feed I .26 I 6 rnin extra spin. cake 31.50 firm cake centrate 0.88
5 13.5 feed 1.15 3 min extra spin. cake 28.06 cake slightly liquid centrate 0.35
"DeLaval 12 in basket centrifuge. 2800 X R.
CONCLUSIONS
Microscreening, particularly when cou- pled with centrifugation, provides an attrac-
tive method for gross scleroglucan-biomass separation. The method, because of low solids production and ease of operation, would be particularly suited to field opera- tions.
A particular interest in considering the use of microscreens for gross solids removal is the Ceca contention that low head filtration for polymers provides a better injection broth because of the removal of soft, or pressure deformable, aggregates, which are extruded through higher head filters. Microscreens, in general, work under less than a meter of water head pressure, and should therefore remove finely divided gelatinous aggregates well if proper seals and media are selected.
28

3. Pressure Filtration Methods In Chapter 2, the use of microscreens for
the separation of fungal biomass from culture broth was discussed. Microscreens operate with a pressure differential corre- sponding to the difference in liquid levels inside and outside the rotating drum. Generally, this pressure differential is < I psi which limits the permeate flux that can be attained with a given media. However, because of the high solids content, it appears that a method which permits continuous removal of solids in a concentrated stream would permit production of a higher quality stream. It was unclear a t the start of these experiments, which chronologically preceded the microscreening work, whether it would be more effective to use filtration alone or as a second step following micro- screening.
Tangential filtration methods are particu- larly effective where streams contain large amounts of solids. These methods, which inc1ud.e axial filtration and the new Gelman cartridge filters described below, rely on the flow of the feed stream past the surface of the filter, as shown in Fig. 3.1 (B), to remove accumulating solids. This is particularly important where solids are gelatinous, as they are in the biopolymer -
biomass separations which we have been studying, since the filtercake is highly viscous and the polymer hasa tendency t o be retained in the cake produced using a straight through filter, also shown in the figure (A).
Pressure-filters with a tangential flow configuration appear to offer the prospect of higher fluxes and reduced media surface area requirements as well as reduced fouling and ease of backwashing through the application of shear forces a t the media surface. Shear was applied in two ways: high velocity rotation of the filter media (axial- flow filter) and high velocity fluid flow across the media surface (cross-flow filter).
Early investigations a t this laboratory of cross-flow filtration methods were described by Dahlheimer, Thomas, and Kraus (1970). Investigations of the concentration of microbial cells by tangential filtration methods were reviewed by Henry (1972). Recent applications a t this laboratory of cross-flow filtration and axial filtration methods to municipal and industrial waste treatment were described by Kraus (1974).
The axial filter used was as developed by Nelson and described by Kraus ( 1 974). A diagram of the axial filter used is shown in Fig. 3.2. The filter consists of a hollow rotor
F E E D I I I
which carries the filter medium on the outside of the cylindrical surface and ORNL-DWG. 70-5404
rotates in a pressure jacket. Feed is intro- I l l ---- - duced into the annulus between iacket and ? ? T t t t v - J~ ..... -. ~ ~ ~~~ - rotor. After passage through the filter
medium, the filtrate is conveyed from the filter through the rotor shaft.
The rotor used in these experiments was 3.5 cm in diameter and had 110 cm2 of effective filtering area. The effective area
A 6 was reduced to 100 cm2 when the Acropor filter membrane was applied. The annulus between the rotor and the pressure jacket
I I I PRODUCT
I l l PRODUCT
Fig. 3.1. Straight through (a) and tangential (b) filtration.
29

ORNL- DWG. 74-4005R
CONCENTRATE c-
ROTOR
FEED PRO DUCT - Fig. 3.2. Axial filter.
was 3 mm in radial thickness. Feed at constant pressure was supplied from a 19 liter pressure vessel connected to a regulated compressed air supply. The concentration of the material in the annulus was controlled by removal of concentrate with a variable speed Cole-Parmer peristaltic pump throughout each run. Filtrate and concen- trate were collected as time fractions. A hydrophilic Acropor type AN membrane backed up with a 125 pm stainless steel screen was used. The pore size of the Acropor type AN was 5 pm unless otherwise specified. Screened product was prepared with the axial filter by omitting the Acropor membrane.
Straight through (batch) filtration experi- ments were conducted using a 142 pm flat plate pressure filter with a n Acropor type AN membrane without prefilter. Feed was supplied at constant pressure as described above. Filtrate fractions were collected
using a Gilson Miniescargot fractionator except at the beginning of the run when large fractions were collected using graduated cylinders.
Cross-flow experiments were made using a circulating loop as described by Kraus (1974). In the version used in these experi- ments, a filter module was inserted in a loop consisting of a feed tank and a pump. New feed was added and the concentrate was withdrawn or sampled continuously. The Gelman pleated cross-flow module used is a novel experimental device (patent pending) which is a new company product. The major element of this module is a cross-flow cartridge as shown in Fig. 3.3 which contains pleated channels each containing a membrane wall (B), a spacer material (C), which promotes turbulence, and a relatively impermeable material (D) to create the flow channel. A plastic ring (H), glued onto the external impermeable layer, creates a seal between the cartridge and the housing so as to force the pressurized liquid into the parallel flow channels. The membrane wall is supported by a pleated porous plastic mesh which allows the filtrate to drain past the porous support tube (E) into the product compartment. The module contains 3060 cm2 of filter surface.
Both the axial filter and the cross-flow filter have the advantage that the filter can be backwashed by merely reversing the direction of flow of the filter permeate through the filter media.
BROTH PREPARATION
The culture broth used in the filtration experiments was taken from a fermentation run using Sclerotium glucanicum NRRL 3006. Details are presented in Materials and Methods.
The broth produced was first neutralized with potassium hydroxide to a pH between 6
30

ORNL-DWG 78-152951
Fig. 3.3. Gelman pleated cross flow cartridge. Upper view: photograph of assembled filter cartridge shows sealing O-ring. Lower view: cutaway drawing shows details of construction: (a) porous pleated support screen to provide mechanical support under applied pressure; (b) pleated microporous filter element; (c) pleated spacer which creates the thin flow channel and promotes tubulent flow; (d) imperme- able film which creates the flow channel; (e) porous support tube to provide a n exit for permeate; (f) open end cap which provides a n exit for product flow; (g) closed end cap which completely seals one end of the module; (h) outer seal ring which creates the seal between the impermeable film in the module and the interior of the housing. Back pressure support tube not pictured. The ends of the cartridge are potted and sealed. A space between the ends of film D and the end seals is provided to allow theentrance and exit of the flow channel fluid.
and 8. The neutralized broth was heated to 80 C for 30 min and then blended in a Waring blender for a t least 2 min. After cooling to 25 C, the culture broth was diluted prior to filtration to a polymer concentration of 1 glliter and a biomass concentration of about 1 g / liter.
A comparison of feed and filtrate viscos- ity was used as an indication of polymer rejection by the membraned uring filtration. Samples were centifuged a t 1 1,OOOX g for 15 min in a Sorvall centrifuge to remove suspended solids before viscosities were determined. Viscosity was determined a t 25 C for a shear rate of 11.5 sec-' using a Brookfield LVT microviscometer fitted with a 0.8" cone.
ONE STEP FILTRATION
The major concern in this study is the separation of high viscosity polymer from the biomass of its parent fungus. Although we will discuss some of the mechanisms implied by classical dynamic membrane and filtration theories, these theories are based on ideal models, and they may not be adequate to describe the complexities occurring in these processes. Of particular concern is that the filtercake may not be homogeneous.
Figure 3.4 presents the fluxes obtained with the 142-mm flat-plate filter using the diluted culture broth as the feed. The fluxes calculated from the volumes of permeate produced are plotted as a function of elapsed time. Since the filtration runs were carried out a t constant pressure, a decline in flux rate with time was expected with cake buildup. The initial fluxes were less in order of decreasing pore size. Fluxes declined in a11 cases as filtercake buildup and ap- proached a common value toward the end of the run. Filtrate viscosities plotted in Fig. 3.5 indicate polymer rejection, or decreased concentration of polymer in the permeate compared with the concentration of po- lymer in the feed stream, by all of the membranes tested, although an induction period with the 5 pm membrane indi- cates that polymer passes through this pore size. Increasing incorporation of polymer in
31

O R N L DWG. 78.7553
1 Pore size (wn)
lo l l
o = 5 o = 3
+ = 0.45 A = 1.2
loJ ' 1
12 10' 12 ELAPSED TIME (min)
-.
Fig. 3.4. Flux of diluted culture broth through a 142 mm flat plate 5 pm filter at 5 psi.
O R N L DWG. 78-7552
loo ' I 12 12 12
ELAPSED TIME (min) Fig. 3.5. Viscosities ofdiluted culture broth filtered
through a 142 mm flat plate 5 pm filter. Viscosities measured at a shear rate of 11.5 sec-'.
the filtercake may account for a steeper flux decline slope expected on the assumption of the flux being inversely proportional t o cake thickness (Kraus 1974).
Figure 3.6 presents the fluxes obtained using the axial filter. The 5 p m mem- brane a t 5 psi differential pressure gave higher fluxes than with the flat-plate filter. A flux decline was observed after an initial 15 min period, and filtrate viscosities presented in Fig. 3.7 indicated less polymer rejection than with the flat plate filter. More pro- nounced flux decline and greater polymer rejection at a differential pressure of 10 psi may indicate a compaction of the filtercake. Because polymer rejection was still observed a t high shear rates using diluted culture broth as feed, additional tangential filtra- tion experiments were conducted using
ORNL DWG. 78-75JJ
10' .l +-+-+-+- ++++- t
O = 5 5 1600 o = 5 I O 1 6 0 ...
A = 125 5 2000 + = 125 2.5 2000 X = 125 1.25 2000
lo4 ' I
I? lbl 10 ELAPSED TIME (rnin)
Fig. 3.6. Flux of diluted culture broth through an axial filter.
32

SNOI.LVXL7Id dXLS 0M.L
"\
LSSL-~L .ohia iNno

O R N L DWG. 78-7556
0-0-0-0-
- - - - -
-
PA B
FILTRATES FROM PASSAGE - 5 - OFSCREENED FEEDTHROUGH - - 0 S p m ACROPOR - A 5 p m NUCLEPORE -
-
0 3 p m NUCLEPORE 2 - -
1 1 I I I I I I I I I I I I I I l l
A = C row + = C r i i w 15
loo 10’ 10‘
Fig. 3.9. Viscosities of diluted culture broth prescreened through an axial filter and treated further by a 5pm Acropor wrapped axial filter. Viscosities measured at a shear rate of 11.5 sec-’.
ELAPSED TIME (min)
limitations prevented higher d i ffe ren t ial pressure and flow rate observations at this time.
Studies on two stage axial and cross flow filtrations were extended to investigate changed broth production conditions and to examine higher flow rates using the Gelman pleated module.
The first stage in all cases was by axial filtration through square-weave stainless steel screens. Filtrates from two apertures, 120 and 200 mesh, were tested in second stage axial filtration with 5 pm Acropor AN filters. The other first stages were with 200 mesh. Besides those already listed, second stages were with 3 and 5 p m Nuclepore (a film with cylindrical pores, perpendicular to the surface, of a narrow pore size distribu- tion); a Gelman pleated cross flow module with 5 pm Acropor AN; and, for compa- rison, a medium aperture glass filter, used in a straight-through flow scheme.
Fig. 3.10 summarizes fluxes in second stage axial filtrations, and Figs. 3.11 and
ORNL DWG 79-537
I I I I I
SCREENED THROUGH FILTERED THROUGH 5 p m ACROPOR 5 p m ACROFQR
o 200 MESH 120 MESH
A 200 MESH 5 p m NUCLEKIRE 200 MESH 3 p m NUCLEPoRE
0 I 2 3 4 TIME (hr)
Fig. 3.10. Axial filtration at a rotational speed of 2,000 rpm (-1 1 ft/sec) of screened culture broth at 7.5:l dilution and 7 psi.
ORNL DWG 79-564
loo 1 @=
2 5i 1 X
I
SCREENED FEED F
3.12, viscosities of feed and filtrate. In all cases, flux decline was rapid, but there was no significant loss of viscosity. There appeared to be little difference between Acropor and Nucleopore, and perhaps slightly slower flux decline with 5 pm Acropor when the first stage was through 200 mesh instead of 120 mesh.
34

ORNL DWG 79-565 100 I I I 1 I 1 ” I I I 1 1 1 1 1
o 5 u ACROPOR
I I I 1 1 1 1 1
8
2 0.1 J U
8
-0 0 - 0 0 0
I ‘ I I I I . SHUTDOWN
Fluxes in cross-flow filtration through the Gelman 5 pm Acropor AN pleated module are presented in Fig. 3.13. From informa- tion provided us by Dale Hauk of Gelman, a pump rate of 1 gpm is equivalent to about 0.24 ft/sec average feed solution rate past the membrane surface. Circulation velocities were therefore <1 ftlsec. Although this would be a low velocity in an open channel, a screen in the flow path promotes turbulence. There was substantial viscosity loss when the Gelman module, as opposed to the axial filter, was used under these conditions. Tests using higher circula- tion velocities are needed.
Plugging tests for two-stage filtration effluents as well as that from a conventional sintered glass filter are shown in Fig. 3.14. The flux declines of filtrates from the axial filtration were mugh higher than those of similar filtrates presented in the September 1978 monthly report. Flux declines for filtrate from the Gelman module appeared to’ be quite tolerable.
P 0.2 0 -
c
0 I I I I I I I I l l
7 0 20 40 60 80 103
OPERATING TIME h i n )
Fig. 3.13. Cross-flow filtration of prescreened culture broth through the Gelman cross-flow filtration module using 7.5:1 dilution, 200 mesh prescreen, and a 5 pm Acropor filter media. Inlet pressure to the Gelman module is the upper pressure curve, and the lower curve is the pressure down- stream of the Gelman module. Viscosities were measured at 11.25 sec-’.
Differences between polymer batches could account for the observed differences in plugging fromdifferent tests. However, in view of the difference between filtrates from the same pore-size Acropor filter in the Gelman module and in the axial filter, we suspect that there may have been leakage around the rotating seal of the axial filter. Such leakage may also have allowed gross material into the filtrate in prescreening. Filter cakes of this material might have then caused fluxes to be less favorable than previously observed in other second stage filtrations and have caused filtration of polymer and consequent loss of ’viscosity with the Gelman module.
35

5
' O ; I 2 OB O
A
0 0 0 A
A 0
0
I 0 10 20
0 0.01
TIME (min)
PRESCREENING FILTRATION THROUGH MESH THROUGHp
0 200 5 A 0 120 5 A
5 N
0 200 3 N 0 200 5 A (GELMAN
a 200 GLASS,MED.
MODULE) n m II*N
Fig. 3.15. Fluxes of diluted culture broth through 5 pm Nuclepore filters. The axial filter was operated a t 2,000 rpm which corresponds to 11 ft/sec.
ORML DWO m - m n
FEED 0 FILTRATE FROM I2 PSI FILTRATION A FILTRATE FROM 1 PSI FILTRATION
Fig. 3.14. Comparison of the plugging rates of filtrates using Acropor (A), Nuclepore (N), and glass
-media. Culture broth dilution was 7.51. The plugging tests used 1.2 pm Millipore media.
The bench tests whose results are shown in Fig. 3.15 covered axial filtration of heated, neutralized, blended, and diluted broth through a n axial filter wrapped with 5 p m Nuclepore filter media. Sclerotium rolfsii broth pretreated by passage through a screen wrapped axial filter was compared to broth without pretreatment. The fluxes of the screened material appears to be higher than that of the unscreened material, although neither was particularly high. vowever, as shown in Figs. 3.16 and 3.17, a major advantage of the screen pretreatment is recognized in a higher Nuclepore product viscosity.
Plugging test results, shown in Figs. 3.18 and 3.19 also show a marked advantage for
lrn[ .
A . A
I : t 10 SHEAR RATE Is.c-'I 1 0 0 1000
Fig. 3.16. Viscosities of diluted culture broth after passage through a 5pm Nuclepore-wrapped axial filter.
the screened feed in higher fluxes; however, the rate of flux decline for both the screened a n unscreened feed is similar.
CONCLUSIONS
Tangential filtration methods may offer substantial improvements over straight
36

. WWL 010 n-irsm
. FEED 0 FILTRATE F W I2 PSI FILTRATION A FILTRATE FROY 3 PSI FILTRATCU
I
-
I 1 I I I I I I I 1 I 1 1 1 1 1 I I 1 1 1 8 ,
10 1 0 0 IWO
4
d 0
6 0
I , #
Q
TIME (mlnl
Fig. 3.19. Plugging test on permeate from axial- filtration of diluted culture broth by a 5 pm Nuclepore-wrapped axial filter through a 1.2 pm Millipore-wrapped axial filter.
through filtration methods for the separa- tion of fungal biomass from scleroglucan polymer. However, rejection occurs using conventional methods, and large amounts of precoat and body feed appear to be warranted by the sharply declining fluxes observed. Tangential filtration would dec- rease the observed flux decline and diato- maecous earth requirements.
In the two-stage axial and cross-flow filtration procedures, there appears to be little difference between Acropor AN and Nuclepore media materials. In view of the effect of treatment on microscreen perfor- mance described in Chapter 2, culture broth treatment should be investigated with two stage axial and cross flow filtration proce- dures.
37

4. Alternative Organisms Rosenberger (1976) and Smith (1975)
indicate that the glucan /3-1,3 glucosylglu- cose with /3-6,1 side branches is produced by many fungi. Although the fungi we have primarily investigated for production of scleroglucan are desirable for field produc- tion, they do have some drawbacks: mild plant pathogenicity, oxalic acid production, requirements for clearance as food-grade organisms, inability to fix nitrogen, a requirement for a t least thiamin, and a decrease in solution biopolymer at the end of a fermentation run. There is room for improvement. Several fungi which were currently in culture as food-grade organ- isms, or which had a record of high culture viscosity, were obtained for screening. These initial experiments are simply to determine whether these organisms are able to produce an alcohol-precipitable polymer when grown on our conventional scleroglucan production medium which contains glucose and nitrate. Otherwise, media suitable for their growth and reproduction would have to be developed. We determined the amount of polymer made, the amount of biomass produced, final culture pH, reducing sugar, and nitrate.
TEST DESIGN
Several organisms from the American Type and Quartermaster Corps Culture Collections were selected. Later tests are planned to include some organisms from the Northern Regional Research Center of the U.S. Department of Agriculture. The organisms used included Pleurotus ostrea- tus Q M / MYCO 987, Claviceps purpurea QM / MYCO 68 10, Pleurotus japonicus ATCC 20 159, Pleurotus sapidus ATCC 24986, Lentinus edodes ATCC 28759, Pleurotus cystidiosus ATCC 28785, and Pleurotus sajor-caju ATCC 32078, Individ-
ual fermenters with 1 liter of the standard nitrate-glucose broth used for Sclerotium rolfsii cultures were sterilized and innocu- lated from slants. Penicillin (100,000 l U / liter) and streptomycin (100 mg/ liter) were added to the fermenters to preserve axenic culture conditions. The culture nitrate level was 3 glliter (0.035 M), and broth pH after sterilization was between 4.2 and 4.6.
Since we were unable t o obtain informa- tion on the production of beta-glucan polymer by these organisms, we elected to continue the experiments until a level of around 1% reducing sugar was reached or until two months had passed since the beginning of the experiment. It is important to remember that, since the cultures were started from slants, the growth times reported may be much longer than would be expected with the conventional use of a log phase liquid innoculum. The results were analyzed using the SAS program, a statisti- cal analysis system described by Barr, Goodnight, Sall, and Helwig (1976).
Procedures for reducing sugar, residual nitrate, pH, volatile solids, and biopolymer determinations are described in Materials and Methods. The nitrate procedure used an Orion specific ion electrode. Reducing sugar analysis was performed using a commercial preparation by Hycel which contained between 3 and 3.5% o-toluidine in glacial acetic acid. Volatile solids were determined on ignition of solids filtered using a glass fiber filter. Biopolymer determinations were made as a difference between whole culture alcohol precipitation and volatile suspended solids.
RESULTS
Figs. 4.1,4.2, and 4.3 show the respective polymer and biomass, pH, and residual
38
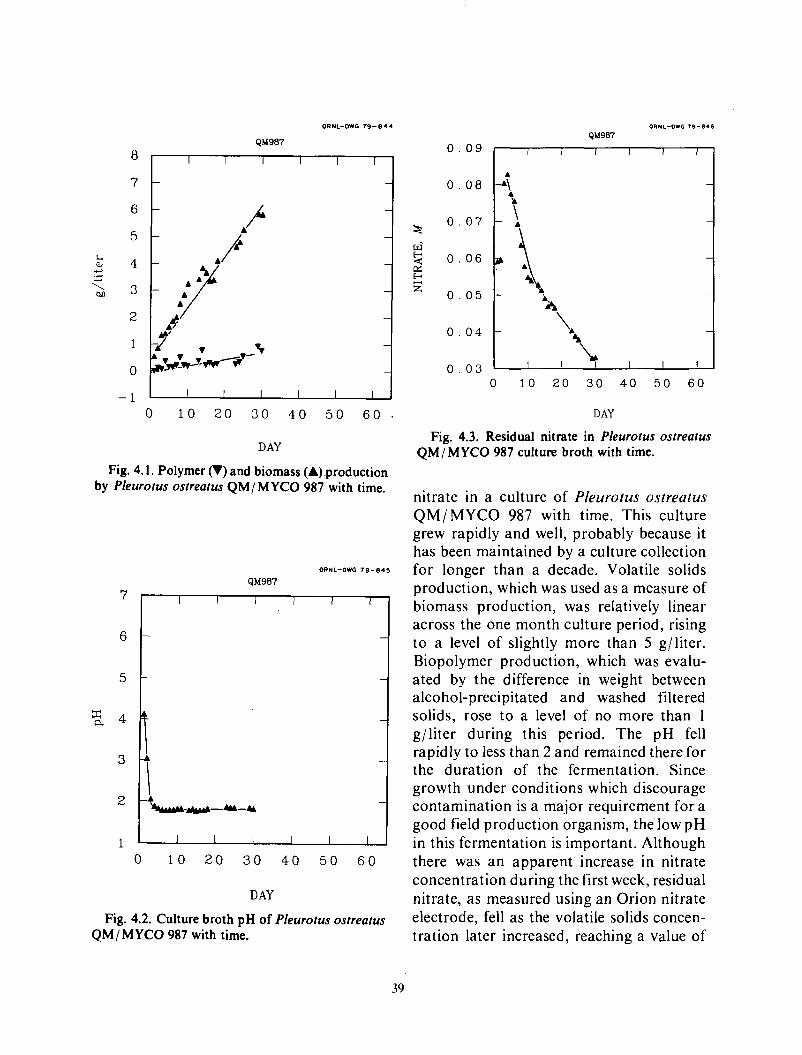
0
7
6
5
$ 4 5 2 3
2
1
0
-1
ORNL-OWG 79-044
QM907
1 A /&
0 1 0 2 0 3 0 4 0 50 6 0 .
DAY
Fig. 4.1. Polymer (r) and biomass (A) .production by Pleurotus ostreafus QM/MYCO 987 with time.
6
5
E 4
3
2
1 0 1 0 2 0 3 0 4 0 50 6 0
DAY
Fig. 4.2. Culture broth pH of Pleurotus ostreatus QM/ MYCO 987 with time.
0 . 0 9
0 . 0 8
0 . 0 7
0 . 0 6
0 . 0 5
0 . 0 4
0 . 0 3
ORNL-QWG 79-146
QM987
0 10 2 0 30 4 0 5 0 6 0
DAY
Fig. 4.3. Residual nitrate in Pleurotus ostreatus QM/MYCO 987 culture broth with time.
nitrate in a culture of Pleurotus ostreatus QM/MYCO 987 with time. This culture grew rapidly and well, probably because it has been maintained by a culture collection for longer than a decade. Volatile solids production, which was used as a measure of biomass production, was relatively linear across the one month culture period, rising to a level of slightly more than 5 g/liter. Biopolymer production, which was evalu- ated by the difference in weight between alcohol-precipitated and washed filtered solids, rose to a level of no more than 1 g/liter during this period. The pH fell rapidly to less than 2 and remained there for the duration of the fermentation. Since growth under conditions which discourage contamination is a major requirement for a good field production organism, the low pH in this fermentation is important. Although there was an apparent increase in nitrate concentration during the first week, residual nitrate, as measured using an Orion nitrate electrode, fell as the volatile solids concen- tration later increased, reaching a value of
39

slightly over the input concentration. Thus, it appears that the organism was not nitrate starved during this period; this is important in that conditions of low medium nitrogen and high medium phosphate have been reported to be conducive to the production of high viscosity polymers during fungal antibiotic fermentations. Because nitrate electrodes, like many wet chemical proce- dures, have a significant interference in apparent nitrate caused by nitrite, it is possible that the apparent increase in nitrate is actually a reduction of nitrate to nitrite. It is also possible that this organism, like many reported mushroom species, is fixing ni- trogen.
This organism, which is the alternate state of a commercially canned and supplied mushroom, is an acceptable human food grade organism. Strains of Pleurotus ostrea- tus, which were the kind gift of Dr. John Ellis of the Northern Regional Research Center of the Department of Agriculture, are under consideration as potential cattle and hog food additives. (These will be tested later.) We feel that there is a good possibility of the clearance of these organisms as food grade materials for animal feeds. It seems that even the low polymer production by this organism is promising and that it will be profitable to investigate further culture conditions appropriate for biopolymer pro- duction.
Figs. 4.4,4.5, and 4.6, respectively, show polymer and biomass, pH, and nitrate levels during the culture of Cluviceps purpurea Q M / MYCO 6810. This organism, although it is routinely cultured on growiilg grain for the production of pharmaceutical feed- stocks, has been grown in stirred fermenters. During these fermentation runs, little or none of the usual products of grain culture were noted, but the fermentations were observed to produce a high concentration of very viscous gum. Literature indicates that
ORNL-CWG 79-840
QM6810
7
6
5
I I I I I I
0 1 0 2 0 3 0 4 0 5 0 6 0
DAY
Fig. 4.4. Polymer (r) and biomass (A).production by Clavicepspurpurea QM/MYCO 6810 with time.
ORNL-DWG 7 9 - 8 3 9
QM6810
6
5
4
3
2
1 0 1 0 2 0 3 0 4 0 5 0 6 0
DAY
Fig. 4.5. Culture broth pH of Clavicepspurpurea ~
QM/MYCO 6810 with time.
40

ORNL-OWG 79-038
QM6810 0 . 0 9
0 . 0 8
0 . 0 7
0 . 0 6
0 . 0 5
0 . 0 4
0 . 0 3 0 10 2 0 3 0 4 0 5 0 6 0
DAY
Fig. 4.6. Residual nitrate in Claviceps purpurea QM/MYCO 6810 culture broth with time.
this particular organism is unable to decrease culture viscosity a t the end of log phase growth; thus, biopolymer produced remains available. However, as shown in Fig. 4.4, the Claviceps biomass production, as volatile suspended solids, remained low, usually less than 2 glliter. Polymer produc- tion was very slight. During the course of culture, p H rose toward neutrality from its original value of around 4.5. In spite of low biomass production, the culture nitrate level decreased from an early high to roughly two-thirds of that value. This was still slightly above the feed concentration.
It appears that this particular medium was not a suitable substrate for polymer product ion by Claviceps purpurea QM/ MYCO 6810. Other media will proba- bly be required if this organism is to be useful; however, it does not seem a promis- ing candidate at this time.
Figs. 4.7,4.8, and 4.9, respectively, show polymer and biomass, pH, and nitrate levels during the culture of Pleurotus japonicus ATCC 20159. This organism produced a
h e,
\ b.0
?i -
ORHL-DWG 7 9 - 8 3 7
A 2 0 1 5 9
I I I I I
I I I I I I I 0 1 0 20 30 4 0 50 6 0
DAY
Fig. 4.7. Polymer (r) and biomass (A) production by Pleurorus japonicus ATCC 20159 with time.
O R N L - O W G 7 9 - 8 3 6
A20159
7
6
5
5 4 3
2
1 0 1 0 20 3 0 . 4 0 50 6 0
DAY
Fig. 4.8. Culture broth pH of Pleurorus japonicus ATCC 20159 with time.
comparatively high level of biomass as volatile suspended solids, nearly 7 g/ liter. Polymer production was substantially 1 ower
41
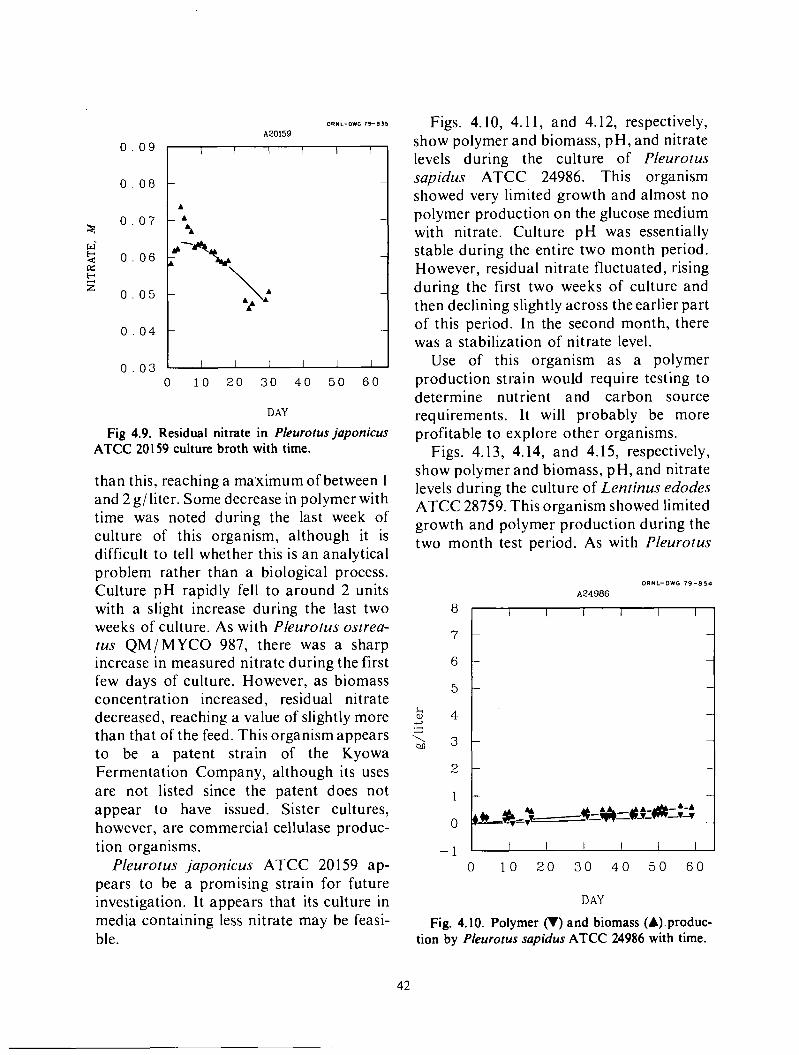
I I I I I I
0 . 0 8 - -
0 . 0 7 - A - * i
W' 2 0 . 0 6 r &-+% -
- 5
A
A \A E 0 . 0 5 -
0 . 0 4 - -
0 . 0 3 I I I I I I
DAY
Fig 4.9. Residual nitrate in Pleurotus japonicus ATCC 20159 culture broth with time.
levels during the culture of Pleurotus sapidus ATCC 24986. This organism showed very limited growth and almost no polymer production on the glucose medium with nitrate. Culture p H was essentially stable during the entire two month period. However, residual nitrate fluctuated, rising during the first two weeks of culture and then declining slightly across the earlier part of this period. In the second month, there was a stabilization of nitrate level.
Use of this organism as a polymer
than this, reaching a ma'ximum of between I and 2 glliter. Some decrease in polymer with time was noted during the last week of culture of this organism, although it is difficult to tell whether this is an analytical problem rather than a biological process. Culture pH rapidly fell to around 2 units with a slight increase during the last two weeks of culture. As with Pleurotus ostrea- ius QM/MYCO 987, there was a sharp increase in measured nitrate during the first few days of culture. However, as biomass concentration increased, residual nitrate decreased, reaching a value of slightly more than that of the feed. This organism appears t o be a patent strain of the Kyowa Fermentation Company, although its uses are not listed since the patent does not appear to have issued. Sister cultures, however, are commercial cellulase produc- tion organisms.
Pleurotus japonicus ATCC 20 159 ap- pears to be a promising strain for future investigation. It appears that its culture in media containing less nitrate may be feasi- ble.
requirements. It will probably be more profitable to explore other organisms.
Figs. 4.13, 4.14, and 4.15, respectively, show polymer and biomass, pH, and nitrate levels during the culture of Lentinus edodes ATCC 28759. This organism showed limited growth and polymer production during the two month test period. As with Pleurotus
ORNL-DWG 79-854
A24986
I I I 1 I I 1
I I I -1 ' I I
0 1 0 2 0 3 0 4 0 5 0 6 0
DAY
Fig. 4.10. Polymer (V) and biomass (A).produc- tion by Pleurotus sapidus ATCC 24986 with time.
42

ORNL-DWG 79-853 A24986
6 -
5 -
0 1 0 20 3 0 4 0 5 0 60
DAY
Fig. 4.1 1. Culture broth pH of Pleurotus sapidus ATCC 24986 with time.
0 . 0 7 0 ' 0 8 1 0 . 0 6 I
0 . 0 3 I I 1 I I I I
0 1 0 2 0 3 0 4 0 5 0 6 0
DAY Fig. 4.12. Residual nitrate in Pleurotus sapidus
ATCC 24986 culture broth with time.
ORNL-OWG 79-852 A28759
8
7
6
5
4
3
2
1
0
-1 0 1 0 2 0 3 0 4 0 50 60
DAY
Fig. 4.13. Polymer (r) and biomass (A).produc- tion by Lentinus edodes ATCC 28759 with time.
ORNL-OWG 79-851 A28759
6i 5
2
1 1 0 1 0 20 3 0 4 0 50 60
DAY
Fig. 4.14. Culture broth pH of Lentinus edodes ATCC 27859 with time.
43

r:
suitable for growth of this organism. There 7 - I I I I I I
is a gradual pH drop of around one unit across the two month culture test period, and a slight fluctuation in the amount of residual nitrate in the culture test broth.
We originally picked this organism for test on the basis of its acceptability as a food grade organism and its demonstrated acceptance of a wide variety of wood
would require further testing to find a
may not be profitable in comparison to other organisms tested. I I I I I I
i.4 -
t A 4
>fi-*-.--Ak- A A
-\ 5 .-
% 4 - -
carbohydrates. However, it appears that it
suitable culture medium. Further testing
3 - -
2 - -
1
0 . 0 9
0 . 0 8
0 . 0 7
0 . 0 6
0 . 0 5
0 . 0 4
0 . 0 3
ORNL-DWG 79 -050
A28759
- 0 1 0 2 0 30 4 0 5 0 6 0 I I I I I 1 - 1
44
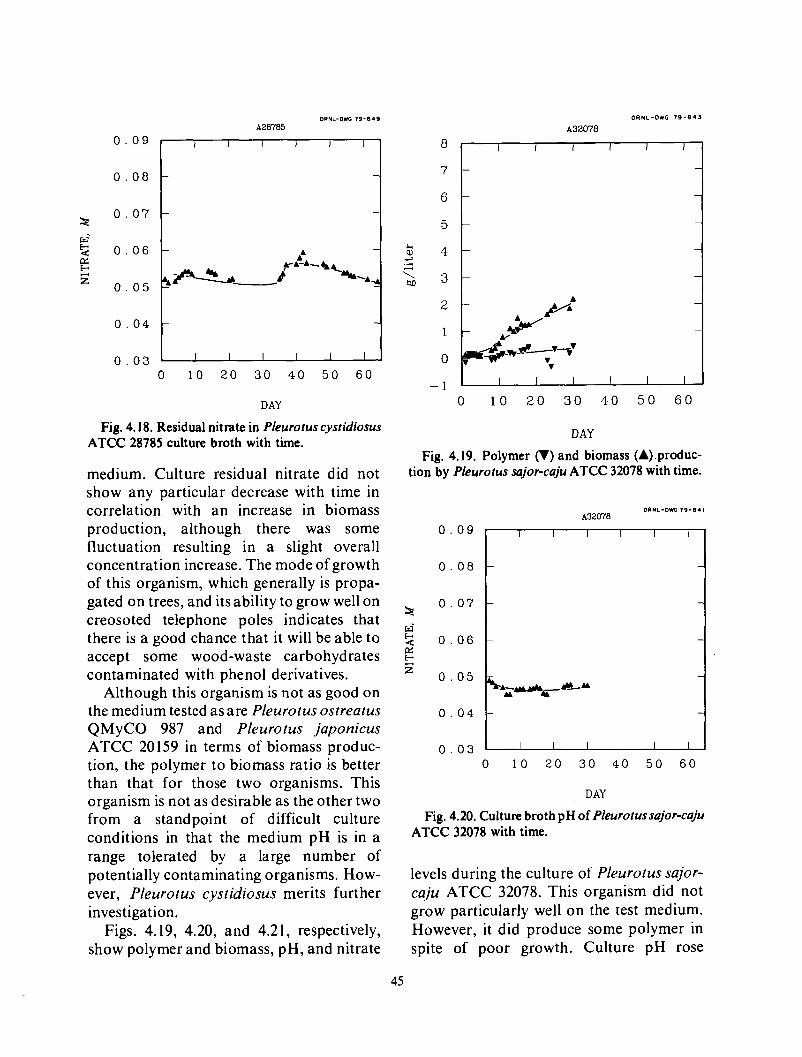
ORHL-DWG 19-849
A20705 ORNL-OWG 7 9 - 0 4 1
A32078 0 . 0 9
0 . 0 8
0 . 0 7
0 . 0 6
0 . 0 5
0 . 0 4
0 . 0 3 0 1 0 2 0 3 0 4 0 5 0 6 0
DAY
2
1
0
-1
DAY Fig. 4.18. Residual nitrate in Pleurotus cystidiosus ATCC 28785 culture broth with time.
medium. Culture residual nitrate did not Fig. 4.19. Polymer (r) and biomass (A).produc-
tion by PIeurorus sajor-coju ATCC 32078 with time. show any particular decrease with time in
O R N L - D I G 1 9 - 8 4 t correlation with an increase in biomass A32078 production, although there was some fluctuation resulting in a slight overall concentration increase. The mode of growth of this organism, which generally is propa- gated on trees, and its ability to grow well on creosoted telephone poles indicates that there is a good chance that it will be able to accept some w ood-w a ste carbohydrates contaminated with phenol derivatives.
Although this organism is not as good on the medium tested as are Pleurotus ostreatus QMyCO 987 and Pleurotus japonicus ATCC 20159 in terms of biomass produc- tion, the polymer to biomass ratio is better than that for those two organisms. This organism is not as desirable as the other two from a standpoint of difficult culture conditions in that the medium p H is in a
0 . 0 7 2? 0 . 0 8 I
0 . 0 6
0 . 0 5
0 . 0 4
0 . 0 3 0 1 0 2 0 30 4 0 5 0 6 0
DAY
Fig. 4.20. Culture broth pH of Pleurotussajor-caju ATCC 32078 with time.
range tolerated by a large number of potentially contaminating organisms. How- ever, Pleurotus cystidiosus merits further investigation.
Figs. 4.19, 4.20, and 4.21, respectively, show polymer and biomass, pH, and nitrate
levels during the culture of Pieurotus sajor- caju ATCC 32078. This organism did not grow particularly well on the test medium. However, it did produce some polymer in spite of poor growth. Culture pH rose
45

6 -
5 4 -
3 -
2 -
1 0 1 0 2 0 3 0 4 0 5 0 6 0
r+ ?r i- .--ur-b
I I I I I I
slightly and returned to normal pH for glucose nitrate medium. Residual nitrate remained essentially constant duringculture, as might have been predicted from the low level of biomass development. This particu- lar organism was selected both for its acceptability as a potential feed ingredient
oRNL-DWG 79-a42
and for its ability to fix nitrogen. The literature reports a very high level of protein in the mycelium, in some cases, as high as 65% on a dry weight basis.
This organism is marginal for further investigation. It has traits which would be very useful as a polymer production organ- ism including use of novel carbohydrates and the fixation of nitrogen during fermen- tation. The high protein level would be useful in cattle and hog ration supplements. However, the pH during culture is one at which many organisms could grow, and investigation of a better medium is obvi- ously required if this organism is to become a polymer production organism.
Since the culture broth was viscous and had widely dispersed large solids, consistent sampling and analysis was difficult. In order to test the significance of the polymer production results, least squares analyses were performed using the SAS 76 general least squares procedure, GLM. The slope of a least squares polymer production line versus elapsed time was determined for each
A32078
organism tested. These slopes and the associated significance levels are presented
Fig. 4.21. Residual nitrate in PIeurotus sajor-caju in Table 4.1. Also presented are the correlation coefficients for the line and the
DAY
ATCC 32078 culture broth with time.
Table 4.1. Summary of statistical analysis parameters.
Organism
Slope, Model Slope, polymer t-statistic Model F-st a t is t ic
product ion, significance correlation significance glliter-day level" coefficient level"
Pleurotus osfreafus Q M I M YCO 987 0.0234 0.000 I 0.904 I 0.000 1 Claviceps purpurea Q M I M Y 0 68 I O 0.0030 0.1 131 0.3655 0. I336 Pleurotus ,japonicus ATCC 3 078 0.0356 0.000 I 0.9 I37 0.000 I
0.000 1 Pleurofus sapidus ATCC 24986 Lentinus edodes ATCC 28759 0.0076 0.000 1 0.9 I07 0.000 1 Pleurotus cysridiosus ATCC 28785 0.0096 0.0009 0.5905 0.0009 Pleurotus sajor-caju ATCC32078 0.0105 0.0084 0.5362 0.0084
0.934 I 0.0056 0.000 I f
"Significance levels were interpreted as follows: significance level- > 0.05, factor regarded as nonsignficant; 0.01 < signficance level < 0.05, factor regarded as signficant; and significance levels 0.01, factor regarded as highly significant.
46

significance levels for the model's goodness of fit. The polymer production lines were highly significant for all organisms except QM 68 10 although the amounts of polymer produced were small for some organisms as discussed above.
CONCLUSIONS
It appears that four of the seven tested organisms might be candidates for further testing. These organisms are those that appear readily cultured on the medium used and were able to produce some polymer. It appears that tests of media which contain less input nitrogen could be useful, since nitrogen consumption, as measured, was not marked. We found that these tests were particularly interesting in that they indi-
cated that it should be possible to find fungal biopolymer producers among organisms which have lower potential plant pathoge- nicities and higher acceptance as food-grade organisms.
The major analytical problem so far appears to'have been nitrate analysis. Some of the tested organisms are known nitrogen fixers, and some are thought to reduce nitrate to nitrite. Either of these occurrences decreases accuracy of nitrate analysis with an ion specific electrode. Unfortunately, Standard Methods indicates that it is difficult to find a wet chemical test for nitrate which does not show significant interference under these conditions. It may be advantageous to consider proximate analyses or total nitrogen tests in future experiments.
47

5. Enzymatic Biopolymer Hydrolysis
The properties of high-viscosity biopo- lymers for injection are critical to the control of fluid flow through porous petroleum bearing formations. Polymers decrease fingering of the flow, so that sweep of the formation with injected fluids is increased. It is important for the high viscosity polymer to flow through the small rock formation pores readily, while still having a high enough viscosity to flow slowly through high permeability streaks in the formation. Flow on the order of one foot per day for the liquids through the formation can be expected during this process, and the pressure gradient in the formation can be quite low.
Current biopolymer production methods usually involve the precipitation of a 1 to 5% biopolymer solution with alcohol or ketone solvents. The resultant precipitate is dried and ground to a fine powder. The precipita- tion step is both a purification and a concentration step. As might be expected, there is considerable difficulty in the resuspension. of powdered dried b i o p e lymer.
In order to decrease the problems arising from polymer impurities, such as plugging, formation of macrocolloids, and precipita- tion, we have investigated several methods which could be used for upgrading biopo- lymers for oil well injection. One of these methods, which is called ENPLUG, for enzymatic’ unplugging, is a method which uses enzymes to modify the structure of biopolymers so that they pass through porous bodies with micron pores more readily than d o conventional biopolymer solutions. There is much patent literature dealing with methods, including enzymatic treatments, for increasing the purity of biopolymer solutions. However, these meth- ods are, for the most part, concerned with
the removal of particulate materials, such as cell walls, from biopolymer solutions, rather than with modification of the polymer itself. The ENPLUG method is a generally applicable method primarily concerned with modification of the structure of a biopo- lymer rather than with its purification. Although we have been primarily concerned with scleroglucan and xanthan, extension of the method to celluloses, substituted cellu- loses, plant gums, alginates, agar, and other biosynthetic polysaccharides can be readily made.
PATENT LITERATURE
In view of the availability of prior art, we requested that a patent search covering the claim below be performed by Fitch, Even, Tabin, and Luedeka, a private patent law firm skilled in the area of gums and high viscosity polymers.
“A method of treating carbohy- drate polymers, including xan- t hans, polysaccharides, cellulose derivatives, and vegetable gums to enhance their optical clarity and ability to flow through porous formations comprising contacting said polymers with an enzyme capable of decreasing the molecu- lar weight of said polymer without decreasing its viscosity.”
We also used Lawrence (1976) and Jeanes (1973, which are comprehensive treatments of the high viscosity gum patent literature as sources of appropriate patents. We are summarizing our literature survey below because of general interest.
In the course of this survey, we found that most of the patents on high viscosity
48

polymer purification fell into five classes: 1) extraction from the dried fermentation mixture by treatment with alcohols, ke- tones, and chlorinated organics; 2) precipi- tation with cations; 3) precipitation with quaternary ammonium compounds; 4) treatment with proteolytic enzymes to minimize the problem of cell debris and 5 ) background patents concerning bacterial flocculation by gums,
Most of the patents are concerned with the purification of xanthan gum, a bacterial
‘high viscosity polymer which received concentrated scientific attention from the Northern Regional Research Center of the Department of Agriculture. This material was originally developed as a replacement for alginates in many of their uses, and is widely used in a variety of products currently available today. Much of the technology developed was also applicable to other biosynthetic gums which had approp- riate chemical and structural properties.
Organic Solvents
Leder and Miescher(U.S. 3,316,241 1967) claim a process for recovering xanthan gum, polysaccharide B-1459, from its fermen- tation medium which involves drying the fermentation medium and then contacting the solid material recovered with a single phase solvent mixture consisting essentially of methanol, water, and acetone or 1 , 1 , 1 trichloroethane to form a dispersion from which purified polymer is recovered. The claims and the teaching indicate that a water concentration of 3 to 20% by volume in the liquid mixture and a ratio of methanol to acetone of 4: 1 to 2: 1 are best. A temperature of 20 to 50 C is preferred. The teaching of this patent indicates that there is a higher polymer viscosity per unit weight after treatment of dried polymer.
Purification with Cations
McNeely and O’Connell (U.S . 3,232,929 1966) claim a process for producing Xantho- monas hydrophilic colloid which involves the production of xanthan gum fibers from a dilute aqueous solution following admix- ture of the solution with an aqueous slurry of lime. The fibers can be recovered by simple screening o r filtration, and are then reacted with an acid in a water-miscible organic solvent which can dissolve the resultant calcium salt. The Xanthomonas hydrophilic colloid is then removed from the solvent and neutralized with a base. The bases covered specifically in the claims include alkali and ammonium hydroxides and carbonates; the solvents include me- thanol, ethanol, isopropanol, and acetone; and the preferred acid is hydrochloric. The teaching covers several other methods of preparing the polymer, including simple neutralization of lime-precipitated fibers and neutralization followed by soxhlet extraction to remove the salt produced. The major advantages of the process claimed are the low final volume of liquid produced and the low cost of the reagents involved.
O’Connell (U.S. 3,355,447 1967) claims a process for elevating the pH of a xanthan fermentation broth to between 7 and 9, heating the broth to a temperature of 150 to 170 F for a period of at least 20 minutes, cooling the broth to 40 to 100 F, adjusting the concentration of the Xanthomonas colloid to less than 1% by weight in the solution, and filtering the solution. The claims cover addition of a bleach solution or acid neutralization of t he heated solution, as well as alcohol precipitation of the finished product. The teaching indicates that spoi- lage prevention and clarity improvement are the major reasons for the invention. The teaching also indicates that several different alkali salts can be used for the purpose of pH
49

increase, including potassium hydroxide, ammonium hydroxide, sodium carbonate, and calcium hydroxide.
Patton and Holman (U.S. 3,382,229 1968) claim an improved process for the recovery of Xanthomonas heteropolysaccharide which involves treating fermenter broth with a water-soluble salt yielding polyvalent cations to increase solids removal, filtering the broth, and increasing the broth pH to 8.5 with alkali, and recovering the precipitated polymer. The teaching covers a wide range of simple salts which have divalent cations, ranging from barium to zinc, and including many anions, e. g. halides, carbonates, and acetates.
Colegrove (U.S. 3,516,983 1970) claims a process for purifying Xanthomonas hydro- philic colloid from proteinaceous impurities by maintaining the pH of the fermentation broth above 8.0, and preferably, 10.0, and adding an alkali metal hypochlorite to the mixture. After reaction at the elevated pH, the mixture is adjusted to a slightly acid pH, and the xanthan precipitated with a lower alcohol. After treatment, the teaching of the patent indicates that the fermentation beer had a markedly improved clarity and could be readily polish-fil te red with diatomaceous earth. The alkaline hypochlorite reaction requires 1 to 5 hours according to the teaching and claims 9 to 15; however, no reaction time is specified in the first claim. The teaching indicates that alkali hypoch- lorites react appropriately to oxidize or- ganic material in the fermentation beer; however, closely related materials such as hydrogen peroxide and chlorine gas were not found functional.
Patton (U.S. 3,729,460 1973) claims an improved thickening agent prepared by reacting an alkaline compound with a heteropolysaccharide produced by Xantho- monas in aqueous reaction media at elevated temperatures. The claim specifies that the reaction medium should be substan-
tially free of polyvalent cations and have a ' pH of 11.8 to 12.8. The reaction mixture should be heated to 150 to 250 F until the reaction is substantially complete as judged by the clarity of the solution. In the teaching of the patent, Patton indicates that the clarification is due to changes in the structure of the polymer involving deacety- lation and some degree of depolymerization. He cites infrared and ultraviolet absorption studies as analytical methods which indicate the differences in structure. He also indi- cates that the clarity produced would be beneficial in foodstuffs, inks, dyes, and petroleum recovery waterflood solutions.
Buchanan and Cottle (U.S. 3,773,752 1973) claim a method of recovering Xantho- monas polysaccharides in which fermenta- tion broth is diluted with an aqueous solution of an alkali metal salt and the resultant solution coagulated and filtered to remove undesirable materials. The teaching and the claims include sea water, a n alkali metal salt, and both the general term, coagulants, and the more specific, potas- sium aluminum sulfate. The use of a filter at subatmospheric pressure for removal of coagulated impurities was also covered in the claims. In order to facilitate coagulation and filtration, dilution of the xanthan solution to a viscosity of 10 to 20 centipoises was specified in both the teaching and the claims. The use of such purified material for waterflooding was covered in the teaching.
Quaternary Amines
Precipitation of dilute solutions of xan- than gum using alcohols is a costly process (Rogovin and Albrecht U.S. 3,119,8 I2 1964). In order to decrease the cost of xanthan precipitation, methods involving the precipitation of xanthan gum with quaternary amines to form concentrated gelatinous precipitates were developed. The methods were directed towards other
50
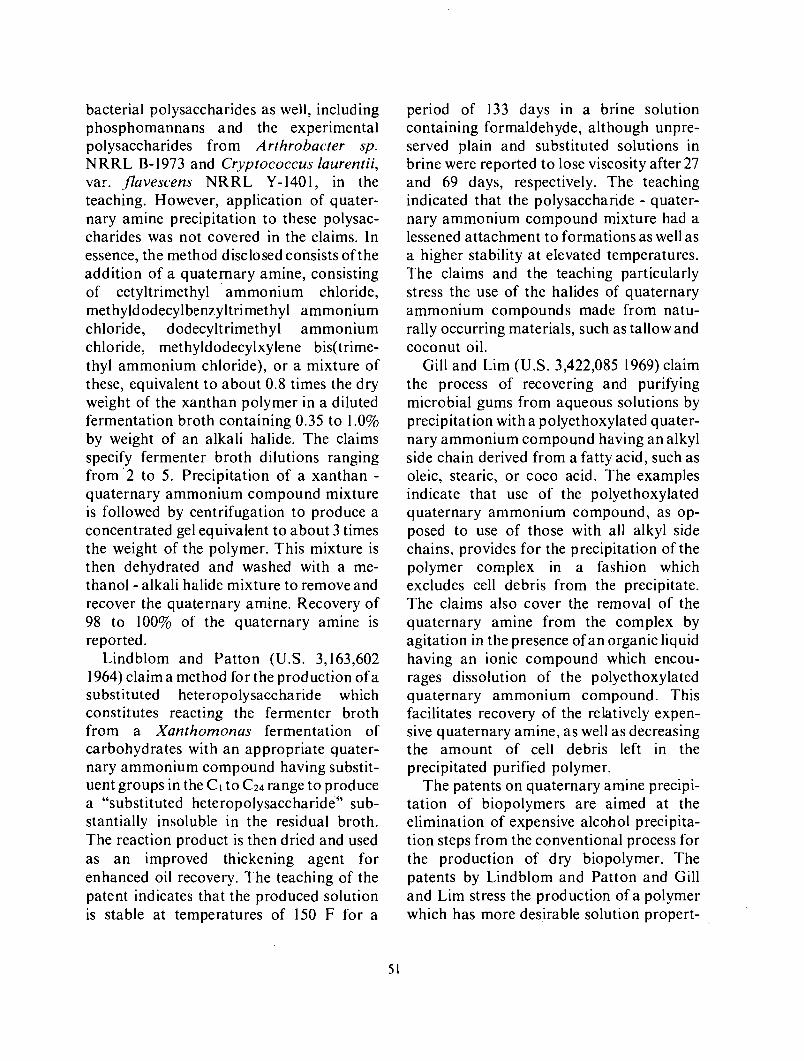
bacterial polysaccharides as well, including phosphomannans and the experimental polysaccharides from Arthrobacter sp. NRRL B-1973 and Cryptococcus laurentii, var. ,flavescens NRRL Y-1401, in the teaching. However, application of quater- nary amine precipitation to these polysac- charides was not covered in the claims. In essence, the method disclosed consists of the addition of a quaternary amine, consisting of cetyltrimethyl ammonium chloride, methyldodecylbenzyltrimethyl ammonium chloride, dodecyltrimethyl ammonium chloride, methyldodecylxylene bis(trime- thy1 ammonium chloride), or a mixture of these, equivalent to about 0.8 times the dry weight of the xanthan polymer in a diluted fermentation broth containing 0.35 to I .O% by weight of an alkali halide. The claims specify fermenter broth dilutions ranging from’2 to 5. Precipitation of a xanthan - quaternary ammonium compound mixture is followed by centrifugation to produce a concentrated gel equivalent to about 3 times the weight of the polymer. This mixture is then dehydrated and washed with a me- thanol - alkali halide mixture to remove and recover the quaternary amine. Recovery of 98 to 100% of the quaternary amine is reported.
Lindblom and Patton (U.S. 3,163,602 1964) claima method for the production ofa subs ti tuted which constitutes reacting the fermenter broth from a Xanthornonas fermentation of carbohydrates with an appropriate quater- nary ammonium compound having substit- uent groups in the CI to c24 range to produce a “substituted heteropolysaccharide” sub- stantially insoluble in the residual broth. The reaction product is then dried and used as an improved thickening agent for enhanced oil recovery. The teaching of the patent indicates that the produced solution is stable at temperatures of 150 F for a
he te rop oly sacc ha rid e
period of 133 days in a brine solution containing formaldehyde, although unpre- served plain and substituted solutions in brine were reported to lose viscosity after 27 and 69 days, respectively. The teaching indicated that the polysaccharide - quater- nary ammonium compound mixture had a lessened attachment to formations as well as a higher stability at elevated temperatures. The claims and the teaching particularly stress the use of the halides of quaternary ammonium compounds made from natu- rally occurring materials, such as tallow and coconut oil.
Gill and Lim (U.S. 3,422,085 1969) claim the process of recovering and purifying microbial gums from aqueous solutions by precipitation with a polyethoxylated quater- nary ammonium compound having an alkyl side chain derived from a fatty acid, such as oleic, stearic, or coco acid. The examples indicate that use of the polyethoxylated quaternary ammonium compound, as op- posed to use of those with all alkyl side chains, provides for the precipitation of the polymer complex in a fashion which excludes cell debris from the precipitate. The claims also cover the removal of the quaternary amine from the complex by agitation in the presence of an organic liquid having an ionic compound which encou- rages dissolution of the polyethoxylated quaternary ammonium compound. This facilitates recovery of the relatively expen- sive quaternary amine, as well as decreasing the amount of cell debris left in the precipitated purified polymer.
The patents on quaternary amine precipi- tation of biopolymers are aimed at the elimination of expensive alcohol precipita- tion steps from the conventional process for the production of dry biopolymer. The patents by Lindblom and Patton and Gill and Lim stress the production of a polymer which has more desirable solution propert-
5 1

ies. However, other than the removal of solids, such as cell debris, from the fermen- ter broth, these patents do not disclose the production of a material which has im- proved flow through porous bodies.
Enzyme Treatments
Colegrove claims a method of clarifying an aqueous solution of xanthan gum containing water-insoluble fermentation solids that comprises contacting the xan- than solution with an alkaline protease enzyme to remove cell debris and water- insoluble materials in the solution without adversely affecting viscosity (U. S. 4,O 10,07 1 1977). According to the teaching of the patent, alkaline protease enzymes function to hydrolyze proteins at pH values of at least 7, and often up to 12. The teaching of the patent indicates that flux through a 1.2 micron Millipore filter is substantially improved after treatment with either of two commercial alkaline protease enzymes. Clarity as measured by Klett colorimeter readings is also improved markedly. The teaching indicates that the enzyme treat- ment requires a period of several hours and is best performed at elevated temperatures. Improvements brought about by the enzyme treatment extend to dried xanthan prepara- tions.
Wellington (U.S. 4,119,491 1978) claimsa process for clarifying xanthan gum solu- tions which consists of contacting them with an alkaline protease solution for roughly one-fourth of the time required for cell body disintegration, adjusting the pH (if required) to 10 to 11, contacting the solution with siliceous solids having a surface area at least equivalent to 100 mesh sand, lowering the solution pH to 5 to 7, and filtering out the siliceous solids and their adsorbed partially disintegrated bacterial cells. The filter is required to remove at least 80% of the
bacterial cell bodies. The preferred condi- tions, as indicated by both the teaching and the claims, include the use of diatomaceous earth and a soft water solution make-up brine having 50 to 5,000 ppm of total dissolved solids. Prefiltration of make-up water is also recommended.
Discussion
For many purposes, it is desirable to be able to manufacture xanthan and other gums as clear, nonplugging polymers. I t is a major concern in the petroleum industry (Martin 1979) where exceptionally clean solutions are required for injection into petroleum-bearing formations which have pores on the order of 0.1 to 10 microns. Solution optical clarity is desirable in USP and food-grade applications. Inexpensive techniques for improving both the clarity and the plugging properties of xanthan solutions are needed, and considerable research has been devoted to this.
Many polymer recovery methods use separation of the xanthan polymer from solution, either as a sole or as a final step. The two most common methods employ the use of either an alcohol o r ketone solvent or a quaternary amine compound for precipi- tation of biopolymer from solution. How- ever, alcohol or ketone precipitation is not particularly selective, and is apt to result in the precipitation of materials such as proteins or nucleic acids in addition to the biopolymer. The large volume of the precipitate produced may also result in the inclusion of bacterial cells and cell or fermentation debris in the precipitate. Similar problems occur with the quarter- nary amine precipitation schemes, although Gill and Lim (1969) claim a decreased amount of cell debris in their process. In the process developed by Leder and Miescher (1967), extraction of a dried whole fermen- ter broth with a water-miscible solvent
52
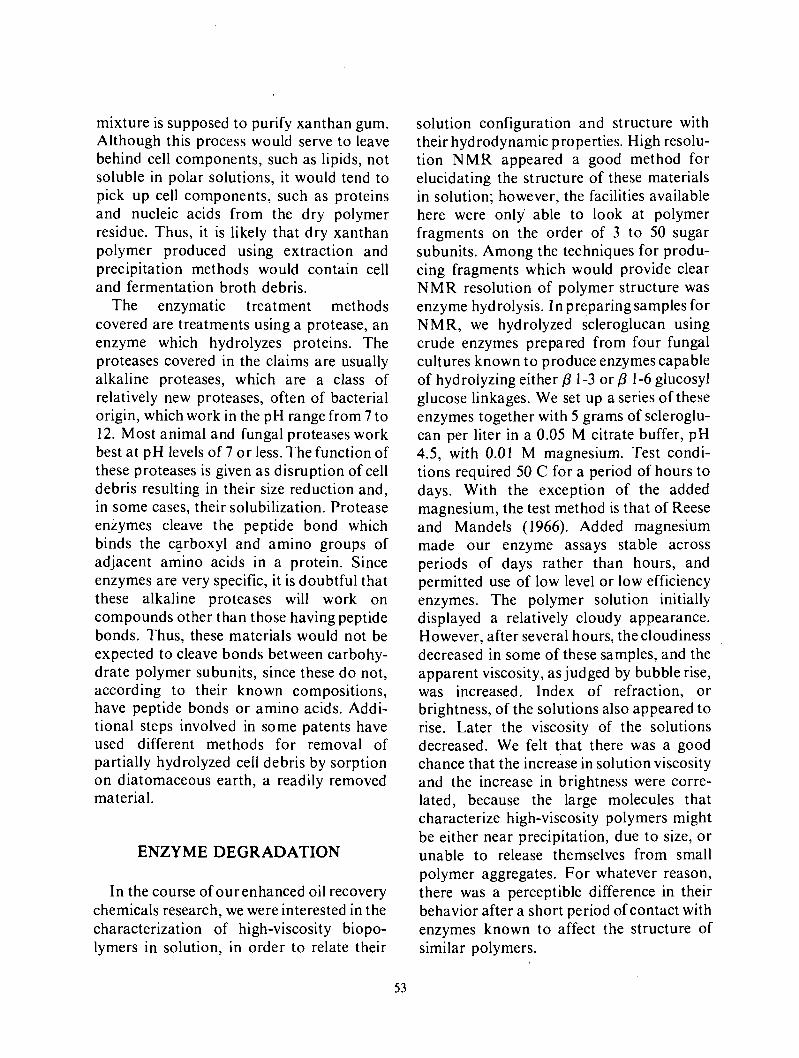
mixture is supposed to purify xanthan gum. Although this process would serve to leave behind cell components, such as lipids, not soluble in polar solutions, it would tend to pick up cell components, such as proteins and nucleic acids from the dry polymer residue. Thus, it is likely that dry xanthan polymer produced using extraction and precipitation methods would contain cell and fermentation broth debris.
The enzymatic treatment methods covered are treatments using a protease, an enzyme which hydrolyzes proteins. The proteases covered in the claims are usually alkaline proteases, which are a class of relatively new proteases, often of bacterial origin, which work in the pH range from 7 to 12. Most animal and fungal proteases work best at pH levels of 7 o r less. The function of these proteases is given as disruption of cell debris resulting in their size reduction and, in some cases, their solubilization. Protease enzymes cleave the peptide bond which binds the carboxyl and amino groups of adjacent amino acids in a protein. Since enzymes are very specific, it is doubtful that these alkaline proteases will work on compounds other than those having peptide bonds. Thus, these materials would not be expected to cleave bonds between carbohy- drate polymer subunits, since these do not, according to their known compositions, have peptide bonds or amino acids. Addi- tional steps involved in some patents have used different methods for removal of partially hydrolyzed cell debris by sorption on diatomaceous earth, a readily removed material.
ENZYME DEGRADATION
In the course of our enhanced oil recovery chemicals research, we were interested in the characterization of high-viscosity biopo- lymers in solution, in order to relate their
solution configuration and structure with their hydrodynamic properties. High resolu- tion NMR appeared a good method for elucidating the structure of these materials in solution; however, the facilities available here were only able to look at polymer fragments on the order of 3 to 50 sugar subunits. Among the techniques for produ- cing fragments which would provide clear N M R resolution of polymer structure was enzyme hydrolysis. In preparing samples for NMR, we hydrolyzed scleroglucan using crude enzymes prepared from four fungal cultures known to produce enzymes capable of hydrolyzing either p 1-3 or p 1-6 glucosyl glucose linkages. We set up a series of these enzymes together with 5 grams of scleroglu- can per liter in a 0.05 M citrate buffer, pH 4.5, with 0.01 M magnesium. Test condi- tions required 50 C for a period of hours to days. With the exception of the added magnesium, the test method is that of Reese and Mandels (1966). Added magnesium made our enzyme assays stable across periods of days rather than hours, and permitted use of low level or low efficiency enzymes. The polymer solution initially displayed a relatively cloudy appearance. However, after several hours, the cloudiness decreased in some of these samples, and the apparent viscosity, as judged by bubble rise, was increased. Index of refraction, or brightness, of the solutions also appeared to rise. Later the viscosity of the solutions decreased. We felt that there was a good chance that the increase in solution viscosity and the increase in brightness were corre- lated, because the large molecules that characterize high-viscosity polymers might be either near precipitation, due to size, or unable to release themselves from small polymer aggregates. For whatever reason, there was a perceptible difference in their behavior after a short period of contact with enzymes known to affect the structure of similar polymers.
53

This observation suggested a way to alleviate some of the problems earlier discussed: the difficulty of bringing the solution to high clarity when starting from a dry powder and the difficulty of producing a high-viscosity solution relatively free from aggregated materials which could cause plugging in petroleum-bearing formations. We investigated the possibilities under more rigidly controlled conditions.
Although detailed methods are given later for those interested, the general scheme will be discussed. The enzymes used were produced by incubation of four fungal cultures, Phanaroc hyte chrysosporium WISC HHB-625 1-5P, Penicillium ochroch- loron Q M 477, Rhizopus arrhizius QM 1032, and Sporotrichum dimorphosporum QM 806, on BSP medium for a period of at least one week. BSP medium is a semisolid medium using bran as a carbohydrate with meat and soy peptones as nitrogen sources and with added magnesium. Bran was used as a carbon source because it has a high concentration of p-1,3 glucan linkages, and could be expected thereby to increase the amount of enzymes hydrolyzing p 1-3 glucan in cultures using it as a carbon source. After liquefaction of the bran paste appeared well established, the medium - fungal mycelium mixture was diluted 2:3 with water, blenderized, and centrifuged. The pellets were washed and recentrifuged. Pooled supernatants were precipitated at 70% of saturated ammonium sulfate, resu- spended in distilled water, desalted, and lyophilized. The enzymes could then be used as required, with some reproducibility between aliquots taken from the same batch. The method was rapid, and start to finish, less than one day was required. During the procedure, samples were continuously refri- gerated.
As shown in Fig. 5.1, accumulation of reducing sugar, as measured with Hycel 283MX direct sugar reagent (ortho-
0 . 4
W v) 8 0 . 3 3 M lx
Q
3 rn 0 z u 3
p:
- E-
0 2
I
0 . 1
0 . 0
OR\L DUG 78 75
I I LEGEND P chrysosporaum
0 P ochrochloron A R u r r h z z m s
5 d z m o r p h o s p o r u m
* * 1 * *
0 1 0 0 2 0 0 3 0 0
TIME, hr
Fig. 5.1. Batch degradation of scleroglucan by exolaminarinases from Sporoticwn dimorpho- sporum Q M 806, Phanaerochaete chrysosporium, WISC HH&6251-SP, Penicillium ochrochloron QM 477, and Rhizopus arrhizius QM 1032.
toluidine in glacial acetic acid), was moni- tored for a period of 13 days, continued to rise. The viscosity also was observed to rise for a short period during the first two days. With one of the cultures tested, Sporotri- chum dimorphosporum Q M 806, hydrolysis had reached a level of around 80% of the input scleroglucan to reducing sugar, measured as glucose, at the end of the test period. Other enzymes produced lower levels of reducing sugar, but, with the exception of Rhizopusarrhizius QM 1032, a known producer of enzymes making mid- chain breaks, a major fraction of the input polymer was converted to short subunits. Thus, we have relatively conclusive evidence that the enzymes used specifically hydro- lyzed scleroglucan biopolymer to simple subunits which acted as reducing sugars, i.e., glucose.
54

ENDOLAMINARINASE I I I I I I I -
- P. ChTySOSpOTiUm - o------ P. ochrochloron .......... At this point, we felt that we should
investigate the use of a bound enzyme system for controlled enzymatic attack of scleroglucan and study the resultant sample viscosity changes. We cross-linked the filtrate from 500 ml of Rhizopus arrhizius Q M 1032 culture onto the surface of 1/4 inch alumina beads using glutaraldehyde. The beads were placed in a 2.5 cm X 50 cm glass column and the treatment solution run upflow. Rhizopus arrhizius QM 1032 was chosen in that it is known to produce an endo-laminarinase, Le., an enzyme which makes mid-chain breaks between the 1-3 p- linked glucoses comprising laminarin (Reese and Mandels 1966). The first long- term run produced data which we will not report because they reflected a marked decrease in the amount of scleroglucan in solution, probably due to the sorption of scleroglucan into the pores of the alumina enzyme-support beads. After four days of run, we felt that the alumina column had equilibrated sufficiently, and tried a second run using the alumina column on a circular recycle. We found a slight increase in viscosity at about 14 hours, followed by a subsequent decrease in viscosity, as shown in Fig. 5.2. Reducing-sugar production from scleroglucan polymer was not apparent, indicating that there was a very low level of hydrolysis.
Some preliminary plugging tests were performed. The plugging test apparatus was essentially a pipe reservoir with 400 ml capacity with a small membrane filter mounted on a flange below the liquid. The membrane filter was supported by a porous metal frit with an effective filter face area of 1.44 cm2 recessed into the flange, as shown in Fig. 5.3. The resultant assembly was pressurized, and provided enough volume to test flow for a period around one hour. Although we designed our plugging test with
io3
100 200 300 1 0’
0
TI ME, hr
Fig. 5.2. Scleroglucan viscosities after treatment with immobilized Rhizopus arrhizius QM I032 endolaminarinase.
the idea of providing a base for comparison with similar proprietary oil industry tests, comparison is frequently difficult. Results are not ordinarily reported as fluxes, but in ratios of flow volumes of the beginning and end of the tests, without specification of the dimensions of the apparatus. We used flux through a 1.2 micron Gelman Acropor membrane filter under I5 psi for a period of 1 hr as a standard test. Samples were taken at 4 min intervals and the results plotted as flux, rather than as the conventional volumetric measure. Throughout the flux tests, or plugging tests, liquid measurement was performed as a weight measure, rather than as a volume measure, because these were more accurate for smaller volumes. The only usual exception to this rule was in the case of samples greater than 10 ml, where liquid measurement could be expected to be adequate. A Gilson Mini-Escargot fraction collector was used for sample collection, and
55

AIR INLET
-FEED RESERVOIR I 1/2" I PS. SCH. 80 PVC x 1 1 " LONG
O-RING .09374 x 3/4" 0. D.
SS BOLTS LONG
1/8" SS TUBING
Fig. 5.3. Plugging test apparatus.
line air was used for the overpressure gas. A dilution of I : 10 on the processed 5 g polymer per liter samples was used, Le., 500 mg/liter, since this was closer to field conditions than 5 glliter. Dilution was with distilled water filtered through Whatman G F / C glass fiber filters, which have a 99% retention of 0.8
micron and larger particles. It is important to be sure that dilution water is freshly filtered through media with a greater retention than that used in the plugging test.
We decided that the bound enzyme column used would operate better at the 50 C specified by Reese and Mandels for free laminarinase enzyme assays. Using the bound enzyme column, jacketed and sup- plied with 50 C heating water, we recircu- lated 0.5% scleroglucan in pH 4.5 citrate buffer with magnesium for 24 hours with regular samples. As shown in Fig. 5.4, the flux of diluted samples through 1.2 micron Acropor increased with treatment by roughly an order of magnitude. As shown in Fig. 5.5, there was a slight increase in the viscosity determined at 25 C using a Brookfield LVT microviscometer with a 0.8" cone. We find these results promising, since they indicated that flux could be markedly improved with, if anything, a gain
ORNL DWG. 80-17222 10'
loo
n C
\ .i g lo-'
3 v
X
t%
0 15 30 45 60 10-
ELAPSED TIME (min) Fig. 5.4. Flux of boundenzyme column treated
scleroglucan samples.
56

Fig. 5.5. Viscosities of boundenzyme treated scleroglucan samples.
in viscosity, through controlled hydrolysis of scleroglucan with an endo-laminarinase.
Since the viscosity changes measured were small in Fig. 5.5, power-law models for the solutions were computed using the general least squares procedure, GLM, of the Statistical Analysis System - 79 deve- loped by Barr et a1 (1979). The equation parameters are presented in Table 5.1. As expected, slightly different exponents were calculated for each elapsed time. A statisti- cal analysis of these data indicated that these exponents were not significantly different at the 95% confidence level; therefore, a least squares fit of these data using the GLM procedure was made to give a common exponent of -0.7776 k 0.0080 at the 95% confidence level. The constant parameters calculated for each treatment presented in Table 5.2 are proportional to solution viscosity at any shear rate. These results indicate that there was a highly significant 1.3% increase in viscosity was observed at around 2 hr reaction time. Even a small decrease in the total polymer requirement
Table 5.1. Power-law model" of glucan solution viscosity with time
Time, Constant' Exponent hr K n- 1
0 2,913 -0.7844 2 2,952 -0.7738 4 3,088 -0.7864 6 2,897 -0.7702 8 3,026 -0.7809
24 2,897 -0.7702
"Ostwald-de-Waele power-law model q(r) = K(F)"-'.
Table 5.2. Power-law model" of glucan solution viscosity with time with
exponent, n-1 = 4.7776
Time, Constant Constant Significance hr K Increaseb, % Level', a
0 2,864 2 2,980 4.1 0.0028 4 3,02 1 5.5 0.0002 6 2,95 1 3.0 0.0181 8 3,OO I 4.8 0.0007
24 2,95 1 3.0 0.0181
"Ostwald-de-Waele power-law model q(r) = K( r y l . Percentage increase in constant relative to
time zero.
b
'Significance levels were interpreted as follows: CY > 0.05, constant regarded as nonsignificant; 0.01 < CY d 0.05, constant regarded as. significant; and CY d 0.01, factor regarded as highly significant.
57

could be important economically where large quantities of polymer are needed.
- I I I 1 1 1 1 1 I I I I I I l l 1 I I I l l +
- LEGEND -
- - - - -
XANTHAN EXOHYDROLYSIS Xanthan was used to test the applicability
of controlled carbohydrate hydrolysis to other types of high-viscosity biopolymers. We screened some commercial enzymes for xanthan degrading activity. On the first screening, we found that one commercial enzyme mixture, Rohm and Haas HP-150, which is used in decreasing plant gum viscosity, was very active in reducing the viscosity of xanthan gum solutions. Some activity also appeared in a crude cellulase prepared from Aspergillus niger. However, we wanted an enzyme which increased flux without adversely affecting viscosity. We tested a simple ammonium sulfate fractiona- tion of the available enzyme for separating potential fractions for activity tests. We dissolved 2 g of the crude HP-150 mixture, which probably also included a variety of added fillers, in 20 ml of water to obtain a relatively clear solution and a small amount of black precipitate. We made ammonium sulfate cuts at saturated ammonium sulfate additions of 10, 10,20, and 20 ml, to give 33, 50, 67, and 75% of saturation, respectively. We batch-tested these enzymes on xanthan using the standard test conditions, and ran plugging tests on the resultant solutions. Fig. 5.6 shows the plugging rate of the xanthan controls with increasing contact time, and Fig. 5.7, observed viscosities for this material. Incubation at 50 C had very little effect on this material's viscosity and flux. Fig. 5.8 shows the flux tests for the enzyme precipitated at 33% of saturated ammonium sulfate, and Fig. 5.9, the changes in observed viscosity. As can be seen from Fig. 5.8, the flux of this material increased markedly with time. However, there was a fluctuation ofviscosity with time which was primarily in the direction of lower
i o 3 f? *- e 8 5 l o 2
[I) 0
1 0 '
ELAPSED TIME (min)
Fig. 5.6. Flux of xanthan controls.
-
= - - - - - - -
= - - - - - - -
I I I I I I I I I I I I I I I I I I I I I I I l l
__.___.___ 0 1 +- 2
._.................. 0 ............ -. 4.5 \ - -- O h r d 1
viscosity. The enzyme recovered at 50% of saturated ammonium sulfate also produced a marked increase in flux with time of treatment, as shown in Fig. 5.10. This
58
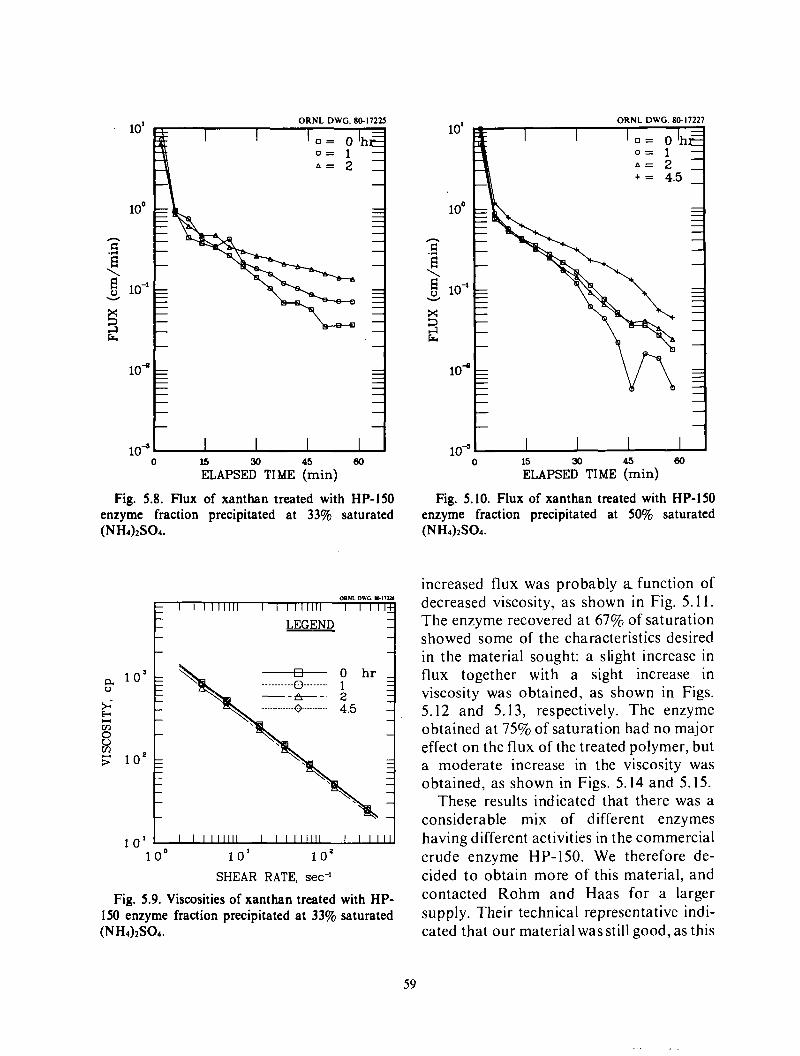
10'
loo
h
E
\ .a !i lo-'
W
ORNL DWG. 80-17223
10-
0 15 30 45 60 loJ
ELAPSED TIME (min)
Fig. 5.8. Flux of xanthan treated with HP-150 enzyme fraction precipitated at 33% saturated (NH4)zSOd.
own DWG ulnas
LEGEND
1 o o 1 0 ' 1 o 2 SHEAR RATE, sec-l
Fig. 5.9. Viscosities of xanthan treated with HP- 150 enzyme fraction precipitated at 33% saturated (NH4)zS04.
ORNL DWG. 80-17127 10'
loo
n E
\ -a g lo-'
3 W
X
L
10-O
0 15 30 45 60 10"
ELAPSED TIME (min)
Fig. 5.10. Flux of xanthan treated with HP-150 enzyme fraction precipitated at 50% saturated (NH4)zS04.
increased flux was probably a function of decreased viscosity, as shown in Fig. 5.11. The enzyme recovered at 67% of saturation showed some of the characteristics desired in the material sought: a slight increase in flux together with a sight increase in viscosity was obtained, as shown in Figs. 5.12 and 5.13, respectively. The enzyme obtained a t 75% of saturation had no major effect on the flux of the treated polymer, but a moderate increase in the viscosity was obtained, as shown in Figs. 5.14 and 5.15.
These results indicated that there was a considerable mix of different enzymes having different activities in the commercial crude enzyme HP-150. We therefore de- cided to obtain more of this material, and contacted Rohm and Haas for a larger supply. Their technical representative indi- cated that our material was still good, as this
59

i o 3 4 >; k rn 0 u z l o 2
1 0 '
ORNL DWG. w i m - - I l1l11l l 1 I I111111 I I I l l + - LEGEND - - - - - -
- -
= - - - - - -
E - - - - - -
I I I111111 I I ( ) 1 ) ) 1 1 I I I 1 ) 1
10'
loo
10' 4 e z l o 2
c( rn 0 u
10 '
0 15 30 45 80
Fig. 5.12. Flux of xanthan treated with HP-150
loJ
ELAPSED TIME (min)
OllNL DWG. 101720 - - I I I l l l l l I I I I I I I I I I I I I l - l J - LEGEND - - - -
- - -
- 0 h r -
.................. 0 4.5
- [email protected]. 1 = - - - - - - - - - - - - - -
E - - - -
- - - -
- - - -
- - - ' I ' I I ' ' I 1 ° 1 1 I I I 1 1 1
~.
enzyme fraction precipitated at 67% saturated (NH4)zSOd.
10'
loo
n E:
3 \
X
R 3
0 15 30 45 80
Fig. 5.14. Flux of xanthan treated with HP-150 enzyme fraction precipitated at 75% saturated (NH4)zS04.
loJ
ELAPSED TIME (min)
60

ORNL DWC. 1017111
I I I111111 I I I I H J
1 o o 1 0' 1 o e SHEAR RATE, sec-'
Fig. 5.15. Viscosities of xanthan treated with HP- 150 enzyme fraction precipitated at 75% saturated (NH4)2S04.
particular enzyme had a several-year shelf life; however, he indicated that they had changed the procedure for manufacture, and thus, the probable mix of activities in the crude enzyme. He was kind enough to send us another 4 ounce bottle of the dried enzyme mixture, which we used as a base for further tests.
We standardized a 4 hour test period and to make cuts at intervals of 5% saturation with ammonium sulfate. This permitted us to make an assessment of a preparative method for the isolation of those fractions of the HP-150 crude enzyme mixture which had the desired activity. We used 10 grams of HP-150 crude enzyme dissolved to make 100 milliliters in citrate buffer with magne- sium as starting material. As reported for the earlier test, there was a fraction of the enzyme which did not dissolve in the time allowed, and which was removed as the 0% cut. Because of the number of samples to be processed, we did not desalt the ammonium sulfate precipitates but instead filtered them to dryness and dissolved them in citrate test
'buffer with magnesium. An aliquot amoun- ting to 10% of the recovered fraction was used in each case. Ammonium sulfate fractionation was used in that it is a standard preparation method which is particularly amenable to large scale industrial use, and would thereby make translation of the results obtained simpler and easier. We found it necessary to do reruns on the 60,65, and 70% of saturation samples; since these were repeated, we were able to perform both 2 and 4 hour tests.
The plugging tests for the 0, 5, and 10% of saturated ammonium sulfate cuts are shown in Figs. 5.16, 5.17, and 5.18, respectively. Viscosities for these samples are shown in Fig. 5.19. Of these, the 0% cut, that is, the dark material which did not dissolve in citrate buffer at a concentration of 10% enzyme, w/v, is the most promising. This material caused a significant improvement
ORNL DWG. 80-17233 10'
loo - c
\ .z g lo-'
3 W
x
E
lo4
0 15 30 45 Bo loJ
ELAPSED TIME (min)
Fig. 5.16. Flux of xanthan treated with HP-150 enzyme fraction insoluble in buffer.
61

10'
a l o 3 0
c( rn 8 2 lo2
10 '
loo
- -
- -
- LEGEND -
- - Blk
0% = - -- e- 5 % : - - - 0 - - 10% -
._..____ 0 _ _ _ _ _ _ = - - - - - - - -
- - - - -
- - - -
-
- - -
- -
I I I111111 I I I I I I l l 1 I I I I l l
X
E 3
lo*
0 15 30 45 60
Fig. 5.17. Flux of xanthan treated with HP-150 enzyme fraction precipitated at 5% saturated
loJ
ELAPSED TIME (min)
(NH4)zS04.
0 15 30 45 80 loJ
ELAPSED TIME (min)
in the flow of xanthan through a membrane filter and also provided for an improvement in the viscosity of the sample. We judged the 5 and 10% cuts unsuitable for use in that they lowered the viscosity of the test solution without showing much effect on the ob- served flux. It is interesting that the material insoluble in a concentrated solution is the enzyme mix in citrate buffer which provides the desired flux improvement, since this material might be particularly simple to recover from the enzyme mixture.
Table 5.3 shows the power-law model least squares fit of both treated (Cut 0%) and untreated xanthan gum viscosities presented in Fig. 5.19. The slightlydifferent exponents calculated were not significant, thus con- stant parameters were calculated by the GLM least squares procedure for the common exponent, -0.7662 + 0.0101 at the 95% confidence level. The results presented
Fig. 5.18. Flux of xanthan treated with HP-150 in Table 5.4 indicate that the treated gum is enzyme fraction precipitated at 10% saturated 4.5% higher in viscosity than the untreated (N H4)2 S 0 4 . solution.
62

Table 5.3. Power-law model" of xanthan solution viscosity
Time, Constant Exponent hr K n- 1
0 2,414 -0.7679 2 2,499 -0.7645
"Ostwald-de-Waele power-law model q(r) = K(I')n-l.
Table 5.4. Power-law model" of xanthan solution viscosity with time
with exponent, n-1 = -0.7662
Time, Constant Constant Significance hr K Increaseb, % Level', cr
0 2,40 1 2 2,5 12 4.6 0.0032
"Ostwald-de-Waele power-law model q(r) = K(r)"-'.
bPercentage increase in constant relative to time zero.
'Significance levels were interpreted as follows: cr > 0.05, constant regarded as nonsignificant; 0.01 < cr < 0.05, constant regarded as significant; and cr < 0.01, factor regarded as highly significant.
Figs. 5.20, 5.21, and 5.22 show the respective plugging tests for the 15, 20, and 25% of saturated ammonium sulfate cuts. Fig. 5.23 shows the viscosities of these samples. The 20% cut appeared to leave the sample viscosity relatively unchanged, and the 25% cut provided a slight improvement
ORNL DWG. 80-17236 10'
loo
c
\ '2 v g lo-' X
R 5
i 10" 0 15 30 45 60
ELAPSED TIME (min) Fig. 5.20. Flux of xanthan gum treated with HP-
150 enzyme fraction precipitated at 15% saturated (NH4)2S04.
10'
loo
n c
\ '2 E lo-' v
X 3
ORNL DWG. 80-17237
1
i 0 15 30 45 60
Fig. 5.21. Flux of xanthan gum treated with HP- 150 enzyme fraction precipitated at 20% saturated (NH4)zSOd.
10"
ELAPSED TIME (min)
63

10'
loo n C
\ 'Z 6 lo-' v
ORNL DWG. 80-17238
10-O
0 15 30 45 60
Fig. 5.22. Flux of xanthan gum treated with HP- 150 enzyme fraction precipitated at 25% saturated (NH4)zSOd.
10-
ELAPSED TIME (min)
DRSL DWG. 1%-75.59 - - I I111111 I I I I11111 I I I l l +
- LEGEND -
Blk - _.._______ 0 __--... 15% -- e- 20% =
0 25% =
- - -
- -
- - - - -
rn - 5 l o 2 - = - - -
- -
- - - - -
- -
- -
10 ' I I I I I1111 I I I I I l l l l I I I I I L 1 o o 1 o 1 1 o 2
SHEAR RATE, sec-'
Fig. 5.23. Viscosities of xanthan gum treated with HP-150 enzyme fractions precipitated at 15, 20, and 25% saturated (NH4)2S04.
in sample viscosity, similar to that provided by the 0% cut. The 15% cut decreased the sample viscosity sharply. However, none of these enzyme fractions appeared to have affected sample flux to the extent that the 0% cut did. It would probably be important, in processing this material to use the 0 to 5% cut.
Figs. 5.24, 5.25, and 5.26, respectively, show the plugging tests for the 30, 35, and 40% of saturated ammonium sulfate cuts. Fig. 5.27 shows the viscosity profiles for these samples. These three cuts showed a modest decrease in the sample viscosity, without a major effect on flux. In the case of the 40% cut, there is actually a slight decrease in flux combined with a moderate decrease in viscosity. Because these enzyme fractions d o not improve flux, and have a detrimental effect o n viscosity, they should
10'
loo
ORNL DWG. 80-17239 ' 0 = b l a h E 0=30% -
4
4 I- \\ 1
il
0 15 30 45 60
Fig. 5.24. Flux of xanthan gum treated with HP- 150 enzyme fraction precipitated at 30% saturated (NH4)zS04.
10"
ELAPSED TIME (min)
64

10'
lo0
n c
ORNL DWG. 80-17240 ORbL OWG 7b7% - Blk
ELAPSED TIME (min) Fig. 5.25. Flux of xanthan gum treated with HP-
150 enzyme fraction precipitated at 35% saturated (NH4)2SO4.
ORNL DWG. 80-17241
10-
A V
0 15 30 45 80 ELAPSED TIME (min)
fj l o 5 E
c g! l o e E
- - - c( - rn 0 u
-
- - - - - -
10' I I I111111 I I I111111 I I I1111
1 o o 1 0 ' 1 o e SHEAR RATE, sec-'
Fig. 5.27. Viscosities of xanthan gum treated with HP-150 enzyme fractions precipitated at 30,35, and 40% saturated (NH4)2S04.
probably be excluded from the fractions used in polymer treatment on a larger scale.
Figs. 5.28, 5.29, and 5.30, respectively, show the plugging tests for the 45, 50, and 55% of saturated ammonium sulfate cuts. The 45 and 50% fractions show a negligible effect on the flux of treated samples during membrane filtration; however, these cuts, as shown in Fig. 5.31, have a modest detrimen- tal effect on the viscosity of treated polymer solutions. The 55% cut shows a marked improvement of polymer solution flux; however, the improvement is accompanied by a corresponding decrease in polymer solution viscosity.
Figs. 5.32, 5.33, and 5.34, respectively, show the plugging tests for the 60, 65, and 70% of saturated ammonium sulfate cuts. The viscosities for these samples are shown in Fig. 5.35. The 60% cut alone shows some improvement in polymer solution flux; however, the flux improvement is offset by a
Fig. 5.26. Flux of xanthn gum treated with HP- 150 enzyme fraction precipitated at 40% saturated (NH4)2S04. for xanthan polymer.
decrease in polymer viscosity. None of these three cuts appears to be useful as a treatment
65

lo1
loo n C
\ .i f! 10-1
W
X 3 4 R
1o-O
- I I I 1 1 1 1 1 - I I I 1 1 1 1 1 1 I I I l l + - LEGEND_ - - -
- - - -
ORNL DWG. 80-17242
t\ 1
, 0 15 30 45 80
10"
ELAPSED TIME (min)
Fig. 5.28. Flux of xanthan gum treated with HP- 150 enzyme fraction precipitated at 45% saturated (NH4)2S04.
ORNL DWG. 80-17243
0 15 30 45 80 ELAPSED TIME (min)
ORNL DWG. 00-17244 10'
loo n C
\ 2 f! lo-'
2 W
X
kl
1o-O
0 15 30 45 60 loJ
ELAPSED TIME (min)
Fig. 5.30. Flux of xanthan gum treated with HP- 150 enzyme fraction precipitated at 55% saturated (NH4)2S04.
Fig. 5.29. Flux of xanthan gum treated with HP- 150 enzyme fraction precipitated at 50% saturated (N H4)2 Sod.
Fig. 5.31. Viscosities of xanthan gum treated with HP-150 enzyme fractions precipitated at 45, 50, and 55% saturated (NH4)2S04.
66

ORNL DWG. 80-17245
W rj- lo-'
X
k 5
lo4
0 15 30 45 80
Fig. 5.32. Flux of xanthan gum treated with HP- 150 enzyme fraction precipitated at 60% saturated
loJ ELAPSED TIME (min)
Fig. 5.34. Flux of xanthan gum treated with HP- 150 enzyme fraction precipitated at 70% saturated
(NH4)2S04. (NH4)2S04.
ORNL DWG. 80-17246 10'
loo
n d
\ 3 g lo-'
?I
W
X
R
1044 10- 0 15 ELAPSED 30 TIME 45 (min) 80
Fig. 5.33. Flux of xanthan gum treated with HP- 150 enzyme fraction precipitated at 65% saturated (NH4)2S04. 70% saturated (NH4)2S04.
Fig. 5.35. Viscosities of xanthan gum treated with HP-150 enzyme fractions precipitated at 60,65, and
67

I t appears that, using the currently available Rohm and Haas HP- I50 commer- cial enzyme mix, the fraction of the mix that is insoluble at a concentration of 10% w/v in pH 4.5 citrate buffer with magnesium is the best choice for use in treating xanthan solutions to decrease the plugging caused by macrocolloids and polymer aggregates. This material should be relatively simple to recover during the normal polymer purifica- tion process, and could probably be made commercially available as a relatively specific activity material for a reasonable cost.
>
> F 0.8 0 4 W
k
? t 0.6- -1 w a
0.4
0.2
0.0 ENDOLAMINARINASE OPTIMA
-
-
-
- I I I I u 0 I 2 3 4 5 6 7
We are indebted to Dr. Elwin Reese, who did earlier screening and characterization studies (1959) on fungal laminarinases. Dr. Reese provided assistance in determining the best cultures and enzyme purification conditions for use on scleroglucan. We are also indebted to Dr. Emory G. Simmons of the University of Massachusetts at Amhurst who located and supplied the fungal culture used in this experiment. Dr. Simmons has been privately maintaining the U.S. Army Quartermaster Corps Culture Collection until a permanent home for it can be found.
Effect of pH
As shown in Fig. 5.36, the activity of Rhizopus arrhizius Q M 1032 endoglucanase on scleroglucan varies markedly with pH. As with Sporotrichum dimorphosporum QM 806, the activity is highest at or below pH 3. However, there is a secondary activity peak between pH 5 and 6 which occurs with both laminarin and scleroglucan. This is probably due to macromolecular structure changes at these pH values.
Temperature Effects
In contrast to the exolaminarinase pre- sented earlier, Rhizopus arrhizius endolami- narinase has a sharp temperature peak, as shown in Fig. 5.37, near 50 C. Activity is substantially lower at 60 C than at 50 C, indicating that temperature control could play an important part in managing enzyme treatment of biopolymer solutions. How- ever, as shown previously in Fig. 5.1, enzyme activity is stable for periods of over one week in batch degradations at 50 C in the presence of 10 m M Mg".
Process Considerations
Previously reported results of the modifi- cation of scleroglucan in a packed-bed, bound-enzyme column were obtained at 50 C and pH 4.5. These p H and temperature optima indicate that a higher temperature and a lower pH would result in a higher
68

O R N L DWG 79-1517 1.4 I 1
- t ; 0.8 - V Q
W E 0.6- a J w - K
0.4 - -
0.2 - -
0.0 1 1 1 1 1 1 1 1 1 1 1
0 IO 20 30 40 5 0 60 TO 8 0 90 100 110 I20 TEMPERATURE
Fig. 5.37. Effect of temperature on activity of endolaminarinase from Rhizopus arhizius QM 1032.
reaction rate and a smaller bound-enzyme reactor would be required. Further bench- scale studies are needed to confirm that these results also can be obtained in a continuous bound-enzyme reactor, since the same enzyme under batch and bound reactor conditions can have different condi- tions for activity maxima.
EXOLAMINARINASE OPTIMA
Exolaminarinases are enzymes, usually of fungal origin, which can hydrolyze polym- eric chains of glucose units joined by /3-1,3 linkages starting at one end of the chain and working sequentially. We originally investigated the use of exolaminarinases as a means for preparation of samples for nuclear magnetic resonance spectroscopy (NMR), since preliminary scans indicated that the structures of only relatively small molecules, thus polymer fragments, would
be satisfactorily resolved by the available instrumentation.
We investigated the conditions of exolam- inarinase activity on scleroglucan, which we felt might be somewhat different from those on laminarin. Scleroglucan and laminarin share the same basic chain structure, p-1,3 glucosylglucose, but scleroglucan has p-6,l glucosylglucose sidebranches which could affect both the kinetics and the optimum conditions for enzyme hydrolysis.
The 'occurregcegof p- 1,3 glucosylglucan- ohydrolases in fungi were surveyed by Reese and Mandels (1959). Of the 140 organisms surveyed, Sporotrichum dimorphosporum QM806 was found to have the most active exo-P-D-( 1-3)-glucanase on laminarin. Thus, this organism.was chosen for further study with scleroglucan.
Enzyme Preparation
The crude enzyme prepared from Sporo- trichum dimorphosporum Q M 806 was isolated from the culture filtrate following the fermentation and isolation methods of Reese and Mandels (1959). The culture used was from the U. S. Army Quartermaster Corps collection, and was kindly supplied by Dr. Emory G. Simmons of the University of Massachusetts, who maintains the collec- tion privately at Giesent. The complete preparation and isolation methods are discussed in Materials and Methods since some slight modifications of the procedure were used. We are greatly indebted to Dr. Reese for his assistance in this area.
Test Method
Although most tests varied one or more of test components, the generalized test was for the production of reducing sugar as glucose in a mixture of one part enzyme solution to one part of test solution at a pH of 4.5 and a temperature of 50 C. The test solution
69

consisted of 0.05 M trizma base, 0.5% w/v of polysaccharide, and 0.01 M MgS04. Both laminarin and scleroglucan were tested using the same method. Materials and Methods has a more complete procedure.
Added Magnesium
Many polysaccharide hydrolase enzymes require the presence of divalent cations, most commonly Mg", for activity or stability. As shown in Table 5.5, it appears that the addition of small amounts of Mg" to the test solution during incubation increased the apparent activity of the crude enzyme by a factor of two. It should be noted that there may be some enzyme associated Mg" in the crude enzyme preparation. Although, as shown earlier in Fig. 5.1, the Sporotichum dimorpho- sporum Q M 806 exolaminarinase is stable for a period of nearly two weeks in the presence of 10 m M Mg", we have not determined whether the magnesium is required for activity or contributes to long term stability.
Variation with pH
As shown in Fig. 5.38, Sporotrichum dim o rp h osp o ru m Q M 8 06 e xo 1 am in a r i n a s e
Table 5.5. Enzyme activity with Mg" variation.
Activity relative to 10 m M Mg" Mg", mM
0 1 5
10
0.5 0.8 0.9 1 .O
ORNL DWC 79-152
- - - I
PH
Fig. 5.38. Effect of pH onexolaminarinase activity from Sporotrichum dimorphosporum QM 806. Legend: (V) laminarin; (0) scleroglucan.
has activity maxima at very different pH values on laminarin and scleroglucan. On laminarin, the activity peaks around pH 3 fairly sharply. The activity maximum on laminarin is around pH 4.5 with broad peak. The laminarin values are close to those obtained by Huotari, Nelson, Smith, and Kirkwood (1968) for highly purified S. dimorphosporum enzyme and tend to confirm the validity of the tests used.
Temperature Effects
Although the activity maxima of the tested exolaminarinase on scleroglucan and laminarin are different, their response to different incubation temperatures follows the same general pattern. As shown in Fig. 5.39 activity on both of these substrates peaks at or above 60 C, with a sharp decrease in activity a t 75 to 80 C. It is possible that 60 C would have been a better incubation tempera tu re.
70

ORNL DWG. 80-17248
ORNL DWG 18-1120
2 00 -
175-
150-
I- O
000- I I I I 1 1 1 1 1 1 I I
0 IO 20 30 40 5 0 60 7 0 80
TEMPERATURE OC ELAPSED TIME (min)
Fig. 5.39. Effect of temperature on exolaminari- nase activity from Sporotrichum dimorphosporum . QM 806. Legend: (V) laminarin; (0) scleroglucan.
Fig. 5.40. Flux of carboxymethylcellulose soh- tions treated with cellulase.
Result Confirmation cellulose derivatives. Although the flux improvement is not as great as those observed with scleroglucan and xanthan, the results were obtained using a whole commercial cellulase. It is probable that further improvement in flux could be obtained by selection and purification of appropriate enzyme fragments. Similar methods could be applied to other cellulose
These results were presented a t the U.S.- Japan Intersociety Microbiology Congress/ 79th Annual Meeting of ASM. In the discussion of the paper a t the conference, Dr. Douglas Eveleigh of Rutgers University indicated that these results were also confirmed by some of his unpublished data.
CARBOXYMETHYLCELLULOSE derivatives. HYDROLYSIS
As shown in Fig. 5.40, it is possible to extend the methods discussed above to
71

6. Sclerotium Salinity Tolerance Use of brines in fermentation feeds might
be advantageous in areas where water is limited or where substantial water improve- ment would be required to meet conven- tional fermentation water requirements. It seemed reasonable to expect that a low concentration of salt would be tolerated in the Sclerotium biopolymer fermentation. However, we were unsure of the ability of this organism to tolerate as high a level of salinity as would be expected in many well brines. We decided to test the response of Sclerotium rolfsii to NaCl, with extension to more complicated brines. If field use is contemplated, an assessment of the toxi- cants particular to the brine used a s well as tests covering effects of salts incorporation into the fungal biomass should be per- formed. We repeated the experimental runs to see whether organism performance improved after culture on salt containing medium.
RESULTS
Volatile suspended solids production by Sclerotium rolfssii cultures grown on 0 , 2 , 4 and 6% NaCl w/ v is shown in Fig. 6.1. In the first run, it appears that the biomass concentration in the 0 and 2% salt cultures is relatively similar, with the 4 and 6Rcultures showing much decreased biological solids production. In the second run, a similar pattern is followed. Fixed suspended solids, as shown in Fig. 6.2, remain low for both runs in all four cultures.
Polymer production follows similar trends as shown in Fig. 6.3. Polymer found in the 6% NaCl culture shows a decline which persists during both culture runs. Polymer produced in the 0 and 2% NaCl cultures reaches nearly the same level by the
- 6 L
0 c .- - \ 0,
v)
J 0 0 4 n n
- 5
0
W
z v) 3 v)
W
Y 3
- J 2
!z ' 1
a
J 0
z W I
0
ORNL DWG 80-944 R
I I 1 I I I I I
R U N 1 I R U N 2 I
A
1 3 5 7 9 11 13 t5 17 19
ELAPSED TIME (days)
Fig. 6.1. Mean volatile suspended solids concen- tration during successive Sclerotium rolfiifermenta- tion runs in presence of NaCl. Plotting symbols: 0 = 0% w / v NaC1; 0 = 2% w/v NaC1; A=4% w/vNaCl;
= 6% w/v NaCl.
end of each fermentation run, while polymer in the 4% NaCl run is substantially lower. Viscosity is slightly higher in the 0% NaCl culture than in the 2% NaCl culture during the first run; the converse is true in the second run. However, a s shown in Fig. 6.4, viscosity in the 6% NaCl samples is low. Viscosity in the 4% NaCl samples is slightly higher than that of the 6% NaCl samples, but much lower than that of the 0 and 2% NaCl samples.
Fermentation runs using Instant Ocean to simulate a complex brine, such as seawater o r a groundwater brine, were performed. As shown in Fig. 6.5 growth of the 0 and 4% mixed salts cultures were similar in the first '
run, with the 2% mixed salts culture showing
72
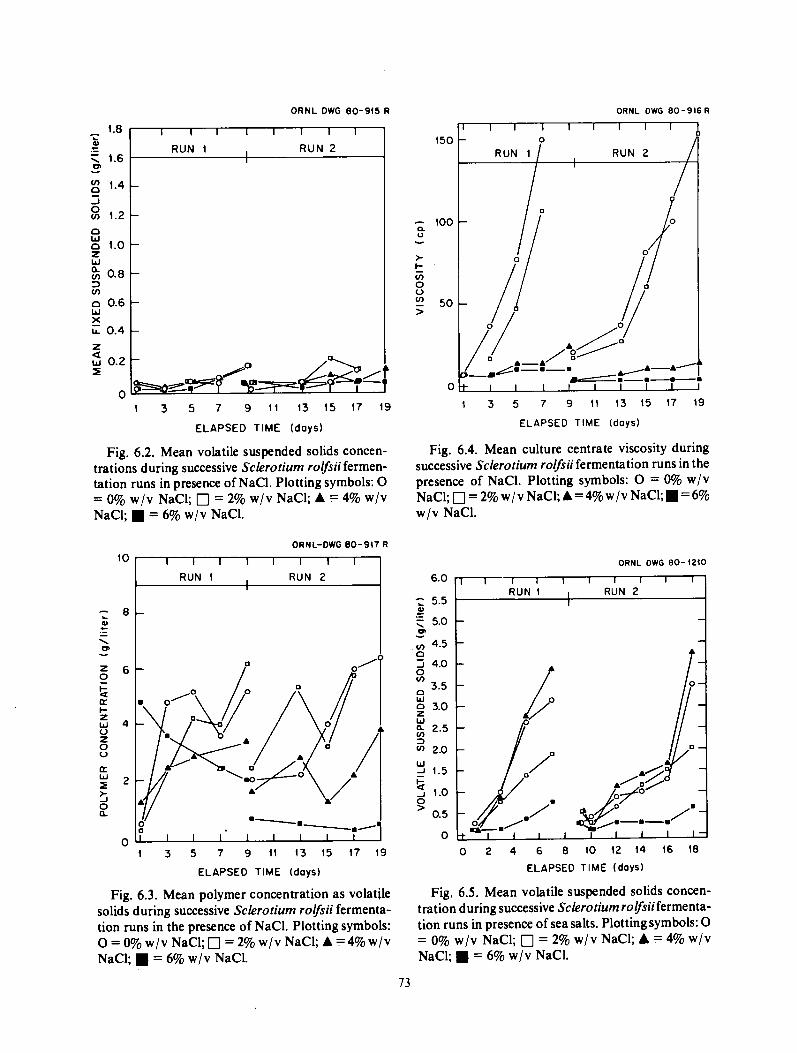
ORNL DWG 80-9 t5 R
- 1.8 B
1.6 c
0, - 1.4 -
.J
2 1.2 n 0 1.0 W
z W
3 v)
W X
g 0.8 n 0.6
0.4
ORNL OWG 80-916R
I I 1 I I I I I
RUN 1 RUN 2 I I
- - -
- - -
y 5.5
: 5.0 al L .- El
1 3 5 7 9 11 13 15 17 19
ELAPSED TIME (days)
Fig. 6.2. Mean volatile suspended solids concen- trations during successive Sclerotium roljsii fermen- tation runs in presence of NaCl. Plotting symbols: 0 = 0% w/v NaCl; 0 = 2% w/v NaC1; A = 4% w/v NaC1; H = 6% w/v NaC1.
RUN 1 1 RUN 2 I
- -
ORNL-DWG 80-947 R
1 I I 1 I 1 I I
RUN 1 RUN 2
1 3 5 7 9 11 13 15 17 19
ELAPSED TIME (days)
Fig. 6.3. Mean polymer concentration as volatile solids during successive Sclerotium rolfsii fermenta- tion runs in the presence of NaCl. Plotting symbols: 0 = 0% w/v NaCl; 0 = 2% w/v NaCl; A =4% w/v NaCl; H = 6% w/v NaCl.
I I I I I I I 1
1 3 5 7 9 11 13 15 17 19
ELAPSED TIME idoys)
Fig. 6.4. Mean culture centrate viscosity during successive Sclerotium roljsii fermentation runs in the presence of NaCl. Plotting symbols: 0 = 0% w/v NaCl; 0 = 2% w/ v NaC1; A = 4% w /v NaC1; = 6% w/v NaCl.
ORNL OWG 80- 4210
6.0 1 I 1 I I I I I 1
- - v) 4.5
2 0 5 4.0
3.5 n 3.0
2 W
v) 3 a 2.5
0 2.0 W
t-
0 >
J 1.5 a J 1.0
0.5
I- 4
O 0 2 4 6 8 10 12 14 16 18
ELAPSED TIME (days)
Fig. 6.5. Mean volatile suspended solids concen- tration during successive Sclerotium roljsii fermenta- tion runs in presence of sea salts. Plotting symbols: 0 = 0% w / v NaC1; 0 = 2% w/v NaC1; A = 4% w/v NaC1; = 6% w/v NaC1.
73

ORNL DWG 80- 1209 lower apparent growth. The second runs showed a similar pattern. The 6% culture showed limited growth in either run, although its performance was somewhat better than that found with NaCl. The high fixed solids level shown by the 2 and 4% mixed salts (Fig. 6.6) cultures, but not by either those cultures grown on NaCl or mixed salts, could result from the produc- tion of oxalic acids during early culture growth and its precipitation by calcium or magnesium in the complex brine. Fixed solids levels in the 0 and 6% salts cultures were low.
Polymer concentrations, shown in Fig. 6.7, were closer together, particularly during the second run, than were polymer concen- trations for the NaCl runs. The culture grown on 4% w / v mixed salts produced more polymer during the first run than did the 0 and 2% cultures. In the second run,
ORNL DWG 80-124 1
0.4
0.2
0
x LL
I I I I I I 1 I I
0 2 4 6 8 10 12 14 16 18
E L A P S E D TIME (days)
Fig. 6.6. Mean fixed suspended solids concentra- tions during successive Sclerotium rolfsii fermenta- tion runs in presence of sea salts. Plottingsymbols: 0 = 0% w/v NaCl; 0 = 2% w/v NaCl; A = 4% w/v NaCl; = 6% w/v NaCl.
r
1 3 5 7 9 1 1 13 15 17 19
ELAPSED T IME (days)
Fig. 6.7. Mean polymer concentration as volatile solids during successive Sclerotium rolfsii fermenta- tion runs in the presence of sea salts. Plotting symbols: 0 = 0% w/v NaCl; 0 = 2% w/v NaCl; A = 4% w/v NaCl; = 6% w / v NaCl.
ORNL DWG 80- 1208
0 1 3 5 7 9 14 13 15 17 19
ELAPSED T IME (days)
Fig. 6.8. Mean culture centrate viscosity during successive Sclerotium rolfsii fermentation runs in the presence of sea salts. Plotting symbols: 0 = 0% w/v NaCl; 0 = 2% w/v NaC1; A =4% w/v NaCl; =6% w/v NaCl.
74

polymer production for the 0, 2, and 4% cultures was lowered, as was the culture viscosity shown in Fig. 6.8. It appeared that reculturing the organism in the complex salts medium was not a n effective method of seed culture propagation. Viscosities of the 0 and 2% mixed salts cultures were lower than their counterparts grown on NaC1. The 4% culture, however, performed better during the mixed salts runs than during the NaCl runs. The 6% culture showed some produc- tion of an extracellular material which alcohol precipitated, but which did not have much viscosity.
CONCLUSIONS It appears that production of scleroglucan
on media whichcontain 2%NaCl w/v or less is nearly as efficient as that on a conven- tional low salts medium. In the mixed salts solution tests, which is similar to seawater, it appears that brines up to around 4% salts may be feasible for use as makeup water. This may permit use of seawater as makeup water for fermentations performed on ocean-based platforms. Many groundwater brines may also be suitable for use as makeup water, if proper investigation of their Dossiblv toxic constituents is made.
7s

7. Innoculum Production
A major part of field pilot biopolymer production facility costs would be the group of small fermentation and culture mainte- nance equipment required for the produc- tion of starting cultures for the larger fermenters. This cost could be reduced sharply if highly active starter cultures were available on either a dry o r frozen basis. The availability of such cultures could also reduce the professional microbiological staffing needs for the pilot plant. Starter cultures are a routinely used method in many industries, including baking, sausage manufacture, milk product fermentation industries, and alcohol biosynthesis. A number of U.S. firms are engaged in the starter culture business, and if we are able to improve the activity of our cultures, we might be able to interest these firms in providing scleroglucan starter cultures. This is particularly desirable since agar slants, the most common method of culture mainte- nance, are not well suited to the preservation of scme of the cultures producing scleroglu- can.
The medium used for the production of scleroglucan from the CECA Sclerotium culture is a relatively austere salts medium to which a slight amount of yeast extract or corn steep liquor is added. We were interested in investigating slight changes in the medium which might permit the growth of higher concentrations of organisms. We decided to perform a small factorial experi- ment in which the concentration of phos- phate and nitrate were doubled in small batch fermentations in Bellco 1 liter fermen- ters. We hoped to find a feed in which higher biomass production did not cause an increase in culture viscosity or polymer concentration. The four types of fermenters were referred to as follows: the high nitrate fermenter had a doubled nitrate concentra-
tion; the high phosphate fermenter had a doubled phosphate concentration; and high combination fermenter had doubled nitrate and phosphate; and the control used the normal fermentation media described in Materials and Methods. During the 9 day fermentations at 18 to 20 C, samples were taken for analysis a t 2 day intervals. Sample reducing sugar, nitrate, polymer concentra- tion, viscosity, and volatile solids (biomass) were monitored.
The levels of reducing sugars in the fermentations followed essentially similar patterns. The volatile solids concentration, which is rougly proportional to the amount of biomass in the fermenter, is shown in Fig. 7.1. It appears that more biomass was present in the high combination and high phosphate cultures. The high combination fermenter, however, appeared t o provide the highest level of biomass.
This is consistent with the data shown for nitrate concentration in Fig. 7.2. The high combination fermenter showed a slightly greater decrease in the level of broth nitrate than did the high nitrate fermenter. How- ever, both fermenters showed markedly higher levels of culture nitrate than did
Fig. 7.1. Volatile solids concentration during small fermenter tests. Legend: (0) doubled nitrogen and phosphorus; (A) doubled phosphorus; (r) doubled nitrogen; (m) standard medium.
16

0.090 I I I
o.om - T T T
0 0
1) - 0.080 -
0.0151C
0.010 - 0.065 - 0.060 -
0
- - -
0.055 - - 0.050 - 0.045 - A A
- -
6
I I I
0.040, iA . - i t
0.035 - 0.Oza
-
either the high phosphate or control cultures. In none of the cases was nitrate limiting.
Fig. 7.3 shows the concentration of polymer recovered from the different fermenters. The concentration on day 9 was highest in the high combination fermenter, with slightly less in the high nitrate and high phosphate fermenters. However, as shown in Fig. 7.4, the viscosity of the high combination fermenter broth was not much different from the viscosities of the high nitrate and high phosphate fermenter broths.
We were also interested in the effects of oxygen concentration in the sparge gas used for small fermenters. We tested the relative effects of sparge gases containing 5, 20 and 100% oxygen in our standard Bellco one liter fermenters. The results, which are
shown in Table 7.1, indicated that use of a higher oxygen sparge gas can permit higher productions of biopolymer relative to biomass, as well as more complete utiliza- tion of broth glucose. Final pH did not show a major response t o oxygen tension.
Fig. 7.3. Polymer concentration during small fermenter tests. Legend: (0) doubled nitrogen and phosphorus; (A) doubled phosphorus; (V) doubled nitrogen; (w) standard medium.
TIME Iday)
Fig. 7.4. Viscosities during small fermenter tests. Legend: (0) doubled nitrogen and phosphorus; (A) doubled phosphorus; (r) doubled nitrogen; (m) standard medium.
77

Table 7.1. Effect of sparge gas oxygen concentration on Sclerotium grown at 18 C in one liter Bellco fermenters.
~ ~~~
Sparge gas oxygen, % v / v
Parameter 100 100 20 20 5 5
Final pH 2.9 2.9 2.9 3 .O 3.1 3.1 Final Redu-
cing Sugar, % 0.29 0.18 1.55 1.12 0.89 1.19 Polymer, g/ 1 4.94 6.70 2.67 2.85 3.3 I 2.72 Biomass, g/ 1 2.05 3.43 2.56 2.7 I 6.04 4.84 Viscosity, cp
at I 1.5 sec -' " 69.7 65.6 47.3 72.0 56.0 69.8
"0.5% dried polymer resuspended in distilled water.
78

8. Neutral Solvents Production
Butyl and propyl alcohols can be used as cosurfactants, or coagents, in the micellar flooding process for tertiary oil recovery from existing wells. With the exception of 1- butanol, which is fermentation produced to a significant extent, butyl and propyl alcohols are produced from petroleum derived aliphatic compounds. With the objective to decrease the requirement for petroleum as a feedstock for the production of compounds required for enhanced pro- duction of petroleum, to reduce cost, and to augment supply of needed chemicals,we are investigating microbial production of n-butyl alcohol. To determine the most promising areas for concentration, we surveyed the sugars which occur in the various large-scale concentrated liquid waste streams available as feedstocks for butanol fermentation. We chose to look at pure sugars first to avoid the potential problems involved in the fermentation of a specific waste, which might contain several sugars and some fermentation inhibitors. The results of this survey, reported in the 1977 - 1978 annual (Baldwin et a1 1979), were encouraging.
The acetone-butanol fermentation has a long career as a successful industrial fermentation. The earliest work was per- formed by Pasteur, who investigated the production of butyl alcohol from lactic acid and calcium lactate (1862). In 1911, two teams of microbiologists, Fernbach and Schoen of the Pasteur Institute and Perkin and Weizmann of Manchester University, were employed by the firm of Strange and Graham, Ltd., to find fermentation methods for meeting synthetic rubber feedstock needs. Strange and Graham required a bacterium capable of producing isoamyl or n-butyl alchol. Fernbach and Weizmann isolated bacteria capable of producing a
mixture of amyl, butyl and ethyl alchols with acetone from potato starch. In 1912, Weizmann left employment with Strange and Graham, Ltd., to pursue his research. He eventually isolated an organism capable of producing a 4 times higher yield of acetone than the earlier isolate and also capable of using a variety of starches for feed. The organism which he isolated is now termed Clostridium acetobutylicum Weiz- mann.
During World War I, the increased industrial demand for acetone, a feedstock for cordite and airplane wing dope produc- tion, caused the British government to require the substitution of the Weizmann organism in Strange and Graham, Ltd. plants, due to its higher acetone production and ability to use a variety of starches as feedstocks (Prescott and Dunn 1940). Although demand for acetone and butanol died down immediately following World War I, it resumed in a few years as the demands for these materials as chemical feedstocks increased. Organisms capable of using diluted molasses as a feedstock were isolated, and a molasses based process was developed (Monick 1968). However, changes in the availability of feedstocks and some problems which developed with phage infestation of ace to ne-butanol cultures caused a decrease in the production of acetone and butanol by fermentation. The phage infestation problem was solved by the development of phage resistant cultures by the Northern Regional Research Labora- tory (NRRL) of the Department of Agricul- ture, which continues to make the phage resistant cultures available.
There is a substantial requirement for butanol as a coagent in tertiary oil recovery systems. If 1-butanol can be used as a coagent in tertiary system producing lo6 bbl
79
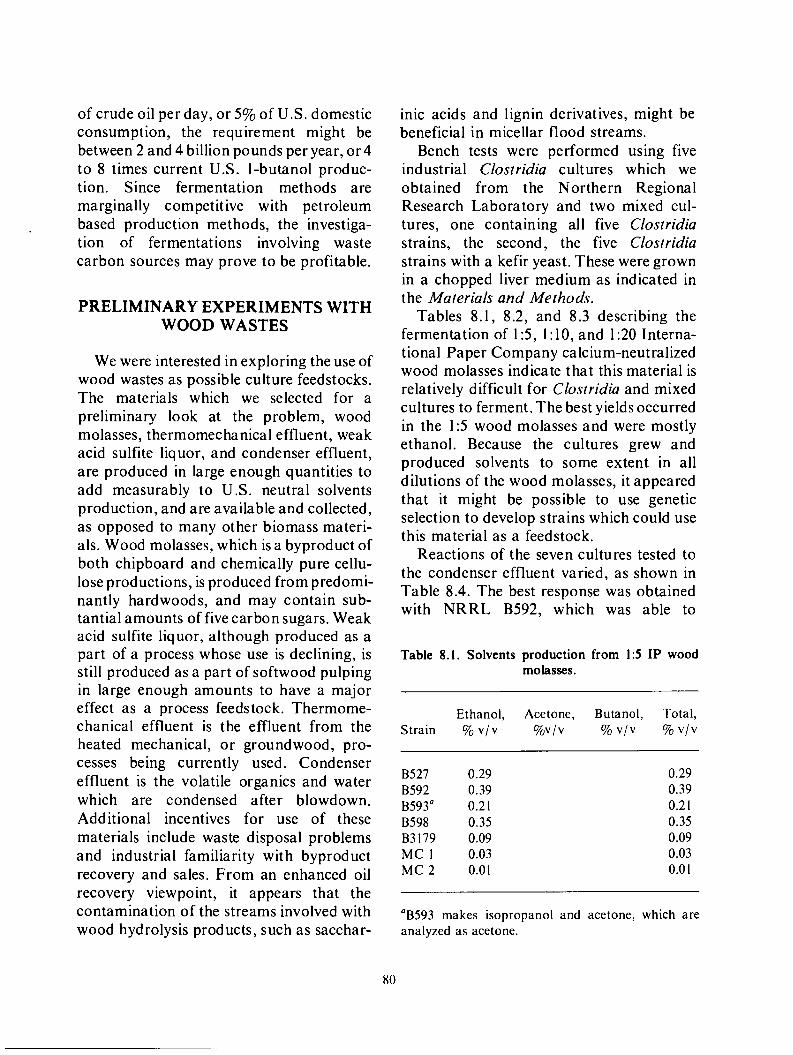
of crude oil per day, or 5% of U.S. domestic consumption, the requirement might be between 2 and 4 billion pounds per year, or 4 to 8 times current U.S. 1-butanol produc- tion. Since fermentation methods are marginally competitive with petroleum based production methods, the investiga- tion of fermentations involving waste carbon sources may prove to be profitable.
PRELIMINARY EXPERIMENTS WITH WOOD WASTES
We were interested in exploring the use of wood wastes as possible culture feedstocks. The materials which we selected for a preliminary look at the problem, wood molasses, thermomechanical effluent, weak acid sulfite liquor, and condenser effluent, are produced in large enough quantities to add measurably to U.S. neutral solvents production, and are available and collected, as opposed to many other biomass materi- als. Wood molasses, which is a byproduct of both chipboard and chemically pure cellu- lose productions, is produced from predomi- nantly hardwoods, and may contain sub- tantial amounts of five carbon sugars. Weak acid sulfite liquor, although produced as a part of a process whose use is declining, is still produced as a part of softwood pulping in large enough amounts to have a major effect as a process feedstock. Thermome- chanical effluent is the effluent from the heated mechanical, o r groundwood, pro- cesses being currently used. Condenser effluent is the volatile organics and water which are condensed after blowdown. Additional incentives for use of these materials include waste disposal problems and industrial familiarity with byproduct recovery and sales. From an enhanced oil recovery viewpoint, it appears that the contamination of the streams involved with wood hydrolysis products, such as sacchar-
inic acids and lignin derivatives, might be beneficial in micellar flood streams.
Bench tests were performed using five industrial Clostridia cultures which we obtained from the Northern Regional Research Laboratory and two mixed cul- tures, one containing all five Clostridia strains, the second, the five Clostridia strains with a kefir yeast. These were grown in a chopped liver medium as indicated in the Materials and Methods.
Tables 8.1, 8.2, and 8.3 describing the fermentation of 1 5 , l : lO , and 1:20 Interna- tional Paper Company calcium-neutralized wood molasses indicate that this material is relatively difficult for Clostridia and mixed cultures to ferment. The best yields occurred in the 1:5 wood molasses and were mostly ethanol. Because the cultures grew and produced solvents to some extent in all dilutions of the wood molasses, it appeared that it might be possible to use genetic selection to develop strains which could use this material as a feedstock.
Reactions of the seven cultures tested to the condenser effluent varied, as shown in Table 8.4. The best response was obtained with NRRL B592, which was able to
Table 8.1. Solvents production from 1 5 IP wood molasses.
Ethanol, Acetone, Butanol, Total, Strain % v / v %vlv % v l v % v l v
B527 0.29 B592 0.39 B593" 0.21 B598 0.35 B3179 0.09 MC 1 0.03 MC 2 0.01
0.29 0.39 0.2 1 0.35 0.09 0.03 0.0 1
"B593 makes isopropanol and acetone, which are analyzed as acetone.

Table 8.2. Solvents production from 1:lO IP wood molasses.
Ethanol, Acetone, Butanol, Total, Strain 9% v / v %v/v % v / v % v l v
Table 8.4. Solvents production from condenser effluent.
Ethanol, Acetone, Butanol, Total, Strain % v / v %vlv % v / v % v l v
B527 0.08 0.08 B592 0.05 0.05 B593" 0.11 0.1 1 B598 0.03 trace 0.03 B3179 0.01 0.0 I MC 1 0.03 trace 0.03 MC 2 0.01 0.0 1
B527 0.26 0.02 0.0 1 0.29 B592 0.08 0.07 0.27 0.43 B593" 0.03 0.03 0.0 1 0.07 B598 0.02 0.03 0.05 0.10 B3179 0.04 0.02 0.06 MC 1 0.19 0.03 0.0 1 0.23 MC 2 0.06 0.02 0.0 1 0.09
"B593 makes isopropanol and acetone, which are analyzed as acetone.
"B593 makes isopropanol and acetone, which are analyzed as acetone.
Table 8.3. Solvents production from 1:20 IP wood molasses.
Ethanol, Acetone, Butanol, Total, Strain % v / v %vlv % v l v % v l v
Table 8 . 5 . Solvents production from thermomechanical effluent.
Ethanol, Acetone, Butanol, Total, Strain % v lv %vlv % v / v % v l v
B527 0.02 0.02 B592 0.02 0.02 B593" 0.03 0.03 B598 0.03 trace trace 0.03 B3179 0.01 trace 0.0 1 MC 1 0.02 0.02 MC 2 0.02 0.02
B527 0.08 0.02 0.10 B592 0.07 0.0 1 0.12 0.20 B593" 0.05 0.02 0.04 0.1 1 B598 0.04 0.02 0.0 1 0.07 B3179 0.15 0.03 0.01 0.08 MC 1 0.06 0.0 1 0.0 1 0.08 MC 2 0.12 0.0 I 0.09 0.22
"B593 makes isopropanol and acetone, which are analyzed as acetone.
produce 0.43% neutral solvents from the material. This was probably due to the low concentration of materials in condenser effluent, less than 1% generally. However, all of the cultures grew well on the material, even if they did not produce solvents, indicating that toxicity was limited.
Thermomechanical effluent, as shown in Table 8.5, was used best by NRRL B592, which was able to produce 0.20% neutral
"B593 makes isopropanol and acetone, which are analyzed as acetone.
solvents, and by mixed culture 2. The concentration of thermomechanical effluent was about 0.5% fermentable carbohydrates, so it appears that this material, like condenser effluent, is well tolerated and fermented by some available strains. Fur- ther concentration of thermomechanical or condenser effluent feedstocks or the fermen- tation products made from them may be required.
81

Calcium base weak acid sulfite liquor was also evaluated, as shown in Tables 8.6, 8.7, and 8.8. As expected, NRRL B592 attacked this material readily, producing the highest total solvents concentration, 0.59%, from a 1 5 dilution. However, the weak acid sulfite liquor appeared to have some toxicity for the organisms, since 0.35% total solvents, a higher yield based on available carbohy- drates, were produced by this culture from a 1:20 dilution of weak acid sulfite liquor. This
Table 8.6. Solvents production from 1:5 weak acid sulfite liquor.
Ethanol, Acetone, Butanol, Total, Strain 96 v / v %vlv % v / v % v / v
B527 0.48 0.03 0.01 0.52 B592 0.22 0.05 0.32 0.59 B593“ 0.16 0.02 0.02 0.20 B598 0.19 0.02 0.15 0.36 B3179 0.43 0.02 0.0 1 0.46 MC I 0.38 0.03 0.0 1 0.42 MC 2 0.19 0.03 0.04 0.26
“B593 makes isopropanol and acetone, which are analyzed as acetone.
Table 8.7. Solvents production from 1 : 10 weak acid sulfite liquor.
Ethanol, Acetone, Butanol, Total, Strain % v / v %v/v % v l v % v / v
B527 B592 B593“ B598 83 179 MC 1 MC 2
0.18 0.02 trace 0.20 0.08 0.10 0.3 1 0.49 0.06 0.02 0.24 0.32 0.06 0.02 0.07 0.15 0.15 0.03 0.02 0.20 0.14 0.02 0.16 0.14 0.03 0.04 0.21
“B593 makes isopropanol and acetone, which are analyzed as acetone.
Table 8.8. Solvents production from 1:20 weak acid sulfite liquor.
Ethanol, Acetone, Butanol, Total, Strain % v / v %vlv , % v l v % v l v
B527 0.15 0.02 0.02 0.19 B592 0.07 0.04 0.24 0.35 B593“ 0.08 0.0 1 0.20 0.29 B598 0.03 0.0 1 0.05 0.09 B3179 0.15 0.02 trace 0.17 MC 1 0.17 0.0 1 0.01 0.19 MC 2 0.07 0.05 0.12
“B593 makes isopropanol and acetone, which are analyzed as acetone.
indicates that it may well be possible to develop strains which will produce the theoretical yield, 2 to 2.5% total neutral solvents, from the 1 5 dilution which is the normal unconcentrated stream. Weak acid sulfite liquor was shown to be constant enough in properties for wartime ethanol production by fermentation, making it look like a good candidate for a feedstock.
When we were satisfied with bench developments, we were interested in pursu- ing further developments to small pilot testing with Weyerhaeuser, which sent several of the streams tested. However, after negotiation, we were prevented by the inability of their and DOE/ORO”s legal departments to reach and agreement, although the proposed contract did not involve transfer of funds.
OPERATING PLANT COMPARISON
There appears to be a considerable amount of interest in the production of ethanol for use in fuels and as an industrial chemical. Neutral solvents fermentations appear to be largely ignored for reasons that are not clear, because good yields are
82

attainable, and, as will be discussed later, require less separation energy. For compa-
a rison, we show in Table 8.9 the product and energy yields from two commercial fermen- tations run on molasses and reported by Prescott and Dunn (1959). Molasses is a particularly favorable substrate for ethanol production by yeast. The neutral solvents production shown is an'acetone - butanol - ethanol fermentation, but butanol - isopro- panol -ethanol fermentations having similar yields and better suitability for used in micellar flooding have been used used on a commercial production basis. Energy pro- duction from the Clostridia fermentation is about 10% higher than that from the yeast ethanol fermentation, and the additional energy is in the form of hydrogen, which can be used for hydrogenation o r in plant energy needs.
Table 8.9. Comparison of ethanol and neutral solvents production.
Ethanol Neutral solvents
Mate ria 1 Kg lo6 cal Kg I O 6 cal
Molasses H 2 0
Mash, 1
c02 H2
DDS" I-Butanol Acetone Ethanol
Total
Input
1,000 1,430 2,020
output
186
155
194 1.38
1.38
1,000 9,420 9,500
32 1 8 0.14
286 115 0.99 49 0.36
5 0.04
1.53
ODDS is distiller's dried solids.
PROCESS ENERGY BALANCE
Because the concentration of fermenta- tion products in the feedstock stream and the process flow arrangement selected are important factors in process energy require- ments, we decided to investigate the rec- overy of neutral solvents from dilute (5% v/ v) streams, such as might be expected with wood wastes, which can typically be 10% carbohydrate. We were fortunate to have an M. I . T. School of Chemical Engineering Practice Team, A. M. Grosset(leader), S. K. Fok, and M. Lemarchand to study the hypothetical recovery of neutral solvents from a dilute fermentation, such as one would get through fermentation of a wood waste stream. Their findings were published in a report, Recovery of neutral-solvent fermentation products, ORNL/ MIT-307, and are briefly summarized here.
The problem posed for the team was to estimate theenergyrequirementsand costs to separate a stream containing 5% neutral solvents and 95% water by freeze chilling, distillation, or solvent extraction to a stream 50% or less water. They considered rough energy balances and process costs, and performed some laboratory research on freeze chilling and solvent extraction, and a few on a combined freeze chilling - solvent extraction process. The solvent extraction results, which were concerned with extrac- tion of alcohols directly into alkane sol- vents, were judged unsuccessful a t that time. Tables 8.10 and 8.11 show the costs which were developed for distillation and freezing for an 85,000 kg/ hr process stream, which might be typical of a wood waste operation. We feel that these costs are somewhat low, as a result of consideration of a binary system of butanol and water for some of the distillation work. However, they did indi- cate that there was enough promise for continuation of work in this area.
83

Table 8.10. Estimated neutral solvents distillation Table 8.1 1. Estimated neutral solvents cystallization costs. costs.
Item cos t ltem cos t
Equipment
Distillation columns Heat exchangers Condenser Pumps
$ 59,OO 176,000 30,400 4,400
Equipment
Crystallizers Heat exchanger Filter Pumps
$ I4,000,000 I00,000 24,000 2 I ,500
Total Equipment
Annual costs
$270,000 Total Equipment $14,145,500
Annual costs
Maintenance Utilities Fixed charges
16,000 529,000 40,500
Maintenance Utilities Fixed charges
848,700 946,000
2, I2 1,800
Total Annual Cost $585,700
Unit cost: $0.012 kg solvent
Total Annual Cost 3,916,500
Unit cost: $0.079 kg solvent
In order to obtain better distillation calculations, a computer model for multi- component vapor-liquid equilibria using the Wilson equation of state was evaluated by a second team of M. I. T. students, J. H. Chronis (leader) and M. Amrhein, and released in a report, Vapor-liquid equilib- rium model ~ for a partially miscible multi- component system: isopropanol-acetone- ethanol-n-butanol-water, ORNL/ MIT-3 10.
Although successful in other systems, the addition of a third parameter to the Wilson equation to accommodate immiscible syst- ems did not provide a n adequate model for multicomponent distillation calculations with this system. Recent results (Prausnitz 1980) using the UNIQUAC equation of state, however, indicate that this state equation can be adapted to our model.
84

9. Phase Behavior and Interfacial Tensions of Aqueous-Hydrocarbon Systems Containing
Alkyl-Substituted Sodium Oleates
In the previous summary report (BETC/ W26-4), preliminary observations of the effect on interfacial properties of an ethyl group substituted for a hydrogen on the carbon next to the carboxylate of sodium oleate were described. Salts of oleic acid are of interest a s surfactants because they are a prominent constituent of tall oils and other natural products. Tall oils are a byproduct of the pulping of soft woods by the kraft process, isolated in the recovery of chemicals from weak black liquor (see Fig. 14.1). They represent a substantial potential source of surfactants not derived from petroleum feedstocks. However, a t the time of the earlier report, we had not identified conditions under which either crude tall oils o r sodium oleate gave interfacial tensions lower than 0.05 mN/ m (dynes/cm). Large differences in interfacial properties of tall- oil fatty acids salt components, which differ only in the number of double bonds in the eighteen carbon chains, had suggested that intentional modifications of structure might have interesting effects. Substituents on the carbon alpha to the carboxylate were considered a promising approach to try, on the basis that steric hindrance near the ionized group might affect tolerance to salinity o r to divalent cations. In addition, there are substantial reported effects of the influence of multiple alkyl substitutions on interfacial properties of aromatic sulfonates (P. H . Doe, M. El-Emary, W. H . Wade,and R. S. Schechter 1978) and on adsorption on minerals (G. P. Ahearn and A. F. Turbak 1966). I t is of interest to see if similar trends occur with non-aromatic surfactants. Branching has been shown in many in-
stances to affect surfactant properties (see, for example, Durham 1955, Hartley 1941, and Winsor 1948).
Sodium-2-ethyloleate (or sodium-2-ethyl- cis-9-octadecanoate) proved to have quite different properites than those we had observed a t the time for sodium oleate. Conditions were found under which aque- ous-hydrocarbon interfacial tensions in the millidyne/cm range were attained. How- ever, a puzzling aspect of the behavior was noted in the previous report. Wade and coworkers (1978) had reported shifts in the alkane carbon number, ACN a t which minima in interfacial tensions were observed as the concentration of commercial mixed surfactants was increased , but invariance in optimal A CAT with surfactant concentration if the surfactant were pure. With our first synthesis of sodium-2-ethyloleate, there was a shift from undecane to octane of the minimum when the surfactant concentra- tion was raised from 0.01 M to 0.05 M (0.5 MNaC1, pH 9.8,5%v/v isobutylalcohol(2- methyl-Z-propanol) in the initial aqueous phase, WOR=3, 30 C). This suggested that our preparation was not as pure as we had thought. Reexamination of the purity of the starting material and of the steps for isolation of the product resulted in a product of much higher purity, for which the anomalies disappeared. A series of oleates having different substituents on the carbon alpha to the carboxylate was prepared, and the phase behavior of hydrocarbon-aqueous systems containing t hem is compared below. The results suggested compositions under which sodium oleate should cause low interfacial tensions, and the confirmation of
85

this prediction with 99% pure oleic acid and with crude tall oils is discussed in Chapter 10.
The research described in this chapter was supported for the most part by the Division of Chemical Sciences, Basic Energy Sciences, DOE.
PHASE BEHAVIOR AND INTERFACIAL TENSIONS OF
SYSTEMS CONTAINING SODIUM-2-ETHY LOLEATE
The main source of impurities in the preparation of sodium-2ethyloleate used in the experiments described in the previous summary report is believed to be from the oleic acid used as starting material. In any case, reexamination of the methyl ester of the original preparation by gas chromatog- raphy (5% Dexil 300 and 6% Silar-5-CP columns) indicated that only 76% was the 2- ethyl derivative, in spite of ‘the close correspondence of the elemental carbon and hydrogen analysis. Consequently, in the preparations used in the results to be reported here, close attention was given to preparation of the starting material. Details are given in Materials and Methods; but in general, alternating distillations and crystal- lizations from acetone were used to give a feed over 97% pure oleic acid, as determined by gas chromatography of the methyl ester. Synthesis of the a-ethyl derivative was then carried out by the procedure of Pfeffer (1972). Details of procedures are also given in Materials and Methods; briefly, in a reaction mixture containing tetrahydro- furan, diisopropyl amine and hexamethyl- phosphoramide, n-butyl lithium (added as a solution in hexane) was reacted with oleic acid. Ethyl bromide was then added. The 2- ethyloleate formed was isolated by distilla- tion and crystallization.
Most of the results presented here have been described in quarterly reports and it is perhaps appropriate to indicate which earlier results we consider superceded by later measurements and which in our present judgement are most reliable. In the April to June 1979 quarterly (BETC/ W26- 8), preliminary observations of phase behavior after contact of one volume of hydrocarbons from hexane to tridecane with three volumes (WOR = 3) of an aqueous solution 0.5 A4 in NaCI, 5% v /v isobutyl alcohol, and 0.01 or 0.05 A4 in sodium-2-ethyloleate (pH 9.8, 30 C) were presented, along with a n interfacial tension scan as a function of alkane molecular weight. The samples were mixed by invert- ing ten times to generate white emulsion, the layers were allowed to separate in a 30 C water bath for a day, the phase volumes were observed, and the layers were then remixed. The procedure was repeated for 5 days after which they were allowed to sit a week before withdrawing samples for interfacial tension measurements. The interfacial tension minima for the two surfactant concentra- tions appeared to occur a t the same alkane carbon number, between nonane and decane for the crossover point of the tensions of the top vs middle phases and middle vs bottom phases. This contrasts with the minimum a t undecane for 0.01 M sodium-2-ethyloleate and a t octane for 0.05 M reported in the last summary (BETC/ W264).
Subsequent measurements ind ica ted that equilibrium may not have been attained before the phase volumes in the Spring 1979 quarterly were taken, and nonequilibrium is particularly suspect with respect to the samples used in the interfacial tensions. Improvements were subsequently made in the techniques for equilibrating the samples and for measuring equilibrium interfacial tensions. Consequently, the results reported
86

here were taken from the July to September 1979 (BETC/W26-10) and October to December 1979 (BETC/ W26-15) quarterly reports. These measurements were carried out with a WOR of 2, rather than 3.
The modifications of the spinning drop tensiometer mainly had to do with temperat- ure control. A five sample unit (Gash and Parrish 1977) purchased from N. B. Simp- son, Tulsa, Oklahoma, had an advantage for this purpose over our University of Texas instrument of longer capillaries which allowed better isolation of the drops from heat flow through the chuck on the motor shaft holding the tubes. The tubes spin in an air bath, in the as-received apparatus proportionally controlled by nichrome wire heaters and a circulating fan. We found that a considerable variation of temperature (+2 C a t the point furthest from the fan) occurred when the unit was required to maintain a temperature around 30 C. Coils under the glass deck with cooling water circulating through them cut this variation to k0.3 Cy but thermometers a t each of the motor positions indicated there was still a 2 C temperature variation across the sample deck, the tube next to the fan being the hottest. In addition, as the thermometer was shifted to indicate what temperatures would be along the length of a single tube, a 2 C difference was found, with the end closest to the motor the coolest. Apparently, cooler air from the room was being sucked into the holes through which the spinning-drop tubes were connected to the synchronous motors. To alleviate these variations, air pumped through a coil in a bath controlled a t the desired temperature was injected a t each of the tube loading holes on the opposite, o r motor, side. Water circulated in the cooling coils was also controlled by the bath. The fan was operated, but not the nichrome heating wires. The temperature variation across the deck was reduced to less
than 0.5 C, and along the length of a single tube, to 0.1 C.
Phase Volumes
It was mentioned previously that the experiments reported here were for a WOR = 2, there being initially four ml of hydrocarbon and eight ml of aqueous phase. The equilibrations were carried out a t 3 1.5 C in 15 ml volumetric screw cap centrifuge tubes, capped tightly with polyethylene plastic positive seal inserts. The tube were inverted ten times to generate white emul- sions and phases were allowed to separate in the controlled temperature bath. When volumes ceased to change, tubes were again inverted ten times and allowed to sit. The procedure was repeated 5 times over a 30 day period, after which the tubes were allowed to sit undisturbed for another 30 days before the densities and final phase volumes reported were determined. With minor variations, the above procedure was followed for three sets of measurements: (1) alkane scans for unbuffered solutions, the initial aqueous phase being adjusted to 9.8 a t 0.5 M NaCl and a t 0.01 M a n d 0.05 Msod- ium-2-ethyloleate; (2) for buffered solu- tions, the same except that inorganic salts were 0.45 M NaCl and 0.025 M Na2C03, initial pH adjusted to 10.0,O.OI M a n d 0.05 M sodium-2-ethyloleate; and (3) three salinities, a t 0.01 M sodium-2-ethyloleate, 10% of the total sodium from inorganic salt being introduced a s sodium carbonate, 0.25 M , 0.50 M , and 0.75 MNa'. The 0.5 MNa' results are an independent set of measure- ments duplicating a set in (2). Densities reported in the tables were measured by weighing 0.050 ml samples taken with a constant delivery 100 pliter syringe.
The phase observations for the systems containing initially unbuffered aqueous, 0.5 M NaCl are summarized in Table 9.1 for
81

Table 9.1. Phase behavior of aqueous/hydrocarbon systems, with 0.01 M surfactant, WOR = 2, unbuffered."
AI kane: Hexane Heptane Octane Nonane Decane Undecane Dodecane Tridecane
Rel. volumeb Density' A p pea ranced
Rel. volume Density Appearance
Rel. volume Density
;gearance
0.33 0.688
0.67 1.015
9.77
(0.34)' 0.695
t
(<0.005)'
t
0.66 1.016
9.8 I
Upper phase
0.3 1 0.3 1 0.32 0.715 0.722 0.737
Middle phase
0.03 0.03 0.04 0.762 0.835 0.932
t St,O StSO
Lower phase
0.66 0.66 0.64 1.020 1.02 I 1.016
t,O 9.80 9.82 9.78
0.32 0.32 0.33 0.742 0.747 0.768
(0.03)' 0.996 t.so
(0.65)' 0.68 0.67 1.02 I 1.012 I .020 St,O st,o t 9.77 9.80 9.8 I
"8 ml of 0.01 A4 sodium-2-ethyloleate, 5 vol % i-butanol, 0.50 M NaCI, pH 9.8, equilibrated with 4 ml 'Gm/ml from weighing accurately measured 50
Based on visual observation of scattered white light: t = Tyndall effect; 'Values in parentheses show no
'Potentiometrically determined a t 3 I .5 C on aqueous layer
alkane, for 60 days a t 31.5 C. pliter samples removed a t 31.5 C. s t = strong Tyndall effect; o = opalescent; and so = strongly opalescent. meniscus between the indicated phases. samples, Ag/ AgCl internal pH electrode.
bBased on 12 ml = 1.00. d
0.01 M sodium-2ethyloleate and in Table 9.2 for0.05 Msodium-2-ethyloleate. Middle phases formed immediately (1 hr at 3 I .5 C) at octane, nonane and decane at both surfactant concent rations. The phase vo- lumes at nonane and decane reached equilibrium volumes in six hours after the first mixing and showed no tendency to change with subsequent remixing. The middle phases at octane and undecane reached steady values only after sitting undisturbed for 90 hr a t 3 1.5 C. At undecane for both surfactant concentrations, the light reflective meniscus between the middle and aqueous phases became less distinct with time until a t 30 days no meniscus could be found; but instead a strongly opalescent
(blue to reflected light, red-tinted to trans- mitted light) material could be seen floating on a slightly opalescent aqueous phase. To a lesser extent, this phenomenon occurred a t decane; but here a meniscus could still be noted, but only as a sharp change in refractive index in the middle of a-gradual change in opalescence. At 0.01 Msurfactant concentration the heptane sample showed after 45 days a t 3 1.5 C what appeared to be a small amount of middle phase but without a clear meniscus between it and the upper oil phase. After 60 days equilibration, no middle phase was seen a t heptane a t 0.05 A4 surfactant concentration. Comparison of these data with those reported for the WOR = 3 systems in the Spring 1979 quarterly
88

Table 9.2. Phase behavior of aqueous/ hydrocarbon systems, with 0.05 M surfactant, WOR = 2, unbuffered."
Alkane: Hexane Heptane Octane Nonane Decane Undecane Dodecane Tridecane
Rel. volumeb 0.35 Density' 0.655 Appearanced t,O
Rel. volume Density Appearance
Rel. volume 0.65
Appearance
P H' 9.80
Density 1 .oo I
Upper phase
0.36 0.24 0.25 0.29 0.680 0.70 I 0.71 I 0.714
t
Middle phase
0.15 0.17 0.2 I 0.833 0.919 0.937
t st.0 st,so
Lower phase
0.64 0.6 1 0.58 0.50 1.006 I .oo I 1.003 I .006
t,o
9.81 9.78 9.79 9.82
0.29 0.30 0.32 0.73 1 0.742 0.755
(0.25)' 0.990 st,so
(0.46)' 0.70 0.68 I .ooo I .005 I ,000 st,o St,O t
9.80 9.78 9.80
"8 ml of 0.05 M sodium-2ethyloleate, 5 vol % i-butanol, 0.50 M NaCI, pH 9.8, equilibrated with 4 ml 'Gmjml from weighing accurately measured 50
Based on visual observation of scattered white light: t = Tyndall effect: eValues in parentheses show no
'Potentiometrically determined at 3 I .5 C on aqueous layer
alkane, for 60 days at 31.5 C. pliter samples removed at 31.5 C. st = strong Tyndall effect; o = opalescent; and so = strongly opalescent. meniscus between the indicated phases. samples, Ag/AgCI internal pH electrode.
bBased on 12 ml E 1.00. d
report show that the change in water-oil ratio had very little effect on the phase volumes, and the hydrocarbon range of three phase behavior was only slightly different. On the other hand, clear differ- ences in density of the various phases are apparent.
After determination of the interfacial tensions, 1.0 ml samples of the aqueous phases were withdrawn by syringe and their pH determined. Table 9.1 shows an average pH of 9.80 with no obvious trend across the three-phase region for the 0.01 Msurfactant solutions. Table 9.2 shows an average pH of 9.80 also, again with no trend across the three-phase region for the 0.05 Msurfactant
solutions. We had also sealed up a sample of the aqueous phase which was not contacted with an oil. Here the pH was measured to be 9.60. Therefore, it appears that either some buffering action is present in the two-phase systems or the pH after equilibration rises. However from contact with an oil phase one would expect a rise in pH in the aqueous phase since free acid should be preferentially extracted. We had saved several of the samples used in the studies reported in the Spring 1979 quarterly report. When the pH of' these nearly 90 days old samples were detemined, we found an average pH of9.55. Thus it is evident that either we erred in determinaton of pH in our previous formu-
89

lations or that absorption of C02 over time had reduced the pH.
We had initially chosen pH 9.8 for our studies since we believe this to be in the neighborhood of equivalence points in contact with hydrocarbons where the surfactant is in salt form without the presence of gross amounts of excess base. For our present purposes, however, as long as the pH is high enough for a n appreciable fraction of the fatty acid to be in the salt form, the value of the pH is perhaps less important than that it be constant across the hydrocarbon or salinity scans. For this reason and others which will become clear later, we were interested in the effect that introduction of another buffer into the system might have.
Since carbonate rock is a common constituent of underground petroleum
reservoirs, a sodium carbonate-sodium bicarbonate buffer was an obvious choice for a pH near 10.0 (pKa2 = 10.25 for HKO3). At pH 10.0, a carbonate- bicarbonate buffer will have a buffer capacity of nearly 50% of its molarity. To avoid changing the ionic strength apprecia- bly, we elected to make only 10% of the total sodium ion Na2CO3. Stock solutions ofO.O1 M and 0.05 M sodium-2-ethyloleate, 0.45 M NaC1,0.025 M Na2CO3 and 5 vol % i-butyl alcohol were prepared as described previ- ously and brought t o pH 10.0 with HCl or NaOH addition.
Tables 9.3 and 9.4 for the higher pH buffered samples show that the three-phase region has shifted to lower carbon number hydrocarbons (lower ACN) a s compared to Tables 9.1 and 9.2. The phase volumes and appearances, however, are remarkably
Table 9.3. Phase behavior of aqueous/ hydrocarbon systems, with 0.01 M surfactant, WOR = 2, buffered."
Alkane: Pentane Hexane Heptane Octane Nonane Decane U ndecane Dodecane Tridecane
Rel. volumeb Density' Appea ranted
Rel. volume Density Appearance
Rel. volume Density Appearance P g
0.33 0 .34 0 . 3 I 0 .620 0.643 0.670
t
0.03 0.825
t
0.67 0.66 0.66 0.997 1.006 1.003
9.96 9.98 9.98
Upper phase 0.32 0.32 0.685 0.716
Middle phase 0.03 0.02 0.902 0.982 st,o st ,so
Lower phase 0.65 0.66 1.007 1.000
t .o 9.95 10.00
0.32 0.32 0.33 0.33 0.7 I9 0.725 0.738 0.743
(0.005)'
S t . 0
(0.68)' 0.68 0.67 0.67 1.002 I .005 0.996 0.996 st,so S l . 0 t t 9.97 9.98 10.00 9.99
"8 ml o f 0.01 M sodium-2~thylo leate , 5 vol % i-butanol. 0 .45 M NaCI, 0.025 M Na2CO3. pH I O , equilibrated with 4 'Gm/ml from weighing accurately measured 50 pliter
dBased o n visual observation of scattered white light: t = Tyndall effect; st = strong 'Values in parentheses show no meniscus between the
'Potentiometrically determined at 3 I .5 C on aqueous layer samples, Ag / AgCl internal pH electrode.
ml alkane, for 60 days at 31.5 C . bBased on 12 ml E 1.00. samples removed at 31.5 C . Tyndall effect; o = opalescent; and so = strongly opalescent. indicated phases.
90

Table 9.4. Phase behavior of aqueous/ hydrocarbon systems, with 0.05 M surfactant, WOR = 2, buffered."
AI ka ne: Pentane Hexane Heptane Octane Nonane Decane U ndecane Dodecane Tridecunc
Rel. volumeb Densityd Appearance'
Rel. volume Density Appearance
Rel. volume Density Appearance P~
0.36 0.647
0.64 1.012
9.98
(0.27)' 0.670
t
(0.10)' 0.760
t
0.63 1.001
9.99
0.22 0.677
0.16 0.790
t
0.62 1.013
10.02
Upper phase 0.24 0.26 0.689 0.705
Middle phase 0.17 0.17 0.814 0.890 st.0 st.0
Lower phase 0.59 0.57 1.002 1.006
10.00 10.01
0.28 0.29 0.718 0.729
(0.24)' 0.946 St.SO
(0.48)' 0.7 I 0.998 0.995
S t . 0 st.so 9.98 10.01
0.30 0.3 I 0.735 0.752
0.70 0.69 0.999 I .004
t I 10.03 10.00
"8 ml of 0.05 M sodium-2ethyloleate, 5 vol '31 i-butanol, 0.45 M NaCI, 0.025 M Na2CO3. pH IO,.equilibrated with 4 ml alkane, for 60 days a t 31.5 C. Values in parentheses show no meniscus betwcen the indicated phases. dGm/ml from weighing accurately measured 50 pliter samples removed at 31.5 C. 'Based on visual observation of scattered white light: t = Tyndall effect; st = strong Tyndall effect; o = opalescent; and so = strongly opalescent.
bBased on 12 mi E 1.00.
'Potentiometrically determined at 3 I .5 C on aqueous layer samples, Ag/AgCI internal pH electrode.
similar. At both surfactant concentrations middle phases formed after six hours at 3 1.5 C from heptane to decane. As before, the center samples showed three-phase volumes which reached equilibrium values after the first mixing and showed no tendency to change with subsequent remixing up to 60 days afterward. The middle phase at heptane reached its equilibrium volume after 30 days showing a definite meniscus a t both the oil and water interfaces. At 0.01 M surfactant concentration, no middle phase ever appeared a t hexane even after 60 days. However, a t 0.05 M surfactant concentra- tion, the hexane sample was initially three- phase; but after 25 days the meniscus between the upper and middle phases could just barely be seen and the middle phase could best be detected by the schlieren lines indicating unequal density which formed in
the oil phase after the sample was tilted slightly. For both surfactant concentrations the decane sample lost the meniscus separat- ing the middle and bottom phases after 30 days at 3 1.5 C; however, a middle phase was clearly present as could be seen from the change in opalescence near the oil phase.
Thus we see that an interesting pheno- menon occurs with increasing age of both sets of samples. Middle phases slowly form a t the low ACN side of the three-phase region and eventually generate a light reflecting meniscus. After this occurs, the sample upon remixing quickly returns to this condition and the mensicus does not completely disappear with age. However, a t the high ACN side ofthe three-phase region, the meniscus between the middle and aqueous phases forms immediately but slowly disappears with age. Remixing of
91

these samples can result in an apparent two- phase clear system which requires months for the middle phase to reform but again without a visible middle/ aqueous meniscus. We have now had the opportunity to observe these systems for over 120 days and find that the disappearance of the mid- dle/aqueous meniscus is a general pheno- menon which proceeds at nonane in the buffered samples and at decane in the unbuffered samples as well but at, a much slower rate. We see no evidence for this a t heptane or octane in the buffered samples or a t octane or nonane in the unbuffered samples where the middle phase is more oil continuous. However, as will be evident in the discussion of interfacial tensions, the samples in which the middle phases have “disappeared” readily reform them in the spinning drop tube under centripetal force. Thus while this phenomenon raises ques- tions about just what one should call the three-phase region, its effect is less apparent on the interfacial tension minimum. We have not been able to regenerate these middle phases with ordinary bench top centrifugation at 5,000 RPM.
Again, after interfacial tension measure- ments, one ml samples of the buffered aqueous phases were withdrawn for pH determination a t 3 1.5 C. Table 9.3 shows an average p H of9.98 atO.O1 Msurfactant with no trend across the three-phase region. Table 9.4 shows an average pH of 10.00 a t 0.05 M surfactant again with no obvious trend. A sealed sample of the aqueous stock surfactant solution used to prepare the buffered samples was also aged for 60 days without oil and showed a somewhat lower pH of 9.86. The tension measurements we have, including those reported in the Spring quarterly not included here, span a 0.5 pH range.
The salinity dependence of phase behav- ior for buffered aqueous 0.01 M sodium-2-
ethyloleate-hydrocarbon systems is sum- marized in Tables 9.5 to 9.7. Table 9.6, which is comprised of observations for 0.5 A4 Na’, is an independent set of measure- ments on the same systems as Table 9.3. Comparison indicates good agreement between the two sets. Fig. 9.1 maps the regions of salinity and hydrocarbon molecu- lar weight where three phases were found.
The 0.2 pH unit difference between 0.25 M Na’ (Table 9.5) and 0.75 M Na’ (Table 9.7) may reflect the change in the pH electrode potential with the change in sodium ion concentration more than an actual difference in hydrogen ion concentra- tion. Middle phases intermediate in density between oil and brine phases were observed with several hydrocarbons at each salinity. The formation of indistinct oil-middle phase
ORNL OW0 80-3I8R
I I I I I I I I I I I I I y No*
1 1 1 1 1 1 1 1 1 1 1 1 1 1 4 5 6 7 8 9 IO 11 12 13 14 15 16
ALKANE CARBON NUMBER
Fig. 9.1. Phase behavior of 0.01 M sodium-2- ethyloleate. Conditions: 5% v/v i-butyl alcohol; average pH 10; 5 mole % Na2CO3; WOR = 2; equilibrated with hydrocarbon for 60 days at 3 1.5 C. Plotting symbols: m = middle phase present; (m) = questionable middle phase; mo = opalescent middle phase; u” = opalescent upper phase; 1” = opalescent lower phase; 1‘ = cloudy lower phase; ACN* = position of optimal interfacial tension.
92

Table 9.5. Phase behavior of aqueous /hydrocarbon systems, 0.25 M Na', 0.01 M sodium-2ethyloleate, WOR = 2, buffered ") 31.5 C.
Alkane: Pentane Hexane Heptane Octane Nonane Decane
Rel. volume' Density'
Rel. volume Density Appearanced
Rel. volume Density A p peara nce PH'
0.30 0.610
0.03 0.886 st ,o
0.67 0.995
10.10
Upper phase
0.3 1 0.32 0.32 0.32 0.33 0.654 0.672 0.694 0.710 0.719
Middle phase
Lower phase
0.69 0.68 0.68 0.68 0.67 0.998 I .ooo 0.997 I .ooo 0.998 st,o t t 10.09 10.09 10.08 10.09 10.07
"8 ml of 0.01 M sodium-2-ethyloleate, 5 vol 96 i-butanol, 0.225 M NaC1, 0.0125 M Na2CO3, p H 10, equilibrated with 4 ml alkane, for 60 days a t 31.5 C. 'Based on 12 ml E
1.00. 'Gm/ml from weighing accurately measured 50 pliter samples removed a t 31.5 C . dBased on visual observation of scattered white light: t = Tyndall effect; st = strong
Tyndall effect; o = opalescent; and so = strongly opalescent. 'Potentiometrically determined a t 3 1.5 C o n aqueous layer samples, Ag/ AgCl internal pH electrode.
boundaries on the low alkane carbon number, high salinity side of the three-phase conditions and of indistinct middle-aqueous phase boundaries on the high alkane carbon number, low salinity side of the three-phase conditions is seen to be a general pheno- menon. At these points, the densities of the two phases which have no distinct meniscus between them are very similar. This and the interfacial tension results to be presented suggest that the solid lines in Fig. 9.1 are the loci of systems near critical end points at 31.5 C.
Fig. 9.2 shows the same sodium-2-ethyl- oleate systems, separately prepared and aged for 60 days a t 21 C with repeated mixing and settling as described above. The
ten degree difference in temperature results in a narrower three-phase region with the salinity center of the three-phase region (ACN*) shifted to slightly higher hydrocar- bon molecular weight at constant salinity or equivalently to lower salinity at constant hydrocarbon molecular weight. As before, many of the systems (those enclosed in parentheses) have indistinct menisci sug- gesting proximity to critical end points. It appears that for sodium-2-ethyloleate, the oil-middle phases'critical conditions are far more sensitive to temperature than are the middle-aqueous phases' critical conditions. I t is also apparent from Fig. 9.2 that the effect of temperature on the location of the salinity center of the three-phase region is
93

Table 9.6. Phase behavior of aqueous/ hydrocarbon systems, 0.50 M Na', 0.01 M sodiurn-2+thyloleate, WOR = 2, buffered" , 3 1.5 C.
Alkane: Pentane Hexane Heptane Octane Nonane Dccanc Undccanc Dodccanc -Pridecanc
Rcl. volumeb 0.33 Density' 0.610 A ppeara nccd
Rel. volume Density Appearance
Rel. volume 0.67 Density 0.998 Appearance P H' 9.97
0.34 0.3 I 0.655 0.670
1
0.03 0.82 I
t
0.66 0.66 1.002 1.004
10.00 10.01
Upper phase 0.3 I 0.32 0.692 0.706
Middle phase 0.03 0.03 0.892 0.942 s t so s1.so
Lower phase 0.66 0.65 I .oo I 1.003
10.0 9.99 t
0.32 0.32 0.32 0.33 0.718 0.726 0.734 0.745
(0.03)' 0.948
1.0
(0.65)' 0.68 0.68 0.67 1.000 1.002 0.998 0.998 St.SO st.0 t ' 1
9.99 10.03 10.03 10.00
"8 ml of 0.01 M sodium-2i thyloleate , 5 vel% i-butanol. 0.45 M NaCI, 0.025 kl Na2COj. pH IO. equilibrated w i t h 4 ml alkane, for 60 days a t 31.5 C. 'Gm!ml from weighing accurately measured 50 plitcr samples removed a t 31.5 C. dBased on visual observation of scattered white light: t = Tyndall effect: s t = strong Tyndall effect; o = opalescent; and so = strongly opalescent. 'Values in parenthcses show no meniscus. 'Potentiometrically determined at 31.5 C o n aqueous layer samples, Ag/AgCI internal pH clectrode.
bBased on 12 ml E 1.00.
Table 9.7. Phase behavior of aqueous/ hydrocarbon systems, 0.75 M Na', 0.01 M sodium-2ethyloleate, WOR = 2, buffered", 31.5 C.
Alkane: Heptane Octane Nonane Decane Undecane Dodecane Tridecane Tetrdecane Pentadecane
Upper phase
Rel. volume* 0.33 0.33 (0.31)' 0.31 0.33 0.33 0.32 0.32 0.33 Density' 0.677 0.685 0.705 0.712 0.729 0.737 0.745 0.753 0.756 Appearanced t
Middle phase
Rel. volume Density Appearance
(0.02 )' 0.03 0.02 0.02 (0.02 ) r
0.818 0.873 0.875 0.950 0.954 t 1 st.so stso t .so
Lower phase
Rel. volume 0.67 0.67 0.67 0.66 0.65 0.65 (0.66 )' 0.68 0.67 Density 1.012 1.009 1.015 1.013 1.017 1.016 1.014 1.015 1.016 Appearance S t . 0 St.0 t .o P d 9.90 9.90 9.85 9.89 9.93 9.9 I 9.87 9.89 9.91
"8 ml of 0.01 M sodium-2-e1hyloleate, 5 vo1 % i-butanol. 0.675 M NaCI. 0.0375 M NazCO,. p H 10.0 equilibrated with 4 ml alkane. for 60 days ai31.5 C. 'Grn/ml from weighing accurately measured 50 plitcr samples removed at 31.5 C . dBased on visual observation of scattered white light: t = Tyndall effect; st = strong Tyndall effect: o = opalescent: and so = strongly opalescent. 'Potentiometrically determined at 31.5 C on aqueous layer samples. Ag' AgCI internal pH electrode, after equilibration for 60 days.
*Based on 12 ml e 1.00.
'Values in parenthesis show no meniscus.
94

I I I I I I I I I I I I -
PC
-
-
-
oo 4 5 6 7 8 9 10 11 12 13 14 IS 16
ALKANE CARBON NUMBER
Fig. 9.2. Phase behavior of 0.01 M sodium-2- ethyloleate. Conditions: 5% v/v i-butyl alcohol; average pH 10; 5 mole% NaKO3; WOR = 2; equilibrated with hydrocarbon for 60 days at 21 C. Plotting symbols: m = middle phase present; (m) = questionable middle phase; m" = opalescent middle phase; u" = opalescent upper phase; 1" = opalescent lower phase; 1' = cloudy lower phase; ACN* = position of optimal interfacial tension.
far less near the systems where two curves delineating the three phase region approach each other a t low salinity and low hydrocar- bon carbon number.
Interfacial Tension
Interfacial tensions were measured at 3 1.5 C in the five-sample single-rotational speed spinning drop apparatus, modified as previously discussed for control of tempe- rature in a narrower range. Glass tubes of 0.079 cm I D X 0.245 c m ODX 6 in., supplied by the Wilmad Glass Company were used. They were initially cleaned by rinsing three times with water, soaking for 3 min in dilute chromic acid, rincing again with water, soaking for 3 min in dilute NH40H, rinsing three times with water, soaking overnight in 1 M sodium-EDTA, rinsing three times with
.
drying. Between uses, they were rinsed three times with water, three times with methanol, three times with water, and oven dried. Tubes filled with distilled water were checked for rotational stability at 16.7 msec/ rev. If a sharp focus of the inner glass edge along the whole length of a tube could not be obtained when viewing through the drop-measuring scope, the tube was dis- carded. The tubes were loaded by syringing in approximately 0.3 ml of the lower phase being tested followed by placing a less than 1 p l drop of the upper phase in the center of the tube and topping off with the lower phase. The tubes were capped by red rubber caps obtained from Kimble-Terumo vac- uum-sealed seriological tubes taking special care to avoid introduction of an air bubble. This was facilitated by filling the cap with the lower phase prior t o installation. In our experience, these caps provide the best performance ofallcaps tested. When we had black neoprene rubber caps prepared for us, we found large changes in pH of the aqueous phase in the samples of top vs bottom in the case where most of the buffering surfactant is in the small oil droplet. Evidently the red rubber has very little acid material which can be extracted compared to neoprene rubber. The seal of these caps deteriorates rapidly so they were replaced after every third or fourth use. In general we found pH decreases in the recovered aqueous phase of those samples such as the hexane top vs bottom determination in Fig. 9.3 which summarizes interfacial tension results for systems having unbuffered aqueous phases (those in Tables 9.1 and 9.2). The results for buffered systems in Fig. 9.4 are less susceptible to uncertainties from uptake of atmospheric COZ.
In the course of making the measurements reported in Fig. 9.3, we found yet another factor which contributes to error, especially in the top vs bottom measurements at the
95
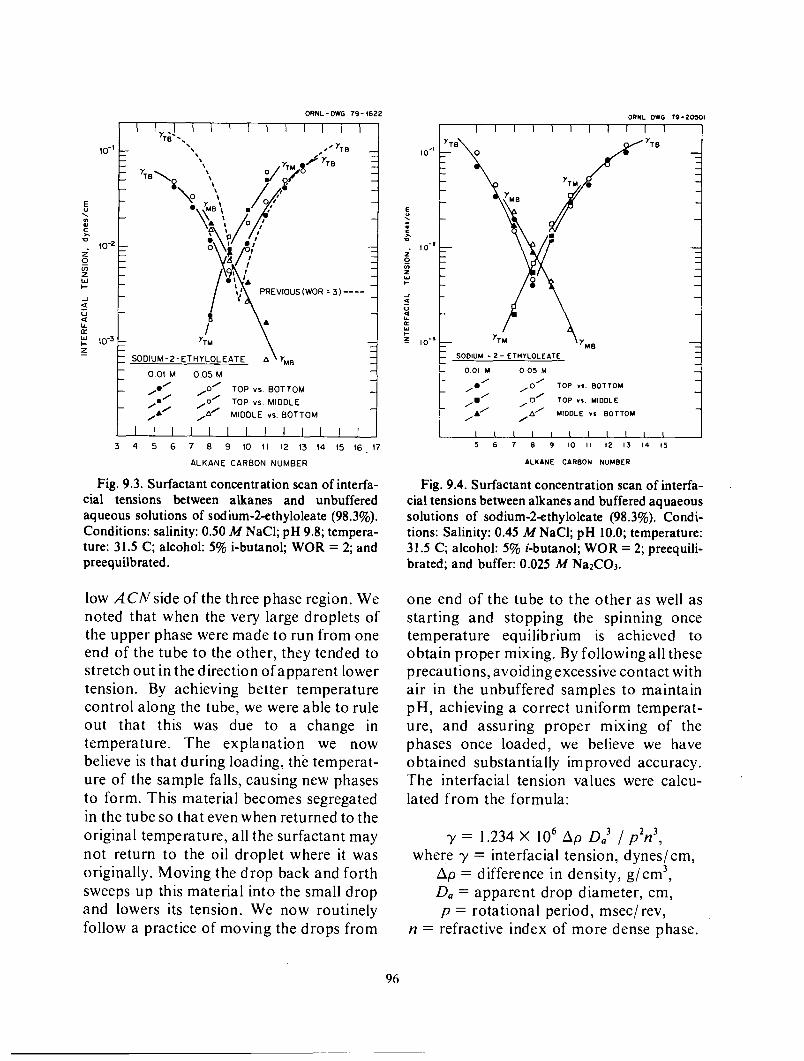
ORNL-DWG 79- I622 ORNL OWG 79-2ox)I
I I I I I I I I I I I I
0.01 M 0.05 M /0° TOP vs. BOTTOM /oO TOP vs. MIDDLE
A/ /A0 MIDDLE vs. BOTTOM
3 4 5 6 7 8 9 IO 1 1 12 13 14 15 16.!7
ALKANE CARBON NUMBER
,o' TOP vu. BOTTOM 1 ::' ,O' TOP Y S . MIDDLE
A' MIDDLE v s . BOTTOM ' A'
5 6 7 8 9 I O I1 12 13 14 I 5
ALKANE CARBON NUMBER
Fig. 9.3. Surfactant concentration scan of interfa- Fig. 9.4. Surfactant concentration scan of interfa- cial tensions between alkanes and unbuffered cial tensions between alkanes and buffered aquaeous aqueous solutions of sodium-2-ethyloleate (98.3%). solutions of sodium-2ethyloleate (98.3%). Condi- Conditions: salinity: 0.50 M NaCl; pH 9.8; tempera- tions: Salinity: 0.45 M NaCI; pH 10.0; temperature: ture: 31.5 C; alcohol: 5% i-butanol; WOR = 2; and 31.5 C; alcohol: 5% i-butanol; WOR= 2; preequili- preequilbrated. brated; and buffer: 0.025 M Na2CO3.
low ACNside of the three phase region. We noted that when the very large droplets of the upper phase were made to run from one end of the tube to the other, they tended to stretch out in the direction ofapparent lower tension. By achieving better temperature control along the tube, we were able to rule out that this was due to a change in temperature. The explanation we now believe is that during loading, the temperat- ure of the sample falls, causing new phases to form. This material becomes segregated in the tube so that even when returned to the original temperature, all the surfactant may not return to the oil droplet where it was originally. Moving the drop back and forth sweeps up this material into the small drop and lowers its tension. We now routinely follow a practice of moving the drops from
one end of the tube to the other as well as starting and stopping the spinning once temperature equilibrium is achieved to obtain proper mixing. By following all these precautions, avoiding excessive contact with air in the unbuffered samples to maintain pH, achieving a correct uniform temperat- ure, and assuring proper mixing of the phases once loaded, we believe we have obtained substantially improved accuracy. The interfacial tension values were calcu- lated from the formula:
y = 1.234 X I O 6 Ap 0: / p2n3, where y = interfacial tension, dynes/cm,
Ap = difference in density, g/cm3, D, = apparent drop diameter, cm, p = rotational period, msec/rev,
n = refractive index of more dense phase.
96
Values are averages of at least two separate tube loadings of two identically prepared hydrocarbon scans. We have reduced the scatter in the drop diameters to +0.001 cm which translates into an error of 5% for those tension values above 5 X dynes/cm and &lo% for the lowest tensions a t 1 X dynes/cm.
In the results for the systems with unbuffered aqueous phases of Fig. 9.3, the minimum tensions, as expected from the phase behavior, occur between octane and undecane. But unlike results for WOR = 3, reported in the April to June 1979 quarterly, the optimum conditions a t this salinity are clearly a t n-nonane where the middle vs bottom and top vs middle curves cross and a t the minimum top vs bottom tension. The optimum conditions for this surfactant produce an overall tension of between 5 and 10 millidyneslcm a t this point between all the phases present. The ultralow tensions of the top vs middle phasesat octane and of the middle vs bottom phases a t undecane may be due to the fact that critical end points where the tension must go to zero are being approached here. This is supported a t least for the latter by the disappearance of the meniscus between the middle and bottom phases and the opalescence seen here. Thus the tension values at n-nonane are more a measure of this surfactant’s ability to produce low tension than are the values at octane and undecane since even a surfactant of marginal surface activity could conceiva- bly cause critical end points where the tension would necessarily approach zero.
These measurements were repeated on identically prepared samples after only 20 days equilibration where the phase bounda- ries had not yet begun to disappear. The top vs middle and middle vs bottom curves were identical to those reported, crossing at n- nonane. However, the top vs bottom curve was displaced to higher ACN. Thus at least
in part, the disagreement of the crossover point and the minimum top vs bottom point in the previous results a t WOR = 3 is corrected by longer equilibration times. But just as before, there is no difference in the magnitude of the tensions o r the position of the minimum with a change in surfactant concentration.
Fig. 9.4 shows the results for the 0.01 M and 0.05 M sodium-2-ethyloleate, 0.50 M Na’ buffered to pH 10.0 with [C03-*] + [ HC03-I equal to 0.025 M , 5 vol % i-butyl alcohol scans vs pentane through tridecane. Here the minimum tensions occur between heptane and decane with optimum condi- tions at n-octane where the tension falls in the range of4 to 8 millid ynes/ cm between all three phases. Again we see that the crossover point of the top vs middle curve and the middle vs bottom curve occurs precisely over the minimum point of the top vs bottom curve. We feel that these data are the best we have obtained so far and are close to the theoretical ideal discussed below.
Widom (1975) has discussed the triangle inequality which applies to the interfacial tensions of three mutually saturated fluid phases in equilibrium: y m u < Y m e d + y m i n .
Although this inequality does not predict which of the pair of phases will exhibit the maximum tension, if we assume as our results show that the top vs bottom tensions are never the maximum tensions then the ideal form of the interfacial tension plots vs salinity o r ACN should show the following form. The top vs middle curve should be tangential to the top vs bottom curve a t the point where the three-phase region ends, i.e. where the middle vs bottom tension goes to zero, at the high A CAT (low optimal salinity) side of the three-phase region. Similarly the middle vs bottom curve should be tangential to the top vs bottomcurve at the point where the middle and top phases become identical, i.e. where the top vs middle tension is zero,
97

a t the low A CAT (high optimal salinity) side of the three-phase region. Both the middle vs bottom and top vs middle curves should then approach zero tension at the point where the other is tangential to the top vs bottom curve and cross over at a point midway between. Although the inequality does not dictate that the top vs bottom values remain below these curves, it does dictate that they never go below the higher of the other two minus the lower. Thevalues in Table 9.8 show that the inequality holds for the data in Fig. 9.4 in the center of the three phase-region and that values approach equality at the edges of this region. In reality, however, considering the 10% scatter in the data, equality is very nearly the rule throughout in accord with “Antonoff‘s rule”.
The buffered scan in Fig. 9.4 shows a shift to lower A CAT of one carbon unit compared to the unbuffered data in Fig. 9.3. This shift was also apparent in the phase studies in Tables 9.1-9.4. If this shift is due solely to the 0.2 difference in pH, then these results are very sensitive to the ratio of free acid to its sodium salt, so much so that carrying out a salinity scan a t constant acidity will be very difficult, since the sodium ion content of the samples will affect both the potentiometric ’
measurements and the equilibrium. An effect of carbonate on the position of the
minima seems thus more likely than such extreme sensitivity t o pH.
Salinity Effects Interfacial tensions between phases of the
system in Tables9.5-9.7 are presented in Fig. 9.5. The reported values are averages of a t least two independent measurements of the width of drops (length: width > 4) after rotation for more than 24 hours a t this temperature. In general after only twelve hours, the drop widths showed no syste- matic change with time. The difference in the two determinations, after following all the precautions listed earlier, was less than 10% for all the tensions reported.
The tensions in Fig. 9.5 for 0.01 M sodium-2-ethyloleate and 5 v /v % i-butyl alcohol a t various salinities and hydrocar- bons across the three-phase region show the same form as those reported earlier for this compound. In particular, the values a t 0.50 M Na’ are very similar to those of Fig. 9.4 for 0.01 M surfactant even though the method of preparing samples (pipetting from stock buffered salt solutions into stock surfactant-alcohol solutions) was different from that used earlier (surfactant-alcohol solutions made to proper salinity and pH in bulk). The optimal tension for sodium-2- ethyloleate, where the sum of the three
Table 9.8. The triangle inequality as applied to the interfacial tensions of 0.01 M and 0.05 M sodium-2+thyloleate, 0.05 M Na’ buffered to pH 10.0,5 % v / v i-butanol vs. n-
alkanes, preequilibrated.
Alkane Y m a x Y m e d Y m i n ( y m e d + y m i n ) Inequality
- Heptane 2.0x 1 o-2 I .8X I 0-2 2.2x10-~ 2.0x Io-2 - Octane I .ox 1 o-2 7.2X I 0-3 4.2X IO-’ I . I X < Nonane 1.6X 1 0-’ 1 .3X I 0-2 4.2X 1 O-’ 1.7X IO-2 < Decane 3.1 X 1 0-2 2.9X10-’ I .5X10-3 3.1 X 1 0-’ - -
98

ORNL DWG 80-318
1 1 1 1 1 1 1 1 1 1 1
r
ORNL DWG 80-318
I 1 1 1 1 1 1 1 1 1 1 1 1
IO" L
[No*]
0 .25 0 .50 E 0 .75
/a' TOP vs. BOTTOM
/A' MIDDLE IS. BOTTOM
,m' TOP vs. MIDDLE
I 1 1 1 1 1 1 1 1 1 1 1 I 4 s s 7 a 9 IO 1 1 12 13 14
ALKANE CARBON NUMBER
Fig. 9.5. Salinity scan of interfacial tensions between alkanes and buffered aqueous solutions of sodium-2ethyloleate (98.3%). Conditions: 0.01 M sodium-2ethyloleate; 5% i-butyl alcohol; pH 10; 31.5 C; preequilibrated; WOR = 2.
tensions between the three phases is mini- mum, occurs at octane in the presence of 0.50 M Na' as reported previously. As expected from the phase behavior summar- ized in Fig. 9.1, increasing the salinity to 0.75 A4 Na' shifts the optimum tension condi- tions to undecane under otherwise identical conditions. Since we are unable to obtain data below pentane for the normal alkanes, the optimal tension condition at 0.25 MNa' is not preciselydetermined but appears to be near pentane. Loci of optimal tensions are plotted in Fig. 9.1, indicated by an asterisk. They are seen to lie on the dotted line which marks the salinity center of the three-phase region. The actual tensions under optimal conditions are seen in Fig. 9.5 to fall toward lower salinity, a suggestion that as the three-
phase region contracts (critical end points move closer together) the tensions for the system taken as a whole become lower.
Phase Behavior of Systems Containing Sodium Oleate having Other
Substituents next to the Carboxylate
By the same general method as described for sodium-2-ethyloleate (see Materials and Methods), we have prepared the 2-methyl; 2-butyl; 2-hexyl; 2 ,2d imethyl; and 2,2-di- ethyl derivatives. We have completed hydro- carbon salinity scans of 0.01 M solutions of all of the above compounds under identical conditions of 5% v/v i-butyl alcohol, WOR = 2, buffered to pH 10, except for temperat- ure, which was 21 C. After 60 days of equilibration, all of these surfactants show regions over which three phases a t equilib- rium are present; many of the systems also have one indistinct meniscus near the edge of the three-phase region. The three-phase regions of all these compounds are similar in shape but shifted to higher molecular weight alkane a t constant salinity and lower salinity a t constant alkane molecular weight with increasing length of the substituent. I t has been pointed out by Wade, et al., (Salager, 1979) that a linear plot results if the alkane of the center of the three-phase region with respect to salinity (ACN*) is plotted vs the log of the salinity (salinity in g/ dl NaC1). To a good approximation this is also the plot of the optimal interfacial tension as demon- strated for sodium-2-ethyloleate. Fig. 9.6 shows the plots obtained in this fashion for all the substituted oleates at 21 C and for sodium-2-ethyloleate and sodium oleate at 3 1.5 C as well. The plot for sodium-2-hexyl- oleate is not shown but is entirely similar and off to the lower right of the figure. Within the experimental error of k0.5 ACN for placement of the boundaries of the three- phase systems, these lines are remarkably parallel a t constant temperature with an
99

ORNL OW6 00-616
I! No* 0 7 - 0 6 - 0 5 -
0 . - - 0 50
-03 - -0. - - 0 5 -
- 0 6 - - - 0 0625
I I I I I I I I I I I I I I I L 0 2 3 4 5 5 I 0 9 1 0 1 1 1 2 ~ 3 1 4 1 5 1 6
OPTlYAL A L K A N E CARBON NUMBER IICN.1
Fig. 9.6. Plots of ACN+ at center salinity of the three-phase region versus log salinity, 0.01 M surfactant; 5% v/v i-butylalcohol; 5 mole % Na~C03; pH 10; WOR = 2; equilibrated with hydrocarbon for 60 days.
average slope ofK =2.303 X0.076=0.175 in In units, similar to the 0. I6 value reported by Wade for alkylbenzene sulfonates (Salager, et al., 1979). Until we have completed our studies of the effect of decreasing the concentration of iso-butyl alcohol on these intercepts, we can not compare our results rigorously with Wade’s o r with each other. However, Wade finds that in the presence of heavier alcohols such a s iso-pentyl alcohol, the addition of 3% sec-butyl alcohol has very little effect on the intercept (< 0.2 ACN). This implies that the correction for sec-butyl alcohol is small; and evidently, from his results, it is the same for the five aromatic sulfonates of differing structure tested. This assumption was employed by Lipow to compare under identical conditions without correcting for 3% sec-butyl alcohol the effect of changes in structure of several surfactants of different types (alkyl sulfonates, sulfates and carboxylates and aromatic sulfonates and carboxylates) on compositions at which optimally low interfacial tensions should be found (Lipow, 1979). Further, in an earlier paper, Wade has presented data which
suggest that above 3% alcohol, the alkane of optimal salinity (ACN*) ceases to shift to higher ACN with increasing alcohol concen- tration and that the shifts of all isomeric butanols are approximately the same (Wade, et al., 1978). Thus to a first approximation, our log S = 0 intercepts uncorrected for 5 v/v% iso-butyl alcohol may be directly comparable with each other and with Lipow.’s data.
The log S = 0 intercepts, uncorrected for 5 v/v% iso-butyl alcohol, for the A CAT* vs log S (S=salinity in g / dl NaCI) plots in Fig. 9.6 for the sodium oleates described above a t 21 C are plotted in Fig. 9.7 vs the number of carbons in the surfactant. For the short alpha-substituents methyl and ethyl, the intercepts follow a general trend toward higher alkane carbon number of the optimal oil with increasing surfactant molecular weight (indicated by the dashed line in Fig. 9.7) parallel to similar trends observed by Lipow when the length of the hydrocarbon tail of the surfactant is increased. However, for substituents longer than butyl, the shift is much greater. This effect is reminiscent of a similar observation of the effect of substitu- ents alpha to the head group on the critical micelle concentration, CMC, of substituted alkyl sulfates of constant main chain length (Klevens, 1953). For short substituents such
ORNL DWG 00-406 26
25
-6 - 4 -2 0 2 4 6 8 IO I 2 14 16 I8 20 22 24 26 28 30 ‘+ s INTERCEPT I T SALINITY * l p m l d l No Cl
Fig. 9.7. Effect of surfactant structure on a / K uncorrected for 5% v/v i-butyl alcohol, 21 C.

as methyl, ethyl or propyl, the CMC is virtually constant with increasing molecular weight; however, around n-butyl in length the CMC begins to increase rapidly with increasing length of the branching chain. Lipow has reported the intercepts of similar plots with log S = 0 for saturated fatty acid soaps uncorrected for 3% sec-butyl alcohol. Extrapolation to a n alkyl chain length of 18 to compare with sodium oleate predicts an intercept of -12.5 for sodium octadecanoate. Thus the cis double bond in sodium oleate shifts this surfactant’s optimum (three- phase) conditions by more than +10 ACN units, probably much larger than the error from our assumed equality in correction for 3% sec-butyl alcohol compared to 5% iso- butyl alcohol. In fact, the intercepts in Fig. 9.7 are all more similar to those obtained with the substituted aromatic sulfonates and carboxylates than to those obtained with the
saturated alkyl carboxylates, sulfates or sulfonates (Lipow, 1979). The other import- ant observation in Fig. 9.7 is that the effect of increasing molecular weight in the tertiary series (disubstitution on the alpha carbon) is clearly different than in the secondary series. Thus sodium-2,2- diethyloleate has a three-phase region that is far less shifted to high alkane carbon number oils than is sod ium-2-butyloleate, both referred to the unsubstituted sodium oleate under otherwise identical conditions.
The identification of high salinity condi- tions under which sodium oleate has three phases in equilibrium implies that low interfacial tension may be achievable with sodium oleate itself under appropriate conditions, outside the range reported in the previous summary report (BETC-W26-4). Tests confirming this are discussed in Chapter 10.
101

10. Interfacial Tension and Phase Behavior of Tall Oil Components
SODIUM OLEATE
We discussed in the previous chapter that a t the time of the last summary report (Baldwin et a1 1979) we had not identified conditions under which either sodium oleate o r crude tall oil fatty acids salts produced ultralow aqueous-hydrocarbon interfacial tensions. Tall oil pitch is however reported to effect good oil recovery in core floods (Reisberg 1967 and Chiu 1974, 1975, and 1978). This fact, plus the phase behavior discussed in connection with Fig. 9.6, suggested that we should reexamine sodium oleate over a wider range of conditions.
Tables 10.1 to 10.4 summarize observa- tions of phase volumes of systems comprised initially of one volume of hydrocarbon to two volumes of aqueous 0.01 M sodium oleate (99% pure), 5% v /v i-butanol, and NaCl plus sodium carbonate buffer contri- buting 10% of the Na' of the inorganic salts. The aqueous buffer is the same as used in
buffered experiments in Chapter 9, but the pH of the aqueous phase after equilibration was on the average 9.8, in comparison with about 10 for the systems containing the substituted sodium oleates. The difference may reflect a lower partition coefficient for oleic acid than for the others; less extraction into the organic phase would be reflected in a lowering of the apparent p L .
Fig. 10.1 maps the regions of salinity and hydrocarbon number where three phases are observed. It is clear that interfacial tensions vs undecane a t this alcohol concentration reported in Table IV of Baldwin et a1 1979 a t 0.1 M NaCl would be outside the range of low tension. It is not so obvious why lower tensions were not seen in the experiments reported in Fig. 1 1 of the April 1977 to April 1978 annual report (BETC/ W26-4), for which the aqueous phase was 0.5 MNaCl .
Interfacial tensions measured between the phases of the systems in Tables 10.1 to 10.4 are presented in Fig. 10.2. Values of less than
Table 10.1. Phase behavior of aqueous/hydrocarbon systems, 0.25 M Na', 0.01 M sodium oleate, WOR = 2, buffered", 31.5 C.
~
Alkane: Pentane Hexane Heptane Octane Nonane Decane Undecane Dodecane Tridecane
Upper phase
Rel. volumeb 0.32 0.32 0.33 0.33 0.33 0.33 0.33 0.33 0.33 Density' 0.628 0.645 0.670 0.695 0.710 0.723 0.734 0.738 0.740
No middle phase observed
Lower phase
Rel. volume 0.68 0.68 0.67 0.67 0.67 0.67 0.67 0.67 0.67 Density 1.001 1.003 0.996 0.998 0.994 1.000 1.001 0.996 0.999 P H d 9.8 I 9.80 9.85 9.80 9.82 9.80 9.8 I 9.78 9.83
"8 ml of 0.01 M sodium oleate. 5 vol % i-butanol, 0.225 M NaCI. 0.0125 M Na2CO3, pH 10.0. equilibrated with 4 ml %m/ml from weighing accurately measured 50 plitcr samples
dPotentiometrically determined at 31.5 C on aqueous layer samples. Ag/AgCI internal pH alkane, for 60 days at 31.5 C. removed at 31.5 C. electrode.
*Based on 12 ml e 1.00.
I02
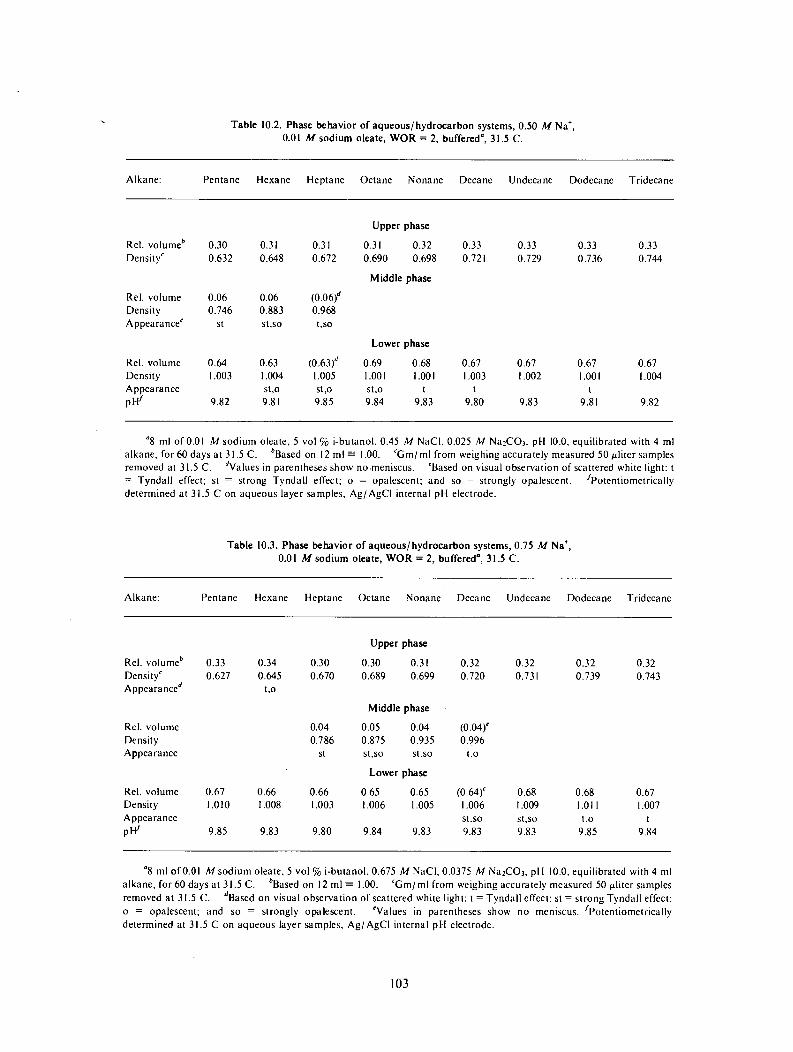
Table 10.2. Phase behavior of aqueous/hydrocarbon systems, 0.50 M Na', 0.01 M sodium oleate, WOR = 2, buffered", 31.5 C.
Alkane: Pentane Hexane Heptane Octane Nonane Decane Undecane Dodecane Tridecane
Rel. volumeb 0.30 Density' 0.632
Rel. volume 0.06 Density 0.746 Appearancee SI
Rel. volume 0.64 Density 1.003 Appearance P H' 9.82
0.31 0.648
0.06 0.883 S t S O
0.63 1.004 St,O
9.8 1
0.3 I 0.672
(0.06)d 0.968 t,SO
(0.63)d 1.005 St,O 9.85
Upper phase
0.3 I 0.32 0.33 0.33 0.33 0.33 0.690 0.698 0.721 0.729 0.736 0.744
Middle phase
Lower phase
0.69 0.68 0.67 0.67 0.67 0.67 1.001 1.001 1.003 1.002 1.001 1.004 St.0 t t 1
9.84 9.83 9.80 9.83 9.81 9.82
"8 ml of 0.01 M sodium oleate, 5 vol '?b i-butanol, 0.45 M NaCI. 0.025 M Na2C01, pH 10.0. equilibrated with 4 ml %m/ml from weighing accurately measured 50 pliter samples
'Based on visual observation of scattered white light: t /Potentiometrically
alkane, for 60 days at 31.5 C. removed at 31.5 C. = Tyndall effect; st = strong Tyndall effect; o = opalescent; and so = strongly opalesccnt. determined at 31.5 C on aqueous layer samples, Ag/AgCI internal pH electrode.
bBased on 12 ml E 1.00. %slues in parentheses show no.meniscus.
Table 10.3. Phase behavior of aqueous/ hydrocarbon systems, 0.75 M Na', 0.01 M sodium oleate, WOR = 2, buffered", 31.5 C.
Alkane: Pentane Hexane Heptane Octane Nonane Decane Undecane Dodecane Tridecane
Rel. volumeb 0.33 Density' 0.627 Appearanced
Rel. volume Density Appearance
Rel. volume 0.67 Density 1.010 Appearance Pt t ' 9.85
0.34 0.30 0.645 0.670
1.0
0.04 0.786
SI
0.66 0.66 1.008 1.003
9.83 9.80
Upper phase
0.30 0.31 0.689 0.699
Middle phase
0.05 0.04 0.875 0.935 St.SO s1,so
Lower phase
0.65 0.65 1.006 1.005
9.84 9.83
0.32 0.32 0.32 0.32 0.720 0.731 0.739 0.743
(0.04)' 0.996
t,O
(0.64)' 0.68 0.68 0.67 1.006 1.009 1.01 I I .007 s1.so s1.so t .o t 9.83 9.83 9.85 9.84
"8 ml of 0.01 M sodium oleate, 5 vol % i-butanol. 0.675 M NaCI. 0.0375 M Na2C03, pH 10.0. equilibrated with 4 ml 'Gm/ml from weighing accurately measured 50 pliter samples
dBased on visual observation of scattered white light: t = Tyndall effect; SI = strong Tyndall effect: 'Values in parentheses show no meniscus. /Potentiometrically
alkane, for 60 days at 31.5 C. removed at 31.5 C. o = opalescent; and so = strongly opalescent. determined at 31.5 C on aqueous layer samples, Ag/AgCI internal pH electrode.
bBased on 12 m l ~ 1.00.
I03

Table 10.4. Phase behavior of aqueous/hydrocarbon systems, 1.00 M Na', 0.01 M sodium oleate, WOR = 2, buffered", 31.5 C .
ORNL OWG 80-3IIP2
-
-
-
-
I I I I I I I I I I J I I I 4 5 6 7 8 9 IO I I 12 13 14 15 16
Alkane: Hexane Heptane Octane Nonrtne Decane Undecane Dodecane l'ridecane 'I'etradecnne
10-1 E . I " * D
z m 0 6 1 0 - 2 I-
J
V
LL (L W I-
a
5. 10-3
Upper phase
Rel. volumeb 0.33 0.34 (0.31)' 0.31 0.3 I 0.32 0.32 0.32 0.33
Appearance' t Densityd 0.660 0.682 0.703 0.715 0.729 0.737 0.755 0.755 0.762
Middle phase
ORNL OWG 80-1474
L 1 1 1 1 i l 1 1 1 1 1 - 3 - - - - - - - - - - - -
r - - - - - - - - - - - - - -
- -
- - - - - - - - - - - - - - - -
= - - - - - - - - - - - - - 1 -
0 2 5 E 0 5 0 M 075M 1 . 0 0 M - p' p'- ,,e*; ,Y TOP^^ BOTTOM- -
I TOP vs MIDDLE 5 5 :;A*' 5 MIDDLE rsBJTTOM
1 1 1 1 1 1 1 1 1 1 1
4 5 6 7 8 9 10 I 1 12 13 14
Rel. volume Density Appearance
(0.03)" 0.03 0.04 0.04 (0.03)' 0.832 0.838 0.879 0.938 1.000
S t ,o S t . 0 S t . 0 S t .o IS0
Lower phase
Rel. volume 0.67 0.66 0.66 0.66 0.65 0.64 (0.64) 0.68 0.67 Density 1.020 1.018 1.021 I .023 1.021 I .025 1.022 1.020 1.024 Appearance St.0 1.0 t P d 9.85 9.83 9.83 9.84 9.85 9.84 9.82 9.84 9.84
. _ "8 ml of 0.01 M sodium oleate. 5 vol '%J i-butanol. 0.90 IM NaCI, 0.05 hf NaKO,. pH 10.0 equilibratcd with 4 ml alkane. for 60
1.00. dGnl/ml from weighing accurately measured 50 'Based on visual observation of scattered white light: t = Tyndall effect; st = strong Tyndall effect:
'Potentiometrically determined at 31.5 C on aqueous layer samples. Ag!AgCI internal
days at 31.5 C . bBased on 12 ml pliter samples removed at 31.5 C. o = opalescent; and so = strongly opalescent. pH electrode. after equilibration for 60 days.
'Values in parenthesis show no meniscus.
1 0.25
//e-
P
I04

a millidyne/cm are obtained between adjacent phases, although the minima for top vs bottom phasesappear to be between 3 and 5 millidyne/cm. As the correlation of phase behavior in Fig. 9.6 predicts, the ACN of minimum tension is less a t the same compositions for sodium oleate systems than for alkyl-substituted oleates. The position of optimal interfacial tensions falls near the salinity center of Fig. 10.1. The three-phase region for sodium oleate is broader than for sodium 2-ethyl oleate.
I
TALL OIL The low interfacial tensions obtained with
sodium oleate prompted us to take another look a t neutralized crude tall oil, which is usually about a quarter sodium oleate, along with salts of other fatty and rosin acids
I I I I I I I I I I I
ORNL-DWG 80-1030R
5 -
- ' 4 -
< k
a
D
b
J
ln
2 -
1 -
- M N O +
1 1.00
- 0.75
5 0.50
- 0 . 2 5
- - b [ N O '1 Y"0 - - 71" - 0.50 M 0 7 5 & 1.00 M -
- /- ,/ ,d- TOP VI BOTTOM 7 *.** / TOP VI MIDDLE - 5 :-A*' ,d MIDDLE VI BOTTOM -
1 1 1 1 1 1 1 l I I I
I I I I I I I I I I I I I
4 5 6 7 8 9 10 1 1 12 13 (4 45
A L K A N E C A R B O N N U M B E R
Fig. 10.3. Phase behavior of 0.28% w/w neutral- ized tall oil. Conditions:5% v/v i-butyl alcohol; average pH 9.63; buffered with 5 mole ?6 NaZCO- 3;WOR = 2; equilibrated with hydrocarbons for 120 days at 31.5 C.Plotting symbols: m = middle phase present; m" = opalescent middle phase;l" = opalescent lower phase; * = position of optimum interfacial tension.
(Arizona Chemical Company 1976). Fig. 10.3 maps the two and three phase regions of systems containing tall oil. Low tensions were also attained with this material (Fig. 10.4) at salinities and alkane carbon numbers representative of many reservoirs. It is perhaps of interest that the optimal hydrocarbon for 1% salinity is estimated to be -0.5, very similar to that for pure sodium oleate, -1.2.
ORNL OWG 80-620
c I I I I I I I I I I I
SULFONATED TALL OILS
We are also interested in pursuing other directions which might lead to a commer- cially feasible surfactant from tall oil acids capable of effecting ultralow interfacial tensions. A cheap class of surfactant materials commercially available from tall oils are those from direct sulfonation of the
I05

unsaturation with SO3 (Rueggeberg and Sauls 1956). These poorly characterized materials containing roughly equal amounts of molecules such as those numbered 1 to 4 below have, however, found very little use as surfactants and are employed mainly as wetting agents. I t may be that unfavorable properties partly arise from the fact that they contain two widely separated hydro- philic head groups and only relatively short hydrophobic tails. If the carboxylic acid could be transformed by amidation, hydro- lysis resistant materials with one head group and two symmetrically disposed hydrocar- bon tails might have relatively low interfa- cial tensions (Stirton et a1 1962).
We have investigated the direct sulfona- tion of oleamide with S 0 3 d ioxane and so3-
d isod ium-10-sulfoole ic acid
I
disodium-9-hydroxy- I 0-sulfostearic acid
2
oleic acid
tributylphosphate complexes (Turbak and Livingston 1963). With the S03-dioxane complex, the amide cleaves during sulfona- tion and the reaction product contains roughly equal amounts of isomers of 1 and 2 and their corresponding amides. However, with the SO3-tributylphosphate complex, no amide cleavage occurs, and the product contains only unsaturated amide 5 (R=H) in greater than 90% yield. This result is particularly pleasing not only because it allows preparation of a new surfactant type but also because i t avoids formation of the relatively water insoluble hydroxysulfonate.
We have prepared several sulfonated derivates but have not yet evaluated them.
d isod ium-9-sulfoabietic acid
3
HO
disodium-7-hydroxy-9-sulfo-7,9-dihyd roabietic acid
4
(C'H 2)7COS H K /
oleam ide
SO3
tr i butylphosphatr -
sod ium-l 0-sulfoleamide 5
I06

1 I . Phase Behavior in Multicomponent Systems Containing Tall Oil Ethoxylates and Related Surfactants
The use of tall oil derivatives in enhanced oil recovery is attractive because these surfactants have hydrocarbon chains which are natural products from a renewable resource, namely trees. We have surveyed the experimental conditions necessary for the production of three liquid phases in multicomponent systems containing these surfactants along with a hydrocarbon, aqueous NaCl, and a cosurfactant. The surfactants employed are listed in Table 11.1. Because of the time demands on our spinning drop interfacial tensiometers, relatively few IFT’s have been measured for these systems. However, tensions in the millidynel cm range have been observed between the phases for the systems contain- ing Trydet OA-7. 8
Table 1 I .2 lists the salinity dependence of the phase behavior of systems containing these surfactants. The experimental condi- tions were as follows: a water to oil ratio, WOR, of one was used, and all NaCl
concentrations are based on the volume of the initial aqueous dispersion used. Surfact- ant and cosurfactant amounts are 2.62%v/v and 3.92% v /v respectively, expressed relative to the volume of the entire system. All observations were made at ambient temperature, 22 C.
The two ethoxylated tall oils (Ethofat 242125 and Renex 20) have too high an ethylene oxide, EO, content to produce three phase behavior for salinities or aliphatic hydrocarbons likely to be of interest in enhanced oil recovery. However, ethoxylated fatty acids of several EO contents are available; oleic acid in particu- lar is a prominent fatty acid constituent of tall oil. Comparing the phase behavior of OA-7 with 0-20, SA-7 with SA-8 or ISA-4 with ISA-9, one sees that increasing hydro- phile-lipophile balance, H L B (or EO con- tent), causes an increase in the salinity needed to effect the 2 t - 3 - 2’ transitions. This agrees with the work of the Texas
Table 11.1. Tall oil ethoxylates and related compounds, RCO(OCH2CH2),OH.
Surfactant Supplier n H L L P R group
Ethofat 2421 25 Renex 20 Trydet OA-7 Ethofat 0-20 Trydet SA-7 Trydet SA-8 Tryd et 1 SA-4 Trydet ISA-9 Trylox 1086’
Armak IC1 Americas
Emery Armak Emery Emery Emery Emery Emery
15 > I O
7 I O 7 8 4 9
13.9 13.8 10.2 12.1 10.6 1 1 . 1 7.7
11.7 10.2
Tall oil moieties Tall oil moieties
CH~(CHZ),CH CH(CHz)?- CH3(CH2)7CH CH(CH2)7-
c H 3( c H 2 ) ~ -
CHdCHz)i6- Isostearic lsostearic
CH3(CH2)7CH CH(CHz),-
“HLB=hydrophile-lipophile balance; all values from suppliers except Ethofat 242125 and Ethofat 0/20. where HLB = (% ethylene oxide w/w)/5 was used. ‘An ethoxylated sorbitol hexaoleate.
I07
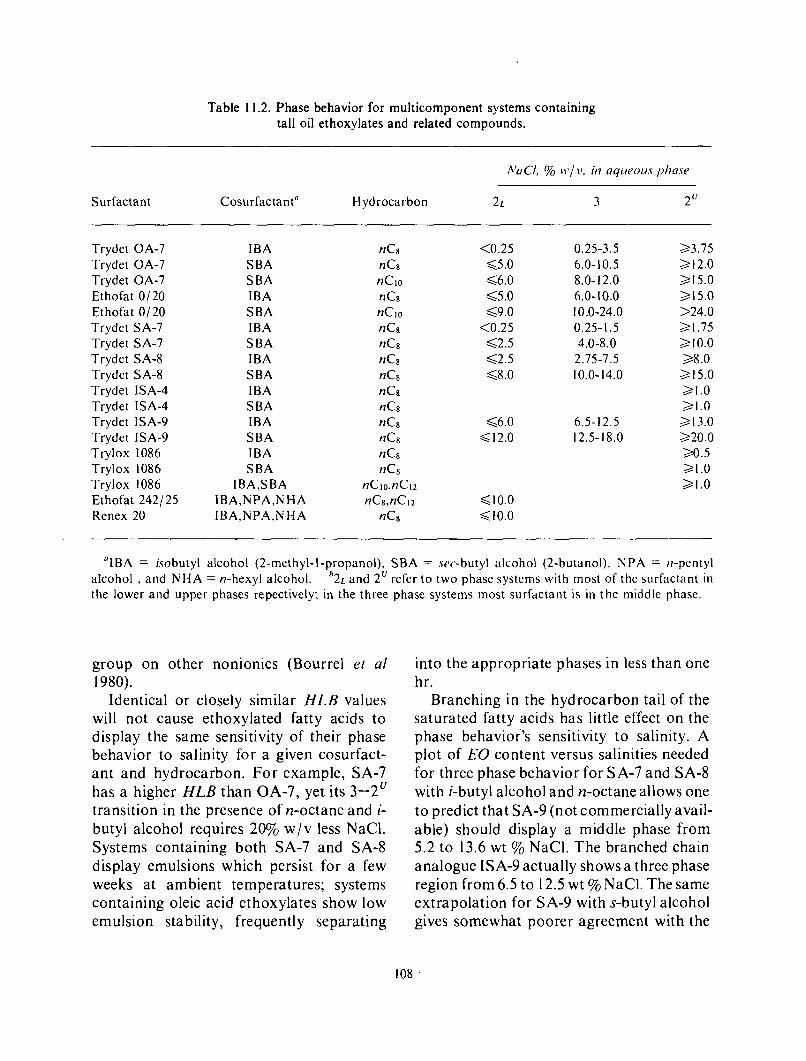
Table 1 1.2. Phase behavior for multicomponent systems containing tall oil ethoxylates and related compounds.
A'uCI, % i i . /v, in uqireoits pliuse
Surfactant Cosurfactant" Hydrocarbon 2L 3 2u
Trydet OA-7 IBA Trydet OA-7 SBA Trydet OA-7 SBA Ethofat 01 20 IBA Ethofat 01 20 SBA Trydet SA-7 IBA Trydet S A-7 SBA Trydet SA-8 I BA Tryd et S A-8 S BA Trydet ISA-4 IBA Trydet 1 SA-4 SBA Trydet ISA-9 IBA Trydet 1SA-9 SBA Trylox 1086 IBA Trylox 1086 S BA Trylox 1086 IBA,SBA Ethofat 2421 25 IBA,NPA,NHA Renex 20 IBA,NPA,N HA
nCe n G nClo nCs nClo nCs nCs nCs nCs nCs nCs nCs n G nCs nCs
nClo,nClz nCs,nC~z
nCs
c0.25 65 .0 66 .0 65 .0 G9.0
<0.25 G2.5 62 .5 G8.0
6 6 . 0 G 12.0
G10.0 G 10.0
0.25-3.5 6.0- IO. 5 8.0- 12.0 6.0-10.0 10.0-24.0 0.25- 1.5 4.0-8.0 2.75-7.5 10.0- 14.0
6.5- I 2.5 12.5- 18.0
23.75 2 12.0 215.0 215.0 >24.0 21.75 2 10.0 28.0 2 15.0 21 .o 31.0 213.0 220.0 20.5 21 .o 21 .o
"IBA = isobutyl alcohol (2-methyl-l-propanol), SBA = sec-butyl alcohol (2-butanol), N P A = n-pentyl b 2 ~ and 2" refer to two phase systems with most of the surfactant in alcohol , and NHA = n-hexyl alcohol.
the lower and upper phases repectively; in the three phase systems most surfactant is in the middle phase.
group on other nonionics (Bourrel et a1 1980).
Identical or closely similar HLB values will not cause ethoxylated fatty acids to display the same sensitivity of their phase behavior to salinity for a given cosurfact- ant and hydrocarbon. For example, SA-7 has a higher HLB than OA-7, yet its 3-2' transition in the presence of n-octane and i- butyl alcohol requires 20% w / v less NaC1. Systems containing both SA-7 and SA-8 display emulsions which persist for a few weeks at ambient temperatures; systems containing oleic acid ethoxylates show low emulsion stability, frequently separating
into the appropriate phases in less than one hr.
Branching in the hydrocarbon tail of the saturated fatty acids has little effect on the phase behavior's sensitivity to salinity. A plot of EO content versus salinities needed for three phase behavior for SA-7 and SA-8 with i-butyl alcohol and n-octane allows one to predict that SA-9 (not commercially avail- able) should display a middle phase from 5.2 to 13.6 wt % NaCl. The branched chain analogue ISA-9 actually shows a three phase region from 6.5 to 12.5 wt % NaCl. The same extrapolation for SA-9 with s-butyl alcohol gives somewhat poorer agreement with the
I08

experimental data for ISA-9 and that cosurfactant. ISA-9 does differ from the straight chain surfactant in the absence of persistent emulsions in multicomponent systems containing it.
A large change in surfactant structure at constant HLB does cause a dramatic shift in the salinities needed for three phase behav- ior. Thus Trylox 1086, although it has the same HLBas Trydet OA-7, partitions much
more readily into the hydrocarbon phase with increasing salinities.
Trydet OA-7 and Ethofat 0-20 have been selected for further investigation in systems containing a petroleum sulfonate; progress in that area is described below.
We are currently investigating the effect of varying the cosurfactant/ surfactant ratio on the phase behavior of systems containing Trydet OA-7 and Ethofat 0-20.
I09

12. Mixtures of Ethoxylated Tall Oils and Petrostep 465
1 1 1 1 ~ ' " ' ~ - - ~ - - - -
H - - - -
- - - -
I I I I I I I I I I
Nonionic surfactant or ethoxylated an- ionic surfactants may be used to increase the salinity tolerance of commercial petroleum sulfonates which have been evaluated for use in enhanced oil recovery (Bansal and Shah 1978 and Salager et alI979). We have selected Petrostep 465 as a representative petroleum sulfonate because of its high equivalent weight and solubility in hydro- carbons. This surfactant was used as received from Stepan; it contains 61.2% actives, 13.1% free oil, 22.9% H20 and 2.8% inorganic salts.
Phase behavior and interfacial tensions, I F T s , have been determined for systems containing as surfactant(s) Petrostep 465 alone or in combination with Trydet OA-7 or Ethofat 0-20. Cosurfactants were 2- methyl-I-propanol (i-butyl alcohol) or 2- butanol; hydrocarbons were n-octane or n- decane. Compositions are given in the legends of Figs. 12.1-6. Percentages for the surfactants and cosurfactants refer to an
1.0
z 0 0
L LL 0.5
f W
0
O W L OW6 79-1731
3 1 0.5 t.0 2.0 3.0 4.0
NaCI wl Y
Fig. 12.2. Variation of volume fraction with salinity. Surfactant: Petrostep 465 (3.1 % w/v) and Trydet OA-7 (2.1% w/v); alcohol: 2-methyl-l- propanol (2.0% w/v); hydrocarbon n-octane; and initial water/ oil ratio 1 : 1.
1.0
2 0 0
R LL 0 . 5
a! -I
o>
I I I I I I I I 1 .o 3.0 5.0
NoCl. w l X
Fig. 12.3. Variation of volume fraction with salinity. Surfactant: Petrostep 465 (2.8% w/v) and Ethofat 0/20 (2.4% w/v); alcohol: 2-methyl-l- propanol (2.0% w/v); hydrocarbon: n-octane; and initial water/oil ratio 1: 1.
initial aqueous dispersion of them. Five ml of this dispersion was then contacted with an appropriate amount of solid NaCl, followed by 5 ml of the appropriate hydrocarbon. Weight percentages of the surfactant in the anionic/nonionic cases were chosen to keep the mole fraction of anionic surfactant in the mixture constant at 0.53.
I10

ORNL DWQ ?9-1?13 1.0
5.0 10.0 15.0
NoCl. w l X
Fig. 12.4. Variation of volume fraction with salinity. Surfactant: Petrostep 465 (5.2% w/v); alcohol: 2-butanol (2.1% w/ v); hydrocarbon: n- decane and initial water/ oil ratio: 1: 1.
ORNL DWG 79-1737
' . O 3
5.0 0.0 (0.0
NoCI. w t %
Fig. 12.5. Variation of volume fraction with salinity. Surfactant: Petrostep 465 (3.2% w/v) and Trydet OA-7 (2.1% w/v); alcohol: 2-butanol (2.0% w/ v); hydrocarbon: n-decane; and initial water/ oil ratio: 1:l.
Figs. 12.1 and 12.4 depict the phase volume behavior for Petrostep 465 without any nonionic surfactant present. Regions designated A refer to the aqueous (lower) phase; S refers to the surfactant-rich phase, which may be the lower (aqueous), middle
2 0 0
K Y
0.50
I 3
4 t I ' b . 1
NoCl. w9 %
Fig. 12.6. Variation of volume fraction with salinity. Surfactant: Petrostep 465 (2.8% w/v) and Ethofat 0/20 (2.3% w/v); alcohol: 2-butanol (2.0% w/v); hydrocarbon ndecane; and initial waterloil ratio: 1:l.
or upper (hydrocarbon) phase; H refers to the hydrocarbon (upper) phase. In both these Petrostep - only systems, there is apparently a small middle phase out to very high salinities. However, our recent work indicates that the long salient in fact is due to a macro- rather than a microemulsion. Systems having salinities out in the salient may be induced to undergo a 3 - 2" transition in phase behavior by being shaken for several days on a reciprocating action shaker. The optimal salinities reported below support this interpretation.
Both Trydet OA-7 and Ethofat 0-20 extend the salinity range for observation of three liquid phases for Petrostep 465. Thus OA-7 in the system containing 2-methyI-l- propanol and n-octane (Fig. 12.1) moves the 3 - 2"transition to 2.4% NaCl; Ethofat 0-20 moves it to 6.5% NaCl. With only Petrostep 465 present we put the 3 - 2"transition at ca 2.2% NaCl. In all systems investigated, Petrostep 465 dominates the salinity at which the 2 t - 3 transition occurs. Ethofat 0-20 is more effective than Trydet OA-7 at increasing the salinity where the 3 - 2"

transition is observed. This is consistent with the higher ethylene oxide content and hence greater hydrophilicity of Ethofat 0-20.
As noted by Flemingand Vinatieri (l979), the shaFe of the phase volume diagrams in the neighborhood of critical end points indicate how close the system passes to those end points. For the mixed anionic/ nonionic systems in n-decane, Ethofat 0-20 markedly increases the sharpness of the 3 - 2’ transition with changing NaCl (Fig. 12.6). With both Ethofat 0-20 and Trydet OA-7 (Fig. 12.5) the system passes quite near the microemulsion - oilcritical end point (3 - 2’ transition) as well. In the systems having n-
octane as the hydrocarbon, the transitions with respect to changes in salinity are much more gradual.
Interfacial tension measurements for the systems in Figs. 12.1-6 were made a t 32 C on a Texas spinning drop interfacial tensiome- ter. The samples were in all cases held for several weeks at 32 C in a constant temperature bath prior to the IFT determi- nations. Optimal salinities and the corre- sponding I F 7 3 (point where ym-o = yrn-,,,) are tabulated in Table 12.1. The nonionic surfactants are effective at increasing salin- ity tolerance without much effect (either raising or lowering) on the IF73.
Table 12. I . Optimal salinities and interfacial tensions for systems containing Petrostep 465 and ethoxylated tall oils
System Nonionic Hydro- I FT. ol Surfactant carbon dynes / cm
Fig. 12.1 None ,?-octane N ’ A Fig. 12.2 O h - 7 ri-octane 3.0 x IO-’ Fig. 12.3 o/ 20 ri-octane 4 . 1 x IO-’ Fig. 12.4 None wdecane 4.7 X IO-’ Fig. 12.5 OA-7 fi-decane 3.0 X IO-’ Fig. 12.6 0 /20 u-dccnne 3.9 x IO-’
“W I\!%. inital aqueous phase.
Opt iniii I salinity“
1 . 1 I .3 I .9 2.7 4.0 5.7
I12

13. Aggregation Properties of Branched Chain Sodium Alkvlbenzenesulfonates in Water
-I
There is currently disagreement among the several groups of investigators working with the surfactant Texas No. 1 [sodium p - (1 -heptylnonyl)benzenesulfonate] as to whether it displays a critical micelle concen- tration, C. M . C., in aqueous solution (Franses et a/ 1980, Benton et a/ 1980, Wade et a/ 1978, and Shah et a/ 1978). This question is interesting not only as it relates to the influence of surfactant aggregation on the generation of ultralow interfacial ten- sions, but also from the point of view of theoretical predictions on the effects of surfactant molecular structure on aggrega- tion properties. Thus several series of surfactants with two long hydrocarbon tails (sulfosuccinate esters, lecithins, unsymmet- rical tetraalkylammonium salts) are known to show lamellar liquid crystals, rather than micelles, as the first aggregated structure in water, provided the hydrocarbon tails are sufficiently long. Franses et a/( 1980) believe that Texas No. 1 has alkyl tails of sufficient length to preclude micellar behavior in aqueous solutions. However, using literat- ure data for shorter homologues enables one to predict a C. M . C. for Texas No. 1 below the concentration at which lamellar liquid crystals first form.
Because the solubility of Texas No. 1 is very sensitive to Na' concentration, we have performed conductivity measurements us- ing solutions prepared in glass and in plastic containers. The plastic is a linear polyethy- lene having a residual sodium content of 5.4 X g per bottle; it contains no plasticizer which may be solubilized by the surfactant. Solution resistances were measured used an RC conductivity bridge at 1 kHz and cells having constants of 0.6495 or 0.7613. The resulting specific conductivities, measured at 45 C, are plotted in Fig. 13. I . There are
20
48
46
44
(2 f > E 40
Q
0,
0 c
In-
K
8 I
J I J
6 -
4
2
0
ORNL-DWC 8 0 - 2 2 9
8 0 PREPARED
0 PREPARED
IN
I N
GLASS
PL ASTl C
0 5 IO 45 20
SURFACTANT, mol/ kg x 404
Fig. 13.1. Conductivities of solutions of sodium p( 1-heptylnony1)benzene sulfonate (Texas No. 1, purified sample) in water a t 45 C.
breaks in both plots at concentration quite close to the predicted value. Using Evans' (1956) technique, the percent counterion binding to the aggregates may be derived from the slope of the plot above and below the break point. For the samples prepared in plastic containers, 27% of the counterions
I I3

are bound. The value would be quite low for micellar aggregates, unless their aggregation numbers are small. In fact, Evans sees conductivity behavior very similar to that displayed by Texas No. 1 for the surfactant sodium 8-hexadecylsulfate. Its aggregate number is 13.
Extension of the conductivity measure- ments beyond the solubility limit for Texas No. 1 (Franses 1980) gives rise to a second break in the specific conductivity versus concentration plot a t 2.4 X M (see Fig. 13.2). The slope of the plot above the break is 0.0627, which indicates substantial Na’ dissociation from whatever aggregates (presumably bits of dispersed lamellar liquid crystalline surfactant) are present. Our break is substantially lower than the literature solubility limit, but it is clearly separated from the first break at 8.25 X M. We are surprised by the large value of the line’s slope above the second break.
The Texas No. 1 used in these studies was synthesized by the Texasgroup (Wade 1978) and purified further at Minnesota to remove NaCl and Na2C03 (private communication from C. Pesheck). The surfactant is desig- nated Texas No. 1 BP2 by the Minnesota group (Franses 1980); it may contain some organic impurities. Accordingly, we have obtained another sample of Texas No. 1 from W. J. Benton of Carnegie-Mellon. This material has been purified by chromatogra- phy on Sephadex LH-20.
Studies on two other alkylbenzenesulfo- nates are currently in progress. They are sodium p-( 1-propylnony1)- and sodium p -
3 5
3 0
2 5 E s 0
r E 2 0
0
0,
m
X
15 I J I J Y
10
5
ORNL-DWG 80-232
I I I I
C 0 1 2 3 4 5
SURFACTANT, mol/ kg x to3
Fig. 13.2. Conductivities of solution of sodiump( 1- heptylnony1)benzene sulfonate (Texas No. 1, purified sample) in water at 45 C; .prepared in plastic.
(1 -pentylheptyl)benzenesulfonates. The for- mer surfactant was purchased from the Texas group and purified by a desalting procedure followed by column chromatog- raphy to remove two yellow oily impurities. The latter sample was obtained in analyti- cally pure form.
I14

14. Sacrificial Agents
There is increasing recognition (for example, see Kuuskraa 1980) that a major problem in enhanced oil recovery by chemical flooding is the loss of active substances by adsorption on formation minerals. Not onlyare the required amounts increased, but changes in composition of the injected banks may change properties from those optimal for oil recovery. This is particularly true of surfactants, for which not only the concentration but likely also the equivalent weight may vary as components are selectively removed in passage through the formation (Gale and Sandvik 1973). Optimal phase and interfacial tension properties frequently are found only in a narrow range of compositions, and diffi- culty of the control of the flood for good performance, as well as its cost, is therefore increased when chemicals are lost by adsorption or by formation of precipitates with ions present in brines or displaced from minerals. Losses can be severe and may be higher in the field than projected from laboratory work. In the Phillips field pilot in the North Burbank unit, only about 0.5% of injected surfactant has been found in produced fluids, in comparison with about 9% of the alcohol and 13% of the polymer. Surfactant loss is almost three times that predicted from laboratory results (Glins- mann et a1 1980).
Substances which preferentially adsorb on minerals and thus reduce adsorption of active chemicals are therefore of interest. Competitive adsorbates should be cheaper than the chemicals they save, should be available in large quantities, and should not interfere with oil-mobilization properties of the floods.
There has been considerable interest in alkaline inorganic salts, such as sodium phosphates (Roszelle 1972 and Hill et al
1973) and sodium silicates (Somasundaran and Hanna 1978 and Krumrine et a1 1980). The mechanism by which these reduce adsorption is not altogether clear. With weak-acid surfactants (carboxylates, pheno- lates), increasing fractions in the salt form at high pH would tend to reduceadsorption by increasing preference for the aqueous phase, but such an explanation would not hold for the strong-acid sulfonate surfactants usually employed.
There is further question as to why anionic surfactants adsorb on minerals in the first place, because most substances comprising formations tend to be cation- exchangers, i. e., carry a negative fixed charge at the pH of usual brines (Kraus et a1 1958). The fact is, surfactants are lost from solutions to a substantial extent, even on such highly negatively charged substances as clays. Shah et a,( 1979) have attributed part of the loss to precipitation by multivalent cations, rather than adsorption, part to bridging by multivalent ions between cation exchange sites and charged surfactant groups, and part to positively charged .sites on the clays. Alkaline salts might in this context reduce loses by removing surfact- ant-precipitating ions as solids (e. g. CaCO3) by complexing multivalent cations, or by shifting the fixed charge of hydrous-oxide components of minerals in a negative direction. However, in view of the fact that neutral surfactants and polymers also adsorb on minerals, it appears likely that factors other than long-range electrostatic forces are important.
Another class of sacrificial agents are organic electrolytes, more similar to the surfactants than inorganic salts. In search- ing for useful examples, the criteria of cheapness and large supply might be met by waste streams or by by-products generated
,
I15

in the pulping of wood (Grune et al 1979). Roughly a third of the large tonnages of raw material fed into these processes are lignins, from which products of relatively low value are produced or which are used as fuel or discarded.
Lignosulfonates have been suggested as competitive adsorbates by Texaco (Kalfog- lou 1977, 1979); patent rights have been licensed to American Can Co. (Anonymous 1979) which is active in lignin production. Lignosulfonates are generated in the sulfite pulping process or may be prepared, with somewhat different characteristics, by sulfo- nation of the lignins from the kraft process. This class of materials has long been used in drilling muds and has been frequently suggested as a component in enhanced recovery formulations (see, e. g. Bansal 1979, Germer et al 1972, Harvey 1969, and Parker 1968) for various reasons, including
Chips
as a dispersant, as a clay-coating agent, and as a substitute for the surfactant.
The direct source of lignosulfonates, the sulfite pulping process, accounts for a relatively small, and declining, fraction of total paper and allied products manufac- ture. A probable reason for the neglect of the kraft process, used in about 80% of production, is the fact that normally the bulk of the lignin matter is used as fuel, in the course of concentrating and burning the spent digester solution, weak black liquor, to recover pulping chemicals (Fig. 14.1). There has consequently been little effort to develop byproducts from kraft wastes, although Westvaco has been active in this area.
Lignin and other fractions that d o not end up in primary products represent an enormous source of .organic matter of low value, however. As far back as 1964, nearly
Blow & O W High Digesters .- Tank - stock - Scnrm - Deckel - Demity
W.d*n S t o r e -
t r I Black
I I6
t To
f 1. Filter Liquor - 0b.ch Storags In the k ra f t process, w o o d chips are broken d o w n to - fibers b y cook ing under pressure w i t h so-called wh i te
PIant and
Kiln t I p a w l iquor, wh ich consists p r imar i l y o f a solut ion of sodium hydrox ide end sodium sulfide. A t the end of t h e cooking period, pressure is released and t h e m i x t u r e of liquor and fibers i s expelled from the b l o w tank. The spent l iquor,
M~~~
I C
containing most o f t h e l ign in removed f r o m t h e wood, is burticizer Evrporators n o w called black l iquor and is sent to a l iquor storage
tank. The pulp goes t o the b r o w n stock washers where m o r e liquor i s washed o u t and recombined w i t h t h e black
they are dissolved w i t h water. A f t e r causticizing w i t h l ime, t h e m i x t u r e i s f i l tered and the rejuvenated wh i te

nine million tons/ year of thiolignin were produced, for example (Hoyt and Goheen 1971). Presently discharged waste streams contain substantial, though more limited, amounts. For example, about 240 lb of total solids are present in the effluent from production of a ton of pulp in kraft bleaching operations shown in Fig. 14.2 (Grune et a1 1979). By our measurements on several lots, the ratio of total organic carbon (TOC) to solids is about 1 / 5 (in results to be described, TOC is a convenient unit for measurement of concentration of material active as competitive adsorbate). We d o not have a figure for the fraction of kraft production that is bleached; if half, the 1980 production of 134,000 tons of pulp/day would imply generation of about 1600 tons of bleach-plant TOC/day. Although it will appear that, if this material proves practical, more might be used in oil recovery, the amount available is large enough to be significant.
The results to be discussed deal mostly with reduction of adsorption of a commer- cial petroleum sulfonate by the caustic extract from bleaching of kraft pulp, as an example of waste product. Fragmentary results indicate also potential for weak black
1
liquor, which is of relatively low value as currently used and which is available in large quantity. The minerals tested were montmo- rillonite, kaolin, and berea sandstone; clays were emphasized because of the strong contribution they make to total loss of chemicals. Our results share with those of others uncertainties concerning the relative extent of precipitation and adsorption. In an attempt to limit these ambiguities, we have emphasized measurements with minerals pretreated to put them in the sodium form.
EXPERIMENTAL
Adsorption measurements were by batch equilibrations. A weighed sample of the solid adsorbent was equilibrated with a measured volume or weight of solution_on a shaker. The solid was separated by centrifu- gation, and the supernatant solution anal- yzed. The amount adsorbed on the solid was computed from the difference in solution concentration before and after equilibra- tion.
Analyses for surfactant were by two- phase titration (Reid et a1 1967; see Materials and Methods for details). Con- centrations by this method may not include
::i ORNL DWG. 80-17249
To Storage
Fig. 14.2. Pulp bleaching sequence. The schematic identifies chemical treatments common in bleaching of kraft pulp. Sequence of steps varies. Pulp is mixed with the bleaching chemicals and run into retention towers which may hold the pulp for 30 to 60 min. Normally, the pulp is washed between each stage of the bleaching sequence. Effluent from this system is highly colored, especially from the caustic stages.
I17
all of the low-equivalent-weight species in the surfactant, but we believe the values should be useful as at least relative indica- tors for the fraction most susceptible to adsorption. Competitive adsorbates were assayed as total organic carbon (TOC) with a Beckman 915 TOC Analyzer. In the procedure with this instrument, two samples are analyzed -one by catalytic combustion for total carbon and the other by acid displacement of C02 for inorganic carbon. In both cases, COZ is swept through an infrared analyzer by a gas stream. The difference, expressed as carbon, is TOC.
Most of the experiments to be reported were with montmorillonite (Swy-aNa- Montmorillonite, Crook Co., Wyoming, from Dept. of Geology, U. of Missouri), berea sandstone, and kaolin (CMS-K6a-I, well crystallized, Georgia, from Dept. of Geology, U . of Missouri). The sandstone was given us in a block by W. J . Boegly, Jr., of the ORNL Environmental Sciences Division. It was crushed by A. E. Pasto of the ORNL Metals and Ceramics Division. First, it was broken into 1 in. chunks with a hammer, then subjected to a hardened-steel jaw crusher, then an A1203 disc crusher, followed by automatic sieving. Pretreat- ments of the minerals before adsorption experiments are discussed in connection with the results.
The surfactant was Witco TRS 10-80, sometimes used as received and sometimes deoiled. The procedure for deoiling is described in Materials and Methods,
Unless otherwise specified, the experi- ments with bleach-plant caustic extract were carried out with a single lot (Lot I ) which analyzed at 1200 ppm TOC and 140 ppm of inorganic carbon (also reported as C), and 0.055 moles chloride per liter. The pH was about 8. Lot 2 was about 1000 ppm TOC and about 7.3 in pH. The pH values were as we measured them a t some time. It is likely
that they are lower than the values on discharge from the process, owing to uptake of C02 from the air. The TOC values from a given lot also varied in samples taken at different times, sometimes by a hundred ppm or so. Whether the differences arise from aging or from slow settling of some components is not clear. All samples were supplied by the International Paper Com- pany.
RESULTS
The major fraction of the results to be summarized here have been previouly reported in the monthly letters for November and December 1978 and in the quarterly reports covering calendar 1979. As we have pointed out, there have been substantial quantitative discrepancies between adsorptions determined at different times under apparently similar conditions. In many cases, defects in experimental procedures in preliminary measurements have been identified and in others adsorp- tion has been found to be more sensitive to certain variables than we initially thought. An example of the former in the December 1978 monthly report are values for surfac- tant uptake on montmorillonite from 0.1 M NaCl solutions pretreated in varous ways. From subsequent work, we conclude that our solid-liquid separations after equilbra- tion were not complete a t this low salinity, and the dispersed clay interfered with the analysis of surfactant in the equilibrated solution samples. An example of the latter are comparisons of adsorption from solutions of different salinities at different equilbrium concentration of adsorbate; later work estabished adsorption was concentration dependent t o a greater degree than we originally thought in some com- positional regimes investigated.

Where we have identified with reasonable certainty the origin of discrepancies, we shall not report here the ambiguous results. There remains a range in some values to be reported, the origin of which we are not certain a t this time. Because sets of measure- ments are internally consistent, more than experimental scatter appears to be involved. Presumably there is some variation in the solids, the surfactant samples, etc. Although the presence of unidentified sources of significant differences is disquieting, we believe that discordancies in the results to be presented are not large enough to invalidate the trends or the significance of the effects of competitive adsorbates.
Adsorption of Surfactant on Solids
Montmorillonite. Representative values of the adsorption of a commercial petro- leum sulfonate, Witco TRS 10-80, on the sodium form of montmorillonite are pre- sented in Fig. 14.3. Values from two concentrations of sodium chloride are presented. The clay in this case has been pretreated with pH 5 buffer to remove CaCO3 (Jackson 1956), and the surfactant was deoiled. The comparison between prewashed and non-prewashed clays was between samples dry on initial contact'with the surfactant-sodium chloride solution and samples which had been precontacted three times with 25 ml of the solutions, 'not containing surfactant, of the same concen- tration of NaCl, the precontacts being about two hours. The objective was to establish if discrepancies in some earlier results might have arisen from decomposition of some of the clay on drying. Comparison of the results indicates no significant difference between prewashed and non-prewashed material.
The trend of increasing surfactant adsorp- tion with increasing NaCl concentration is
t
0.5
0, X \ 0 W -
0.1 t
0 v) 0
a a
a 0.05
0.01
ORNL DWG 79-4184
I I I I I PREWASHED
0 0.1 M NaCl NO 0 0.1 M NaCl YES A 0.254 NaCl NO A 0.254 NaCl YES
0.001 0.005
SURFACTANT EQUILIBRIUM CONCENTRATION (Eq/P)
Fig. 14.3. Adsorption of petroleum sulfonate on Na-form montmorillonite - effect of prewashing. Conditions: Witco TRS 10-80, deoiled; 50:l to 6O:l liquid / solid ratio; prewashed 3 X with solutions.
the rule in our results. Also, approach to a limiting value of equivalents of surfactant adsorbed per kg of .montmorillonite at equilibrium surfactant concentrations be- tween 0.001 Eq surfactant per liter and the highest concentrations of our range was usually observed. The amount adsorbed in the plateau, however, varied significantly. Fig. 14.4 gives results of another set of measurements, in which the adsorption leveled off a t about 0.15 Eq/kg clay, rather than about 0.25 in Fig. 14.3. Comparison is made in Fig. 14.4 between solutions contain- ing cosurfactant with solutions without;
I19

2
ORNL DWG 79-643
I I I I I I 0 NO COSURFACTANT 0 2 57. )-BUTYL ALCOHOL - -
o----- e, /< -- - - - --0- /
0' 0
- / - - 1 - -01 - - I - - I -
I 1
I I I
- -
- -
- - 2
0.01 I I I I I I 1 0 0.002 0.004 0.006
EOUlLlERlUM SURFACTANT CONCENTRATION, EOUIV/A
Fig. 14.4. Effect of cosurfactant on adsorption of petroleum sulfonate surfactant on montmorillonite. Conditions: Witco TRS 10-80; 0.25 M NaCl; Na- form montmorillonite; 100-325 mesh montmorillon- ite solid particles; liquid / solid ratio 50 ml/g.
presence of 2.5% i-butyl alcohol appeared to have no significant effect on surfactant adsorption.
The clay used in the experiments of Fig. 14.4 was from the same lot as in Fig. 14.3, but had been subjected to a somewhat different pretreatment. It had not been treated with pH 5 acetate buffer to remove carbonate. Rather it had been put into the sodium form by three successive equilibra- tions with 2 M NaCl solutions, then subjected to a single contact with 0.1 M NaCl. Following this, it was washed successivly with 50, 75, 90, and 100% methanol, then dried a t room temperature under vacuum.
Most other sets of measurements with
factor, because of a more recent series of measurements carried out on the buffer- treated clay, summarized in Fig. 14.5. In this case, we were interested in the effect of equilibration time and of the ratio of volume of liquid phase to weight of clay used in the experiments. Scatter is greater than with other sets, partly because the constraints on initial conditions to arrive at the desired equilibrium surfactant concentrations for the different liquid / solid ratios precluded selection of conditions for optimal preci- sion. However, values in the plateaus ranged from 0.15 to 0.3 Eq surfactant/kg clay. There appeared to be no significant differ- ence between two and five day equilibra- tions, but there was a trend to higher apparent adsorption at higher solid-liquid
0.4
>
V 5 0.3
A A A
3 v) q s 0.1
0 0 0.0 I 0.02 0.03
EOUIV SURFACTANT /kg SOL'N AT EOUlLlBRlUM
samples from these two lots gave roughly the Fig. 14.5. Effect of time of equilibration and of
buffer treated and 0*15 for the Other* sulfonate surfactant on sodium form of montmoril- Same limiting adsorption-0'25 Eq/li ter for liquid / solid ratio on adsorption of petroleum
However, we are somewhat skeptical that the clay differences are the only significant
lonite. Conditions: Witco TRS 10-80, as received; 0.25 M NaC1; 25 C.
I20

ratios. This would be expected ifsomething from the solid were precipitating surfactant.
Fig. 14.6 compares adsorption on as- received, or raw, clay with adsorption on clay which had been put in the sodium form, but not buffer treated. Adsorption is substantially higher on the raw clay. Effects of competitive adsorbates will be discussed later.
The higher apparent adsorption on raw clay than on sodium-form is a further suggestion of a contribution of precipitation by ions introduced with the clay. Table 14.1 summarizes some observations of precipita- tion by WitcoTRS 10-80 by Ca(II), Mg(II), and Al(II1). These results are not directly applicable to the conditions of Fig. 14.6, because NaCl concentration was 0.1 M in
ORNL DWG 79-531
SURFACTANT
RAW CLAY 0.5 NO-FORM I//---
- 01 0.2 r \ w
W Y
z c a 0
2 a
2 0.05 v)
SURFACTANT EQUILIBRIUM CONCENTRATION ( Eq/p)
Fig. 14.6. Adsorption of petroleum sulfonate on montmorillonite from 0.25 M NaCl solutions, in absence and in the presence of bleach plant effluent, BPE, at 500 mg/ liter; 25 ; and 50: 1 liquid / solid ratio.
contrast to 0.25 M in the figure,. but they are suggestive of effects. There is a clear decrease in surfactant concentration on addition of 0.004 M of Ca(1I) per liter. The raw clay contained about 0.1 moles of Ca( 11) and 0.075 moles of Mg(lI)/kg, and the liquidlsolids ratio of the tests in Fig. 14.4 was SO/ 1. This would imply the solution would be as high as 0.002 M Ca(I1) and 0.0015 M Mg(II), o r a total of 0.0035 M alkaline earth ions, if all divalent ions were displaced from the solid. Some precipitation might occur, but a large amount does not seem likely from this source. Equilibria of Na(1) and Ca(I1) between montmorillonite and aqueous solutions is not such that essentially all divalent ions would be displaced by 0.25 M NaCl (Rogers et al I979), although complexing by surfactant would presumably favor their distribution in the aqueous phase. However, if Al(II1) were displaced into the solution, the effect might be substantial. As we mentioned earlier, we have stressed use of the sodium form of clay to minimize confusion of results from precipitation.
Kaolin. Fig. 14.7 summarizes adsorption of Witco T R S 10-80 on kaolin in the sodium form. The general form of the curves is the same as with montmorillonite, and adsorp- tion is greater a t higher NaC1 concentration. The amount of surfactant adsorbed per unit weight of clay at surfactant concentrations in the plateau region is however much lower on kaolin, about a third as much. Adsorp- tion is of the order reported for dodecylben- zene sulfonates under similar conditions (Schechter and Wade 1979), but only a half to a third that reported by another group for this compound (Somasilndaran 1979).
Berea sandstone. Fig. 14.8 summarizes some results of adsorption of Witco TRS 10- 80 on crushed berea sandstone, not con- verted to the sodium form, from 0.25 M NaCI. Amount adsorbed per kg solid is about a factor of ten less than kaolin under
121
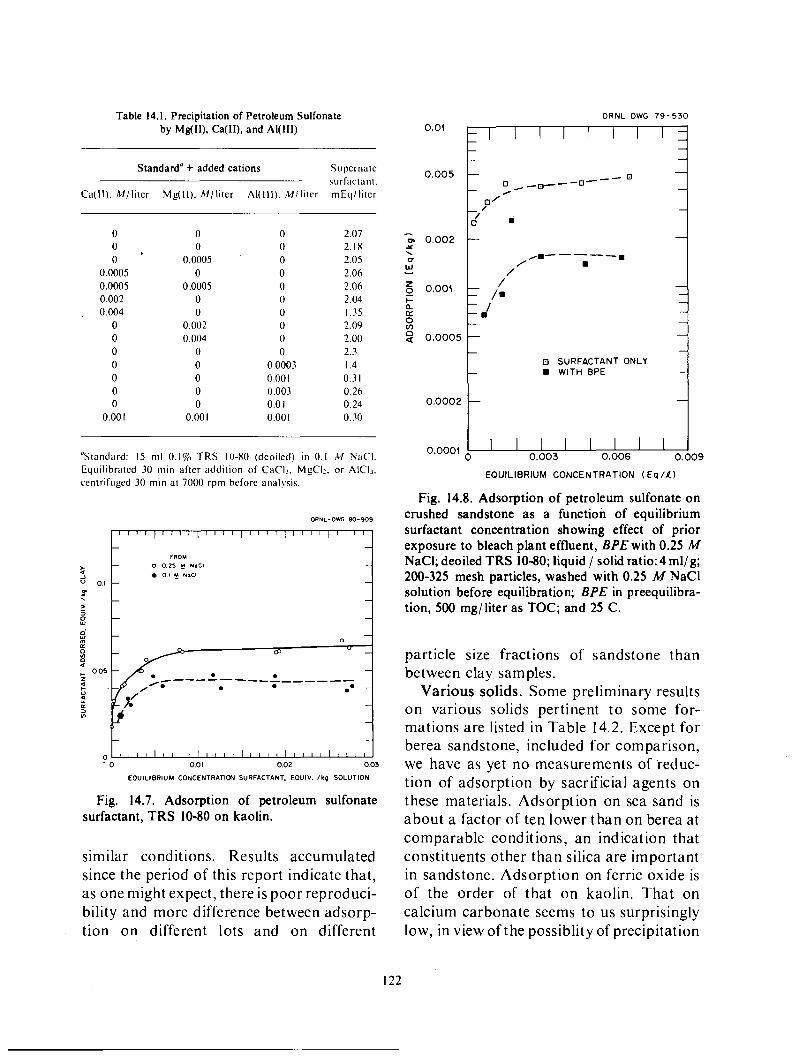
Table 14.1. Precipitation of Petroleum Sulfonate by Mg(II), Ca(II), and AI(II1)
0.0002
O.OOO!
Standard” + added cations Supcrnatc s ti rfrict a ii t .
Ca(II). Militer Mg(l l ) . A.l/litcr Al(111). iM/liter mEq/liter
0 0 0 2.07 0 0 2.18
0.0005 0 2.05 0 0.0005 0 0 2.06 0.0005 0.0005 0 2.06 0.002 0 0 2.04
, 0.004 0 0 I .35 0 0.002 0 2.09 0 0.004 0 2.00 0 0 0 2.3 0 0 0.0003 I .4 0 0 0.001 0.3 I 0 0 0.003 0.26 0 0 0.0 I 0.24
0.001 0.001 0.00 I 0.30
0 .
- - B SURFACTANT ONLY
- - WITH BPE
- -
I “Standard: 15 nil 0.1% TRS 10-80 (deoiled) in 0.1 !Id NaCI. Equilibrated 30 min after addition of CaC12. MgC12. or AICI,. centrifuged 30 min at 7000 rpm before analysis.
FROM
0 0.25 I NaCI
0 15 NOCl
. >
0 w a
ORNL-OWG 80-909 I 00 1 0.01 0.02 0.03
EQUILIBRIUM CONCENTRATION SURFACTANT. EOUIV. I k p SOLUTION
Fig. 14.7. Adsorption of petroleum sulfonate surfactant, TRS 10-80 on kaolin.
similar conditions. Results accumulated since the period of this report indicate that, as one might expect, there is poor reproduci- bility and more difference between adsorp- tion on different lots and on different
ORNL DWG 79-530
O.O’ F - l l l - T
5 0.001
s: t a IL 8
9 0.0005
particle size fractions of sandstone than between clay samples.
Various solids. Some preliminary results on various solids pertinent t o some for- mations are listed in Table 14.2. Except for berea sandstone, included for comparison, we have as yet no measurements of reduc- tion of adsorption by sacrificial agents on these materials. Adsorption on sea sand is about a factor of ten lower than on berea at comparable conditions, an indication that constituents other than silica are important in sandstone. Adsorption on ferric oxide is of the order of that on kaolin. That on calcium carbonate seems to us surprisingly low, in view of the possiblity of precipitation
I22

Table 14.2. Adsorption of petroleum sulfonate"
Surfactant, at equilibrium
Solid Eq/ liter s o h Eq/ kg solid
Sea sand 0.00 I78 0.00050 Berea sandstone 0.0025 0.0055
0.0035 0.0048 CaCOj 0.00443 0.0 I35
0.0037 I 0.0624 Fez03 0.0038 I 0.0646
"Witco TRS 10-80 precipitated from 0.01 M NaCl Solution. 25 C.
of sulfonate by Ca(II), which would result in a high apparent adsorption. However, it is compatible with the observation reported above that montmorillonite in the sodium form which had not been treated with pH 5 buffer to remove CaCO3 adsorbed less surfactant than buffer treated. The fact that CaCOj and sand content (allowed for in computing results for the buffer-treated material, but not with as-received clay and NaCl solutions) of the non-buffer treated clay contributed relatively little to adsorp- tion is in the right direction to account for differences in surfactant adsorption between the two samples, although it is not likely to explain all of the range between 0.15 and 0.25 Eq surfactant/kg clay from 0.25 A4 NaCl solutions.
Comparison of Various Substances Generated in the
Pulping of Wood
Table 14.3 summarizes some comparisons of the adsorption of petroleum sulfonate on the sodium form of montmorillonite after preequilibration of the solid with solutions of various wood-pulping wastes and bypro- ducts. The conditions of the measurements were similar, though not identical. Acid bleach, caustic extract, and weak black
liquor are from the kraft process; their sources can be identified in Figs. 14.1 and 14.2. Briefly, acid bleach is from the oxidizing step of the bleach process; typically it is of considerably lower solute content than caustic extract. It emerges from the process moderately acidic, say pH 2.5, and in common with the other materials tested, was adjusted to neutrality by NaOH or HCl addition before equilibration. '
Caustic extracts I and I1 were two different lots, both believed to be softwood. In general, this stream contains mainly oxid- ized and somewhat degraded, possibly chlorinated, lignin, plus wood sugars, and diluted NaCI. Weak black liquor is the blowdown from kraft digestion of wood, and here was diluted from original concen- tration, typically 15% solids, to the initial concentration used. All of these were supplied by the International Paper Com- pany. Sodium saccharinate, supplied by ITT Rayonier, may be prepared from weak black liquor (Green 1956). I t is a mixture of carbohydrates oxidized to compounds containing a carboxylate group, contami- nated liberally with ligfiin species. Kraft lignin, a purified product from black liquor, and lignosulfonate were commercial pro- ducts from Westvaco.
It can be seen that the amount of these lignin substances adsorbed varies over a wide range, but there is little correlation between amount adsorbed and loss of surfactant. All decreased surfactant adsorp- tion somewhat, although the acid bleach was not very effective. If relative amounts of the lignin adsorbed are ignored, the caustic extracts and weak black liquor were the most effective of the group in competitive adsorption, based on distribution coeffi- cients of the surfactant. However, sodium saccharinate and lignosulfonate were not much less, perhaps insignificantly less, effective; as we mentioned earlier, lignosulf-
I23
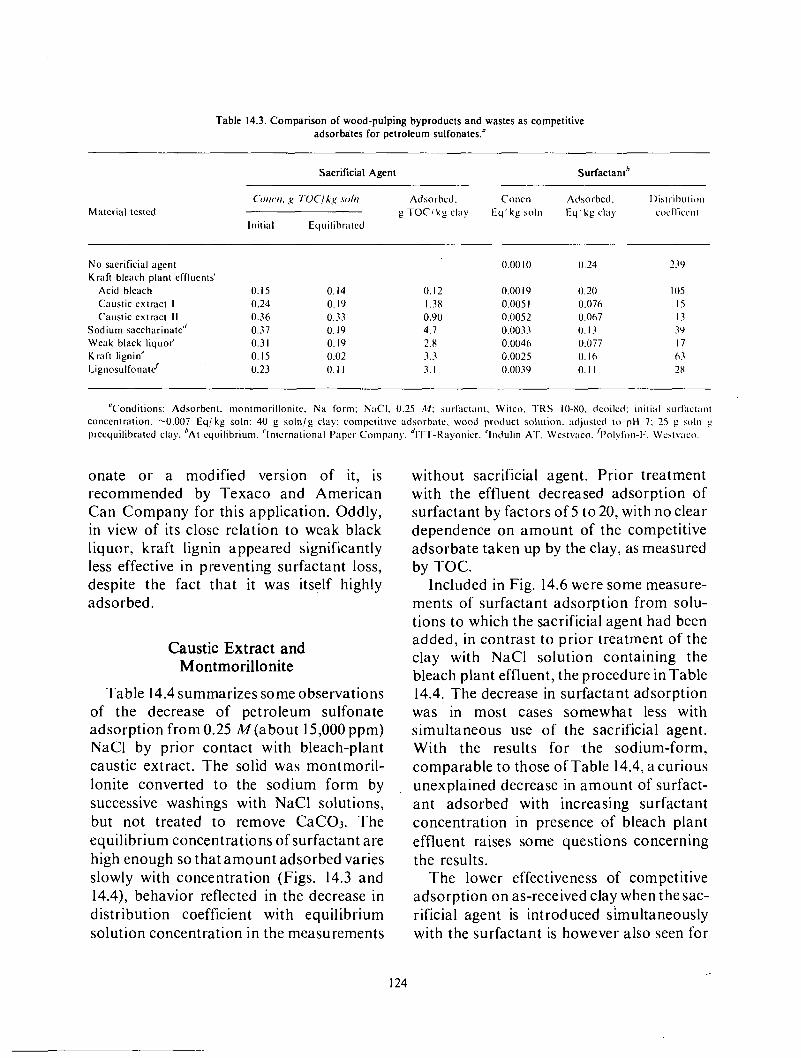
Table 14.3. Comparison of wood-pulping byproducts and wastes as competitive adsorbates for petroleum sulfonates.“
Material tested
Sacrificial Agent Surfactant’
CWlCtl. ,L! roc,!kaL! .YO/ll Adsorbed. Concn Adsorbed. Ihti-ihutioii g TOC 1 kg clay E q ‘ kg soln E q ’ kg clay COCl1”ICCIIt
I nit ia I Eq uilibratcd
No sacrificial agent Kraft bleach plant effluents’
Acid bleach 0.15 Caustic extract 1 0.24 Caustic extract I1 0.36
Sodium saccharinatc” 0.37 Weak black liquor‘ 0.3 I Kraft lignin“ 0.15 Lignosulfonate‘ 0.23
0.00 IO
0.14 0. I 2 0.00 I9 0. I9 I .3x 0.005 I 0.33 0.90 0.0052 0.19 4.1 0.003 3 0. I9 2.X 0.0046 0.02 3.3 0 .00 2 5 0.11 3. I 0.0039
0.24
0.20 0.076 0.067 0 . I 3 0.077 0.16 0.11
239
I 05 I S 13 39 17 63 2X
“Conditions: Adsorbent. montmorillonite, Na form: NaCI. 0.25 M: surlactant. Witco. T R S IO-XO. clcoiled: initial wr l i i c tan t Concentration. -0.007 Eq/kg soh: 40 g soln/g clay: compctitive adsorbatc. \wad product solution. adjustcd t o pH 7: 25 g soln 9 precquilibratcd clay. ’At equilibrium. ‘International Paper Company. dl’l~T-Kayonicr. ‘Indulin A T . \Vestv;ico. ’Polyfoii-F. \Vcstvaco.
onate or a modified version of it, is recommended by Texaco and American Can Company for this application. Oddly, in view of its close relation to weak black liquor, kraft lignin appeared significantly less effective in preventing surfactant loss, despite the fact that it was itself highly adsorbed.
Caustic Extract and Montmorillonite
Table 14.4 summarizes some observations of the decrease of petroleum sulfonate adsorption from 0.25 M(about 15,000 ppm) NaCl by prior contact with bleach-plant caustic extract. The solid was montmoril- lonite converted to the sodium form by successive washings with NaCl solutions, but not treated to remove CaC03. The equilibrium concentrations of surfactant are high enough so that amount adsorbed varies slowly with concentration (Figs. 14.3 and 14.4), behavior reflected in the decrease in distribution coefficient with equilibrium solution concentration in the measurements
without sacrificial agent. Prior treatment with the effluent decreased adsorption of surfactant by factors of 5 to 20, with no clear dependence on amount of the competitive adsorbate taken up by the clay, as measured by TOC.
Included in Fig. 14.6 were some measure- ments of surfactant adsorption from solu- tions to which the sacrificial agent had been added, in contrast to prior treatment of the clay with NaCl solution containing the bleach plant effluent, the procedure in Table 14.4. The decrease in surfactant adsorption was in most cases somewhat less with simultaneous use of the sacrificial agent. With the results for the sodium-form, comparable to those of Table 14.4, a curious unexplained decrease in amount of surfact- ant adsorbed with increasing surfactant concentration in presence of bleach plant effluent raises some questions concerning the results.
The lower effectiveness of competitive adsorption on as-received clay when the sac- rificial agent is introduced simultaneously with the surfactant is however also seen for
, I24

Table 14.4. Surfactant adsorption on Na-form Wyoming Na montmorillonite both in the presence and absence of bleach plant effluent”.
Adsorption of bleach plant efflucnt Adsorption of surfactant
Initial Equilibrium Adsorbed, Distribution I nit in1 Equilibrium Adsorbed I>istrihutioil Solid. concn, concn. g I-OC~! coefficient. coIlcI1. concn. rncq! cocfl‘icicnt.
g g TOC*/liter g ’fOC’/liter kg solid liter/kg rncq! lifcr mcq‘ lifcr kg solid l i tcr kp
0.24 5.10 I .74 14.0 x0.5 0.22 7.83 4.62 14.7 31.2 0.2 I 1.158 1.121 I .75 I .56 3.68 3.24 25.9 x.o 0.20 0.869 0.848 I .07 1.21 3.82 3.62 11.5 3.2 0.2 I 0.579 0.540 I .88 3.48 3.75 3 3 10.8 3.0 0.21 0.386 0.358 I .34 3.74 3.77 3.58 11.3 3.2 0.22 0.232 0.207 1.15 5.55 3.66 3.53 7.5 2. I
“Thesc conditions were used: 0.25 A4 NaCl in a l l solutions: surfactant. dcoilcd Witco TI1S 10-80: 50: I liquid:solid: clay particles.
2Total organic carbon. measured as the differcncc bctwccn total and inorganic carbon using ;I Hcckman 9 I 5 carbon analy7cr. 100-325 mesh: and clay. Wyoming Na montmorillonite put in Na form.
0.1 MNaCl (about 600 ppm) solutions (Fig. 14.9). The curves for0.25 Marecopied from Fig. 14.6 for comparison. The decreases are much less than some reported in the November 1978 monthly report for 0.1 M NaC1, measured under conditions that were similar except for the fact that the sacrificial agent was used in a prior contact. Although we are not including these results in detail here because of their preliminary nature and because of some questions about our pro- cedures at the time, it seems probable that prior contact reduced surfactant adsorption by a factor of five at least, in contrast to a factor of two or less in Fig. 14.9.
These differences between prior and simultaneous contact suggest that kinetics of adsorption of surfactant and of sacrificial agent may play a role. Results of an experiment to test displacement of surfact- ant previously adsorbed by caustic extract (Fig. 14.10) indicates that, although this may be the case, there is a preference for the sacrificial agent under the co nd i tio ns stud - ied. Four samples of the sodium form of
1.0
0.5
- - 0.2 x \ CT
W - 6 0.1 t a a 0 v, 2 0.05
0.02
0.01
ORNL DWG 79-529
- NO BPE
/ - T - - -- - - / b0.25 M NaCl
/WITH BPE 0
e
0
e
0
e
0,002 0.004 0.006 0.008 0.01
SURFACTANT EQUILIBRIUM CONCENTRATION ( E q / l l )
Fig. 14.9. Adsorption of petroleum sulfonate on raw montmorillonite from 0.1 M NaCl solutions, in the presence and absence of bleach plant effluent at 500 mg/liter; 25 C.
125

montmorillonite were equilibrated with solutions of T R S 10-80 in 0.25 MNaCI. The amounts adsorbed, indicated by the four points marked a in Fig. 14.10, fall fairly close to a typical loading curve (sketched from Figs. 14.4 and 14.6). In separating the supernatant solution from the solids, two samples werecentrifuged under a field about four times higher than for the other two, in this and subsequent steps, in order to check for possible difficulties arising from interfer- ence of suspended solids on analysis. After removal of the supernatant, two of the samples (one from centrifugation at each speed) were contacted with 0.25 A4 NaCl containng bleach plant effluent at 500 ppm TOC, and the otherwith 0.25 MNaCl. After the time of equilibration indicated on the figure, the tubes were again centrifuged and the supernatants anaylzed for surfactant. It can be seen that the solution containing bleach plant effluent displaced far more surfactant (almost two thirds) from the solid
0 2 0 , I I I I I I I I I I I I I I I I I - DISPLACEMENT WITH - SOCID-LIOUID SEW7ATION AT RPM 7000 44.300 -
0 O25HNDCl A - - * 0 25 Y NoCI PLUS WE. A o 5 Q mcu
0 03
0
in the first wash than the solution without. The process was repeated several times; displacement of the remaining surfactant was relatively slow. (In these experiments, some solution remained in the clay pack each time, and a detailed material balance is not established by numbers in the figure.)
The amounts adsorbed after the wash without bleach plant effluent fell somewhat above the loading curve. Whether this results from irreversibility o r slow reversibil- ity of surfactant adsorption, o r corresponds to uncertainty in the loading curve in a relatively steep region is not known.
The amount of surfactant on the solid after the first displacement with caustic extract of Fig. 14.10 is in reasonable agreement with the amount adsorbed under corresponding conditions for simultaneous contact in Fig. 14.6. In any case, the greater effectiveness of the sacrificial agent when it contacts the solid first suggests that it would be better used in a preflush than in a surfactant bank.
In Table 14.4, amounts of caustic extract adsorbed, assayed as total organic carbon, were rather erratic with respect to equili- brium solution concentration. Much more serious discrepancies were observed in other sets of measurements. We shall present here several examples but d o not have a convin- cing explanation for the differences.
Fig. 14.1 1 summarizes adsorption on as- received clay for three NaCl concentrations. A suspicious aspect is the fact that more appears to be adsorbed for a given equilib- rium solution concentration from 0.1 M NaCl than from the higher concentrations. However, the values a t this concentration are not greatly different than results of preliminary measurements in the November 1978 monthly report. Fig. 14.12 summarizes another set of measurements over a nar- rower range of equilibrium concentrations on as-received and sodium-form montmo- rillonite. The values for the raw clay from
- -20 - - -
' 1 1 ' 1 1 1 1 ' 1 1 1 1 1 1 1 1 1 1 1 1
I26
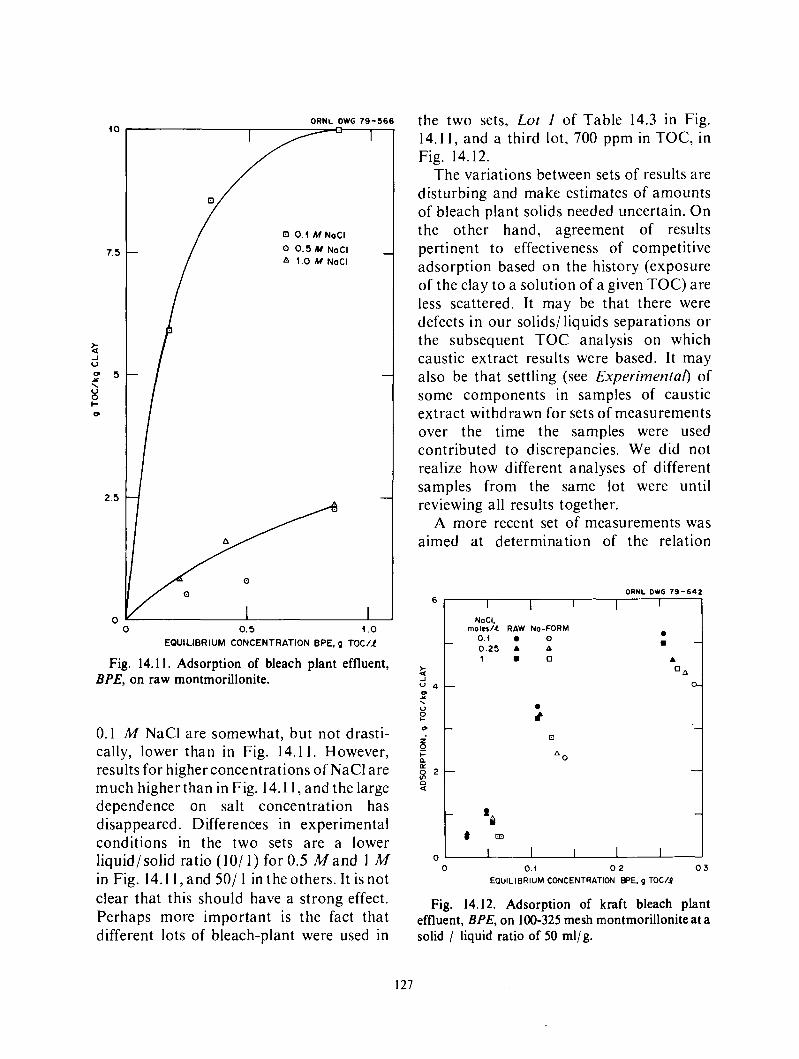
10
7.5
* J V
a
2 5 \ u 0 I- o
2.5
> J a
z 4 1 \
V e 0 -
8 ; 2 -
I- n
n a
ORNL DWG 79-566
NaCl. moles/.( RAW No-FORM
0.1 0 0 0 .25 A A 1 8 0
-
-
r Y 1
0 0 1 M NaCl 0 0.5 M NaCl A 10 M NoCl
0 0 0.5 1 .O
EQUILIBRIUM CONCENTRATION EPE, g T O C / I
Fig. 14.11. Adsorption of bleach plant effluent, BPE, on raw montmorillonite.
0.1 A4 NaCl are somewhat, but not drasti- cally, lower than in Fig. 14.1 1 . However, results for higher concentrations of NaCl are much higher than in Fig. 14.1 1 , and the large dependence on salt concentration has disappeared. Differences in experimental conditions in the two sets are a lower liquid/solid ratio ( I O / ] ) for 0.5 M a n d 1 M in Fig. 14.1 1, and S O / 1 in the others. It is not clear that this should have a strong effect. Perhaps more important is the fact that different lots of bleach-plant were used in
the two sets, Lot I of Table 14.3 in Fig. 14. I I , and a third lot, 700 ppm in TOC, in Fig. 14.12.
The variations between sets of results are disturbing and make estimates of amounts of bleach plant solids needed uncertain. On the other hand, agreement of results pertinent to effectiveness of competitive adsorption based on the history (exposure of the clay to a solution of a given TOC) are less scattered. It may be that there were defects in our solids/ liquids separations or the subsequent TOC analysis on which caustic extract results were based. It may also be that settling (see Experimental) of some components in samples of caustic extract withdrawn for sets of measurements over the time the samples were used contributed to discrepancies. We did not realize how different analyses of different samples from the same lot were until reviewing all results together.
A more recent set of measurements was aimed at determination of the relation
ORNL DWG 79-642
6R
0 0 0.1 0.2 0 3
EOUlLlBRlUM CONCENTRATION WE. g TOC/P
Fig. 14.12. Adsorption of kraft bleach plant effluent, BPE, on 100-325 mesh montmorillonite at a solid / liquid ratio of 50 ml/g.
I27

between amount of caustic extract and surfactant adsorbed. We hope, but cannot guarantee, that they were obtained with more reliable procedures.
Samples of montmorillonite from which CaCOJ had been removed and which had been converted to the sodium form were shaken in centrifuge tubes with 0. I M and 0.25 M NaCl solution. They were then contacted with solution of the same NaCl molarity containing different initial amounts of caustic extract bleach plant effluent (BPE) for approximately 16 hr. After equilibration, the solids were centri- fuged to the bottom of the tubes and the supernatant solution removed. From anal- yses of the solution before and after equilibration and the weights of the tubes and contents after successive steps, the amount of BPE as TOC adsorbed on the clay was computed.
The results are given in Fig. 14.13, plotted against the equilibrium concentrations of the equilibrated solution. Contrary to previous results with as-received montmo-
ORNL-OWG 79-1995
3 A 0 .25 NaCl o 0.1 E NoCl
3
- % 0
0 - m 2 x \ V
2 m
z - 0 t ' a Lz
0 a
0 0 0.5 0.0
EQUILIBRIUM CONCENTRATION ( g TOC/kg SOLUTION)
Fig. 14.13. Adsorption of kraft bleach plant effluent, BPE, on Na-form montmorillonite; liquid / solid ratio - 251 1 .
rillonite (Fig. 14. I I ) , adsorption was higher a t higher NaCl molarity, the direction usually observed in surfactant adsorption. The quantities adsorbed seem to be consid- erably lower than in Fig. 14.12 on sodium- form montmorillonite for both NaCl con- centrations, but are closer to values reported for 0.25 M NaCl in Table 14.4.
The clay samples were then shaken briefly (approximately 4 hr) with NaCl solutions of the same concentration, to reduce bleach plant effluent in the solution held up in the clay pack. The clay was then centrifuged down again and supernatant removed. The solids were then contacted with solutions of the same concentration of NaCl containing 0.009 Eq/liter of TRS 10-80 for approxi- mately 16 hr. This initial concentration was selected to be high enough so that a t equilibrium, the solution concentations would all be a t least approximately 0.002 Eq/liter, so that the amount of surfactant adsorbed varies only slowly with equilib- rium concentration, and effects of loading of the clay with surfactant are therefore not confused with effects of the sacrifical agent.
The results are plotted in Fig. 14.14, as amount of surfactant adsorbed vsloading of bleach plant effluent (change in TOC loading in the intermediate rinse was considered insignificant). Values for the clay not previously contacted with BPE fall in the range of earlier observations. Adsorbed surfactant falls off rapidly from these values with increasing BPE TOC adsorbed on the clay, by a factor of approximately 10 at 1 g TOC/kg clay for 0.1 M NaCl and at 2 g adsorbed TOC/ kg clay for 0.25 M NaCl. The reduction in loss of surfactant per g adsorbed TOC is roughly comparable in the two cases, because of the greater adsorption on montmorillonite from 0.25 M NaCI.
Most of the results reported here have been with deoiled surfactant, and the applicability of the results to practical situations might be questioned. Fig. 14.15
I28

ORNL-DIG 19-1994
I - I
r
I I I I - - - A 0.25 NoCl
ORNL-DWG 80-910
\
2 3 O W
z I- u IL (L 3 v)
W
(L
t-- a
a
a m
0, 0.01 0 a
0.001
- - - -
-
- - - - - - - -
-
I I I I I I I I I
- a 0
" - 0.1
X . VI I- z W
2 0 w 0
0.01
I-
L
5: 4 I-
4
y 0.001 LL L
Y)
0.0001
0'4 0.2 1 / 0 I I I I I I 0 1 2 3
BLEACH PLANT EFFLUENT LOADING I p TOClkg cloy1
100
'0 ; 0 x . !-
4
U
LL
a 1 a
0
0.1
Fig. 14.14. Adsorption of petroleum sulfonate on Na-form montmorillonite as a function of prior loading of kraft bleach plant effluent. Conditions: Witco TRS 10-80, deoiled; initial concentration: 9 mEq/ liter; liquid / solid ratio, 30:l.
compares some measurements with as- received TRS 10-80 and with two batches deoiled on separate occasions. Within scatter, there appears to be no substantial effect, either on montmorillonite or on montmorillonite after prior exposure to caustic extract.
Caustic Extract and Kaolin
Much less work has been done on effectiveness of caustic extract a s a sacrificial agent with kaolin than with montmorillon- ite. Fig. 14.16 indicates that surfactant adsorption from 0.25 MNaCl is lowered by approximately a factor of five by a prior
P A 1 SURFACTANT I A F T E R CAUSTIC 1 - 0 A5 RECEIVED EXTRACT AD-
A DEolLED A D E O I L E D I
A A
e A A .
Fig. 14.15. Effect of deoiling on adsorption of petroleum sulfonate on Na-form of montmorillonite, before and after exposure to bleach plant effluent. Conditions: Witco TRS 10-80; 0.25 M NaCl, 25 C.
contact with a caustic extract solution containing 500 ppm TOC. The clay was as received. As with montmorillonite, there did not 'appear to be any great difference between deoiled and as-received surfactant.
Caustic Extract and Berea Sandstone
Figs. 14.17 and 14.18 summarize results on adsorption of caustic extract on crushed
I29

ORNL-DWG 80-908 ORNL O W G 79-536 0.07
006
J V
0 e 0.05 > - 3 8
w
2 t 0.02
0.04 m K
0
c z u
* 0.03
3 In
0.01
0
I I I I I I I I I I I I
0 0 4--
- ./- A
A DEOILED D A DEDILED I
A 0
/'0°
-
/
/
a A A 0
I I I I I I I I I I I I 0.005 0.01
SURFACTANT, EOUIV. /k9 SOLUTION AT EOUlLlBRlUM
Fig. 14.16. Adsorption of petroleum sulfonate surfactant on kaolin, before and after exposure to bleach plant effluent. Conditions: 0.25 MNaCl; TRS 10-80; 25 C; initial BPE TOC 500 ppm; as received clay.
berea sandstone. For a given equilibrium concentration of extract, increase in NaCl concentration increases adsorption. Results for 0.1 M NaCl agreed fairly well with preliminary values given in the Nov. 1978 monthly report. In Fig. 14.18, comparison is made between as-received sandstone and sandstone prewashed thrice with a NaCl solution of the sameconcentration as that of the adsorption measurements. T o our surprise, adsorption on the prewashed appears to be greater than on the as- received. The amounts adsorbed seem different in Fig. 14.17 and 14.18, but the discrepancies are more apparent than real. The equilibrium concentration in Fig. 14.18 ranged between 0.07 g TOC/liter for 1 A4 NaCl and 0.14 g TOC/ liter for 0.1 MNaCl. This is the region of steeply rising adsorp- tion in Fig. 14.17 and is below the concentra- tion of the measurements in that figure.
2.5
2 .o
(3 1.5 - -I 0 v, 0, s \ 0 0 I-
5 1.0
0.5
C
NaCl 1M
0 0.5 M 0 0.4 M
I
0 . 5 0 EQUILIBRIUM CONCENTRATION (gm TOC/i!)
Fig. 14.17. Effect of salt concentration on adsorption of bleach plant effluent on crushed Berea sandstone. Conditions: < 200 mesh; liquid / solid ratio 3: 1 to 13: 1 ml/ g; initial BPE cocentration 0.25 to 1.0 g TOC/liter.
In Fig. 14.8 a comparison was presented of petroleum sulfonate adsorption before and after exposure to caustic extract. The sandstone had been prewashed with NaCl solution to decrease multivalent cations. Reduction of surfactant adsorption is about a factor of three, considerably less than montmorillonite.
I30

on Interfacial Tensions 0 SOLID PREWASHED
0 0.5 I
NaCl h o l e s / l )
Fig. 14.18. Salinity effect on kraft bleach plant effluent adsorption on crushed Berea sandstone. Conditions: 200-325 mesh solid; inital BPE 0.185 g TOC / liter; liquid / solid ratio: 2.5 ml/g.
-
ORNL DWG 79-338
1 I I I I PHASES
o TOP vs BOTTOM
Wx) BPE BPE o MIDDLE vs BOTTOM E
- !o.ll A TOP vs MIDDLE A -
Q- 2 a t- 0.01 z
O 0 - ln W
-I
V
W -
I o A
OD01 I I I I 1
0.0 0. I 0.2 0.3 0.4 0.5
0
0
A
0 0
m a A A 0
pulp clearly reduces loss of Witco TRS 10- 80 on minerals found in formations. The effect is considerably greater if the extract contacts the solids first, as it would if used in a preflush, than if it is added to the surfactant solution. It appears about as effective in the cases for which we have made comparisons as lignosulfonates. The mate- rial has no present beneficial use and is customarily discharged through the disposal treatment systems of the paper plants. There are two constraints on its application however. The effluents are dilute, usually less than a percent. Concentration of the effluent would be necessary, if the material were to be used in a n oil field any substantial distance from a pulp mill. Impending environmental restrictions on color dis- charge may cause material to be concen- trated in any case, if membrane processes are adopted as the treatment methods (McKinnon 1979). The other constraint is available quantity. The results given here are too preliminary to support other than order of magnitude estimates of the amount of caustic extract one would need. An optimis- tic guess from results on montmorillionite in Fig. 14.14 or Table 14.3 might be a lb of TOC/ 10 Ib of surfactant, a figure which in conjunction with the 1600 tons TOC per day mentioned earlier would imply that, for 10
131

lbs of surfactant per barrel of enhanced oil, caustic extract supply could service produc- tion of about 3.2 million barrels per day. The 1600 tons TOC/day, however, includes acid bleach, which does not appear effective as a sacrificial agent. At a pessimistic extreme, from the high adsorption of bleach plant effluent from 0.1 A4 NaCl indicated in Fig. 14.1 I in combination with the low competi- tive adsorption indicated for use in the presence of surfactant, rather than precont- act, in Fig. 14.9, one might save only one to a few Ib of surfactant per Ib TOC, and perhaps as serious, the benefits in better control of the flood by maintenance of compositions closer to optimal (as distinct from savings in expense of chemicals) would be minimal.
Inferences from adsorption on montmo- rillonite might of course be misleading. We have less information on berea sandstone, but what is available suggests that savings in weight of surfactant not adsorbed per weight of caustic extract TOC adsorbed is in the same range as for montmorillonite. From the point of view of control of flood conditions, the results are not so favorable, in that the ratio of surfactant adsorbed in the absence of sacrificial agent to that adsorbed after pretreatment with agent is not as high (Fig. 14.8) as with montmorillonite (Figs. 14.13 and 14.14). However, if a statement sometimes encountered is correct, that berea has much less clay than typical oil- formation sandstones, the situation would be more favorable in practical cases.
We believe in summary that use of caustic extract as a sacrificial agent could have significant impact on oil recovery. If micellar flooding should be applied widely, however, weak black liquor would not face the supply constraints of caustic extracts. We have tested it much less, but in the cases we have, as in Table 14.3, it is nearly as effective in lowering surfactant adsorption as cdustic extract. It is furthermore dis- charged in concentrated form, about 15% total solids from the digestor, and is further concentrated, up to perhaps 50%, in conventional mill practice recovery systems.
Obviously, much more needs to be done before a sound evaluation of potential can be made. Besides clearing up discrepancies in our present results, much more work is needed on weak black liquor. With both agents, extension to other typical surfact- ants, checks with other minerals, including sand st ones from oil-bearing format ions, wider salinity and alkaline earth/alkali metal ion ratios, and effects of temperature are necessary. An inexpensive method of removing constituents which might plug formations also must be worked out; we believe, but cannot guarantee, that this is feasible. Eventually, when a t least favorable, if not optimal, conditions can be specified, validation by core floods will be needed. Because of pressure of other topics o n limited staff, the level of effort at this writing is low, but we hope to be able to d o more toward filling these gaps in early F Y 198 I .
132

15. Miscellanea Interactions. Only those events occurring in the
Winter 1980 quarter, which this report covers, are included; other period are covered in the appropriate report for the time.
W. L. Griffith, J. S. Johnson, Jr., and R.E. Meyer attended the meeting of the principal investigators in DOE supported micellar flood research 14 and 15 January 1980 in Long Beach, California. W. L. Griffith also visited the Laboratory of R. A. Mah at the University of California while in Los Angeles.
A faculty group from the University of Georgia, Athens, visited Oak Ridge National Laboratory 15 February 1980 to discuss possible cooperative efforts. W. R. Finnerty of the Department of Microbiology and Allen King of the Department of Chemistry discussed research of mutual interest with members of the group.
Howard H. Moorer, John A. Alford, and Thomas F. McPartland of the Westvaco laboratories in Charleston, S. C., visited 21 February to discuss enhanced oil recovery chemicals related to the pulp and paper industry.
J. S. Johnson, Jr., attended the information meeting of the enhanced oil recovery program at the Univeristy of Florida, Gainesville, 26 and 27 Febru- ary.
Professor John Ricci consulted at the Laboratoy on the week of 4 February 1980. Phase studies underway in the group were discussed with him.
Dr. M. R. Moldover of the National Bureau of Standards visited our laboratories on 5 March 1980. He gave a seminar on current critical state studies a t the Bureau and discussed our ongoing research.
A group from the Industrial Research Institute visited the Laboratory I 1 and 12 March 1980. A. J . Frisque, Vice-president for Research and Develop- ment, Nalco Chemical Company, was briefed on our enhanced oil recovery research, particularly the part directed a t polymers, by J. S. Johnson, Jr .
Acknowledgements. We have mentioned contribu- tions by several persons not listed as authors in the appropriate sections reporting the research. Here we wish to acknowledge the help of others.
Several undergraduates have participated in research with R. M. Jones on synthesis and evaluation of derivatives of sodium oleate: under the
Southern Colleges and Universities Union, D. Y. Williams (Birmingham Southern College); under Oak Ridge Associated Universities, C. M. Fowler (University of the South, Sewanee); under National Science Foundation, M. Mudano (University of the South, Sewanee); and under Great Lakes Colleges Associaiton / Associated Colleges of the Midwest, K . D. Harshman (Lake Forest College). E. W. Kaler, a research interne between undergraduate and gradu- ate studies, carried out preliminary small angel x-ray measurements. on microemulsions with R. Triolo, research he is continuing as a thesis problem a t the University of Minnesota.
M. Long and E. F. Phares of the ORNL Biology Division carried out the large scale fermentation which provided feed for the tests described in Chapter 2.
We are grateful to Lea J. Breithaupt of the International Paper Company research laboratories in Mobile for providing samples from kraft pulping process streams, and t o H. R. Froningand associates at Amoco Production Research Laboratories, Tulsa, for advice and for carrying out tests we were not equipped to do.
Rat Feeding. The cotton rats, Sigmodon hispillus, which we have been growing in the lab on a diet supplemented with Sclerotium rolfsii biomass, have prospered and multiplied. These animals were used because they have several generations per year, are small and readily manageable, and have a cecal fermentation similar to that of the cattle rumen. Thus, they are effectively bench scale cows. When we started the feeding, we were interested in seeing if the animals either had reproductive difficulties or developed cancer. Since around twenty have died natural deaths and been autopsied by Dr. Eugene Bingham, the veterinary pathologist in charge or the Biology Division Rat Facility, we have found that there appear to be no problems associated with either cancer or reproductive problems in the animals. The two major sources or death have been hairballs - from consuming undigestable bedding - and kidney failure a t around a year and a half to two years ofage, which Dr. Bingham calls the “old rat syndrome”. We cannot currently account for the absence of deaths from cancer in the number. of rats checked.
I33

16. Materials and Methods In general, methods used conform to standard
analytical procedures. Where possible, relatively automated analysis methods have been used, since this increases the number of analyses which can be performed by limited staff. Although we utilize prestandardized analytical reagents where possible, we have listed the ingredients as accurately as possible.
Methods used for culture maintenance and preservation are standard, although some of the media used are not commercially available from sources such as Difco.
The authors recognize the difficulties inherent in writing procedures which provide adequate informa- tion to replicate experiments. Provision of feedback on areas which were not satisfactory would be a help to improve our procedures in subsequent reports. Contacts for this purpose are listed in the fntroduc- tion.
CHEMICAL ANALYSES
Biomass and polymer determination. Biomass and polymer were determined gravimetrically. Biomass was measured in terms of volatile suspended solids, i. e. , filterable solids which volatilize between 102 and 550 C. Biopolymer was generally alcohol precipitated and measured in terms of filterable, air dried solidsat 102 C, but was, in the experiments covering salinity tolerance, measured in terms of volatilesolids so that alcohol precipitable salts entrained in the gelatinous polymer precipitate would not affect the data obtained.
Two 40 ml samples were centrifuged a t 27,000 X g in a Sorvall RS-2 refrigerated centrifuge using a SS- 34 rotor. The centrate from the two replicates was combined for polymer determination and viscosity measurement. The pellets in each sample were twice resuspended in distilled water and centrifuged to wash the suspFnded material. The pellets were again resuspended in distilled water and analyzed for volatile suspended solids as described. These two replicates of volatile suspended solids were averaged and the result taken to be biomass. From the combined centrate, 75 ml was precipitated with three volumes of i-propanol. The precipitated polymer was recovered by filtration through tared 42.5 mm Whatman G F / C glass fiber filters and washed with 30 ml of i-propanol. The samples were then processed as suspended solids samples. Biopolymer
was determined as the weight difference. In the work described in Chapter 6, biopolymer was estimated as volatile suspended solids, since salts precipitating in i-propanol and adhering to the gelatinous biopo- lymer affected the results. The unused portion of the centrate was available for viscosity, pH, or nitrate determinations.
Brookfield viscosity. Prior t o testing, the samples were centrifuged at 27,000 X g in a Sorvall RC-2 refrigerated centrifuge using an SS-34 rotor. A temperature of 15 to 20 C was used during the 30 min centrifugation. After centrifugation, a 0.8 ml sample was withdrawn and placed in a clean Wells- Brookfield LVT-C/ P micro viscometer chamber maintained at constant temperature by recirculated water maintained a t 25.0 k 0.1 C. The viscosity was read a t 2.25,4.50, 11.25,22.5,45, and 90 sec-' and, if possible, a t 225 and 450 sec-I. In general, measure- ments were repeated. Manufacturer's instructions were followed in standardizing and maintaining the instrument.
Where the samples exceeded the viscosity range of the LVT-C/P with a 0.8" cone, we used the Wells- Brookfield RVT-C/P with a 0.8" cone at the same temperature and with the same preparative proce- dures, although the shear rates with the RVT-C/P are3.75,7.50, 18.75,37.5,75, 150,375,and 750sec-l, respectively.
Fatty acid analyses. The gas chromatographic analyses of methyl esters of fatty acids were carried out on a 6 ft X 1 / 8 in stainless steel 5% Dexil300 on loo/ 120 mesh Chromasorb W-AW column and a 6 ft X 1 /8 in stainless steel 6% Silar-5-CP on loo/ 120 mesh Gas Chrom Q column a t 200°C usinga Perkin- Elmer Sigma 3 gas chromatograph with flame ionization detectors. The methyl esters were prepared by diazomethane titration of the fatty acids in ether and injected into the chromatograph without further purification. The pH of the aqueous surfactant solutions was measured using a Coleman Model 38A pH meter with a Corning Semi-Micro No. 476056 Ag/AgCl internal pH Electrode. The in-house distilled water was used in all preparations and cleaning. The alkanes used were all from Aldrich and were 99% or better in purity. The other chemicaJs employed were ACS reagent grade and are discussed in Synthesis and Purification. The nuclear magnetic resonance spectra of the preparations were deter- mined on a Varian EM360 spectrometer. The infra- red spectra were measured on a Beckman 1R8 spectrophotometer. Interfacial tensions were mea-
134

sured by the spinning drop method. Modifications of this device are discussed in the section on interfacial tension.
Neutral solvents determinations. Acetone, bu- tanol, isopropanol, and ethanol concentrations were determined using gas chromatography. One pl samples were injected into a 20 ft X I j 8 in. stainless steel column filled with Porapak Q and operated at 160 C in a Varian 1520B gas chromatograph.
Nitrate specific electrode. The Orion Research model 93-07 nitrate specific electrode was used for nitrate measurements. It was used in conjunction with an Orion 90-02 reference electrode filled with 0.04 M (NH4)zSOd. The electrodes were calibrated against known nitrate concentration solutions and the resultant calibration curve or its equation were used for determination of nitrate concentration.
As per the manufacturer’s instructions, 2 ml of 2 M (NH4)2S04 was added to every 100 ml of sample. Some anions, including nitrate, cyanide, bicarbo- nate, and chloride can cause interferences in the determination of nitrate. However, these materials affect the nitrate electrode less by one or more orders of magnitude than does a given concentration of nit rate.
pH. The Corning model 112 pH meter was standardized and used, following the manufacturer’s instructions, for pH determination. Fisher pH 4.00, 7.00, and 10.00 buffer solutions were used for calibration. Since sample volumes were generally small, a combination electrode (Corning No. 476056) was used.
Plugging. Our standard plugging test used flux through a porous Gelman 1.2 p m Acropor AN membrane at 15 psig for 1 hr, as a measure of solution flux through a porous body. We selected this particular test because the results can be compared with many industrial tests. To perform the plugging test, a 1 in2 section of 1.2 p Acropor AN membrane was wetted with ethyl or isopropyl alcohol until translucent, washed several times in distilled water, and placed in a filter holder a t the bottom of a 300 ml pressure chamber. The chamber was filled with the test culture broth diluted 1 : l O with filtered distilled water. The chamber was closed and placed under 15 psig for a period of 1 hr. The plugging test apparatus was previously shown in Fig. 5.3. Filtrates over4 min intervals were collected into tared plastic vials and their weight determined using a Mettler four-place balance. The results were plotted as flux, or volumetric flow through a given area per unit time.
Reducing sugar. Hycel 283 MX direct sugar reagent, which is 3 to 3.5% o-toluidine in glacial
acetic acid, was used for reducingsugaranalysis. A 25 to 100plsamplewasplaced in6 mlofthe Hyceldirect sugar reagent and heated in a heating block at 80°C for 29 min. After heating, the samples were cooled and the optical density or concentration determined at 590 nm. using a Beckman DU with a Gilford digital Model 250 spectrophotometer. A 1 % glucose standard was used, and heated direct sugar reagent was used as a blank. All reducing sugar measure- ments are expressed as glucose, although the test may respond to other reducing sugars.
As an alternative method of reducing sugar analysis, we used a. Technicon AutoAnalyzer I 1 following the manufacturer’s instructions for redu- cing sugar analysis. Sigma o-toluidine reagent 635-6, which has 6% o-toluidine in glacial acetic acid, was used as the stockanalytical reagent with the AutoAn- alyzer.
Suspended solids. With minor modifications, the method used follows Srandard merhods .for the examination of water and wastewarer. A 42.5 mm Whatman GF/Cglassfiberfilter was weighed usinga 4 place Mettler balance. The filter was placed in a Millipore glass filter holder with a teflon rim, put under vacuum, and wet with filtered distilled water. A small aliquot of sample, usually between 5 and 20 ml, was filtered. The filter is washed with three 10 ml aliquots of 70°C filtered distilled water and the vacuum released. The filter was dried at 102 C for a t least 1 hr or until the weight remains constant. A blank washed with three 10 ml aliquots of 70 C filtered distilled water was processed concurrently and used to correct for the small weight change generally observed with glass fiber filters during processing. After correction for the weight change in the blank, the suspended solids were computed as g/ liter of total suspended solids.
The samples were then fired at 550 C for 30 min and reweighed. After correction for weight changes in blanks, the suspended solids were computed as g/liter of fixed (or fired) suspended solids. Fixed suspended solids are a measure of the inorganic ion content of the sample.
Two-phase titration method for determination of anion active detergent. T o a known weight or aliquot of sample containing 0.005 to 0.1 moles of active matter, add H20 to make a volume ofapproximately 30 ml. Add to this I O ml mixed indicator solution previously prepared as a concentrate and diluted with H20 and H2S04 to a working solution at 0.01M aciditiy. Then 15 ml chloroform is added to the sample which is in a 100 ml bottle with cap suitable for shaking. This prepared sample is titrated with
0.004 M Hyamine 1622, a cationic active detergent (Rohm and Haas). Titrant is added by increments followed by vigorous shaking after each addition. The end point is taken when the color in the chloroform layer changes from red to blue (Reid, et al 1967). (Note: The mixed indicator is disulphine blue VN + dimidium bromide. Hyamine 1622 is standar- dized by titration against ultra pure sodium lauryl sulphate (Fluka).)
CULTURE MANAGEMENT
Biopolymer broth production. Broth from a Sclerotium, Stromutinia, or Helotium culture, unless otherwise stated, was from aculture innoculated with a 1 to 5%v/v innoculum and grown at 26 to 27 C until adequate polymer production, a s measured by precipitation of an aliquot, was reached. The fermentation was allowed to proceed until polymer production was maximal. This generally occurred near a reducing sugar level of 0.5%. After fermenta- tion was judged to be complete, the broth is brought to a pH 7 in the fermenter. I t was then placed in a 40 liter stainless kettle and heated a t 90 C for 90 min. The hot fermenter broth was blended in a 4 liter Waring blender for 2 rnin on low speed and 1 rnin on high speed.
During tests, post fermentation broth treatment was varied. As used in microscreening tests, neutruli- zation means to bring broth pH to 7, autoclaving means to heat broth at 90 C for 90 rnin in a 40 liter stainless kettle, and blending means to blend in a 4 liter Waring blender for2 min on low speed and 1 rnin on high speed.
Biopolymer media. Liquid cultures were generally grown in a medium consisting of (per liter): 50 g anhydrous glucose, 3 g NaNO,, I ml H3PO4, 0.5 g MgS04.7Hz0,0.5 g KC1,0.05 g FeSO4,and 1 geither Amber or Difco yeast extract a t a temperature of 26 to 27 C. Other carbohydrates including starch or sucrose, may be substituted for glucose. The amount of carbohydrate may also be varied between 3 and 6%
Clostridia cultures were grown on medium 38 of the American Type Culture Collection Catalogue of Strains (Hatt 1976) which was made by placing a small amount of blended pork liver in the bottom o fa 10 ml serum bottle together with a small amount of granular calcium carbonate. The meat was covered with 0.5 ml of a solution of 100 g / I peptone (Difco) and I O g / l dibasic potassium phosphate. The bottles were capped and autoclaved a t 15 psi for 20 min.
w/v.
Carbohydrate solutions, with the exception of cellulose and xylan were prepared as20%solutions in distilled water and autoclaved separately to prevent caramelization of the sugar. Because xylan and cellulose are difficult to aliquot after autoclaving, these were autoclaved with the meat-broth mixture. After sterilization of the components was complete, the sugar solutions were added to the meat-broth mixture to provide 2 . 5 , 5 , and lO%sugdrconcns,and the final solution volumes adjusted with sterile distilled water to 5 ml. The cultures were innoculated with 50 microliters of log phase culture and were incubated a t 37 C for a t least 4 days or until gas production ceased. The cultures were vented daily to prevent the accumulation of too much pressure in the culture vials. Admittedly, liver medium is not an optimum medium for the production of neutral solvents; however, it has been an extensively used screening medium for solvent production and appears to satisfy the nutritional requirements of many Clostridia.
The cultures used were kind gifts of the Northern Regional Research Laboratory in Peoria, Illinois. Clostridium ucetobutj~licum strains N RRL B527 and NRRL B3179; Closrridiuni burylicum strainsNRRL B592 and NRRL B593; and Clostridium pasteuri- anum strain NRRL B598. These organisms were maintained on the beef liver medium above with glucose as a carbon source and a heavy layer of crushed limestone in the fermentation vessel.
Enzyme production medium. BSP medium, which contains 170 g/liter bran, I O g/liter Difco soytone 0436-01, I O glliter Difco peptone 0118-01, and I g/liter MgS04 (heptahydrate), was layered toadepth of 1 in . in Fernbach flasks, and autoclaved for 30 rnin at 121 C. After innoculation, the flasks were incubated at 25 C for a period of a t least one week, until culture attack on the bran medium was apparent.
Enzyme purification from fungal cultures. Culture medium was diluted 2.5:l with distilled water, blenderized, and centrifuged in a Sorvall GSA rotor a t 13,000 X g for 30 rnin a t 4 C. The liquid was decanted and the pellets were washed once with distilled water. The liquid was made 70% saturated with (NH4)2S04 and recentrifuged. Solids from the centrifugation were pooled and resuspended in distilled water. Approximately 0.6 g Sephadex G-IO per ml liquid was added and the mixture was refrigerated for 4 hr. The paste was placed in a sintered glass filter under vacuum and the liquid removed from Sephadex beads. A wash ofabout 10% of bed volume of distilled water was then app!ied and
I36

removed under vacuum. The product was portioned and lyophillized. It was stored prior to use in a Revco freezer a t -70 C.
Enzyme purification from HP-150. Rohm and Haas HP-150 enzyme was mixed in distilled water to form a 10% w/v solution and filtered through a Whatman G F / C glass fiber filter. The undissolved material remaining on the filter was dissolved in 0.05 M sodium citrate, pH 4.5, with 0.0 1 M MgS04 and used with xanthan gum a s a substrate.
Enzyme incubation. With the exceptions noted under pH and temperature variation, all enzyme incubations were performed using the methods developed by Reese and Mandels (1966) although 0.01M MgS04 was added to their standard test solution of 0.5% w/v polysaccharide with 0.05 M sodium citrate, pH 4.5. To suspend the polysacchar- ide, it was generally sheared in a Waring blendor for a period of a t least 3 min on high. Polymer samples were then aliquotted into serum vials, capped, and autoclaved a t 121 C for 30 min. Unless otherwise noted, incubations were performed a t 50 C. Where a bound enzyme column was used, temperature was maintained by a heated water jacket.
Fungal culture preservation. Sclerotium, Stro- matinia and Helotium strains are maintained as frozen cultures in 10% glycerol. At early to mid log phase, the cultures were sterily centrifuged at 10,000 X g in a Sorvall RC-2 centrifuge using a GS-3 rotor. The pellets were resuspended in sterile medium containing 10% glycerol v/v, aliquotted, sealed, and frozen a t -70 C in a Revco. The cultures were revived by thawing the container out in cool water with agitation. These cultures remain viable for long periods of time frozen in glycerol; however, several culture collections maintaining the cultures on slants have been unable to grow slant cultures out.
Rhizopus arrhizius QM I032 was obtained from the Quartermaster Corps Culture Collection through the kind offices of Dr. Emory G . Simmons of the University of Massachusetts at Amherst, who was at that time maintaining the collection. Phanaerochaete chrysosporium WlSC-HHB4251-SP was obtained through the offices of Dr. Kent Kirk of the Forest Products Laboratory in Madison, Wisconsin.
With the exception of Sclerotium, Srromatinia and Helotium strains, cultures were maintained on Difco 0013-01 potatodextrose agarslantsin I X 4 inscrew- cap vials held at 4 C.
One liter fermentations. Cultures were grown on glucose nitrate medium with a 50 g/liter glucose carbon source at 18°C. Spores or plugs from slants were placed in I liter Bellco 1964-SO006 fermenters,
shown in Fig. 16.1, and stirred for the periods indicated. Except for periods of heaviest growth, the fermenters were not aerated.
Ten liter fermentations. Unless otherwise stated, these fermentations were carried out in a Chemapec Type GFOO14 fermenter in which the broth was aerated a t 1 v / v air/ min.
360 liter fermentations. The large fermentations were prepared in the ORNL Biology Division fermentation facility. The fermentations were con- ducted using the same medium, but the culture innoculum was a t 3% v/v, rather than a t 5%. The Ceca production culture, rather than ATCC culture, was used. Less than the normal I v /v airlmin was used, but the fermenter pressure was increased to provide adequate dissolved oxygen.
FILTRATION AND SCREENING
Axial filtration. Axial filtration was used for both prefiltration screening and membrane filtration. The
AIR STONE-
.
P W .o I L 0 3
I?! I. yl
!------ 100 OD 1 Fig. 16.1. Bellco one liter fermenter. Dimensions
shown are in mm.
I37
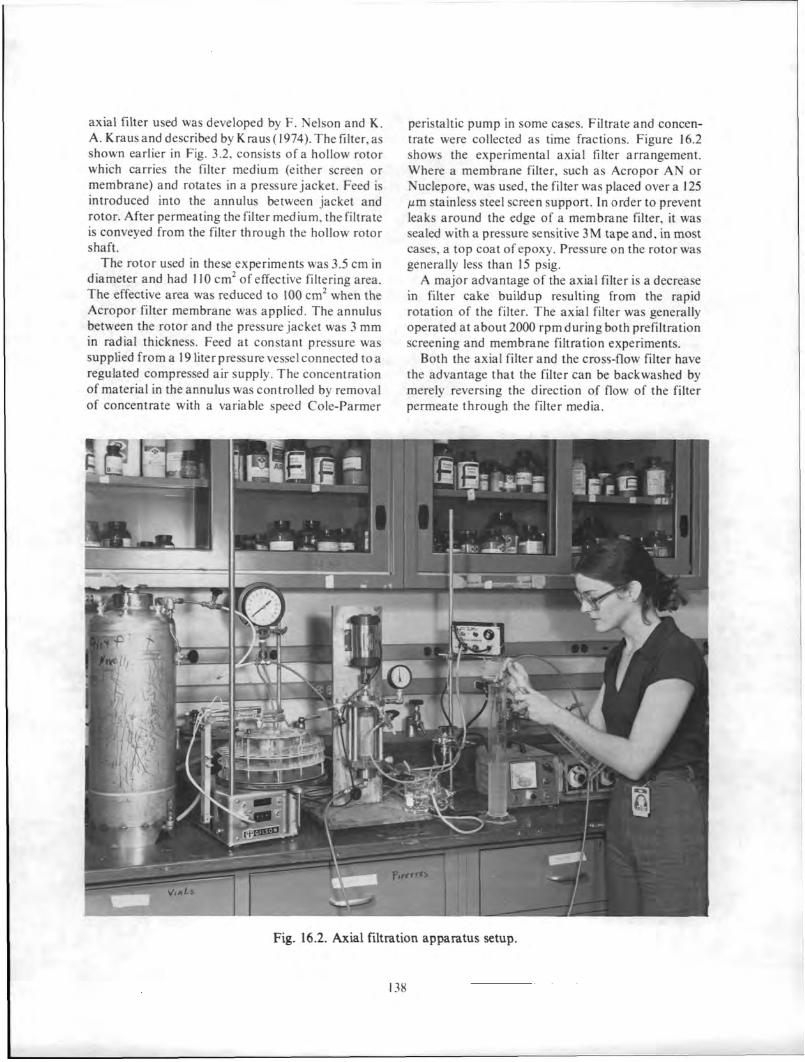
axial filter used was developed by F. Nelson and K . A. Kraus and described by Kraus ( 1974). The filter, as shown earlier in Fig. 3.2, consists of a hollow rotor which carries the filter medium (either screen or membrane) and rotates in a pressure jacket. Feed is introduced into the annulus between jacket and rotor. After permeating the filter medium, the filtrate is conveyed from the filter through the hollow rotor shaft.
The rotor used in these experiments was 3.5 cm in diameter and had I I O cm2 of effective filtering area. The effective area was reduced to 100 cmz when the Acropor filter membrane was applied. The annulus between the rotor and the pressurejacket was 3 mm in radial thickness. Feed a t constant pressure was supplied from a I9 liter pressure vessel connected to a regulated compressed air supply. The concentration of material in the annulus was controlled by removal of concentrate with a variable speed Cole-Parmer
-.; 2f j; -1
peristaltic pump in some cases. Filtrate and concen- trate were collected as time fractions. Figure 16.2 shows the experimental axial filter arrangement. Where a membrane filter, such as Acropor AN or Nuclepore, was used, the filter was placed over a 125 pm stainless steel screen support. In order to prevent leaks around the edge of a membrane filter, it was sealed with a pressure sensitive 3 M tape and, in most cases, a top coat of epoxy. Pressure on the rotor was generally less than 15 psig.
A major advantage of the axial filter is a decrease in filter cake buildup resulting from the rapid rotation of the filter. The axial filter was generally operated a t about 2000 rpm during both prefiltration screening and membrane filtration experiments.
Both the axial filter and the cross-flow filter have the advantage that the filter can be backwashed by merely reversing the direction of flow of the filter permeate through the filter media.
Fig. 16.2. Axial filtration apparatus setup.
I38

BATCH MICROSCREEN TESTS
The two microscreening procedures which we have used were taken directly from Crane and Envirex, two manufacturers of microscreening equipment. They were kind enough to send us their test equipment and procedures. We have reproduced their procedures below to illustrate the relative simplicity of evaluating this equipment, and would recommend contacting these companies directly if further information is desired.
Crane procedure. Crane furnishes a microstrainer test apparatus which holds a 2.5 in. diameter screen between O-rings and provides a 4.5 in. head above the screen, as shown earlier in Fig. 2.2. An approxima- tion of required microscreen surface area can be obtained by using the equation in Microscreening.
I . Collect a representative sample.
2. Hold test tube over calibrated collection beaker or bottle.
3. Determine the volume of filtrate passed through the microfabricin9 sec while maintaining the test apparatus full by continuing to pour in sample.
4. Empty the tube and thoroughly clean the fabric by backflushing and rinsing in hypochlorite solu- tion.
5. Repeat steps 1 to 4 several times to obtain average
6. Compare filtrate with original sample visually, or, if test equipment is available, measure the dry weight of suspended solids in the raw and filtered sample.
7. Using the average amount collected in 9 sec, estimate the required microstrainer size.
conditions.
Envirex procedure. The major d ifferences between the Crane and Envirex procedures for microstrainer evaluation arethe use of a header box with adjustable filter head and a variable filtration throughput time. As the procedure below shows, there is little other difference between the two procedures. The Envirex apparatus was shown earlier in Fig. 2.3.
I . Select a desired headloss for the test run and install the proper length tube into the constant head box.
2. Install the screen media sample to be tested in the proper position.
3.
4.
5.
6 .
7.
8.
Fill the head box such that the liquid level is near the top of the tray. Also determine raw sample characteristics.
Select a submergence time for the test run.
Using a stopwatch a t time zero pull the plug and collect the flow that passes the screen media for exactly the submergence time selected in Step 4 and then replace the plug.
Measure the volume collected and analyze it to determine the amount of solids removed.
Remove the screen holder and backwash the screen media with two passes simulating the backwash- ing under full scale conditions. (Note that i t is not necessary to remove the screen media from the holder to accomplish this.) The direction of backwashing must be opposite to thedirection of sample flow passing through the screen media. Quantitivatively evaluate how well backwashing can be accomplished.
Repeat steps I to 7. (In a formal test program each test run should be made in triplicate.)
MICROSCREEN PILOT PROCEDURE
The pilot unit used was a 4 ft X 2 ft fully automated microscreen. In tests here, initially the polymer feed was partially diluted broth (- 1:4 with filtered distilled water) in a feed tank, and the microscreen tank and drum were filled up to theeffluent weir level with filtered distilled water. The -8:l dilution of fermentation broth adopted as standard for these tests refers to the total dilution of original broth by both the water added priorto microscreening and the water in the microscreen and its tank. Because of limited broth available for the tests, effluent and backwash were recycled to the continuosly mixed feed tank. In all runs except for the first 1 p m screen run, essentially complete mixing was attained. Performance of the screening was evaluated on the basis of samples taken from the influent to the microscreen and from the filtrate exiting from the microscreen weir. The first run was dropped from consideration because of incomplete mixing. In other runs, early points may not reflect complete mixing.
During operation, a record of headloss; drum submergence; backwash composition, pressure, and flow; effluent flow; and media size and type was kept, and was shown in Chapter 2. Since the first 1 p m media run did not appear to reach a point where
I39

effluent and influent polymer concentrations were comparable; since this appeared due to insufficient mixing, the 1 pm run was repeated after the 6 pm run. The last run was the treatment ofeffluent from the 21 pm screen through I pm media to determine the efficiency of two step treatment.
ORGANIC SYNTHESIS
This section includes the purification of the starting materials for synthesis of substituted oleic acids, their preparation, and their purification. Methods used in analysis of oleic acid and oleic acid derivatives are listed under Chemical analj~ses.
Oleic Acid
Purification of oleic acid. The technical grade oleic acid available from Eastman Kodak Co. was repeatedly distilled under 0.01 mm Hg pressure to a boiling range of 164 - 165°C. Eighty grams of this material was made up to I liter with reagent grade acetone and cooled to -20°C for 24 hr, yielding a small amount of mostly saturated acids (m.p. 25 - 35°C) which were collected by vacuum filtration and discarded. The mother liquor was evaporated to 750 ml and again cooled to -20°C for24 hr. The purity of this crop varied. and i t was returned forredistillation with the lower boiling fractions from above. The mother liquor was further evaporated to 500 ml and cooled to -20 C. In 6 to 12 hr, oleic acid crystallized as long white needles. This crop (rn.p. -5 C), was isolated by rapid suction filtration and was recrystal- lized twice from a c e t p e in a total volume of 300 ml. This material melted at -15 C and was taken up in ether and dried over MgS04. Distillation taking the fraction distilling at 164 C, 0.05 mm Hg yielded 68 g of 97.3% purity as determined by glc of its methyl ester. Altogether 180gof99%oleicacid was prepared by repeated alternation of recrystallization from acetone and vacuum distillation from a total of 225 g of combined 97% pure material prepared in this fashion. This material, distilling at 174-175 C and 0.01 mm Hg, was completely colorless. It was stored at -20 C. U V (heptane): end absorption<200 nm, t - 10,000; shoulder 218 nm, E = 321 implying < I % of diene; tailing to E = 1 a t 340 nm; t < I to 900 nm. Analysis (Galbraith Laboratories, Inc.. Knoxville, Tennessee) found 76.36%C, 12.28%H; calc. 76.54%C, 12. I3%H.
Synthesis and Purification of 2-Substituted Oleic Acids
2-Methyloleic Acid. Following essentially Pfeffer’s procedure for preparation of a-substituted fatty acids (P. E. Pfeffer, et u/., 1972), 165 ml’of freshly distilled tetrahydrofuran (THF) and 24.7 g of diisopropylamine were added to a flame-dried 2-liter, 3-necked round bottom flask containing an efficient magnetic stir bar and equipped with a low temperat- ure thermometer, 500 mi dropping funnel and argon inlet teed to a flow bubbler. After flushing with argon, the contents of the flask were cooled to -20 C and 148 ml of 1.6 M n-butyllithium in n-hexane was added dropwise with stirring under an argon atmosphere keeping the temperature well below 0 C. The 500 ml addition funnel was then replaced with a clean, dry 150 ml addition funnel through which was added dropwise 28.3 g of 99% pure oleic acid followed by 22.3 g of hexamethylphosphoramide (HMPA), keeping the flask temperature <O C. The reaction mixture was allowed to come to room temperature and stirred for one hour. The reaction mixture was then recooled to 0 C and 16.2 g iodomethane was added dropwise. With the comple- tion of this addition, the flask was allowed to warm to room temperature slowly; and stirring under argon was continued for 18 hr. At the end of this time, the reaction was stopped by slowly adding 385 ml of ice- cold 10% HCI with stirring. The organicand aqueous layers were separated, the organic phase was extracted twice with 100 ml saturated NaCl solution, and the aqueous phase was extracted twice with 150 ml portions of hexane. The organic layers were combined and dried over Na2S04. The combined aqueous phases were saturated with NaCl and subjected to continuous extraction with a 250 ml portion of hexane. After three hours the hexane was replaced with another 250 ml portion and extraction continued overnight. The hexane extracts were then combined, washed with three 100 ml portions of ice- cold 10% HCI, three 100 ml portions of dilute NaCl nnd dried over Na2S04. The dried hexane extracts and the original reaction flask work-up were combined, filtered, and rotary evaporated to remove the T H F and hexane.
The crude 2-methyloleic acid was distilled through a microware heating tape wrapped, 6 in. glass helix packed, 8 in. column a t 140 C. The pot temperature ranged from 196 C to 228 C, the head temperature from 66 C to 180 C, and the vacuum from 0.03 to 0.005 torr. The fourth fraction distilled between 170
I40
C and 176 C at 0.005 torr. Fraction 4 was redistilled as was the combined fractions two and three. The final fractions ofthese twodistillations (156-158 C a t 0.02 torr and 151-154 C a t 0.01 torr) werecombined and subjected to two low temperaturecrystallizations from 150 ml acetone in a submersible filtration system. The acid was crystallized by cooling the contents to -65 C by submersion into a dewar containing dry ice and acetone. After two hours at this temperature, the filtrate was pulled off through the medium porosity fritted glass filter using argon pressure against vacuum, cooling the receiver with dry ice and acetone to achieve a low vapor pressure. The procedure was repeated by warming to melt the crystals, adding another 150 ml acetone and recooling to -65 C. The resulting 2-methyloleic acid was taken up in ether and dried overnight over Na2S04, then redistilled after filtration with the major fraction being taken a t 155 C to I56 C with the pot at 198 C and 0.01 torr. This material analyzed to be 99% pure by gas chromatography of its methyl ester a t 250 C and of final weight 18.3 g. U V (heptane); end absorption < 200 nm, - 10,000; shoulder 220 nm, t=380 implying< IRdiene; tailing to E = 1 at 380 nm; t < 1 to 900 nm. Analysis (Galbraith Laboratories, Inc., Knoxville, Tennessee): found 77.12% C, 12.1 1% H; calc. 76.97% C, 12.24% H.
2-Ethyloleic Acid. The 2-ethyloleic acid was prepared following the same procedure as that used in the 2-methyloleic acid synthesis with the iodome- thane being replaced by 12.3 g ethyl bromide. The crude 2-ethyloleic acid was distilled through a microware, heating tape wrapped, 6 in. glass helix packed, 8 in. column with the pot temperature ranging from 172 to 194 C, the head temperature ranging between 149 and 162 C with a pressure range of 0.03 to 0.01 torr. The major (final) fraction, 26 g, collected at 153-155 C at 0.02 torr, was dissolved in 150 ml acetone and subjected to two low temperature (-65 C ) crystallizations. The resulting 2-ethyloleic acid was taken up in ether, dried overnight over Na2S04, filtered and redistilled with the major fraction distilling at 159-160 C at 0.03 torr. This material analyzed to be 98.3% 2ethyloleic acid and I .6% oleic acid by gas chromatography of its methyl ester and weighed 15.6 g. U V (heptane): end absorption <200 nm, e - 10,000; shoulder 219 nm, t 193 implying<0.5%diene;tailingtot= I at370nm;e < I to 900 nm. Analysis ( Galbraith Laboratories, Inc., Knoxville, Tennessee): found 77.27% C, 12.26% H; calc. 77.36% C, 12.34% H .
2-Butyloleic Acid. The 2-butyloleic acid was prepared following the procedure described for 2- methyloleic acid with the iodomethane being replaced by 15.5 g n-butylbromide. The crude 2- butyloleic acid isolated by hexane extraction was distilled through a microware, heating tape wrapped, 6 in. glass helix - packed, 8 in. column with the pot temperature ranging from 175 to 220 C, the head temperature ranging between 150 and 180 C with a pressure range of 0.06 to 0.01 torr. The major (final) fraction, 25.4 g, collected at 176-179 C at 0.02 torr, was dissolved in 150 ml acetone and subjected to two low temperature (-65 C) crystallizations from 150 ml acetone. The resulting 2-butyloleic acid was taken up in ether, dried overnight over NaZS04, filtered and redistilled with the major fraction distilling at 179- 180 C at 0.02 torr. This material analyzed t o be 97% 2-butyloleic acid and 2.1% oleic acid by gas chromatography of the methyl ester and weighed 18.6 g. U V (heptane): end absorption < 200 nm, e 10,000; shoulder 219 nm, E = 236 implying < 1% diene; tailing to t = I a t 360 nm; t < 1 to 900 nm. Analysis (Galbraith Laboratories, Inc., Knoxville, Tennessee): found 77.80% C, 12.42% H; calc. 78.05% C, 12.50% H.
2-Hexyloleic Acid. The 2-hexyloleic acid was prepared following the procedure described for 2- methyloleic acid with the iodomethane being replaced by 18.2 g of I-bromohexane. The crude 2- hexyloleic acid isolated by hexane extraction was distilled through a microware, heating tape wrapped, 6 in. glass helix packed, 8 in. column with the pot temperature ranging from 183 to 230 C, the head temperature ranging between 180 and 210 C with a pressure range of 0.06 to 0.01 torr. The major (final) fraction, 33.6 g, collected a t 190-196 C at 0.04 torr, was dissolved in 150 ml acetone and subjected t o two low temperature ( -65 C) crystallizations from 150 ml acetone. The resulting 2-hexyloleic acid was taken up in ether, dried overnight over NaZS04, filtered and redistilled with the major fraction distilling at 191- 192 C at 0.03 torr. This material analyzed to be 97% 2-hexyloleic acid and 2.3% oleic acid by gas chromatography of the methyl ester and weighed 117.5 g. U V (heptane): end absorption < 200 nm, t - 10,000; shoulder 220 nm, E 202 implying < 0.5% diene; tailing to t = I a t 360 nm; t < I to 900 nm. Analysis (Galbraith Laboratories, Inc., Knoxville, Tennessee): found 78.71% C , 12.75% H;calc. 78.62% C, 12.65% H.
2,ZDimethyloleic Acid. The 2,2-dimethyloleic acid was prepared following the procedure described

for 2-methyloleic acid with the following exceptions: ( I ) 30 g of crude 2-methyloleic acid prepared as described above was used instead of 28.3 g of oleic acid and (2) HMPA was not used as suggested by Pfeffer (Pfeffer, Silbert and Chrinko, 1972). The crude product of this reaction isolated by hexane extraction and evaporation of the hexane, after drying over NazS04, was carried through the alkylation procedure a second time to assure complete dialkylation. The crude 2,2-dimethyloleic acid isolated by hexane extraction was distilled through a microware, heating tape wrapped, 6 in. glass helix packed, 8 in. column with the pot temperature ranging from 170 to 230 C, the head temperature ranging between 100 and 185 C with a pressure range of 0.05 torr to 0.01 torr. The major (final) fraction, 25.5 g, collected a t 180-185 C a t 0.05 torr, was dissolved in I50 ml acetoneand subjected to two low temperature (-65 C) crystallizations from I50 ml acetone. The resulting 2,2dimethyloleic acid was taken up in ether, dried overnight over Na2S04, filtered and redistilled with the major fraction distilling at 154-155 C at 0.01 torr. This material analyzed to be 97% 2,2dimethyloleic acid, 2.0% 2- methyloleic acid and 0.5% oleic acid by gas chromatography of the methyl esters and weighed 15.6 g. U V (heptane); end absorption < 200 nm, E - 10,000; shoulder 222 nm, r 500 implying < 1.5% diene; tailing to r = 1 a t 370 nm; E < 1 to 900 nm. Analysis (Galbraith Laboratories, Inc., Knoxville, Tennessee): found 77.26% C, 12.40% H ; calc. 77.36% C, 12.34% H.
2,2-Diethyloleic Acid. The 2,2-d iethyloleic acid was prepared following the procedure described for 2-methyloleic acid with the following exceptions: ( I ) 30 g of crude 2-ethyloleic acid prepared as described above, wasused instead of28.3gofoleicacid,(2) 12.3 g of ethyl bromide replaced the iodomethane, and (3) HMPA was not used. The crude product of this
reaction, isolated by hexane extraction and evapora- tion of the hexane after drying over Na2S04 was carried through the alkylation procedure a second time to assure complete dialkylation. The crude 2,2- dimethyloleic acid isolated by hexane extraction was distilled through a microware, heating tape wrapped, 6 in. glass helix packed, 8 in. column with the pot temperature ranging from 170 to 220 C, the head temperature ranging between 166 and 177 C with a pressure range of 0.05 to 0.01 torr. The major (final) fraction, 32.7 g collected a t 175-1 77 C at 0.05 torr, was dissolved in 150 ml acetone and subjected to two low temperature (-65 C) crystallizations from 150 ml acetone. The resulting 2,2diethyloleicacid was taken up in ether, dried overnight over Na2S04, filtered and redistilled with the major fraction distilling at 174- 174.5 at 0.01 torr. This materialanalyzed to be96.5% 2,2-diethyloleic acid, 2.8% 2ethyloleic acid and 0.5% oleic acid by gaschromatography of the methyl esters and weighed 18.2 g. U V (heptane): end absorption < 200 nm, E 10,000; shoulder 221 nm, E = 543 implying < 0.5% diene; tailing to E = I a t 360 nm; E < 1 to 900 nm. Analysis (Galbraith Lboratories, Inc., Knoxville, Tennessee): found 78.22% C. 12.35% H, calc. 78.05% C, 12.50% H.
Petroleum Sulfonate Purification
Deoiling of petroleum sulfonate (Witco TRS 10- 80). A weighed sample of material was place in vacuum oven at 50 C overnight t o remove volatiles. The material was then dissolved in chloroform and adsorbed onto a column of silica gel. The column was washed with chloroform until no oil was present. I f the oil content of the sample is desired, tared beakers should be used to collect effluent and samples evaporated and reweighed. Then surfactant is extracted from silica gel using isopropanol.
I42

17. References
Ahearn, G . P., and Turbak, A . F. 1966. Surfactant for petroleum recovery. U.S. Patent 3,283,812.
American Public Health Association, American Water Works Association, and Water Pollution Control Federation. 1975. Siandard methods .for the examinafiarr of tt’ater and wastewafer. Fourteenth edition. Washington, D.C.: American Public Health Association.
Anonymous. 1979. American Can and Texaco sign agreement on lignin. Paper Trade ./orrrnal 163( 12): 21.
Anonymous. 1979. Wood chemicals inject new life into tired oil wells. Chemical Week 124(25): 65.
Arizona Chemical Company. 1976. Actinol tall oil clerivaiives. (Bulletin).
Baldwin, W. H., and Neal, G. W. 1979. Colloidal properties of sodium carboxylates. I n Chen~isti:~; of Oil Recovery, American Chemical Society Symposium Series, vol. 91, ed. R. T. Johansen and R . L. Berg, pp. 75-85. Washington, D. C.: American Chemical Society.
Baldwin, W. H.;Compere, A. L.; Crenshaw,J. M.;Griffith, W. L.; Hall, J . E; Harrison. N. E.: Johnson, J . S. ,Jr . ; McDaniel, V.; Neal, G. W.; Smith, D. H.; Westmoreland. C . G. 1979. Cl?en~icals/or enliancecloilrecover~.. Annual report for the period April 1977 to April 1978. U.S. Department of Energy report BETC/W26-4.
Bansal, B. B.; Hornof, V., and Neale, G. 1979. Enhanced oil recovery using lignosulfonates. CanarJian.Journalyf Chemical Engineering 57: 203-21 0.
Bansal, V. K., and Shah, D. 0. 1978. The effect of ethoxylated sulfonates on salt tolerance and optimal salinity of
Barr, A. J.; Goodnight, J. H.; Sall, J . P.; and Helwig, J . T. 1976. A user’s guide io SAA-76. Raleigh, North
Benton, W. J. ; Natoli, J.; Qutubuddin, S.; Mukherjee, S.; Miller, C. A., and Fort, T., Jr . 1980. Phase behavior
Bourrel, M.; Salager, J . L.; Schechter, R. S.; and Wade, W. H. 1980. A correlation for phase behavior of
surfactant formulations for tertiary oil recovery. Socief.1’ of PetroIeim Engineers’s Journal IS: 167-1 72.
Carolina: SAS Institute, Inc.
studies of two model surfactant systems. Society of Petroleum Engineers’ ./ournu1 paper 8984.
nonionic surfactants. Journal of Colloid and Interface Science. 75: 45 1-46 I .
Buchanan, B. B., and Cottle, J . E. 1973. Recovery of microbial polysaccharides. U.S. Patent 3,773.752.
Chiu, Y. C. 1974. Digested alkaline tall oil pitch soap composition. U.S. Patent 3,823,774.
Chiu, Y. C. 1975. Digested alkaline tall oil pitch soap composition. U.S. Patent 3,892,668.
Chiu, Y . C. 1978. Tall oil pitch in chemical recovery. In Proceedings, Fall Technical Conference ofthe National Society of Petroleum Engineers. Houston, Texas, paper 7578. Dallas, Texas: American Institute of Mining Engineers.
Colegrove, G. T. 1970. Treatment of xanthomonas hydrophillic colloid and resulting product. U.S. Patent 3 3 16,983.
Colegrove, C. T. 1977. Clarification of xanthan gum. U.S. Patent 4.010,071.
Compere, A. L.; Crenshaw, J . M.;Greene, S. V.;Griffith, W. L.; Hall,J. E., Jr.;.lohnson.J. S., Jr.;Jones, R . M.; Magid, L. J.; Westmoreland, C. G.; and Williams, D. Y. Chemicalsfor enhanc.ecl oil recovery. Quarterly report for the period 1 January 1979 to 31 March 1979. U.S. Department of Energyreport BETCIW26-5.
Compere, A. L.; Crenshaw, J . M.; Fowler. C. M.; Greene, S . V . ; Griffith, W. L.; Johnson. J . S. , Jr.; Jones, R. M. ; Magid, L. J.; Westmoreland, C. G.; and Williams, D. Y. CheniicalsJor enhanced oil reco\:et:l;. Quarterly report for the period I April to 30 June 1979. U.S. Department of Energy report RETC/W26-8.
I43
Compere, A. L.; Crenshaw, J . M.; Greene, S. V.; Griffith, W. L.; Johnson, J . S. Jr . ; Jones, R. M.; Kahler, E. W.; Magid, L. J.; Triolo, R.;and Westmoreland, C. G. 1980. Cheniical.s,/or enhanced oil recoverj). Quarterly report for the period I July to 30 September 1979. U.S. Department of Energy report BETC/ W26-IO.
Compere, A. L.; Crenshaw, J . M.; Greene, S. V.; Griffith, W. L.; Harshman, K.; Johnson,.I. S., Jr.; Jones, R. M.; Magid, L. M.; Triolo, R.; Westmoreland, C. G. 1980. Chen?ic~al.s~for enliancc~rloilreco\~er~v. Quarterly report for the period I October t o 31 December 1979. U. S. Department of Energy report DOE/BETC/OR-15.
Cravens, J . B. and Kormanik,R. A. 1979. The upgrading of lagoons and wastewater treatment plants via
Dahlheimer, J.A.; Thomas, D. G.; and Kraus, K . A. 1970. Hyperfiltration. Inclratriul and Engineering
Diaper, E. W. J ., Jr. 1970. Microstrainer test kit: instructionsfor use. Crane Company, Cochrane Environmental
microscreening. Journal of the Water Pollution Control Federation ( 1 n press).
Chemistry. Process Design and Development 9: 565-569.
Systems.
Societ?, 55: 505, 513. Doe, P. H.; El-Emary, M.; Schechter, R. S.; and Wade. W. H . 1978. Journal o f the Atnerican Oil Cheniists
Durham, K. 1955. The interaction of monolayers of branched-chain fatty acids with calcium ions in the
Engineering Science, lnc. 197 I . Invesrigution of response sui-faces of rhe tnicroscwen process. U.S.
Evans, H. C. 1956. Alkyl sulfates. Part I . Critical micelle concentrations of the sodium salts. Cliet?iicalSoc~ietj~o/
Ferguson, R. B., and Westover, J. D. 1969. Aqueous suspension of fungal polysaccharide subjected to shearing forces. U.S. patent 3,436,31 I .
Fleming, P. D., I I , and Vinatieri, J . E. 1979. Quantitative interpretation of phase volume behavior of multicomponent systems near critical points. Journal o f the Atvericun Institute qf Chemical Engineers 25:
Franses, E. I . ; Puig, J . E.; Talmon, Y.; Miller, W. G.; Scriven, L. E.; and Davis, H . T. 1980. Roles of liquid
Freeman, R. R. 1964. Separation of cells from fluids. Biotechnolog,,; and Bioengineering 4: 87-125.
Gale, W. W., and Sandvik, E. 1. 1973. Tertiarysurfactant flooding/ Petroleum sulfonate composition. Society of’ Petroleum Engineers Journal 13: 19 1 - 1 99.
Gash, B., and Parrish, D. R. 1977. A simple spinning drop interfacial tensiometer. Journal of Pe~trole~~tn Technology 29: 30-3 1.
Germer, W. F.; Stringer, C. W.; and Harrison, W. H. 1972. Secondary recovery. well stimulation, solutions, and methods for use. U.S. Patent 3,700,031.
underlying solution. Journal of Applied Chemistry (London) 5: 686-692.
Environmental Protection Agency report I7090 EEM I2/7 I .
London Journal 579-586.
493-502.
crystals and micelles in lowering interfacial tensions. Journal I$ Phj:sic.al Cheniistr.~ 84: 157- 1556.
Gill, J . W.; and Lim, P. G. 1969. Recoveryand purification of microbial polysaccharides. U.S. Patent 3,422,085.
Glinsmann, G. R.; Hollis, P. R.; Kleinschmidt, R. F.; and Zornes, D. R. 1980. A‘orth Burbunk unit ter/iarj!
Green, J . W. 1956. AlkAline pulping. I . Saccharinic acids in kraft black liquor. TA PPI 39: 472-477.
Griffith, W. L.; Tanny, G. B.; and Compere, A. L. 1979. Evaluation of tangential filtration methods for the
Grune, W. N.; Compere, A. L.; Griffith, W. L.; and Crenshaw, J . M. 1979. Enhuncedoilrec~over~~~lieniicals,fi.oni
rec0ver.v pilot test. Final report. U .S. Department of Energy report DOE/ ET/ 13067-60.
recovery of scleroglucans. Developments in Industrial Micmhiologj* 20: 743-750.
renewable wood wastes. Oak Ridge National Laboratory report ORN L-5525.
144

Hartley, G. S. 194 I . Interfacial activity of branched paraffin chain salts. Transacrions ~ f l / ? P FaradajJ Societj~ 44:
Harvey, R. R. 1969. Aqueous fluids drive process using minute solids in suspension. U.S. patent 3,476,188.
Hatt, H. D. 1976. Catalogue of Strains. Rockville, Md.: American Type Culture Collection
Henry, J . D., and Allred, R. C. 1972. Concentration of bacterial cells by cross flow filtration. Developt~enrs in
Hill, H. J.; Reisberg, J.; and Stegemeier, G. L. 1973. Aqueous surfactant systems for oil recovery. Journal qf
Hoyt, C. H., and Goheen, D. W. 197 1. Polymeric products. I n Lignins, ed. K . V. Sarkanen and C. H. Ludwig, pp.
Huotari, F. I . ; Nelson, T. E.; Smith, F.; and Kirkwood, S. 1968. Purification of an exo-p-D-( I-3)-glucanase
Jackson, M. L. 1956. Soil chemical analvsis - advanced course. Published by author, Department of Soils,
Jeanes, A. 1975. Extracellular microbial po1j:saccaride.s: publicarions and parenrs.from the Porthern Regional
Kalfoglou, G. 1977. Lignosulfonates as sacrificial agents in oil recovery. U.S. Patent 4,000,779.
Kalfoglou, G. 1979. Oxidized lignosulfonates as additives in oil recovery processes involving chemical recovery agents. U.S. patent 4,133,385.
Kalfoglou, G. 1979. Chrome lignosulfonates as additives in oil recovery processes involving chemical recovery agents. U.S. Patent 4,142,582.
Kalfoglou, G. 1979. Lignosulfonates as additives in recovery processes involving chemical recovery processes. U S . Patent 4,157,l 15.
Klevens, H. B. 1953. Structure and aggregation in dilute solutions of surface active agents. Journal qf the American Oil Chemisrs' Sociery 30: 74-80.
Kraus, K. A. 1974. Cross flow filtration and axial filtration. I n Proceedings, 29th Purdue Industrial Waste Conference. Lafayette, Indiana: Purdue University Press.
Kraus, K . A.; Phillips, H.; Carlson, T. A.; and Johnson, J . S. 1958. Ion exchange properties of hydrous oxides. In Proceedings, 2nd International Conference on Peaceful Uses of Atomic Energy. 28: 3-16. Geneva: United Nations.
Krumrine, P. H.; Campbell, T C.; and Falcone, J . S. , Jr. 1980. Surfactant Flooding I . The effect of alkaline additives on IF" , surfactant adsorption, and recovery efficiency. S0cier.v qf Petroleum Engineers paper 8998.
Kuuskraa, V. 1980. Major technology constraints in enhanced oil recovery. In Proceedings Supplemenr, First Joint SPE/DOE Symposium on Enhanced Oil Recovery, 1 April 1980 Tulsa, Oklahoma, paper 8809. Dallas, Texas: American Institute of Mining Engineers.
Lawrence, A. A. 1976. A'arural gums for ediblepurposes. Park Ridge, New Jersey: Noyes Data Corporation
Leder, H. J . ; and Miescher, G. M . 1967. Process for the recovery of polysaccharide gum polymers. U.S. patent
Leder, H. J.; and Miescher, G. M . 1967. Process for the recovery of polysaccharide gum polymers. U.S. patent
Lindblom, G. P., and Patton, T. J . 1964. Substituted heteropolysaccharide. U.S. Patent 3.163,602.
463-47 1 .
lndusrrial Microbiology 13: 177- 180.
Petroleum Technologv 25: 186-1 94.
833-866. New York: John Wiley and Sons, Inc.
from Basiomycere species QM 806. The Journal of Biological Chemistry 243: 952-956.
University of Wisconsin, Madison.
Research Center 19.58-1974. Peoria, Illinois: NRRC patent office.
3,305,O 16.
3,3 16,24 I .
I45

Lindblom, G. P.; Ortloff, G. D.; and Patton, J . T. 1967. Displacement of oil from depleted reservoirs. U.S.
Lipow, A. M. 1979. The effect of surfactant structure on the phase behavior o surfactant - brine -oil systems.
Martin, F.D. 1979. Development of improved mobility control agents for surfactant-polymer flooding. U.S.
McKinnon, J. T. 1979. Advancedfiltrarion ofpulp mill wastes. Environmental Protection Agency report EPA-
Patent 3,305,O 16.
Master’s thesis, University of Texas at Austin.
Department of Energy report BETC-0047/4.
6001 2-79-209.
McNeely, W. H., and O’Connell, J . J. 1966. Process for producing Xanthomonas hydrophilic colloid. U.S.
McNeely, W. H., and Kang, K . S. 1973. Xanthanand someother biosyntheticgums. I n Inc/ustrialgutns, ed. R . L.
Monick, J. A. 1968. Alcohols, their chemistr?~, properties, and tnanufacture. New York: Reinhold Publishing
O’Connell, J. P. 1967. Treatment of xanthomonas hydrophillic colloid and resulting product. U.S. Patent
Patton, J . T. 1973. Modified heteropolysaccharids. U.S. Patent 3,729,460.
Patton, J . T., and Holman, W. E. 1968. Polysaccharide recovery process. U.S. Patent 3,382.229
Parker, H. W. 1968. Aqueous fluid drive oil recovery process. U.S. Patent 3,384,171
Pfeffer, P. E.; Silbert, L. S.; and Chrinko, J . M., Jr . 1972. a anions of carboxylic acids. I I . The formation and alkylation of a-metalated aliphatit acids. Journal o f Organic Chen?isir.il 37: 45 1-458.
Prausnitz, J . M.; Anderson, T. F.; Grens, E. A.; Eckert, C. A.; Hsieh, R.; and O’Connell, J. P. 1980. Cotnputer calculations f o r multicomponent vapor-liquid and liquid-liquid equilibria. Englewood Cliffs. N. J .: Pretice- Hall, Inc.
Prescott, S. C., and Dunn, C. G. 1940, 1959. Inc/u.strialtnicrohiolog~~. New York: McGraw-Hill Book Company,
Reese, E. T., and Mandels, M. 1959. Use of enzymes in isolation and analysis of polysaccharides. Applied
Reese, E. T., and Mandels, M. 1966. Beta glucanases other than cellulase. I n Meihocls in Enzivnolog~., ed. E. F.
Reid, V. W.; Longman, G. F.; and Heinerth, E. 1967. Determination of anion active detergents by two-phase
Reisberg, J. 1967. Secondary recovery method. U.S. Patent 3,330,344.
Rogers, N. E.. 1973. Scleroglucan. I n Industrialgutns. ed. R. L. Whistler, pp. 499-51 I . New York: Academic
Rogers, W. J.; Shiao, S. Y.; Meyer, R . E.; Westmoreland, C. G.; and Lietzke, M. H. 1979. Ion exhange on mixed ionic forms of montmorillonite at high ionic strengths. I n Proceedings, 3rd International Conference on Surface and Colloid Chemistry, Stockholm, August 1979. ( I n press).
Rogovin, S. P., and Albrecht, W. J. 1964. Method of recovering microbial polysaccharides from their fermentation broths. U.S. Patent 3,1 19,812.
Rogovin, S. P.; Anderson, R . F.; and Cadmus, M. C. 1961. Production of polysaccharide form ,Yanthotnot~as campesrris. Journal of Biochemical and Microbial Technolog?; and Engineering 3: 5 1-63.
Patent 3,232,929.
Whistler, pp. 473-492. New York: Academic Press, Inc.
Corporation.
3,355,447.
Inc.
Microbiology 7: 378-387.
Neufeld and V. Ginsburg, pp. 607-615. New York: Academic Press, Inc.
titration. Tenside 4: 292-304.
Press, Inc.
I46
Rosenberger, R. F. 1976. The cell wall. In Thefilamentous fungi, ed. J . E. Smith and D. R . Berry, pp. 328-344.
Roszelle, W. 0. 1972. Oil recovery process using micellar dispersions containing a metal phosphate. U.S. patent
Rueggeberg, W. H. C., and Sauls, T. W. 1956. Monosulfonated carboxylicacids and theiresters. U. S. 2,743,288.
Salager, J . L.; Bourrel, M; Schechter, R. S.; Wade, W. H. 1979. Mixing rules for optimum phase-behavior formulations of surfactant/oil/ water systems. S0ciet.v of Petroleum Engineers Journal 19: 27 1-278.
Salager, J . L.; Vasquez, E.; Morgan, J . C.; Schechter, R. S.; and Wade, W. H. 1979. Optimium formulation of surfactant/ waterloll systems for minimum interfacial tension or phase behavior. Society of Petroleum Engineers Journal 19: 107- I 15.
Schechter, R . S., and Wade, W. H. 1979. Tertiary oil recoveryprocesses research at the Universit.v of Texas. Annual report for the period October 1977 to September 1978. U.S. Department of Energy report BETC- 0001-1.
Shah, D. O., and Walker, R. D. 1978. Research on surfactant p o / i ~ n e r oilrecoverits,~stems. Quarterly report to the Department of Energy for the period 1 September to 31 December.
Shah, D. 0.; Walker, R. D., Jr.; O’Connel, J . P. 1979. University of Florida research program on surfactant- polymer oil recovery systems. In Proceedings, 5th DOE Symposium on Enhanced Oil Recovery and Improved Drilling Systems, paper B15.
Smith, J . E. 1975. The structure and development of filamentous fungi. In The.filamentou.s,fungi, ed. J . E. Smith and D. R. Berry, pp. 1-15. New York: John Wiley and Sons, Inc.
Somasundaran, P.; and Hanna, H. S. 1978. Adsorption of sulfonate on reservoir rocks. Societlj qf’ Petroleum Engineers paper 7059.
Somasundaran, P. 1979, Adsorption fromfloodingsolutions inporous media. Annual report from the School of Engineering and Applied Science, Columbia University, to the Department of Energy, National Science Foundation, and Supporting Industrial Organization.
Stirton, A. J.; Bistline, R. G., Jr.; Weil, J . K. ; and Ault, W. C. 1962. Sodium alkyl a-sulfoperargonates, C ~ H I X H ( S O ~ N A ) C O Z R . Wetting and related properties. Journalqf the American Oil Chemists Societii 39:
Turbak, A. F., and Livingston, J . R., J r . 1963. Reaction of phosphate-complexed sulfur trioxide with alpha
Wang, D. I. C., and Sinsky, A. J. 1975. Collectionofmicrobialcells. Advancesin App/iedMicrobio/og,v 12: 121-
Wade, W. H.; Morgan, J . C.; Schechter, R . S.; Jacobson, J . K.; and Salager, J. L. 1978. Interfacial tension and
Wellington, S. L. 1978. Enzyme-filtration clarification of xanthan gum polymer solution. U.S. 4, I 19,491.
Widom, B. 1975. Interfacial tension of three fluid phases in equilibrium. The Journal ofChemica1 Phjuics. 62:
Winsor, P. A. 1948. Part VI I I . Effect of constitution of amphiphilic properties. Transactions qf’lhe Faracfa.v
New York: John Wiley and Sons, Inc.
3,688,844.
55-58.
olefins. industrial and Engineering Chemistry, Product Resaerch and Development 2: 229-23 I .
152.
phase behavior of surfactant systems. Society of Petroleum Engineers Journal 18: 242-252.
1332-1336.
Societj; 44: 463-47 I .
147

18. Publications
We will provide reprints of these publications, which have issued from the beginning of the program to the end of this reporting period, on request. A few items were supported by agencies other than the Office of Oil, DOE, and are included because of possible interest to readers of this report. Sponsors are noted in these cases. Contact: James S. Johnson, Jr., Oak Ridge National Laboratory, Chemistry Division, P.O. Box X, Oak Ridge, Tennessee 37830.
Journal Publications
Compere, A. L., and Griffith, W. L. 1976. Fermentation of waste materials to produce industrial
Griffith, W. L., and Compere, A. L. 1977. Continuous lactic acid production using a fixed-film system.
intermediates. Developments in Industrial Microbiology 17: 247-252.
Developments in Industrial Microbiology 18: 723-726.
Compere, A. L., and Griffith W. L. 1978. Production of high viscosity glucans from hydrolyzed cellulosics. Developments in Industrial Microbiology 19: 60 1-608.
15206. Developments in Industrial Microbiology 19: 609-6 18. Griffith, W. L., and Compere, A. L. 1978. Production of a high viscosity glucan by Sclerotirrm rolfsii ATCC
Baldwin, W. H., and Neal, G. W. 1979. Colloidal properties of sodium carboxylates. In Chemistry q f o i l recovery, ed. R. T. Johansen and R. L. Berg, pp. 75-85. American Chemical Society Symposium Series Vol. 91.
Grune, W. N.; Compere, A. L.; Griffith, W. L.; and Crenshaw, J . M. 1979. Enhanced oil rec0ver.v chemicals f rom renewable wood resources. Oak Ridge National Laboratory report ORNL 5525.
Griffith, W. L.; Tanny, G. B.; and Compere, A. L. 1979. Evaluation of tangential flow methods for purification of scleroglucans. Developments in Industrial Microbiology 20: 743-750. (Work supported by the Division of Chemical Sciences, Basic Energy Sciences, DOE.)
Compere, A. L., and Griffith, W. L. 1979. Evaluation of substrates for the production of butanol. Developments in Industrial Microbiology 20: 509-5 18.
Compere, A. L., and Griffith, W. L. 1980. lndustrial chemicals and chemical feedstocks from wood pulping wastewaters. TAPPI 63: 101-104.
Griffith, W. L.; Compere, A. L.; and Crenshaw, J . M. 1980. Modification of biopolymer solution properties
Compere, A. L.; Griffith, W. L.; and Greene, S. V. 1980. Polymer production by Pleurotrrs. Developments in
by endoglucanohydrolases. Developments in Industrial Microbiology 2 I : 45 1-460.
Industrial Microbiology 21 : 460-469.
Proceedings Papers
Compere, A. L., and Griffith, W. L. 1977. Bioconversion of wastes to higher valued organic chemicals. In Energy conservation: a national.forum, ed. T. N. Veziroglu, pp. 181-196. University of Miami: Coral Gables, Florida.
I48

Johnson, J. S., Jr. 1977. Enhanced oil recovery by micellar floods: chemicals from wastes, tracers, and ion-exchange aspects. In Proceedings, 3rd Annual ERDA Symposium on Enhanced Oil and Gas Recovery, August 1977, Tulsa, Oklahoma, paper B-9.
Johnson, J. S., Jr. 1978. Research supporting micellar floods: chemicals, tracers, and ionexchange aspects. In Proceedings, 4th Annual DOE Symposium on Enhanced Oil and Gas Recovery, August 1978, Tulsa, Oklahoma, paper A-12.
Johnson, J . S., Jr. 1979. Micellar-flood research. Chemicals, phase behavior, and adsorption on minerals. In Proceedings, 5th Annual DOE Symposium on Enhanced Oil and Gas Recovery, August 1979, Tulsa, Oklahoma, paper B-6.
Cravens, J. B.; Erickson, P. R.; Compere, A. L.; and Griffith, W. L. 1980. lnnovative enhanced oil recovery separations methods. In Proceedings, U.S. Department of Energy Energy Optimization of Water and Wastewater Management for Municipal and Industrial Applications Conference, ed. B. Broomfield, 8-10 December 10-13, 1979, New Orleans, Louisiana. Argonne National Laboratory Report ANL-EES-TM-96 Volume I , pp. 447-456. (Work supported by Division of Chemical Sciences, Basic Energy Sciences, DOE.)
Compere, A. L., and Griffith, W. L. 1980. Industrial chemicals and chemical feedstocks from wood pulping wastewaters. In Proceedings, TAPPI Annual Meeting, 25 t o 28 February, Atlanta, Georgia, pp. 147-152. Atlanta, Georgia: TAPPI press.
Griffith, W. L.; Compere, A. L.; Rao, T. K.; and Griest, W. H. 1980. Potential use of orgunosolv underflow tar lignin as a petrochemical refinery feed. In Proceedings, TAPPI Papermakers’ Conference, 14 to 16 April, Atlanta, Georgia, pp. 18 1-185. Atlanta, Georgia: TAPPI Press.
Progress Reports
Baldwin, W. H.; Compere, A. L.; Griffith, W. L.; Harrison, N. H.; Johnson, J . S . , Jr.; Neal, G. W.; Smith, D. H.; and Westmoreland, C. G. 1977. Chemicals f o r enhanced oilrecovery. Report for the period April 1976 to April 1977.
Baldwin, W. H.; Compere, A. L.; Crenshaw, J . M.; Griffith, W. L.; Hall, J . E.; Harrison, N. E.; Johnson, J . S. , Jr.; McDaniel, V.; Neal, G. W.; Smith, D. H.; and Westmoreland, C. G. 1979. Cheniicals .for enhanced oil recovery. Report for the period April 1977 to April 1978. Bartlesville Energy Technology Center report BETC/ W26-4.
Compere, A. L.; Crenshaw, J . m.; Greene, S. V.; Griffith, W. L.; Hall, J . E., Jr.; Johnson, J . S., Jr.; Jones, R. M.; Magid, L. J.; Westmoreland, C. G.; and Williams, D. Y . 1980. Chemicals f o r enahnced oil recovery. Report for the period 1 January to 30 March 1979. Bartlesville Energy Technology Center report BETC/ W26-5.
Compere, A. L.; Crenshaw, J . M.; Fowler, C. M.; Greene, S. V.; Griffith, W. L.; Johnson, J . S., Jr.; Jones, R. M.; Magid, L. J.; Westmoreland, C. G.; and Williams, D. Y . 1979. Chemicals for enhanced oil recovery. Report for the period I April to 30 June 1979. Bartlesville Energy Technology Center report
Compere, A. L.; Crenshaw, J . M.; Greene, S . V.; Griffith, W. L.; Johnson, J . S., Jr.; Jones, R. M.; Kahler, E. W.; Magid, L. J.; Triolo, R.; and Westmoreland, C. G. 1980. ChemicalsJor enhanced oil recover>’. Report for the period 1 July to 30 September 1979. Bartlesville Energy Technology Center report
Compere, A. L.; Crenshaw, J . M.; Greene, S. V.; Griffith, W. L.; Harshman, K.; Johnson, J . S., Jr.; Jones, R. M.; Magid, L. J.; Triolo, R.; and Westmoreland, C. G. 1980. Cheniicals.for enhanced oil recovery. Report for the period I October to 31 December 1979. Bartlesville Energy Technology Center report
B ETC / W26-8.
BETC/ W26-I 0.
BETC/ W26-15.
I49

Patents
Compere, A. L.; Griffith, W. L.; and Holleman, J. W. 1979. Enzymatic method for improving injectability of polysaccharides. SN 79-90176, filed I November. (Also filed in Mexico, Britain. Finland, and Venezuela.)
I50
* U.S. GOVERNHENT P R I N T I N G O F F I C E : 1981-771-031/13