Embed Size (px)
Citation preview
1
Prepared by : Dr. Amer El Hamouz , eng. Maha Fuqha
An-Najah National University
Department of Chemical Engineering
(Nablus/Palestine)
Chemical Reactor Engineering Lab, 64428
Instructor:
Dr. ِ Amer EL-Hamouz
Eng. Maha Fuqha
January, 2011
2
Prepared by : Dr. Amer El Hamouz , eng. Maha Fuqha
An-Najah National University
Department of Chemical Engineering
Chemical Reactor Engineering Lab, 64428.
Second term 2011
Prerequisites: Chemical Reaction Engineering, Numerical Analysis for Chemical
Engineers
Text Book: Prepared Lab Manual
References: 1- Elements of Chemical Reaction Engineering, Fourth edition, 2004,
ISBN 0-13-253220-4
H.Scott Fogler
2- Chemical Reaction Engineering, second edition, 1999,
ISBN 0 471-53019-0
O. Levenspiel
Instructors: Amer M. EL-Hamouz, Associate Professor of Chemical Engineering
Engineer Maha Fuqha, Teaching Assistant
Introduction: This lab is one of the most important labs in the chemical engineering
study. In this lab, student will perform experiments to support their theoretical study of
Batch, CSTR and PFR reactors.
Objectives:
1- To familiarize students with main type of chemical reactors.
2- To analyze the experimental data to obtain the reaction rate expression (reaction
order and specific reaction rate constant).
3- Compare results obtained using different concentration measurement techniques.
4- Compare the conversion of reactants during a specification reaction in various
types of reactor.
5- Observe batch mixing under different operating conditions.
Outline
Part A: Manual measurement of species concentration.
Safety in Reaction lab.
Homogeneous Batch Reactor
Neutralization of Aqueous Solution Of Acetic Acid
Mixing Behavior under Various Operating Conditions
Scale up rules in the mixing tank.
Effect of solution viscosity on mixing behavior in stirred tank
reactors
Mixing degree Measurements using spectrophotometer.

3
Prepared by : Dr. Amer El Hamouz , eng. Maha Fuqha
Plug flow reactor
Part B: Chemical Reactor trainer Batch Reactor, Adiabatic Reaction
Batch Reactor, Isothermal Reaction
Continuous Stirrer Tank Reactor
Tubular Flow Reactor
Stirred Tanks in Series
Comments
ALL STUDENTS ARE REQUESTED TO ATTEND ALL EXPERIMENTS.
One formal repot should be submitted by each group.
Final exam will be written exam
Grading :
Quizzes 5%
performance 10%
Reports 35%
Final Exam 50%

4
Prepared by : Dr. Amer El Hamouz , eng. Maha Fuqha
An-Najah National University
Department of Chemical Engineering
Chemical Reactor Engineering Lab, 64428.
Second term 2011
Instructions for Preparing Laboratory Reports
The report must be prepared according to the following outline.
1. Title Page
The Title page should be separate from the rest of the report. It should contain:
a. The title of the experiment.
b. The number of course.
c. The names of the writer and his co-worker(s), their ID numbers, and group number.
d. Name of the instructor to whom the report is submitted
e. The date when the experiment was run
f. The date of submission of report
A sample title page is shown on page xv, which can be used when submitting reports.
2. Abstract
The abstract should be informative, and should be written in about three to five sentences.
It should cover all phases of the investigation. It must include the following:
a. An introductory statement about the subject matter
b. Brief description of what was done and how it was done.
c. Selected results (numerical values, if available).
d. Brief assessment of the results e.g. some percentage errors in
Experimental results in comparison with theoretical values.
While writing the abstract, no reference should be made to graphs, tables or equations
inside the report.
3. Introduction
This section should include few sentences discussing the physical and/or chemical
principles involved in the experiment. The importance and relevance of the experiment to
real applications may also be stated.
4. Theoretical Background
This section should include the theory behind the experiment. It should also contain all
those equations, which are used to acquire a certain result. Theoretical correlations, which
are used for comparison with experimental results, should also be included.
5. Procedure
Here, you should briefly describe the actual step-by-step procedure you followed in
running the experiment. It should be written in your own words, e.g. the needle valve was
manipulated in order to adjust the liquid flow rate.
5
Prepared by : Dr. Amer El Hamouz , eng. Maha Fuqha
6. Results
The results should be presented in the form or Tables or graphs. The Table should contain
the results obtained from experiments and from theoretical knowledge.
Comparisons may also be presented in terms of percent deviation between experimental
values and theoretical predictions.
7. Discussion of Results
In this section you should discuss your experimental results and observations. If the
results are obtained in terms of graphs, then interpret them also. Describe observed trends
and possible relationship between parameters e.g. how a change in one variable affects
another. Also show how you make comparison with the values obtained theoretically and
discuss the deviation of experimental results from theoretical values. The possible source
of errors should also be mentioned.
8. Conclusions and Recommendations
Conclusions are the series of numbered sentences which answer the questions posed at
the beginning of each experiments. Conclusions should also include main results
(numerical values) and the errors between the experimental and theoretical values. What
you have learned from the experiment should be mentioned as well.
Recommendations are the proposals for future work, e.g. suggested changes in
equipment, Study of new variables, or possible experiments in relative fields. Like the
conclusions, the recommendations are usually listed by numbers, and each consists of
only a sentence or two.
9. Literature Cited
Here, you should list the books, Journal’s articles, etc. used in writing your report and
analyzing the experiment. The reference should be completed (name of the book, author,
volume, date of publication, pages, etc.). References should be arranged alphabetically by
author’s names.
10. Nomenclature
The symbols, which are used in the report, should be defined in the nomenclature in
alphabetical order. The accompanying definitions must include proper units.
Appendices
All appendices and graphs should be attached at the end of the report.
A1. Raw Data:
It should contain the raw data (in the log sheet) collected during the experiment.
A2. Analysis of Data and Sample Calculations:
This shows how the collected experimental data are analyzed and transformed into
experimental results by using the appropriate equations. Also, how the theoretical results
are obtained using theoretical in terms of percentage error. Sample calculations should
contain each step, which is used to acquire certain results.

6
Prepared by : Dr. Amer El Hamouz , eng. Maha Fuqha
Organization and Neatness
The students must organize their reports in accordance with the format described earlier.
It is required/encouraged to use computer packages such as EXCEL, SIGMAPLOT,
HARVARD, GRAPHICS or any other suitable engineering software to draw graphs. The
neatness will include how the student has organized his report, neat handwriting, accuracy
in grammar and spelling, numbering pages, figures, tables and equations. Additional
points will be given to those students who use computers in preparing their reports.

7
Prepared by : Dr. Amer El Hamouz , eng. Maha Fuqha
An-Najah National University
Department of Chemical Engineering
Chemical Reactor Engineering Lab, 64428.
Second term 2008-2009
Report Grading Form
Name of Student:_ __________________________ ID #:________________
Title of Report:_________________________________________________
Term:__________________________ Date:__________________________
Subject Max Mark Actual Mark
1- Title Page 2.
2- Abstract 20
3- Introduction 5
4- Procedure 5
5. Results 15
6. Discussion of Results 20
7. Conclusion and Recommendations 8
8. Literature Cited 5
9. Nomenclature 2
10. Organization and Neatness 4
Appendix
A1 Raw Data 4
A2 Data Analysis and Sample Calculation 10
Total 100
Signed:___________________________
Comments:

8
Prepared by : Dr. Amer El Hamouz , eng. Maha Fuqha
Sample Cover Page
Kinetics Reaction Laboratory
Homogeneous Batch Reactor
(Experiment no. 1, Performed on: February 20, 2008)
Prepared by: Naser Jaber
Group members: N. Jaber
A. Daqa √
M. Badran √
Submitted to: Eng. Maha Faqha
Chemical Engineering Department
An-Najah National University
February 26, 2009

9
Prepared by : Dr. Amer El Hamouz , eng. Maha Fuqha
III. Criteria for Evaluating Laboratory Reports and
Grading Policy
TECHNICALFORMAT
Abstract
Does it stand alone?
Is it understandable?
Does it include a summary of the following- objective, introduction, Theory,
Methods and Conclusions?
Objective
Is the objective stated clearly and concisely?
Introduction
Does the introduction explain the relevance of the experiment to the field of engineering?
Theory
Is the theory explained?
Are all the necessary formulas stated and variables defined?
Experimental Methods
Can the experiment be reconstructed from the description given?
Is there a diagram of the experimental set-up?
Results
Is presentation clear and concise? Are all the relevant Tables, Graphs,
explanations included? Are the pertinent Sample calculations, References, etc.
included in the Appendices?
Conclusion
Are the conclusions derived from the results of the experiment? Were there
any discrepancies from expected results? Is the objective of the experiment
accomplished?

10
Prepared by : Dr. Amer El Hamouz , eng. Maha Fuqha
WRITING QUALITY
Does the report follow the prescribed format?
Is the language of the report easy to read? Is it precise? Does it conform to the
conventional standards?

11
Prepared by : Dr. Amer El Hamouz , eng. Maha Fuqha
PART 1
Experiment # 1
HOMOGENEOUS BATCH REACTOR
1.1 Objective
To determine the order and value of the rate constant for the liquid reaction of caustic
soda and ethyl acetate in a batch reactor:
NaOH + CH3COOC2H5 → C2H5OH + CH3COONa
1.2 Introduction
A batch reactor may be described as a vessel in which chemicals are placed to
react. Batch reactors are normally used in small-scale laboratory set-ups to study the
kinetics of chemical reactions.
To determine the order and constant of a chemical reaction, the variation of a
property of the reaction mixture is observed as the reaction progresses. Data collected
usually consist of changes in variables such as concentration of a component, total
volume of the system or a physical property like electrical conductivity or refractive
index.
The data are then analyzed using pertinent equations to find desired kinetic parameters.
1.3 Theory
For any given reaction in a constant volume system, the rate of the reaction can be
represented by:
Where rA is the rate of disappearance of reactant A among the reacting species. Equation
(1) can be rearranged to give:
(1.1) )(dt
dCCkfr A
AA
(1.2) )(
kdtCf
dC
A
A

12
Prepared by : Dr. Amer El Hamouz , eng. Maha Fuqha
Integrating equation (1.2) analytically yields
By postulating various forms for f (CA) in equation (1.3) and correlating the resulting
equation with the experimental data, the rate constant k, and order of the reaction can be
determined.
1.4 Procedure
1. In the reactor, mix 1.0 liter of the 0.1M Caustic Soda (NaOH) solution with
1.0 liter of the 0.1M ethyl acetate solution at an arbitrary time (t = 0) at room
temperature. Start the stirrer immediately at an intermediate speed to avoid
splashing.
2. After a certain time interval, using a flask or graduated cylinder withdraw a
sample of known size (e.g., 25 ml) from the opening in the base of the reactor,
and immediately quench this sample with an excess of 0.05M Hydrochloric
Acid (HCl) (e.g. 25 ml).
3. Back titrate the quenched sample with 0.05M NaOH solution. The required
amount of 0.05M NaOH should be recorded since this will enable you to
determine the concentration of NaOH in the reactor at the time you withdrew
the sample.
4. Note that a drop or two of phenolphthalein should be added to the quenched
sample to detect the end point (i.e., stable new color) before you back titrate.
Stirring the flask is also required during back titration.
5. Repeat steps (2) and (3) every 5-10 minutes (and record the time for each new
sample) until the amount of NaOH needed in the back titration is nearly equal to
the amount of the quenching acid.
(1.3) )(
00
ktdtkCf
dCt
C
C A
A
fA
A
13
Prepared by : Dr. Amer El Hamouz , eng. Maha Fuqha
Note 1
Make sure to withdraw and analyze at least five samples of the reactor contents during the
first 15 minutes of the reaction. To accomplish this it is recommended that you prepare
known quantities (25 ml) of the acid indifferent flasks before the start of the reaction.
You can then withdraw the samples from the reactor quench, back titrate, etc.
1.5 Report Requirement
1. Calculate the number of moles of unreacted NaOH in each sample
withdrawn.
2. Calculate the concentration of unreacted NaOH (mol/lit).
3. Apply the integral method of analysis to determine the reaction order and
rate constant of the reaction. This should involve assuming an expression
for the reaction rate, substituting into equation 3, integrating, and then
plotting.
4. Calculate the half-life of NaOH.
5. Determine the fractional conversion of NaOH at the end of the reaction.
6. Find both the order and rate constant of the reaction from literature and
compare between the theoretical and experimental values and give reasons
for the deviations.
Note 2
You must give the exact reference i.e author, title and page number of the book
from which values were obtained.
1.6 References
1. Levenspiel, O., “Chemical Reaction Engineering”, 2nd
ed., Wiley and sons, N.Y.,
p.41 (1977).
2. Smith J.M., “ Chemical Engineering Kinetics”, 3rd
ed., McGraw-Hill Book Comp.
N.Y., p.37 (1981).

14
Prepared by : Dr. Amer El Hamouz , eng. Maha Fuqha
HOMOGENEOUS BATCH REACTOR
Raw Data
Group Name -------------------------
Temperature :---------------------- ºC
Table 1.1Experimental Data
Sample # Time
(min)
Sample Vol.
(ml)
Volume of HCl
Used In Quenching
(ml)
Volume NaOH Used
In Titration
(ml)
Signature------------------ Date-----------------------
15
Prepared by : Dr. Amer El Hamouz , eng. Maha Fuqha
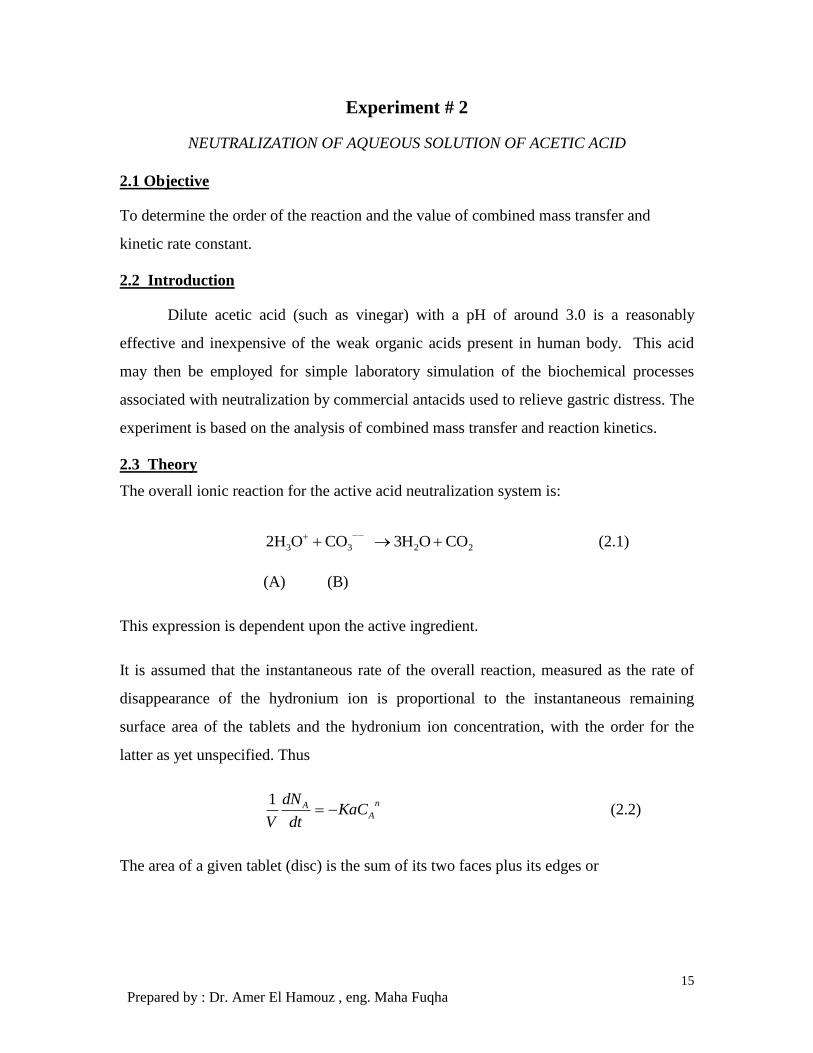
Experiment # 2
NEUTRALIZATION OF AQUEOUS SOLUTION OF ACETIC ACID
2.1 Objective
To determine the order of the reaction and the value of combined mass transfer and
kinetic rate constant.
2.2 Introduction
Dilute acetic acid (such as vinegar) with a pH of around 3.0 is a reasonably
effective and inexpensive of the weak organic acids present in human body. This acid
may then be employed for simple laboratory simulation of the biochemical processes
associated with neutralization by commercial antacids used to relieve gastric distress. The
experiment is based on the analysis of combined mass transfer and reaction kinetics.
2.3 Theory
The overall ionic reaction for the active acid neutralization system is:
2233 COOH3COOH2 (2.1)
(A) (B)
This expression is dependent upon the active ingredient.
It is assumed that the instantaneous rate of the overall reaction, measured as the rate of
disappearance of the hydronium ion is proportional to the instantaneous remaining
surface area of the tablets and the hydronium ion concentration, with the order for the
latter as yet unspecified. Thus
n
AA KaC
dt
dN
V
1 (2.2)
The area of a given tablet (disc) is the sum of its two faces plus its edges or

16
Prepared by : Dr. Amer El Hamouz , eng. Maha Fuqha
2r2 + 2rh. Assuming that the aspect ratio (= height / radius) of a given tablet remains
constant throughout the dissolution process, the instantaneous surface area of a tablet is
2r2
(1+). Eq. (2.2) then becomes, after assuming constant reaction volume (V).
n
A
2A C1Kmr2dt
dC (2.3)
It is necessary to relate CA and r in the above equation. From the stoichiometry of Eq.
(2.1)
dt
dN
dt
dN BA 2 (2.4)
Eq. (2.3) then becomes
n
A
2A C1Kmrdt
dN
V
1 (2.5)
We further assume that the composition of an antacid tablet remain constant throughout
the process. Thus
B
BB
M
XhmrN
2
= B
BB
M
XmrN
3
(2.6)
Eq. (2.5) then becomes
n
A
B
B CX
VMK
dt
dr
3
1 (2.7)
From an overall material balance
33
B
BA
0
A rRVM
Xm2CC
(2.8)
Invoking the definition of PH
ACpH log

17
Prepared by : Dr. Amer El Hamouz , eng. Maha Fuqha
31
A
0
A
B
B3 CCXm2
VMRr
(2.9)
2.4 Equipment & Material
A pH meter and electrode with a rapid response time of about 5-10 sections.
Two buffer solutions (pH = 1 and 7) for 2 point standardization of the pH meter.
A magnetic stirrer, stirring bar and a timer.
A set of vernier caliper to measure the dimensions of the antacids tablets.
Standard laboratory supplies, such as beakers, graduated cylinders, and reagent
bottles.
Distilled white vinegar.
Antacids tables as a neutralization agent.
2.5 Procedure
Following is a step-by-step procedure:
1. Remove protective tip from the pH electrode and rinse it well with distilled
water to remove any residue, which may have formed on the electrode tip.
2. Perform 2 points’ standardization of the pH meter with the two buffer
solutions in accordance with the procedure given in the manufacturer’s
instruction manual.
3. Prepare a fresh acid solution by mixing 25 ml of distilled white vinegar and
500 ml of distilled water in al 1 liter reagent bottle.
4. Transfer 250 ml of this fresh acid solution from regent bottle to 500-ml
beaker, which is placed, on a magnetic stirrer.
5. Place the beaker below the electrode assembly and lower the electrode tip into
acid solution. Ensure that the stirring bar does not hit to electrode tip during
the operation.

18
Prepared by : Dr. Amer El Hamouz , eng. Maha Fuqha
6. Measure the thickness (h), the diameter (D) and the weight of the antacid
tablets using vernier calipers and weight balance.
7. Drop 3 to 5 tablets in the acid and start the timer. Adjust the stirring speed so
that a fair degree of homogeneity is achieved and the tablets are just barely
lifted off of the bottom of the beaker.
8. Record the pH values of solution at 30- second intervals for the first five
minutes, at 1 minute intervals for the next 15 minutes and at 2 minute
intervals for the remainder of the run-until the tablets are completely dissolved
and the solution pH has off at a constant value (typically 40-50 minutes total).
9. Repeat the above procedure for different type of antacid tablets.
2.6 References
1. Standers, S.A. and Sommerfeld, J.T. “A Laboratory Experiment on Combined Mass
Transfer and Kinetics”, Chem.Eng. Edu. Vol.22, No.2, Spring 1989,p. 86-91.
2.7 Nomenclature
a Interfacial
CA Concentration of species A
CB Concentration of species B
D Diameter of the tablet
K Combined mass transfer and kinetic rate constant
MA Molecular weight of species A
MB Molecular weight of species B
m Number of tablets
n Order of reaction
R Radius of the tablets

19
Prepared by : Dr. Amer El Hamouz , eng. Maha Fuqha
V Volume of the acetic acid solution
XB Mass fraction of active ingredient
α Aspect ratio
Density of the tablet
NEUTRALIZATION OF AQUEOUS SOLUTION OF ACETIC ACID
1. Data Analysis
Write the characteristics of antacid tablets
Table 2.1 Characteristics of antacid Tablets
Property Antacid Brand
Active (Alkaline) Ingredient Typical
Mass of Tablets, gm.
Mass of Active Ingredient, mg
Mass Fraction of Active, (XB) Ingredient.
Mol. Wt. of Active Ingredient (MB)
Typical Thickness of Tables(h), cm
Aspect Ratio ( = h / R )
Density of Tablets g / cm3
No. of Tablets Used in the experiment (m)
2. Determine the order of the reaction
3. Determine the value of combined mass transfer and kinetic rate constant K.

20
Prepared by : Dr. Amer El Hamouz , eng. Maha Fuqha
2. Raw Data
T, min pH T, min pH
Group Name-------------
Signature------------------ Date-----------------------

21
Prepared by : Dr. Amer El Hamouz , eng. Maha Fuqha
EXPERIMENT # 3
Mixing Behavior under Various Operating Conditions
3.1 Objective:
To study the behavior of mixing under various operating.
3.2 Introduction
Mixing is applied to the processes used to reduce the degree of non-uniformity or
gradient of a property in a system such as concentration, viscosity, temperature and so
on.
3.2.1 Type of Mixing
There are many types of mixing:
1. Single Phase Liquid Mixing.
In this mixing two or more miscible liquid must be mixed to give a product of
a desired specification.
2. Mixing of Immiscible Liquids
Two immiscible liquids are stirred together, one phase become dispersed as tiny
droplets in the second liquid which forms a continuous phase.
3. Gas- Liquid Mixing
The purpose of mixing here is to produce a high interfacial area by dispersing the
gas phase in the form of bubbles into the liquid.
4. Liquid-Solid Mixing
Mechanical agitation may be used to suspend particles in a liquid in order to
promote mass transfer or a chemical reaction.
5. Gas-Liquid-Solid Mixing
Like slurry reactors, evaporative crystallization.

22
Prepared by : Dr. Amer El Hamouz , eng. Maha Fuqha
3.2.2 Rate and Time for Mixing
Mixing time is the time required producing a mixture or a product of predetermined
quality, and the rate of mixing is the rate at which the mixing progresses towards the final
state.
For a single-phase liquid in a stirred tank to which a volume of tracer materials is added,
the mixing time is measured from the instant the tracer is added to the time when the
contents of the vessel have reached the required degree contents of uniformity.
The mixing time will depend upon the process and the following:
1) System geometry.
2) Impeller Diameter, D.
3) Speed of rotation (revs/unit time) N
4) Properties of liquids.
t = f (N, D, g, ρ, μ, system geometry)
3.2.3 Mixing equipment
In designing mixing equipment there are many factors that must be considered to obtain
“desired process results”, among these factors are:
Vessel size
Vessel shape
Vessels are typically cylindrical in shape, defined by H/T ratio:
Where: H: vessel height,
T: vessel diameter.
The base of vessel may be flat, dished, or conical, or specially contoured,
depend upon factors such as ease of emptying, or the need to suspend solids.
Baffles Baffles are used to prevent cross vortexing, which is detrimental to mixing, particularly in low
viscosity systems. The baffles are mounted flush with the wall and these take the form of thin
about one-tenth of the tank diameter in width, and typically four qui-spaced baffles may be used.
Impeller
There are many types of impellers: propellers, turbines, paddles, anchors, helical
ribbons and screws which are usually mounted on a central vertical shaft in a
cylindrical tank, and they are selected for a particular duty largely on the basis of
liquid viscosity.
23
Prepared by : Dr. Amer El Hamouz , eng. Maha Fuqha
Propellers, turbine and paddles are generally used relatively low viscosity systems and
operate at high rotational speeds.
3.4 Equipment and material
Water
dye
Beakers (2L).
Stirrer
3.5 Procedure
A. Effect of impeller position
B. Effect of speed
C. Effect of aeration
D. Effect of baffles
1. Fill the beaker with water.
2. Inject a dye at the top of a beaker.
3. From time to time take sample and find it concentration by spectrophotometer.
4. Operate the mixer under laminar flow.
5. Observe how mixing is carried out and evaluate how long does it take to mix.
6. Observe the aeration if happen or not.
7. Repeat the same experiment but at higher speed that is in turbulent flow.
8. Repeat the above experiments with different impeller position (1/2 and 1/3 from
the bottom).
9. Repeat the above experiments using baffles.
24
Prepared by : Dr. Amer El Hamouz , eng. Maha Fuqha
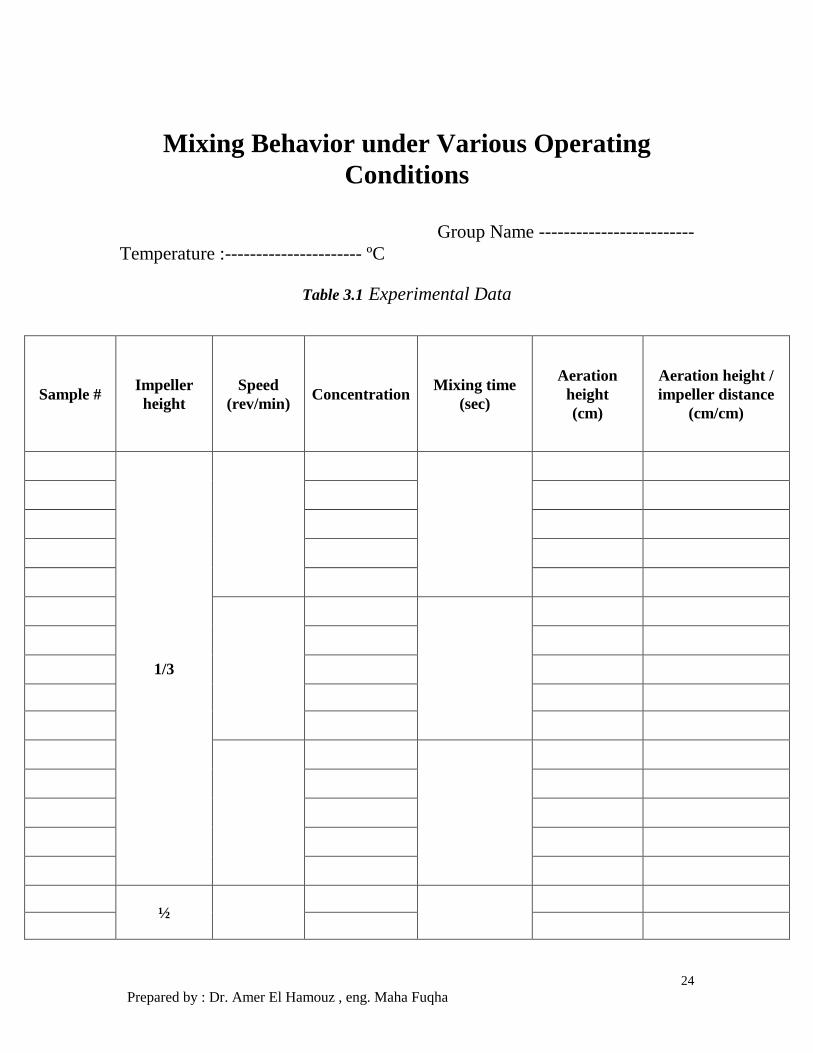
Mixing Behavior under Various Operating
Conditions
Group Name -------------------------
Temperature :---------------------- ºC
Table 3.1 Experimental Data
Sample # Impeller
height
Speed
(rev/min) Concentration
Mixing time
(sec)
Aeration
height
(cm)
Aeration height /
impeller distance
(cm/cm)
1/3
½

25
Prepared by : Dr. Amer El Hamouz , eng. Maha Fuqha
2/3
Signature------------------ Date-----------------------

26
Prepared by : Dr. Amer El Hamouz , eng. Maha Fuqha
1. Report on mixing time as a function of impeller speed
2. Plot mixing time vs. time at low speed and high speed.
3. Plot mixing time vs. time at different impeller position.
4. Calculate the power consumption in each case.
5. Compare between using baffles and not using it.
6. Compare your results with theoretical data.

27
Prepared by : Dr. Amer El Hamouz , eng. Maha Fuqha
EXPERIMENT # 4
Effect of fluid viscosity on mixing time
4.1 Objective :
To determine the effect of fluid viscosity on the mixing time and mixing quality
4.2 Equipment and material
CMC solution of different concentration.
Beakers.
Stirrer
dye
4.3 Procedure
Following is a step by step procedure:
Adding non viscous to viscous:
1- Prepare a 1L of viscous CMC solution of different concentration. Use a
concentrations of 0.2, 0.4 and 0.8%
2- Prepare a 5 ml of dye solution of x % concentration for each concentration. This
solution when fully mixed in the CMC concentration should give a final
concentration of 300ppm.
3- Fill the 2L beaker with the viscous fluid and use a low stirrer speed but adequate
for mixing (corresponds to the minimum turbulent Reynolds number value).
4- Stop the mixer and gently add the dye solution at the top surface of the viscous
fluid, switch on the stirrer and observe how the dye moves inside the batch.
5- From time to time take sample and find it concentration by spectrophotometer.
6- Draw a sketch for the movement of dye in the batch.
7- Repeat steps 3 to 5 for other CMC solution.
Adding viscous to non viscous:
1- Fill a 2L beaker with 1L water and use a low stirrer speed but adequate for
mixing (corresponds to the minimum turbulent Reynolds number value)
2- Prepare a 5 ml of CMC solution of different concentration (0.2, 0.4 and 0.8%).
3- Add x of dye for each concentration that make the solution when fully mixed
in water should give a final concentration of 300ppm.

28
Prepared by : Dr. Amer El Hamouz , eng. Maha Fuqha
4- Stop the mixer and gently add the dye solution at the top surface of the non
viscous fluid, switch on the stirrer and observe how the dye moves inside the
batch.
5- From time to time take sample and find it concentration by spectrophotometer.
6- Draw a sketch for the movement of dye in the batch.
7- Repeat steps 3 to 5 for other CMC solution.

29
Prepared by : Dr. Amer El Hamouz , eng. Maha Fuqha
Effect of fluid viscosity on mixing time
Group Name -------------------------
Temperature :---------------------- ºC
Table 4.1 Experimental Data
Dye
weight
(mg)
CMC
concentration
%
Time
(Sec)
Sample
concentration
Mixing
time
non Viscous
to viscous
0.1
0.3
0.6
Viscous to
non viscous
0.1
0.3
0.6
Signature------------------ Date-----------------------
1- Sketch mixing time vs time for all cases.
2- How solution viscosity affect mixing time. Support your results with any existing
correlation. ( use reference).

30
Prepared by : Dr. Amer El Hamouz , eng. Maha Fuqha
EXPERIMENT # 5
Scale up of Stirred tank reactor
5.1 Objective:
To apply different scale up rules on scaling 200ml batch to 2000ml
5.2 Equipment and material
CMC solution of different concentration.
Beakers.
Stirrer
dye
5.3 Procedure
Following is a step by step procedure:
1- prepare a 2% CMC solution.
2- Fill the 200 ml beaker with the viscous fluid and use a low stirrer speed but
adequate for mixing (corresponds to the minimum turbulent Reynolds number
value).
3- Stop the mixer and gently add the dye solution at the top surface of the viscous
fluid, switch on the stirrer and observe how the dye move inside the batch.
4- From time to time take sample and find it concentration by spectrophotometer.
5- Draw a sketch for the movement of dye in the batch.
6- Use different scale up rules (equal Reynolds number, equal tip speed, and equal
power per unit volume) and record the mixing time for the 2000ml batch reactor
and 5000 ml batch reactor.
7- Repeat steps for another speed.
8- Repeat steps for another viscous concentration 0.5%

31
Prepared by : Dr. Amer El Hamouz , eng. Maha Fuqha
Scale up of Stirred tank reactor
Group Name -------------------------
Temperature :---------------------- ºC
Mixer speed --------------------------
Table 5.1 Experimental Data
Volume of
reactor
(ml)
H D H/D
CMC
concentration
%
Time
(Sec)
Sample
concentration
Mixing
time
200
2
0.5
2000
2
0.5
5000
2
0.5
Signature------------------ Date-----------------------
1- Report on mixing time value at different scale (200 ml, 2000 ml and 5000 ml) with same speed.
2- Using scale up procedure (Equale mixing time) what are the value of speed at each scale that give
same mixing time.

32
Prepared by : Dr. Amer El Hamouz , eng. Maha Fuqha
EXPERIMENT # 6
Plug Flow Reactor
Plug flow Reactor
Objectives:
1- Study the effect of flow rate on the conversion of acid base reaction (Sodium
hydroxide and Ethyl acetate (EA)).
2- Determine the conversion of the acid base reaction at different reactor length.
3- Study the effect of recycle ratio on the final conversion of the acid base reaction.
Procedure:
1- Prepare 2l of 0.1M sodium hydroxide, 0.1 EA and 1 liter 0.1M of HCl solutions.
2- Set the peristaltic pump at flow rate of 30ml/minute.
3- Fill the pump with EA solution
4- Connect the two solutions to peristaltic pump
5- Switch on the pump at the desired flow rate.
6- Every 1 minute take 10 ml sample and quench it with 10 ml of HCL. Samples
should be taken from all sampling points.
7- continue the experiment for 15 minutes
8- report values of NaOH needed for titration, plot concentration of NaOH at
different location with time
9- repeat experiment different flow rate, preferable double the previous flow rate.
Experiment 2
1. Prepare 1 liter of 0.1M NaOH and 0.1M HCL
2. Add phenolphtaline indicator to NaOH solution
3. Pump the solution at low flow rate and take a sample of solution and add HCL of
known volume and back titrate with NaOH
4. Record the exit concentration with time and make an observation for color
change.
PART II
33
Prepared by : Dr. Amer El Hamouz , eng. Maha Fuqha
CHEMICAL REACTORS TRAINER 1. Unit Layout and Function
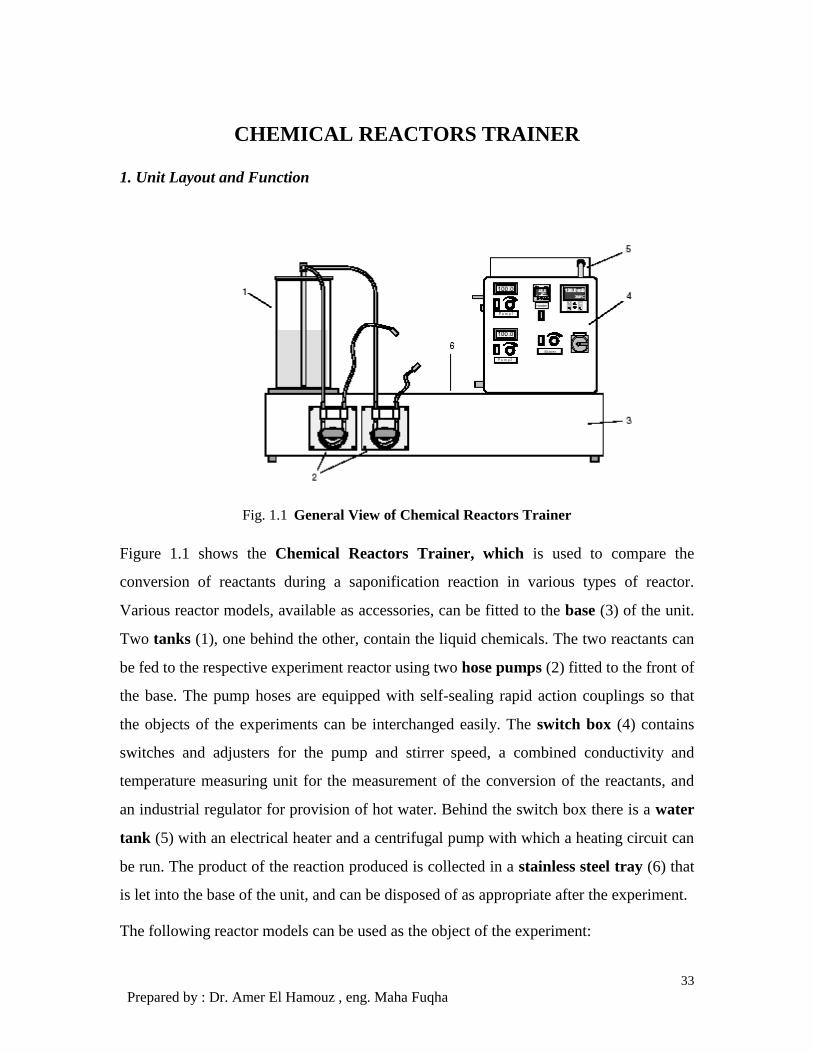
Fig. 1.1 General View of Chemical Reactors Trainer
Figure 1.1 shows the Chemical Reactors Trainer, which is used to compare the
conversion of reactants during a saponification reaction in various types of reactor.
Various reactor models, available as accessories, can be fitted to the base (3) of the unit.
Two tanks (1), one behind the other, contain the liquid chemicals. The two reactants can
be fed to the respective experiment reactor using two hose pumps (2) fitted to the front of
the base. The pump hoses are equipped with self-sealing rapid action couplings so that
the objects of the experiments can be interchanged easily. The switch box (4) contains
switches and adjusters for the pump and stirrer speed, a combined conductivity and
temperature measuring unit for the measurement of the conversion of the reactants, and
an industrial regulator for provision of hot water. Behind the switch box there is a water
tank (5) with an electrical heater and a centrifugal pump with which a heating circuit can
be run. The product of the reaction produced is collected in a stainless steel tray (6) that
is let into the base of the unit, and can be disposed of as appropriate after the experiment.
The following reactor models can be used as the object of the experiment:

34
Prepared by : Dr. Amer El Hamouz , eng. Maha Fuqha
Fig. 1.2 Switch Box
Fig. 1.3 Combined Conductivity and
Temperature Sensor
1. Continuous Stirrer Tank Reactor
2. Tubular Flow Reactor
3. Stirred Tanks in Series
4. Batch Reactor
Figure 1.2 shows the switch box which contains two-control groups (7) for the
two hose pumps, each group has a switch. An adjusting potentiometer on each group
permits the volumetric flow rate of each pump to be adjusted individually from 0% to
100%. Using the associated four digit displays, it is possible to read the corresponding
value. An industrial controller (8) is used to adjust and regulate the water temperature in
the heating circuit. The current water temperature and the heating temperature set are
displayed on the display for the regulator. Using the associated switch below the regulator
housing, it is possible to switch the heater on or off as required. A hot water pump is
installed in the switch box, this can be placed in operation using the pump switch (9).
The combined measuring unit (10) for the conductivity and temperature of the
experimental solution is already adjusted and the parameters set. Further changes are not
necessary. As some of the experimental reactors are equipped with a stirrer, on the switch
box there is an adjuster (11) with a switch and potentiometer using which the
35
Prepared by : Dr. Amer El Hamouz , eng. Maha Fuqha
corresponding stirrer speed can be adjusted. The stirrer is connected electrically to the
switch box via the socket (14).
The trainer is switched completely on or off, including all components, using the master
switch (12). The respective reactor can be connected to the hot water system using the
hoses supplied via the water connection (13) with rapid action couplings. The combined
conductivity and temperature measuring sensor (figure 1.3) is plugged into the
adapter (15) and is then ready for use without any further action. There are sensor
insertion points on the reactors for recording results and ensuring correct measurements.
2. Theoretical Principles and Experiments
2.1Theory
As a rule, chemical processes are not spontaneous and are incomplete. Indeed, in
the majority of cases the reaction products only formed gradually. The speed of the
reaction can be very varied, as reactants only react with one another if they meet with a
sufficiently large amount of energy. An increase in the temperature therefore increases the
conversion of the reactants. The time for which the reactants are in contact is a further
criterion.
The conversion of the reactants is thus dependent on:
• The nature of the reactants
• The concentration and mixing rate of the reactant
• The time that the reactants are in contact
• The reaction temperature
For each chemical reaction, there exists a process that splits the product of the reaction
back into the original reactants. This counter reaction is, in turn, temperature dependent.
It thus sets equilibrium between the concentrations of the initial reactants and the product.
This situation is termed dynamic, as both reactions occur side by side without
interruption; however the reactant concentration does not change.

36
Prepared by : Dr. Amer El Hamouz , eng. Maha Fuqha
The response time and position of this equilibrium can be influenced, for example, by:
• Change in the time for which the reactants are in contact or the duration of the period in
the reactor
• Change of the reaction temperature
These relationships are to be checked based on the saponification of ether with sodium
hydroxide. The following reaction occurs:
atesodiumacet ethanol oxidesodiumhydr ether
33223
acetic
NaCOOCHCHHOCHNaOHCOOCHCH
The ether molecules are split and each disintegrates into an acetate ion and an ethanol
molecule. During this process the hydroxide ions in the sodium hydroxide are consumed.
The progress of the reaction and conversion of the reactants can thus be tracked extremely
well by the change in the hydroxide concentration. Alternatively, a conductivity
measurement or volumetric analysis with acid can be used. From the conductivity values,
the percentage conversion of the reactants S can be calculated with the aid of the
following equation:
%100kk
kk1S
e0
e
k : Actual measured value for conductivity
k0 : Initial conductivity of the 2.3% Sodium Hydroxide (NaOH)
ke : Conductivity of the end product produced

37
Prepared by : Dr. Amer El Hamouz , eng. Maha Fuqha
Figure 3.1 Batch Reactor
3. Experiments
3.1 BATCH REACTOR, ADIABATIC REACTION
A batch reactor is in general designed as a vacuum sleeve vessel and is closed. It
cannot be used continuously. Due to its properties, a reaction in the batch reactor can
either be adiabatic or isothermic using external temperature regulation. In the case of
heavily exothermic reactions, there is a risk of uncontrolled acceleration or uncontrolled
inhibition of the reaction and thus an unstable reaction. By combining the possible
methods of operating the batch reactor, the correct stability conditions can be found for
each reaction and thus a runaway of the reaction on the operation of a continuous reactor
can be voided.
3.1.1 Performing the Experiments
1. Attach the batch reactor to the trainer above the collecting tray and open it.
2. Prepare a glass beaker with 400 ml of 2.3% Sodium Hydroxide. Measure by
using the measuring sensor, the conductivity and temperature of the solution and
note.
3. Prepare a glass beaker with 400 ml of 5% Ethyl Acetate solution, measure
using the measuring sensor, the conductivity and temperature of the solution and
note.
4. Insert the conductivity measuring sensor in the measuring opening on the lid
and connect the stirrer
5. Adjust the stirrer to a medium speed, however do not switch it yet.

38
Prepared by : Dr. Amer El Hamouz , eng. Maha Fuqha
6. Quickly pour both solutions into the reaction tank.
7. Close lid immediately and switch on the stirrer.
8. Continuously note the conductivity and temperature values for approximately
three minutes.
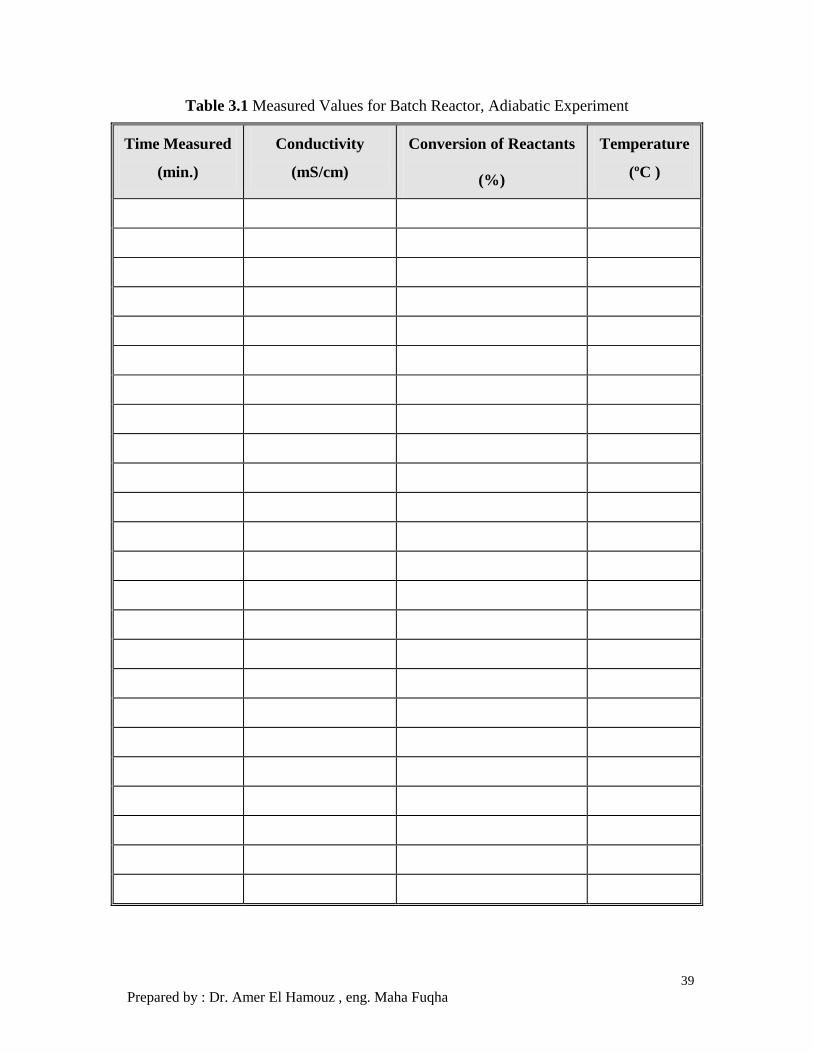
9. Record your data in Table 3.1.
39
Prepared by : Dr. Amer El Hamouz , eng. Maha Fuqha
Table 3.1 Measured Values for Batch Reactor, Adiabatic Experiment
Time Measured
(min.)
Conductivity
(mS/cm)
Conversion of Reactants
(%)
Temperature
(ºC )

40
Prepared by : Dr. Amer El Hamouz , eng. Maha Fuqha
Initial Conductivity of 2.3 % NaOH mS/cm
Note 1: After the end of the experiment
Empty the reaction vessel and clean it.
Rinse measuring sensor with water.
Dispose of the reaction product correctly.
3.1.2 Report Requirement
1. Convert measured results for conductivity into percentage conversion of
reactants.
2. On one graph, plot conversion (%) and temperature (ºC ) versus time (s).

41
Prepared by : Dr. Amer El Hamouz , eng. Maha Fuqha
3.2 BATCH REACTOR, ISOTHERMIC REACTION
3.2.1 Performing the Experiments
1. Attach the Batch Reactor to the trainer above the collecting tray and open it.
2. Prepare a glass beaker with 400 ml of 2.3% Sodium Hydroxide. Measure,
using the
3. measuring sensor, the conductivity and temperature of the solution and note.
4. Prepare a glass beaker with 400 ml of 5% Ethyl Acetate solution. Measure,
using the
5. measuring sensor, the conductivity and temperature of the solution and note.
6. Insert the conductivity measuring sensor in the measuring opening on the lid
and connect the stirrer
7. Adjust the stirrer to a medium speed, however do not switch it yet.
8. Connect the water hoses from the heating system to the connections on the lid
and to the switch housing, switch the pump.
9. Quickly pour both solutions into the reaction tank.
10. Close lid immediately and switch on the stirrer.
11. Continuously note the conductivity and temperature values for approximately
three minutes.
12. Record your data in Table 3.2

42
Prepared by : Dr. Amer El Hamouz , eng. Maha Fuqha
Table 3.2 Measured Values for Batch Reactor, Isothermic Experiment
Time Measured
(min.)
Conductivity
(mS/cm)
Conversion Of Reactants
(%) Temperature
(ºC )

43
Prepared by : Dr. Amer El Hamouz , eng. Maha Fuqha
Initial Conductivity of 2.3 % NaOH mS/cm
Note 2: After the end of the experiment
Empty the reaction vessel and clean it.
Rinse measuring sensor with water.
Dispose of the reaction product correctly.
3.2.2 Report Requirement
1. Convert measured results for conductivity into percentage conversion of
reactants.
2. On one graph, plot conversion (%) and temperature (ºC) versus time (s).
3. Compare results with the results from previous experiment (Adiabatic) and
give reasons for the deviations.

44
Prepared by : Dr. Amer El Hamouz , eng. Maha Fuqha
Figure 3.2 Continuous Stirrer Tank Reactor
3.3 CONTINUOUS STIRRER TANK REACTOR
A key feature of a stirrer tank reactor is that it can work both continuously and also
discontinuously in batches. A further advantage is that it is easier to drain in the event of
a defective batch or breakdown, as the reaction chamber is directly accessible.
Thus it is possible to quickly set up the experiment. The disadvantages are the poor
mixing behavior and less favorable heat transfer to the chemicals used.
3.3.1 Performing the Experiments
1. Attach the continuous stirrer tank reactor to the trainer above the collecting tray
2. Connect the water hoses from the heating system to the connections on the base of
the tank and to the switch housing.
3. Connect the chemical hoses from the pumps to the tank using the rapid action
connectors.
4. Insert the conductivity measuring sensor in the measuring opening on the lid and
connect the stirrer
5. Adjust the overflow on the tank such that the measuring sensor is immersed
approximately 50 mm in the liquid with the tank filled.
6. Ensure that all subordinate switches on the main unit are switched off and then
switch on the unit at the master switch.

45
Prepared by : Dr. Amer El Hamouz , eng. Maha Fuqha
7. Set the required temperature for the heating regulator to 45ºC and switch on the
heater.
8. Switch on the chemical pumps and adjust both to the same flow rate of
approximately 80%
9. When the liquid level reaches the overflow, switch on the stirrer and adjust to a
medium speed
10. At regular intervals of approximately 20-30 seconds, the conductivity and reaction
temperature indicated on the measuring unit until stable values are reached
11. Then reduce the flow rate of both chemical pumps to the same value of approx.
40%.
12. Then the conductivity and reaction temperature indicated on the measuring unit at
regular intervals of approximately 20- 30 seconds until stable values are reached.
13. Check whether the hot water temperature has reached 45ºC and switch on the hot
water pump.
14. Again the conductivity and reaction temperature indicated on the measuring unit
at regular intervals of approximately 20-30 seconds until stable values are
reached.
15. Then increase the flow rate of both chemical pumps back to the same value of
approximately 80%
16. Again log the conductivity and reaction temperature indicated on the measuring
unit at regular intervals of approximately 20-30 seconds until stable values are
reached.
17. Switch off chemical pumps, heater, hot water pump and stirrer
18. Record your data in Table 3.3

46
Prepared by : Dr. Amer El Hamouz , eng. Maha Fuqha
Table 3.3 Measured Values for Continuous Stirrer Tank Reactor
Pump 1
(%)
Pump 2
(%)
Time Measured
(min.)
Conductivity
(mS/cm)
Reactants
Conversion
(%)
Temperature
(ºC )

47
Prepared by : Dr. Amer El Hamouz , eng. Maha Fuqha
Initial Conductivity of 2.3 % NaOH mS/cm
Note 3: After the end of the experiment
Undo all connections to the reaction vessel and remove the measuring sensor.
Empty the reaction vessel and clean it. .
Rinse measuring sensor with water.
Dispose of the reaction product correctly
Drain both chemical tanks and rinse then out.
Operate both chemical pumps with water to clean them.
Correctly dispose of the product of the reaction collected in the collecting tray.
Switch off the master switch.
3.3.2 Report Requirement
1. Convert measured results for conductivity into percentage conversion of
reactants.
2. On one graph, plot conversion (%) and temperature (ºC) and percentage flow rate
values for the pumps versus time (s).
3. Comment on your results.

48
Prepared by : Dr. Amer El Hamouz , eng. Maha Fuqha
Figure 3.3 Tubular Flow Reactor
3.4 TUBULAR FLOW REACTOR
Figure 3.3 shows a tubular flow reactor, which is basically comprises a coiled tube
or a section of hose in a heat exchanger bath. In the simplest case the bath contains water.
Due to the large contact area, very good heat transfer to the reactants or cooling effect on
the reactants is achieved Due to the comparatively small cross-sectional aperture,
intensive mixing of the chemicals is achieved while the reactants are flowing through the
reactor. In comparison to other types of reactors, it therefore offers characteristically
higher reactant conversion. In principle, such a reactor can however only be operated
continuously and only be cleaned by rinsing, as it cannot be opened.
3.4.1 Performing the Experiments
1. Attach the tubular flow reactor to the trainer above the collecting tray
2. Connect the chemical hoses from the pumps to the tank using the rapid action
connectors.
3. Connect the water hoses from the hot water system to the connections on the
base of the tank and to the switch housing.
4. Ensure that the end of the overflow hose is in the collecting tray
5. Insert the conductivity measuring sensor in the measuring opening on the lid
and connect the stirrer
6. Ensure that all lower level switches on the main unit are switched off and then
switch on the unit at the master switch.

49
Prepared by : Dr. Amer El Hamouz , eng. Maha Fuqha
7. Set the required temperature for the heating regulator to 45ºC and switch on the
heater
8. Switch on the chemical pumps and adjust both to the same flow rate of
approximately 80%
9. At regular intervals of approximately 20-30 seconds, the conductivity and
reaction temperature indicated on the measuring unit until stable values are
reached
10. Then reduce the flow rate of both chemical pumps to the same value of
approximately 40%.
11. Then the conductivity and reaction temperature indicated on the measuring unit
at regular intervals of approximately 20 – 30 seconds until stable values are
reached.
12. Check whether the hot water temperature has reached 45ºC and switch on the
hot water pump.
13. Again the conductivity and reaction temperature indicated on the measuring
unit at regular intervals of approximately 20-30 seconds until stable values are
reached.
14. Then increase the flow rate of both chemical pumps back to the same value of
approximately 80%
15. Again log the conductivity and reaction temperature indicated on the
measuring unit at regular intervals of approximately 20-30 seconds until stable
values are reached.
16. Switch off chemical pumps, heater, and hot water pump.
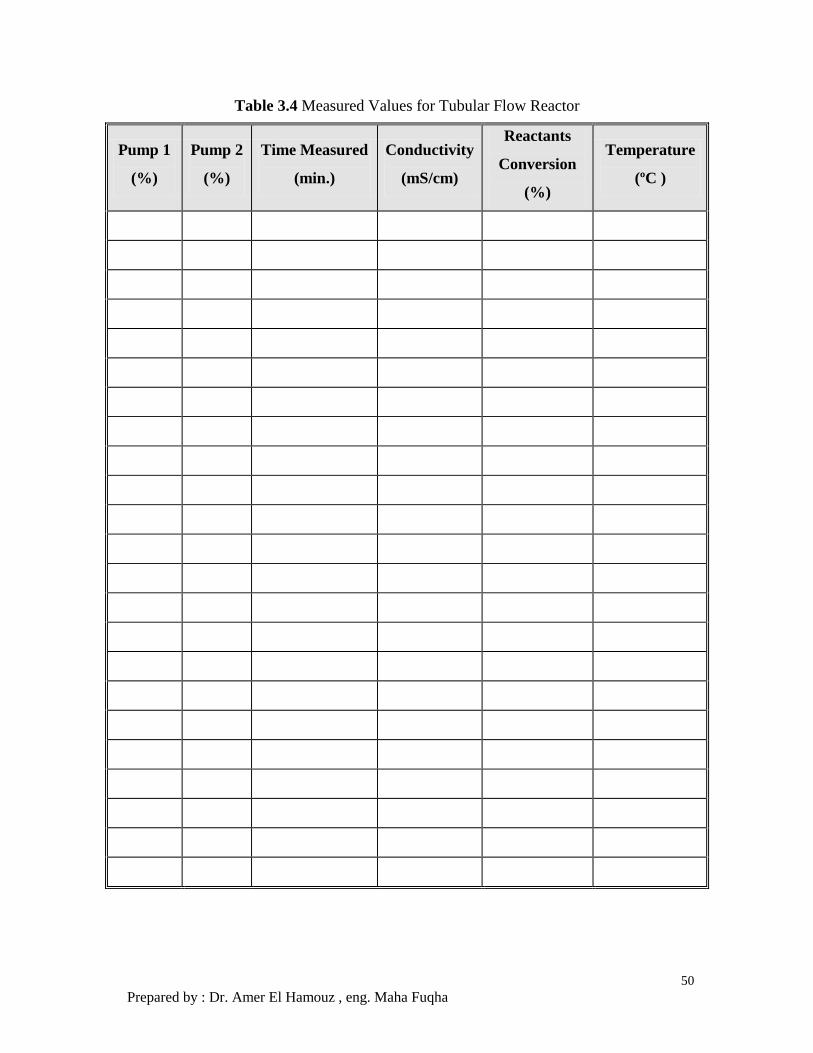
17. Record your data in Table 3.4
50
Prepared by : Dr. Amer El Hamouz , eng. Maha Fuqha
Table 3.4 Measured Values for Tubular Flow Reactor
Pump 1
(%)
Pump 2
(%)
Time Measured
(min.)
Conductivity
(mS/cm)
Reactants
Conversion
(%)
Temperature
(ºC )

51
Prepared by : Dr. Amer El Hamouz , eng. Maha Fuqha
Initial Conductivity of 2.3 % NaOH mS/cm
Note 4: After the end of the experiment
Undo all the connections to the reaction vessel and remove the measuring
sensor.
Rinse the measuring sensor with water.
Empty reaction vessel and rinse it out.
Drain both chemical tanks and rinse out.
Operate both chemical pumps with water to clean them.
Correctly dispose of the product of the reaction collected in the collecting tray.
Switch off unit at master switch.
3.4.2 Report Requirement
1. Convert measured results for conductivity into percentage conversion of
reactants.
2. On one graph, plot conversion (%) and temperature (ºC) and percentage flow
rate values for the pumps versus time (s).
3. Comment on your results.

52
Prepared by : Dr. Amer El Hamouz , eng. Maha Fuqha
Figure 3.4 Stirred Tanks in Series Figure 3.5 Back Panel of the Measuring Point Selector
3.5. STIRRED TANKS IN SERIES
Figure 3.4 shows a cascade consists of several stirred tanks connected in series. This
arrangement offers the advantage that in one setup, solutions with varying degrees of
progress of the reaction are available. Figure 3.5 shows the monitoring Panel.
3.5.1 Performing the Experiments
1. Attach the stirred tanks in series to the trainer above the collecting tray
2. Place the measuring point selector on the switch housing on the trainer
3. Connect the supply connection (1) (Figure 3.5) to the associated socket on the
right on the main unit.
4. Connect the digital connection (2) (Figure 3.5) to the associated socket on the
right on the main unit
5. Connect the conductivity connection (3) (Figure 3.5) to the measuring sensor
adapter on the left on the main unit.
6. Connect the three stirrers to the associated sockets (4) (Figure 3.5).
7. Connect the four measuring sockets to the associated receptacles on the
reaction tanks and to the corresponding sockets (5) (Figure 3.5).
8. Connect the chemical hoses from the pumps to the cascade using the rapid
action connectors
9. Ensure that the end of the overflow hose from the delay section is in the
collecting tray
53
Prepared by : Dr. Amer El Hamouz , eng. Maha Fuqha
10. Place all three-way valves in the correct open position
11. Switch on both chemical pumps and adjust to the same flow rate of
approximately 80%
12. Switch on the stirrers one after the other, once the blades are covered with
sufficient liquid, and set to a medium speed
13. Once the reaction mixture has reached all tanks and sections, with the aid of the
measuring point selector measure all four values for conductivity and reaction
temperature and note
14. Reduce the flow rate of both chemical pumps to the same value of around
approximately 40%
15. At intervals of one minute, the value at all four measuring points until a stable
state is reached.
16. Record your data in Table 3.5

54
Prepared by : Dr. Amer El Hamouz , eng. Maha Fuqha
Table 3.5 Measured Values for Stirred Tanks in Series
PUMP 1 80%
PUMP 1 80%
Initial Conductivity Of 2.3 % NaOH---------- mS/cm
Conductivity (mS/cm) Reactor Conversion (%) Temperature (C)
Tank 1
Tank 2
Tank 3
Delay Section
Note 5: After the end of the experiment
Undo all the connections to the reaction vessels and remove the measuring
sensors
Rinse the measuring sensors with water
Drain the reaction vessels and rinse it out with water
Drain both chemical tanks and rinse it out
Operate both chemical pumps with water to clean them
Correctly dispose of the product of the reaction collected in the collecting tray
Switch off unit at master switch
3.5.2 Report Requirement
1. Convert measured results for conductivity into percentage conversion of
the reactants and compare.

55
Prepared by : Dr. Amer El Hamouz , eng. Maha Fuqha
APPENDIX
Technical Data
Conductivity Measure Range 0...200 mS/cm
Temperature Measure Range 0...100 °C
Heater, Electrical 2 kW
Volume of Hot Water approx. 15 l
Hose Pumps:
Speed 0 - 105 min-1
Pump Flow Rate max. 250 ml/min
Chemicals:
Sodium Hydroxide 2.3%
Acetic Ether (Ethyl Acetate)
Power Supply 230V, ~50 Hz
Dimensions:
LxWxH 1300 x 680 x 630 mm
Weight approx. 90 kg
Continuous Stirrer Tank Reactor:
Volume 0.4 - 1.5 l
LxWxH 470 x 400 x 380 mm
Weight approx. 13 kg
Tubular Flow Reactor:
Pipe Section Length 20 m
Tube Diameter 5.5 mm
Reactor Volume 0.475 l
LxWxH 470 x 250 x 600 mm

56
Prepared by : Dr. Amer El Hamouz , eng. Maha Fuqha
Weight approx. 25 kg
Stirred Tanks in Series:
Tank Volume 1.2 l
Delay Section Length 2.8 m Delay Section Volume 0.2 l
LxWxH 470 x 460 x 400 mm
Weight approx. 32 kg
Batch Reactor:
Volume 0.95 l
LxWxH 470 x 290 x 380 mm
Weight approx. 8 kg