Embed Size (px)
Citation preview

spectra Volume No. 2, Number 1 Finnigan Corporation February 1972
Chemical Ionization Mass Spectrometry
by E. J . Bonelli and M. S. Story
Introduction
One of the exciting new techniques in mass spectrometry has been the development of the chemical ionization source 1. In comparison to the elect ron impact source, chemica l ionization offe rs the advantages of si mpler c racking patterns, intense quasi-molecular ions and easy-to-interpret spectra.
Principle of Operation
Chemical ionization (CI) is a form of high pressure mass spectrometry (0.5-1 .5 torr) where the compound of interest is reacted with reactant ions. T he reactant ions are formed from one substance by a combination of electron impact and ion-molecule reactions. The reaction of these ions with the material to be chemically ionized occurs by ion-molecule reactions. In most of the work done to date, methane has been the source of reactant ions. The reactant ions formed from methane are shown below:
Primary electron impact reaction CH4+e~CH4 +, CH3 +, CH2 +, CH+, c+, H2 +, H+ + 2e·
Secondary ion-molecule reactions CH4 + + CH4- CH5 + + CH3
CH3 + + CH4- C2H5 + + H2 + fC2H4+ + H2
CH2 + CH4- l C2H3+ + H2+ H + + CH +CH4-C2H2 +H2 +H
Tertiary ion-molecule reactions
C2H5 + + CHcC3H7 + + H2
C2H3 + + CHcC3H5 + + H2 C2H2 + + CHcpolymer
The ions which predominate in the above reactions are CH5 + ( 47% of the total) , C2H5 + {41% of the total) and C3H5+ (6% of the total). For these ions t he chemical ion ization precesses involve the transfer o f massive entities such as protons (H+). hydride ions (H-) and alkyl carbonium ions (R-CH 2+).
Thus, C l spect ra are quite different from electron impact (EI) spectra, wh ich are governed by FranckCondon considerations. Furthermore, the nature of the Cl process is such that the product ions formed
Figure 1: Exploded view of chemical ionization source.
contain even numbers of electrons. This is in contrast to the odd-electron ions formed by El and field ionization processes. Also , the amount of energy involved in Cl reactions tends to be low, depending on the identity of the reactant material used; this accounts for the simpler cracking patterns and generall y high intensity of the quasimolecular ion.
It is possible to use many different gases as reactants and thus produce spectra from reactant ions of different energ ies. Other reactant gases used in C l (major reactant ion in parenthesis) are n-propane (i-C3H7 +). hydrogen (H3 +). isobutane (t-C4H9 +), nitrogen (N2+). water (H30 +, H50 2). rare gases (R+). methanol (CH 30H 2 +, (CH30 Hh H+ ) and ammonia (NH4 +, N2H7+).
Component Description A chemica l ionization source (Fig. 1) used in a multipurpose gas chromatograph /mass spectrometer system must allow ent rance of the GC effluent and solid probe sample. In addition , it is desirable to have the source operable in the El mode.

The gas flow conductance out of the source must be low so that the filament and the rest of the spectrometer are not under excessive pressure. The electron entrance and ion exit holes should be as large as possible to optimize sensitivity, but not so large as to raise the pressure over 10·4 torr in the rest of the system when the source interior pressure is at 1 torr. There also must be additional lines to the source to bring in the sample and the reagent gases.
The source consists of a filament, ionization block, electron co llector, ion repeller , ion lens and quadrupole entrance aperture. When used in the C l mode, the source parameters general ly used are 100 microamp emission , 100 volts electron energy, 5 volts ion acceleration voltage, 1 to 5 volts ion repeller and 10-50 volts of lens voltage. The entrance aperture is at ground potential. When used in the El mode, the source parameters are the same except the repeller is raised to 20-40 volts. Because of the closed nature of such a source, it is necessary to provide heating to reduce background . An internal heater capable of raising the temperature of the source to 250° C in ten minutes is incorporated .
Cl In GC/ MS Systems
In general, the interfacing of a GC to a MS has two problems which must be overcome; high gas flow rates and low sample to carrier gas ratio {or low system dynamic range) . Both problems have been solved to some extent by the use of separators .2 However, if a separator is not used the low sample to carrier {reactant) gas ratio actually becomes an asset since with C l the reactant gas to sample gas ratio must be at least 100:1. However the ion source diffusion pump must be still capable of handling the entire GC effluent.
Figure 2 shows the arrangement of a GC/ MS system uti lizing an EI-CI source. The ion source is differential ly pumped by a 1200 liter/ sec diffusion pump with a water cooled cold cap. The main chamber is pumped by a 300 liter/sec pump with a liquid nitrogen baffle. The two chambers are separated by a vacuum baffle. With this arrangement 5-10 ml/ min of methane can be run into the source from the gas chromatograph without the use of a separator.
When solid probe samples are to be analyzed in the El mode, the reagent gas is simply turned off. With no separator in the system El spectra on GC samples cannot be run . However, if helium is used as the carrier-reagent gas the resulting spectra from charge exchange reactions shows remarkable resemblance to El spectra 3 .4 .5, and higher flow rates can be used. A controller module with flow switching valves is provided to regulate gas flow into the solid probe. It also will allow any one of th ree reagent gases to be routed to either the solid probe or GC. Evacuation of gas lines is also provided .
Figure 2: Vacuum diagram of Finnigan Model 1015C or 3100 with chemical ion ization system .
Applications-Hydrocarbons
Hydrocarbons are characterized by the formation of the {M-1 )+ quasi-molecular ion {i.e. molecular ion minus one) which occurs by H- abstraction. This can occur as a direct hydride ion abstraction with C2H5+ or a dissociative proton transfer from CH5+. Using n-C18H38 as an example, the following can occur:
n-C18H38 + CH5 + - s-C 18H37 + + CH4 + H2
n -C,8H38 + C2H5+-s-C18H37 + C2H6
The reactions above which produce the secondary octadecyl ion are exothermic. The formation of the primary octadecyl ion would be slightly endothermic and thus relatively improbable.
Branched alkanes give spectra similar to normal alkanes but there are generally less {M-1 )+ ions
8 ~ EfY De11CR.. lCNJZRTJ(),
n.c, .HJ(_
n ·~H ..
I I
0 10 20 30 'ICl SO 60 70 ~ 90 100 llO 120 SPECTR.N N.HlER
Figure 3: Hydrocarbons by GC/ CIMS: 10' x 1/B" S .S., 3% SE-30 on 80/100 Chromosorb W (HP); carrier gas, methane, to give 900 ~ pressure in the ion source (d irect connection); sample size, 1 J .. d (5 ~g per component in hexane); injector 225° C; c rossover 230° C; column 85° C- 250 C @ 15° C/min; ion source 100° C; fi lament current 500 ~a@ 100eV.
.. 1
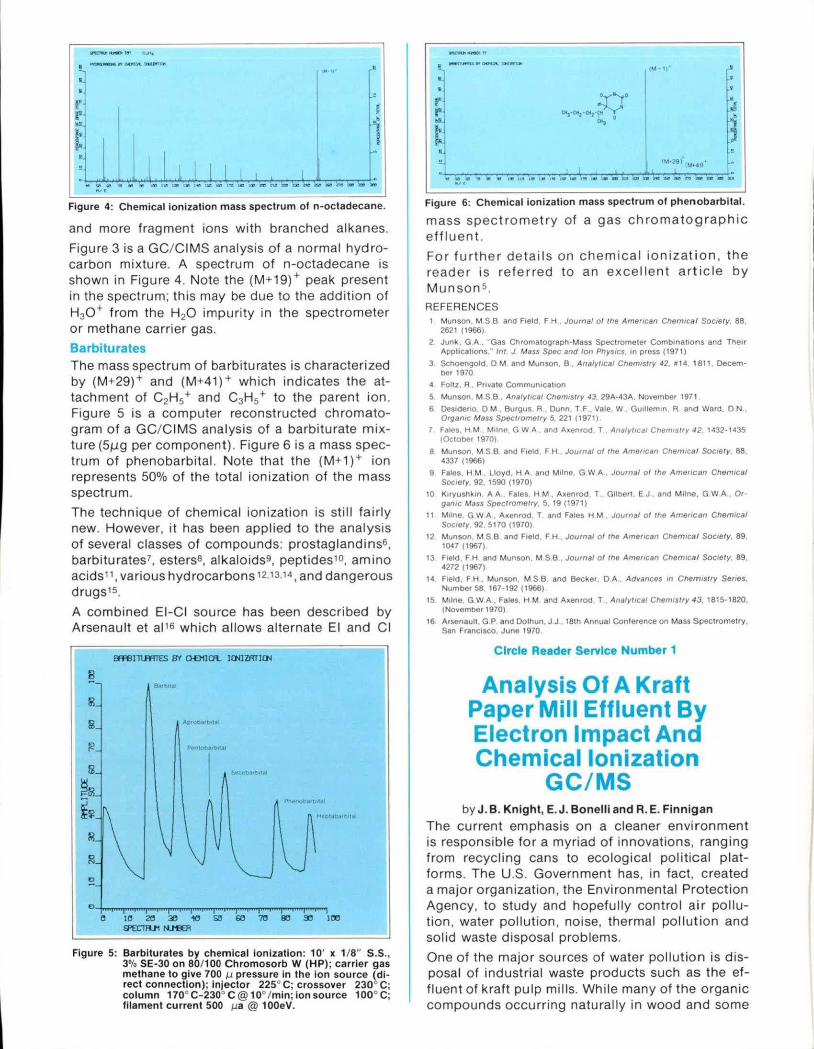
.I ..... .... ! .... J Figure 4: Chemical ionization mass spectrum of n-octadecane.
and more fragment ions with branched alkanes.
Figure 3 is a GC/ CIMS analysis of a normal hydrocarbon mixture. A spectrum of n-octadecane is shown in Figure 4. Note the (M+19) + peak present in the spectrum; this may be due to the addition of H30+ from the H20 impurity in the spectrometer or methane carrier gas.
Barbiturates The mass spectrum of barbiturates is characterized by (M+29)+ and (M+41) + which indicates the attachment of C2H5 + and C3H5 + to the parent ion. Figure 5 is a computer reconstructed chromatogram of a GC/ CIMS analysis of a barbiturate mixture {S!Jg per component) . Figure 6 is a mass spectrum of phenobarbital. Note that the (M+1) + ion represents 50% of the total ionization of the mass spectrum.
The technique of chemical ionization is still fairly new. However, it has been applied to the analysis of several classes of compounds: prostaglandinss, barbiturates?, esterss, alkaloids9, peptides10, amino acids 11, various hydrocarbons 12.13.14, and dangerous drugs15.
A combined EI-CI source has been described by Arsenault et ailS which allows alternate El and C l
~ .. 2
s Apr bJitbltal
~ ft.,toba ·~1
fil
~51 ~~
,,
"" ~
1'3
~
Figure 5: Barbiturates by chemical ionization: 10' x 1/8" S.S., 3% SE-30 on 80/100 Chromosorb W (HP); carrier gas methane to give 700 J.1. pressure in the ion source ~direct connection); Injector 225" C; crossover 230 C; column 170" C-230" C @ 10" / min; ion source 100° C; filament current 500 p a @ 100eV.
Figure 6: Chemical ionization mass spectrum of phenobarbital.
mass spectrometry of a gas chromatographic effluent.
For further details on chemical ionization, the reader is referred to an excellent article by Munson s.
REFERENCES 1 Munson. M S B and Field, F H . Journal of tho Amortcan Cham1caf Soc1aty. 88,
2621 (1966)
2 Junk . GA. "Gas Chroma1ograph·Mass Spec1rome1er Comb•nauons and The" Appltcauons." tnt J Mass Spec and /on Phys1cs '" press (1971)
3 Schoengold, D M and Munson. B . Anafyttcal Chem1stry 42. •14 1811 , Decem-ber 1970
4 Follz, R Prtvate Commun•cauon
5 Munson. M S B , Anatyt1ca1 Chemistry 43, 29A-43A, November 1971
6 Destdeno D M Burgus. R Dunn T F Vale. W Gu•llemtn. R and Ward. D N Organoc Mass Spectrometry 5, 221 ( 1971)
7 Fates. H M M1lne. G W A and Axenrod T Analyt•cal Chemos try 42 1432- 1435 (October 1970)
8 Munson M S B and F1eid. F H . Journal of the Amencan Chem1ca1 Soc1ety, 88, 4337 (1966)
9 Fales H M Lloyd, H A and M•lne, G W A, Journal of the Amerocan Chem1cat Soc1oty, 92, 1590 (1970)
10 Koryushk1n. A A Fales. H M Axenrod T Gil ben. E J and Milne. G W A ., Or· ganoc Mass Spectrometry, 5. 19 (1971)
11 Milne, G w A , Axenrod T and Fales H M Journal of the Amerocan Chem1cal SOCiety 92 5170 (1970)
12 Munson. M S B and Fteld, F H Journol oflhe Amencan Chem1ca1 Socoety, 89, 1047 (1967)
13 Field, F H and Munson. M S B Journal of the Amencan Chem1cal Soc1ety. 89, 4272 (1967)
14 Field, F H . Munson M S B and Becker D A Advances m Chem1stry Sones. Number 58. 167· 192 (1966)
15 M1lne, G W A , Fales. H M and Axenrod. T . AnalyiiCBI Chemistry 43. 1815-1820, (November 1970)
16 Arsenaull. G P and Dol hun. J J .• 18th Annual Conference on Mass Spectrometry. San Francisco. June 1970
Circle Reader Service Number 1
Analysis Of A Kraft Paper Mill Effluent By Electron Impact And Chemical Ionization
GC/MS by J . B. Knight, E. J . Bonelli and R. E. Finnigan
The current emphasis on a cleaner envi ronment is responsible for a myriad of innovations, ranging from recycling cans to ecological political platforms. The U.S. Government has, in fact, created a major organization, the Environmental Protection Agency, to study and hopefully control air pollution , water pol lution, noise, thermal pollution and sol id waste disposal problems.
One of the major sources of water pollution is disposa l of industrial waste products such as the effluent of kraft pu lp mills. While many of the organic compounds occurring naturally in wood and some

of those produced during the pulping process have been identified, little is known of the organics remaining after waste treatment procedures. Before the advent of gas chromatography/ mass spectrometry, it was practically impossible to perform a detailed analysis of the complex mixture of chemicals entering our natural water system from kraft pulp mills.
Figure 7: Computer reconstructed chromatogram of acid frac-tion of kraft paper mill effluent.
Garrison et al 1 have employed GC/ MS in the characterization of these effluents. The results they obtained were similar to those in the computer reconstructed chromatogram shown in Figure 7, which represents the acidic fraction (phenols and acids) of the effluent. The sample was prepared by first extracting the effluent with chloroform to remove terpenes, then methylating it with dimethyl sulfoxide and sodium hydroxide, and finally extracting the methyl esters and ethers with chloroform. The extract was injected into a 10' x 1/8" SS column packed with 3% OV-1 on 60/80 mesh Gas Chrom Q . The column oven temperature was programmed from 70-240° C at 8° C/ min. The sample was analyzed by both electron impact and chemical ionization GC/ MS. When analysed in the Cl mode, methane was employed as the reactant gas.
Figure 8: Electron Impact (above) and chemical ionization spec-tra of 3, 4- dlmethoxy benzaldehyde.
Figure 8 shows both El and Cl spectra of a compound which was identified as 3,4-dimethoxy benzaldehyde. Note that the (M+29) + and (M+41) + of the Cl spectrum confirm the mo lecular ion to be m/ e 166. The high intensity of the (M+1) + ion fragment of the Cl spectrum indicates that high sensitivities are attainable.
II
Circle Reader Service Numbers here for more information on equipment and techniques described in this issue of Finnigan Spectra:
1. Chemical Ionization Mass Spectrometer
2. GC/ MS Computer Analysis of Kraft Paper Mill Effluent Using Electron Impact and Chemical Ionization Fragmentation Techniques
3. GC/MS Analysis of Chlorinated Dioxins
4. Send Information on the 1972 Series of Customer Operation/ Service Train-
1• ing Courses.
II
5. Send Technical Information on Quanta/ Metrix Computerized Energy-dispersive X-ray Spectrometer
o Check this box i f you have already completed a Finnigan Spectra Subscription Request Card.
FOLD, STAPLE AND RETURN THIS CARD
Finnigan Corporation
Gentlemen: Please address my free subscription to Finnigan Spectra as follows: Name __________________________ _
Position -------------------------
Organization --------------------
Department ----------------------
Address ---------------------
----------------Zip __ _
o Industry (1)
o Government Agency (2)
o Educational Institution (3)
o Hospital/ Medical School (4)
0 (5)

I
...
ltinnigan HOTLINE
Finnigan Applications Laboratory
Gentlemen: Please telephone me at to supply technical data on my potent1al application of GC/ MS technology to the following analytical problem.
~ ti ~ ~ ~ ~ < ::D $
~ ~ ; :;;~ 0-::DJI> !,.. Jl><
~ ~ 0 c: g: m
(Jj ..., :!! r:: ..
" ! ::Jl
" (Jj '< c ... II z 0 !0 !" r
)>
0 "' (Jj
"' (Jj
'!'" "'
Figure 9 represents El and Cl spectra of 3,4-dimethoxy acetophenone whose molecular ion is at m/e 180.
op·
...... 1 ........ --~--" ... """"' M•11" ' • • •
~ . -~~---- ·- ·· - -·- - - - ---- -· --- - -----
Figure 9: Electron impact (above) and chemical ionization spectra of 3, 4 - dimethoxy acetophenone.
The resin acids lend themselves well to chemical ionization analysis as shown by methyl abietate in figure 10. Note the intensity of the (M+1) + quasimolecular ion in the Cl spectrum compared to the M + molecular ion of the El spectrum. The sample fragmentation pattern of C l also great ly facilitates the positive determination of molecu la r weights .
r I' .. t
.. . . . . ... . .
_,..,,.
... It •• , .. . . .... ... ... "' i' - .. lJ;; • - ,. - - - • • - - ...
Figure 10: Electron impact (above) and chemical ionization spectra of methyl abietate.
In addition to methyl abietate, some of the other major components were also found to be methyl esters of resin acids.
The combin ed use of the elect ron impact and chemica l ionization source in the GC/ MS promises to be a powerful analytical tool. Not only can we expect higher system sensitivity, but we can also obtain addi tional information to help us make positive identifications.
REFERENCES 1 Gamson AW Kcolh, L H and Walker M N ASTM E·14 Common~e 181h Annual
Conlcrence on Mass Spcc1rom01ry and Allied Topocs San Francosco 1970
Circle Reader Service Number 2

GC/ MS Of Chlorinated Dioxins
by Ernest J . Bonell i
One class of chlorinated industrial compounds now coming under scrutiny as a possible threat to our environment are chlorinated dioxins. Since these compounds are structurally simi lar to such chlorinated hydrocarbon pesticides as DDT, it is considered possible that chlorinated dioxins can accumulate in food chains, ... threatening the environment in the same manner as the pesticides.
Chlorinated dioxins are known to produce chloracne, a disease which causes skin eruptions and often requires 2-3 years for recovery . Another problem caused by chlorinated dioxins is chick edema, a disease of chickens that occurs periodically in the United States and kills millions of young chicks . These compounds were first iso lated in the toxic fat in the chicken feeds. One of the principle dioxins, TCDD (tetrachlorodibenzo-p-dioxin). ranks second only to neurotoxins as a poison . When fed to rats, which are general ly more hardy animals than man , a dose-to-body weight ratio of 0.125 part per billion is toxic to the fetus.
Dioxin is found in 1-5 ppm concentrations in commercial preparations of the herbicide 2, 4, 5-Trichlorophenoxyacetic acid {2,4,5-T) as shown below:
co c•.,P.c• co
....-1 1' M e l10 coo:o:co Cl ~ ~ Cl
1 , 1, 7, 1 tet,..chletM i iteftle - , · lll~• ln l fC DDI
He Selt •• 1 , 4 , S · f
The computer reconstructed chromatogram shown in Figure 11 represents 30 ng (3 x 1Q· B gm) of TCDD injected on column. The column used was a 3%
I I I I I I I u' 215 Je 10 Sf'£I:1H.J1 N.lftJI
Figure 11 : 2,3,7,8-T etrachloro -p- D ioxin
Figure 12: Spectrum Number 18. 2,3,7,8-Tetrachloro -p - Dioxin
OV-1 on 60/ 80 Gas Chrom Q (5' x 2mm ID glass) operated at 220° C isothermal. Figure 12 (Spectrum 18} is the mass spectrum of TCDD. GC/ MS allows us to detect and positi vely identify low levels of chlorod ioxins in a variety of carriers.
Circ le Reader Service Number 3
Datelines San Carlos, California
Finnigan Corporation has just acquired Quanta/ Metrix, a manufacturer of computerized energydispersive X-ray spectrometers. Quanta/ Metrix instruments are widely used for quantitative and qualitative elemental analysis of inorganic substances in geology, biology, chemistry, medicine, metallurgy, archaeology, and ind ustrial process monitoring and quality control.
Circle Reader Service Number 4
finnigan spectra
"ll ::!! z -1 m a 2 c in ),.
Editor ... Ernest J. Bonelli
Finnigan Corporation
595 N Pasloria Avenue. Sunnyvale. Callfornoa 94086 408· 732·0940
P.O. Box 790. Arlonglon Heights. Illinois 60006 312-358·0522
1551 Oakland Avenue. Union. New Jersey 07083 201-964- 1353
.. ; v i ::- . -.J ·-0' 0 C'O u .


![Electrospray ionization mass spectrometry of ...93)85031-R.pdfElectrospray Ionization Mass Spectrometry of Phosphopeptides Isolated by On-Line ... this purpose [19~22]. Immobilized](https://img.dokumen.tips/doc/110x75/5ad660d07f8b9a6b668b8d17/electrospray-ionization-mass-spectrometry-of-9385031-rpdfelectrospray-ionization.jpg)