Embed Size (px)
Citation preview

CHEMICAL INVESTIGATIONS OF THE METABOLITES OF TWO STRAINS OF TOXIC CYANOBACTERIA
Justin D. Isaacs
A Thesis Submitted to the University of North Carolina Wilmington in Partial Fulfillment
of the Requirements for the Degree of Master of Science
Department of Chemistry and Biochemistry
University of North Carolina Wilmington
2011
Approved by
Advisory Committee
Pamela J. Seaton Bongkeun Song Jeffrey L. C. Wright
Chair
Accepted by
Dean, Graduate School

ii
TABLE OF CONTENTS
ABSTRACT ................................................................................................................................... iii
ACKNOWLEDGEMENTS ........................................................................................................... iv
LIST OF TABLES .......................................................................................................................... v
LIST OF FIGURES ....................................................................................................................... vi
INTRODUCTION .......................................................................................................................... 1
EXPERIMENTAL ........................................................................................................................ 12
Analysis of a naturally occurring bloom of Microcystis aeruginosa ................................ 12
Analysis of Planktothrix rubescens (UTCC 507) ............................................................ 16
Amino Acid Analysis ........................................................................................................ 21
RESULTS ..................................................................................................................................... 24
Microcystis aeruginosa Products ...................................................................................... 24
Planktothrix rubescens (UTCC 507) Products ................................................................. 39
DISCUSSION ............................................................................................................................... 66
Microcystis aeruginosa ..................................................................................................... 69
Planktothrix rubescens (UTCC 507) ................................................................................ 70
CONCLUSION ............................................................................................................................. 72
LITERATURE CITED ................................................................................................................. 73
APPENDIX ................................................................................................................................... 77
iii
ABSTRACT
Cyanobacteria harmful algal blooms (CHABs) are an ever-increasing problem in
bodies of water that experience high levels of pollution or eutrophication, jeopardizing the health
of humans and animals who rely on these sources of water for drinking or recreation. A general
analytical method was employed to analyze interesting secondary metabolites produced by a
natural bloom of Microcystis aeruginosa in the Cape Fear river and a laboratory-cultured sample
of Planktothrix rubescens (UTCC 507). The Microcystis aeruginosa sample was found to
produce two known hepatotoxins, microcystin-LR and microcystin-RR, as well as two novel
Ahp-containing depsipeptides, micropeptin 1106 and micropeptin 1120. Planktothrix rubescens
(UTCC 507) was found to produce one previously known hepatotoxin, [D-Asp3, (E)-Dhb7]
microcystin-HtyR, and one novel Hph-containing microcystin, [D-Asp3, (E)-Dhb7] microcystin-
HphR. In addition Planktothrix rubescens (UTCC 507) also produced two novel cyclic peptides,
anabaenopeptin 872 and anabaenopeptin 856, that belong to the anabaenopeptin family. Both of
these anabaenopeptins contain versions of the extremely rare amino acids known as alternamic
acids, which previously had never been found in cyanobacterial metabolites. These isolates
demonstrate the diverse metabolic capacity of toxigenic cyanobacteria, which may as yet be
found to possess important biological activity.

iv
ACKNOWLEDGEMENTS
I would like to thank Dr. Jeffrey Wright for providing me with the opportunity to work in
his lab and learn natural product chemistry while developing the skills I need to successfully
accomplish future career goals. Another special thanks goes out to Dr. Ryan Van Wagoner,
Allison Drummond, and Jan Vincente for teaching me the ways of a natural product chemist and
offering advices to help me overcome obstacles in the lab. I would also like to thank Mrs. Eve
Wright for teaching me culturing techniques and growing the cyanobacteria cultures I used
throughout my study, as well as Dr. Mike Mallin and Matt McIver for providing the cell samples
of Microcysis from the Cape Fear River. I am very grateful for the wonderful experience I had
while working at the Center for Marine Science and that can be accredited to all the kind and
helpful people I met, Thank You.
Most importantly, I would like to thank my mom, Donna Isaacs, and my grandfather,
Herman Williams, for telling me that I can accomplish anything I put my mind to, for telling me
I am great, and never letting me give up. Thank you for always being there for me, no matter
what, and supporting my every need. It is because of them that I shoot for the stars and never
look back; I only hope that I can give them as much as they have given me. I would also like to
thank my girlfriend, Claire Taylor, for being understanding and giving up cuddle time so that I
can accomplish my goals. It has been a sacrifice for us all.
v
LIST OF TABLES
Table Page
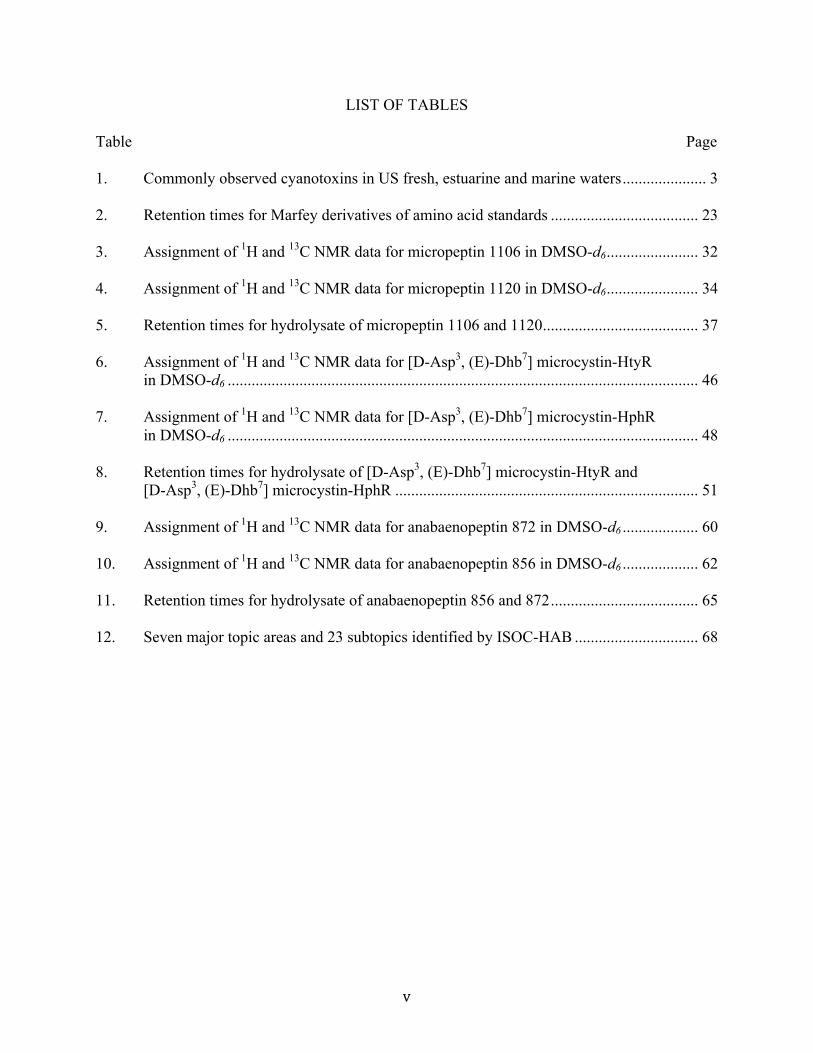
1. Commonly observed cyanotoxins in US fresh, estuarine and marine waters ..................... 3
2. Retention times for Marfey derivatives of amino acid standards ..................................... 23
3. Assignment of 1H and 13C NMR data for micropeptin 1106 in DMSO-d6 ....................... 32
4. Assignment of 1H and 13C NMR data for micropeptin 1120 in DMSO-d6 ....................... 34
5. Retention times for hydrolysate of micropeptin 1106 and 1120 ....................................... 37
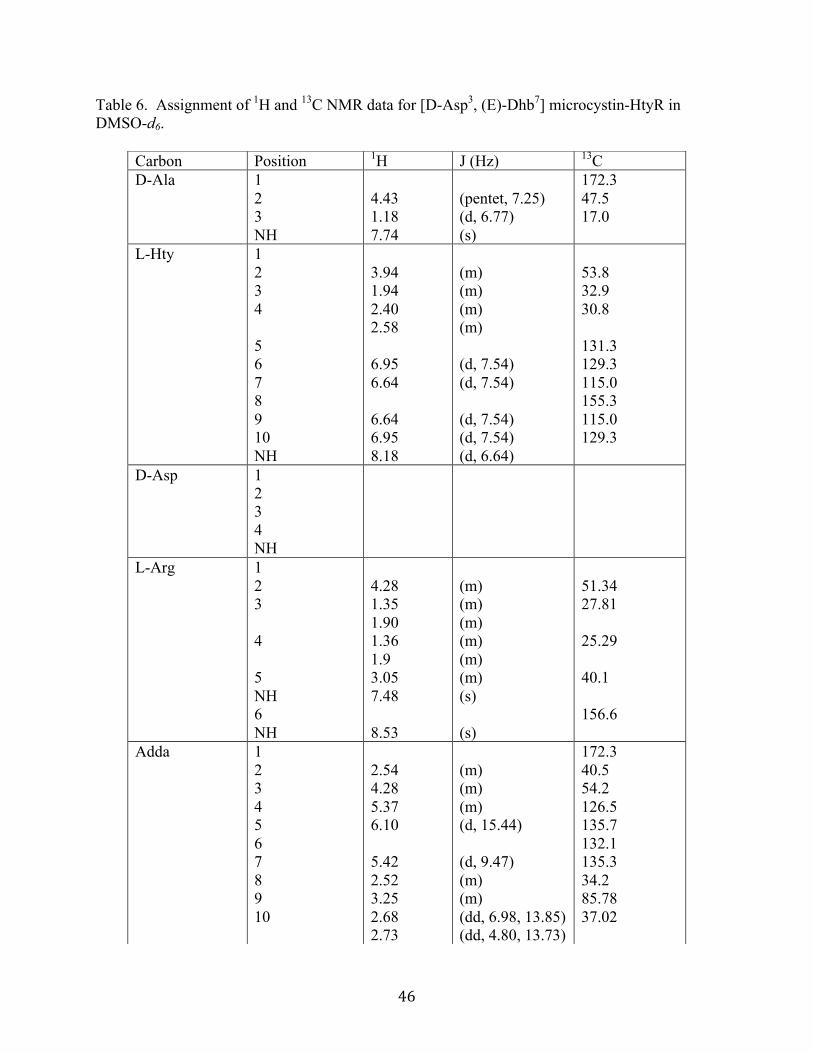
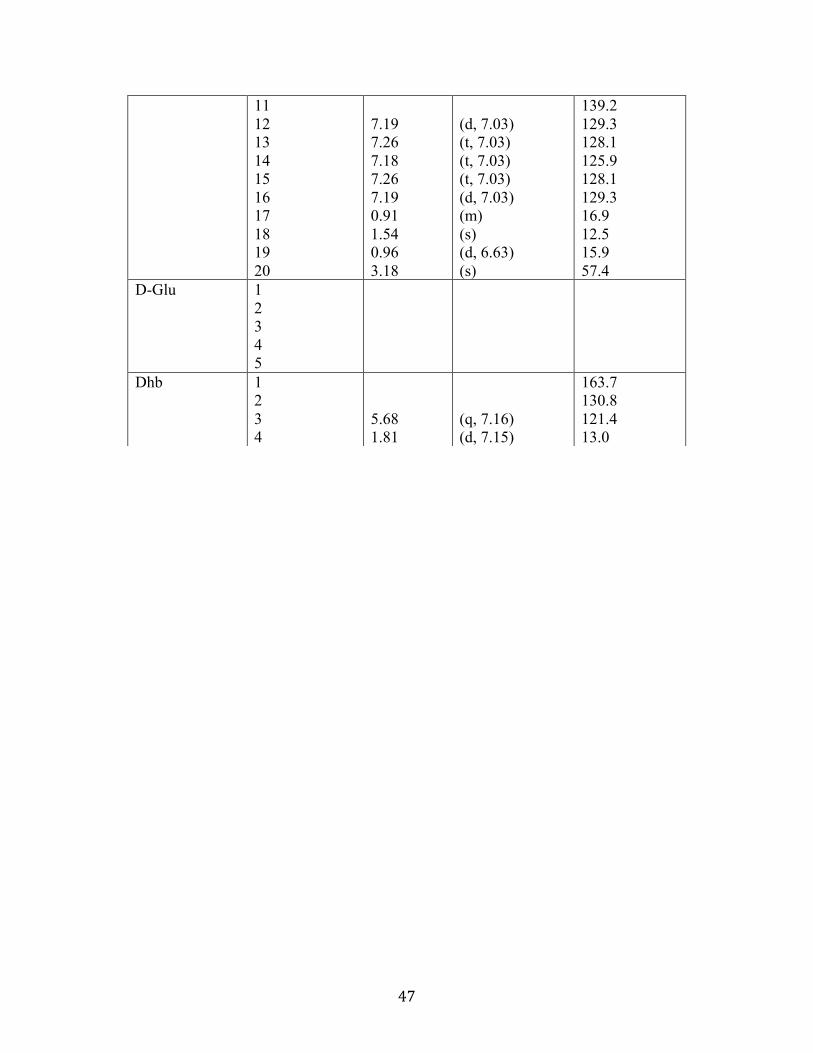
6. Assignment of 1H and 13C NMR data for [D-Asp3, (E)-Dhb7] microcystin-HtyR in DMSO-d6 ...................................................................................................................... 46 7. Assignment of 1H and 13C NMR data for [D-Asp3, (E)-Dhb7] microcystin-HphR in DMSO-d6 ...................................................................................................................... 48 8. Retention times for hydrolysate of [D-Asp3, (E)-Dhb7] microcystin-HtyR and [D-Asp3, (E)-Dhb7] microcystin-HphR ............................................................................ 51 9. Assignment of 1H and 13C NMR data for anabaenopeptin 872 in DMSO-d6 ................... 60
10. Assignment of 1H and 13C NMR data for anabaenopeptin 856 in DMSO-d6 ................... 62
11. Retention times for hydrolysate of anabaenopeptin 856 and 872 ..................................... 65
12. Seven major topic areas and 23 subtopics identified by ISOC-HAB ............................... 68
vi
LIST OF FIGURES
Figure Page
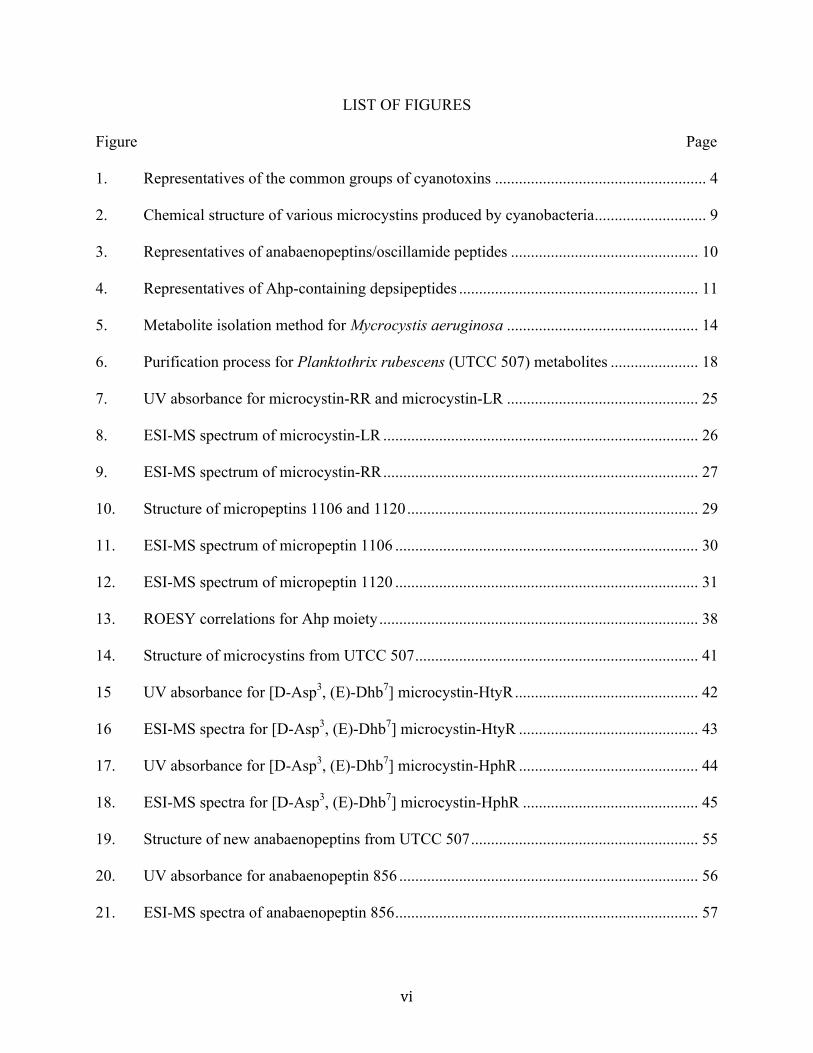
1. Representatives of the common groups of cyanotoxins ..................................................... 4
2. Chemical structure of various microcystins produced by cyanobacteria ............................ 9
3. Representatives of anabaenopeptins/oscillamide peptides ............................................... 10
4. Representatives of Ahp-containing depsipeptides ............................................................ 11
5. Metabolite isolation method for Mycrocystis aeruginosa ................................................ 14
6. Purification process for Planktothrix rubescens (UTCC 507) metabolites ...................... 18
7. UV absorbance for microcystin-RR and microcystin-LR ................................................ 25
8. ESI-MS spectrum of microcystin-LR ............................................................................... 26
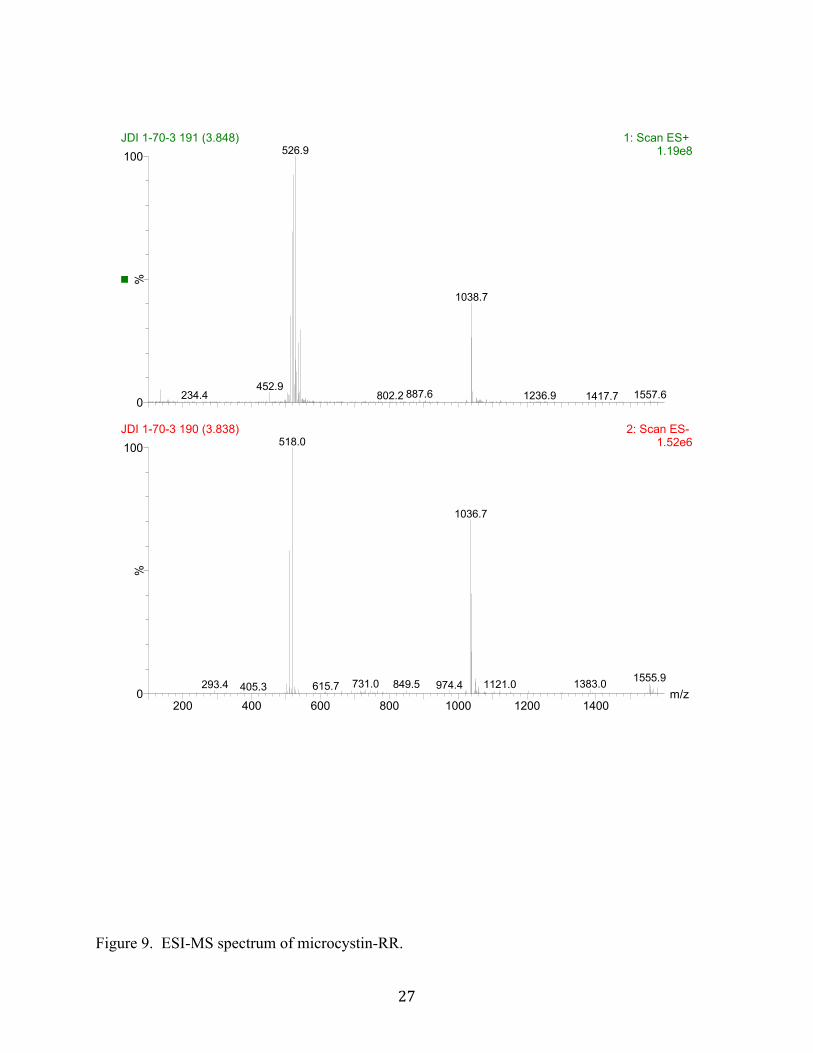
9. ESI-MS spectrum of microcystin-RR ............................................................................... 27
10. Structure of micropeptins 1106 and 1120 ......................................................................... 29
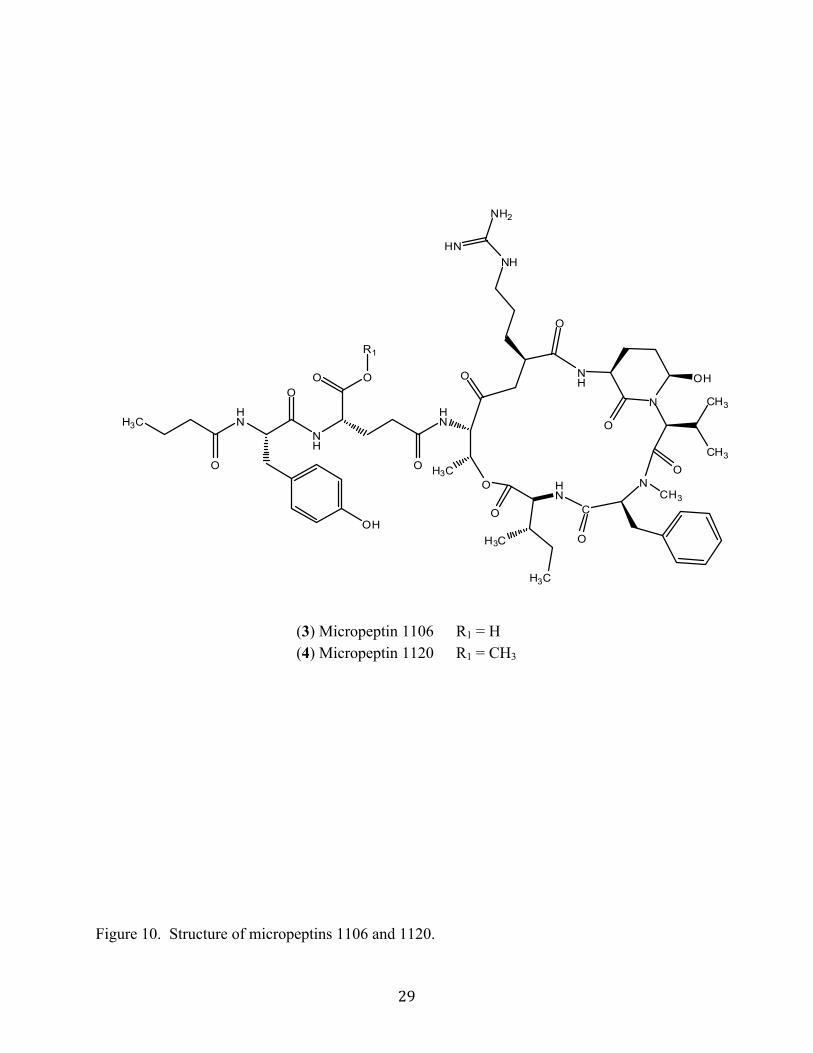
11. ESI-MS spectrum of micropeptin 1106 ............................................................................ 30
12. ESI-MS spectrum of micropeptin 1120 ............................................................................ 31
13. ROESY correlations for Ahp moiety ................................................................................ 38
14. Structure of microcystins from UTCC 507 ....................................................................... 41
15 UV absorbance for [D-Asp3, (E)-Dhb7] microcystin-HtyR .............................................. 42
16 ESI-MS spectra for [D-Asp3, (E)-Dhb7] microcystin-HtyR ............................................. 43
17. UV absorbance for [D-Asp3, (E)-Dhb7] microcystin-HphR ............................................. 44
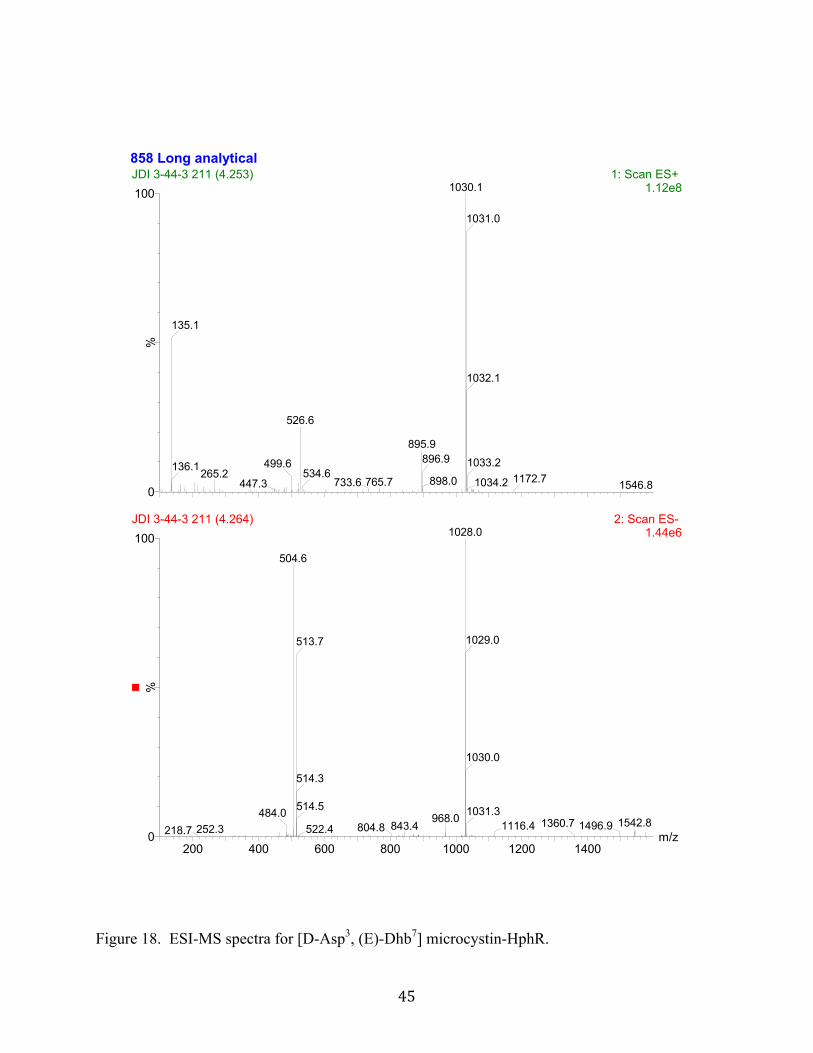
18. ESI-MS spectra for [D-Asp3, (E)-Dhb7] microcystin-HphR ............................................ 45
19. Structure of new anabaenopeptins from UTCC 507 ......................................................... 55
20. UV absorbance for anabaenopeptin 856 ........................................................................... 56
21. ESI-MS spectra of anabaenopeptin 856 ............................................................................ 57

vii
22. UV absorbance for anabaenopeptin 872 ........................................................................... 58
23. ESI-MS spectra of anabaenopeptin 872 ............................................................................ 59
INTRODUCTION
Cyanobacteria, also known as blue-green algae, are ancient prokaryotic organisms that
have survived and flourished on the planet for over two billion years. Their name describes the
characteristic blue and green phycobilin pigments found within these photosynthetic organisms
which are believed to be responsible for producing the earth’s earliest oxygen, enabling aerobic
metabolism and all life forms that depend on it (Dismukes et al., 2001). Cyanobacteria are
prolific organisms, often the first plant life to colonize barren areas of rock and soil, where they
play an important role in the functional processes of ecosystems and the cycling of nutrients.
They also flourish in salty, brackish or fresh water, in cold and hot springs, and other extreme
environments where no other microalgae can exist (Mur et al., 1999). The tremendous
adaptability of these microorganisms has allowed them to inhabit a diverse range of aquatic and
terrestrial environments covering all corners of the earth (Carmichael et al., 1993; Mur et al.,
1999). Awareness of the presence and effects of cyanobacteria has been documented throughout
history. For example, this description by a medieval clergyman and chronicler of his time,
Gerald of Wales, describing the presence of buoyant cyanobacteria in 1188: “The lake has many
miraculous properties --- it sometimes turns bright green, and in our days it has been known to
become scarlet, not all over, but as if blood were flowing along certain currents and eddies”
(Codd et al., 2005a). Such blooms of cyanobacteria can produce toxins and the earliest
documented reports of cyanobacteria causing death were published during the 19th century, when
livestock and wildlife in Australia, Denmark and Poland died by ingesting waters containing
toxic cyanobacteria blooms (Codd et al., 2005a).

2
If the conditions of light, turbidity, and nutrients in a body of water are favorable,
cyanobacteria often form dense blooms, defined as visible colorations of a body of water due to
the presence of suspended cells, filaments and/or colonies and, in some cases, subsequent surface
scums (Fristachi et al., 2008). Blooms are especially prevalent in areas that experience high
levels of pollution or eutrophication, the excessive richness of nutrients, usually phosphorous and
nitrogen, in a lake or other body of water that increases biological production of plant life while
simultaneously killing animal life due to the lack of oxygen. While eutrophication happens
naturally in some bodies of water, many times it is caused by anthropogenic activity such as
municipal wastewater discharge or run-off from fertilizers and manure spread on agricultural
areas (Bartram et al., 1999). This ability to thrive in eutrophic or polluted bodies of water make
cyanobacteria blooms common in rivers, lakes, and reservoirs that are in close proximity to
developed areas or farmlands where they are more likely to make an impact. Cyanobacteria have
several vectors by which they create problems for people and animals; diminishing water clarity,
reducing oxygen levels, producing bad odors and tastes, and toxin production (Chorus et al.,
1999).
Many bloom-forming genera of cyanobacteria contain toxic members, referred to as
cyanobacteria harmful algal blooms (CHAB’s). Some examples include Anabaena,
Anabaenopsis, Aphanizomenon, Cylindrospermopsis, Raphidiopsis, Microcystis, Nodularia and
Planktothrix (Carmichael at al., 1992; Codd et al., 2005a, 2005b; Gademann et al., 2008). These
toxigenic genera are responsible for producing an impressive and chemically diverse array of
toxic secondary metabolites that can be grouped according to their chemical structures and
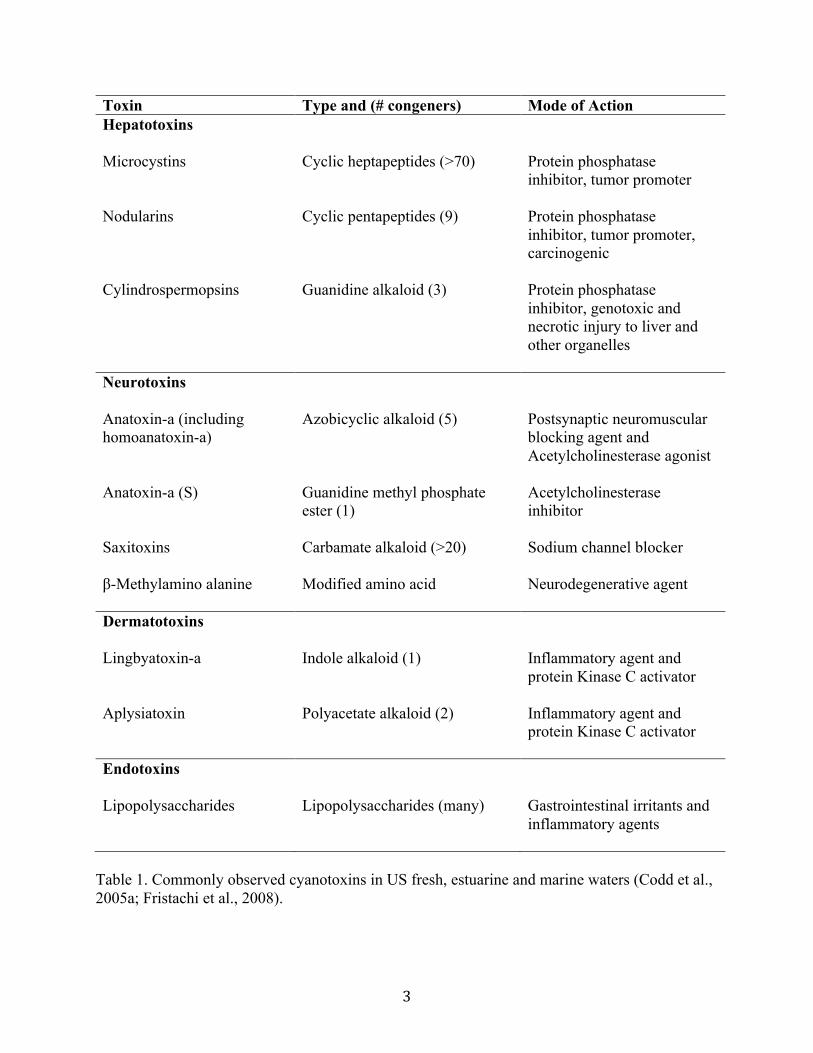
biological effects (see Table 1 and Figure 1 for representative examples). Table 1 also highlights
the variety and range of toxicological properties of these compounds.
3
Toxin Type and (# congeners) Mode of Action Hepatotoxins
Microcystins Cyclic heptapeptides (>70) Protein phosphatase inhibitor, tumor promoter
Nodularins Cyclic pentapeptides (9) Protein phosphatase inhibitor, tumor promoter, carcinogenic
Cylindrospermopsins Guanidine alkaloid (3) Protein phosphatase inhibitor, genotoxic and necrotic injury to liver and other organelles
Neurotoxins
Anatoxin-a (including homoanatoxin-a)
Azobicyclic alkaloid (5) Postsynaptic neuromuscular blocking agent and Acetylcholinesterase agonist
Anatoxin-a (S) Guanidine methyl phosphate ester (1)
Acetylcholinesterase inhibitor
Saxitoxins Carbamate alkaloid (>20) Sodium channel blocker
β-Methylamino alanine Modified amino acid Neurodegenerative agent
Dermatotoxins
Lingbyatoxin-a Indole alkaloid (1) Inflammatory agent and protein Kinase C activator
Aplysiatoxin Polyacetate alkaloid (2) Inflammatory agent and protein Kinase C activator
Endotoxins
Lipopolysaccharides Lipopolysaccharides (many) Gastrointestinal irritants and inflammatory agents
Table 1. Commonly observed cyanotoxins in US fresh, estuarine and marine waters (Codd et al., 2005a; Fristachi et al., 2008).

4
OCH3
CH3 CH3
NH
O
HN
HN
HN
H2N NH
O
CH3
COOH O
HNO
NH
CH2
N
CH3
O
HN
H3C
COOH
CH3
CH3
O
O
OCH3
CH3 CH3
NH
O
HN
HN
H2NNH
O
O
HN
H3C
COOH
O
N
CH3
NH
O
CH3
H3C
COOH
HN CH3
O
Microcystin-LR
Anatoxin-aNodularin
N
N
NH
HN
OH
H2N
NH
OHOH
Saxitoxin
N NH
NH
HN
NH
O
H3C
OH
O O
Cylindrospermopsin
CH3
H
H H
O
H2N OOOH
N
NH3C
O
NH
OH
HH3C
H3CCH3
CH3H3C
Lyngbyatoxin-a
O
CH3
O
CH3
O
BrO
OO
H3CO
O
OH
HO
HO CH3CH3
Aplysiatoxin
NH
N
O
NH
N
H3C
H3C
O
OOH
CH3
Anatoxin-a (S)
Figure 1. Representatives of the common groups of cyanotoxins.
5
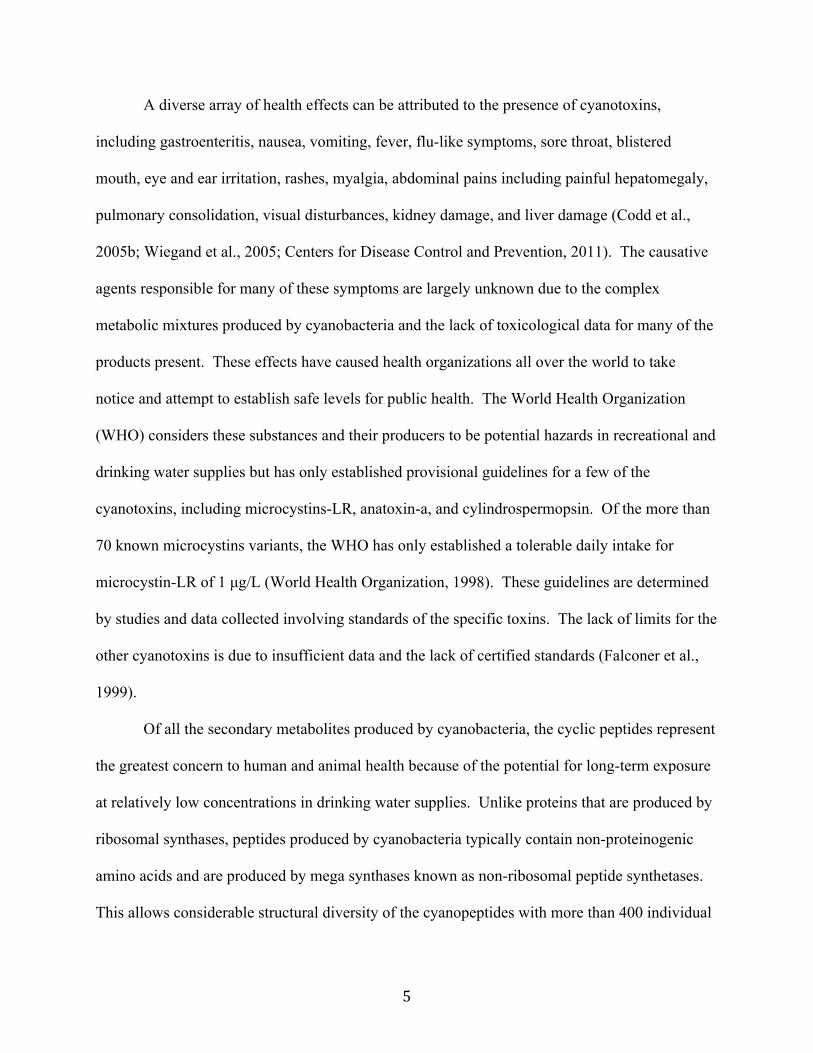
A diverse array of health effects can be attributed to the presence of cyanotoxins,
including gastroenteritis, nausea, vomiting, fever, flu-like symptoms, sore throat, blistered
mouth, eye and ear irritation, rashes, myalgia, abdominal pains including painful hepatomegaly,
pulmonary consolidation, visual disturbances, kidney damage, and liver damage (Codd et al.,
2005b; Wiegand et al., 2005; Centers for Disease Control and Prevention, 2011). The causative
agents responsible for many of these symptoms are largely unknown due to the complex
metabolic mixtures produced by cyanobacteria and the lack of toxicological data for many of the
products present. These effects have caused health organizations all over the world to take
notice and attempt to establish safe levels for public health. The World Health Organization
(WHO) considers these substances and their producers to be potential hazards in recreational and
drinking water supplies but has only established provisional guidelines for a few of the
cyanotoxins, including microcystins-LR, anatoxin-a, and cylindrospermopsin. Of the more than
70 known microcystins variants, the WHO has only established a tolerable daily intake for
microcystin-LR of 1 µg/L (World Health Organization, 1998). These guidelines are determined
by studies and data collected involving standards of the specific toxins. The lack of limits for the
other cyanotoxins is due to insufficient data and the lack of certified standards (Falconer et al.,
1999).
Of all the secondary metabolites produced by cyanobacteria, the cyclic peptides represent
the greatest concern to human and animal health because of the potential for long-term exposure
at relatively low concentrations in drinking water supplies. Unlike proteins that are produced by
ribosomal synthases, peptides produced by cyanobacteria typically contain non-proteinogenic
amino acids and are produced by mega synthases known as non-ribosomal peptide synthetases.
This allows considerable structural diversity of the cyanopeptides with more than 400 individual

6
peptides identified and new ones still being discovered regularly (Fristachi et al., 2008). A few
of the toxigenic cyanobacteria genera, mainly Microcystis, Planktothrix and Anabaena, produce
other types of oligopeptides known as micropeptins, cyanopeptolins, microviridins,
oscillapeptins, oscillamides, nostopeptins, aeruginosins, aeruginopeptins, anabaenopeptolides,
and anabaenopeptins (Fristachi et al., 2008). Despite empirical evidence proving many of these
cyclic and linear oligopeptides to be active protease inhibitors, they are generally considered to
be “non-toxic” metabolites. This is a misleading description considering the range of bioassays
that have been employed are limited, and such “non-toxic” peptides may actually possess chronic
toxicity, act in synergy with known cyanotoxins, or display other biological properties such as
endocrine disruption as recently reported (Rogers et al., 2011).
This thesis describes the isolation and characterization of eight cyclic peptides produced
by two “toxic” strains of cyanobacteria, Microcystis aeruginosa and Planktothrix rubescens.
The M. aeruginosa material analyzed in this study was collected during a natural bloom that
occurred in the Cape Fear River, which provided significantly greater biomass than the P.
rubescens material that was obtained by laboratory culture. However, the controlled growing
conditions of the laboratory-cultured material can provide consistency and reproducibility of
interesting secondary metabolites, which may be used as analytical standards in other studies.
The eight cyclic peptides described here belong to three classes of peptides including one new
and three known microcystins, two new anabaenopeptins, and two new micropeptins.
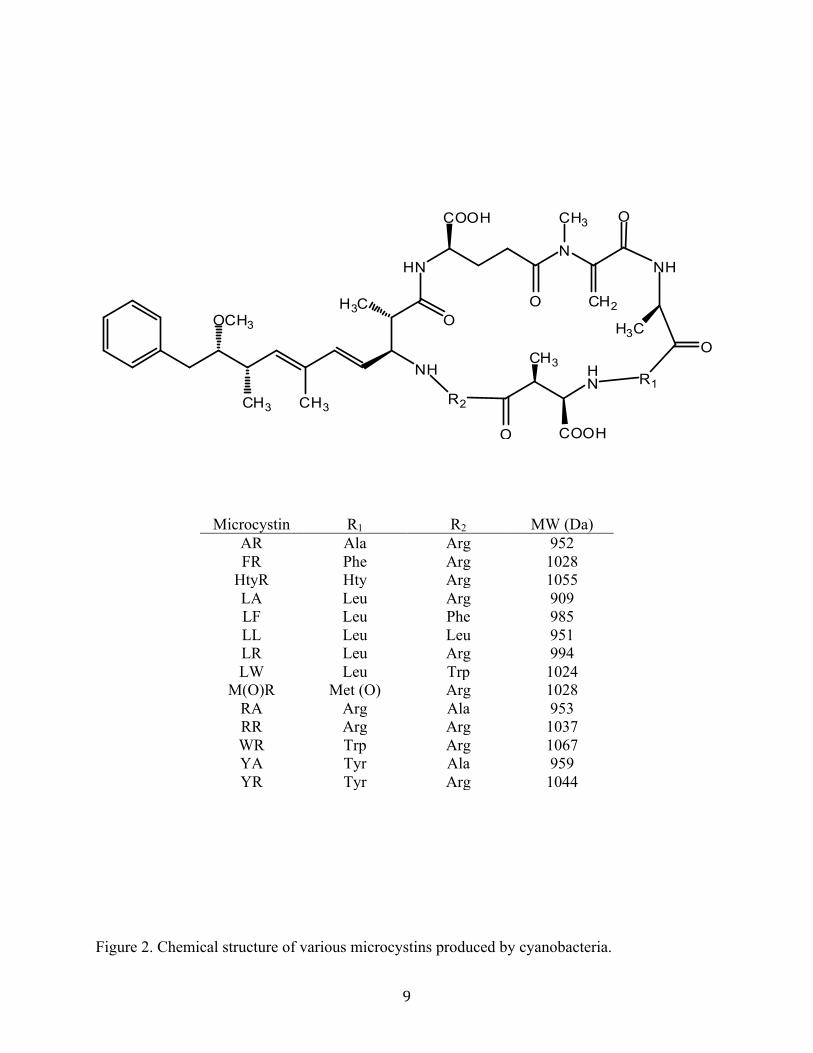
Microcystins are some of the most widely recognized and studied secondary metabolites
produced by cyanobacteria because of their frequency in nature and their adverse effects on
humans and animals. These cyclic heptapeptides have the general structural motif, cyclo-(D-
Ala1-R1-D-MeAsp3-R2-Adda5-D-glutamate6-Mdha7), commonly containing three D-amino acids
7
(D-alanine, β-linked erythro-β-methylaspartic acid and α-linked D-glutamic acid), with two
unusual amino acids (N-methyldehydroalanine (Mdha) and 3-amino-9-methoxy-10-phenyl-2,6,8-
trimethyldeca-4,6-dienoic acid (Adda)), as well as two highly variable L-amino acids, R1 and R2
(see Figure 2). Much of the variability found within this group comes from the substitution of
the two variable L-amino acids, and are usually denoted in the suffix of the nomenclature
(Gademann et al., 2008). Further variability of the microcystins has been demonstrated by, but
not limited to, a number of methylated and demethylated varieties or versions that contain
dehydrobutyrine (Dhb) in place of Mdha or D-Asp in place of D-MeAsp (Namikoshi et al.,
1992). Most of the microcystin congeners are water-soluble, and consequently cannot penetrate
the lipid membranes of animals, plants, or bacterial cells directly. As a result, ingested
microcystins aggregate in the livers of humans and animals where they disrupt key cellular
enzymes called protein phosphatases, type 1 and 2A (PP1 and PP2A). The highly conserved
Adda-glutamate moiety of microcystin is the portion responsible for interacting with PP1 and
PP2A, and recent studies have shown this region of microcystins is essential for bioactivity
(Nishiwaki-Matsushima et al., 1991).
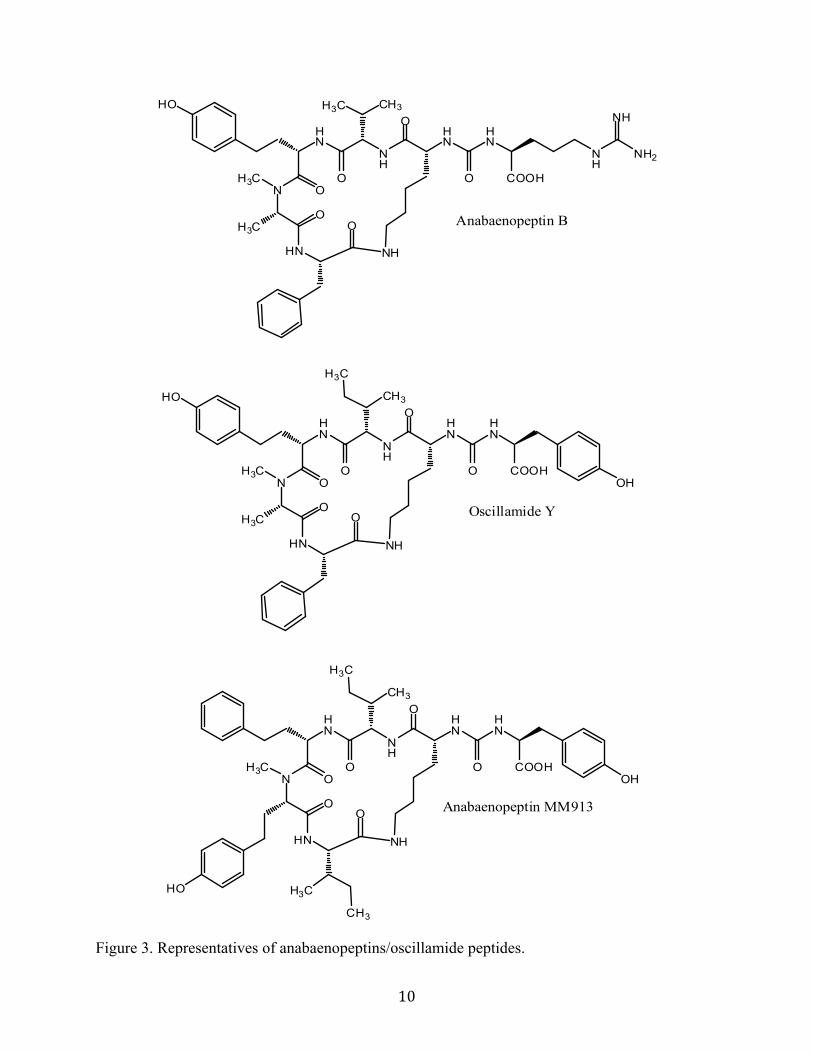
The anabaenopeptins, and related oscillamides (Figure 3), are a group of hexapeptides
characterized by the cyclization of a C-terminal amino acid carboxyl to the ε-amine residue of an
N-terminal-D-Lysine, while the α-amine of this lysine moiety is linked through an ureido-bridge
to the side chain of another amino acid (Zafrir-Ilan et al., 2010a). All anabaenopeptins described
to date contain the D form of lysine while all the other amino acids have an L-absolute
configuration (Zafrir-Ilan et al., 2010b). The many structural variants of the anabaenopeptins
result from the wide assortment of essential and non-essential L-amino acids that are
incorporated during their biosynthesis. Inhibitory assays of several congeners have proven these
8
cyclic peptides to be carboxypeptidase inhibitors as well as inhibitors of PP1 and PP2A (Sano et
al., 2001).
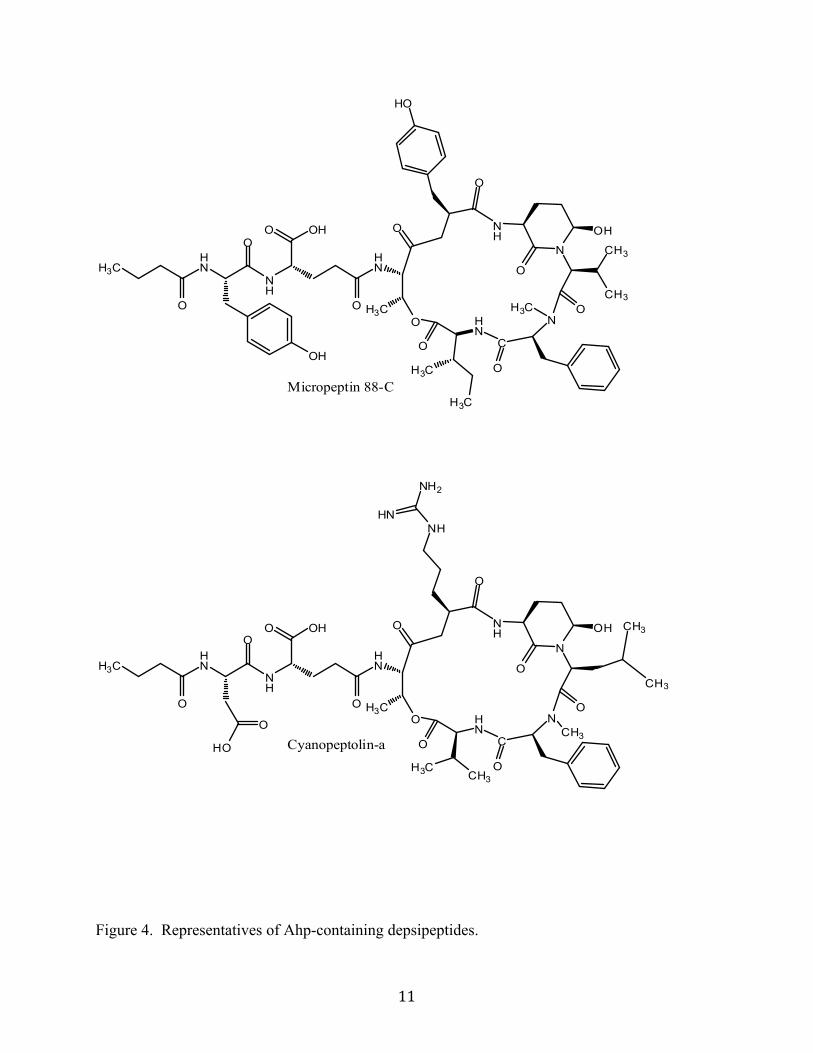
The micropeptins are the most diverse group of depsipeptide cyanotoxins, consisting of
more than 115 members. Depsipeptides are different from cyclic peptides in that the compound
contains a cyclic ester linkage. In the case of the micropeptins, aeruginopeptins, cyanopeptolins
and oscillapeptins all share a common structural motif characterized by the presence of a 3-
amino-6-hydroxy-2-piperdone (Ahp) unit that has ben derived from Glutamine (Welker et al.,
2006). Also present is an N-methylated amino acid, a threonine that forms part of the lactone
linkage, and an attached peptidic side-chain often terminated by either polar acids or
hydrophobic fatty acids (Figure 4) (Gademann et al., 2008). Depending on the nature of the
amino acid occupying the fifth position from the carboxy terminus, these depsipeptides have
shown selectivity for either chymotrypsin or trypsin like serine proteases (Zafrir-Ilan et al.,
2010a). Protease inhibition assays have shown hydrophobic amino acids, such as tyrosine (Tyr)
or leucine (Leu), in this position to be selective for chymotrypsin while basic amino acids, such
as arginine (Arg) or lysine (Lys), tend to be selective for trypsin (Yamaki et al., 2005; Gademann
et al., 2008).
9
OCH3
CH3 CH3
NH
R2
HN
O COOH
R1
O
NH
CH2
N
O
HN
H3C
COOH O
O
CH3
H3C
CH3
Microcystin R1 R2 MW (Da) AR Ala Arg 952 FR Phe Arg 1028
HtyR Hty Arg 1055 LA Leu Arg 909 LF Leu Phe 985 LL Leu Leu 951 LR Leu Arg 994 LW Leu Trp 1024
M(O)R Met (O) Arg 1028 RA Arg Ala 953 RR Arg Arg 1037 WR Trp Arg 1067 YA Tyr Ala 959 YR Tyr Arg 1044
Figure 2. Chemical structure of various microcystins produced by cyanobacteria.
10
HN
NH
HN
ONH3C
H3CO
HN
O
O
CH3H3C
HN
O COOH
HO
NH
O
NH
HN
NH
HN
ONH3C
H3CO
HN
O
O
CH3
HN
O COOH
HO
NH
O
H3C
HN
NH
HN
ONH3C
O
HN
O
O
CH3
HN
O COOH
NH
O
H3C
H3C
NH2
NH
Anabaenopeptin B
Oscillamide Y
Anabaenopeptin MM913
OH
OH
HO
CH3
Figure 3. Representatives of anabaenopeptins/oscillamide peptides.
11
NH
N
HN
N
O
O
O
H3C
H3C
OH
CH3
CH3HN
H3CO
NH
O OH
HN
O
OH
O
H3C
C
O
O
O
O
NH
N
HN
N
O
O
O
CH3
CH3H3C
OH
HN
H3CO
NH
O OH
HN
O
O
HO
O
H3C
C
O
O
O
NH
NH2
HN
O
HO
H3C
Micropeptin 88-C
CH3
CH3
Cyanopeptolin-a
Figure 4. Representatives of Ahp-containing depsipeptides.
12
EXPERIMENTAL
General Experimental
All solvents used were HPLC grade and purchased through VWR international, unless
specified otherwise (Appendix A). High performance liquid chromatography (HPLC) was
accomplished using two Waters 515 HPLC pumps, controlled by a Waters Automated Gradient
Controller, and monitored with a Waters 2487 Dual λ Absorbance Detector with Kipp and Zonen
Servogor 102 chart recorder. Electrospray ionization mass spectrometry (ESI-MS) were
recorded on a Waters Micromass ZQ mass spectrometer coupled to a Hewlett-Packard Agilent
1100 series UV/LC consisting of a QuatPump (G1311A), DEGASSER (G1322A), ALSTerm,
(G1330A), ALS (G1329A), COLCOM (G1316A), and DAD (G1315A); all controlled by
MassLynx version 4.1. Nuclear magnetic resonance spectroscopy (NMR) was recorded on a
Bruker Avance 500 MHz NMR equipped with a 1.7 mm probe, run by TopSpin version 2.1, with
samples suspended in DMSO-d6 (reference peaks, 1H 2.5 ppm, 13C 39.5 ppm) (Cambridge
Isotope Laboratories, Inc. Andover, MA). Optical rotations measured using a Rudolph Research
Analytical Autopol® III automatic polarimeter with a Rudolph Research Analytical Polarimeter
Sample Tube (part no. 32-2.5-10-0.05) and a sodium lamp (589 nm).
Analysis of a naturally occurring bloom of Microcystis aeruginosa
Source of Material
During the fall of 2009, a natural bloom of Microcystis aeruginosa was discovered in the
lower Cape Fear River of North Carolina near Lock and Dam #1. Dr. Mike Mallin and Matthew
McIver (Marine Ecology, Center for Marine Science) identified the responsible organism as
13
Microcystis aeruginosa by microscopy and provided a concentrated sample (1 L) of cells from
the bloom for chemical analysis.
Extraction
The cells were collected on glass microfiber filters (VWR International, LLC brand,
grade-691, 15 cm diameter) and extracted twice overnight with aqueous MeOH (80%). The
MeOH extracts were combined and concentrated in vacuo to mainly water (50 mL), MeOH (450
mL) was added to make extract 90% MeOH/H2O before partitioning against hexane (1:1).
The resulting organic MeOH layer was dried in vacuo before chromatography using a Supelco®
ENVI-18 SPE column eluted with 20, 40, 60, 80, and 100% MeOH aliquots, and a final wash
with hexane. Fractions collected at each step were analyzed by LC/UV/MS.
Interesting fractions (40%, 60%, 80% MeOH) were further separated by reversed phase
C18 column chromatography (BAKERBOND Octadecyl (C18) 40 µm Prep LC Packing, J.T.
Baker), and elution with a stepwise gradient (10% steps, 30-70%) of MeOH (50 mL). Two
aliquots (12.5 mL) were collected at each step. The column was finally washed with 100%
methanol and 11 fractions collected in total. UV/LC/MS analysis revealed three groups of
interesting compounds based on their spectroscopic and mass properties and were combined
accordingly (Figure 5).

14
Cape FearMicrocyst is cells extracted with 80%Methanol
C18 Sep Pak column
Solvent partition
HexaneMeOH/H2O
40%MeOH20%MeOH 60%MeOH 80%MeOH 100%MeOH Hexane
C18 Baker Bond column
40%MeOH30%MeOH 50%MeOH 60%MeOH 70%MeOH 100%MeOH
1 2 3 4 5 6 7 8 9 10 11
JDI 1-77 JDI 1-69JDI 1-70
Figure 5. Metabolite isolation method for Mycrocystis aeruginosa.

15
HPLC Purification of Microcystin-LR
The combined Bakerbond extracts JDI 1-77 were separated by reversed phase HPLC
(Waters SunFire™ C18 3.5 µm 4.6 x 150 mm column), eluted with a linear gradient of ACN /
H2O + 0.1% formic acid (23-43% ACN, 0.8 mL/min, 240 nm, 20 min). The peak belonging to
MC-LR eluted at 12.0 minutes. Final purification was accomplished with 35% ACN isocratic
method (0.8 mL/min), eluting MC-LR in 7.1 minutes.
(1) Microcystin-LR: colorless amorphous solid; [α]D 22 -58.3° (c. 0.12, MeOH); UV λmax
(MeOH) 240 nm; positive ion ESI-MS m/z (relative intensity) 996.8 (100.0), 861.6 (18.2), 509.5 (26.2), 135.5 (43.0); negative ion ESI-MS m/z (relative intensity) 993.8 (100.0), 496.5 (28.7); C49H74N10O12 996.5
HPLC Purification of Microcystin-RR
The combined Bakerbond extracts JDI 1-70 were separated by reversed phase HPLC
(Waters SunFire™ C18 3.5 µm 4.6 x 150 mm column), eluted with a linear gradient of ACN /
H2O + 0.1% formic acid (25-40% ACN, 0.8 mL/min, 15 min) and monitored at 214 nm and 240
nm. Microcystin-RR eluted in 8.5 minutes.
(2) Microcystin-RR: colorless amorphous solid; [α]D 22 -63.9° (c. 0.27, MeOH); UV λmax
(MeOH) 240 nm; positive ion ESI-MS m/z (relative intensity) 1038.7 (31.0), 526.9 (100.0) 135.1 (4.9); negative ion ESI-MS m/z (relative intensity) 1036.7 (67.3), 518.0 (100.0); C49H75N13O12 1038.7
HPLC Purification of Micropeptin 1106 and 1120
The combined Bakerbond extracts JDI 1-69 were separated by reversed phase HPLC
(Waters SunFire™ C18 3.5 µm 4.6 x 150 mm column), by elution with a linear gradient of ACN /
H2O + 0.1% formic acid (27-23% ACN, 0.8 mL/min, 20 min) and monitored at 240 nm and 276
nm. A peak containing micropeptin 1106 eluted in 10.3 minutes, ESI-MS data of this fraction
revealed micropeptin 1120. These compounds were separated by reversed phase HPLC (Waters
SunFire™ C18 3.5 µm 4.6 x 150 mm column), eluted with 30% ACN / 70% H2O + 0.1% formic
16
acid and monitored at 276 nm. Pure micropeptin 1106 eluted at 12.3 minutes while pure
micropeptin 1120 eluted at 21.1 minutes.
(3) Micropeptin 1106: colorless amorphous solid; [α]D 22 -54.2° (c. 0.48, MeOH); UV λmax
(MeOH) 280 nm; 1H and 13C NMR- see Table 2; positive ion ESI-MS m/z (relative intensity) 1106.6 (72.0), 531.1 (11.8), 206.2 (65.7), 136.1 (100.0); negative ion ESI-MS m/z (relative intensity) 1104.5 (100.0); positive ion HRESIMS [M+H]+ m/z 1106.6 (calculated for C54H80N11O14, 1106.5886);
(4) Micropeptin 1120: colorless amorphous solid; [α]D
22 -53.8° (c. 0.093, MeOH); UV λmax (MeOH) 280 nm; 1H and 13C NMR- see Table 3; positive ion ESI-MS m/z (relative intensity) 1120.7 (41.6), 538.4 (14.5), 206.2 (72.0), 136.1 (100); negative ion ESI-MS m/z (relative intensity) 1118.6 (100.0), 875.6 (12.3); positive ion HRESIMS [M+H]+ m/z 1120.6 (calculated for C55H82N11O14, 1120.6043)
Analysis of Planktothrix rubescens (UTCC 507)
Biomass
The Planktothrix rubescens strain, UTCC 507, was obtained from the University of
Toronto Culture Collection of Algae and Cyanobacteria (UTCC) where it was originally isolated
from beneath the ice of a lake in Ontario (1999). UTCC 507 was cultured in a temperature and
light controlled culture chamber for 4 weeks (20°C, 14:10 h light:dark). Cultures were grown in
2.8 L Fernbach flasks using BG11 growth medium (250 mL inoculant/1 L media) (Appendix B),
and shaken weekly to aerate and redistribute the nutrients. Scale up of production was
accomplished using 10 L polycarbonate carboys (1 L inoculant/8 L media), constantly bubbled
via aeration pump. Cells harvested by filtering on to glass microfiber filters (VWR International,
LLC brand, grade-691, 15 cm diameter), wrapped in aluminum foil, and stored (-20°C) until time
of extraction.
Extraction
The frozen cells were extracted by cutting filter papers with cells into one-inch squares
and soaking in aqueous MeOH twice overnight (80%). MeOH extracts were filtered and dried in
17
vacuo, concentrating to water (100 ml) only. Methanol was added (900 mL) to make the extract
90% methanol/water before partitioning twice against hexane (2:1). Water (285 mL) was added
to the resulting methanol layer to make the extract solution 70% methanol/water then partitioned
twice against dichloromethane (DCM) (2:1). All MeOH was removed from the resulting 70%
methanol/water layer in vacuo and the extract was finally partitioned against BuOH (1:1) twice.
All resulting layers were dried in vacuo and analyzed by LC/UV/MS to identify the interesting
fractions containing compounds of interest.
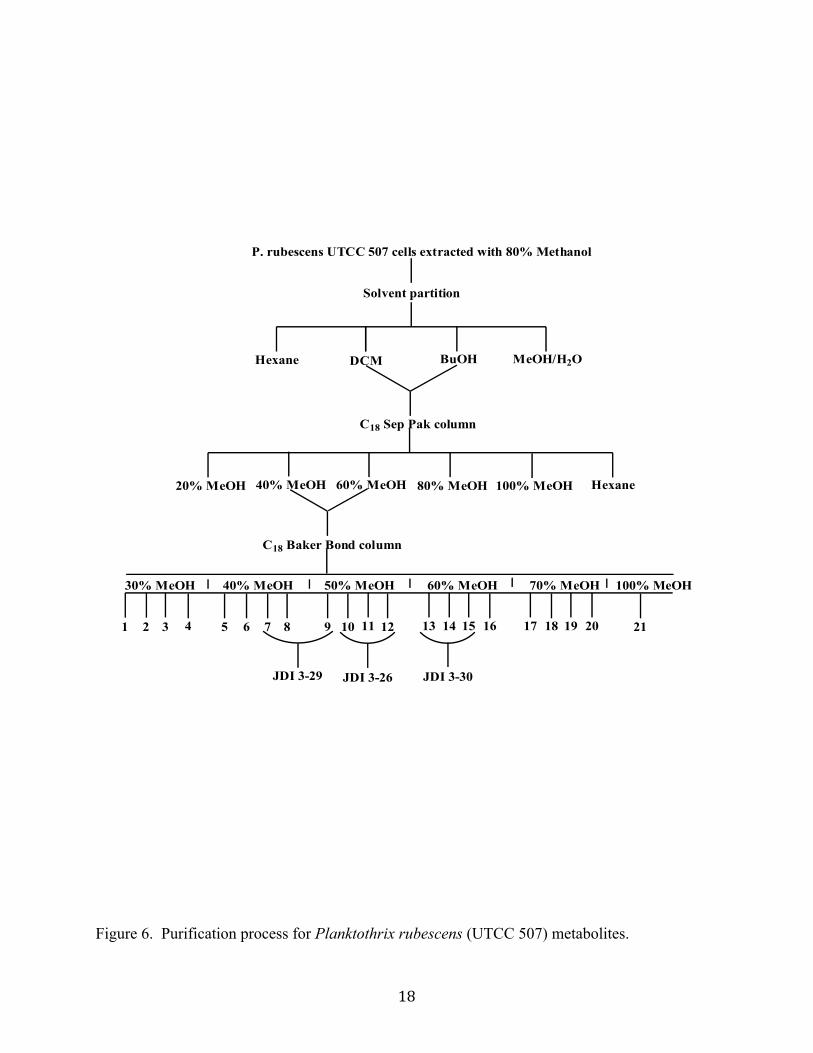
LC/MS analysis of the DCM and BuOH layer fractions displayed peaks of interest that
could be associated with microcystins, oscillamides, and anabaenopeptins. These two organic
extracts were combined and chromatographed on a Supelco® ENVI-18 SPE column, eluted with
20, 40, 60, 80, and finally 100% MeOH aliquots before a final wash with hexane. Fractions
collected at each step were examined by LC/UV/MS, and peaks with masses in the range of
known biologically active compounds were observed. Such compounds of interest were found in
the 40% and 60% MeOH fractions, which were combined for separation by reversed phase C18
column chromatography (BAKERBOND Octadecyl (C18) 40 µm Prep LC Packing, J.T. Baker,
20 g), and eluted in a stepwise gradient (10% steps) of MeOH (30-70%), with four aliquots (12.5
mL) collected at each step. The column was finally washed with MeOH (100%, 100 mL) to give
21 fractions in total, which were then analyzed by UV/LC/MS. Three groups of fractions
containing compounds within a certain mass range and UV properties were identified and
combined (Figure 6).
18
P. rubescens UTCC 507 cells extracted with 80%Methanol
C18 Sep Pak column
Solvent partition
Hexane DCM BuOH MeOH/H2O
40%MeOH20%MeOH 60%MeOH 80%MeOH 100%MeOH Hexane
C18 Baker Bond column
40%MeOH30%MeOH 50%MeOH 60%MeOH 70%MeOH 100%MeOH
1 2 3 4 5 6 7 8 9 10 11 12 13 14 1615 17 18 19 20 21
JDI 3-29 JDI 3-30JDI 3-26
Figure 6. Purification process for Planktothrix rubescens (UTCC 507) metabolites.

19
HPLC Purification of [D-Asp3, (E)-Dhb7] Microcystin-HtyR
The combined Bakerbond extract JDI 3-29 was separated by reversed phase HPLC
(Waters SunFire™ C18 3.5 µm 4.6 × 150 mm column), eluted with a linear gradient of ACN/H2O
+ 0.1% formic acid (27-45% ACN, 0.8 mL/min, 18 min) and monitored at 214nm and 240 nm.
[D-Asp3, Dhb7] Microcystin-HtyR eluted from the column in 10.9 minutes. Final purification
was achieved using reversed phase HPLC (Waters SunFire™ C18 5 µm 4.6 × 250 mm column),
eluted with a linear gradient of ACN/H2O + 0.1% formic acid (30-35% ACN, 0.8 mL/min, 20
min) and monitored at 214 nm and 240 nm. Under these conditions, pure [D-Asp3, (E)-Dhb7]
microcystin-HtyR eluted from the column in 18.0 minutes.
(5) [D-Asp3, (E)-Dhb7] Microcystin-HtyR: colorless amorphous solid; [α]D 22 -16.6° (c.
0.12, MeOH); UV λmax (MeOH) 238 nm. 1H and 13C NMR- see Table 4 & 5; positive ion ESI-MS m/z (relative intensity) 1046.1 (100.0), 534.7 (8.4), 135.1 (28.0); negative ion ESI-MS m/z (relative intensity) 1044.1 (100.0), 521.7 (98.8); positive ion HRESIMS [M+H]+ m/z 1045.5 (calculated for C52H73N10O13, 1045.5359)
HPLC Purification of [D-Asp3, (E)-Dhb7] Microcystin-HphR
The combined Bakerbond extract JDI 3-26 was separated by reversed phase HPLC
(Waters SunFire™ C18 3.5 µm 4.6 × 150 mm column), eluted with a linear gradient of ACN/H2O
+ 0.1% formic acid (27-45% ACN, 0.8 mL/min, 18 min) and monitored at 214 nm and 240 nm.
[D-Asp3, (E)-Dhb7] Microcystin-HphR eluted in 15.2 minutes. The combined Bakerbond extract
JDI 3-30 was separated by reversed phase HPLC (Waters SunFire™ Prep C18 5 µm 10 × 250 mm
column, eluted with a linear gradient of ACN / H2O + 0.1% formic acid (32-50% ACN, 2.0
mL/min, 36 min) and monitored at 214 nm and 240 nm. [D-Asp3, (E)-Dhb7] Microcystin-HphR
eluted in 19.0 minutes. These two fractions were combined before a final purification step by
reversed phase HPLC (Waters SunFire™ C18 5 µm 4.6 × 250 mm column), and elution with a
linear gradient of ACN/H2O + 0.1% formic acid (25-40% ACN, 0.8 mL/min, 40 min) and
20
monitored at 214 nm and 240 nm. Under these conditions, pure [D-Asp3, (E)-Dhb7] microcystin-
HphR eluted from the column in 35.7 minutes.
(6) [D-Asp3, (E)-Dhb7] Microcystin-HphR: colorless amorphous solid; [α]D 22 -113.2° (c.
0.053, MeOH); UV λmax (MeOH) 238 nm; 1H and 13C NMR- see Table 6 & 7; positive ion ESI-MS m/z (relative intensity) 1030.1 (100.0), 895.9 (13.6), 526.6 (22.9), 135.1 (55.0); negative ion ESI-MS m/z (relative intensity) 1028.0 (88.1), 504.6 (100.0); positive ion HRESIMS [M+H]+ m/z 1029.5 (calculated for C52H73N10O12, 1029.5409)
HPLC Purification of Anabaenopeptin 856
The combined Bakerbond extract JDI 3-26 was separated by reversed phase
HPLC (Waters SunFire™ C18 3.5 µm 4.6 × 150 mm column), eluted with a linear gradient of
ACN/H2O + 0.1% formic acid (27-45% ACN, 0.8 mL/min, 18 min gradient then hold for 5
minutes) and monitored at 214 nm and 240 nm. Anabaenopeptin 856 eluted in 20.6 minutes.
Final purification achieved using reversed phase HPLC (Waters SunFire™ C18 5 µm 4.6 × 250
mm column), eluted with a linear gradient of ACN/H2O + 0.1% formic acid (30-45% ACN, 0.8
mL/min, 40 min) and monitored at 214nm and 240 nm. Pure anabaenopeptin 856 eluted in 36.4
minutes.
(7) Anabaenopeptin 856: colorless amorphous solid; [α]D 22 -63.6° (c. 0.346, MeOH); UV
λmax (MeOH) 278 nm. 1H and 13C NMR- see Table 8; positive ion ESI-MS m/z (relative intensity) 856.7 (100.0); negative ion ESI-MS m/z (relative intensity) 854.8 (100.0); positive ion HRESIMS [M+H]+ m/z 856.5 (calculated for C46H62N7O9, 856.4609)
HPLC Purification of Anabaenopeptin 872
The combined Bakerbond extract JDI 3-29 was separated by reversed phase HPLC
(Waters SunFire™ C18 3.5 µm 4.6 × 150 mm column), eluted with a linear gradient of ACN/H2O
+ 0.1% formic acid (27-45% ACN, 0.8 mL/min, 18 min) and monitored at 214nm and 240 nm.
Anabaenopeptin 872 was eluted from the column in 14.8 minutes, and final purification was
achieved by reversed phase HPLC (Waters SunFire™ C18 5 µm 4.6 × 250 mm column), and
elution with a linear gradient of ACN/H2O + 0.1% formic acid (25-40% ACN, 0.8 mL/min, 40
21
min) and monitored at 214 nm and 240 nm. Under these conditions, pure anabaenopeptin 872
was eluted in 34.5 minutes.
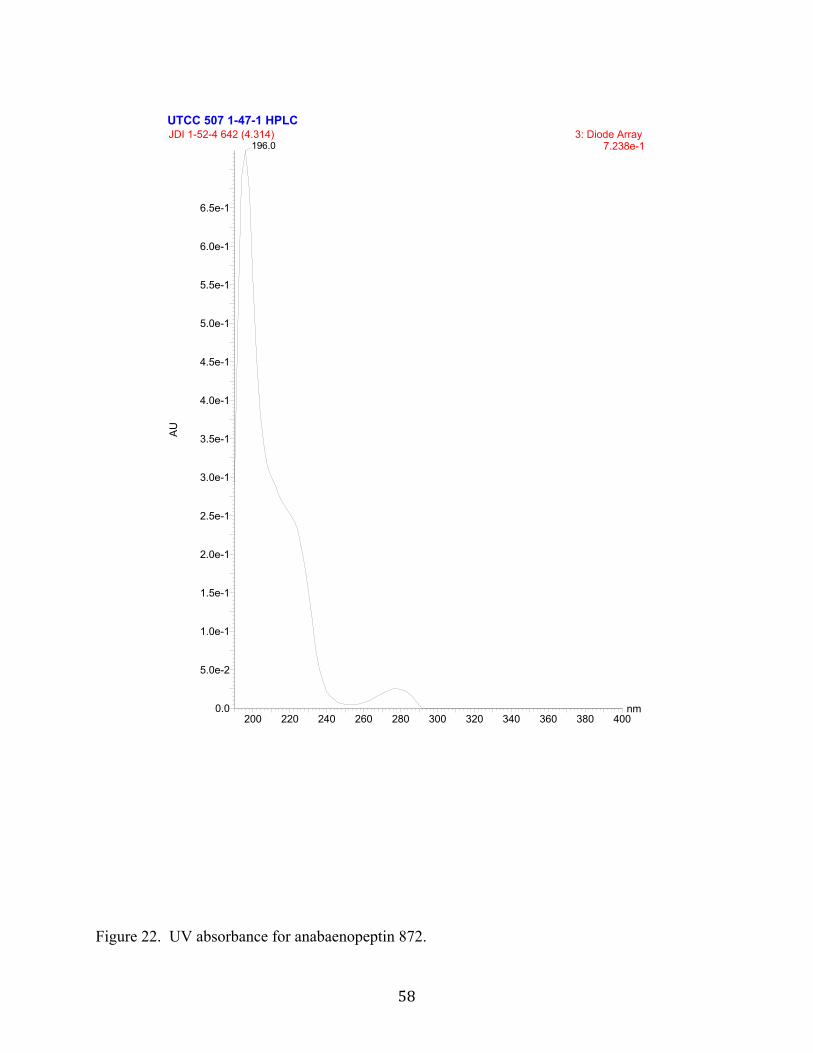
(8) Anabaenopeptin 872: colorless amorphous solid; [α]D 22 -88.3° (c. 0.113, MeOH); UV
λmax (MeOH) 278 nm. 1H and 13C NMR- see Table 9; positive ion ESI-MS m/z (relative intensity) 872.8 (100.0); negative ion ESI-MS m/z (relative intensity) 870.8 (100.0); positive ion HRESIMS [M+H]+ m/z 872.5 (calculated for C46H62N7O10, 872.4558)
Amino Acid Analysis
Derivatization of Amino Acid Standards with Marfey’s Reagent
Amino acid standards (500 µg) were suspended in 1:1 acetone:water (200 µl) in 5.0 mL
Reacti-Them™ vial (Pierce, Thermo Scientific), an aliquot (100 µL) of 1-fluoro-2,4,-
dinitrophenyl-5-L-alanine amide (FDAA) (10 mg/mL acetone) was added followed by 1 M
NaHCO3 (100 µL) and heated in Reacti-Therm™ heating module (40°C, 1 hour). Upon cooling
to room temperature 2 N HCl was added (20 µL). Samples were ready for LC/UV/MS after
degassing was complete.
Acid Hydrolysis of Cyclic Peptides and Derivatization with Marfey’s Reagent
A Reacti-Therm™ vial (1 mL) containing cyclic peptide (0.1 mg) dissolved in 6 N HCl
(100 µL) was heated in Reacti-Therm™ heating module (105°C, 20 hours), then excess HCl
removed in vacuo. The hydrolysate was suspended in 1:1 acetone:water (100 µl) in a Reacti-
Them™ vial (1.0 mL), 100 µL of 1-fluoro-2,4,-dinitrophenyl-5-L-alanine amide (FDAA) (10
mg/mL acetone)(Pierce, Thermo Scientific) was added followed by 1 M NaHCO3 (100 µL) and
the mixture heated in Reacti-Therm™ heating module (40°C, 1 hour). The mixture was cooled
to room temperature before addition of 2 N HCl (20 µL) before degasing and LC/UV/MS
analysis.
22
Oxidation of Micropeptins with Jones’ Reagent
Micropeptin-type compounds (0.1 mg) containing the Ahp moiety were placed in a
Reacti-Therm™ vial (1 mL) and oxidized with Jones’ reagent (1 drop from solution of 1.38 g
K2CrO7, 1 mL H2SO4 in 8 mL H2O) in 0.5 mL acetone at 0 °C for 10 min. The mixture was
allowed to warm to room temperature and a few drops of MeOH were added. The bluish residue
that developed was filtered and the solvent was evaporated in vacuo. The resultant products
were derivatized with Marfey’s reagent as described before analysis by UV/LC/MS.
Amino Acid Analysis of Marfey Derivatives by UV/LC/MS
Amino acid standards and hydrolysate derivatives were analyzed by UV/LC/MS using a
Waters Symmetry Shield RPC18 2.1 × 150 mm column, and an elution gradient of 5-75% ACN +
0.1% formic acid over 70 minutes (0.25 mL/min). Table 2 list suppliers of amino acid standards
and the HPLC retention times of their derivatives.

23
Amino Acid
Retention Time Mono (di)-substituted
D-Ala1 40.85 N-Me-L-Ala1 36.14 L-2-Amino-5-phenyl-pentanoic acid3 54.57 L-Arg2 19.85 D-Arg2 21.05 D-Asp2 41.62 L-Glu1 39.51 D-Glu1 40.96 L-Hph1 52.89 L-Hty4 45.63 (64.23) L-Ile1 45.98 D-Ile1 48.50 L-Lys1 18.59 (54.78) D-Lys1 19.42 (56.00) L-Phe1 50.48 D-Phe1 53.05 N-Me-L-Phe2 45.98 L-Thr1 35.91 L-Tyr1 42.30 (63.60) D-Tyr2 44.3 (68.46) L-Val2 43.00 D-Val2 45.26 Acros Organics, New Jersey, USA1; Sigma-Aldrich, St. Louis, MO2; Peptech Corporation, Burlington, MA3; Chem-Impex International,Wood Dale, IL4
Table 2. Retention times for Marfey derivatives of amino acid standards.
24
RESULTS
Microcystis aeruginosa Products
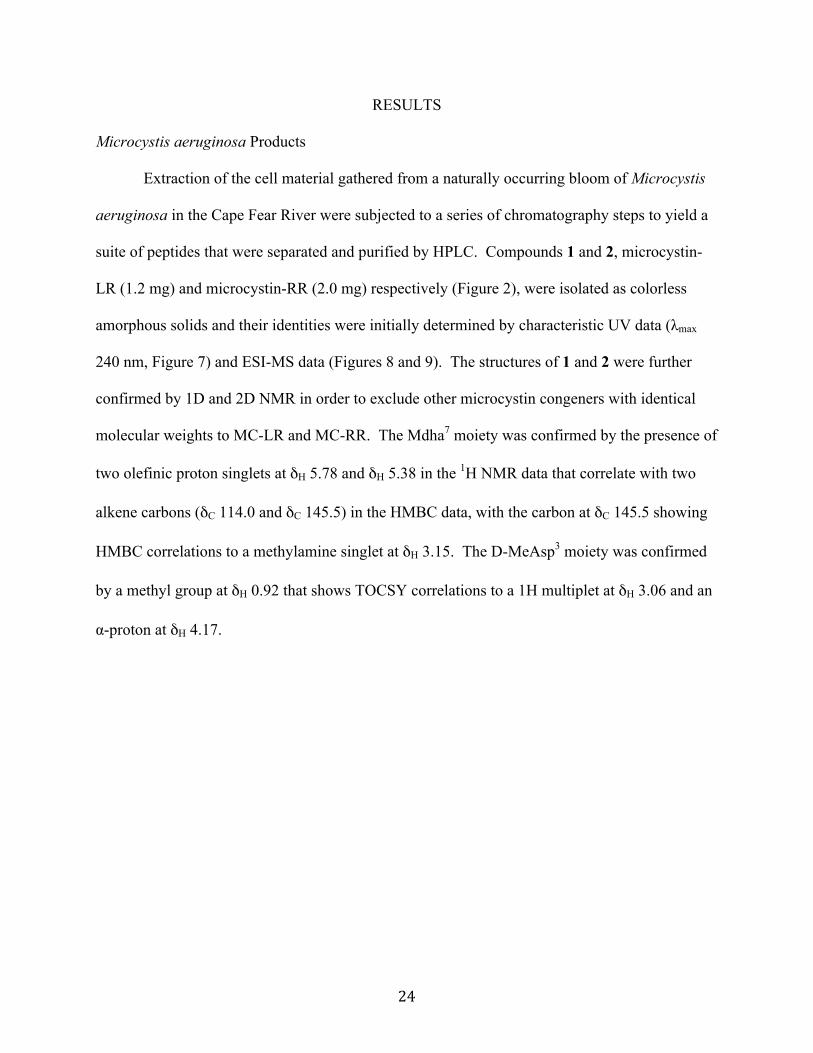
Extraction of the cell material gathered from a naturally occurring bloom of Microcystis
aeruginosa in the Cape Fear River were subjected to a series of chromatography steps to yield a
suite of peptides that were separated and purified by HPLC. Compounds 1 and 2, microcystin-
LR (1.2 mg) and microcystin-RR (2.0 mg) respectively (Figure 2), were isolated as colorless
amorphous solids and their identities were initially determined by characteristic UV data (λmax
240 nm, Figure 7) and ESI-MS data (Figures 8 and 9). The structures of 1 and 2 were further
confirmed by 1D and 2D NMR in order to exclude other microcystin congeners with identical
molecular weights to MC-LR and MC-RR. The Mdha7 moiety was confirmed by the presence of
two olefinic proton singlets at δH 5.78 and δH 5.38 in the 1H NMR data that correlate with two
alkene carbons (δC 114.0 and δC 145.5) in the HMBC data, with the carbon at δC 145.5 showing
HMBC correlations to a methylamine singlet at δH 3.15. The D-MeAsp3 moiety was confirmed
by a methyl group at δH 0.92 that shows TOCSY correlations to a 1H multiplet at δH 3.06 and an
α-proton at δH 4.17.

25
MC-RR
nm200 220 240 260 280 300 320 340 360 380 400
AU
0.0
5.0e-2
1.0e-1
1.5e-1
2.0e-1
2.5e-1
3.0e-1
3.5e-1
4.0e-1
4.5e-1
5.0e-1
5.5e-1
6.0e-1
6.5e-1
7.0e-1
JDI 1-61-2 #2 550 (3.703) 3: Diode Array 7.788e-1240.0
196.0
Figure 7. UV absorbance for microcystin-RR and microcystin-LR.

26
m/z200 400 600 800 1000 1200 1400
%
0
100
%
0
100JDI 1-77-7 208 (4.195) 1: Scan ES+
1.34e8996.8
509.5
265.1 417.8
861.6
570.4 699.6 1150.6
JDI 1-77-7 206 (4.165) 2: Scan ES- 2.97e6993.8
496.5
331.2 842.6574.5 705.2 1492.71107.8 1220.9
Figure 8. ESI-MS spectrum of microcystin-LR.
27
m/z200 400 600 800 1000 1200 1400
%
0
100
%
0
100JDI 1-70-3 191 (3.848) 1: Scan ES+
1.19e8526.9
452.9234.4
1038.7
887.6802.2 1557.61236.9 1417.7
JDI 1-70-3 190 (3.838) 2: Scan ES- 1.52e6518.0
293.4 405.3
1036.7
731.0615.7 849.5 974.41555.91383.01121.0
Figure 9. ESI-MS spectrum of microcystin-RR.
28
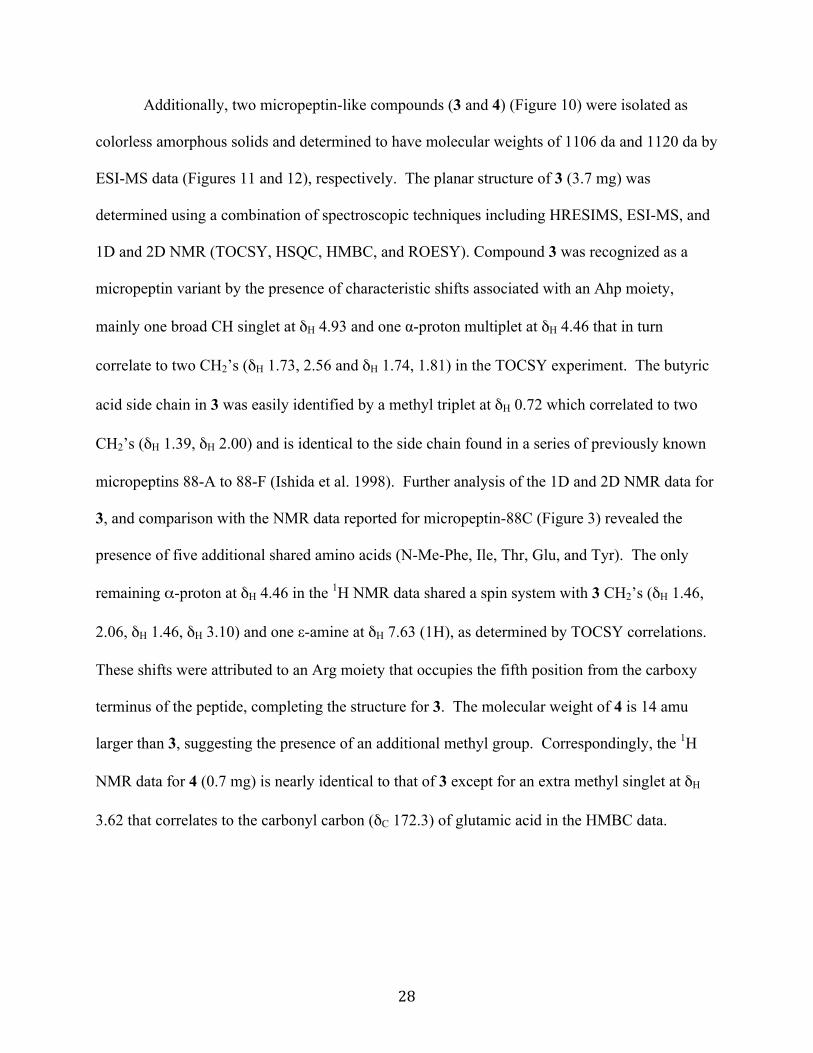
Additionally, two micropeptin-like compounds (3 and 4) (Figure 10) were isolated as
colorless amorphous solids and determined to have molecular weights of 1106 da and 1120 da by
ESI-MS data (Figures 11 and 12), respectively. The planar structure of 3 (3.7 mg) was
determined using a combination of spectroscopic techniques including HRESIMS, ESI-MS, and
1D and 2D NMR (TOCSY, HSQC, HMBC, and ROESY). Compound 3 was recognized as a
micropeptin variant by the presence of characteristic shifts associated with an Ahp moiety,
mainly one broad CH singlet at δH 4.93 and one α-proton multiplet at δH 4.46 that in turn
correlate to two CH2’s (δH 1.73, 2.56 and δH 1.74, 1.81) in the TOCSY experiment. The butyric
acid side chain in 3 was easily identified by a methyl triplet at δH 0.72 which correlated to two
CH2’s (δH 1.39, δH 2.00) and is identical to the side chain found in a series of previously known
micropeptins 88-A to 88-F (Ishida et al. 1998). Further analysis of the 1D and 2D NMR data for
3, and comparison with the NMR data reported for micropeptin-88C (Figure 3) revealed the
presence of five additional shared amino acids (N-Me-Phe, Ile, Thr, Glu, and Tyr). The only
remaining α-proton at δH 4.46 in the 1H NMR data shared a spin system with 3 CH2’s (δH 1.46,
2.06, δH 1.46, δH 3.10) and one ε-amine at δH 7.63 (1H), as determined by TOCSY correlations.
These shifts were attributed to an Arg moiety that occupies the fifth position from the carboxy
terminus of the peptide, completing the structure for 3. The molecular weight of 4 is 14 amu
larger than 3, suggesting the presence of an additional methyl group. Correspondingly, the 1H
NMR data for 4 (0.7 mg) is nearly identical to that of 3 except for an extra methyl singlet at δH
3.62 that correlates to the carbonyl carbon (δC 172.3) of glutamic acid in the HMBC data.
29
NH
N
HN
N
O
O
O
CH3
H3C
H3C
OH
CH3
CH3HN
H3CO
NH
O O
HN
O
OH
O
H3C
C
O
O
O
R1
NH
NH2
HN
O
(3) Micropeptin 1106 R1 = H (4) Micropeptin 1120 R1 = CH3
Figure 10. Structure of micropeptins 1106 and 1120.
30
m/z200 400 600 800 1000 1200 1400
%
0
100
%
0
100JDI 1-83-7 160 (4.613) 1: Scan ES+
9.00e7
1106.6
206.2
531.1347.4 694.5 855.5
1231.0
JDI 1-83-7 159 (4.599) 3: Scan ES- 2.32e61104.5
866.4627.4491.3327.5 710.3 1291.0 1538.2
Figure 11. ESI-MS spectrum of micropeptin 1106.

31
m/z200 400 600 800 1000 1200 1400
%
0
100
%
0
100JDI 1-83-6 169 (4.874) 1: Scan ES+
5.67e7
206.2
1120.7
538.4435.3293.3 708.4869.6913.7
JDI 1-83-6 167 (4.830) 3: Scan ES- 1.52e61118.6
875.6
761.8397.4 653.1 995.61234.5
1451.9
Figure 12. ESI-MS spectrum of micropeptin 1120.
32
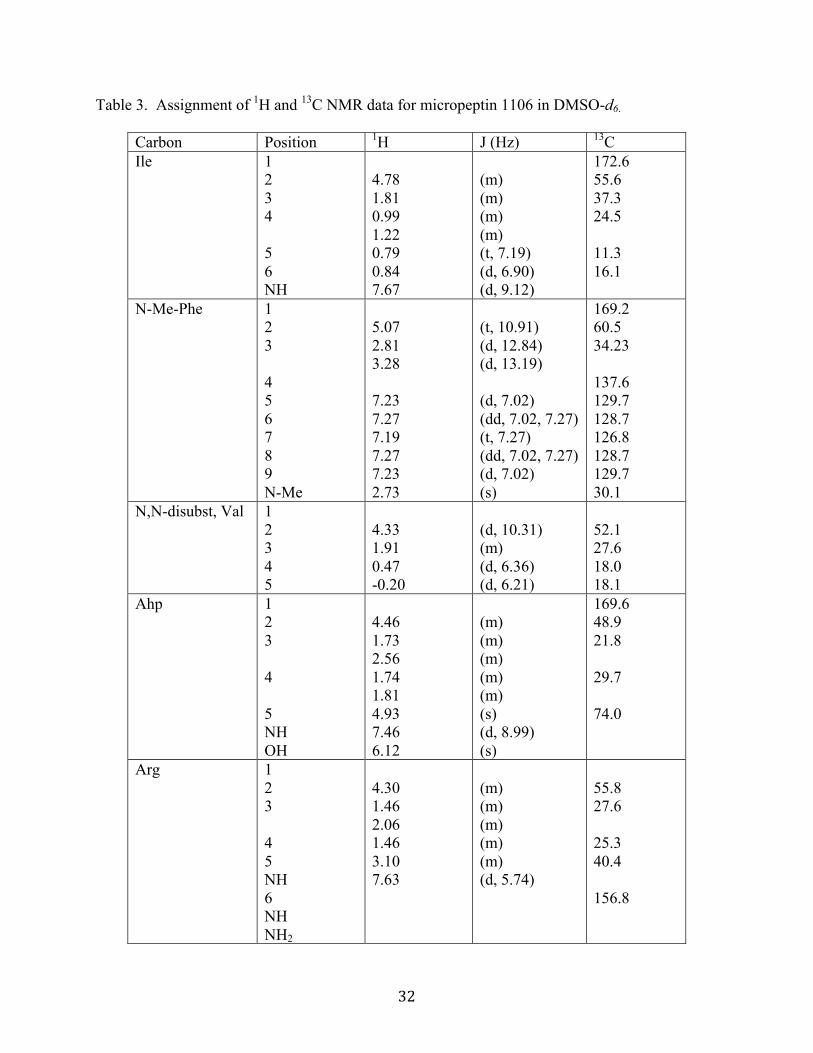
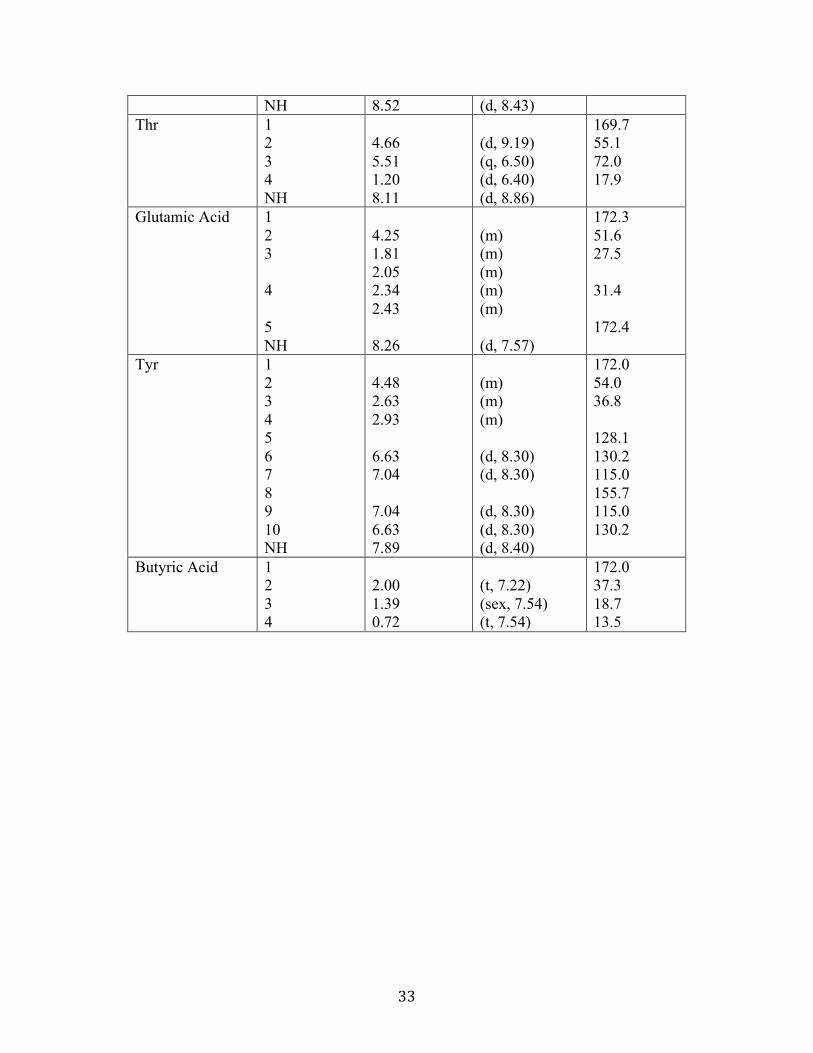
Table 3. Assignment of 1H and 13C NMR data for micropeptin 1106 in DMSO-d6.
Carbon Position 1H J (Hz) 13C Ile 1
2 3 4 5 6 NH
4.78 1.81 0.99 1.22 0.79 0.84 7.67
(m) (m) (m) (m) (t, 7.19) (d, 6.90) (d, 9.12)
172.6 55.6 37.3 24.5 11.3 16.1
N-Me-Phe 1 2 3 4 5 6 7 8 9 N-Me
5.07 2.81 3.28 7.23 7.27 7.19 7.27 7.23 2.73
(t, 10.91) (d, 12.84) (d, 13.19) (d, 7.02) (dd, 7.02, 7.27) (t, 7.27) (dd, 7.02, 7.27) (d, 7.02) (s)
169.2 60.5 34.23 137.6 129.7 128.7 126.8 128.7 129.7 30.1
N,N-disubst, Val 1 2 3 4 5
4.33 1.91 0.47 -0.20
(d, 10.31) (m) (d, 6.36) (d, 6.21)
52.1 27.6 18.0 18.1
Ahp 1 2 3 4 5 NH OH
4.46 1.73 2.56 1.74 1.81 4.93 7.46 6.12
(m) (m) (m) (m) (m) (s) (d, 8.99) (s)
169.6 48.9 21.8 29.7 74.0
Arg 1 2 3 4 5 NH 6 NH NH2
4.30 1.46 2.06 1.46 3.10 7.63
(m) (m) (m) (m) (m) (d, 5.74)
55.8 27.6 25.3 40.4 156.8
33
NH 8.52 (d, 8.43) Thr 1
2 3 4 NH
4.66 5.51 1.20 8.11
(d, 9.19) (q, 6.50) (d, 6.40) (d, 8.86)
169.7 55.1 72.0 17.9
Glutamic Acid 1 2 3 4 5 NH
4.25 1.81 2.05 2.34 2.43 8.26
(m) (m) (m) (m) (m) (d, 7.57)
172.3 51.6 27.5 31.4 172.4
Tyr 1 2 3 4 5 6 7 8 9 10 NH
4.48 2.63 2.93 6.63 7.04 7.04 6.63 7.89
(m) (m) (m) (d, 8.30) (d, 8.30) (d, 8.30) (d, 8.30) (d, 8.40)
172.0 54.0 36.8 128.1 130.2 115.0 155.7 115.0 130.2
Butyric Acid 1 2 3 4
2.00 1.39 0.72
(t, 7.22) (sex, 7.54) (t, 7.54)
172.0 37.3 18.7 13.5
34
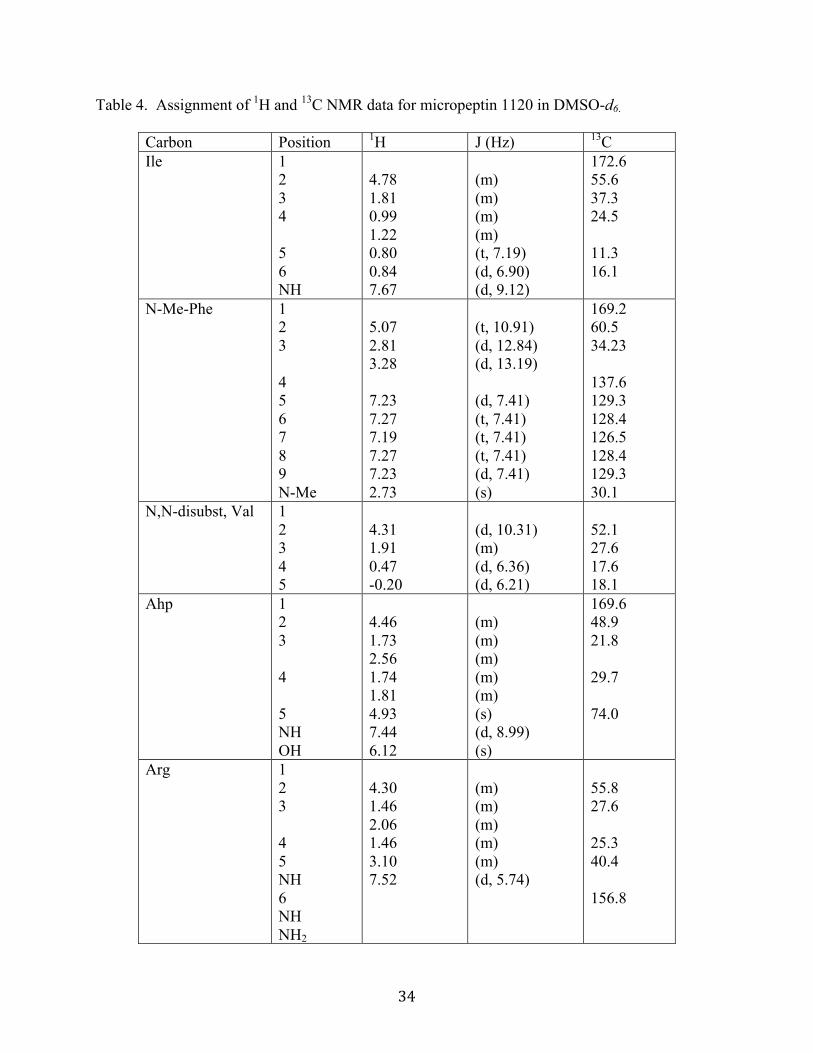
Table 4. Assignment of 1H and 13C NMR data for micropeptin 1120 in DMSO-d6.
Carbon Position 1H J (Hz) 13C Ile 1
2 3 4 5 6 NH
4.78 1.81 0.99 1.22 0.80 0.84 7.67
(m) (m) (m) (m) (t, 7.19) (d, 6.90) (d, 9.12)
172.6 55.6 37.3 24.5 11.3 16.1
N-Me-Phe 1 2 3 4 5 6 7 8 9 N-Me
5.07 2.81 3.28 7.23 7.27 7.19 7.27 7.23 2.73
(t, 10.91) (d, 12.84) (d, 13.19) (d, 7.41) (t, 7.41) (t, 7.41) (t, 7.41) (d, 7.41) (s)
169.2 60.5 34.23 137.6 129.3 128.4 126.5 128.4 129.3 30.1
N,N-disubst, Val 1 2 3 4 5
4.31 1.91 0.47 -0.20
(d, 10.31) (m) (d, 6.36) (d, 6.21)
52.1 27.6 17.6 18.1
Ahp 1 2 3 4 5 NH OH
4.46 1.73 2.56 1.74 1.81 4.93 7.44 6.12
(m) (m) (m) (m) (m) (s) (d, 8.99) (s)
169.6 48.9 21.8 29.7 74.0
Arg 1 2 3 4 5 NH 6 NH NH2
4.30 1.46 2.06 1.46 3.10 7.52
(m) (m) (m) (m) (m) (d, 5.74)
55.8 27.6 25.3 40.4 156.8

35
NH 8.50 (d, 8.43) Thr 1
2 3 4 NH
4.66 5.51 1.20 8.11
(d, 9.19) (q, 6.50) (d, 6.40) (d, 8.86)
169.7 55.1 72.0 17.9
O-Me-Glutamic Acid
1 2 3 4 5 NH O-Me
4.34 1.84 2.05 2.34 2.43 8.40 3.62
(m) (m) (m) (m) (m) (d, 7.57) (s)
172.3 51.6 26.8 30.8 172.4 51.6
Tyr 1 2 3 4 5 6 7 8 9 NH
4.48 2.63 2.90 7.04 6.63 6.63 7.04 7.90
(m) (m) (m) (d, 8.58) (d, 8.58) (d, 8.58) (d, 8.58) (d, 8.40)
172.0 53.7 36.5 128.1 130.2 115.0 155.7 115.0 130.2
Butyric Acid 1 2 3 4
2.00 1.39 0.72
(t, 7.22) (sex, 7.54) (t, 7.54)
172.0 36.8 18.2 13.1
36
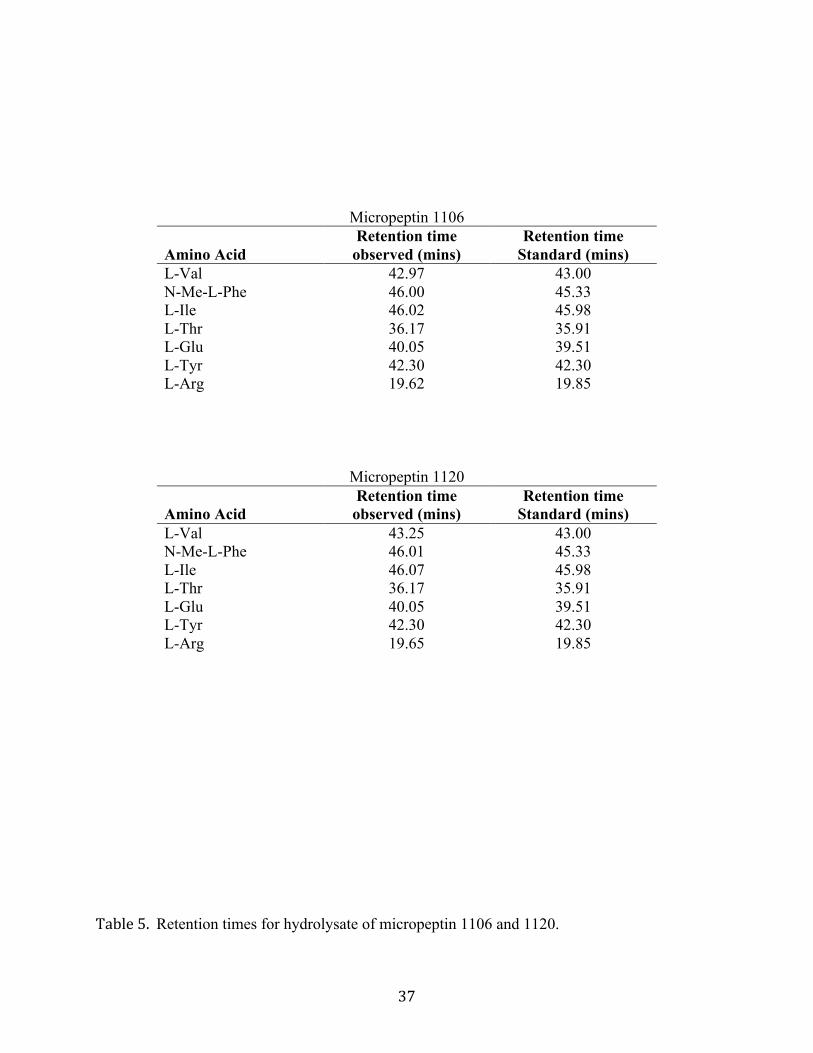
The absolute configurations of the α-amino acid residues present in the new micropeptins
(3 and 4) were determined by Marfey’s method, also confirming the presence of the amino acids
that were predicted by NMR data. Following acid hydrolysis of 3 and 4 and then reaction with
Marfey’s reagent, the HPLC retention time of each derivative was compared with a Marfey
derivative of each of the known amino acids incorporated in both micropeptins. The retention
times obtained for the micropeptin amino acids (Tables 2 and 5) revealed they all possessed the
L-configuration. This result was consistent with all previously reported micropeptins (Ishida et
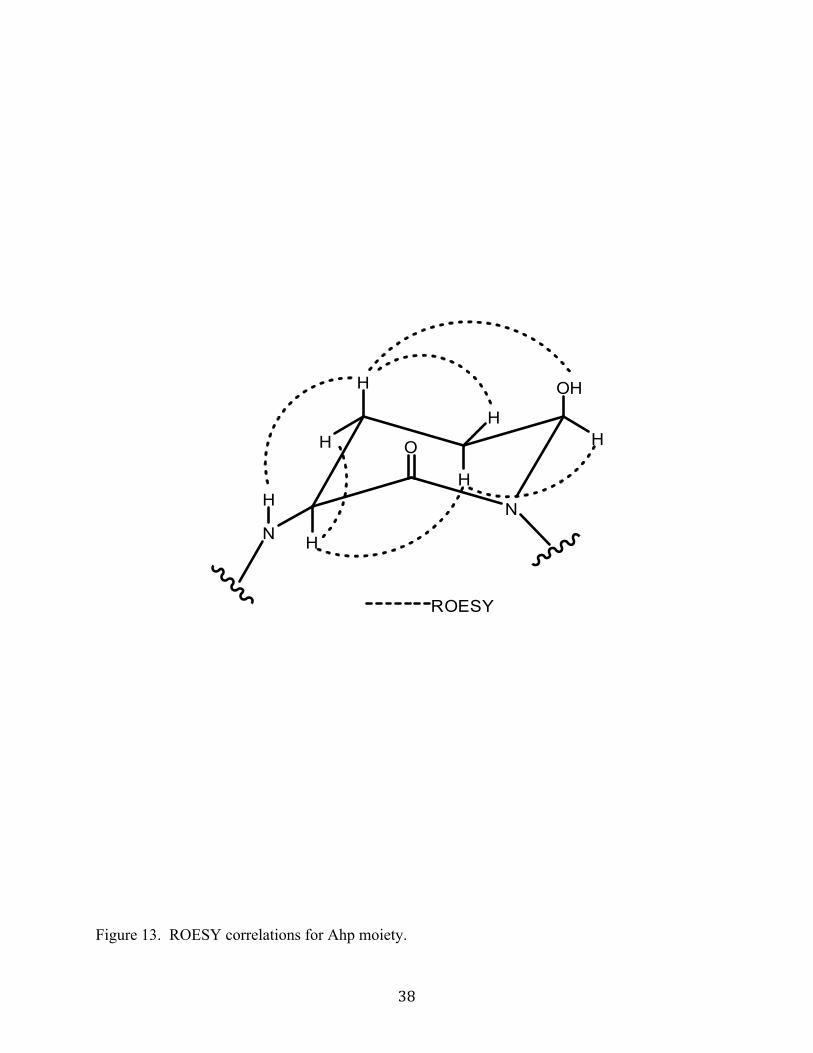
al., 1998). The relative stereochemistry of the Ahp moiety in compounds 3 and 4 were
determined by correlations in the ROESY experiments as seen in Figure 13, and were consistent
with Ahp found in the literature (Zafrir-Ilan et al., 2010b). However, in order to obtain the
absolute stereochemistry of the Ahp moiety it was necessary to oxidize small aliquots of 3 and 4
with Jones’ reagent, which resulted in conversion of the Ahp moiety to glutamic acid (Zafrir-Ilan
et al., 2010a, 2010b) prior to analysis by Marfey’s method. Following conversion with Marfey’s
reagent, HPLC analysis of the oxidized material revealed the glutamine exists in the L form as
well. This result is also consistent with the results of other micropeptin derivatives (Ishida et al.,
1998; Yamaki et al., 2005; Zafrir-Ilan et al., 2010a, 2010b).
37
Micropeptin 1106 Amino Acid
Retention time observed (mins)
Retention time Standard (mins)
L-Val 42.97 43.00 N-Me-L-Phe 46.00 45.33 L-Ile 46.02 45.98 L-Thr 36.17 35.91 L-Glu 40.05 39.51 L-Tyr 42.30 42.30 L-Arg 19.62 19.85
Micropeptin 1120 Amino Acid
Retention time observed (mins)
Retention time Standard (mins)
L-Val 43.25 43.00 N-Me-L-Phe 46.01 45.33 L-Ile 46.07 45.98 L-Thr 36.17 35.91 L-Glu 40.05 39.51 L-Tyr 42.30 42.30 L-Arg 19.65 19.85
Table 5. Retention times for hydrolysate of micropeptin 1106 and 1120.
38
N
H
H
H
H
OH
H
N
H
O
H
ROESY
Figure 13. ROESY correlations for Ahp moiety.
39
Planktothrix rubescens (UTCC 507) Products
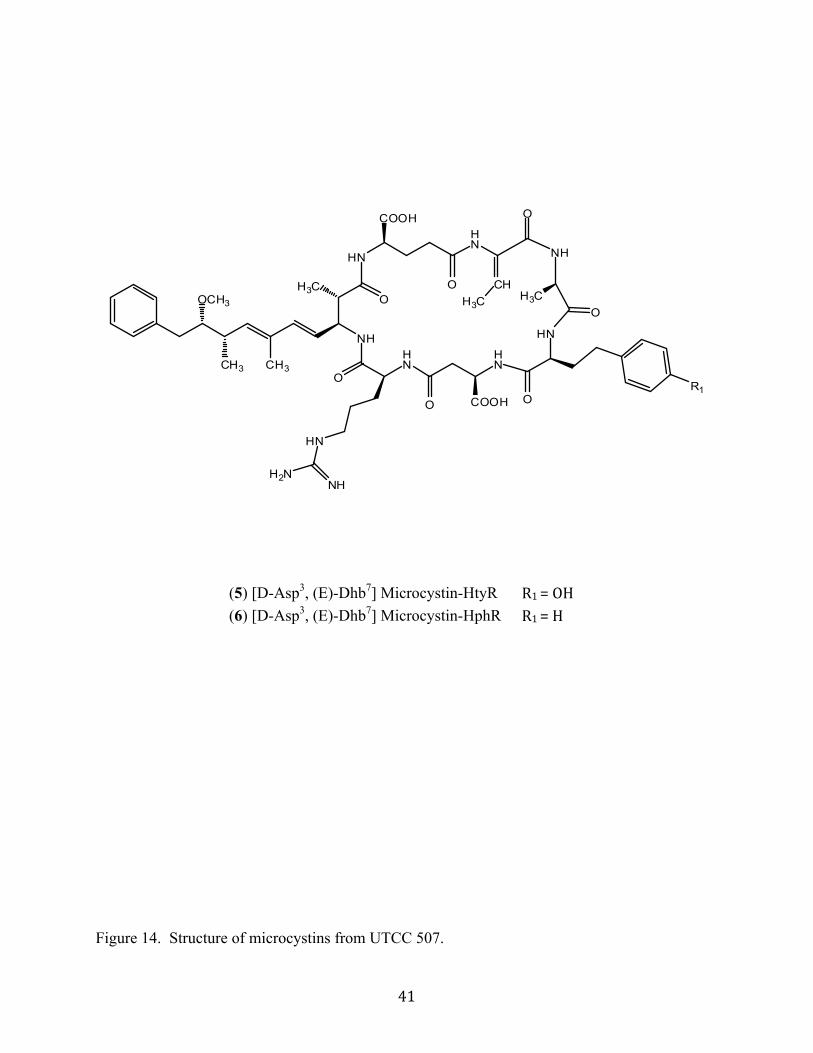
The organic extracts of cells from cultures of Planktothrix rubescens (UTCC 507) were
subjected to a series of chromatography steps, yielding a suite of peptides that were separated
and purified by HPLC. Two microcystin derivatives (Figure 14), [D-Asp3, (E)-Dhb7]
microcystin-HtyR (5) (3.0 mg) and [D-Asp3, (E)-Dhb7] microcystin-HphR (6) (0.5 mg), were
isolated as colorless amorphous solids and initially identified as microcystins based on
characteristic UV data (λmax 240 nm, Figures 15 and 17) and ESI-MS data that showed an
[M+H]+ fragment ion at m/z 135 (Figures 16 and 18), characteristic of microcystins containing
the Adda side chain. The ESI-MS data determined the molecular weights of 5 and 6 to be 1045
da and 1029 da, which are isobaric with the known microcystins, MC-YR and MC-FR
respectively. However, the 1H NMR spectra of 5 and 6 did not contain the usual pair of singlets
(typically at δH ~5.40 and δH ~5.80) associated with the olefinic protons of Mdha7 that are
present in MC-YR and MC-FR. Instead, the 1H spectra of 5 and 6 each contained one olefinic
methine quartet at δH 5.68 that couples with methyl doublets at δH 1.81 in the TOCSY spectra,
suggesting the presence of Dhb7 instead of Mdha7. This was further supported by the lack of an
N-methyl singlet (typically at δH ~3.30) in the 1H NMR spectra of 5 and 6, which is typically
found on Mdha7. Compounds 5 and 6 were also determined to have D-Asp3, instead of the
common D-MeAsp3 found in microcystins, based on the absence of the characteristic methyl
doublet (typically at δH ~1.00) associated with D-MeAsp3. The exchange of Dhb for Mdha has
no effect on molecular weight while the substitution of D-Asp for D-MeAsp would cause a
decrease of 14 amu, consistent with the loss of a methyl group. However, the molecular weights
of 5 and 6 are identical to MC-YR and MC-FR, respectively, suggesting the presence of an
additional CH2 or methyl group. Close examination of the TOCSY and HMBC data for 5

40
revealed the presence of 2 CH2’s (δH 2.40, 2.58 and δH 2.40, 2.58) located between the α-proton
(δH 3.94) and aromatic ring of the tyrosine-like residue that has two doublets at δH 6.64 (2H) and
δH 6.95 (2H), suggesting the presence of homotyrosine instead. The TOCSY and HMBC data
for 6 also revealed a phenyl ring connected to a chain consisting of two methylenes at δH 2.03
(2H) and δH 2.52, 2.69 (2H) indicating the presence of a homophenylalanine moiety.
41
OCH3
CH3 CH3
NH
O
HN
HN
HN
H2NNH
O COOH O
HN
O
NH
CH
HN
O
HN
H3C
COOH
H3C
O
O H3C
R1
(5) [D-Asp3, (E)-Dhb7] Microcystin-HtyR R1 = OH (6) [D-Asp3, (E)-Dhb7] Microcystin-HphR R1 = H
Figure 14. Structure of microcystins from UTCC 507.

42
nm200 220 240 260 280 300 320 340 360 380 400
AU
0.0
2.0e-1
4.0e-1
6.0e-1
8.0e-1
1.0
1.2
1.4
1.6
1.8
2.0
2.2
JDI 3-47-7 603 (4.056) Cm (592:622) 3: Diode Array 2.507238.0
196.0
Figure 15. UV absorbance for [D-Asp3, (E)-Dhb7] microcystin-HtyR.

43
m/z200 400 600 800 1000 1200 1400
%
0
100
%
0
100JDI 3-47-7 203 (4.091) 1: Scan ES+
9.67e71046.1
135.1
982.1534.6
150.1507.7265.1 911.8
535.4847.8765.6
1047.1
1048.1
1049.1
1050.3 1569.21537.21392.51161.6
JDI 3-47-7 204 (4.122) 2: Scan ES- 6.80e51044.1521.7
512.8
480.6
252.1 474.6
980.1
523.4856.7655.2741.7
1045.1
1046.0
1566.71047.01534.91219.7 1294.3 1568.1
Figure 16. ESI-MS spectra for [D-Asp3, (E)-Dhb7] microcystin-HtyR.

44
nm200 220 240 260 280 300 320 340 360 380 400
AU
0.0
5.0e-2
1.0e-1
1.5e-1
2.0e-1
2.5e-1
3.0e-1
3.5e-1
4.0e-1
4.5e-1
5.0e-1
5.5e-1
6.0e-1
6.5e-1
7.0e-1
7.5e-1
8.0e-1
8.5e-1
JDI 3-46-10 630 (4.231) 3: Diode Array 9.491e-1192.0
240.0
Figure 17. UV absorbance for [D-Asp3, (E)-Dhb7] microcystin-HphR.
45
858 Long analytical
m/z200 400 600 800 1000 1200 1400
%
0
100
%
0
100JDI 3-44-3 211 (4.253) 1: Scan ES+
1.12e81030.1
135.1
526.6
499.6136.1265.2447.3
895.9
534.6765.7733.6
896.9
898.0
1031.0
1032.1
1033.2
1034.2 1546.81172.7
JDI 3-44-3 211 (4.264) 2: Scan ES- 1.44e61028.0
504.6
484.0252.3218.7
513.7
514.3
514.5968.0
843.4804.8522.4
1029.0
1030.0
1031.31542.81496.91116.4 1360.7
Figure 18. ESI-MS spectra for [D-Asp3, (E)-Dhb7] microcystin-HphR.
46
Table 6. Assignment of 1H and 13C NMR data for [D-Asp3, (E)-Dhb7] microcystin-HtyR in DMSO-d6.
Carbon Position 1H J (Hz) 13C D-Ala 1
2 3 NH
4.43 1.18 7.74
(pentet, 7.25) (d, 6.77) (s)
172.3 47.5 17.0
L-Hty
1 2 3 4 5 6 7 8 9 10 NH
3.94 1.94 2.40 2.58 6.95 6.64 6.64 6.95 8.18
(m) (m) (m) (m) (d, 7.54) (d, 7.54) (d, 7.54) (d, 7.54) (d, 6.64)
53.8 32.9 30.8 131.3 129.3 115.0 155.3 115.0 129.3
D-Asp 1 2 3 4 NH
L-Arg 1 2 3 4 5 NH 6 NH
4.28 1.35 1.90 1.36 1.9 3.05 7.48 8.53
(m) (m) (m) (m) (m) (m) (s) (s)
51.34 27.81 25.29 40.1 156.6
Adda 1 2 3 4 5 6 7 8 9 10
2.54 4.28 5.37 6.10 5.42 2.52 3.25 2.68 2.73
(m) (m) (m) (d, 15.44) (d, 9.47) (m) (m) (dd, 6.98, 13.85) (dd, 4.80, 13.73)
172.3 40.5 54.2 126.5 135.7 132.1 135.3 34.2 85.78 37.02
47
11 12 13 14 15 16 17 18 19 20
7.19 7.26 7.18 7.26 7.19 0.91 1.54 0.96 3.18
(d, 7.03) (t, 7.03) (t, 7.03) (t, 7.03) (d, 7.03) (m) (s) (d, 6.63) (s)
139.2 129.3 128.1 125.9 128.1 129.3 16.9 12.5 15.9 57.4
D-Glu 1 2 3 4 5
Dhb 1 2 3 4
5.68 1.81
(q, 7.16) (d, 7.15)
163.7 130.8 121.4 13.0

48
Table 7. Assignment of 1H and 13C NMR data for [D-Asp3, (E)-Dhb7] microcystin-HphR in DMSO-d6.
Carbon Position 1H J (Hz) 13C D-Ala 1
2 3 NH
4.46 1.15 7.57
(m) (d, 5.54) (s)
47.8 17.4
L-Hph
1 2 3 4 5 6 7 8 9 10 NH
3.91 2.03 2.52 2.69 7.18 7.24 7.14 7.24 7.18
(m) (m) (m) (m) (d, 7.51) (t, 7.51) (t, 7.51) (t, 7.51) (d, 7.51)
54.9 32.1 31.5 128.9 128.6 126.2 128.6 128.9
D-Asp 1 2 3 4 NH
L-Arg 1 2 3 4 5 NH 6 NH
4.34 1.33 1.89 1.33 1.96 3.01 7.78 8.53
(m) (m) (m) (m) (m) (m) (s) (s)
51.1 25.8 26.8 40.4
Adda 1 2 3 4 5 6 7 8 9 10
2.93 4.26 5.31 6.11 5.43 2.50 3.26 2.54 2.71
(m) (m) (m) (d, 15.44) (d, 9.47) (m) (m) (dd, 6.98, 13.85) (dd, 4.80, 13.73)
40.5 54.2 127.3 135.7 136.2 33.6 86.3 37.1

49
11 12 13 14 15 16 17 18 19 20
7.18 7.27 7.18 7.27 7.18 0.90 1.55 0.97 3.18
(d, 7.51) (t, 7.51) (t, 7.51) (t, 7.51) (d, 7.51) (m) (s) (d, 6.03) (s)
129.3 128.1 125.9 128.1 129.3 16.9 12.6 15.9 57.8
D-Glu 1 2 3 4 5
Dhb 1 2 3 4
5.69 1.83
(m) (d, 7.10)
123.0 13.5

50
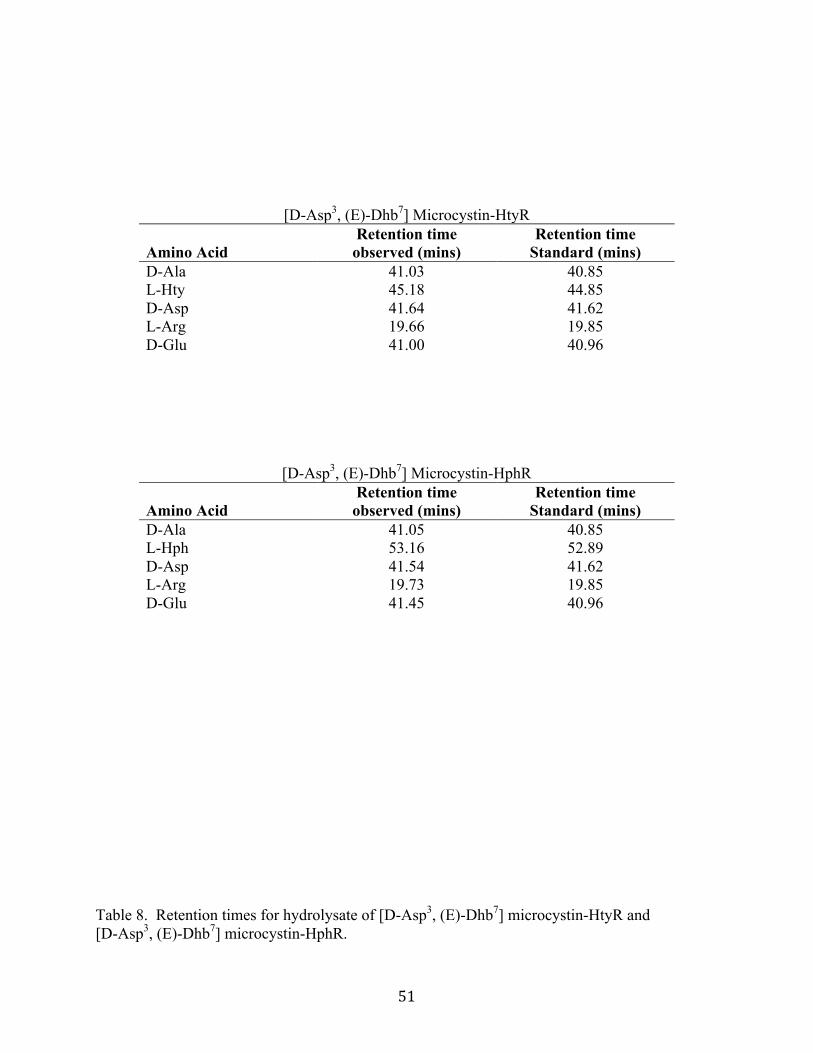
The D-Asp3 and D-Glu7 residues predicted in compounds 5 and 6, based on the chemical
formula of the amino acids identified by NMR data and comparison with the chemical formulas
for 5 and 6 determined by HRESIMS, could not be verified by NMR due to the highly coupled
nature of the methylene and α-protons. However, the presence of D-Asp3 and D-Glu7 in
compounds 5 and 6 were confirmed by Marfey’s method, along with the presence and absolute
stereochemistry of all amino acids present. Comparison of retention times for authentic D and L
amino acid derivatives with hydrolysate derivatives determined compounds 5 and 6 to contain D-
Ala, D-Asp, D-Glu, L-Arg, L-Hty, and L-Hph. This data is consistent with the stereochemistry
of other microcystin congeners (Namikoshi, et al., 1992; Beattie, et al., 1998; Sano et al., 1998)
51
[D-Asp3, (E)-Dhb7] Microcystin-HtyR Amino Acid
Retention time observed (mins)
Retention time Standard (mins)
D-Ala 41.03 40.85 L-Hty 45.18 44.85 D-Asp 41.64 41.62 L-Arg 19.66 19.85 D-Glu 41.00 40.96
[D-Asp3, (E)-Dhb7] Microcystin-HphR Amino Acid
Retention time observed (mins)
Retention time Standard (mins)
D-Ala 41.05 40.85 L-Hph 53.16 52.89 D-Asp 41.54 41.62 L-Arg 19.73 19.85 D-Glu 41.45 40.96
Table 8. Retention times for hydrolysate of [D-Asp3, (E)-Dhb7] microcystin-HtyR and [D-Asp3, (E)-Dhb7] microcystin-HphR.
52
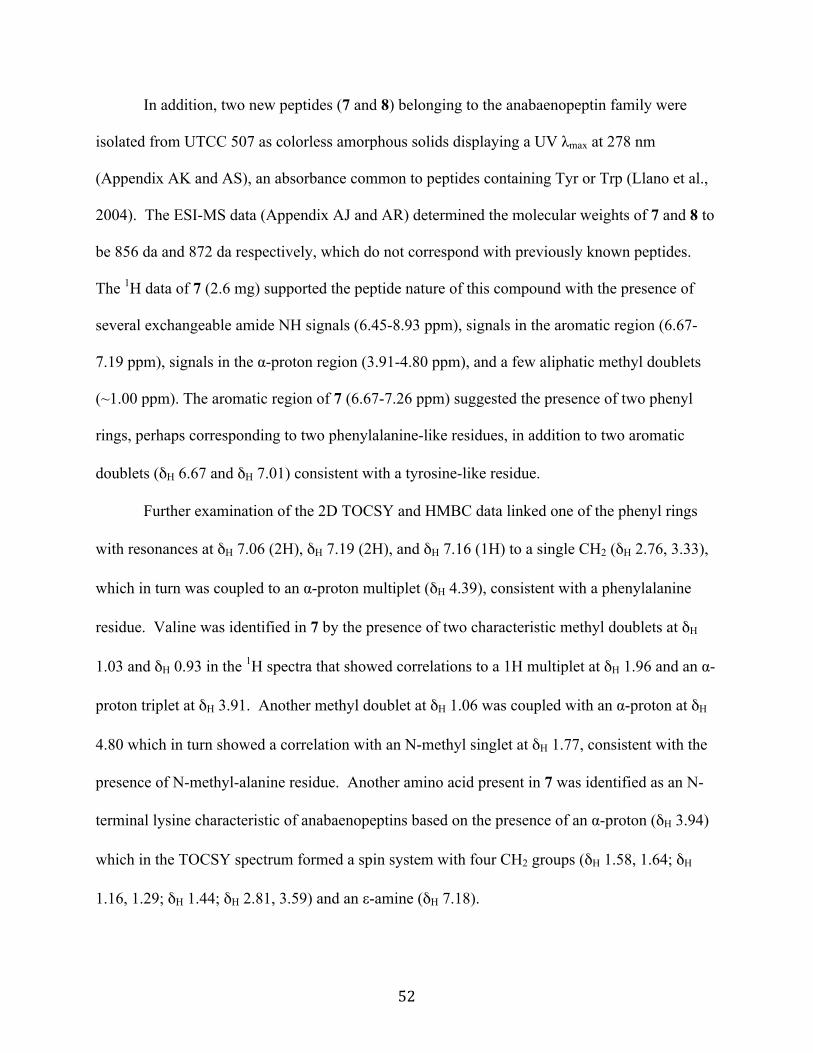
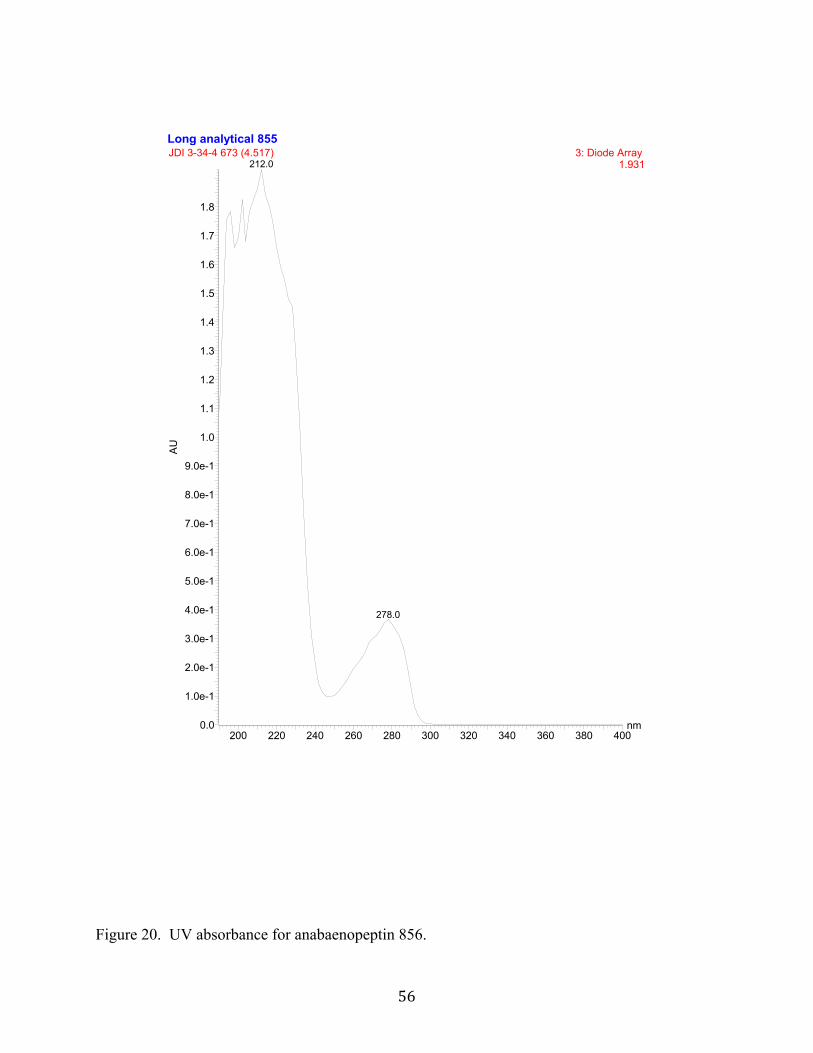
In addition, two new peptides (7 and 8) belonging to the anabaenopeptin family were
isolated from UTCC 507 as colorless amorphous solids displaying a UV λmax at 278 nm
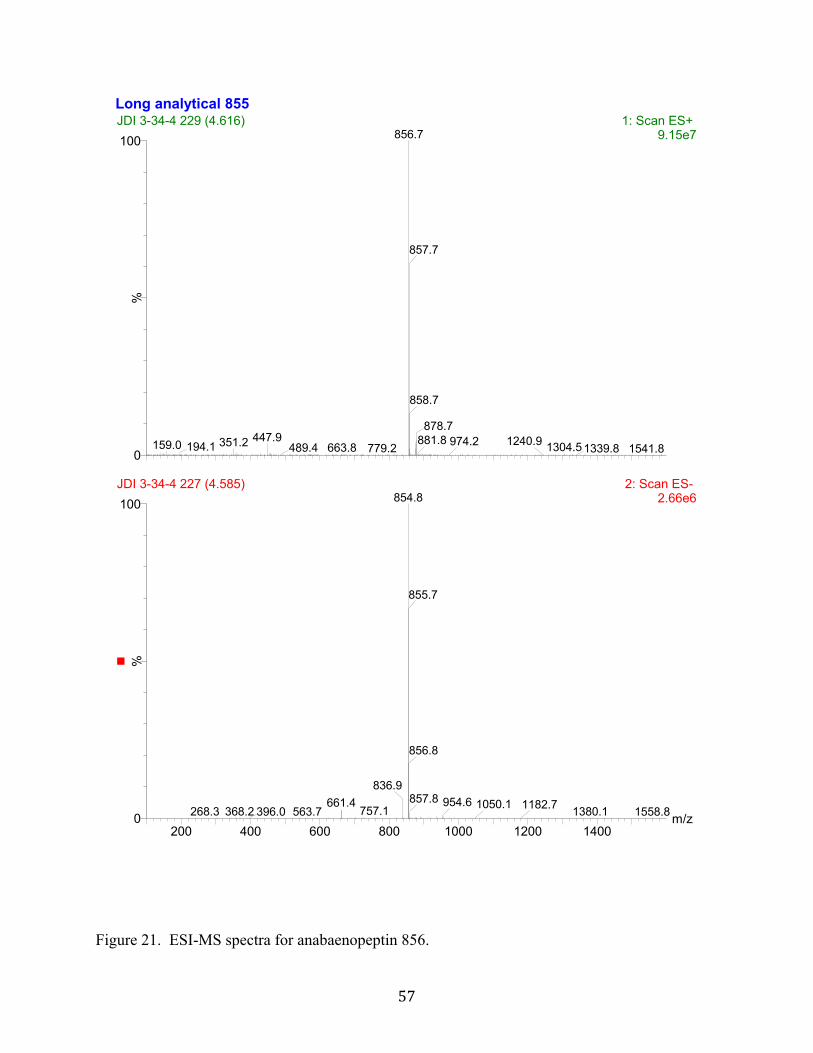
(Appendix AK and AS), an absorbance common to peptides containing Tyr or Trp (Llano et al.,
2004). The ESI-MS data (Appendix AJ and AR) determined the molecular weights of 7 and 8 to
be 856 da and 872 da respectively, which do not correspond with previously known peptides.
The 1H data of 7 (2.6 mg) supported the peptide nature of this compound with the presence of
several exchangeable amide NH signals (6.45-8.93 ppm), signals in the aromatic region (6.67-
7.19 ppm), signals in the α-proton region (3.91-4.80 ppm), and a few aliphatic methyl doublets
(~1.00 ppm). The aromatic region of 7 (6.67-7.26 ppm) suggested the presence of two phenyl
rings, perhaps corresponding to two phenylalanine-like residues, in addition to two aromatic
doublets (δH 6.67 and δH 7.01) consistent with a tyrosine-like residue.
Further examination of the 2D TOCSY and HMBC data linked one of the phenyl rings
with resonances at δH 7.06 (2H), δH 7.19 (2H), and δH 7.16 (1H) to a single CH2 (δH 2.76, 3.33),
which in turn was coupled to an α-proton multiplet (δH 4.39), consistent with a phenylalanine
residue. Valine was identified in 7 by the presence of two characteristic methyl doublets at δH
1.03 and δH 0.93 in the 1H spectra that showed correlations to a 1H multiplet at δH 1.96 and an α-
proton triplet at δH 3.91. Another methyl doublet at δH 1.06 was coupled with an α-proton at δH
4.80 which in turn showed a correlation with an N-methyl singlet at δH 1.77, consistent with the
presence of N-methyl-alanine residue. Another amino acid present in 7 was identified as an N-
terminal lysine characteristic of anabaenopeptins based on the presence of an α-proton (δH 3.94)
which in the TOCSY spectrum formed a spin system with four CH2 groups (δH 1.58, 1.64; δH
1.16, 1.29; δH 1.44; δH 2.81, 3.59) and an ε-amine (δH 7.18).
53
Two amino acids were still unaccounted for: The 2D TOCSY and HMBC data of the
para-substituted benzene ring displaying resonances at δH 7.01 (2H) and δH 6.67 (2H) established
correlations with two CH2’s (δH 1.72, 1.88 and δH 2.44, 2.65) and an α-proton (δH 4.73). These
features were consistent with a homotyrosine residue. Comparison of the molecular formula
associated with the amino acids already identified in 7 (C34H47N6O7), with the observed
molecular formula (C46H61N7O9) indicated the remaining amino acid residue which must contain
the second phenyl ring possessed a molecular formula of C12H14N1O2. The 2D TOCSY and
HMBC data revealed this second phenyl group displaying resonances at δH 7.16 (2H), δH 7.26
(2H), and δH 7.16 (1H) was linked to three CH2 groups (δH 1.57, 1.67; δH 1.57, 2.56; δH 2.56)
and an α-proton (δH 4.09), suggesting the sixth amino acid is 2-amino-5-phenyl-pentanoic acid.
Finally, the connectivity of these six amino acid constituents was determined by HMBC
correlations, which also established the ureido carbonyl linkage (C-ureido δC 157.3) between
lysine and the unique amino acid, 2-amino-5-phenyl-pentanoic acid. These NMR data and the
estimated molecular formula for the final amino acid constituent of 7 are consistent with the
presence of the extremely rare amino acid 2-amino-5-phenyl-pentanoic acid and its ureido
linkage.
The MW of compound 8 (1.0 mg) indicated it contained an extra oxygen (+16 amu)
compared with 7, and the 1D and 2D NMR data for 8 were almost identical to that of 7 except
for the aromatic regions. Instead the 1H data for 8 displayed resonances for only one un-
substituted phenyl group but two para-substituted benzene rings, suggesting the presence of two
tyrosine-like amino acid residues. The additional para-substituted benzene ring with resonances
at δH 6.65 (2H) and δH 6.93 (2H), showed correlations in the 2D TOCSY and HMBC spectra
with three CH2 groups (δH 1.57, 1.67; δH 1.57; δH 2.56), very similar in chemical shift to those

54
observed for the 2-amino-5-phenyl-pentanoic acid chain in 7. Thus the structure of the new
amino acid in 8 was 2-amino-5-hydroxyphenyl-pentanoic acid.

55
HN
NH
HN
ONH3C
H3CO
HN
O
O
CH3H3C
HN
O COOH
HO
NH
O
R1
(7) Anabaenopeptin 856 R1 = H (8) Anabaenopeptin 872 R1 = OH
Figure 19. Structure of two new anabaenopeptins from UTCC 507.
56
Long analytical 855
nm200 220 240 260 280 300 320 340 360 380 400
AU
0.0
1.0e-1
2.0e-1
3.0e-1
4.0e-1
5.0e-1
6.0e-1
7.0e-1
8.0e-1
9.0e-1
1.0
1.1
1.2
1.3
1.4
1.5
1.6
1.7
1.8
JDI 3-34-4 673 (4.517) 3: Diode Array 1.931212.0
278.0
Figure 20. UV absorbance for anabaenopeptin 856.
57
Long analytical 855
m/z200 400 600 800 1000 1200 1400
%
0
100
%
0
100JDI 3-34-4 229 (4.616) 1: Scan ES+
9.15e7856.7
447.9351.2159.0 194.1 663.8489.4 779.2
857.7
858.7
878.7
1304.5881.8 1240.9974.2 1339.8 1541.8
JDI 3-34-4 227 (4.585) 2: Scan ES- 2.66e6854.8
836.9661.4
368.2268.3 563.7396.0 757.1
855.7
856.8
857.8 954.6 1050.1 1380.11182.7 1558.8
Figure 21. ESI-MS spectra for anabaenopeptin 856.
58
UTCC 507 1-47-1 HPLC
nm200 220 240 260 280 300 320 340 360 380 400
AU
0.0
5.0e-2
1.0e-1
1.5e-1
2.0e-1
2.5e-1
3.0e-1
3.5e-1
4.0e-1
4.5e-1
5.0e-1
5.5e-1
6.0e-1
6.5e-1
JDI 1-52-4 642 (4.314) 3: Diode Array 7.238e-1196.0
Figure 22. UV absorbance for anabaenopeptin 872.

59
Long analytical
m/z200 400 600 800 1000 1200 1400
%
0
100
%
0
100JDI 3-33-3 205 (4.131) 1: Scan ES+
7.21e7872.8
456.0351.2159.0 210.1 695.6610.5 796.7
873.8
874.9
894.8896.8 1328.11007.0 1251.5 1364.0 1512.1
JDI 3-33-3 204 (4.121) 2: Scan ES- 2.41e6870.8
661.6329.3285.0209.2 351.2
852.7718.3
871.9
872.8
874.0 969.01389.61302.0
Figure 23. ESI-MS spectrum of anabaenopeptin 872.
60
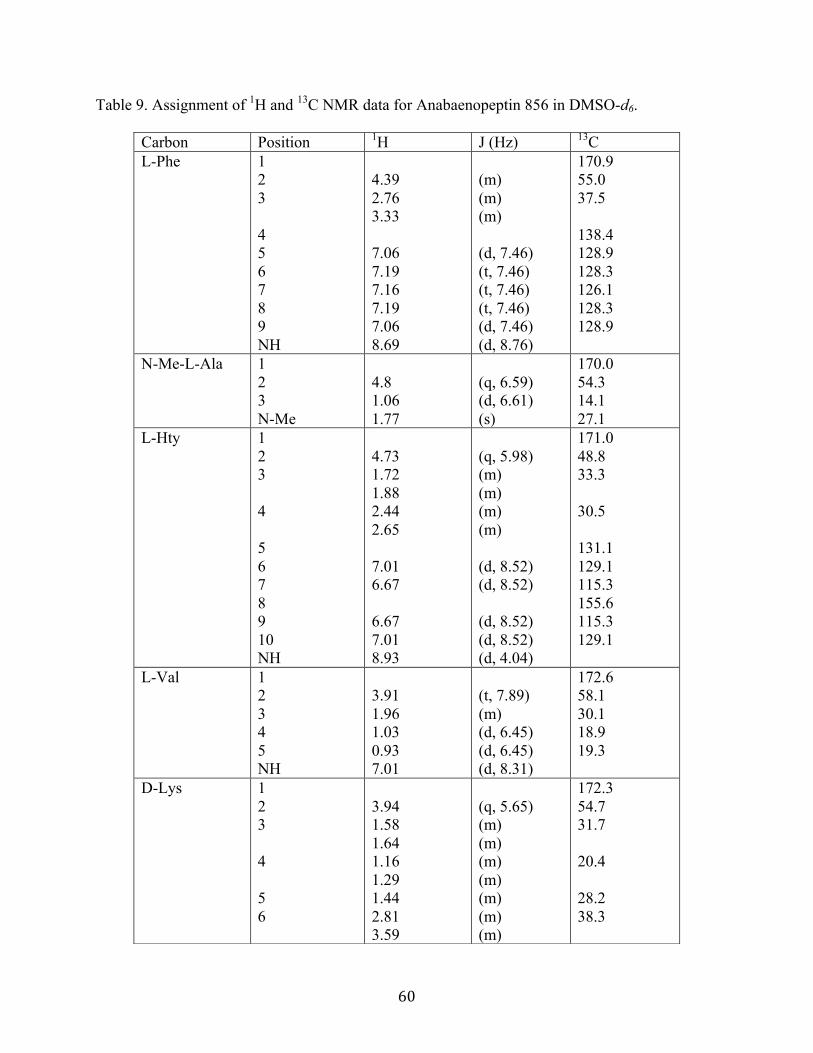
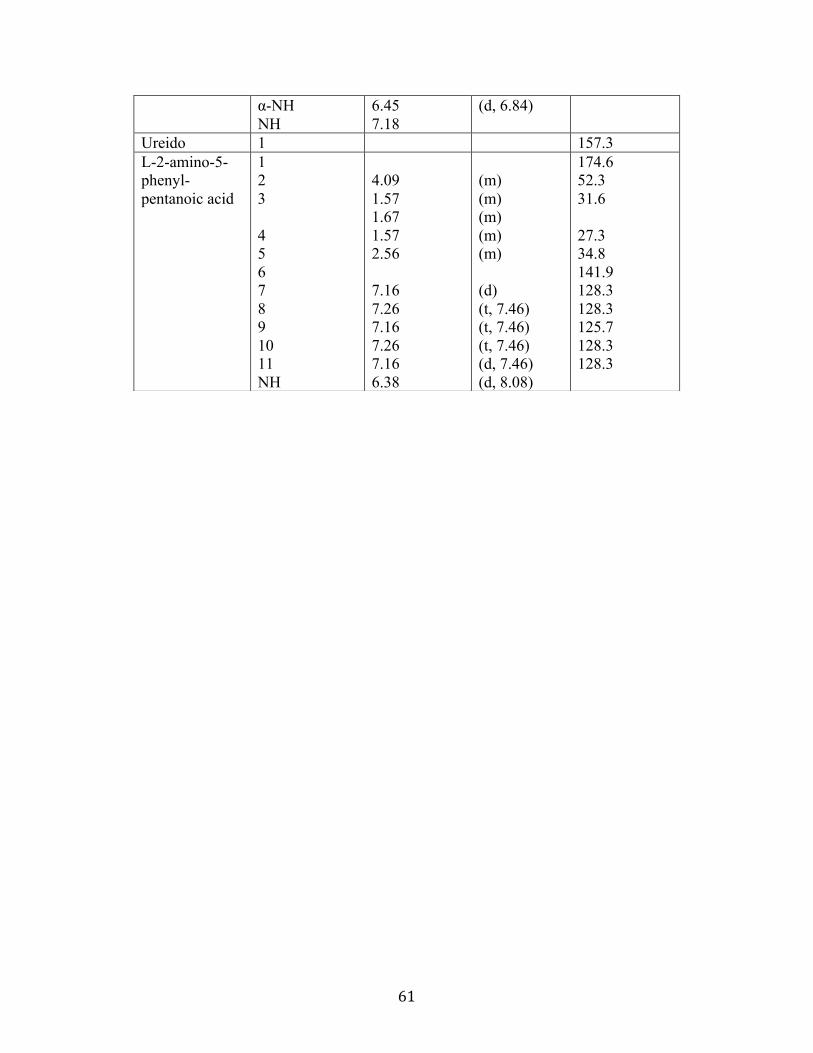
Table 9. Assignment of 1H and 13C NMR data for Anabaenopeptin 856 in DMSO-d6.
Carbon Position 1H J (Hz) 13C L-Phe 1
2 3 4 5 6 7 8 9 NH
4.39 2.76 3.33 7.06 7.19 7.16 7.19 7.06 8.69
(m) (m) (m) (d, 7.46) (t, 7.46) (t, 7.46) (t, 7.46) (d, 7.46) (d, 8.76)
170.9 55.0 37.5 138.4 128.9 128.3 126.1 128.3 128.9
N-Me-L-Ala 1 2 3 N-Me
4.8 1.06 1.77
(q, 6.59) (d, 6.61) (s)
170.0 54.3 14.1 27.1
L-Hty 1 2 3 4 5 6 7 8 9 10 NH
4.73 1.72 1.88 2.44 2.65 7.01 6.67 6.67 7.01 8.93
(q, 5.98) (m) (m) (m) (m) (d, 8.52) (d, 8.52) (d, 8.52) (d, 8.52) (d, 4.04)
171.0 48.8 33.3 30.5 131.1 129.1 115.3 155.6 115.3 129.1
L-Val 1 2 3 4 5 NH
3.91 1.96 1.03 0.93 7.01
(t, 7.89) (m) (d, 6.45) (d, 6.45) (d, 8.31)
172.6 58.1 30.1 18.9 19.3
D-Lys
1 2 3 4 5 6
3.94 1.58 1.64 1.16 1.29 1.44 2.81 3.59
(q, 5.65) (m) (m) (m) (m) (m) (m) (m)
172.3 54.7 31.7 20.4 28.2 38.3
61
α-NH NH
6.45 7.18
(d, 6.84)
Ureido 1 157.3 L-2-amino-5-phenyl-pentanoic acid
1 2 3 4 5 6 7 8 9 10 11 NH
4.09 1.57 1.67 1.57 2.56 7.16 7.26 7.16 7.26 7.16 6.38
(m) (m) (m) (m) (m) (d) (t, 7.46) (t, 7.46) (t, 7.46) (d, 7.46) (d, 8.08)
174.6 52.3 31.6 27.3 34.8 141.9 128.3 128.3 125.7 128.3 128.3
62
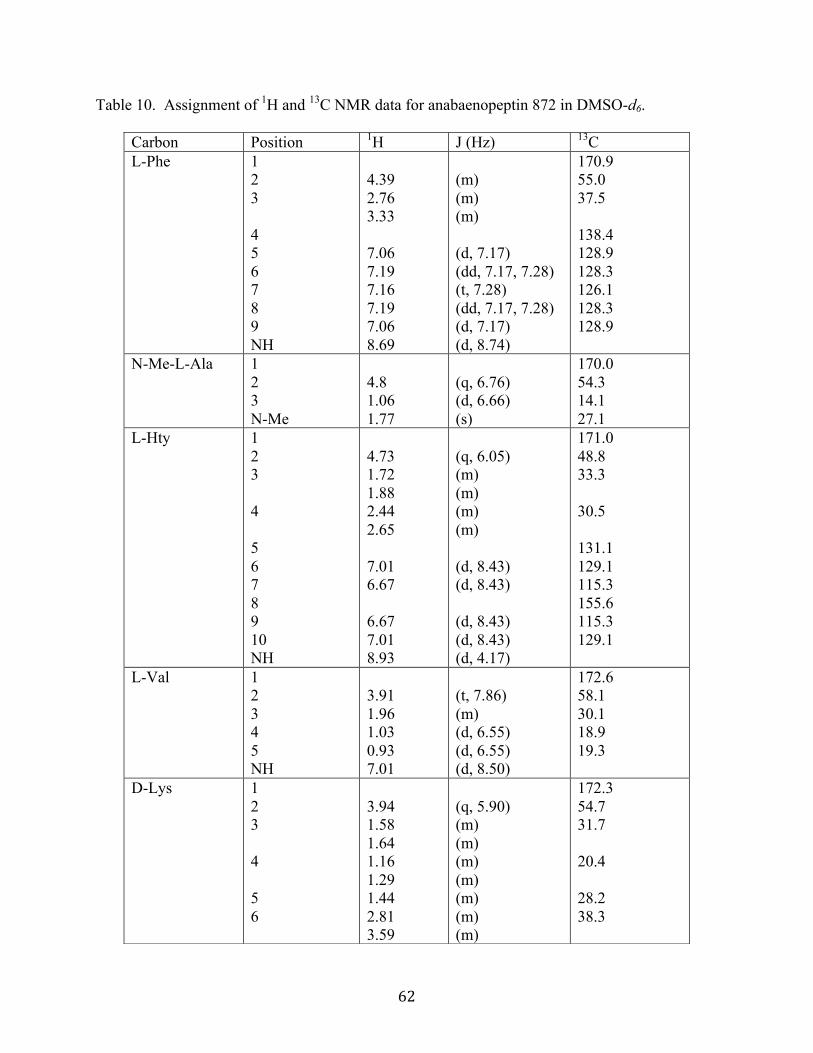
Table 10. Assignment of 1H and 13C NMR data for anabaenopeptin 872 in DMSO-d6.
Carbon Position 1H J (Hz) 13C L-Phe 1
2 3 4 5 6 7 8 9 NH
4.39 2.76 3.33 7.06 7.19 7.16 7.19 7.06 8.69
(m) (m) (m) (d, 7.17) (dd, 7.17, 7.28) (t, 7.28) (dd, 7.17, 7.28) (d, 7.17) (d, 8.74)
170.9 55.0 37.5 138.4 128.9 128.3 126.1 128.3 128.9
N-Me-L-Ala 1 2 3 N-Me
4.8 1.06 1.77
(q, 6.76) (d, 6.66) (s)
170.0 54.3 14.1 27.1
L-Hty 1 2 3 4 5 6 7 8 9 10 NH
4.73 1.72 1.88 2.44 2.65 7.01 6.67 6.67 7.01 8.93
(q, 6.05) (m) (m) (m) (m) (d, 8.43) (d, 8.43) (d, 8.43) (d, 8.43) (d, 4.17)
171.0 48.8 33.3 30.5 131.1 129.1 115.3 155.6 115.3 129.1
L-Val 1 2 3 4 5 NH
3.91 1.96 1.03 0.93 7.01
(t, 7.86) (m) (d, 6.55) (d, 6.55) (d, 8.50)
172.6 58.1 30.1 18.9 19.3
D-Lys 1 2 3 4 5 6
3.94 1.58 1.64 1.16 1.29 1.44 2.81 3.59
(q, 5.90) (m) (m) (m) (m) (m) (m) (m)
172.3 54.7 31.7 20.4 28.2 38.3
63
NH NH
6.42 7.18
(d, 6.84)
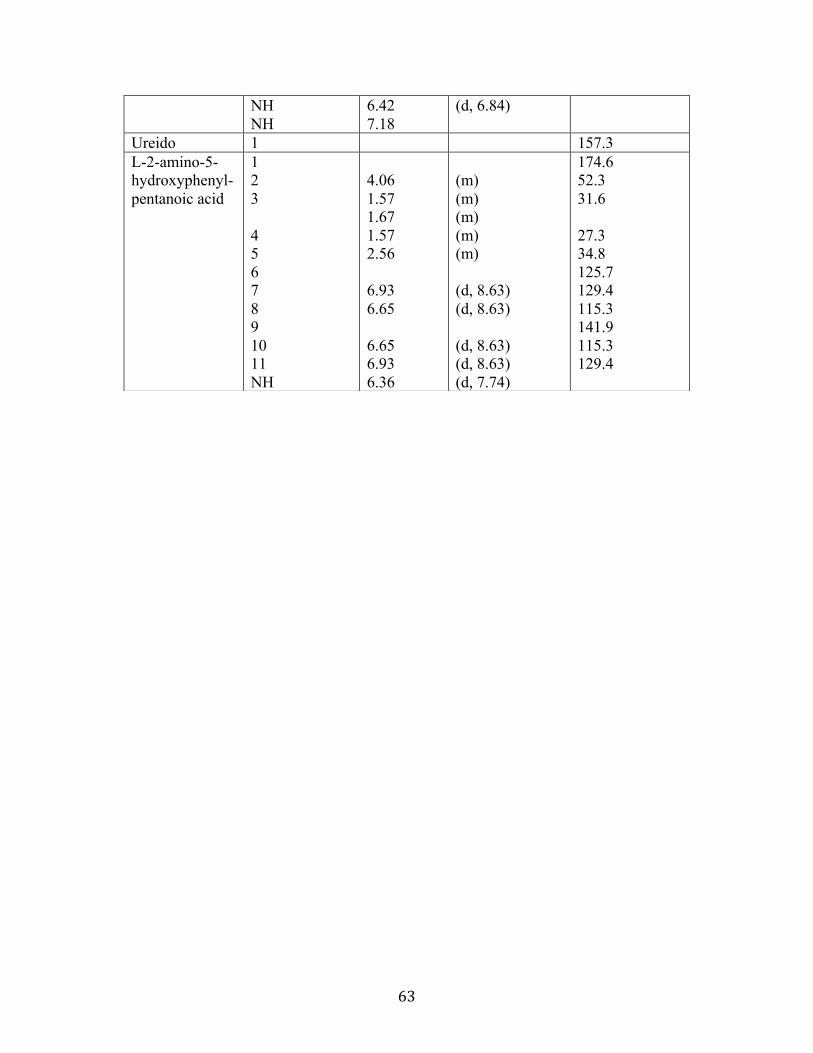
Ureido 1 157.3 L-2-amino-5-hydroxyphenyl-pentanoic acid
1 2 3 4 5 6 7 8 9 10 11 NH
4.06 1.57 1.67 1.57 2.56 6.93 6.65 6.65 6.93 6.36
(m) (m) (m) (m) (m) (d, 8.63) (d, 8.63) (d, 8.63) (d, 8.63) (d, 7.74)
174.6 52.3 31.6 27.3 34.8 125.7 129.4 115.3 141.9 115.3 129.4
64
Confirmation of the presence and absolute stereochemistry of the α-amino acids present
in 7 and 8 were checked by Marfey’s method. Comparison of the derivatized hydrolysate of 7
and 8 with the retention times of standard amino acid derivatives confirmed the presence of all
amino acids predicted by the NMR data and indicated an L-configuration for all, except for D-
lysine. This result was consistent with all other anabaenopeptins (Zafrir-Ilan et al., 2010b).

65
Anabaenopeptin 856 Amino Acid
Retention time observed (mins)
Retention time Standard (mins)
L-Phe 50.71 50.48 N-Me-L-Ala 36.31 36.14 L-Hty 45.71 45.63 L-Val 43.20 43.00 D-Lys 19.56 19.42 L-2-Amino-5-phenyl-pentanoic acid
55.25 54.57
Anabaenopeptin 872 Amino Acid
Retention time observed (mins)
Retention time Standard (mins)
L-Phe 50.76 50.48 N-Me-L-Ala 36.43 36.14 L-Hty 45.73 45.63 L-Val 43.30 43.00 D-Lys 19.79 19.42 L-2-Amino-5-hydroxyphenyl-pentanoic acid
N/A
N/A
Table 11. Retention times for hydrolysate of anabaenopeptin 856 and 872.

66
DISCUSSION
A total of four microcystins, two anabaenopeptins, and two micropeptins have been
isolated and characterized during this investigation of Microcystis aeruginosa and Planktothirix
rubescens. The chemical diversity of these isolates demonstrates the biosynthetic capability of
cyanobacteria to produce a variety of cyclic peptides and depsipeptides. In a five-year study
supported by the National Cancer Institute and Eli Lilly Research Laboratories, it was found that
the discovery rate within the cyanobacteria, for field-collected and laboratory grown cultures,
was about 7% (Carmichael, 1992). This is a value consistent with the discovery rates for other
microorganisms like the actinomycetes, but the rediscovery rate of bioactive compounds from
the cyanobacteria is much lower than the 95% rediscovery rate associated with the actinomycetes
(Carmichael, 1992).
These bioactive compounds, including toxic and allegedly non-toxic compounds pose a
greater threat than ever to human and environmental health due to the ever-increasing occurrence
of CHAB’s caused by anthropogenic eutrophication of rivers, lakes, and reservoirs (Hudnell et
al., 2008). The risk is so concerning that eight federal entities including NOAA, the Food and
Drug Administration, Department of Agriculture, Centers for Disease Control and Prevention,
Army Corps of Engineers, U.S. Geological Survey, National Institutes of Health, and the
National Institute of Environmental Health Sciences, as well as the University of North Carolina
Institute of Marine Sciences joined the Environmental Protection Agency in co-Sponsoring the
International Symposium on Cyanobacterial Harmful Algal Blooms (ISOC-HAB) in 2005. The
purpose of this inter-agency organization is to identify the research needed to reduce scientific
uncertainties and develop processes that will ultimately provide risk managers with cost effective
tools for preventing and mitigating the effects of CHABs (Hudnell et al., 2008).
67
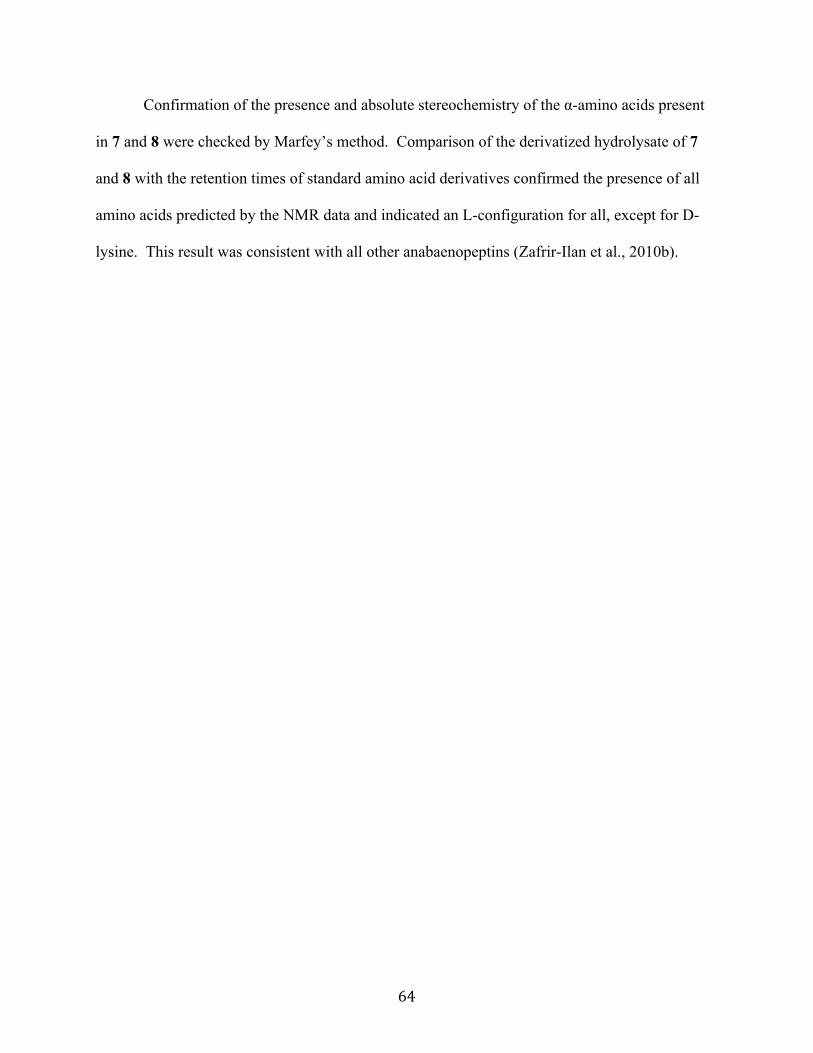
Through systematically addressing this issue, ISOC-HAB has identified seven major
topic areas that need to be addressed in future studies; (1) occurrence of CHABs, (2) analytical
methods, (3) causes, prevention, and mitigation, (4) human health effects, (5) cyanotoxin
characteristics, (6) ecosystem effects, and (7) risk assessment (Table 8). The work presented in
this thesis directly addresses the needs of two of these topics by outlining a general analytical
method to isolate cyclic peptides, and by describing several unusual cyanotoxins possessing
structural features that are either rare or have never been reported in such compounds.
The general analytical methods used throughout this study resulted in the successful
isolation and characterization of known and unusual cyclic peptides and depsipeptides from
laboratory cultures as well as naturally occurring blooms of cyanobacteria. This method
involves extraction of cyanobacterial cells with aqueous methanol (80%) before partitioning
against hexane, DCM, and BuOH. The cyclic peptide-like compounds of interest commonly
dissolve in the DCM and BuOH layers which are pooled and further separated by flash
chromatography followed by reversed phase C18 open column chromatography. The final
purification of all cyclic peptides was accomplished by reversed phase HPLC, using C18 columns
eluted with mixtures of ACN/H2O + 0.1% formic acid, and followed throughout the purification
by UV-LCMS analysis at every step.

68
Major Topic Subtopics Occurrence of CHABs • A US & World Overview
• The Florida Experience • The Nebraska Experience • The New York & Great Lake
Experience Analytical Methods • Sample Preparation
• Laboratory Methods • Field Methods • Emerging High Throughput
Analysis Causes, Prevention, & Mitigation of • Nutrients and Other Causes
• Global Climate Change • Watershed Management • Drinking Water Treatment
Human Health Effects • Laboratory Exposures • Environmental Exposures • Epidemiology
Cyanotoxin Characteristics • Types, Toxicokinetics & toxicodynamics
• Genomics & Proteomics • Bioterrorism Potential
Ecosystem Effects • Aquatic Vertebrates • Trophic Status & Ecological
Conditions Risk Assessment • Economic Impact
• Toxic Microbes & Mixtures • Human & Ecological Integration
Table 12. Seven major topic areas and 23 subtopics identified by ISOC-HAB.
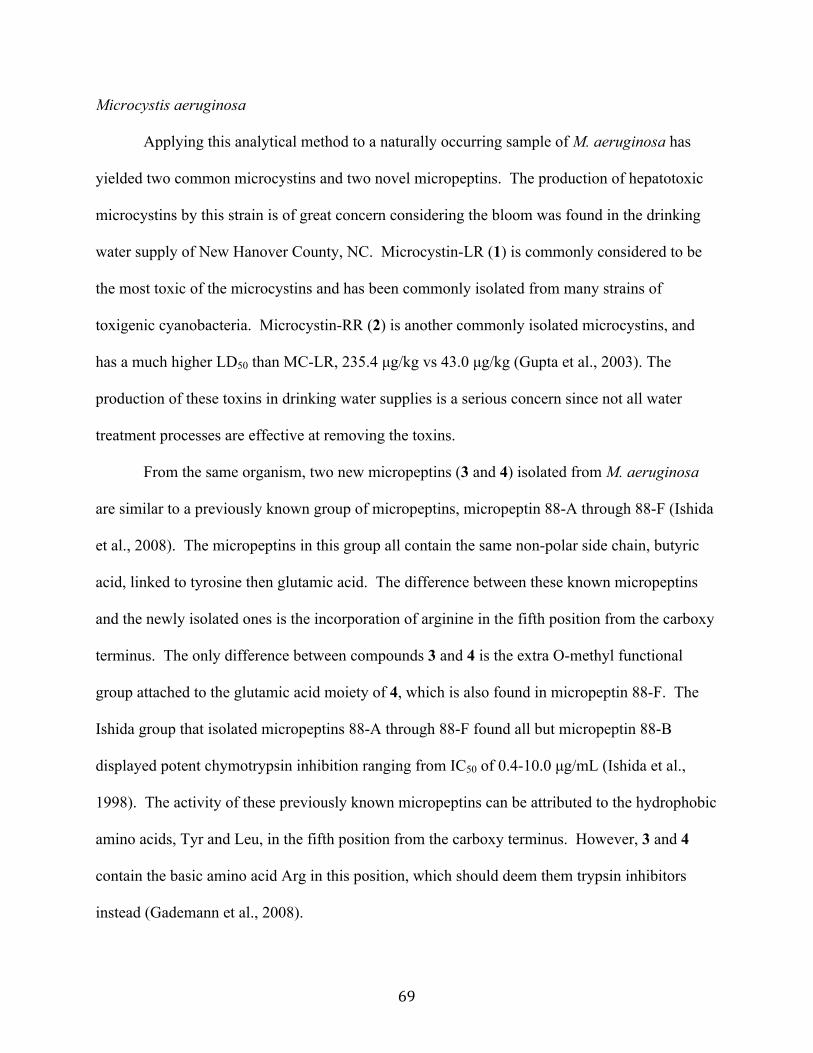
69
Microcystis aeruginosa
Applying this analytical method to a naturally occurring sample of M. aeruginosa has
yielded two common microcystins and two novel micropeptins. The production of hepatotoxic
microcystins by this strain is of great concern considering the bloom was found in the drinking
water supply of New Hanover County, NC. Microcystin-LR (1) is commonly considered to be
the most toxic of the microcystins and has been commonly isolated from many strains of
toxigenic cyanobacteria. Microcystin-RR (2) is another commonly isolated microcystins, and
has a much higher LD50 than MC-LR, 235.4 µg/kg vs 43.0 µg/kg (Gupta et al., 2003). The
production of these toxins in drinking water supplies is a serious concern since not all water
treatment processes are effective at removing the toxins.
From the same organism, two new micropeptins (3 and 4) isolated from M. aeruginosa
are similar to a previously known group of micropeptins, micropeptin 88-A through 88-F (Ishida
et al., 2008). The micropeptins in this group all contain the same non-polar side chain, butyric
acid, linked to tyrosine then glutamic acid. The difference between these known micropeptins
and the newly isolated ones is the incorporation of arginine in the fifth position from the carboxy
terminus. The only difference between compounds 3 and 4 is the extra O-methyl functional
group attached to the glutamic acid moiety of 4, which is also found in micropeptin 88-F. The
Ishida group that isolated micropeptins 88-A through 88-F found all but micropeptin 88-B
displayed potent chymotrypsin inhibition ranging from IC50 of 0.4-10.0 µg/mL (Ishida et al.,
1998). The activity of these previously known micropeptins can be attributed to the hydrophobic
amino acids, Tyr and Leu, in the fifth position from the carboxy terminus. However, 3 and 4
contain the basic amino acid Arg in this position, which should deem them trypsin inhibitors
instead (Gademann et al., 2008).
70
Planktothrix rubescens
Applying the general method described to extracts of Planktothrix rubescens
(UTCC507), four interesting cyclic peptides (5-8) were identified and unambiguously
characterized by NMR and confirmed by Marfey’s method.
The two microcystins isolated from this strain (5 and 6) were initially thought to be MC-
YR and MC-FR based on the primary LC/UV/MS data, however, the 1D and 2D NMR data
established 5 and 6 to actually be [D-Asp3, (E)-Dhb7] microcystin-HtyR and [D-Asp3, (E)-Dhb7]
microcystin-HphR, respectively. This observation underscores the need for full structural
characterization of metabolites using all the analytical techniques necessary including NMR,
rather than data based on preliminary LC/UV/MS analysis alone. There is speculation that this
may be a common occurrence and mis-identification of cyanotoxins pose a significant problem
when trying to assess the toxicity of a particular bloom or when attempting to identify a
causative agent within a toxic sample. It is accepted that an integral relationship exists between
the three-dimensional structure of a compound and the biological activity is may possess, though
the exact mode of action may be unknown. The actual structures of compounds 5 and 6 have
several variations from the structures of MC-YR and MC-FR. These include Dhb7 instead of
Mdha7, D-Asp3 instead of D-MeAsp3, and L-Hty/L-Hph instead of L-Tyr/L-Phe. Some of these
changes are more subtle than others and probably affect bioactivity accordingly.
In this regard, [D-Asp3, (E)-Dhb7] microcystin-HtyR (5) was originally isolated by Sano
and Kaya (1998) from a strain of Oscillatoria agardhii. Two forms of Dhb exist, Z and E, that
can easily be distinguished by the 1H shift of the olefinic quartet, 6.49 ppm vs. 5.73 ppm,
respectively (Sano et al., 1998), and the double bond configuration determined by ROESY and
NOESY data. Several of these Dhb containing microcystins have also been tested for bioactivity
71
by an intraperitoneal mouse bioassay where they showed an acute toxicity, sharing similar
characteristics to Mdha containing microcystin toxicity (Beattie et al., 1992).
[D-Asp3, (E)-Dhb7] Microcystin-HphR is a novel microcystin that contains the very
unusual amino acid, homophenylalanine. [Dha7] Microcystins-HphR is the only other
microcystin described to date that contains this rare amino acid and was simultaneously isolated
with a homotyrosine (Hty) congener mirroring the isolation of both congeners from UTCC 507
(Namikoshi et al., 1992). When Namikoshi tested these two MC’s in an intraperitoneal mouse
bioassay, death occurred within 1-3 hours. Considering MC’s containing Dhb, Hty and Hph
have all proven to be toxic individually, it is assumed that 5 and 6 isolated in this experiment are
also hepatotoxic.
The two novel anabaenopeptins (7 and 8) isolated from UTCC 507 are very similar to the
previously reported anabaenopeptin B (Figure 3). However, these new anabaenopeptins contain
a couple of very rare amino acids in place of the more common ureido linked arginine. These
two unusual amino acids were identified as 2-amino-5-phenyl-pentanoic acid and 2-amino-5-
hydroxyphenyl-pentanoic acid, found in 7 and 8, respectively. This is the first known example
of cyanobacteria using these unusual amino acids. In fact, the only compounds previously
known to contain these two amino acids are the alternarolides, isolated from the fungus
Alternaria mali (Okuno et al., 1975) and given the name alternamic acids. The alternarolides are
host specific phytotoxins that cause leaf-spot disease in various varieties of apples. There are
three congeners of alternarolides and each contains a different congener of alternamic acid.
72
CONCLUSION
In addition to the known toxins they produce, many unrelated families of cyclic peptides
are produced by toxigenic genera of cyanobacteria and may pose a risk to humans and animals
that come in contact with contaminated water. In this study, strains of M. aeruginosa and P.
rubescens were analyzed for the production of unusual peptides using a general procedure that
was developed in this laboratory. The M. aeruginosa strain was gathered from a natural bloom
that occurred in the Cape Fear river of North Carolina and found to produce two common
microcystins, MC-LR and MC-RR, as well as two novel micropeptins, characterized as
micropeptin 1106 and 1120. The P. rubescens strain (UTCC 507) was originally gathered
beneath the ice of a lake in Ontario and cultured in the lab under controlled environmental
conditions. From this strain, two unique microcystins were isolated, [D-Asp3, (E)-Dhb7]
microcystin-HtyR and [D-Asp3, (E)-Dhb7] microcystin-HphR, along with two novel
anabaenopeptins, named anabaenopeptin 856 and 872. These P. rubescens products were found
two contain several unique amino acids, namely 2-amino-5-phenyl-pentanoic acid, 2-amino-5-
hydroxyphenyl-pentanoic acid, homotyrosine and homophenylalanine. Detailed spectroscopic
analysis established the structure and connectivity of the amino acid components in all the
isolated peptides and the absolute stereochemistry of the peptides was confirmed by Marfey’s
method.
73
LITERATURE CITED Barco, M.; Flores, C.; et al. Determination of Microcystin Variants and Related Peptides Present
in a Water Bloom of Planktothrix rubescens in a Spanish Drinking Water Reservoir by LC/ESI-MS. Toxicon, 2004, 44, 881-886.
Bartram, J.; Carmichael, W. W.; Chorus, I.; Jones, G.; Skulberg, O. M. Introduction. In Toxic
Cyanobacteria in Water: A Guide to Their Public Health Consequences, Monitoring and Management; Chorus, I., Bartram, J., Eds.; World Health Organization: London, England, 1999; 1-14.
Beattie, K.; Kaya K.; Sano, T.; Codd, G. A. Three Dehydrobutyrine-Containing Microcystins
From Nostoc. Phytochemistry, 1998, 47 (7), 1289-1292. Blom, J.F.; Robinson, J.A.; Jüttner, F. High Grazer Toxicity of [D-Asp3,(E)-Dhb7]Microcystin-
RR of Planktothrix rubescens as Compared to Different Microcystins. Toxicon, 2001, 39, 1923-1932.
Carmichael, W. W. Cyanobacteria Secondary Metabolites- the Cyanotoxins. Journal of Applied
Bacteriology, 1992, 72, 445-459. Carmichael, W. W.; Falconer, I. R. Diseases Related to Freshwater Blue-green Algal Toxins, and
Control Measures. In Algal Toxins in Seafood and Drinking Water; Falconer, I. R., Ed.; Academic Press: San Diego, CA, 1993, 187-210.
Codd, G. A.; Lindsay, J.; Youg, F. M.; Morrison, L. F.; Metcalf, J. S. Harmful Cyanobacteria:
From Mass Mortalities to Management Measures. In Harmful Cyanobacteria; Huisman, J., Matthijs, H. C. P., Visser, P. M., Eds.; Springer: Dordrecht, The Netherlands, 2005a; 1-24.
Codd, G. A.; Morrison, L. F.; Metcalf, J. S. Cyanobacterial Toxins: Risk Management for Health
Protection. Toxicology and Applied Pharmacology, 2005b, 203, 264-272. Dismukes, G. C.; Klimov, V. V.; Barnov, S. V.; Kozlov, Y. N.; Dasgupta, J.; Tyryshkin, A. The
Origin of Atmospheric Oxygen on Earth: The Innovation of Oxygenic Photosynthesis. Porc. Natl. Acad. Sci., 2001, 98, 2170-2175.
Falconer, I.; Bartram, J.; Chorus, I.; Kuiper-Goodman, T.; Utkilen, H.; Burch, M.; Codd, G. A.
Safe Levels and Safe Practices. In Toxic Cyanobacteria in Water: A Guide to Their Public Health Consequences, Monitoring and Management; Chorus, I., Bartram, J., Eds.; World Health Organization: London, England, 1999; 155-178.
Fenical, W., Jenson, P. Developing a New Resource for Drug Discovery: Marine Actinomycete
Bacteria. Natural Chemical Biology, 2006, 2, 666-673.
74
Fristachi, A.; Sinclair, J. L. Occurrence of Cyanobacterial Harmful Algal Blooms Workgroup Report. In Cyanobacterial harmful Algal Blooms: State of the Science and Research Neeeds; Hudnell, H. K., Ed.; Springer Science + Business Media: New York, 2008; 45-104
Gademann, K.; Portmann, C. Secondary Metabolites From Cyanobacteria: Complex Structures
and Powerful Bioactivities. Current Organic Chemistry, 2008, 12, 326-341. Grach-Pogrebinsky, O.; Sedmak, B.; Carmeli, S. Seco[D-Asp3] Microcysin-RR and [D-Asp, D-
Glu(OMe)6] Microcystin-RR, Two New Microcystins From a Toxic Water Bloom of the Cyanobacterium Planktothrix rubescens. J. Nar. Prod., 2008, 67, 337-342.
Gupta, S.C.N.; Vijayaraghavan, P.R.; Lakshmana Rao, P.V. Comparative Toxicology evaluation
of Cyanobacterial Cyclic Peptide Toxin Microcystin Variants (LR, RR, YR) in Mice. Toxicology, 2003, 188, 285-296.
Hoeger S. J.; Schmid, D.; Blom, J. F.; Ernst, B.; Dietrich, D. R. Analytical and Functional
Characterization of Microcystins [Asp3] MC-RR and [Asp3, Dhb7] MC-RR: Consequences for Risk Assessment. Environ. Sci. Technol., 2007, 41, 2609-2616.
Hudnell, H. K.; Dortch, Q.; Zenick, H. An Overview of the Interagency, International
Symposium on Cyanobacterial Harmful Algal Blooms (ISOC-HAB): Advancing the Scientific Understanding of Freshwater Harmful Algal Blooms. In Cyanobacterial harmful Algal Blooms: State of the Science and Research Neeeds; Hudnell, H. K., Ed.; Springer Science + Business Media: New York, 2008; 45-104.
Ishida, K.; Matsuda, H.; Murakami, M. Micropeptins 88-A to 88-F, Chymotrypsin Inhibitors
from the Cyanobacterium Microcystis aeruginosa. Tetrahedron, 1998, 54, 5545-5556. Llano, D. G.; Herraiz, T.; Polo, M. C. Peptides. In Handbook of Food Analysis: Physical
Characterization and Nutrient Analysis; Nollet, L. M. L., Ed.; Marcel Dekker: Basel, Switzerland, 2004; 125-167.
Mur, L. C.; Skulberg, O. M.; Utkilen, H. Cyanobacteria in the Environment. In Toxic
Cyanobacteria in Water: A Guide to Their Public Health Consequences, Monitoring and Management; Chorus, I., Bartram, J., Eds.; World Health Organization: London, England, 1999; 15-40.
Namikoshi, M.; Rinehart, K.; Sakai, R. Identification of 12 Hepatotoxins from a Homer Lake
Bloom of the Cyanobacteria Microcystis aeruginosa, Microcystis viridis, and Microcystis wesenbergii: Nine New Microcystins. J. Org. Chem., 1992a, 57 (3), 866-870.
Namikoshi, M.; Sivonen, K.; Evans, W. R.; Carmichael, W. W.; Rouhiainen, L.; Luukkainen, R.;
Rinehardt, K. Structures of Three New Homotyrosine-Containing Microcystins and a New Homophenylalanine Variant from Anabaena sp. Strain 66. Chem. Res. Toxicol., 1992b, 5, 661-666.

75
Nishiwaki-Matsushima, R.; Nishiwaki, S.; Ohta, T.; Yoshizawa, S.; Suganuma, M.; Harada, K.; Watanabe, M. F.; Fujiki, H. Structure-Function Relationships of Microcysitns, Liver Tumor Promoters, in Interaction with Protein Phosphatase, Jpn. J. Cancer Res., 1991, 82, 993-996.
Okumura, H. S.; Philmus, B.; Portmann, C.; Hemscheidt, T. K. Homotyrosine-Containing
Cyanopeptolins 880 and 960 and Anabaenopeptins 908 and 915 from Planktothrix agardhii CYA 126/8. J. Nat. Prod., 2009, 72, 172-176.
Okuno, T.; Ishita, A.; Sugawara, Y.; Sawai, M. K.; Matsumoto, T. Structure of the Biological
Active Cyclopeptides Produced by Alternaria mali Roberts. Tetrahedron Letters, 1975, 5, 335-336.
Rogers, E. D.; Henry, T. B.; Twiner, M. J.; Gouffon, J. S.; McPherson, J. T.; Boyer, G. L.;
Saylor, G. S.; Wilhelm, S. W. Global Gene Expression Profiling in Larval Zebrafish Exposed to Microcystin-LR and Microcystis Reveals Endocrine Disrupting Effects of Cyanobacteria. Environmental Science and Technology, 2011, 45 (5), 1962-1969.
Sano, T.; Beattie, K. A.; Codd, G. A.; Kaya, K. Two (Z)-Dehydrobutyrine-Containing
Microcystins from a Hepatotoxic Bloom of Oscillatoria agardhii from Soulseat Loch, Scotland. J. Nat. Prod., 1998a, 61, 851-853.
Sano, T.; kaya, K. Two New (E)-2-Amino-2-Butenoic Acid (Dhb)-Containing Microcystins
Isolated from Oscillatoria agardhii. Tetrahedron, 1998b, 54 (3-4), 463-470. Sano, T.; Usui, T.; Ueda, K.; Osada, H,; Kaya, K. Isolation of New Protein Phosphatase
Inhibitors From Two Cyanobacteria Species, Plantkothrix spp. Journal of Natural Products, 2001, 64, 1052-1055.
Sedmak, B.; Elersěk, T.; Grach-Pogrebinsky, Olga.,; Carmeli, S.; Sever, N.; Lah, T. T.
Ecotoxicologically relevant cyclic peptides from cyanobacterial bloom (Planktothrix rubescens) – A threat to human environmental health. Radiol. Oncol., 2008, 42 (2), 102-113.
Ueno, T.; Nakashima, T.; Hayashi, Y.; Fukami, H. Isolation and structure of AM-toxin III, A
host specific phytotoxic metabolite produced by Alternaria mali. Agr. Biol. Chem., 1975a, 39 (10), 2081-2082.
Ueno, T.; Nakashima, T.; Hayashi, Y.; Fukami, H. Structures of AM-toxin I and II, Host Specific
Phytotoxic Metabolites Produced by Alternaria mali. Agr. Biol. Chem., 1975b, 39 (5), 1115-1122.
Welker, M.; Brunke, M.; Preussel, K.; Lippert, I.; Von Döhren, H. Diversity and Distribution of
Microcystis (Cyanobacteria) Oligopeptide Chemotypes from Natural Communities Studied by Single-Colony Mass Spectrometry. Microbiology, 2004, 150, 1785-1796.
76
Welker, M.; Von Döhren, H. Cyanobacterial Peptides – Nature’s Own Combinatorial Biosynthesis. FEMS Microbiol. Rev., 2006, 30, 530-563.
Wiegand, C.; Pflugmacher, S. Ecotoxicological Effects of Selected Cyanobacterial Secondary
Metabolites a Short Review. Toxicology and Applied Pharmacology, 2005, 203, 201-218. World Health Organization. Guidelines for Drinking-water Quality, 2nd ed.; Geneva,
Switzerland, 1993. Yamaki, H.; Sitachitta, N.; Sano, T.; Kaya, K. Two New Chymotrypsin Inhibitors Isolated From
the Cyanobacterium Microcystis aeruginosa NIES-88. J. Nat. Prod., 2005, 68, 14-18. Zafrir-Ilan, E.; Carmeli, S. Eight Novel Serine Proteases Inhibitors From a Water Bloom of the
Cyanobacterium Microcystis sp. Tetrahedron, 2010a, 66, 9194-9202. Zafrir-Ilan, E.; Carmeli, S. Micropeptins From an Israeli Fishpond Water Bloom of the
Cyanobacterium Microcystis sp. J. Nat. Prod, 2010b, 73, 352-358.
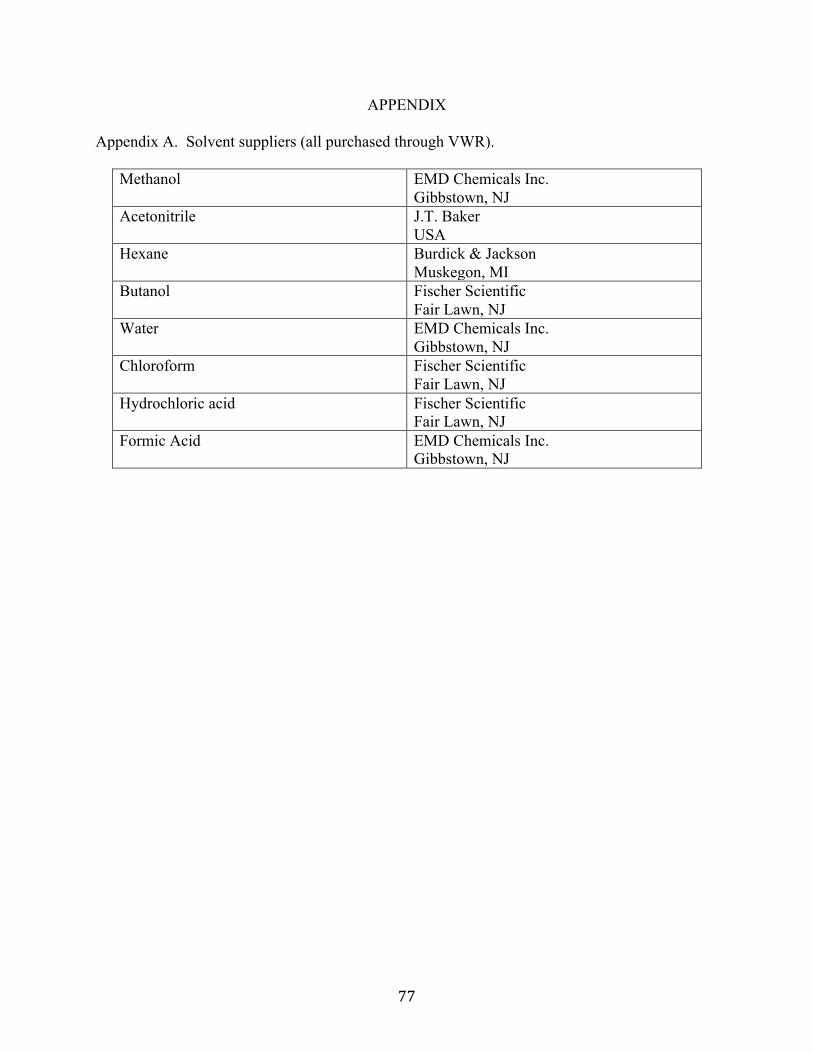
77
APPENDIX Appendix A. Solvent suppliers (all purchased through VWR).
Methanol EMD Chemicals Inc. Gibbstown, NJ
Acetonitrile J.T. Baker USA
Hexane Burdick & Jackson Muskegon, MI
Butanol Fischer Scientific Fair Lawn, NJ
Water EMD Chemicals Inc. Gibbstown, NJ
Chloroform Fischer Scientific Fair Lawn, NJ
Hydrochloric acid Fischer Scientific Fair Lawn, NJ
Formic Acid EMD Chemicals Inc. Gibbstown, NJ

78
Appendix B. Recipe for BG11 growth medium.
Stock Formula Stock Soln mL/L Sodium Nitrate NaNO3 75g/500mL 10mL Potassium Phosphate Dibasic K2HPO4�3H2O 8.0g/200mL 1 mL Magnesium Sulfate MgSO4�7H2O 15.0g/200mL 1 mL Calcium Chloride CaCl2�2H2O 7.2g/200mL 1 mL Citric Acid with 1.2g/200mL 0.5 mL Ferric Ammonium Citrate 1.2g/200mL 0.5 mL EDTA 0.20g/200mL 1 mL Sodium Carbonate Na2.CO3 4.0g/200mL 1 mL Trace Metal Soln See below 1 mL Trace Metal Solution From Rippka Makes 1 Liter Boric Acid H2BO3 2.86g Manganous Chloride MnCl2�4H20 1.81g Zinc Sulfate ZnSO4�7H2O 0.22g Sodium Molybdate Dihydro Na2MoO4�2H2O 0.39g Cupric Sulfate CuSO4�5H2O 0.08g Cobalt Nitrate Co(NO3)2�6H2O 0.05g
Note: Dissolve each of the above substances separately prior to adding the next on the list. Reference: Rippka, R.; Deruelles, J.; Waterbury, J.; Herdman, M.; Stonier, R. Generic Assignments, Strain Histories and Properties of Pure Cultures of Cyanobacteria. J. Gen. Microbiol., 1979, 111, 1-61.

79
Appendix C. 1H NMR spectrum of microcystin-LR in DMSO-d6.
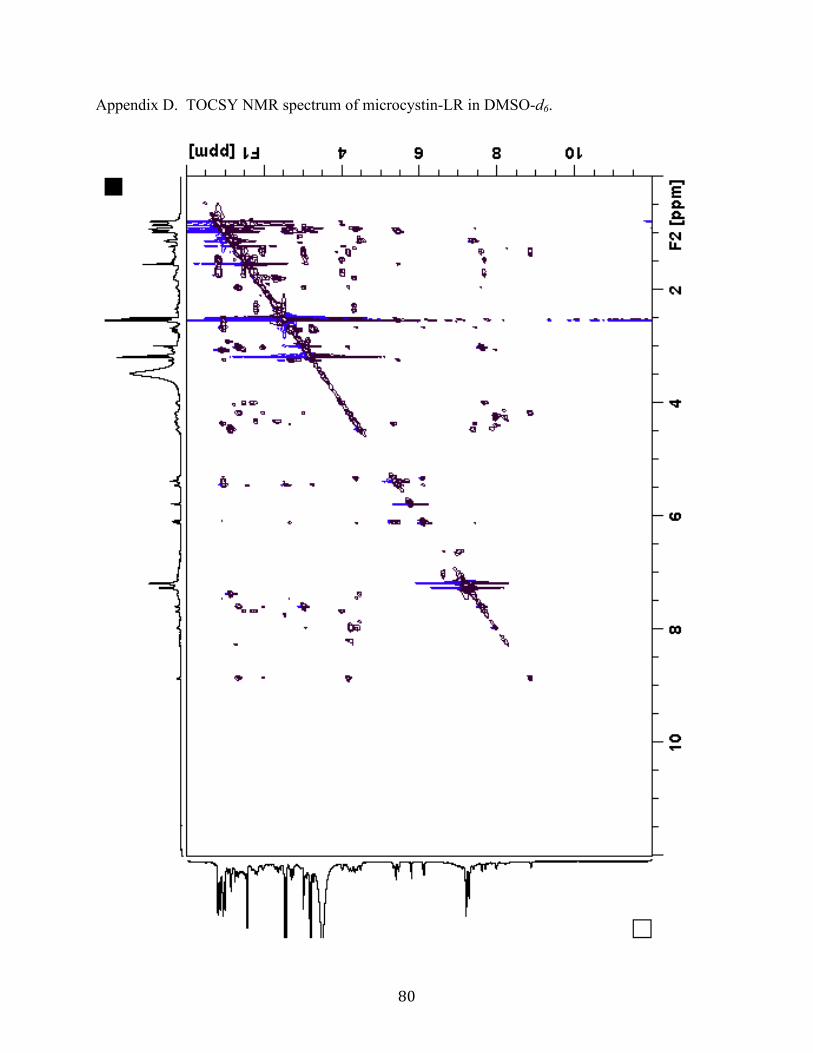
80
Appendix D. TOCSY NMR spectrum of microcystin-LR in DMSO-d6.
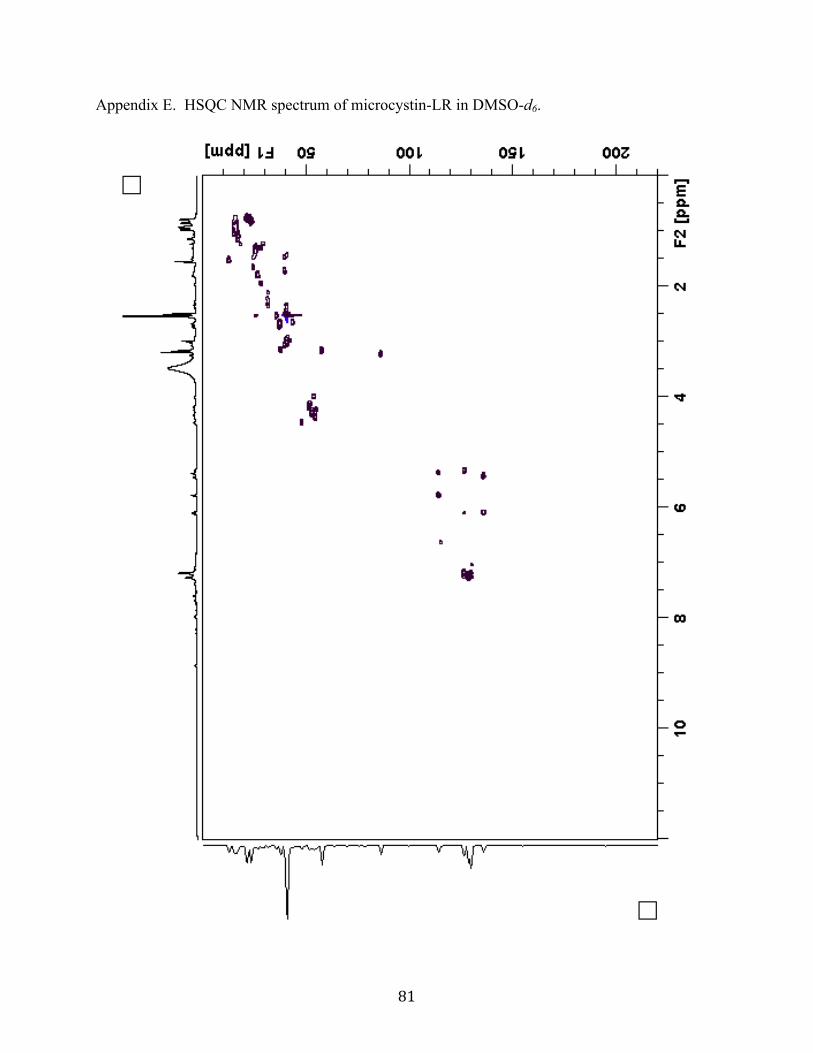
81
Appendix E. HSQC NMR spectrum of microcystin-LR in DMSO-d6.
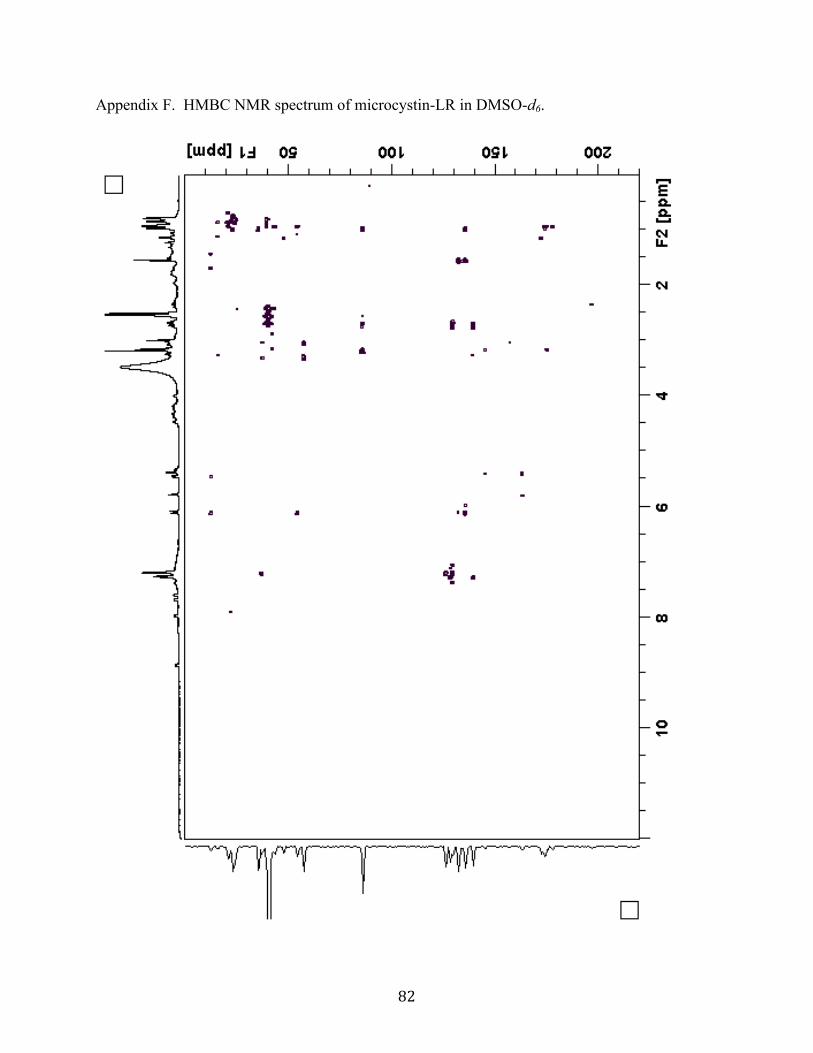
82
Appendix F. HMBC NMR spectrum of microcystin-LR in DMSO-d6.

83
Appendix G. 1H NMR spectrum of microcystin-RR in DMSO-d6.
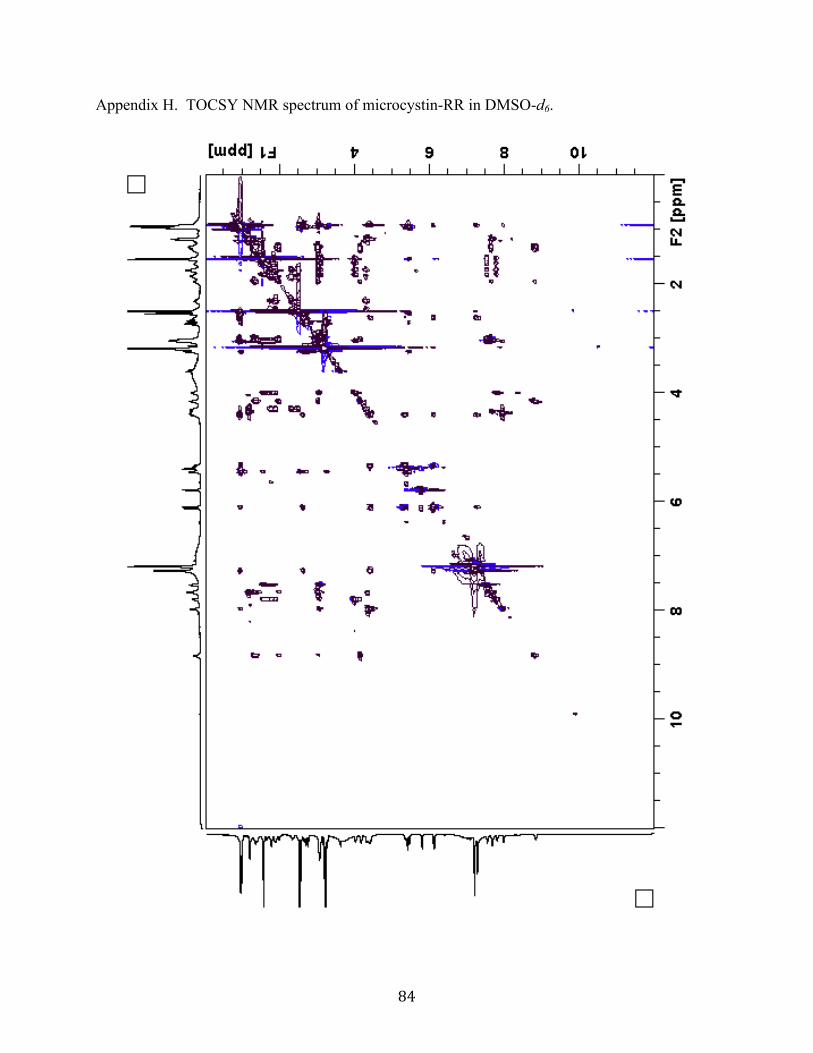
84
Appendix H. TOCSY NMR spectrum of microcystin-RR in DMSO-d6.
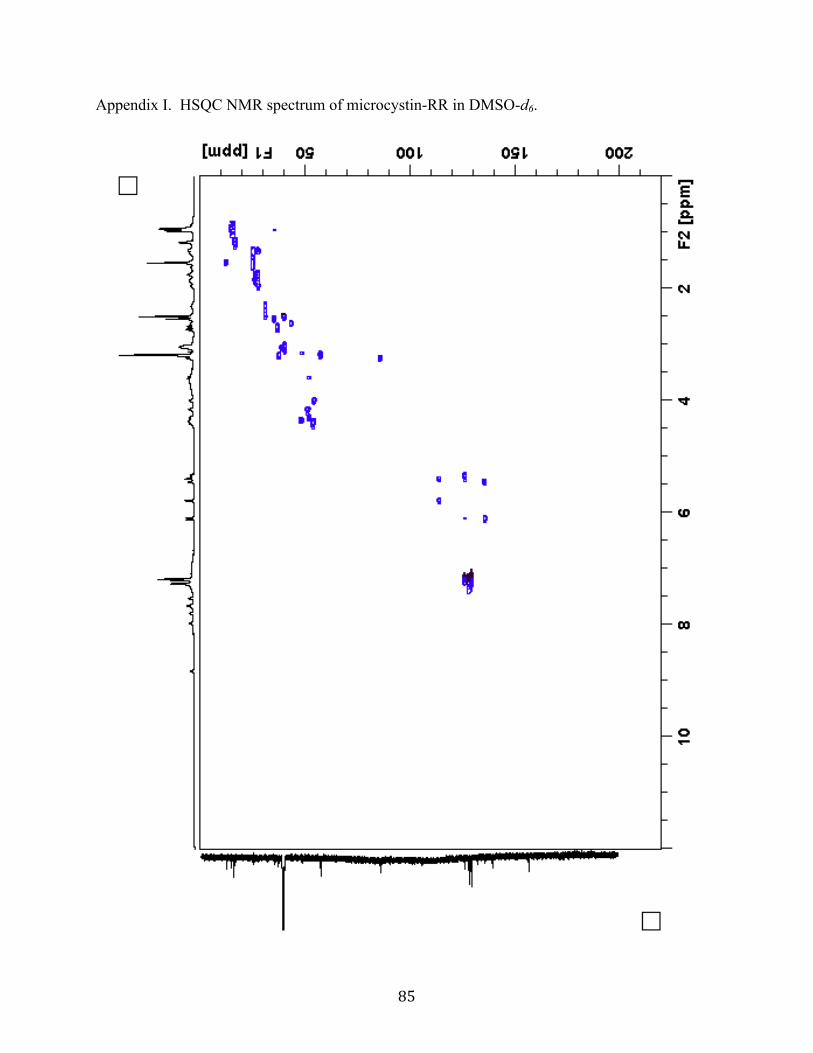
85
Appendix I. HSQC NMR spectrum of microcystin-RR in DMSO-d6.
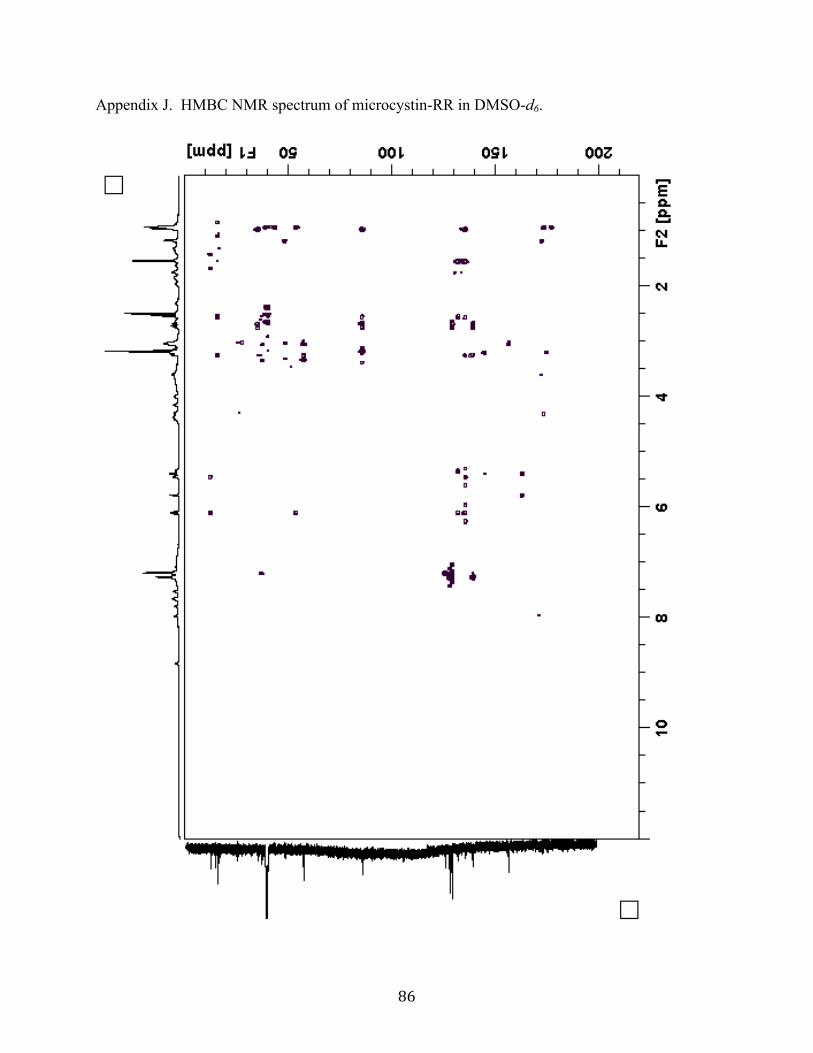
86
Appendix J. HMBC NMR spectrum of microcystin-RR in DMSO-d6.
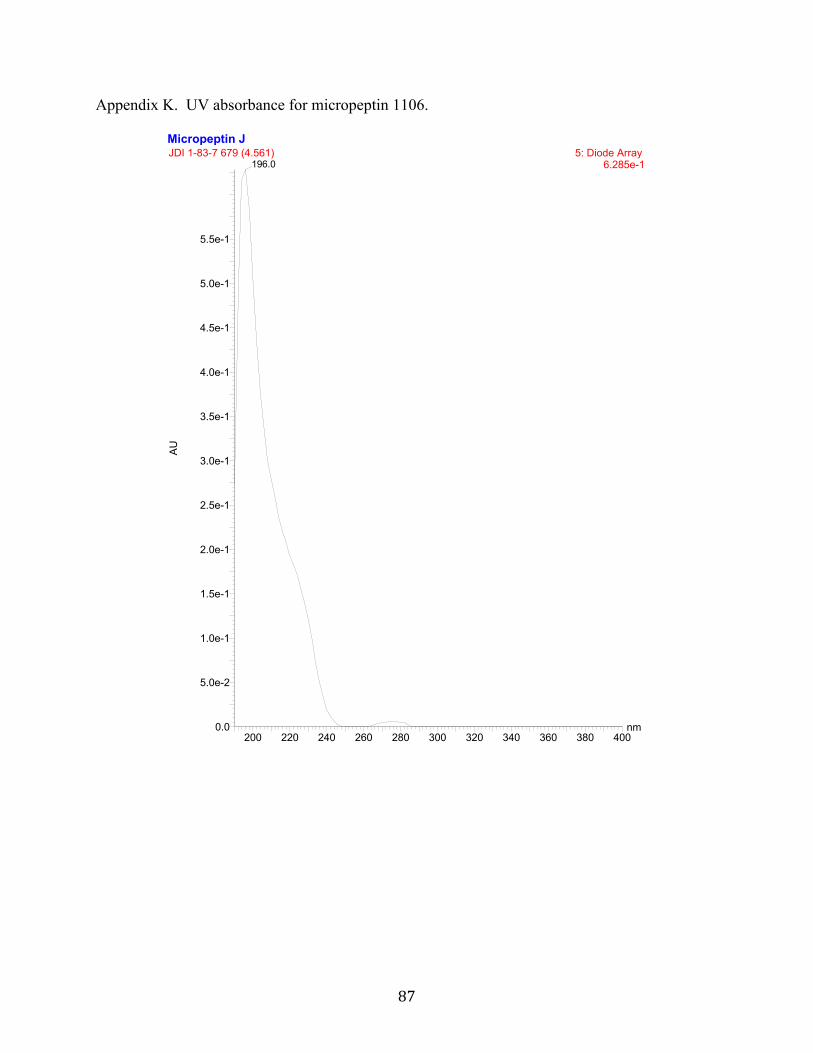
87
Appendix K. UV absorbance for micropeptin 1106.
Micropeptin J
nm200 220 240 260 280 300 320 340 360 380 400
AU
0.0
5.0e-2
1.0e-1
1.5e-1
2.0e-1
2.5e-1
3.0e-1
3.5e-1
4.0e-1
4.5e-1
5.0e-1
5.5e-1
JDI 1-83-7 679 (4.561) 5: Diode Array 6.285e-1196.0
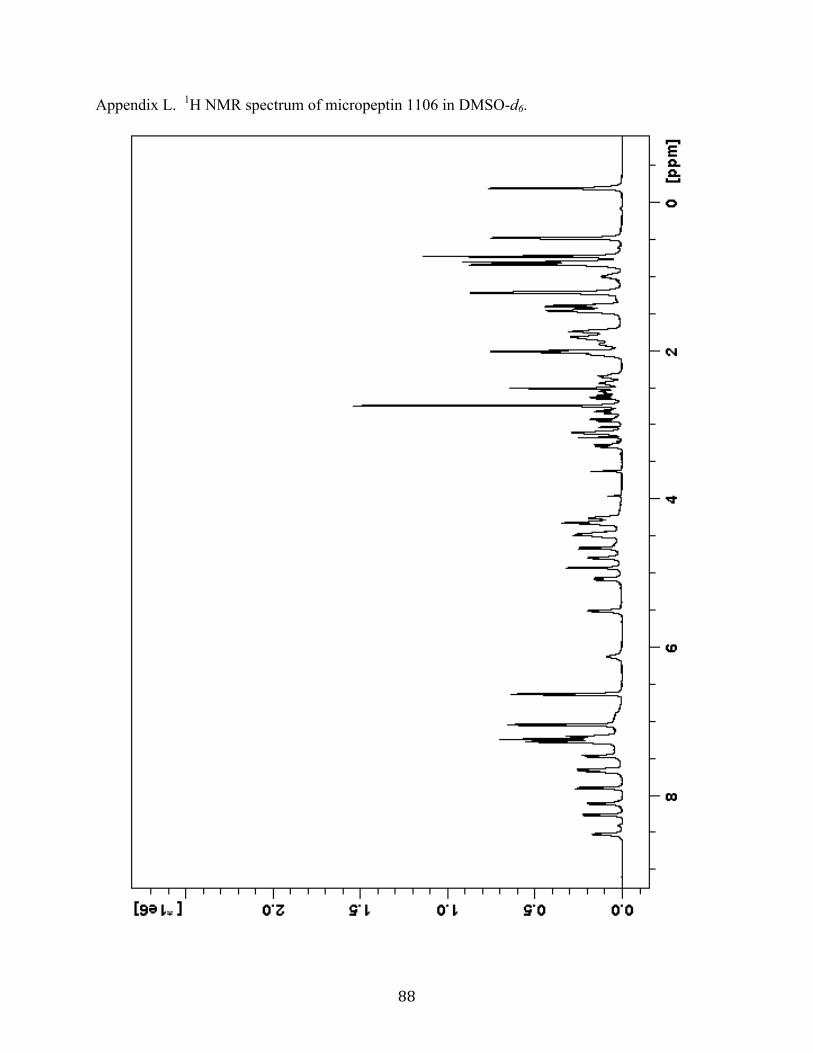
88
Appendix L. 1H NMR spectrum of micropeptin 1106 in DMSO-d6.
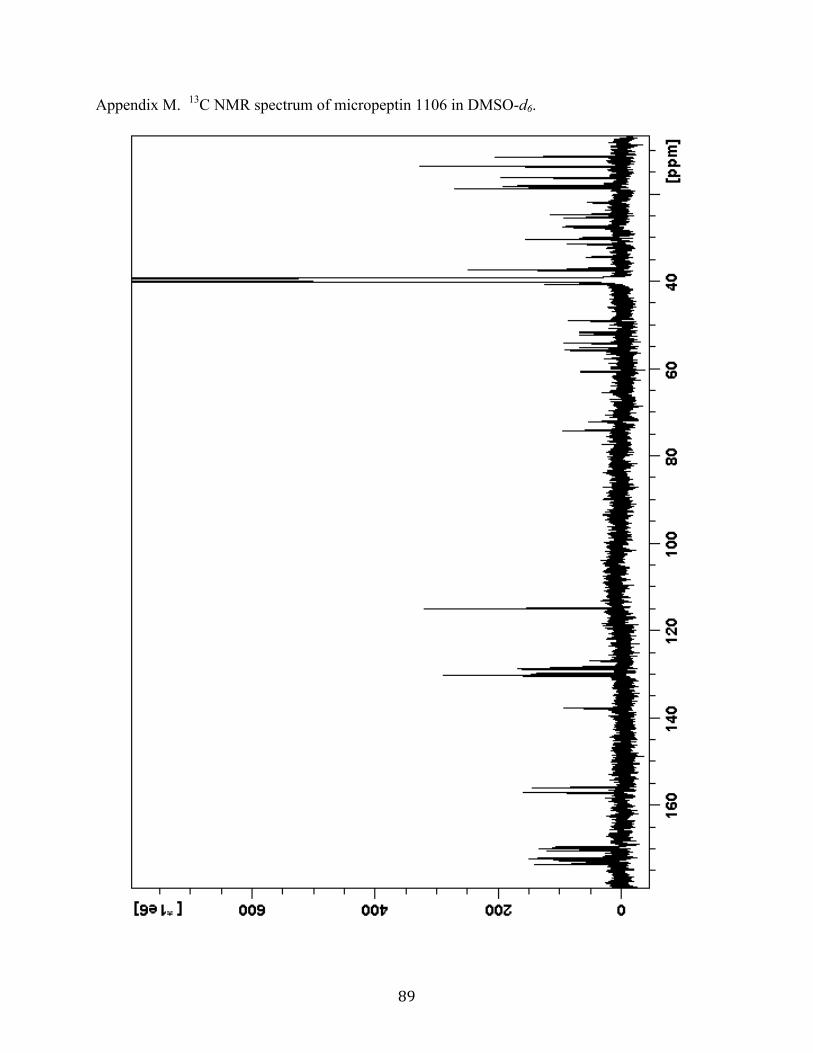
89
Appendix M. 13C NMR spectrum of micropeptin 1106 in DMSO-d6.

90
Appendix N. DEPT-135 NMR spectrum of micropeptin 1106 in DMSO-d6.
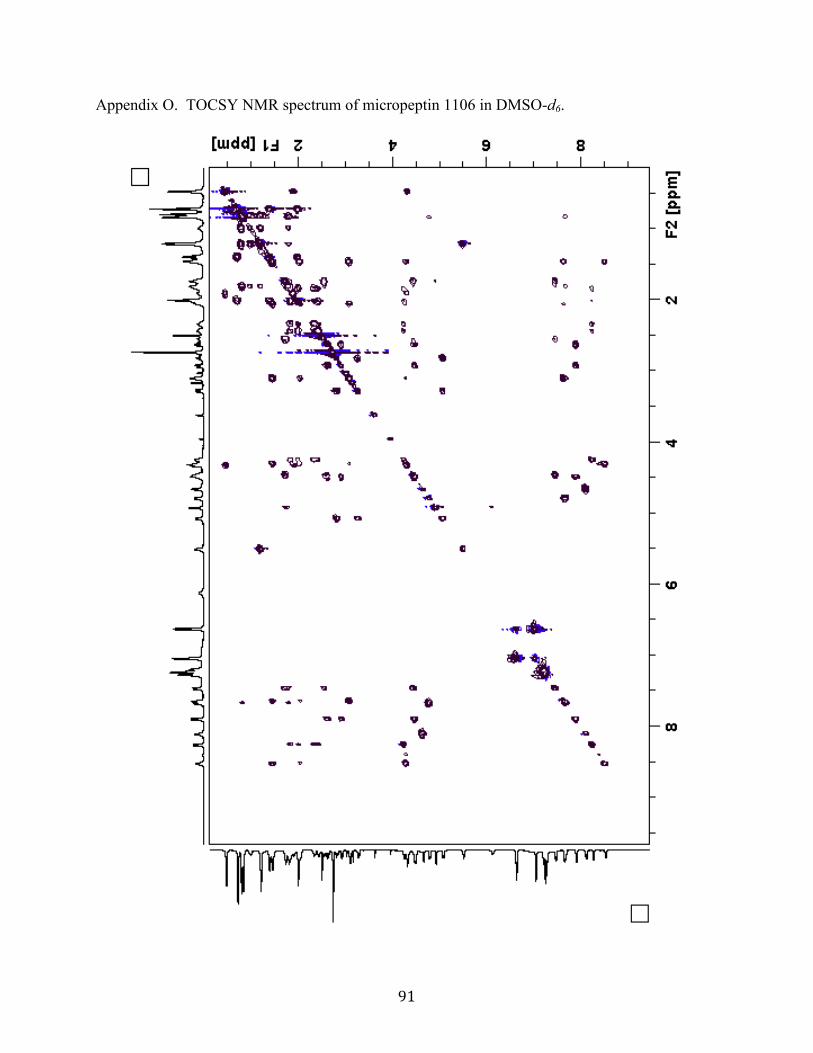
91
Appendix O. TOCSY NMR spectrum of micropeptin 1106 in DMSO-d6.
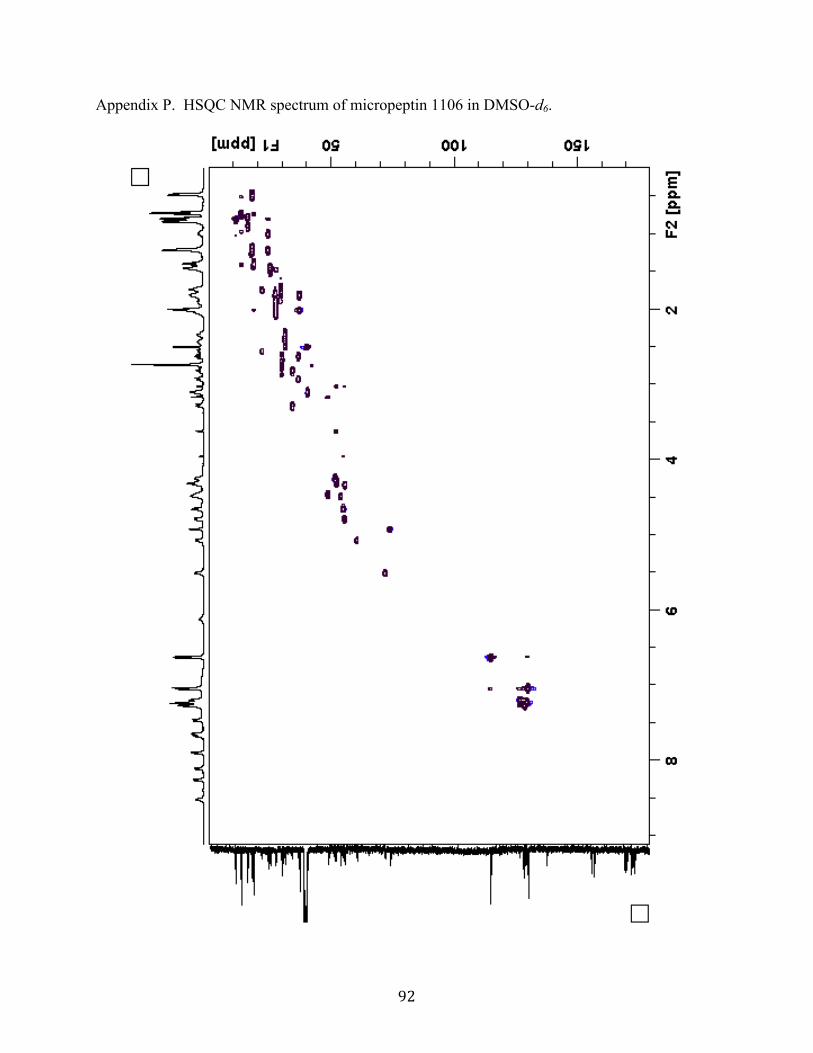
92
Appendix P. HSQC NMR spectrum of micropeptin 1106 in DMSO-d6.
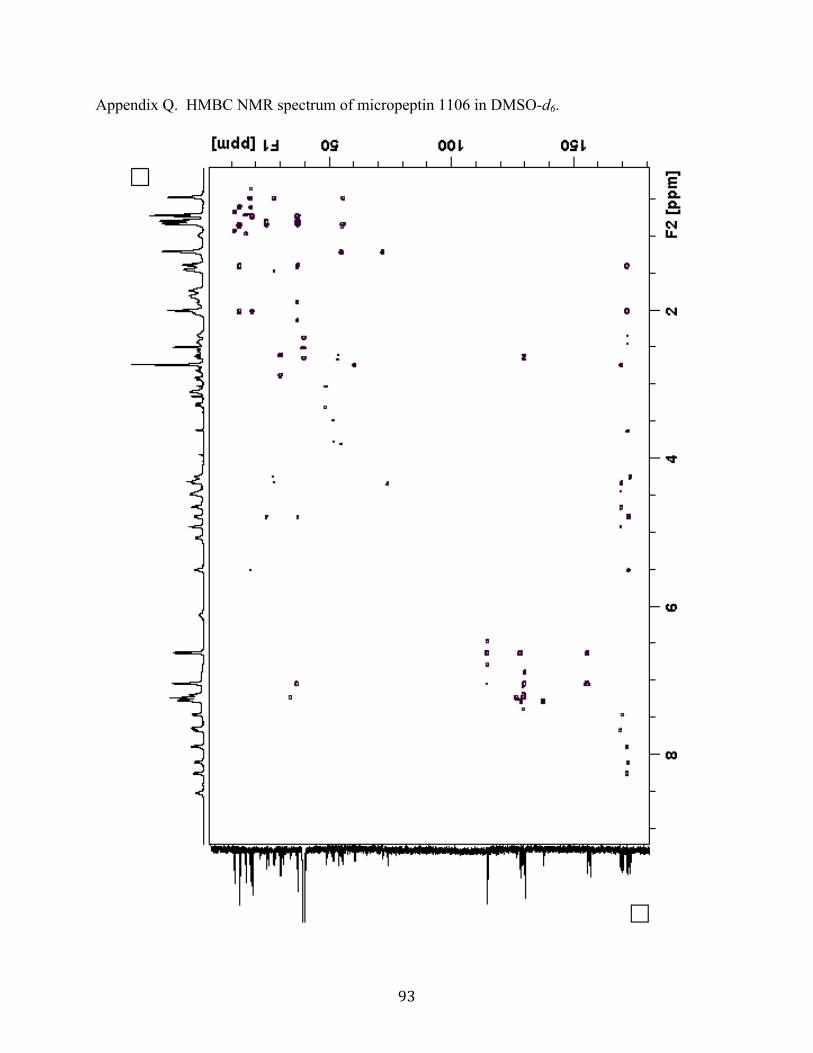
93
Appendix Q. HMBC NMR spectrum of micropeptin 1106 in DMSO-d6.
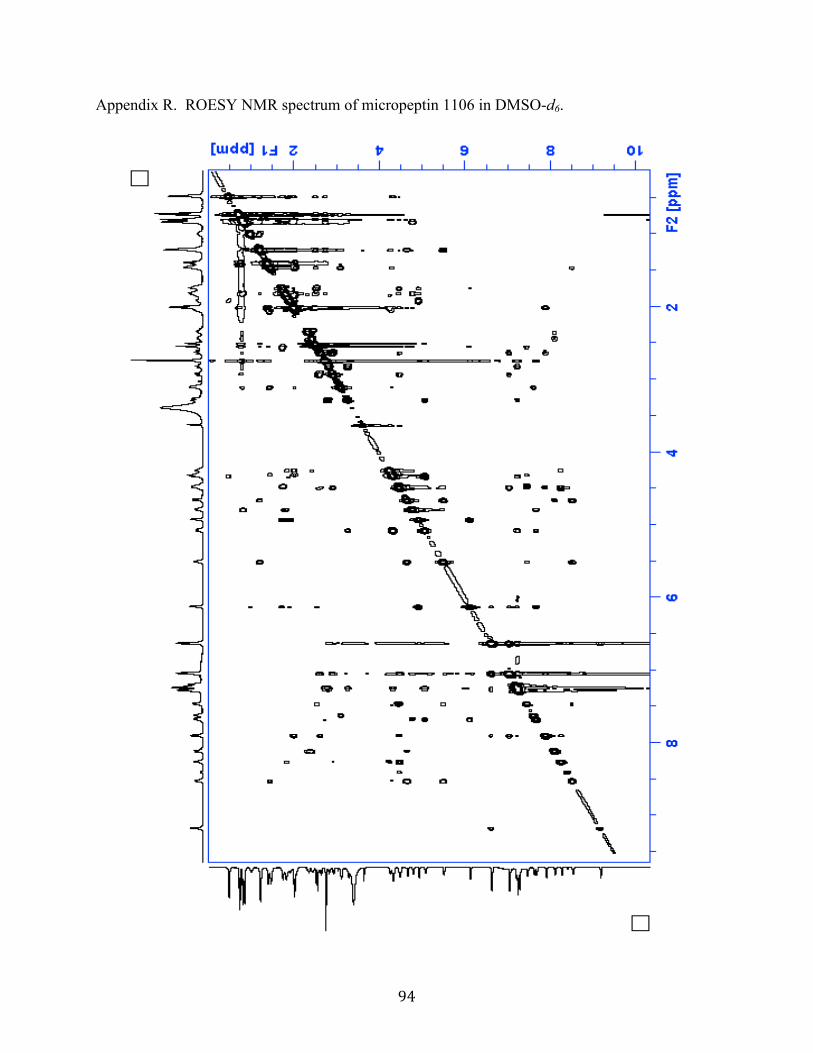
94
Appendix R. ROESY NMR spectrum of micropeptin 1106 in DMSO-d6.
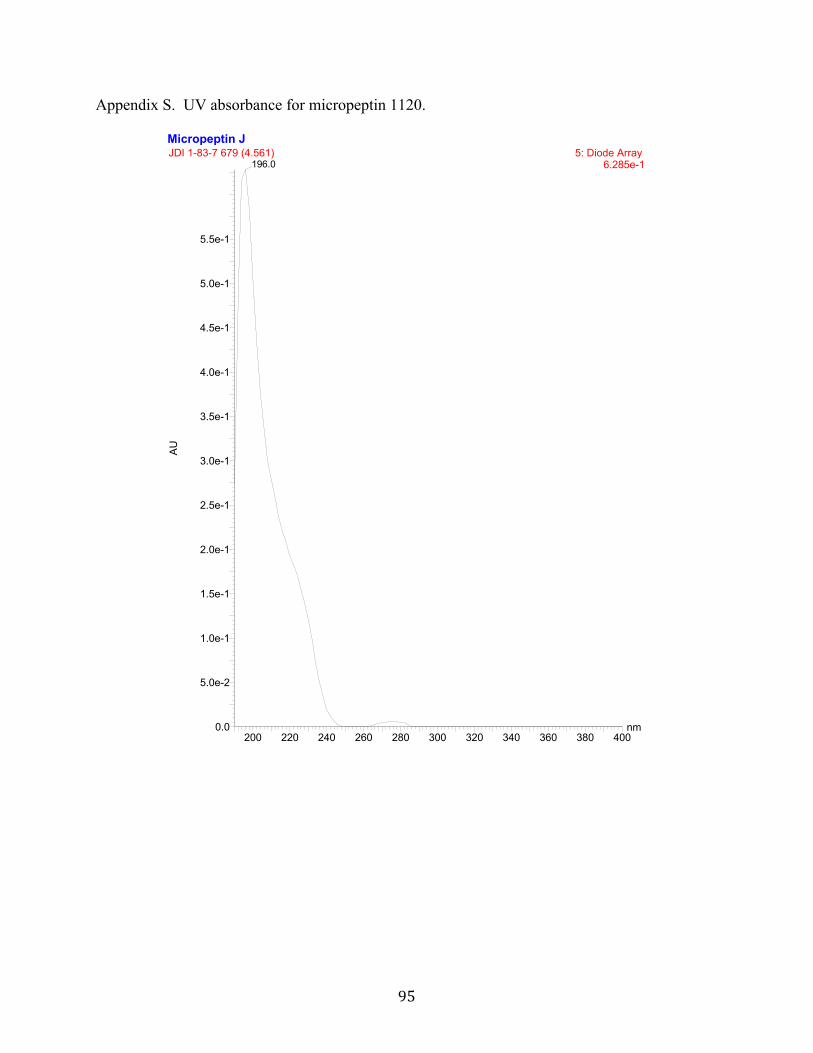
95
Appendix S. UV absorbance for micropeptin 1120.
Micropeptin J
nm200 220 240 260 280 300 320 340 360 380 400
AU
0.0
5.0e-2
1.0e-1
1.5e-1
2.0e-1
2.5e-1
3.0e-1
3.5e-1
4.0e-1
4.5e-1
5.0e-1
5.5e-1
JDI 1-83-7 679 (4.561) 5: Diode Array 6.285e-1196.0
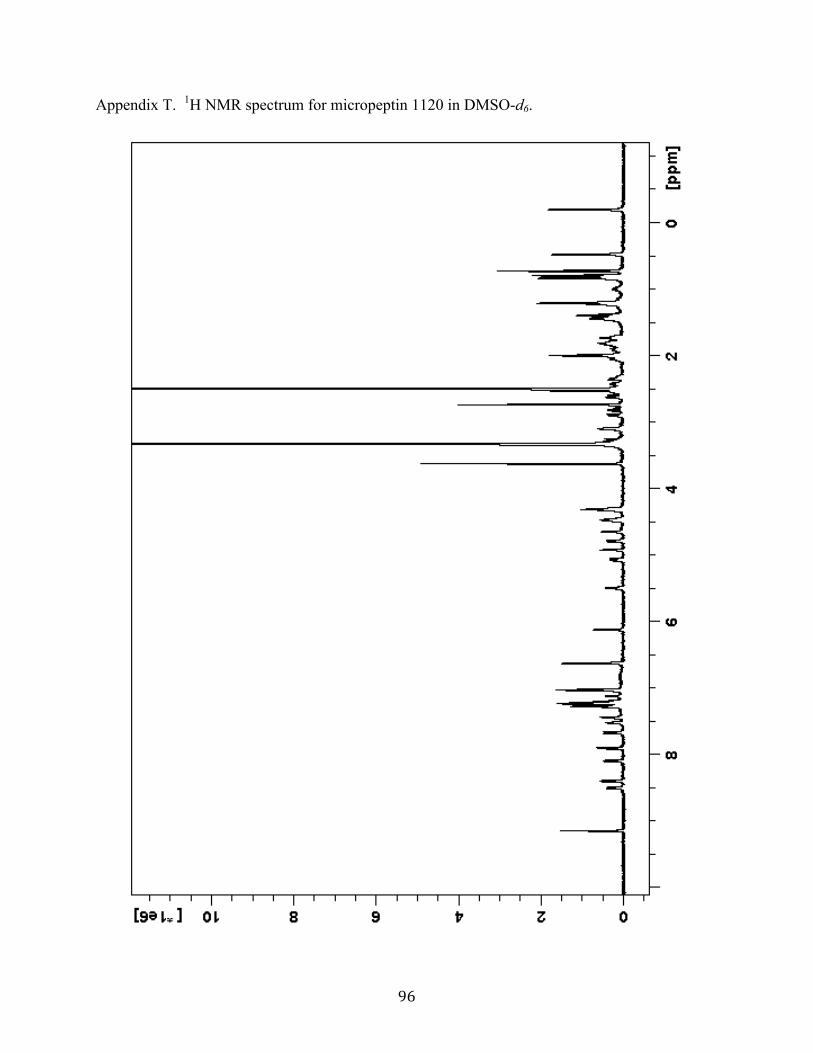
96
Appendix T. 1H NMR spectrum for micropeptin 1120 in DMSO-d6.
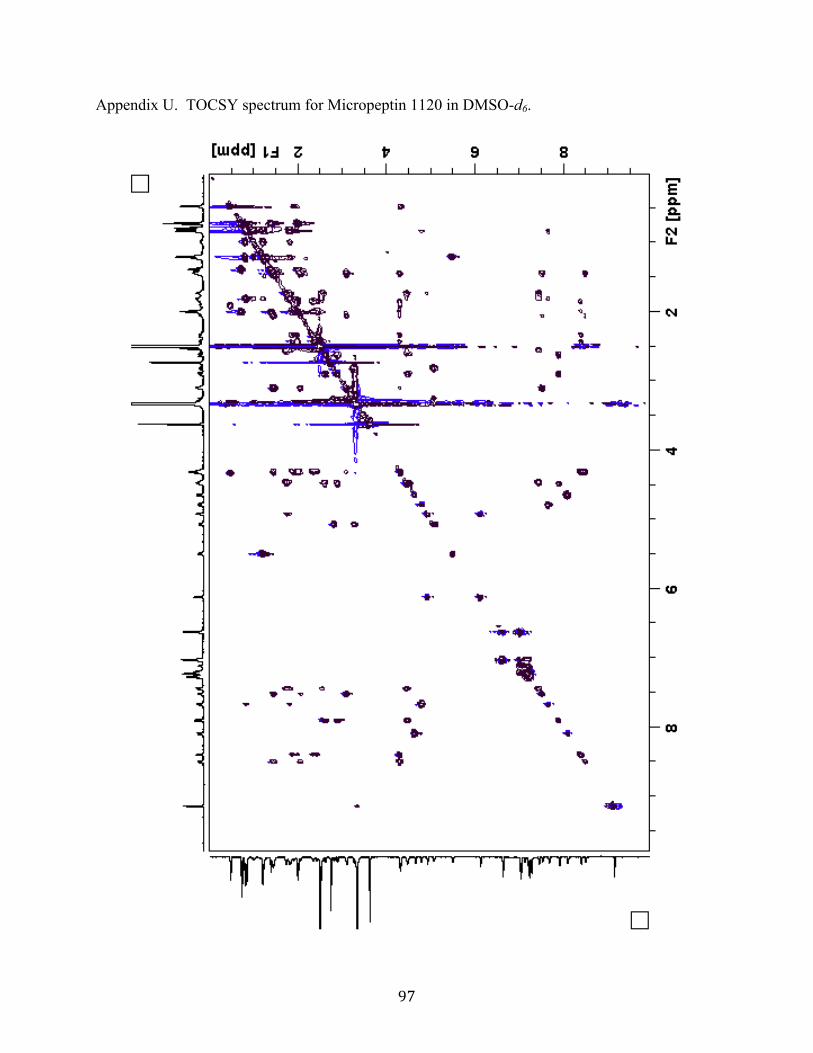
97
Appendix U. TOCSY spectrum for Micropeptin 1120 in DMSO-d6.
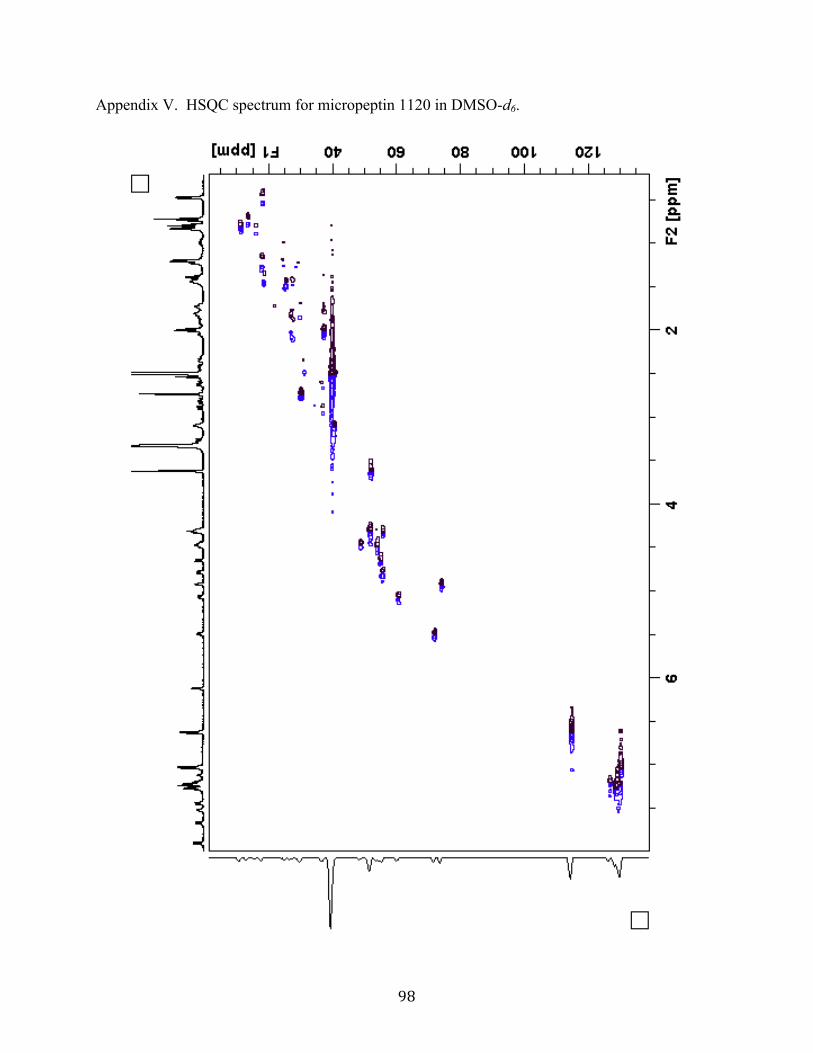
98
Appendix V. HSQC spectrum for micropeptin 1120 in DMSO-d6.
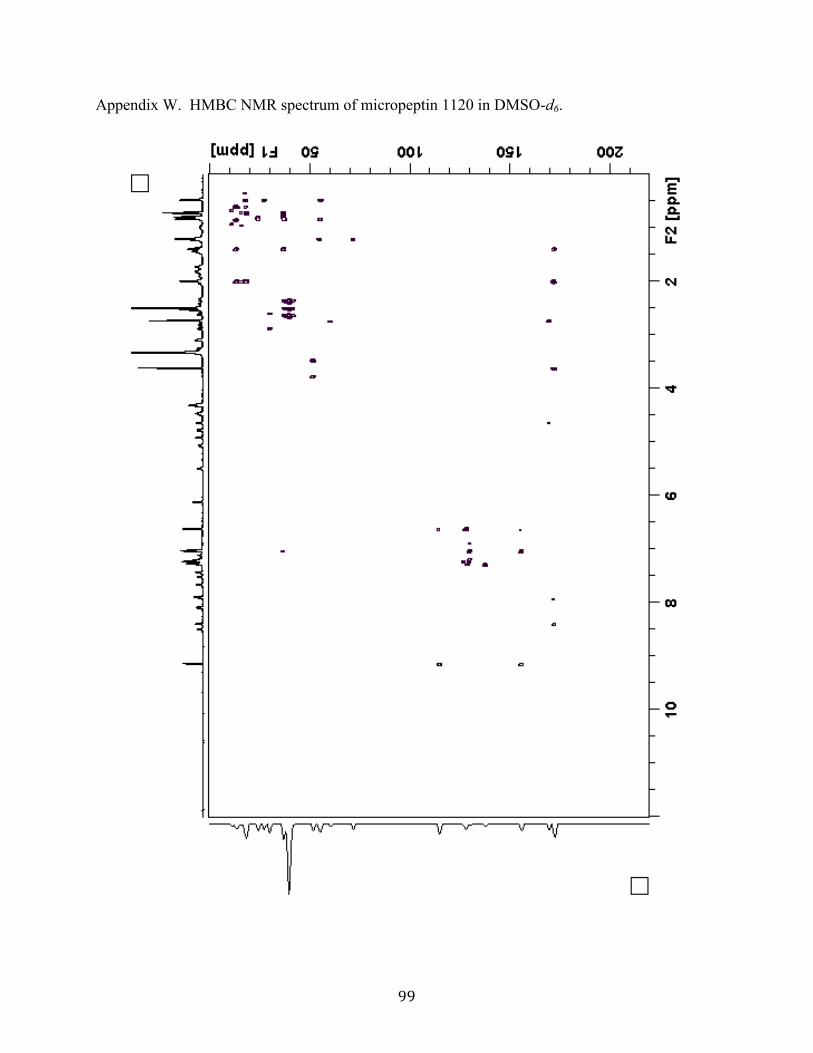
99
Appendix W. HMBC NMR spectrum of micropeptin 1120 in DMSO-d6.
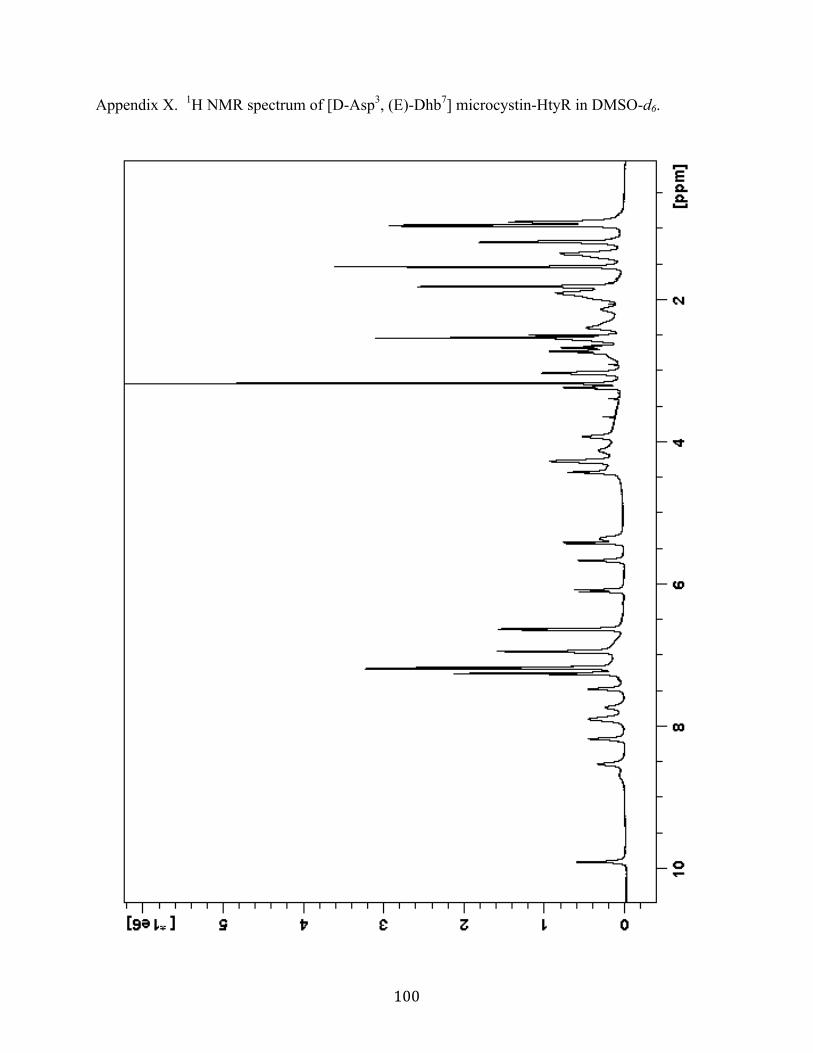
100
Appendix X. 1H NMR spectrum of [D-Asp3, (E)-Dhb7] microcystin-HtyR in DMSO-d6.
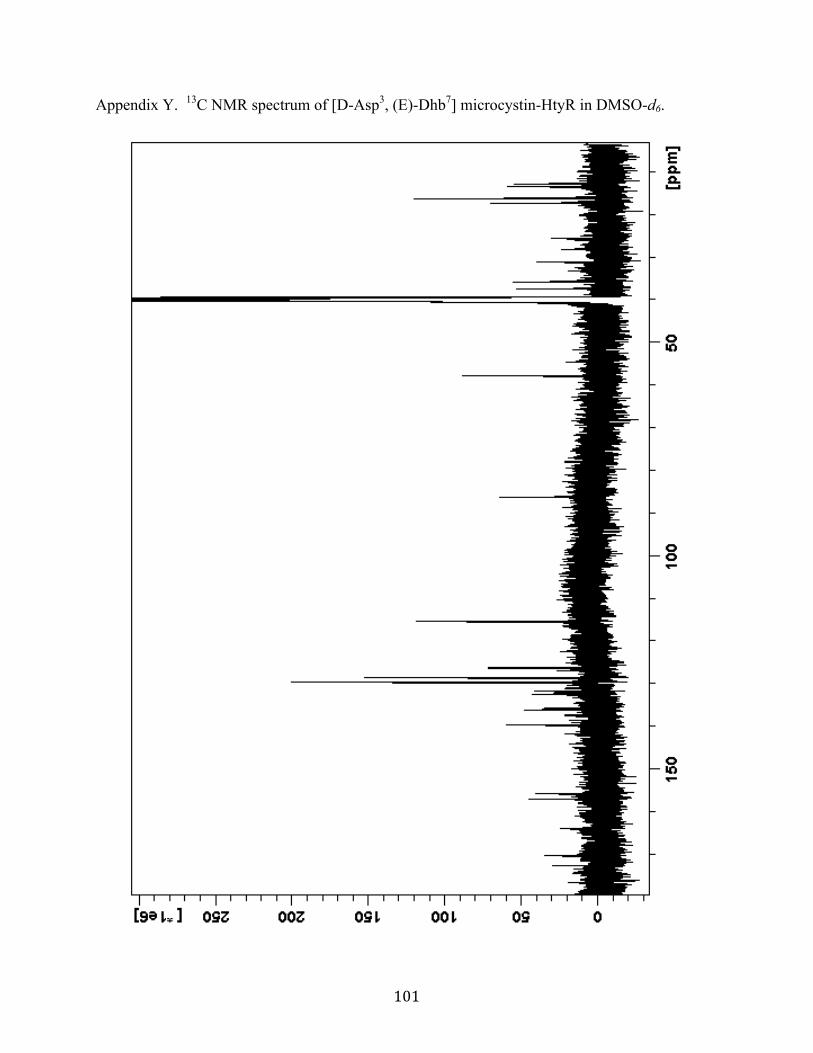
101
Appendix Y. 13C NMR spectrum of [D-Asp3, (E)-Dhb7] microcystin-HtyR in DMSO-d6.
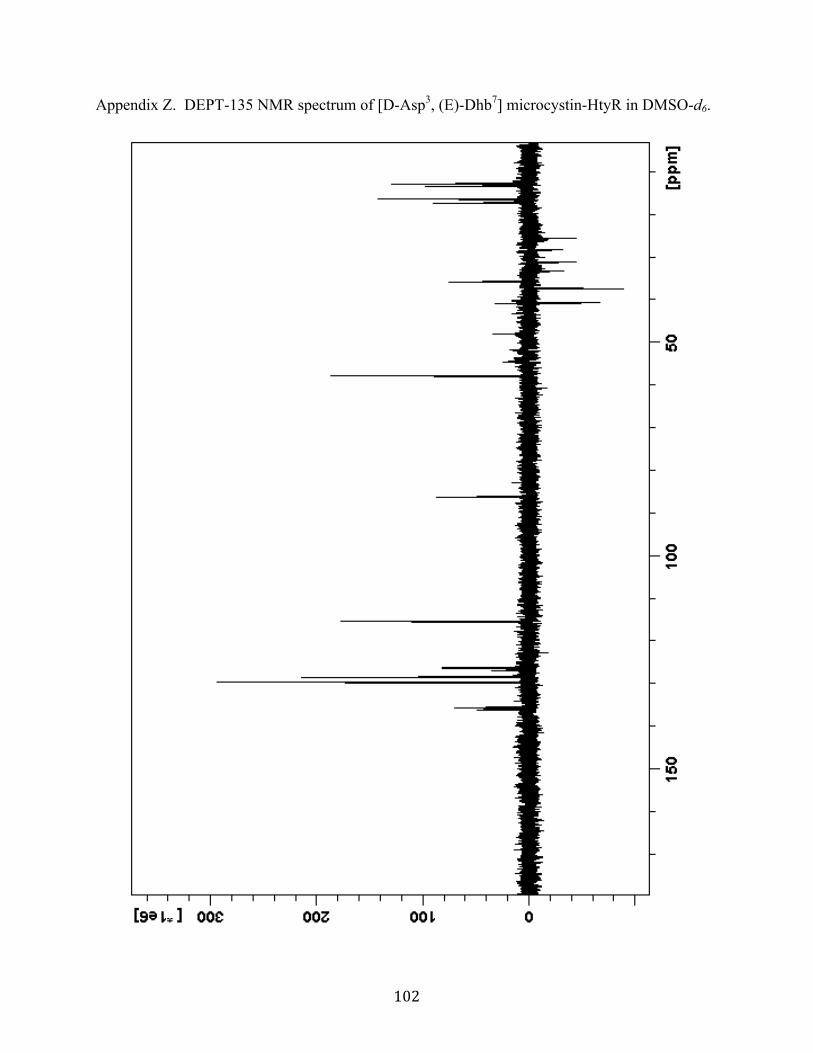
102
Appendix Z. DEPT-135 NMR spectrum of [D-Asp3, (E)-Dhb7] microcystin-HtyR in DMSO-d6.
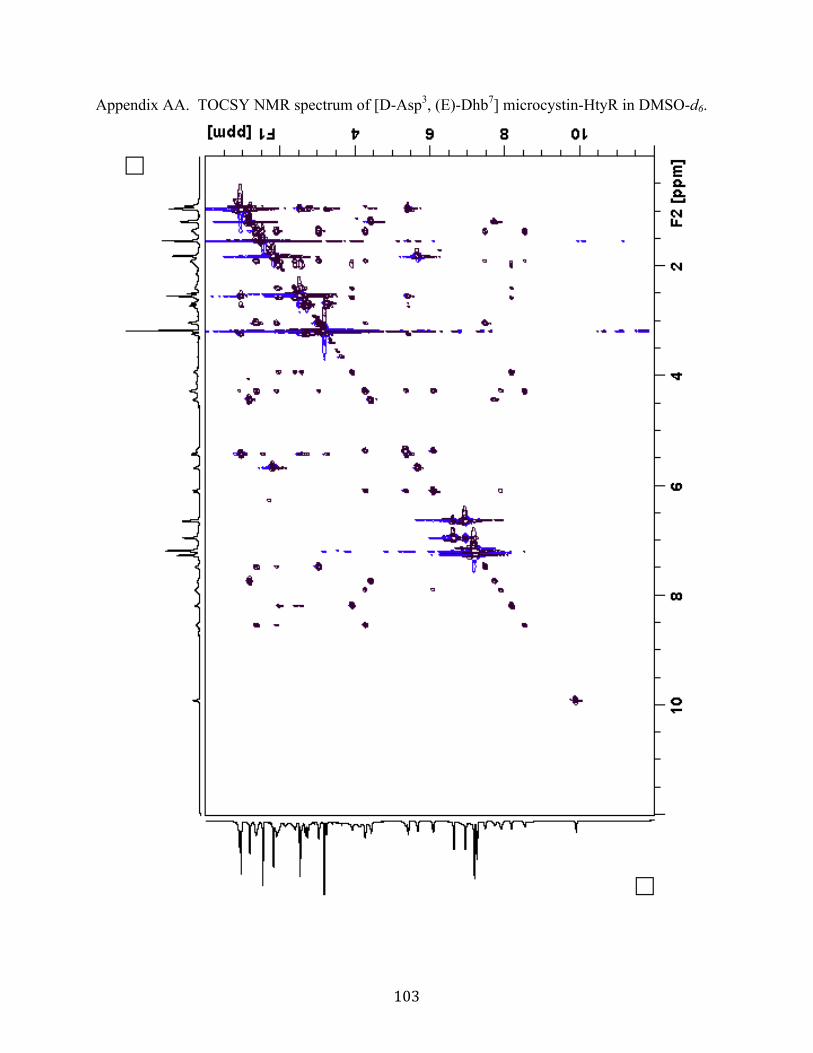
103
Appendix AA. TOCSY NMR spectrum of [D-Asp3, (E)-Dhb7] microcystin-HtyR in DMSO-d6.
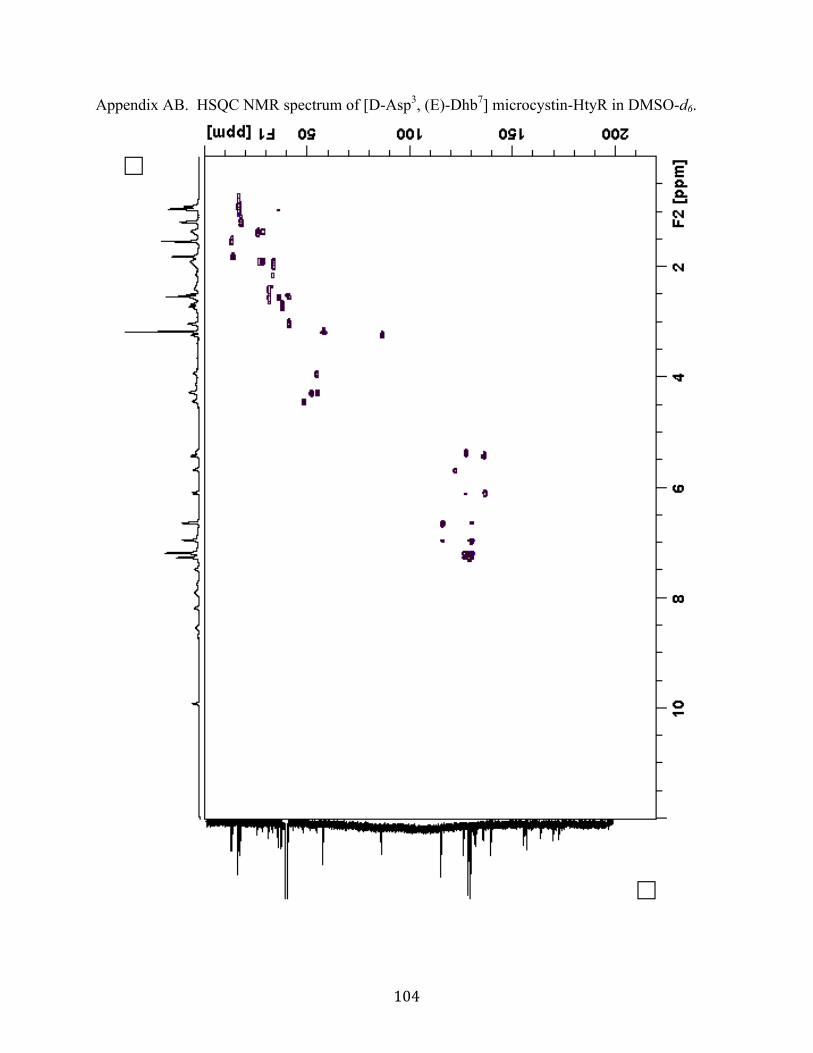
104
Appendix AB. HSQC NMR spectrum of [D-Asp3, (E)-Dhb7] microcystin-HtyR in DMSO-d6.

105
Appendix AC. HMBC NMR spectrum of [D-Asp3, (E)-Dhb7] microcystin-HtyR in DMSO-d6.
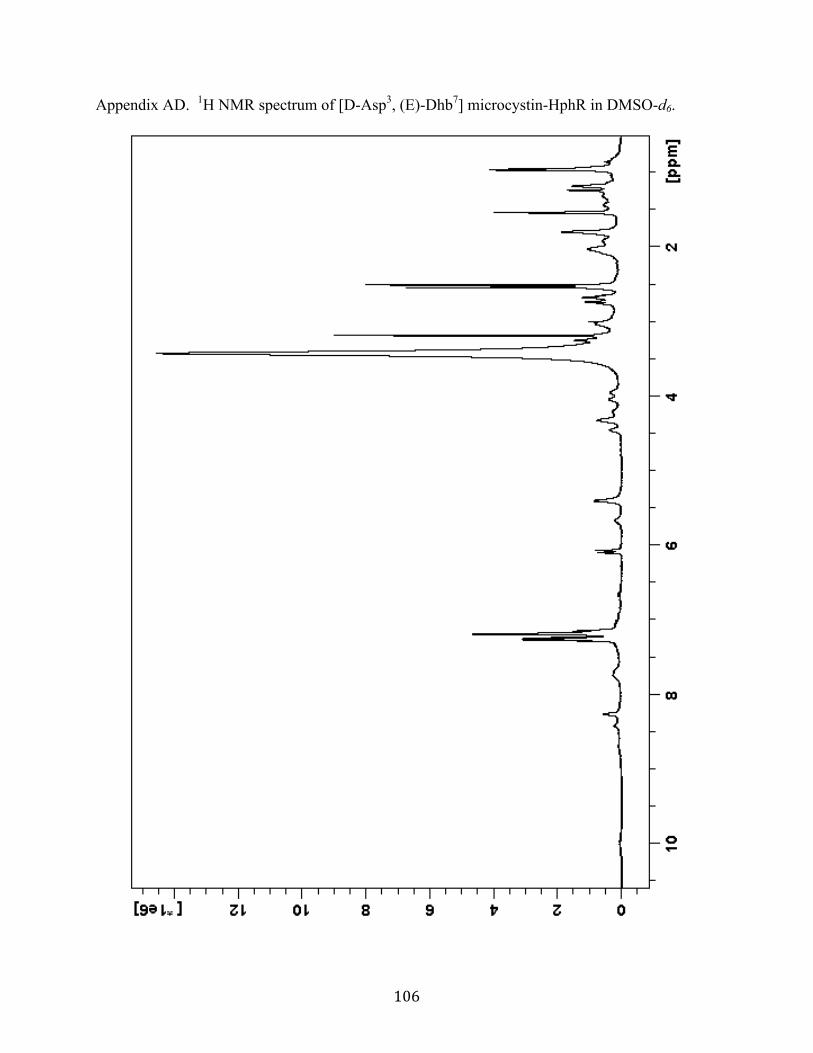
106
Appendix AD. 1H NMR spectrum of [D-Asp3, (E)-Dhb7] microcystin-HphR in DMSO-d6.

107
Appendix AE. DEPT-135 NMR spectrum of [D-Asp3, (E)-Dhb7] microcystin-HphR in DMSO-d6.
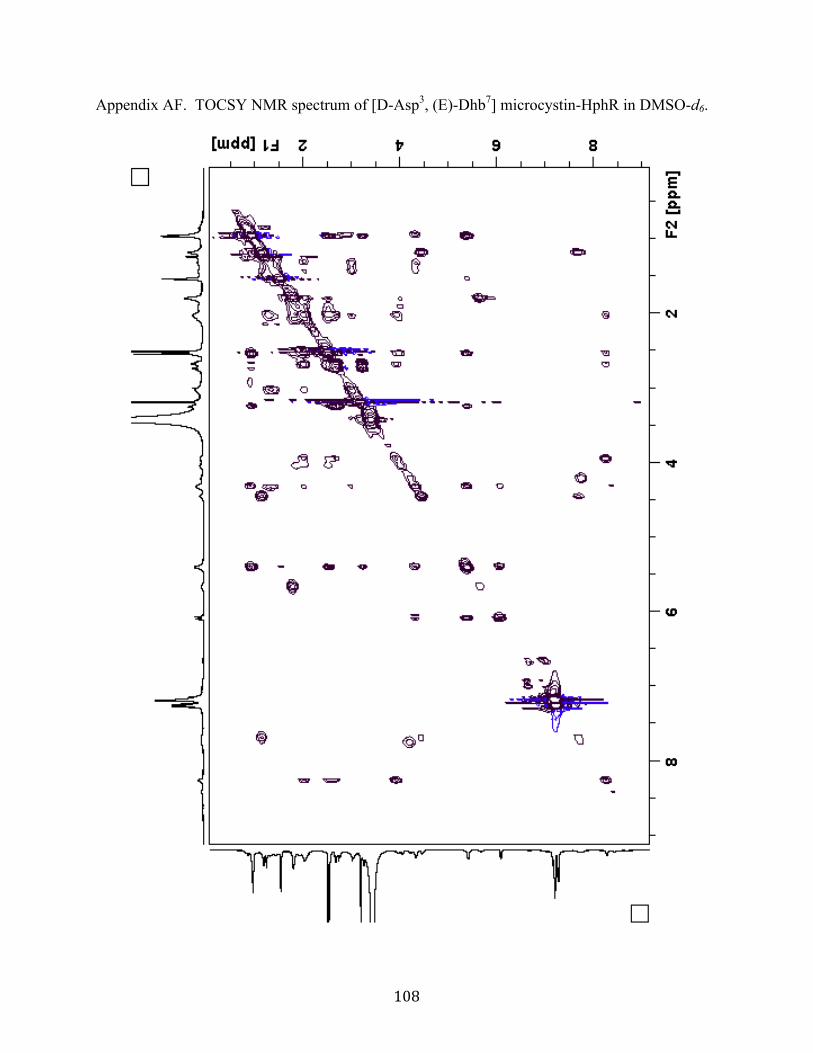
108
Appendix AF. TOCSY NMR spectrum of [D-Asp3, (E)-Dhb7] microcystin-HphR in DMSO-d6.
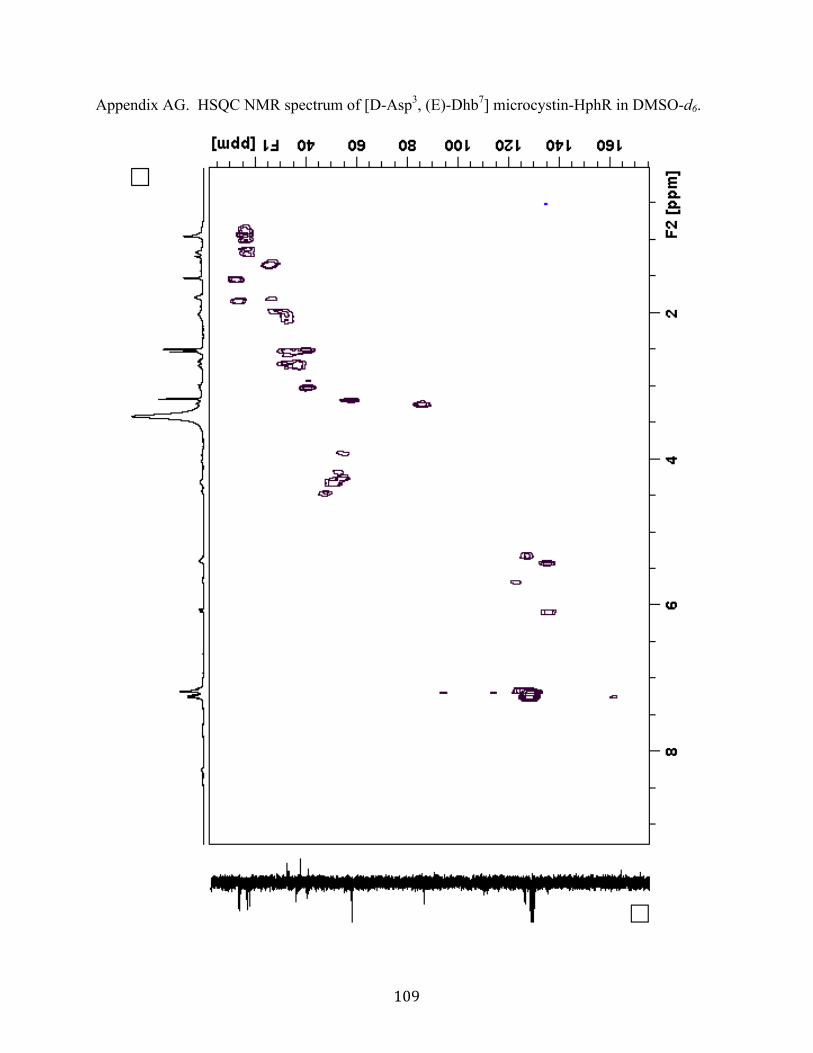
109
Appendix AG. HSQC NMR spectrum of [D-Asp3, (E)-Dhb7] microcystin-HphR in DMSO-d6.
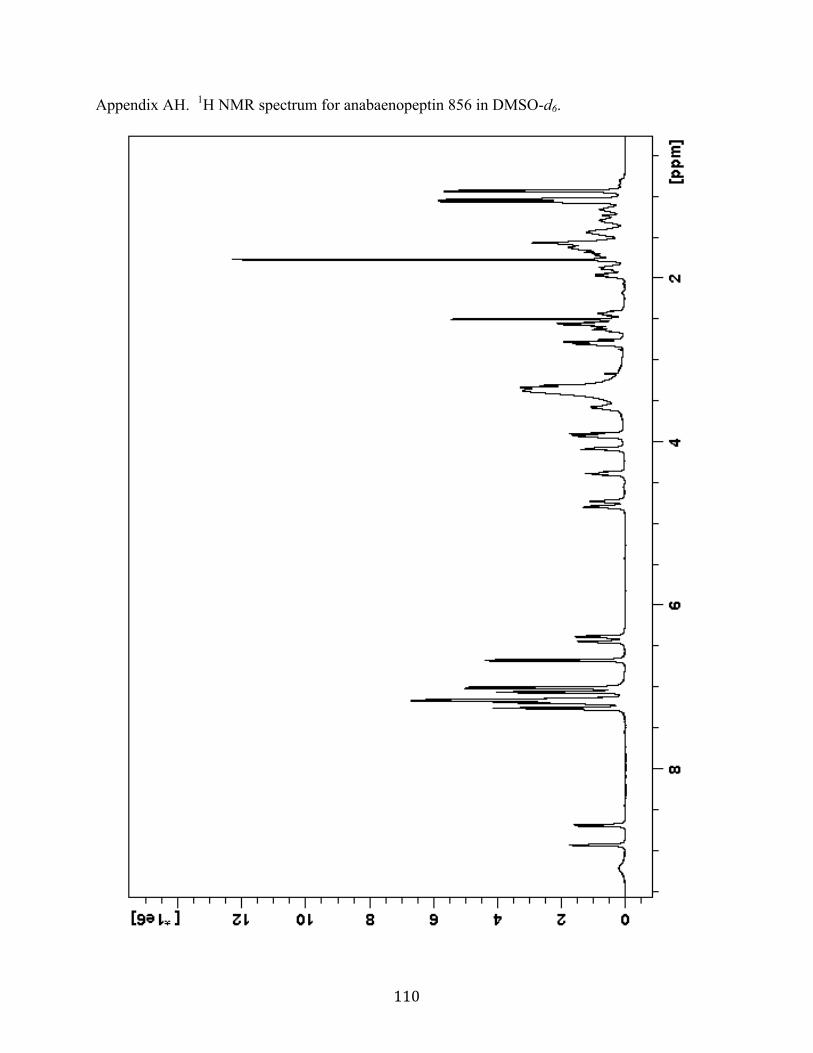
110
Appendix AH. 1H NMR spectrum for anabaenopeptin 856 in DMSO-d6.
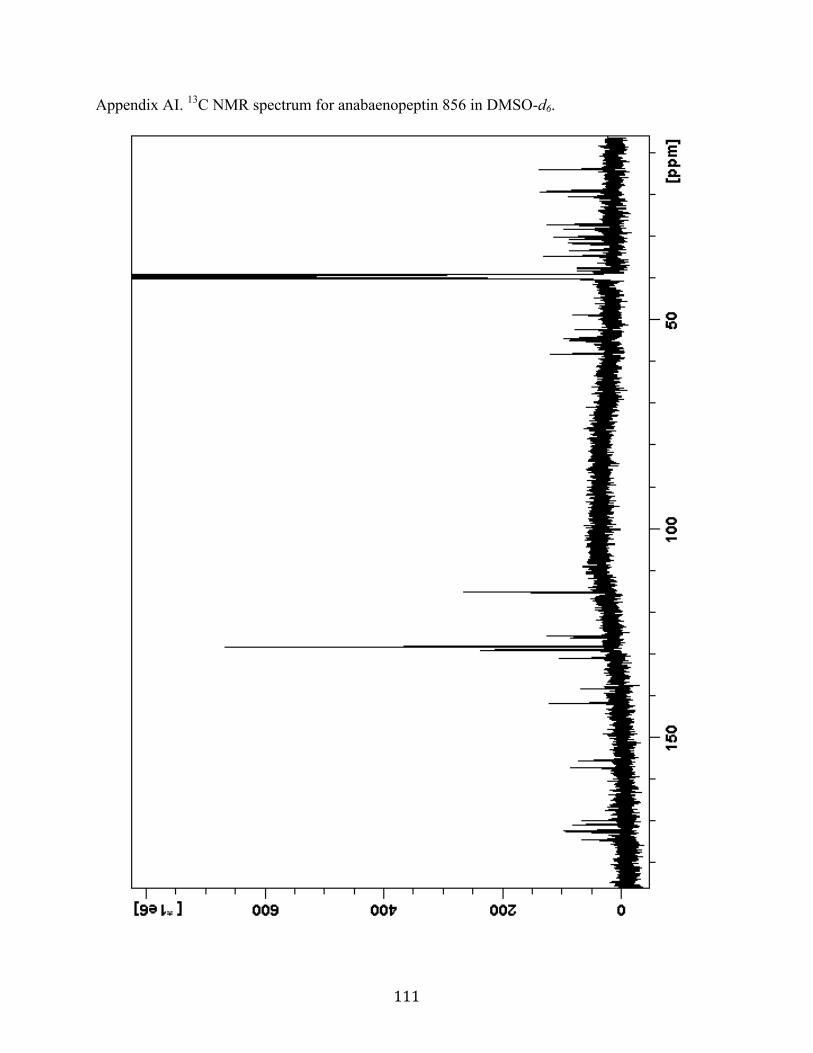
111
Appendix AI. 13C NMR spectrum for anabaenopeptin 856 in DMSO-d6.

112
Appendix AJ. DEPT-135 NMR spectra for anabaenopeptin 856 in DMSO-d6.
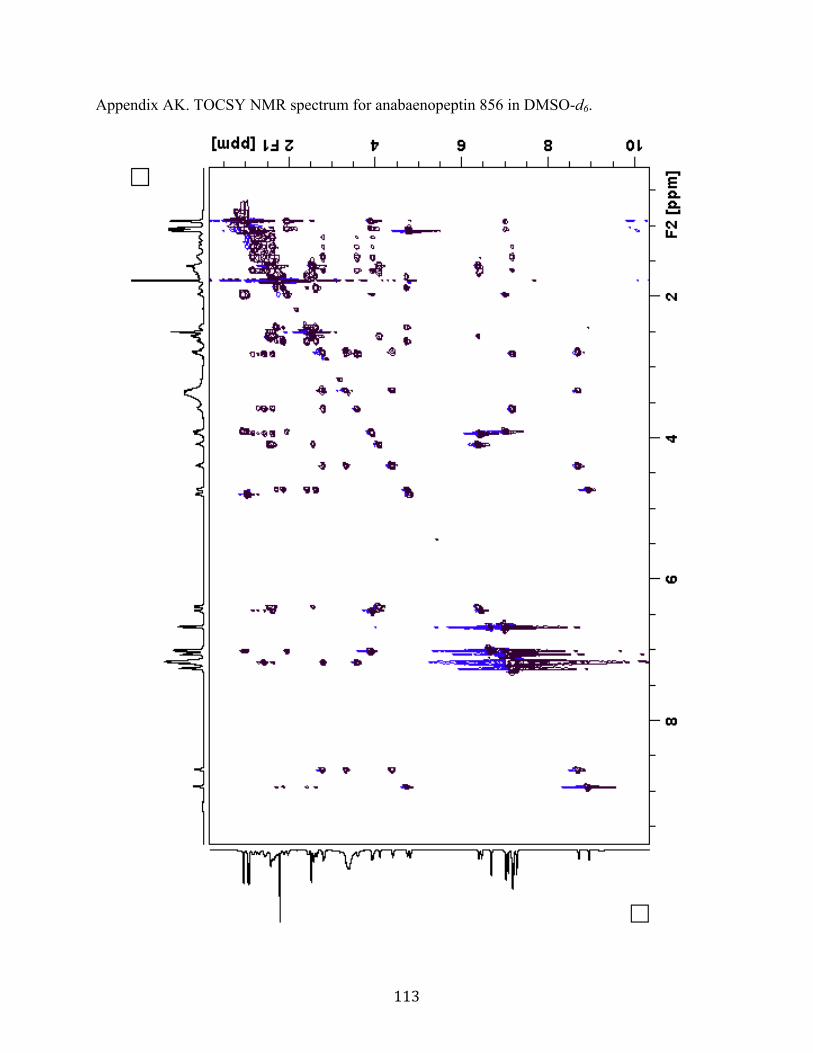
113
Appendix AK. TOCSY NMR spectrum for anabaenopeptin 856 in DMSO-d6.

114
Appendix AL. HSQC NMR spectrum for anabaenopeptin 856 in DMSO-d6.
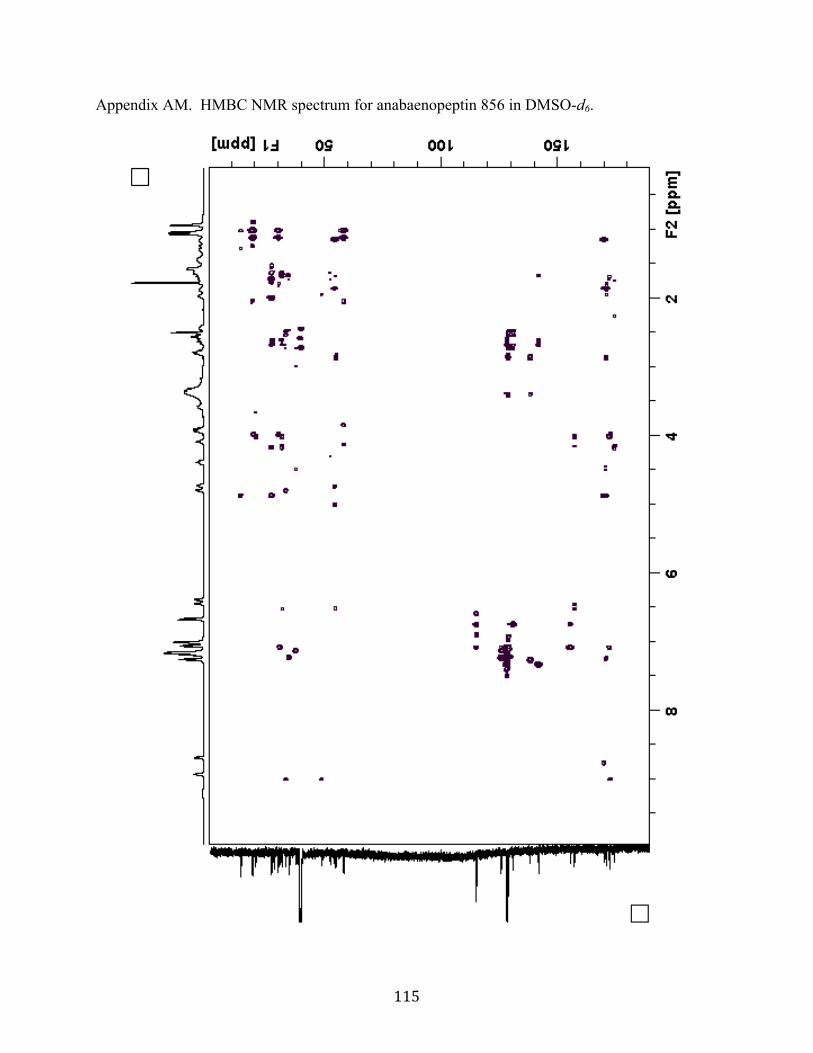
115
Appendix AM. HMBC NMR spectrum for anabaenopeptin 856 in DMSO-d6.
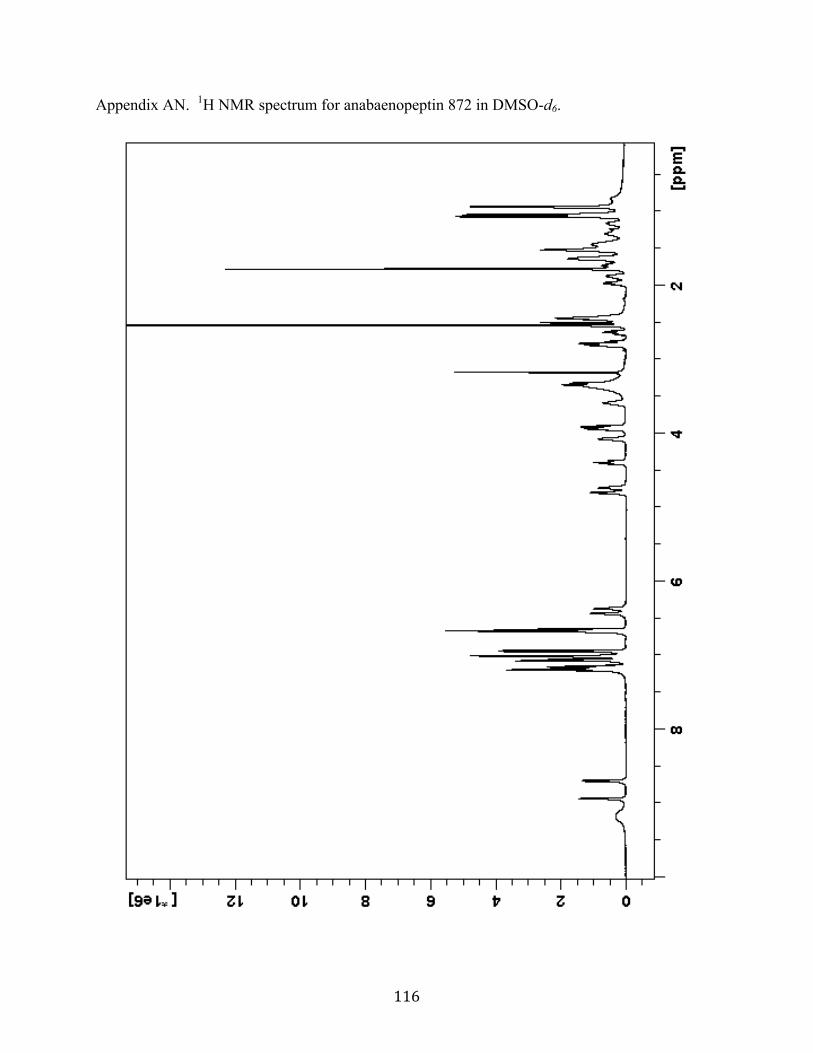
116
Appendix AN. 1H NMR spectrum for anabaenopeptin 872 in DMSO-d6.
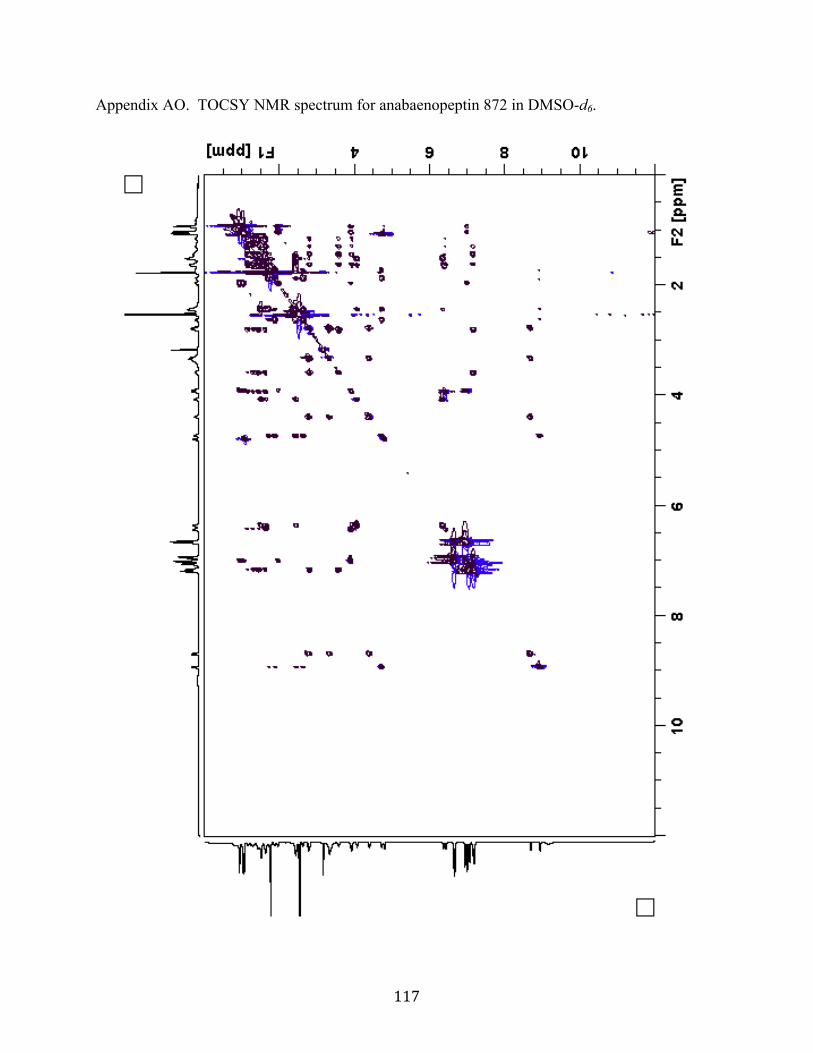
117
Appendix AO. TOCSY NMR spectrum for anabaenopeptin 872 in DMSO-d6.


![Quantum chemical investigations on bis(bora)calix[4]arene](https://img.dokumen.tips/doc/110x75/624131ec5f92147c2d3f3cc4/quantum-chemical-investigations-on-bisboracalix4arene-.jpg)