Embed Size (px)
Citation preview

Chemical Geology, 44 (1984) 33-65 Elsevier Science Publishers B. V., Amsterdam- Printed in The Netherlands
137Cs AND 210Pb TRANSPORT AND GEOCHRONOLOGIES IN URBANIZED RESERVOIRS WITH RAPIDLY INCREASING SEDIMENTATION RATES
P.L. McCALL', J.A. ROBBINS 2 and G. MATISOFF 1
1 Department of Geological Sciences, Case Western Reserve University, Cleveland, OH 44106 (U.S.A.) 2 Great Lakes Environmental Research Laboratory, National Oceanic and Atmospheric Administration, Ann Arbor, MI 48104 (U.S.A.)
(Accepted for publication November 30, 1983)
ABSTRACT
33
McCall, P.L., Robbins, J.A. and Matisoff, G., 1984. 137Cs and 210Pb transport and geochronologies in urbanized reservoirs with rapidly increasing sedimentation rates. In: J.A. Robbins (Guest-Editor), Geochronology of Recent Deposits. Chern. Geol., 44: 33-65.
Sedimentation rates have been measured in three reservoirs in northeastern Ohio, U.S.A., by means of 137Cs and 210Pb geochronologies, volumetric sunieys and varve counting. These various methods, while only partially overlapping for each reservoir, show dramatic (three-fold) increases in rates of sediment accumulation in each system between about 1940 and 1977. Mass sedimentation rates are very nearly proportional to the size of the population in the region and possess a doubling time of roughly 19 yr. In these systems with changing sedimentation rates, the preferred model for use with 210Pb geochronologies is one which assumes a constant activity of material added to surface sediments. In systems possessing large (watershed)/(reservoir area) ratios, increasing erosion is evidently accompanied by a proportionate increase in the erosion of excess 210Pb. High near-surface activities of 137Cs are due to system integration effects with time constants the order of 10 yr. to a few decades. Total accumulation of fallout 137Cs and excess 210Pb far exceed direct atmospheric loadings, thus indicating the importance of watershed contributions and implying annual retention of the radionuclides in the reservoirs of between -15% and -80%. In Lake Rockwell, sedimentary fluxes of Zn, Pb and Cu have increased with time. The flux of Cu in particular has increased very markedly since 1970, and concentrations are high in surface materials due in large part to addition of CuS04 ,
an algicide, to the water. Because of increased rates of sedimentation, the remaining useful life of Lake Rockwell has decreased from 203 to 67 yr., while the remaining useful life of Mayfair Lake is now less than 5 yr.
INTRODUCTION
Multiple geochronological methods, including radionuclide chronologies, have seldom been applied to studies of sedimentation in reservoirs. Because
0009-2541/84/$03.00 © 1984 Elsevier Science Publishers B.V.

34
these man-made systems are sensitive to land-use changes during the past several decades, they provide a means for comparing and contrasting alternative geochronological methods and models. In this paper, net rates of sediment accumulation are determined in cores from three freshwater reservoirs in northern Ohio, U.S.A., by a partially overlapping combination of methods including radiometric age dating (via 137Cs and 210Pb ), volumetric sediment surveys, and varve stratigraphy. Sedimentation rate data are of value because the accumulation of sediments shortens the useful life of reservoirs and landuse-related changes in sediment accumulation may indicate a shorter reservoir lifetime than may have been previously anticipated. Apart from accumulation effects, sediments constitute a major contaminant in sources of drinking water. Increased urbanization of the drainage basin of these reservoirs has resulted in increased contaminant loads which may be chronicled in accumulating sediments. Sedimentary records of metal and organic contaminants can in principle be used to reconstruct exposures of populations using a particular water supply. Since these reservoirs were created at known times, core dating techniques may be usefully compared with volumetric surveys and inferences made concerning non-steady-state transport characteristics of these systems.
METHODS
Two of the reservoirs studied are located on the Cuyahoga River or its tributaries. The Cuyahoga River has its headwaters in northeastern Ohio and runs south to the city of Akron, Ohio, where it turns north and enters Lake Erie at Cleveland, Ohio. The reservoir closest to the headwaters of the Cuyahoga is East Branch Reservoir, created in 1939 on East Branch River (Fig. 1). East Branch Reservoir has a surface area of 1.70 km2 and a drainage basin area of 45.3 km2 (Hahn, 1955). It is used for recreation and river-level control. Lake Rockwell is an impoundment of the Cuyahoga River itself, and was made in 1914 for the sole use as a water supply for the city of Akron, Ohio. It occupies a surface area of 2. 78 km2 and has a drainage basin area of 531 km2 (Hahn, 1955). Mayfair Lake is located in Richmond Heights, Ohio, on a tributary to Euclid Creek and was made some time before 1942 (approximately 1938) for recreational use. It occupies an area of 0.016 km2
and has a drainage basin area of 2.4 km 2 • Surface deposits in most of the drainage basin of the Cuyahoga River consist of Quaternary glacial sands, silts and clays; in a few places below Lake Rockwell the river has cut through glacial deposits into bedrock which consists of Paleozoic conglomerates, sandstones and shales (Hough, 1958). The surface sediments in the reservoirs have water contents of 70-80%, are >90% silt-clay, and contain 9-11% organic matter by weight.
In 1977, two 6.5-cm diameter cores from Lake Rockwell and one from East Branch Reservoir were collected by divers for radiometric analysis (Fig. 2). An additional core was collected from Mayfair Lake in 1982. The

35
cores were extruded in the laboratory and cut into 1-cm sections to a depth of 24 em, then into 2-cm sections to a depth of 40 em, and finally into 5-cm sections for the remaining length of the cores. Core sections were weighed, air-dried and reweighed to calculate sediment bulk density as a function of depth in the core, and ground and passed through a 60-mesh sieve.
Km
LAKE
ROCKWELL
0 10
t
Fig. 1. Location of the three reservoirs in northeast Ohio.
The activity of 137Cs in core sections was determined with a 2 X 2 in. (5.08 X 5.08 em) Nal detector coupled to a multichannel analyzercounter-timer system. Counting times ranged from 2 to 15 hr. per sample. As 137Cs is a high-energy gamma emitter (0.661 MeV), sediment self-absorption effects are practically eliminated (Robbins et al., 1978). Activities were corrected for sediment porosity and expressed as activity per gram dry weight of sediment. For determination of the activity of 210Pb, 3-g portions of dry sediment were extracted in a mixture of hot (86°C} 50% HCl

36
for a period of 36 hr. Periodically 30% H20 2 was added during the extraction period to facilitate destruction of the organic matter. The decay product of 210 Pb, 210Po, was plated from pH-adjusted extracts onto polished silver discs and counted on a gas flow proportional counter. Overall chemical yield and plating efficiencies were determined by sequential plating of the acid extracts and were generally better than 90%. Values of the 210Pb activity are expressed in pCi g- 1 •
EAST BRANCH RESERVOIR
N
*
LAKE ROCKWELL MAYFAIR LAKE
Fig. 2. The three reservoirs studied. (Bar length = 1 km for East Branch Reservoir and for Lake Rockwell; = 0.12 km for Mayfair Lake.) The numbered lines indicate cross-reservoir transects for volumetric surveys. Cores for radionuclide lettered sites. In Lake Rockwell A = core 1 and A' = core 2. The core for varve analysis was collected at site C in Mayfair Lake.
Volumetric surveys of the sediment in Lake Rockwell and East Branch were conducted in 1977. Transects were laid out perpendicular to the long axis of each reservoir as shown in Fig. 2. At seven equidistant points along each transect a ruled plumb line affixed to a 0.04-m2 flat plate weighing 2 lb. (0.907 kg) was used to measure the depth of the water overlying the sediment-water interface, and a ruled length of %-in. (1.9 em) galvanized pipe was used to measure the thickness of sediment over the original basin floor. Where the original reservoir floor consisted of sand- and gravel-sized

37
glacial till, the thickness of the predominantly silt-clay-sized sediments dPposited since the creation of the reservoir was accurately determined. Where the original floor consisted of vegetated soil (determined in sediment cores by the presence of plant roots), poles often penetrated the water-logged soil profile and gave an overestimate of sediment thickness. The addition of 3-in. (7.62 em) diameter floor flanges to the bottom of the poles for the Lake Rockwell survey corrected this problem. The same technique was used in Mayfair Lake, except that only three measurements were made along each transect (Fig. 2). Knowing the elevation of the water surface, sedimentwater interface, and sediment thickness, we calculated the cross-sectional area of water and sediment along each transect and graphically integrated these areas along the axis of the reservoir to obtain water and sediment volumes using the methods of Heineman and Dvorak (1963). Volume of sediment in major inlets was calculated from transect data using the modified Eakins range end formula (Gottschalk, 1951). These two volumes were then summed to obtain an estimate of the volume of sediment in the reservoir.
Sediment cores were collected from various parts of the reservoirs to check the accuracy of the poling method and to look for internal sedimentary structures and evidence of trace-metal pollution that often accompanies increased human use of a watershed. Internal sedimentary structures were examined in radiographs of the cores. Sediment metal concentrations of Zn, Cu, Pb and Fe were determined by analysis of the acid-extractable portion of bulk sediments using atomic absorption spectrophotometry (A.P.H.A., 1976; Perkin-Elmer, Inc., 1974).
RESULTS AND DISCUSSION
Internal sedimentary structures
Radiographs of a sediment core from Lake Rockwell exhibited few internal sedimentary structures (varves), despite the fact that macrobenthos abundances in the core were low (166 chironomids/m2
, 200 tubificids/m2 ).
This is probably due to the fact that most river-borne coarse-grained sediments are trapped in the relatively flat region upstream of the lake. The seasonal variation in river flow thus does not produce a seasonal variation in the type of sediment delivered to the lake, so only fine-grained and relatively low-density material is present within the basin.
Mayfair Lake is considerably smaller than Lake Rockwell; there is no extensive flat-lying area to trap sediments above the lake. The core collected from Mayfair Lake shows extensive sediment banding (Fig. 3). Mayfair Lake is ~40 yr. old. There are 52 discernible pairs of low- and high-density sediment bands in the core; but some of these are subcouplets that probably represent flood deposition within seasonal bands. Based on the size of surrounding bands, there are 44 couplets which are annual bands with three

38
distinct zones visible. The first extends from the sediment-water interface to 12 em; 5 couplets can be detected in the radiographs, yielding a sedimentation rate from 1977 to 1982 of 2.4 em yr. - 1
• The second zone encompasses approximately the period 1956-1977 where the sedimentation rate is 1.29 em yr. - 1
• The lowest zone extends from 1956 to reservoir closure (approximately 1938) where the sedimentation rate is 0.83 em yr.-1.
0
5
10
15
Fig. 3. Stratigraphy of the Mayfair Lake core. The topmost section of the core is on the left. Dark bands indicate sediments of relatively low density.

39
Volumetric surveys
The cross-sectional areas of sediment and overlying water along transects across the three reservoirs measured by poling are shown in Fig. 4. Lakes Rockwell and Mayfair are filling from the point of entry of the river into their basin. Marshes exist at the north end of Lake Rockwell which are not present on the 1944 topographic maps. The delta tops in Rockwell and Mayfair are shown as shaded areas in Fig. 2. Sediments are distributed fairly evenly along the remainder of each basin. Sediment cores taken in most parts of the reservoirs ought to be representative of the entire basin (the position of the sediment cores described above are shown in Fig. 2). The average annual volume of sediment accumulating in a reservoir was calculated by measuring the area under the sediment cross-sectional curves in Fig. 4 and dividing by the age of the reservoirs. Dividing again by the surface area occupied by the basin yields a long-term average basin-wide sedimentation rate (Table I).
TABLE I
Characteristics of three reservoirs and their watersheds
Area of drainage basin (106 m 2)
Date of reservoir construction
Date of this survey Basin volume (106 m 3
)
Water volume (10 6 m 3)
Sediment volume (10 5 m 3)
Average annual volume of sediment accumulated since closure (104 m 3 yr._,)
Reservoir surface area (106 m 2)
Area ratio: (drainage basin) I (reservoir)
Mean annual discharge rate (10 5 m 3 day-') Hydraulic residence time (days)
Lake Rockwell
531 1914
1977 7.42 6.2 8.22
1.3 2.78
191 6.9 9.0
East Branch Mayfair Reservoir Lake
45.3 2.4 1939 1938
(estimated) 1977 1982
5.57 0.018 5.03 0.00892 5.4 0.0912
1.42 0.0228 1.70 0.0155
27 155
Sedimentation rates in Lake Rockwell and East Branch reservoirs have been examined by volumetric surveys in previous years (Tables I and IV). While East Branch Reservoir gives little indication of an increase in sedimentation rate between this survey and that in 1950, the Lake Rockwell surveys clearly show an increasing rate of sedimentation since 1950. The surveys of Hahn (1955) done in 1950 may have overestimated sediment thickness, since there is no indication that pole flanges were used to correct for penetration into a water-logged soil profile. However, in the analysis

40
NE
-4
"' a: 4
.... u
"' <f) z 4 a: ....
N
E
4
"' ~ t; "' "' z 4 a: ....
"' E
<0:
"' a: <0:
.... u
"' (I)
z ... a: ....
3000
2000
EAST BRANCH
4000 5000
DISTANCE I m I
3000
75
so
SEDIMENT VOLUME
0 100 200 300
DISTANCE (m)
Fig. 4. Mean cross-sectional areas of water and sediment along numbered transects vs. longitudinal distance along the reservoir axes. The area under the bottom curve is the sediment volume.

I .
41
below, the rate inferred by Hahn appears to be more consistent with the radionuclide data and population model (see Table IV).
Profiles of 137Cs
This radionuclide (t 1; 2 = 30.2 yr.) is one of several long-lived isotopes produced by the atmospheric testing of nuclear weapons. As there is no natural occurrence of 137Cs, the isotope was not present in the environment until the early 1950's. Maximum fallout to water and land occurred during 1963 and 1964 corresponding to the period of maximum testing activity by the U.S.A. and U.S.S.R. In many soil-water systems 137Cs is strongly (and largely irreversibly) sorbed on clay minerals (Tamura and Jacobs, 1960; Schulz, 1965) and therefore traces the movement and accumulation of particles with which they associate. Its accumulation in sediments has provided a means of inferring accumulation rates in a variety of freshwater environments (Ritchie et al., 1973; Pennington et al., 1976; Robbins and Edgington, 1975; Robbins et al., 1978). Most often the position of the horizon (corresponding to the first appearance of 137 Cs in the environment) or the peak (corresponding to the period of maximum deposition) has been used to determine sedimentation rates. In this paper we shall use the entire
137Cs (pCi/g)
137Cs (pCi/g)
0 2 4 6 1 2 3
' C\J ' E ' u 2 : ' ~ !?}
1- 4 ~ z .., w ~ ~
6 ' 0 i w ' (f)
' lL 8 ~ 0 '---~
~10 L. _____ 1 .. _____ :_]_
Q -- 1...-w ----3: 12 /
I
w )
>
,ft~ /
ti 14 _J
~ 16 East Branch Lake Rockwell ::J Reservoir Mid Lake Core u
Fig. 5. Distribution of 137Cs in the East Branch Reservoir and Lake Rockwell core 2. The solid histogram-like curves are actual values. The dashed line "histogram" is the distribution expected from the direct atmospheric fallout assuming a sedimentation rate which minimizes the discrepancy between measurement and this distribution. The solid smooth curve is the distribution expected if inputs are integrated prior to incorporation into sediments. The dashed curve is the distribution expected with integration and variable sedimentation rates based on the CA/population model (see text).

42
profile and examine the correspondence between the sedimentary record and the well-known loading of the isotope from the atmosphere.
The distribution of 137Cs in two cores is shown in Fig. 5 (East Branch Reservoir and Lake Rockwell, core 2). The data are provided in Table II. A third profile (Lake Rockwell core 1) is shown in Fig. 6 along with excess lead 210Pb discussed below. The data for this core are given in Table III. The solid histogram-like curve in the figure shows the measured distribution. The error bar attached to each curve provides an indication of the characteristic experimental uncertainties in the values. The histogram shown as the dashed line is that expected if the profile were the result of direct transfer of 137Cs
TABLE II
Distribution of ' 37Cs in cores from East Branch Reservoir and Lake Rockwell
Sediment East Branch Reservoir Lake Rockwell (mid) interval (em) cumulative activity* cumulative activity*
weight (pCi g-•) weight (pCi g-•) (gcm- 2 ) (g cm- 2 )
0-1 0.38 1.12 0.45 1.68 1-2 0.73 1.15 0.80 1.88 2-3 1.15 2.02 1.17 2.09 3-4 1.53 2.13 1.52 2.34 4-5 1.96 1.94 1.87 1.44 5-6 2.44 2.40 2.20 1.89 6-7 2.98 2.20 2.57 2.02 7-8 3.50 2.83 2.92 1.78 8-9 4.02 2.01 3.40 2.23 9-10 4.56 2.15 3.84 1.91
10-11 5.16 2.28 4.39 2.57 11-12 5.76 2.65 4.88 1.94 12-13 6.33 2.50 5.36 2.27 13-14 6.94 2.90 5.88 2.10 14-15 7.52 2.69 6.35 2.64 15-16 8.08 3.28 6.80 2.36 16-17 8.75 3.80 7.31 2.61 17-18 9.42 4.22 7.86 1.95 18-19 10.09 4.02 8.52 1.66 19-20 10.72 4.11 9.16 0.81 20-21 11.45 3.77 9.68 0.71 21-22 12.14 3.25 10.35 0.30 22-23 12.75 2.53 10.86 0.11 23-24 13.39 1.99 11.56 0.33 24-26 14.17 1.60 12.30 0.15 26-28 14.79 0.78 13.12 0.23 28-30 15.40 0.76 13.91 0.07 30-32 16.67 0.30
*Analytical uncertainties are generally around 10%.

43
from the atmosphere. (The choice of time scale for this profile is discussed below.) The atmospheric deposition curve is obtained from data published by the U.S. Health and Safety Laboratory (H.A.S.L., 1976) for the North American Great Lakes region. It can be seen that in all cores the peak position and horizon occur at sediment depths which are consistent with the choice of a single sedimentation rate for each core. However, there is far more activity in sediments deposited after about 1964 than can be
TABLE III
Distribution of 137Cs and excess 210Pb in core No. 1 from Lake Rockwell
Sediment Cumulative 137Cs 210Pbexc h) Error interval weight (pCi g-1) (pCi g- 1)
(em) (gcm- 2)
0-1 0.25 1.38 20.23 1.76 1-2 0.58 1.35 24.29 1.93 2-3 0.95 1.61 23.17 1.81 3-4 1.33 1.60 20.49 1.77 4-5 1.77 1.84 21.57 1.78 5-6 2.16 2.29 21.54 1.78 6-7 2.53 1.63 22.02 1.79 7-8 2.94 1.78 19.48 1.75 8-9 3.36 1.60 19.99 1.76 9-10 3.71 2.61 18.71 1.74
10-11 4.09 2.40 18.90 1.74 11-12 4.46 2.90 17.09 1.71 12-13 4.79 2.17 20.97 1.77 13-14 5.11 2.17 21.22 1.73 14-15 5.52 2.70 19.62 1.75 15-16 5.98 3.35 16.93 1.62 16-17 6.42 3.76 15.99 1.70 17-18 6.84 3.67 15.60 1.69 18-19 7.31 4.32 15.08 1.69 19-20 7.74 3.53 14.85 1.68 20-21 8.31 2.69 13.25 1.66 21-22 8.70 2.00 12.45 1.65 22-23 9.18 2.32 13.23 1.66 23-24 9.66 1.76 11.65 1.64 24-26 10.36 1.43 9.11 1.61 26-28 11.10 0.71 7.97 1.60 28-30 11.81 0.46 8.31 1.60 30-32 12.81 0.0 8.89 1.61 32-34 13.91 0.0 7.80 1.60 34-36 14.91 0.0 8.64 1.61 36-38 16.01 0.0 8.09 1.60 38-40 17.01 0.0 5.14 1.57 40-45 19.51 0.0 4.68 1.56
*The activity of supported 210Pb is 3.0 ± 1.5 pCi g- 1. The error in estimating excess 210Pb includes this uncertainty.

44
accounted for in terms of direct fallout to the water and instantaneous incorporation into sediments.
The most probable and self-consistent explanation for the lack of correspondence between atmospheric deposition and sedimentary records of the radionuclide is that a substantial portion is derived from the watershed. In large lakes such as the Great Lakes, very little 137Cs originates from the watershed. In contrast, in a system such as a reservoir with a very short
137Cs (pCi/g)
210Pbexcess ( pCi/g)
4 5 \0 \5
VI\ '\~' I I ' I
2 N
E 41 ..,
'----V ~ -M u ' ' 2 1- 6 z w ::;<
r 0 w en
~i lL 0 1-I S2 w 5: \4 w > ~ \6
r --140
~ 18[ LAKE ROCKWELL
20 CORE NO.\
22
Fig. 6. Distribution of 137 Cs and excess 21 0Pb in Lake Rockwell core 1. The solid curve in the 21 0Pb plot is the distribution expected if the sedimentation rate is proportional to an exponentially increasing regional population and the activity of 210Pb added to surface sediments (pCi g- 1
) is constant (CA model).
hydraulic residence time and a large (drainage basin) I (lake area) ratio, the watershed may contribute in a major way to the sedimentary load of the isotope. In contrast with 137 Cs reaching sediments from direct atmospheric transfer, that originating from the watershed will be integrated. That is, the load at a given moment will consist of a combination of all amounts deposited previously on the surrounding land. For purposes of illustrating the effects of watershed integration processes, it is assumed that the process may be characterized by a single time constant, the residence time, Tn. If the flux of 137Cs to the watershed is <I> (pCi km- 2 yr.- 1 ), then the change in amount stored on the watershed L (pCi) is given by:
dL/dt =An <I> -(A. + Tn - 1 )L (1)
45
where AD is the area of the drainage basin; and A is the radioactive decay constant for 137Cs (= 0.69315/30.2 yr.- 1
). This equation has the solution:
t L = [exp (-13t)/~] J AD<P exp (~t)dt (2)
0
where ~ = A + TD - 1• The amount entering the reservoir is LITD. A computer
program was used to evaluate eq. 2 and predict the distribution of 137Cs in each core for different assumed residence times and sedimentation rates. The calculations are based on depths expressed in g cm- 2 to eliminate compaction effects. If gk and gk+l represent the cumulative weight of sediment at the bottom of the interval k and (k + 1), respectively, then these values correspond to times (in years before 1977) of tk = gkfr and tk+l = gk+llr where r is the sedimentation rate (g cm- 2 yr.- 1
). The expected activity in this time interval is then:
const.
tk+l - tk
tk+l J L(t) exp (-At)dt
tk
(3)
The exponential term in the integral accounts for the radioactive decay of the isotope after deposition. The computer program finds a value of the constant which gives the best least-squares fit to the data for the choices of TD and r. Note that in reality the profile of 137Cs is made up of contributions from both direct fallout and from the watershed. As the relative contributions cannot easily be distinguished on the basis of a few sedimentary profiles, the extreme case is initially chosen where the profile is considered to result only from integrated inputs.
The result of evaluating eqs. 3 and 4 for various choices of TD and r yields the smooth curves shown in Figs. 5 and 6. The least-squares optimized values of the parameters are given in Tables IV and V. Clearly a considerable improvement results if 137Cs inputs are integrated either prior to or after their transfer to sediments. The theoretical curves exhibit an exponential decrease after the mid-1960's which reproduces the observed decline in 137Cs activity. The fits are in fact of such excellent quality that no significant improvement results from adding any direct transfer component to the computation.
The single residence time integration concept is evidently applicable to these profiles, and it is likely that this integration is not localized in sediments to any significant degree. Benthic organism densities are insignificant and the presence of varves in the Mayfair Lake core argues against significant redistribution of sediment solids. Diffusional mobility cannot be ruled out on the basis of 137Cs profiles alone, but the positions of the peak and horizon in the Lake Rockwell core 1 are correctly predicted from analysis of the 210Pb profile below. The consistency of these very different approaches does rule out any major diffusional mobility of 137Cs. Thus integrative effects must be non-local in character, but it cannot be determined if the integration occurs partly within the reservoir or is entirely a watershed effect. The

TABLE IV
Mean linear sedimentation rates calculated by various methods
System Mean date Period Mean sedimentation rate*' (em yr.-')
stratigraphic volumetric radiometric
'37Cs 210Pb (CA) 210Pb (CF)
Mayfair Lake 1980 1977-1982 2.4*' 1967 1956-1977 1.3 1962 1938-1982 1.43 1.47 1949 1938-1956 0.83
East Branch 1964 1950-1977 1.6 Reservoir 1958 1939-1977 0.84
1945 1939-1950 0.90* 4
Lake Rockwell 1964 1950-1977 1.3*' 1.1 0.66 1958 1950-1965 1.0*6 0.86 0.56 1946 1914-1977 0.47 0.64 0.49 1932 1914-1950 0.27* 4 0.20 0.38
*'Mean linear rates are obtained from the CA/population model. * 2 Assumes the mean linear sedimentation rate is proportional to county population. * 3 Linear sedimentation rates are not compaction-corrected but compaction generally amounts to a 10-15% effect. *4 Hahn (1955) (dam closure to 1950). * 5 Mean from two cores: No. 1: 1.4 em yr._,; No.2: 1.2 em yr. __ ,. *6 Hale & Kullgren Associates (unpublished data, 1982).
population model*'
2.4 1.5 1.2 0.93
1.6 1.3 0.90
1.2 0.89 0.49 0.29
..,. O'l

TABLE V
System integration times based on constant and variable sedimentation rate models for the distribution of 137Cs
Core Constant sedimentation rate
Lake Rockwell No.1 No.2
East Branch
r (g cm- 2 yr. -I)
0.57 0.55
0.85
* 1 Mean linear sedimentation rate.
[
N J V• *' V= i?j (Yobs- YcaJc)
2/<N -1)
*3 CF analog model. *4 CA analog model.
w<*l) (em yr. -I)
1.4 1.2
1.6
To (yr.)
8 20
10
Variable sedimentation rate
v<* 2) A "'F(t)<*•>
0.34 0.24
0.38
To (yr.)
6 15
7
v
0.51 0.32
0.43
A "'F(t)/r(t)<*•>
To (yr.)
11 95
14
v
0.46 0.29
0.38
""' -'1
48
integration times resulting from application of the model are different in the two Lake Rockwell cores - 8 yr. for core 1 and 20 yr. for core 2. This difference is real but its significance is uncertain. If the integration were solely a watershed process then values of Tn should be indistinguishable from core to core. The observed trend toward increased mid-lake integration times could conceivably be related to time scales for horizontal redistribution of the isotope within the reservoir, but the data are too scarce to pursue this line of thought further.
Profile of 210Pb
21 0Pb is a naturally occurring radionuclide ( t 1; 2 = 22.26 yr.) which has been used with increasing frequency to determine sediment accumulation rates in coastal marine and freshwater systems (Robbins, 1978). The isotope is produced in the atmosphere through radioactive decay of Rn gas and is efficiently scavenged from the air. In most freshwater environments it is strongly associated with suspended matter and rapidly transferred to sediments where its decay on burial provides the basis for a geochronology typically spanning about 100 yr. Its rate of delivery to water and land is essentially invariant from year to year, so the rate of transfer to a specific sedimentary site depends largely on its fate in the water column. In freshwater systems which have been affected by human activity (for example, through accelerated rates of eutrophication or altered loadings or eroded material), both the rate of transfer of 210Pb and sediment as a whole may be changing in time although the rate at which the isotope is delivered to the water surface remains constant from year to year. A general model for the expected activity of 210Pb in a continuously accumulating sediment column may be formulated by considering the rate of delivery of 210 Pb and sediment mass to be uncorrelated [further discussion of these ideas may be found in Robbins (1978)].
If r(t) is the rate of addition of sediment solids (in g cm- 2 yr. - 1) and
F(t) is the rate of transfer (flux) of excess 210Pb (in pCi cm- 2 yr. - 1 ), then
the activity (pCi g- 1) of material being deposited at the surface is:
J1(t) = F(t)/r(t) (4)
The flux, F, and activity, 11, are expressed in terms of excess 210Pb. Some 210Pb is produced by the decay of Ra (or Rn) in the core itself. This supported activity must be subtracted from the total 210Pb. In many cases the levels of supported 210Pb are roughly an order of magnitude less than surface activities of total 210Pb. The activity of excess 210Pb at a depth in the core corresponding to a time t (yr.) before collection is then:
i1(t) = F(t) exp (-At)/r(t) (5)
where 'A = 0.6932/22.26 = 0.03114 yr. -I. When the sedimentation rate has changed over time as it apparently has in
Lake Rockwell, there is no prior way to establish how F(t) has covaried with
49
r(t). It is customary to make certain extreme and simplifying assumptions about the nature of the covariance. In a system where increases in sedimentation rate are accompanied by corresponding increases in the sedimentary flux of 210Pb, the ratio F(t)/r(t) at the time of deposition is constant and is equal to the activity of excess 210Pb in surface sediments, A(O). This model is termed the constant activity (CA) or constant initial concentration (CIC, Appleby and Oldfield, 1978) model. Eq. 5 then reduces to:
A(t) = A(O) exp (-At) (6)
From this equation it follows that the age of a layer of sediment corresponding to depth Z (em) and cumulative weight, g (g cm- 2
), will be given by:
t =-A -I ln [A(g)/A(O)] (7)
This equation is termed the CA model age-depth relation. Sediment depths are expressed in terms of cumulative weight per unit area to eliminate small compaction effects.
In a system where the flux of 210Pb remains constant while the rate of sediment accumulation changes, the age-depth relation may be established by integrating the activity of excess 210Pb down the core. The total amount of excess 210Pb in the core (in pCi em - 2
) is
(total) = J A(g)dg (8)
0
where dg is the thickness of each sediment interval (g cm- 2 yr.- 1). This
total activity must be equal to the total decay-corrected flux of 210Pb, or:
J A(g)dg = J F exp (-At)dt (9) 0 0
Similarly, the integrated activity to a depth g must correspond to the integrated decay-corrected flux:
g t J A(g)dg = J F exp (-At)dt (10)
0 0
As F is assumed to be constant it may be eliminated from these equations to give the age-depth relation for the constant flux ( CF) or constant rate of supply (CRS, Appleby and Oldfield, 1978) model:
t =-A -I ln (1- n (11)
where
g
r = j A(g)dg/ j A(g)dg 0 0
[See Robbins (1978) for additional discussion.]

50
Both models represent conditions which in practice are only partially met. The CA model may be preferred for systems where the sources of increased sedimentation are exposed to inputs of excess lead 210Pb (increased erosion of surface materials having appreciable excess lead 210Pb activity) or increased scavenging of available 210Pb from the water as a result of increased suspended-solids concentrations. The CF model may be expected to apply to systems where transfer of 210Pb to sediments is already very efficient, so that additional inputs of particles cannot result in any significant additional deposition of the isotope. This would be the case, for example, in very large water bodies with long hydraulic retention times such as several of the Great Lakes where the residence time of 210Pb is the order of a year. As the loading of excess 210Pb to such lakes is almost entirely via direct atmospheric transfer, increases in sediment loads will not result in any significant increase in the flux of the isotope to sediments.
The distribution of excess 210Pb in Lake Rockwell core 1 is shown in Fig. 6. If both the sedimentation rate and flux were constant, the log of the activity would decrease linearly within sediment depth. The observed profile exhibits a striking curvature which cannot be ascribed to either analytical or stratigraphic factors. The gross sediment properties (color, texture) as well as the fraction of sediment soluble on prolonged acid extraction show no significant change with depth while the bulk density, fraction dry weight and porosity increase gradually with depth as a result of compaction but exhibit no discontinuities. The error bars associated with the excess activities reflect combined errors in activities of total and supported 210Pb. The activity of 210Pb at the surface is 25.9 ± 1.0 pCi g- 1 while the activity of supported 210Pb is 3.0 ± 1.5 pCi g- 1 •
The age-depth relations are provided in Fig. 7 for the two alternative models. Uncertainties in the determination of A(O) and the supported 210Pb activity have been propagated through the calculation of the age of each section in the case of the CA model to illustrate the level of uncertainty in age determinations and its increase with sediment depth. The CA and CF models give very different predictions of the age of sediment sections in this core. The contrast between model predictions increases with sediment depth, with the CF model predicting a lower rate of sedimentation than the CA model. It has been shown that this is a general difference between the two models when sedimentation rates are increasing (Robbins, 1978). Note that in the case of the CA model, some estimates of sediment ages near the surface are negative due to random errors in the activities. Because of the way in which the age-depth relation is established for the CF model, negative ages can never be obtained from that relation. The solid line through each set of data points is a portion of a parabola with coefficients determined via least-squares optimization.
Agreement between the age-depth relationships and a second-order polynomial indicates that the excess 210Pb profile is consistent with a linearly increasing sedimentation rate. However, the age-depth relation based on the
51
0
"' E 2 LAKE ROCKWELL (.)
'- Core No. I 2 1- 4 10 z w :::2:
6 0 w (f)
2o'E LJ._ 8 0 ~
1- I I 10 1-~
o_
-137
Cs Horizon w w 0
3 12 H9521 30 w > ti 14 _J Constant Activity ::::>
16 ~
:::2: ::::> 40 u
18 1900 1910 1920 1930 1940 1950 1960 1970 1980
AGE (Years A.D.)
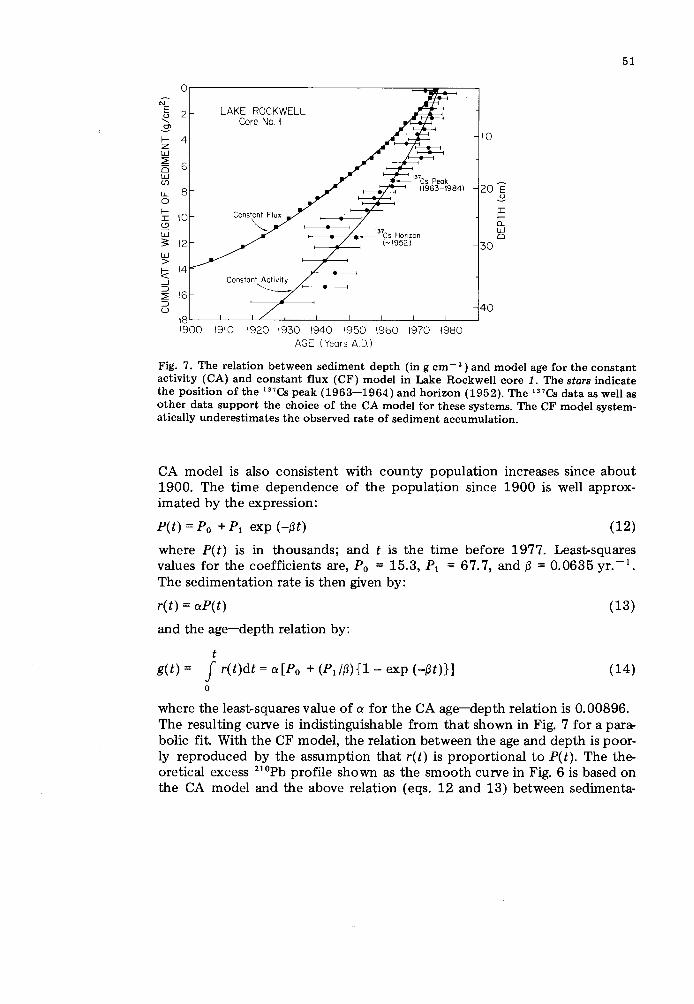
Fig. 7. The relation between sediment depth (in g em- 2 ) and model age for the constant activity (CA) and constant flux (CF) model in Lake Rockwell core 1. The stars indicate the position of the 137Cs peak (1963-1964) and horizon (1952). The 137Cs data as well as other data support the choice of the CA model for these systems. The CF model systematically underestimates the observed rate of sediment accumulation.
CA model is also consistent with county population increases since about 1900. The time dependence of the population since 1900 is well approximated by the expression:
P(t) = P 0 + P 1 exp (-~t) (12)
where P(t) is in thousands; and t is the time before 1977. Least-squares values for the coefficients are, P0 = 15.3, P 1 = 67. 7, and~ = 0.0635 yr. -I. The sedimentation rate is then given by:
r(t) = cx.P(t) (13)
and the age-depth relation by:
t g(t) = J r(t)dt = cx[P0 + (PJI~){1- exp (-~t)}] (14)
0
where the least-squares value of ex for the CA age-depth relation is 0. 00896. The resulting curve is indistinguishable from that shown in Fig. 7 for a parabolic fit. With the CF model, the relation between the age and depth is poorly reproduced by the assumption that r(t) is proportional to P(t). The theoretical excess 210Pb profile shown as the smooth curve in Fig. 6 is based on the CA model and the above relation (eqs. 12 and 13) between sedimenta-

52
tion rate and population size. The resulting sedimentation rate and county population data are shown in Fig. 8.
While the correspondence between sedimentation rate and regional population is significantly better using the CA model, that is only a weak argument for preferring it over the CF model for this lake. However, there are several more compelling arguments. First, the distribution of 137Cs is more consistent with the CA model. The position of the peak (1963-1964) and the horizon (1952) are shown on the age-depth plot (Fig. 7). Note that both points fall very close to the relation obtained from the CA model but are completely inconsistent with the CF model curve. Furthermore, the CA model time dependence of the sedimentation rate is consistent with the volumetric measures of sedimentation rate whereas the CF model rates are not.
~ 0.8 ......
C\J E ~ .9 z 0
~ _J
::::> ~ ::::> (.) (.)
<! 1-z w ~ 0 w (f)
1900
LAKE ROCKWELL Core No.I
(CA/ Population Modell
1925 1950 YEAR
•
1975
80 u; -o c 0
"' ::J 0
60 f'=
20
z 0
~ _J ::::> Q_
0 Q_
Fig. 8. The mass sedimentation rate (g em- 2 yr. -I ) in Lake Rockwell (core 1) vs. year based on an exponential population growth model (eq. 13). Individual points are county population census data. There is no a priori reason why future increases in population should be accompanied by corresponding increases in sedimentation rate.
Comparison of sedimentation rates
The mean sedimentation rates for various periods and methods for the three systems are summarized in Table IV. Because some observations are reported in linear units, all values have been converted to mean linear sedimentation rates for purposes of comparison. For Lake Rockwell the volumetrically determined sedimentation rates agree well with the CAfpopulation model values for 210Pb and with rates based on analysis of 137Cs profiles in two cores. As expected, the CF model values shown for comparison do
53
not agree as well. Since volumetrically determined sedimentation rates represent an average over the entire lake, it is clear that the two cores are representative of the lake as a whole. The increase in sedimentation rates over the past few decades is also seen in the varve data from Mayfair Lake and to a less compelling extent in the East Branch Reservoir core as well. For comparison, the population model has been evaluated to provide a rough prediction of the mean linear sedimentation rate for each period. Increases in sedimentation rate in all three reservoirs are consistent with increases in regional population since 1900.
It is likely that the long-term increase in sedimentation rate in the three reservoirs is due to the increasing human use - primarily residential, commercial and light manufacturing- of the drainage basins. Most of the drainage basins of Lake Rockwell and East Branch is in Geauga County, Ohio. The population increase in the county dates from the 1930's, which is also the time over which the sedimentation rate in Lake Rockwell has been increasing. The doubling time of population size is ~19 yr., a value seen to be very similar to the doubling time of sedimentation rate in all three reservoirs. It is likely that most of the increased load of sediment delivered to the reservoir is due to increased erosion and not to increased runoff. Annual averages of runoff from Lake Rockwell are variable (x = 7.93 m 3 s- 1 ; s =
1. 78), but a linear regression on the flow data indicates that there has been only a 26% increase in Lake Rockwell outflow (6.74-8.50 m 3 s- 1
) from 1940 to 1980. The increase in sedimentation rate over the same time interval is over 10 times larger (381%). The higher sedimentation rate in Mayfair
+ Cs137
(Whole Profile) '-
X L.R. 210
Pb >.
' E 2 o L.R. Surveys JJ.t' 3 • L.R. Cores ML
w o E.B. Surveys
6 ~ • E.B. Cores
~ 6 M.L. Surveys 0:: • M.L. Core
z /:' 0
~ ~/~~ f--z w :::2: /G 0 w 0 (f)
0 1940 1960
YEAR
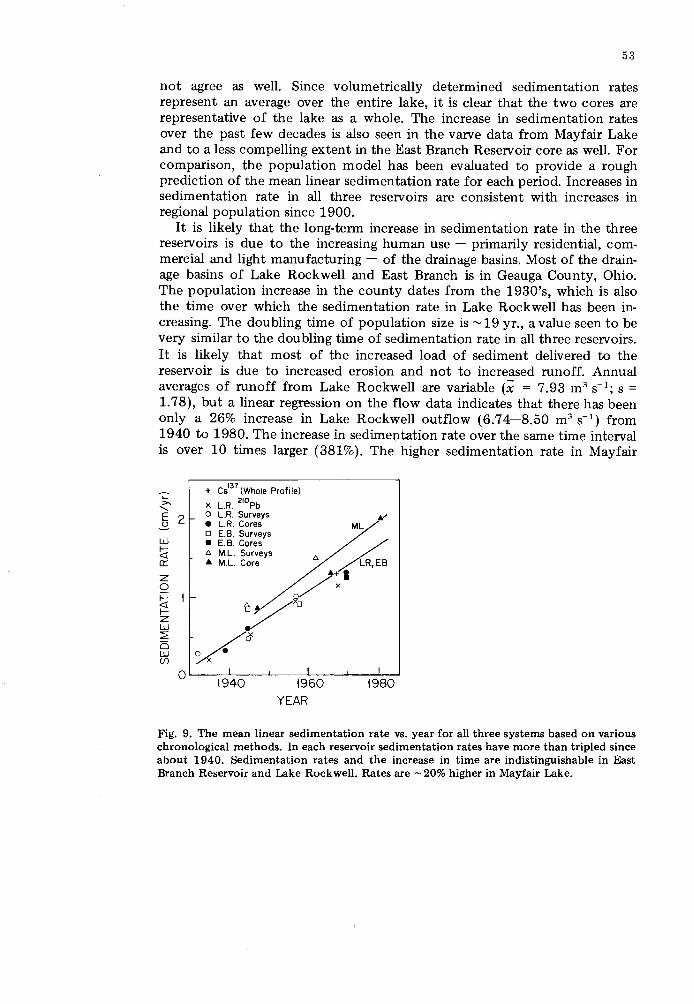
Fig. 9. The mean linear sedimentation rate vs. year for all three systems based on various chronological methods. In each reservoir sedimentation rates have more than tripled since about 1940. Sedimentation rates and the increase in time are indistinguishable in East Branch Reservoir and Lake Rockwell. Rates are -20% higher in Mayfair Lake.

54
Lake may be due either to the difference in the ratio of drainage area to basin volume or to the fact that the population density in the drainage basin of Mayfair Lake has greatly increased since the 1950's and is now - 10 times that of Lake Rockwell (Gamer, 1982).
The changes in mean linear sedimentation rate in the three reservoirs as determined by the several different methods are summarized in Fig. 9.
137Cs and variable sedimentation rates
In the above discussion of 137Cs profiles, theoretical distributions were calculated assuming that over the period from about 1950 to 1977, the sedimentation rate was constant. If they have increased considerably over the period, as several lines of evidence suggest, then theoretical profiles should be recomputed using the best estimates of r(t) and some assumption about the covariance of the loading of 137Cs to the system as a function of r(t). Although the evidence suggests that for 210Pb, the flux and r(t) are well correlated, it is not clear how to specify this covariance under non-steadystate conditions for 137Cs. Two contrasting models offer themselves in the absence of specific knowledge of how changing rates of erosion of materials from the drainage basin affect the transfer of 137Cs. Both models assume that the loading of the radionuclide to the reservoir is given by eq. 2, so that the storage on the drainage basin is characterized by a constant residence time. The first model, in analogy with the constant activity model, assumes that the activity at the time of deposition is proportional to this loading so that the activity with depth is:
A(g) = (const.) L(t) exp (-At) (15)
where the age-depth relation (g vs. t) is given by theCA/population model from 210Pb. The above relation envisions that the increase in loading of the isotope is accompanied by a corresponding increase in sedimentation rate. The alternative model assumes that the loading of 137Cs is completely uncorrelated with sedimentation rate so that the profile is given by:
A(g) = (const.) L(t)/r(t) exp (-At) (16)
This model is analogous to the CF model. In the case of 137Cs it is clear that neither model is strictly correct since increases in sedimentation rate must be accompanied by a decrease in watershed residence time. However, that relationship is not specifiable a priori and cannot be reliably inferred from analysis of 137Cs distributions in only a few cores and little supplementary information about characteristics of the drainage basin. Thus the two models serve primarily to illustrate the effects of variable sedimentation rates on such distributions but have limited usefulness in characterizing the nature of the integrative processes. The results of applying the CA analog model are shown as the smooth (dashed line) curves in Figs. 5 and 6. The general result

55
of introducing variable sedimentation rates and the CA analog model is to: (1) reduce the apparent watershed residence time; (2) sharpen the peak; and (3) reduce the apparent range of penetration of 137Cs near the horizon. The quality of the fits is uniformly worse, but not by much. Theoretical distributions of 137Cs using the CF analog model ( eq. 16) are not significantly different from the CA model distributions shown and are in fact experimentally indistinguishable. The major difference between the two models is in the estimates of system integration time. As shown in Table V, the CF analog model predicts longer integration times than the CA model. This arises because division of the loading (Lin eq. 16 above) by a sedimentation rate which is increasing toward the sediment surface results in a relatively lower predicted activity which must be compensated by increased integration in order to reproduce the observed distributions.
While both variable sedimentation rate models improve the location of the peak position, they underestimate the observed penetration of the isotope near the horizon by ~1 em (0.5 gem -:2 ). The discrepancy can be removed by assuming a higher sedimentation rate in the 1950's than that based on 210Pb (constant sedimentation rate model) or alternatively by invoking some slight diffusional mobility of the isotope. An effective diffusion coefficient associated with the spread in a concentration front is given by Crank (1957):
(17)
where tiZ is the characteristic length; and Cit is the elapsed time. In this core tiZ is the order of 1 cm/20 yr., so from eq. 17 the effective diffusion coefficient would be around 0.03 cm2 yr. - 1
• The effective molecular diffusion coefficient is given by Li and Gregory (1974):
De~ cxe- 2 (1 + K)- 1 D 0
where the term cxe - 2, is nearly unity for these sediments; K is the dimen
sionless distribution coefficient; and D 0 is the diffusion coefficient of 137Cs in free solution (~150 cm2 yr.- 1
). The above values imply a distribution coefficient of 5 ·103 which is comparable to values reported by others for short-term uptake experiments with freshwater sediments ( cf. Robbins et al., 1979). While some limited mobility of the isotope appears plausible, it should be noted that the mobility of 137Cs depends strongly on the type of sediments in question and that the distribution coefficient for the Lake Rockwell sediments is unknown.
The effect of varying system integration times on the distribution of 137Cs is illustrated in Fig. 10. The calculations are based on the CA analog model (eq. 15). Note that for integration times comparable to the half-life of 137Cs, the calculated distribution varies considerably near the interface and at the peak. However, for times greater than ~50 yr., calculated profiles are very insensitive to the assumed value of Tr. In fact Tr = 50 yr. is experimentally

56
indistinguishable from Tr = 5000 yr.! Varying the integration time has essentially no effect on the location of the 137Cs horizon, since the integration occurs outside the sediment core.
N
E u ...... 2 ~ :r: (.!)
0
w ~
w > ~ _j
::::> :2 aw
137Cs (pCi/g)
2
Fig. 10. Theoretical distributions of 137Cs in the Lake Rockwell core 1 for various system integration times. Near-surface and peak activities are especially sensitive to changes in the integration time between 0 and -30 yr. For times greater than 50 yr., profiles are extremely insensitive to the choice of time.
Total 137Cs and excess 210Pb
The total amount of 137Cs and 210Pb in each core, provided in Table VI, may be compared with the amount expected via direct atmospheric transfer. The average amount of 137Cs in the two Lake Rockwell cores is 22.5 pCi cm- 2 as compared with an atmospheric load of ~8 pCi cm- 2 [decay corrected to 1977 (see Edgington and Kartunnen, 1977)]. In Lake Rockwell core 1 the total excess 210Pb is 231 pCi em - 2 as compared with an expected standing crop of 23 pCi em - 2 based on regional atmospheric deposition measurements (Talbot and Andren, 1983). Thus ~3 times as much 137Cs and 10 times as much 210Pb has accumulated at these locations as can be accounted for by direct atmospheric deposition. For 137Cs this factor is comparable to that found in other reservoir/drainage basin systems. Ritchie et al. (1973) reported that the concentrations of 137Cs per unit area of reservoir sediments in three small watersheds in northern Mississippi were 2.8, 3.8 and 4.0 times that of the soils in their respective watersheds, thus indicating that the reservoirs were acting as traps for this radionuclide. There are two alternative explanations for the enhanced deposition: either these radionuclides are focused into selected areas of the lake or the drainage basin is a major source. Without far more extensive coring of the lake itself it is impossible to rule out focusing. However, the two cores are apparently
I
57
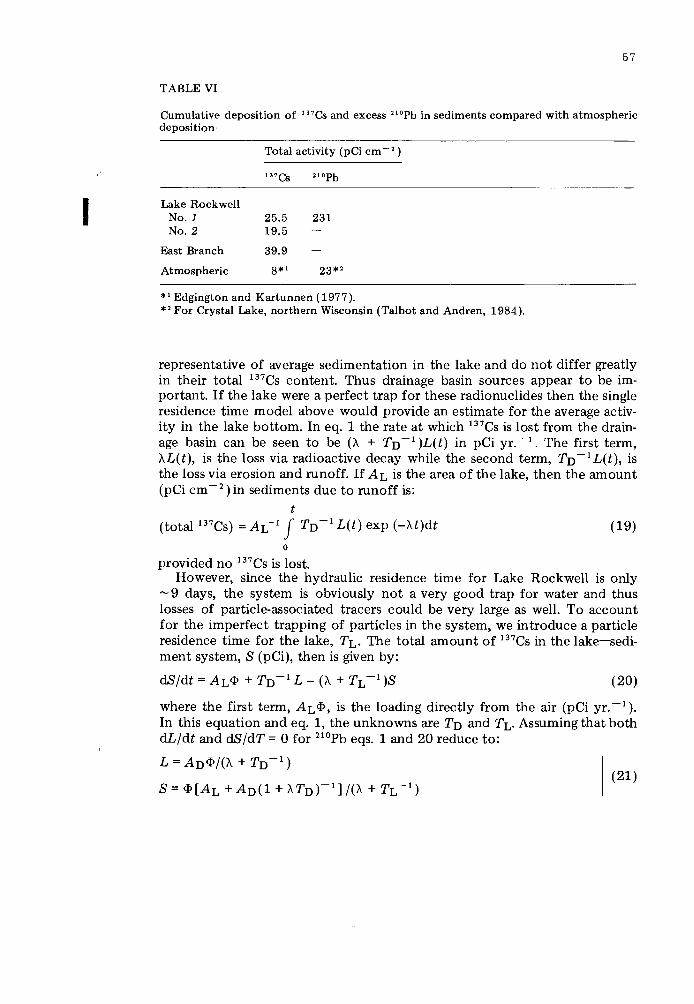
TABLE VI
Cumulative deposition of 137Cs and excess 210Pb in sediments compared with atmospheric
deposition
Total activity (pCi cm- 2)
137Cs 21opb
Lake Rockwell No. 1 25.5 231 No.2 19.5
East Branch 39.9
Atmospheric 8*' 23* 2
*'Edgington and Kartunnen (1977). * 2 For Crystal Lake, northern Wisconsin (Talbot and Andren, 1984).
representative of average sedimentation in the lake and do not differ greatly in their total 137Cs content. Thus drainage basin sources appear to be important. If the lake were a perfect trap for these radionuclides then the single residence time model above would provide an estimate for the average activity in the lake bottom. In eq. 1 the rate at which 137Cs is lost from the drainage basin can be seen to be (A. + To -I )L(t) in pCi yr. -I. The first term, A.L(t), is the loss via radioactive decay while the second term, To -I L(t), is the loss via erosion and runoff. If AL is the area of the lake, then the amount (pCi em - 2
) in sediments due to runoff is: t
(total 137Cs) =AL-I J To- 1 L(t) exp (-At)dt
0
provided no 137Cs is lost.
(19)
However, since the hydraulic residence time for Lake Rockwell is only ~ 9 days, the system is obviously not a very good trap for water and thus losses of particle-associated tracers could be very large as well. To account for the imperfect trapping of particles in the system, we introduce a particle residence time for the lake, TL. The total amount of 137Cs in the lake-sediment system, S (pCi), then is given by:
dSjdt = AL<l> + Tn -I L- (A. + TL -I )S (20)
where the first term, AL<l>, is the loading directly from the air (pCi yr. -I). In this equation and eq. 1, the unknowns are Tn and TL· Assuming that both dLjdt and dS/dT = 0 for 210Pb eqs. 1 and 20 reduce to:
L = An<I>/(A. + Tn -I) 1 (21)
S = <I>[AL + An(1 + A.Tn)- 1] /(A.+ TL -I)

58
The total activity of 210Pb per unit area of the lake is then SIAL and hence:
P (pCi cm- 2) =SIAL= <I>[1 + ADAL - 1 (1 + A.TD)- 1 ]1(/.. + TL- 1
) (22)
and the relation between TL and TD is:
TL = -yl[/..{1- 'Y + ADAL - 1 (1 + t..TD)- 1 }] (23)
and 'Y is the ratio of the total excess 210Pb to the standing crop, 'Y = P(<I>It..)- 1
= 10 (see Table VI). For values of the system integration time implied by distributions of 137 Cs, ~ 10-20 yr., the value of TL is ~ 2 yr. as determined from the above equation. Note that as TD increases, the loading of 210Pb from the drainage basin decreases, so for a given value of -y, TL must increase to compensate for reduced inputs. For complete trapping of particles, in the reservoir (TL = oo), the system integration time, TD, is ~650 yr. Thus integration times greater than this value cannot produce the observed deposition of 210Pb.
The non-steady-state solution of eqs. 1 and 20 for 137Cs gives a value of TL of ~0.5 yr. for values of TD in the range of 10-20 yr. As the models are only approximate and the atmospheric loadings are poorly known, it is not clear if the difference between values of TL based on 210Pb and 137Cs are real. For the East Branch Reservoir a calculation gives a residence time of~ 5 yr. for a watershed residence time of 10-20 yr. These residence times correspond to 13% of the 137Cs and 60% of the 210Pb retained in Lake Rockwell per year and to 82% of the 137Cs retained in East Branch Reservoir per year. In the study of three reservoirs by Ritchie et al. (1973), the trapping efficiencies were 57%, 38% and 25%, respectively. Thus the values obtained in this analysis are consistent with previously reported values.
In Lake Rockwell, losses predicted from a watershed erosion model are also in general agreement with activities observed in sediment cores. Ritchie et al. (1973) found that, in general, the total amount of 137Cs lost from the watershed could be related to the erosion rate (t ha- 1 yr. -I)* by:
(%of total)= 1.6 X (erosion rate) 0• 68 (24)
The erosion rate inferred from the data in Table I, assuming a mean density of sediment solids of 2.6 g cm- 3 , is 0.64 t ha- 1 yr.- 1 • From the above relation the expected loss of the radionuclide would be 1.2% of the total stored on the watershed or 0.51 Ci. The amount contributed to sediments is then ~18 pCi cm- 2 plus another 8 pCi cm- 2 from direct atmospheric transfer for a total of 26 pCi em - 2 • The observed activity is 23 pCi em - 2
•
For the East Branch Reservoir the activity is about twice as high as that predicted by the above relation (see Table VII). Considering the approximations involved, the agreement is satisfactory.
*1 t = 1 tonne = 10 3 kg; 1 ha = 1 hectare = 0.01 km2 •
59
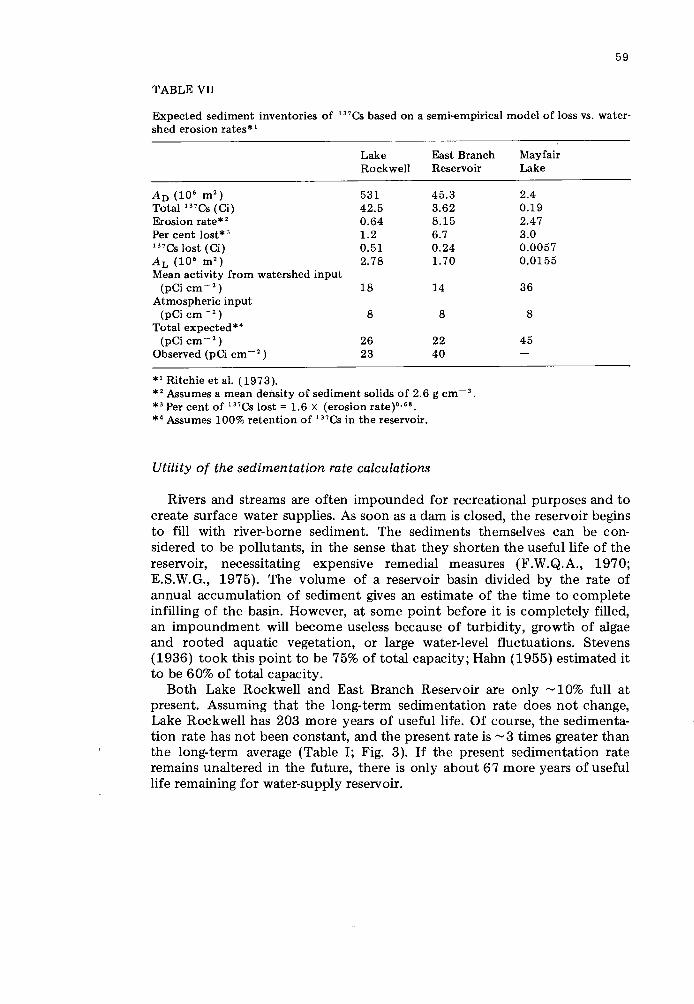
TABLE VII
Expected sediment inventories of 137Cs based on a semi-empirical model of loss vs. watershed erosion rates* 1
Lake East Branch Rockwell Reservoir
Ao (10 6 m 2) 531 45.3
Total 137Cs (Ci) 42.5 3.62 Erosion rate* 2 0.64 8.15 Per cent lost* 3 1.2 6.7 137 Cs lost (Ci) 0.51 0.24 AL (10 6 m 2
) 2.78 1.70 Mean activity from watershed input
(pCi cm- 2) 18 14
Atmospheric input (pCi cm- 2
) 8 8 Total expected* 4
(pCi cm- 2) 26 22
Observed (pCi em- 2 ) 23 40
* 1 Ritchie et al. (1973). * 2 Assumes a mean density of sediment solids of 2.6 g cm- 3
•
*'Per cent of 137Cs lost= 1.6 X (erosion rate)0•68
•
* 4 Assumes 100% retention of 137 Cs in the reservoir.
Utility of the sedimentation rate calculations
Mayfair Lake
2.4 0.19 2.47 3.0 0.0057 0.0155
36
8
45
Rivers and streams are often impounded for recreational purposes and to create surface water supplies. As soon as a dam is closed, the reservoir begins to fill with river-borne sediment. The sediments themselves can be considered to be pollutants, in the sense that they shorten the useful life of the reservoir, necessitating expensive remedial measures (F.W.Q.A., 1970; E.S.W.G., 1975). The volume of a reservoir basin divided by the rate of annual accumulation of sediment gives an estimate of the time to complete infilling of the basin. However, at some point before it is completely filled, an impoundment will become useless because of turbidity, growth of algae and rooted aquatic vegetation, or large water-level fluctuations. Stevens (1936) took this point to be 75% of total capacity; Hahn (1955) estimated it to be 60% of total capacity.
Both Lake Rockwell and East Branch Reservoir are only -10% full at present. Assuming that the long-term sedimentation rate does not change, Lake Rockwell has 203 more years of useful life. Of course, the sedimentation rate has not been constant, and the present rate is -3 times greater than the long-term average (Table I; Fig. 3). If the present sedimentation rate remains unaltered in the future, there is only about 67 more years of useful life remaining for water-supply reservoir.
60
Mayfair Lake, on the other hand, is already -50% full of sediment, and with an unchanged long-term rate of infilling, will have only seven more years of useful life. In fact, the sediment survey of Mayfair Lake was prompted by complaints from shoreline residents of algal growth, foul odors in the lake, and shallowing of the upstream portion of the reservoir. While some improper sewer connections upstream of the lake have exacerbated pollution problems (Garner, 1982), such problems are typical of aging lakes. If the present high rate of sedimentation continues, Mayfair Lake will have less than five more years of useful life.
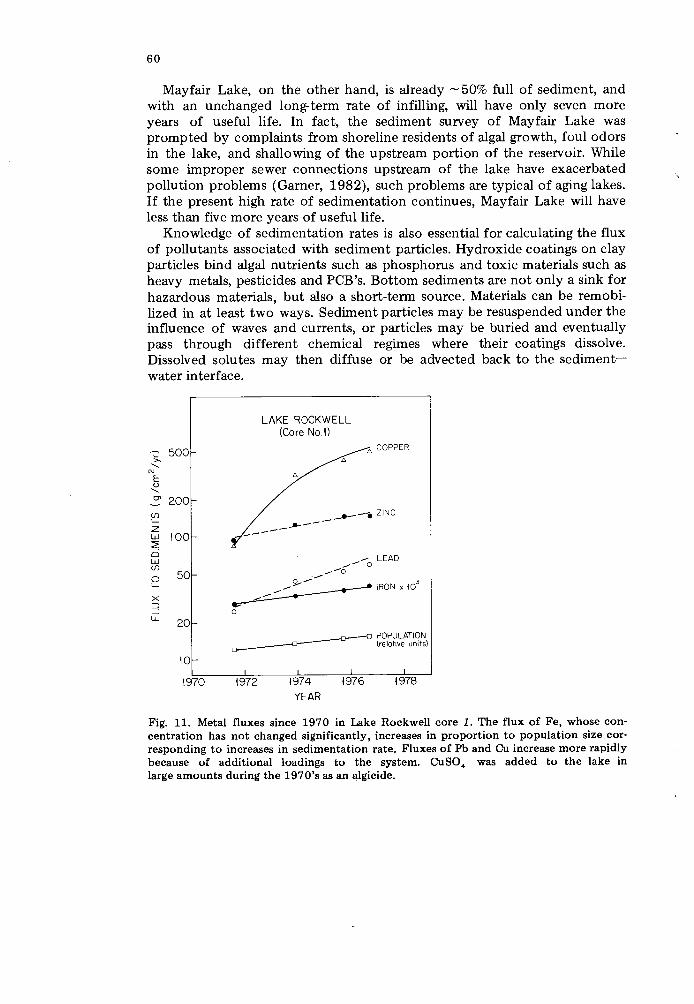
Knowledge of sedimentation rates is also essential for calculating the flux of pollutants associated with sediment particles. Hydroxide coatings on clay particles bind algal nutrients such as phosphorus and toxic materials such as heavy metals, pesticides and PCB's. Bottom sediments are not only a sink for hazardous materials, but also a short-term source. Materials can be remobilized in at least two ways. Sediment particles may be resuspended under the influence of waves and currents, or particles may be buried and eventually pass through different chemical regimes where their coatings dissolve. Dissolved solutes may then diffuse or be advected back to the sedimentwater interface.
~ 500 >-'-
N
E u '-~ 200 en I-z w 100 ::2: 0 w en 0 50 I-
X :::J _j
LL
1970
LAKE ROCKWELL (Core No.O
"' 6
·6 COPPER
. _____ ....... ----·--·ZINC
...-...- LEAD ...- 0 ...-...-o
g......-...~IR0Nxl03
0
_ _--a----0 POPULATION ~ (relative units)
1972 1974 YEAR
1976 1978
Fig. 11. Metal fluxes since 1970 in Lake Rockwell core 1. The flux of Fe, whose concentration has not changed significantly, increases in proportion to population size corresponding to increases in sedimentation rate. Fluxes of Pb and Cu increase more rapidly because of additional loadings to the system. CuSO 4 was added to the lake in large amounts during the 1970's as an algicide.
61
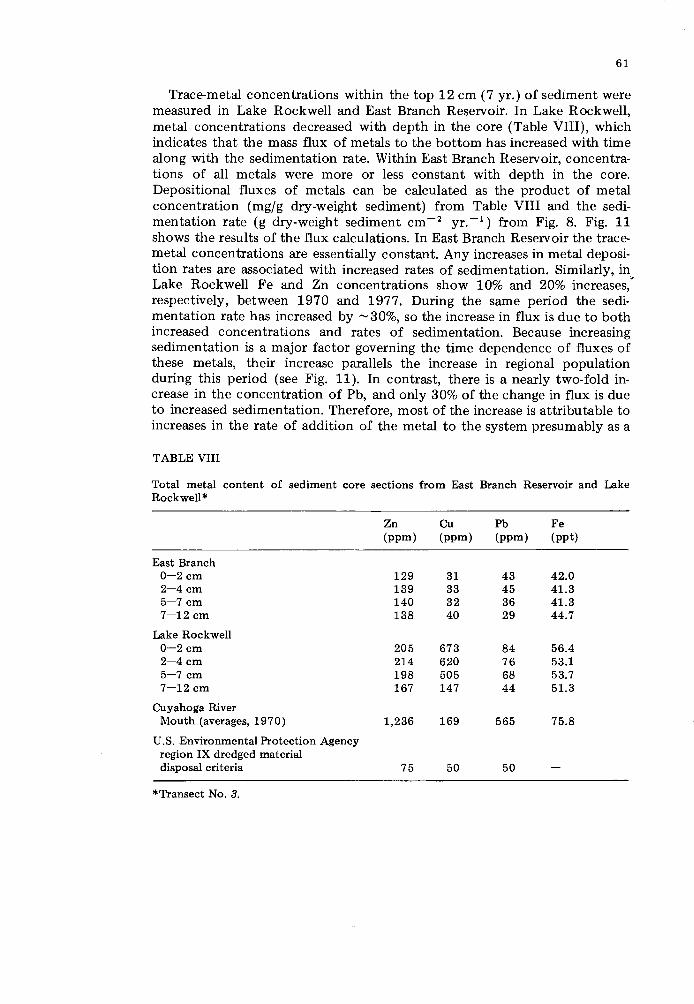
Trace-metal concentrations within the top 12 em (7 yr.) of sediment were measured in Lake Rockwell and East Branch Reservoir. In Lake Rockwell, metal concentrations decreased with depth in the core (Table VIII), which indicates that the mass flux of metals to the bottom has increased with time along with the sedimentation rate. Within East Branch Reservoir, concentrations of all metals were more or less constant with depth in the core. Depositional fluxes of metals can be calculated as the product of metal concentration (mgjg dry-weight sediment) from Table VIII and the sedimentation rate (g dry-weight sediment em -z yr. -l) from Fig. 8. Fig. 11 shows the results of the flux calculations. In East Branch Reservoir the tracemetal concentrations are essentially constant. Any increases in metal deposition rates are associated with increased rates of sedimentation. Similarly, in Lake Rockwell Fe and Zn concentrations show 10% and 20% increases,' respectively, between 1970 and 1977. During the same period the sedimentation rate has increased by -30%, so the increase in flux is due to both increased concentrations and rates of sedimentation. Because increasing sedimentation is a major factor governing the time dependence of fluxes of these metals, their increase parallels the increase in regional population during this period (see Fig. 11). In contrast, there is a nearly two-fold increase in the concentration of Pb, and only 30% of the change in flux is due to increased sedimentation. Therefore, most of the increase is attributable to increases in the rate of addition of the metal to the system presumably as a
TABLE VIII
Total metal content of sediment core sections from East Branch Reservoir and Lake Rockwell*
Zn Cu Pb Fe (ppm) (ppm) (ppm) (ppt)
East Branch 0-2cm 129 31 43 42.0 2-4cm 139 33 45 41.3 5-7 em 140 32 36 41.3 7-12 em 138 40 29 44.7
Lake Rockwell 0-2cm 205 673 84 56.4 2-4cm 214 620 76 53.1 5-7 em 198 505 68 53.7 7-12 em 167 147 44 51.3
Cuyahoga River Mouth (averages, 1970) 1,236 169 565 75.8
U.S. Environmental Protection Agency region IX dredged material disposal criteria 75 50 50
*Transect No. 3.
62
result of the continuing widespread use of leaded fuel additives and the subsequent deposition of combustion products on the watershed and directly into the reservoir.
Particularly dramatic is the increase in deposition rates of Cu from 1970 to 1977. At the present time, Lake Rockwell surface sediments receive ~10 times the amount of Cuper year as sediments of East Branch Reservoir. Concentrations of Cu are 10 times those recommended for "clean" sediments (Table VIII). Most of the Cu is probably the result of the addition of CuS04 to the reservoir to control algal growth in the water column in late summer. Historical records show that ~ 2.34 · 107 g Cu were added to the reservoir over the period 1970-1977. Based on a single core, ~4.2·107 g Cu are stored in the lake sediments for the same period. Thus a considerable fraction of the sediment inventory is apparently attributable to direct additions of Cu to the lake. The effects of these additions on fish or bottom fauna are unknown, but bacterial populations have apparently been little affected. The standing crop of bacteria in Lake Rockwell is over twice that in East Branch Reservoir (11.7·109 vs. 4.7·109 bacteria/g dry-weight sediment). Some of the differences may be due to the sulphate, a bacterial nutrient, added with the Cu. Bacteria remineralize organic matter, which raises the possibility that a material added to prevent algal growth may over the longerterm result in increased production.
CONCLUSIONS
In this paper we have shown that several different approaches to determining sedimentation rates in reservoirs are generally self-consistent and indicate that rates of sediment accumulation have increased dramatically since the mid 1940's in three separate systems. Within experimental uncertainties, sedimentation rates expressed in centimeters per year have increased linearly since about 1940 and mass sedimentation rates are essentially proportional to exponential increases in regional population during the past three decades.
Mayfair Lake has a higher sedimentation rate than Lake Rockwell and a 10 times higher population density. The association of increased population size with increased reservoir sedimentation rate and trace-metal flux is typical of a number of other different reservoirs with a variety of soil types (Guy and Ferguson, 1962; Kautzman and Cavaroc, 1973). A 25% increase in average runoff in Lake Rockwell from 1941 to 1978 may also be due to urbanization. Because of increased rates of sedimentation, the useful life of Lake Rockwell has already been reduced from 203 to 67 yr. If sedimentation rates continue to increase with population growth, the useful life of this and related systems in the region could be even more strikingly diminished.
As these reservoirs possess a well-established change of sedimentation rate, they provide a means for testing alternative models for 210Pb dating. The constant activity (CA) model is clearly preferred over the constant flux
63
model (CF) in these systems. In the CA model the flux of excess 210Pb is proportional to the rate of sediment accumulation. Evidently increases in the rate of erosion from the drainage basin results in the introduction of materials to the reservoir which have appreciable excess 210Pb at concentrations which have not changed greatly with urbanization of the drainage basin. 210Pb is evidently a useful tool for determining changing rates of sedimentation in reservoirs, but inferred sedimentation rates depend critically on the models used in analysis of profiles. The validity of the 210Pb method applied to systems with changing sedimentation rates should always be checked by alternative geochronological techniques.
Distribution of fallout 137Cs exhibits far higher surface activity than expected from direct atmospheric deposition. This feature is the result of integrative processes occurring within the reservoir-watershed system. The integration process, characterized by times of one to several decades, is probably not localized within sediments but is either the result of sediment redistribution processes within the reservoir or, more likely, a property of the drainage basin itself. Roughly 3 times as much 137Cs and 10 times as much 210Pb are deposited in sediments than can be due to direct transfer from the atmosphere. If the cores are representative of each reservoir, then drainage basins are contributing most of these radionuclides to the reservoirs. For drainage basin residence times on the order of 10-20 yr. the reservoirs must be between 14% and 82% efficient in trapping 137Cs and 60% efficient in trapping 210Pb to produce the observed total amount in sediments.
ACKNOWLEDGEMENTS
The authors thank K.A. Johansen of the University of Michigan, Great Lakes Division, for his assistance in preparation and counting some of the sediment samples. Kim McCullough and Sharon Matis assisted in the field and made laboratory geochemical determinations. Charles Hahn (O.D.N.R.) provided his field notes and useful conversation about his earlier surveys on these reservoirs. They thank also the City of Akron Department of Public Service, Public Utilities Bureau-Water, and especially Mr. Joseph Hobroken, for assistance in the field and for information about the water-supply reservoirs. This work was supported by grants to P. McCall from the Northeast Ohio Areawide Coordinating Agency and to G. Matisoff from the Cuyahoga County Regional Sewer District. This study was partially carried out while one author (J.A.R.) was at the University of Michigan, Great Lakes Research Division. Support of that organization is gratefully acknowledged. Contribution No. 373 of the Great Lakes Environmental Research Laboratory.
REFERENCES
AP.H.A (American Public Health Association), 1976. Standard Methods for the Examination of Water and Wastewater. Am. Publ. Health Assoc. (A.P.H.A.)-Am. Water
64
Works Assoc. (A.W.W.A.)---Water Pollut. Control. Fed. (W.P.C.F.), Washington, D.C., 14th ed., 1193 pp.
Appleby, P.G. and Oldfield, F., 1978. The calculation of lead-210 dates assuming a constant rate of supply of unsupported lead-210 to the sediment. Catena, 5: 1-18.
Berner, R.A., 1980. Early Diagenesis: A Theoretical Approach. Princeton University Press, Princeton, N.J., 241 pp.
Crank, J., 197 5. The Mathematics of Diffusion. Clarendon, Oxford, 414 pp. Edgington, D.N. and Kartunnen, J., 1977. Distribution of cesium-137 in Lake Erie.
Radio!. Environ. Res. Div., Argonne Nat!. Lab., Annu. Rep., Ecol., Jan.-Dec. 1977, No. ANL-77-65, pp. 105-110.
E.S.W.G. (Erosion and Sedimentation Work Group), 1975. Erosion and Sedimentation, Great Lakes Basin Framework Study, Appendix 18, Great Lakes Basin Comm., Ann Arbor, Mich.
F. W.Q.A (Federal Water Quality Administration), 1970. Urban soil erosion and sediment control. U.S. Dep. Inter., Washington, D.C., Water Pollut. Control Res. Serv. N15030 DTL 05/70.
Garner, J.J., 1982. An evaluation of Mayfair Lake, Richmond Heights, Ohio. Cuyahoga Co., Sanit. Eng. Dep., Cleveland, Ohio.
Gottschalk, L.C., 1951. Measurement of sedimentation in small reservoirs. Proc. Am. Soc. Civ. Eng., J. Hydraul. Div., 77: 1-11.
Guy, H.P. and Ferguson, G.E., 1962. Sediment in small reservoirs due to urbanization. Proc. Am. Soc. Civ. Eng., J. Hydraul. Div., 88: 27-37.
Hahn, C.L., 1955. Reservoir sedimentation in Ohio. Ohio Dep. Nat. Res., Div. Water Bull. No. 24, 87 pp.
H.A.S.L. (Health and Safety Laboratory), 1977. Final tabulation of monthly 90 Sr fallout data: 1954-1976. Energy Res. Dev. Adm., Environ. Measur. Lab., New York, N.Y., Environ. Q. Rep., HASL-329, Oct. 1, 1977, 401 pp.
Heineman, H.G. and Dvorak, V.I., 1963. Improved volumetric survey and computation procedures for small reservoirs. Proc. Fed. Inter-Agency Sediment. Conf., U.S. Dep. Agric., Washington, D.C., Publ. No. 970, pp. 840-856.
Hough, J.L., 1958. Geology of the Great Lakes. University of lllinois Press, Urbana, TIL, 313 pp.
Kautzman, R.R. and Cavoroc, V. V., 1973. Temporal relation between urbanization and reservoir sedimentation: a case study in the North Carolina Piedmont. Bull. Assoc. Eng. Geol., 10: 195-218.
Li, Y.H. and Gregory, S., 1974. The diffusion of ions in seawater and in deep sea sediments. Geochim. Cosmochim. Acta, 38: 703-708.
Pennington, W., Cambray, R.S., Eakins, J.D. and Harkness, D.D., 1976. Radionuclide dating of the recent sediments of Bielham Tarn. Freshwater Bioi., 6: 317-328.
Perkin-Elmer, Inc., 1964. Analytical Methods for Atomic Absorption Spectrophotometry. Perkin-Elmer, Inc., Norwalk, Conn.
Ritchie, J.C., McHenry, R.R. and Gill, A.C., 1973. Dating Recent reservoir sediments. Limnol. Oceanogr., 18: 254-263.
Robbins, J.A., 1978. Geochemical and geophysical applications of radioactive lead. In: J.O. Nriagu (Editor), The Biogeochemistry of Lead in the Environment. Elsevier, Amsterdam, pp. 285-393.
Robbins, J.A. and Edgington, D.N., 1975. Determination of recent sedimentation rates in Lake Michigan using lead-210 and cesium-137. Geochim. Cosmochim. Acta, 39: 285-304.
Robbins, J.A., Edgington, D.N. and Kemp, A.L.W., 1978. Comparative lead-210, cesium-137, and pollen geochronologies of sediments from Lakes Ontario and Erie. Quat. Res., 10: 256-278.
Robbins, J.A., McCall, P.L., Fisher, J.B. and Krezoski, J.P., 1979. Effect of deposit feeders on migration of 137Cs in lake sediments. Earth Planet. Sci. Lett., 42: 277-287.

65
Schulz, R.K., 1965. Soil chemistry of radionuclides. Health Phys., 11: 1317-1324. Stevens, J.C., 1936. The silt problem. Trans. Am. Soc. Civ. Eng., 101: 207-288. Talbot, R.W. and Andren, A.W., 1984. Dynamics, fluxes and disequilibria of Pb-210 and
Po-210 in Crystal Lake. Geochim. Cosmochim. Acta (in press). Tamura, T. and Jacobs, D.G., 1960. Structural implications in cesium sorption. Health
Phys., 2: 391-396.