Embed Size (px)
Citation preview

Chemical Engineering Research in the US
Arvind VarmaR. Games Slayter Distinguished Professor
Davidson School of Chemical EngineeringPurdue University
West Lafayette, IN 47907, USA
10th World Congress of Chemical EngineeringBarcelona, SpainOctober 3, 2017

Outline
Overview of Academic ChE Research in the US
Overview of Research Funding in the US

Outline
Overview of Academic ChE Research in the US
Overview of Research Funding in the US

The Paradigms of ChE
Unit Operations (1915)
W. H. WalkerA. D. Little W. K. Lewis
Transport Phenomena, 1960
N. Amundson R. Aris R. SargentJ. Prausnitz A. Acrivos
Engineering Science (1950s)

Molecular Engineering -The Current Paradigm
Incorporation of biotechnology and nanotechnology in the ChE discipline Shared with other engineering and science fields, like paradigm 2. Growing feasibility to conduct molecular-scale simulations to calculate
thermodynamic, transport, and other properties of fluids and materials Being applied currently with greater frequency and success for the
analysis and design of ChE products and processes.
Molecular Engineering
R. Langer G. Whitesides
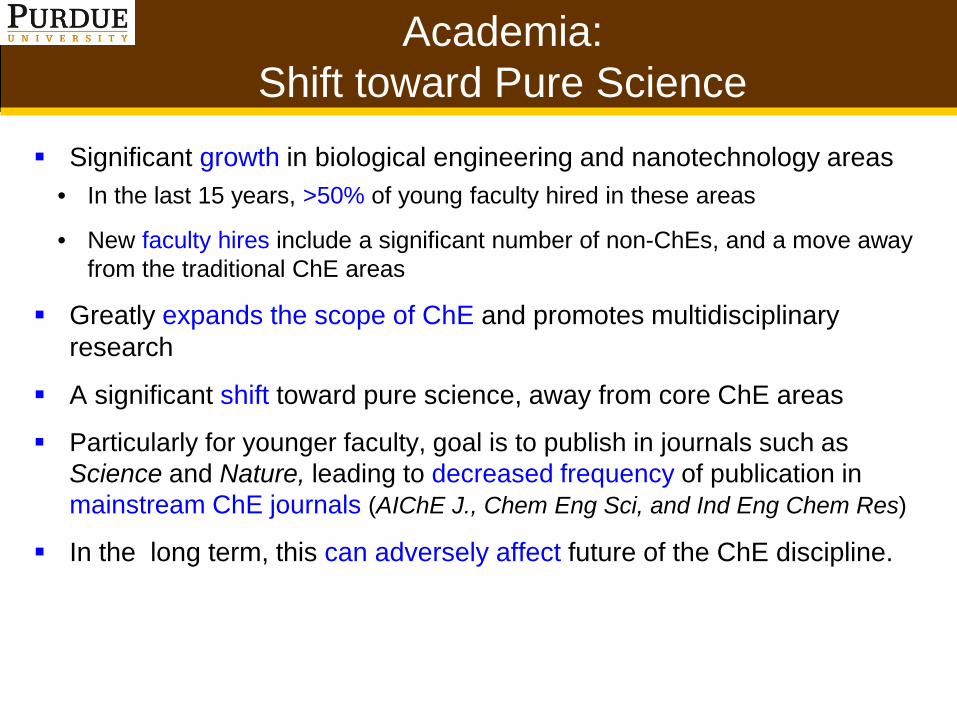
Academia: Shift toward Pure Science
Significant growth in biological engineering and nanotechnology areas• In the last 15 years, >50% of young faculty hired in these areas
• New faculty hires include a significant number of non-ChEs, and a move away from the traditional ChE areas
Greatly expands the scope of ChE and promotes multidisciplinary research
A significant shift toward pure science, away from core ChE areas
Particularly for younger faculty, goal is to publish in journals such as Science and Nature, leading to decreased frequency of publication in mainstream ChE journals (AIChE J., Chem Eng Sci, and Ind Eng Chem Res)
In the long term, this can adversely affect future of the ChE discipline.

Industry-Academia Disconnect
Ranking by Companies of Relative Importance of Areas
Skill Average relativeimportance (from 1 to 5)
Unit operations, transport phenomena,thermodynamics, separation processes 4.6
Reaction engineering, catalysis, kinetics 4.0
Analysis, modeling, simulation, process control 4.0
Materials, surface science, polymers 3.2
Biotechnology, medical and life sciences 2.1
Nanotechnology and its applications 1.8
Faculty Increase in Biological Engineering and Unit Operation AreasRank of Professor Biological Eng. Unit Operations
Professor 22% -16%
Associate Professor 26% -12%
Assistant Professor 36% -6%
Session organized by late John Chen, AIChE annual meeting, San Francisco, 2013

Recent Trends in Research
ChE research in the last decade has been largely dominated by biologically-oriented engineering.
This trend has been driven largely by research funding, given the increasing importance of biological engineering for addressing advances in healthcare and in the development of biomass-based fuels and chemicals.
The importance of biotechnology is likely to continue as is research in nanotechnology, given the importance of analyzing physical, chemical, and biological phenomena at the atomic and molecular level, with applications in molecular self-assembly for the development of new materials at the nanoscale to control matter at the atomic scale.
More recently, energy, sustainability and manufacturing have emerged as significant directions for ChE research.
A. Varma & I. E. Grossmann, Perspective Article, AIChE Journal, 60, 3692 (2014)

Outline
Overview of Academic ChE Research in the US
Overview of Research Funding in the US

Overview and Funding Level in the U.S. National R&D by Funder, in billion 2017 $ University R&D by Source, in billion 2017 $
Source: NSF, National Center for Science and Engineering Statistics, Higher Education R&D series. Includes ARRA funding,
Source: NSF, National Patterns of R&D Resource series, http://www.nsf.gov/statistics/natlpatterns/.
Note: a Includes agricultural, biological, medical, and other life sciences.
b Includes astronomy, physics, and other physical sciences.
c Includes psychology.
Source: National Science Foundation’s WebCASPAR database, 2015 data
Spending by field
Total ChE academic R&D ~$895 million

Main Federal Funding Agencies
Source: 1975-1994 from NSF federal funds survey; remainder from AAAS R&D reports.
CBET: Chemical, Bioengineering, Environmental, and Transport Systems
Supports discoveries in chemical and biochemicalsystems; environmental engineering and sustainability; bioengineering and engineering healthcare; and fundamental transport, thermal and fluid phenomena.
National Science Foundation (NSF), in million $
In constant $, total Federal R&D unchanged for ~15 years!U.S. Department of Agriculture (USDA)U.S. Department of Defense (DOD)National Aeronautics and Space Administration (NASA)U.S. Department of Energy (DOE)National Science Foundation (NSF)National Institute of Health (NIH)American Recovery & Reinvestment Act (ARRA) - 2009
Main agencies and funding, in billion 2015 $
CBET ~ 20% of ENG; ENG ~ 13.4% of NSF

National Labs in the U.S.
17 Labs from DOE
Established starting in 1930-1940sLawrence Berkeley – 1931Los Alamos – 1943Oak Ridge – 1943Argonne - 1946
Typically $ 0.5-1.5 billion annual budget per lab
NNSA: National Nuclear Security Administration
Office of Science:the lead federal agency supporting fundamental scientific research for energy and the Nation’s largest supporter of basic research in the physical sciences

Role of Centers ERCs (Engineering Research Centers), funded by NSF
~ $ 4 M annually per Center; funding for up to 10 years
Total ERCs # 74; currently active #: 19Established in 1985

Four new ERCsannounced on September 12, 2017
Fuels derived from shale gas
Therapies based on living cells
Center for Innovative and Strategic Transformation of Alkane Resources (CISTAR)Purdue (lead); Partners: U. New Mexico, Northwestern U., U. Notre Dame, U. Texas - Austin
Personalized heart tissue
Health systems for underserved populations
Center for Directed Multiscale Assembly of Cellular Metamaterials (CELL-MET)Boston University (lead); Partners: U. Michigan, Florida International U.
Center for Cell Manufacturing Technologies (CMaT)Georgia Tech (lead); Partners: U. Georgia, U. Wisconsin-Madison, U. Puerto Rico
Center for Precise Advanced Technologies and Health Systems for Underserved Populations (PATHS-UP)Texas A&M (lead); Partners: UCLA, Rice, Florida International U.

Role of Centers Materials Research Science and Engineering Centers
Funding: $1.5-3.5 M per year
Established in 1994
Total MRSECs # 21

Role of Centers Energy Frontier Research Centers (EFRCs), funded by DOE
Light-Material Interactions in Energy Conversion (LMI)
Center for Nanoscale Controls on Geologic CO2 (NCGC)
Center for Gas Separations Relevant to Clean Energy Technologies (CGS)
Spins and Heat in Nanoscale Electronic Systems (SHINES)
Center for Next Generation of Materials by Design: Incorporating Metastability (CNGMD)
Catalysis Center for Energy InnInnovation (CCEI)
Energy Frontier Research in Extreme Environments (EFree)
Center for Actinide Science & Technology (CAST)
Center for Understanding and Control of Acid Gas-induced Evolution of Materials for Energy (UNCAGE-ME)
Center for Electrochemical Energy Science (CEES)
Center for Bio-Inspired Energy Science ((CBES) Northwestern University
Argonne-Northwestern Solar Energy Research Center (ANSER)
Center for Geologic Storage of CO2 (GSCO2)
Center for Direct Catalytic Conversion of Biomass to Biofuels (C3Bio)
Materials Science of Actinides (MSA)
Nanostructures for Electrical Energy Storage (NEES)
Integrated Mesoscale Architectures for Sustainable Catalysis (IMASC)
Center for Excitonics (CE)
Solid-State Solar-Thermal Energy Conversion Center (S3TEC)
Inorganometallic Catalyst Design Center (ICDC)
Photosynthetic Antenna Research Center (PARC)
Center for Biological Electron Transfer and Catalysis (BETCy)
Center for Advanced Solar Photophysics (CASP)
NorthEast Center for Chemical Energy Storage (NECCES)
Center for Emergent Superconductivity (CES)
Center for Mesoscale Transport Properties (m2m)
Center for Solar Fuels (UNC)
Center for Performance and Design of Nuclear Waste Forms and Containers (WastePD)
Center for Lignocellulose Structure and Formation (CLSF)
Center for the Computational Design of Functional Layered Materials (CCDM)
Center for Hierarchical Waste Form Materials (CHWM)
Fluid Interface Reactions, Structures and Transport Center (FIRST)
Energy Dissipation to Defect Evolution (EDDE)
Center for Frontiers of Subsurface Energy Security (CFSES)
Center for Molecular Electrocatalysis (CME)
Interfacial Dynamics in Radioactive Environments and Materials (IDREAM)
Established in 2009

Role of Centers BioEnergy Research Centers (BERCs), funded by DOE
FY13 - FY17, $25 M per Center
Since FY18, $10 M per Center
New: Center for Advanced Bioenergy and Bioproducts Innovation(established in 2017) - University of Illinois at Urbana-Champaign
Established in 2007
Three Centers until 2016

Chemical Industry – R&D
2011 2012 2013 2014 2015 % of Sales 2015
3M 1,570 1,634 1,715 1,770 1,763 5.8
Air Products 119 126 134 141 139 1.4
Albemarle 77 79 82 88 103 2.8
Arkema 147 164 166 172 232 2.7
Ashland 89 137 178 114 110 2.0
BASF 1,781 1,937 2,036 2,090 2,167 2.8
Cabot 66 73 74 60 58 2.0
Celanese 96 102 85 86 119 2.1
Clariant 183 182 188 221 212 3.5
Dow Chemcial 1,646 1,708 1,747 1,647 1,598 3.3
DuPont 1,956 2,067 2,153 2,067 1,898 7.6
Eastman 158 198 193 227 251 2.6
Evonik Industries 405 436 437 458 482 3.2
FMC 105 118 118 129 144 4.4
W.R. Grace 69 65 65 80 70 2.3
Huntsman Corp. 166 152 140 158 160 1.6
Praxair 90 98 98 96 93 0.9
Solvay 173 290 333 274 307 2.2
Total and Average
8,896 9,566 9,942 9,878 9,906 3.4
Chemical Industry R&D investments, $M – 18 major companies
Chemical & Engineering News, 94 (16), 18-20 (2016)
Total 2015 R&D ~$9.9 billion

Univ R&D Expenditures - ChE, $M
Chemical & Engineering News, 95, 22-23 (2017)
2015 2014 2005
U of Texas, Austin 51.9 48.9 14.0
Texas A&M U 38.1 21.5 12.1
Massachusetts Inst. of Technology
33.2 32.8 13.7
Georgia Tech 32.7 31.1 13.8
California Inst. of Technology
27.7 14.3 5.9
North Carolina State U 24.7 29.5 15.2
U at Buffalo 23.8 24.4 2.0
U of Minnesota 20.8 16.6 8.7
U of Colorado 17.6 14.6 6.3
U of Delaware 15.0 17.8 7.2
U of Tulsa 14.3 17.1 3.8
U of Michigan 13.4 13.6 8.9
Pennsylvania State U 12.9 12.4 17.4
Purdue U 12.2 14.6 5.5
U of Oklahoma 11.8 10.4 4.4
Johns Hopkins U 11.7 10.8 9.7
Iowa State U 11.6 11.3 3.6
U of California, Santa Barbara
11.5 9.8 7.2
Total 384.9 351.2 159.4
Note: Total 2015 academic ChE R&D ~$895 million
Top 18 academic ChE programs by R&D $

Conclusions
Significant growth in biological engineering and nanotechnology areas• In the last 15 years, >50% of young faculty hired in these areas, including a
significant number of non-ChEs• Greatly expands the scope of ChE and promotes multidisciplinary research• More recently, energy, sustainability and manufacturing have emerged as
significant directions for ChE research
In academia, a significant shift toward pure science, away from core ChE areas
A disconnect in faculty hiring vs industry needs Federal government is the largest source for academic R&D
• NIH, DoE, DoD, NSF, NASA, …
In constant $, total federal R&D funds essentially constant for ~15 years Important role of Centers – ERCs, MRSECs, EFRCs, BERCs Important role of DoE labs Major chemical companies invest ~3.4% of sales on R&D