Embed Size (px)
Citation preview

WM2013 Conference, February 24 - 28, 2013, Phoenix, Arizona, USA
Chemical Characterization and Removal of Carbon-14 from Irradiated Graphite II - 13023
Mary Lou Dunzik-Gougar, James Cleaver, Daniel LaBrier, Shilo McCrory, and Tara E. Smith Idaho State University: 1776 Science Center Dr., Idaho Falls, ID, 83401
ABSTRACT
Approximately 250,000 tonnes of irradiated graphite waste exists worldwide and that quantity is expected to increase with decommissioning of Generation II reactors and deployment of Generation IV gas-cooled, graphite moderated reactors. This situation indicates the need for a graphite waste management strategy. Of greatest concern for long-term disposal of irradiated graphite is carbon-14 (C-14), with a half-life of 5730 years. Study of irradiated graphite from some nuclear reactors indicates C-14 is concentrated on the outer 5 mm of the graphite structure. The aim of the research presented last year and updated here is to identify the chemical form of C-14 in irradiated graphite and develop a practical method by which C-14 can be removed.
A nuclear-grade graphite, NBG-18, and a high-surface-area graphite foam, POCOFoam®, were exposed to liquid nitrogen (to increase the quantity of C-14 precursor) and neutron-irradiated (1013 neutrons/cm2/s). Finer grained NBG-25 was not exposed to liquid nitrogen prior to irradiation at a neutron flux on the order of 1014 /cm2/s. Characterization of pre- and post-irradiation graphite was conducted to determine the chemical environment and quantity of C-14 and its precursors via the use of surface sensitive characterization techniques. Scanning Electron Microscopy (SEM) was used to evaluate the morphological features of graphite samples. The concentration, chemical composition, and bonding characteristics of C-14 and its precursors were determined through X-ray Photoelectron Spectroscopy (XPS), Time-of-Flight Secondary Ion Mass Spectrometry (SIMS), and Energy Dispersive X-ray Analysis Spectroscopy (EDX). Results of post-irradiation characterization of these materials indicate a variety of surface functional groups containing carbon, oxygen, nitrogen and hydrogen. During thermal treatment, irradiated graphite samples are heated in the presence of an inert carrier gas (with or without oxidant gas), which carries off gaseous products released during treatment. Graphite gasification occurs via interaction with adsorbed oxygen complexes. Experiments in argon were performed at 900°C and 1400°C to evaluate the selective removal of C-14. Thermal treatment also was performed with the addition of 3 and 5 volume % oxygen at temperatures 700°C and 1400°C. Thermal treatment experiments were evaluated for the effective selective removal of C-14. Lower temperatures and oxygen levels correlated to more efficient C-14 removal.
1

WM2013 Conference, February 24-28, 2013, Phoenix, Arizona, USA
2
INTRODUCTION
For the past 50 years graphite has been widely used as a moderator, reflector, and fuel matrix in a variety of gas-cooled reactors. The result is approximately 250,000 metric tons of irradiated graphite waste [1]. The U.S. and other countries are developing advanced nuclear systems coined “Generation IV concepts” as established by the Generation IV International Forum, which institutes protocol for individual countries to lead the development of a reactor concept in which they have particular interest [2]. The U.S. has pursued research and development of the High Temperature Gas-cooled Reactor (HTGR) under the U.S. Department of Energy’s Next Generation Nuclear Plant (NGNP) initiative. The HTGR uses helium coolant, graphite-coated fuel particles, a graphite reflector, and other graphite core structural components [3]. Operational HTGRs would dramatically add to the present quantity of irradiated graphite waste.
Characterization of existing irradiated graphite indicates that the most significant long-lived radioisotope is carbon-14 (C-14). With a half-life of 5,730 years this species is of concern for deep geologic disposal of irradiated graphite because it is readily mobile in groundwater and atmospheric systems [4]. Removal of C-14 from large irradiated graphite reactor components may reduce disposal cost, while also allowing the possibility of recycling this very pure nuclear grade material [2]. However, to optimize the removal of C-14, it is important to understand the bonding characteristics, functional groups, location, and concentration of C-14.
Formation of C-14
As graphite is bombarded by neutrons, C-14 is produced through neutron capture by carbon-13 (C-13), nitrogen (N-14), and oxygen-17 (O-17) as seen in Equations 1, 2, and 3 [4].
N-14 +n C-14 +p (Eqn. 1)
C-13 +n C-14 +γ (Eqn. 2)
O-17 +n C-14 +α (Eqn. 3)
Characterization of existing irradiated reactor graphite revealed that there is a concentration of C-14 on the surfaces of graphite blocks [5]. The inhomogeneous distribution of C-14 is indicative of the neutron capture of N-14 and O-17. Graphite naturally adsorbs air; consequently, N-14 and O-17 are readily found on the graphite surface. Oxygen and nitrogen adsorption occurs during graphite manufacturing, component assembly and storage, and as a result of air leaks into the reactor coolant gas. The neutron capture cross sections and isotopic abundances of N-14 and O-17 indicate the neutron activation of N-14 is likely the main source of C-14 on the surfaces of irradiated graphite [5]. (See Table I)
Table I. Properties of C-14 Precursors
Species Capture Cross Section (Barns) Isotopic Abundance (%)
N-14 1.8 99.63 (N-14:N)
C-13 0.0015 1.07 (C-13:C)
O-17 0.235 0.04 (O-17:O)
Production of C-14 significantly depends on the amount of nitrogen present. Directly analyzing graphite for C-14 is difficult because it is chemically indistinguishable from C-12. Furthermore, the difference in mass between N-14 and C-14 is only 0.001385 amu, rendering mass spectrometry based techniques ineffective in discriminating between the two. Because C-14 is formed mainly by the neutron activation of N-14, it was theorized that the

WM2013 Conference, February 24-28, 2013, Phoenix, Arizona, USA
3
chemical environment, location, and bonding characteristics of nitrogen in the irradiated graphite would be comparable with the chemical environment, location, and bonding characteristics of C-14. Therefore, preliminary characterization emphasized the N-14 pathway to formation of C-14 and the resulting environment in irradiated graphite.
The localization of C-14 on the surface of the graphite dictates the use of surface sensitive characterization techniques, though no single technique provides a complete understanding of the morphological features, chemical environment, location, and bonding characteristics. Therefore, a portfolio of techniques was utilized, with each technique providing another piece of the puzzle that is the formation pathway of C-14. Scanning Electron Microscopy (SEM), X-Ray Diffraction (XRD), and Raman Spectroscopy (Raman) were used to evaluate the graphite’s morphological features. The concentration, chemical composition, and bonding characteristics of N-14, and thus indirectly C-14, were determined through X-ray Photoelectron Spectroscopy (XPS), Secondary Ion Mass Spectrometry (SIMS), and Energy Dispersive X-ray Analysis (EDX). Understanding the nitrogen bonding characteristics in graphite is expected to lead to a greater understanding of the formation of C-14, which is vital to the optimization of the selective release of C-14 during thermal treatment.
Thermal Treatment
When graphite is heated at a constant temperature under forced convection with an inert gas it oxidizes due to the presence of adsorbed air, thus releasing gasified carbon-oxygen compounds (expected primarily as carbon monoxide) [6]. An oxidizing species also can be added to the carrier gas. If optimized, this process could be a viable strategy for graphite waste management given that the C-14 enriched surface oxidizes first.
Graphite oxidation rate is controlled by 3 mechanisms determined largely by the reaction temperature. At lower temperatures (less than about 600°C), oxidation kinetics is controlled by the chemical rate of reaction and at higher temperatures (above about 900°C) kinetics is dominated by diffusion of reactants and products through the product boundary layer. At intermediate temperatures, oxidation rate is controlled by diffusion of reactants and products through graphite porosity. The temperatures of transition between oxidation kinetic regimes are highly dependent on the particular graphite properties and experimental conditions. The estimated transition temperatures are displayed in Table II [6,7,8]. The optimal temperature, and oxidation regime, for maximum C-14 removal must be determined experimentally.
Table II. Expected Graphite Oxidation Kinetics Regime Temperature Boundaries
Regime 1 (°C) Regime 2 (°C) Regime 3 (°C)
<( 500-700) > (500-700), < 900 900
METHOD
Irradiated and unirradiated samples of nuclear-grade graphite NBG-18, a German-produced medium-grain graphite, and POCOFoam®, a highly porous graphite foam, have been analyzed. The non-nuclear grade foam was chosen for its significant surface area [10]. NBG-18 and POCOFoam® samples were immersed in liquid nitrogen (LN) for 24 hours prior to neutron irradiation. The purpose of LN immersion was to promote nitrogen adsorption and subsequent neutron-induced production of C-14 to ensure measurable quantities on sample surfaces. Typical C-14 concentrations in existing irradiated reactor graphite are on the order of parts-per-billion, which is too low for meaningful characterization. Sample irradiation took place at the MURR research reactor at the University of Missouri for 120 days in a thermal neutron flux of 6.7 x 10¹³ neutrons/cm2/s.
WM2013 Conference, February 24-28, 2013, Phoenix, Arizona, USA
4
Also analyzed was nuclear grade graphite NBG-25. This material was not immersed in liquid nitrogen prior to irradiation at the Advanced Test Reactor (ATR) at Idaho National Laboratory for approximately 400 days at an average flux of 3 x 10¹⁴ neutrons/cm2/s.
Graphite sample irradiation conditions for this project are summarized in Table III.
Table III. Graphite Irradiation
Graphite Pre-irradiation liquid N2 exposure
Facility Time (days) Flux (n/cm2/s)
NBG-18 yes MURR 120 1013 - 1014
POCOFoam®
NBG-25 no ATR ~400 3 x 10¹⁴
Characterization
The surface sensitive techniques, SEM, XRD, Raman, EDX, XPS, and SIMS, were employed to characterize carbon bonding with nitrogen, oxygen, hydrogen and other carbons. Each technique was chosen to investigate a different aspect of the chemical nature of C-14.
Analysis was performed on NBG-18 & POCOFoam® samples at each of the three stages of C-14 production: Unirradiated (non-LN immersed), LN immersed, and irradiated. Unirradiated and irradiated NBG-25 samples also were analyzed.
XRD and Raman analyses of NBG-18 AND POCOFoam® were discussed in the 2012 WMS publication. In this paper, results of the SEM/EDX, XPS and SIMS analyses for all three graphite types are presented.
SEM was used to identify the polycrystalline nature of the graphite. The implementation of SEM allows the texture, chemical composition, crystalline structure, and subsequently the orientation of the graphite to be viewed on sub-micron scales. The morphological features associated with the elemental and spatial chemical compositions were identified using EDX. NBG-18 and POCOFoam® samples were polished in preparation for SEM/EDX analyses. NBG-25 samples were not polished. Surface areas that exhibited contrasting variations in elemental composition were targeted to map preferential nitrogen formation locations. These formation locations are denoted by color changes on the surface image after using visual graphing software. The compositional variations were measured with a 30 keV accelerating voltage and a 10 mm working distance on an EDX Genesis Quanta 3D FEG.
XPS was used to identify the concentration of surface species and specific carbon bonding types that eject core electrons of varying binding energies from the surface atoms. Binding energies are characteristic for each atom, and are direct representations of the atomic orbital energies [7]. Thus, the energy shifts associated with the movement of the elemental peak in the XPS spectrum are associated with changes in the chemical environment of the atoms. These variations lead to changes in the binding energies of the core electrons and can be used to further indicate the bonding structure of the atom. Graphite samples were studied via XPS using a VersaProbe PHI 5000 spectrometer with aluminum Kα radiation (1480.6 eV) and a base pressure of 2.6 x 10⁻⁵ Pa. The deconvoluted nitrogen (N 1s) and carbon (C 1s) peaks were used to determine the relative bonding configurations of the elements within the graphite. The peak shapes were filtered to yield a full-width-half-mass (FWHM) of less than 1.8 eV and as near a Gaussian fit as possible; however, the best fits of the C 1s and N 1s resulted in multiple Gaussian peaks. To ensure accuracy the energy scale was calibrated to reproduce the binding energies of Cu 2p3/2

WM2013 Conference, February 24-28, 2013, Phoenix, Arizona, USA
5
(932.65 eV) and Au 4f 7/2 (84.00 eV) and the sample charging was corrected by aligning the C 1s peak to 284.6 eV. The core level spectra were fitted using least-squares in AugerScan 3.0 graphing software. Changes in the atomic concentrations, bonding configurations, and electronic structures of the target species were observed with respect to depth while sputtering the samples at a rate of 0.025 nm/sec.
SIMS was used to identify the carbon bonding configurations (with N, O, H and C) and the potential chemical environment by measuring displaced charged atomic and/or molecular species with a mass spectrometer. Graphite samples were analyzed via SIMS (TRIFT I spectrometer by PHI-EVANS). During analysis, samples were kept in a constant ultra-high vacuum environment of 7.3 x 10⁻¹¹ Pa to reduce contamination in the chamber. The focused primary ion beam was rastered over an area of (50 x 50) µm2 on the sample surface. Secondary ions were measured from a smaller region 20 µm2 located at the center of the sputtered area. The accelerating voltage was set to 15.03 keV in the primary gallium ion source, and -3 keV on the sample surface resulting in a net voltage of 12.03 keV. Sputtering at a rate of 0.022 nm/sec allowed for variations in carbon-containing functional groups to be measured with respect to depth. Data was analyzed using WinCadence Version 3.41. Thermal Treatment
During thermal treatment experiments a pre-weighed graphite sample was placed in the center of the main furnace (Fig. 1). Experimental temperatures (700°C, 900°C and 1400°C) were chosen with the intent of facilitating oxidation in two different oxidation kinetic regimes. Argon carrier gas was flowed through the furnace to transport gasified oxidation products released from the graphite through the system to a collection bottle. In some experiments, the carrier gas was doped with 3 vol% (1.5 sccm) or 5 vol% (2.6 sccm) oxygen gas to increase the amount of graphite oxidation.Argon gas was flowed through the system at 50 standard cubic centimeters per minute (sccm) to carry gasified oxidation products released from the graphite to an inline gas analyzer. The gas analyzer was to monitor for CO, CO2, Ar, O2, N2, . The gasified products were oxidized in furnace held at 800°C. This ensured all CO was converted to CO2 and could be collected in a 4 M NaOH solution.
A small portion of gas leaving the furnace was diverted to a Hiden quadrupole mass spectrometer gas analyzer before returning to the main gas flow path. The gas analyzer was programmed to monitor for CO, CO2, Ar, O2, N2, H2O, CH4, 14CO, and 14CO2. After this analysis all gas flowed through the 800°C oxidizing furnace where any CO oxidized to CO2 via reaction with granular copper oxide wrapped in copper mesh. This step ensured all CO was converted to CO2 and could be collected in a 4 M NaOH solution. Upon completion of an experiment the graphite was reweighed to determine the overall mass loss.

WM2013 Conference, February 24-28, 2013, Phoenix, Arizona, USA
Fig. 1. Experimental Design for Thermal Treatment of Nuclear Graphite to Remove C-14 (G.A. is Gas Analyzer).
Thermal treatment was performed on unirradiated graphite samples to establish a gasification rate, speciation baseline, and determine the average percentage of mass removed.
During experiments with irradiated graphite, gas collection bottles were sampled with respect to time and analyzed via liquid scintillation counting (LSC) to determine C-14 content and the associated rate of release from the graphite. ScintiSafe Plus 50% Cocktail was used as the scintillation cocktail because of its compatibility with basic solutions. Upon completion of irradiated experiments the reweighed sample was returned to the furnace and fully oxidized to determine the total C-14 content in the sample. To ensure complete oxidation the graphite sample was held at 800°C for two hours under 50 sccm forced convection with O2 gas. After oxidation was complete, the NaOH collection bottle was sampled and analyzed for the total C-14 activity via LSC.
A summary of the thermal treatment experiments performed is provided in Table IV.
Table IV. Thermal Treatment Experimental Parameters
Gas Mixture Argon Argon + 3 vol% O2 Argon +
5 vol% O2
Temperature 700°C 900°C 1400°C 700°C 1400°C 700°C 1400°C Graphite Experimental Run Time (hrs)*
POCOFoam® Unirradiated - 12,12 12,12,12 10,10,10 12,10,10 10,10,10 4,4,4
Irradiated - 12,10,10 10,10,10 10,10,7 1,1,1 7,7,7 1,1,1
NBG-18 Unirradiated 13,10 - - - - 10,10 2,2
Irradiated 13,13 - - - - 10,10 2.5,2 *Each run time represents a separate experiment.
In some cases preliminary results indicated that the necessary data could be obtained with a shorter run time, so subsequent experimental times were reduced.
6

WM2013 Conference, February 24-28, 2013, Phoenix, Arizona, USA
RESULTS
Characterization
SEM was used to investigate the surface of each unirradiated graphite type, as shown in Fig. 2. Results from EDX investigation of each surface (not shown) indicate that insignificant quantities of nitrogen and oxygen were present, as well as impurities such as sodium and calcium.
Fig. 2. SEM Images of unirradiated POCOFoam® (Left), NBG-18 (Center) and NBG-25 (Right) at 10,000x.
SEM identified the formation of clusters in irradiated LN-immersed samples averaging in size from 5 to 10 μm attached to the surface and graphite planes; these clusters were not observed in irradiated NBG-25 (Fig. 3, all three graphite types). The surface composition of the clusters was further explored using EDX. The images displayed in Figs. 4 (POCOFoam®) and 5 (NBG-18) show the location and qualitative concentrations of carbon (red), oxygen (blue), and nitrogen (green) atoms on the irradiated graphite surfaces. The EDX images illustrate that the clusters are preferentially located along plane edges and mainly composed of nitrogen.
Fig. 3. SEM Images of irradiated POCOFoam® (Left), NBG-18 (Center) and NBG-25 (Right) at 100,000x. Nitrogen clusters are observed on the graphite planar edges of POCOFoam® and NBG-18 only.
7

WM2013 Conference, February 24-28, 2013, Phoenix, Arizona, USA
Fig. 4. SEM Image of irradiated POCOFoam® at 50,000x (Left), and 5000x (Center); EDX image (Right) of Irradiated POCOFoam® at 5,000x. All images show the presence of nitrogen clusters along graphite plane edges.
Fig. 5. SEM Image of irradiated NBG-18 at 15,000x (Left); SEM (Center) and EDX (Right) Images of Irradiated NBG-18 at 13,000x. All images show the presence of nitrogen clusters along graphite plane edges.
The chemical environment of the graphite surface was investigated using XPS and SIMS.
Analysis of XPS results did not reveal measurable concentrations of nitrogen on the surface of the unirradiated non-LN immersed NBG-18 or POCOFoam® samples, or unirradiated NBG-25 samples. Results from the XPS spectra of the unirradiated LN-immersed samples showed measurable concentrations of nitrogen on the surface; concentration levels varied from 0.01-0.67 atom% in POCOFoam®, and 0.34-0.42 atom% in NBG-18. Surfaces of the irradiated POCOFoam® and NBG-18 samples contained much larger nitrogen concentrations (36.1 atom% and 38.7 atom%, respectively) than the unirradiated samples; surfaces of the irradiated NBG-25 contained no significant quantities of nitrogen (0.22 atom%). The most significant non-nitrogen species found on the surfaces of all graphite samples was oxygen, ranging from 1.0-1.3 atom% for unirradiated POCOFoam® and NBG-18, and 2.8 atom% for unirradiated NBG-25. Those values increased to 25.2 atom%, 17.3 atom%, and 6.8 atom%, respectively, for the irradiated cases. A side-by-side comparison of the unirradiated, unirradiated LN-immersed, and irradiated cases for each graphite type is shown in Figure 6; note that samples of NBG-25 were LN-immersed for the purpose of comparison with the other graphite types, but were not irradiated.
8

WM2013 Conference, February 24-28, 2013, Phoenix, Arizona, USA
200 250 300 350 400 450 500 550 600
N 1s O 1s
O 1s
O 1s
C 1s
C 1s
Irradiated
LN2 Immersed
Binding Energy (eV)
Unirradiated
POCOFoam: XPS Results
C 1s
200 250 300 350 400 450 500 550 600
Irradiated
LN2 Immersed
Unirradiated
O 1s
O 1s
O 1s
N 1sC 1s
C 1s
C 1s
NBG-18: XPS Results
Binding Energy (eV)200 250 300 350 400 450 500 550 600
O 1s
O 1s
O 1sC 1s
C 1s
Binding Energy (eV)
C 1s
NBG-25: XPS Results
Irradiated
LN2 Immersed
Unirradiated
Fig. 6. XPS Survey Scans for Unirradiated/LN2-Immersed/Irradiated Samples of POCOFoam® (left), NBG-18 (center), and NBG-25 (right)
Deconvolution of the C 1s and N 1s peaks for the irradiated graphites allowed the bonding types between the carbon, oxygen, and nitrogen atoms to be evaluated. The chemical environment at multiple surface depths/sputtering times was investigated. POCOFoam® was sputtered for 2, 6, 12 minutes correlating to depths of 3, 9, 18 nm. The spectrum generated at the surface and at 9 nm can be seen in Fig. 7.
284 286 288 290 292 294 296 2980
500
1000
1500
2000
2500
C-C
N-O
C-O
C 1s Peak Deconvolution of POCOFoam
Rel
ativ
e In
tens
ity (a
rb. u
nits
)
Binding Energy (eV)
No Sputter
C-O
282 284 286 288 290 2920
500
1000
1500
2000
2500
3000R
elat
ive
Inte
nsity
(arb
. uni
ts)
Binding Energy (eV)
6 min Sputter
C 1s Peak Deconvolution of POCOFoam
C=N
C-C
C-O
Fig. 7. XPS C 1s Spectra of POCOFoam® on the surface (Left), and sputtered to 9 nm (Right)
The C 1s peak broadens and splits as a result of irradiation for each of the graphite types (see NBG-18 and NBG-25 results in Figs. 8 and 9), clearly indicating a disordering of the surface upon irradiation. This disordering indicates the presence of an amorphous carbon that may incorporate the absorbed nitrogen atoms. The surface peak (no sputtering) for irradiated NBG-18 is dominated by oxides, the presence of which decreases with depth. Significant quantities of surface oxide are not observed for irradiated NBG-25. The presence of C=N bonds observed deeper within each graphite type clearly indicates strong nitrogen bonding within the graphite lattice.
9

WM2013 Conference, February 24-28, 2013, Phoenix, Arizona, USA
278 280 282 284 286 288 290 292 294 296 298
0
1000
2000
3000
4000
C-O
C-O-N
C 1s Peak Deconvolution of NBG-18
Rela
tive
Inte
nsity
(arb
. uni
ts)
Binding Energy (eV)
No Sputter
C-C
280 285 290 295 300
0
2000
4000
6000
8000
10000
C=N
C-O
C 1s Peak Deconvolution of NBG-18
Rel
ativ
e In
tens
ity (a
rb. u
nits
)
Binding Energy (eV)
2 min Sputter
C-C
282 284 286 288 290 292 294 296 298-2000
0
2000
4000
6000
8000
10000
12000
14000
C-C
C///N
C 1s Peak Deconvolution of NBG-18
Rela
tive
Inte
nsity
(arb
. uni
ts)
Binding Energy (eV)
8 min Sputter
C-C
Fig. 8. XPS C 1s Spectra of NBG-18 on the surface (Left), and sputtered to 3 nm (Center) and 12 nm (Right)
282 284 286 288 290
0
1000
2000
3000
4000
Rel
ativ
e In
tens
ity (a
rb. u
nits
)
NBG-25 - Surface
Binding Energy (eV)
C-C
C-N
C-C / C-N
282 284 286 288 2900
1000
2000
3000
4000
Rel
ativ
e In
tens
ity (a
rb. u
nits
)
C-C / C-N
Binding Energy (eV)
NBG-25 - 2 min sputter
C-C
C=N
282 284 286 288 2900
1000
2000
3000
4000
Rel
ativ
e In
tens
ity (a
rb. u
nits
)
NBG-25 - 5 min sputter
C-C
C=N
C-N
Binding Energy (eV)
Fig. 9. XPS C 1s Spectra of NBG-25 on the surface (Left), and sputtered to 3 nm (Center) and 8 nm (Right)
Via deconvolution of the N 1s spectra (no sputtering) for irradiated POCOFoam® samples, three peaks were identified (Fig. 6): peak 1 (400.96 eV), corresponding to C-N; peak 2 (402.22 eV), doubly bound C=N atoms; and peak 3 (403.56 eV), nitrogen bonded to oxygen atoms N–O. The presence of surface oxide, N–O, is consistent with the C 1s findings.
10
Fig. 10. XPS N 1s Spectra of Irradiated POCOFoam® on the surface (Left) and sputtered to 9 nm (Center), and 18 nm (Right)

WM2013 Conference, February 24-28, 2013, Phoenix, Arizona, USA
394 396 398 400 402 404 406 408 410 412
0
1000
2000
3000
4000
5000
C// /N
C=N
N-O N-O
Rel
ativ
e In
tens
ity (
arb.
uni
ts)
Binding Energy (eV)
No Sputter
N 1s Peak Deconvolution of NBG-18
C-N
396 398 400 402 404 406 408 410 412
0
500
1000
1500
2000
2500
3000
C=N
C-N
Rel
ative
Inte
nsity
(arb
. uni
ts)
Binding Energy (eV)
2 min sputter
N 1s Peak Deconvolution of NBG-18
C///N
394 396 398 400 402 404 406 408 410
0
500
1000
1500
2000
2500
C-N
C///N
N 1s Peak Deconvolution of NBG-18
Rel
ative
Inte
nsity
(arb
. uni
ts)
Binding Energy (eV)
8 min Sputter
Fig. 11. XPS N 1s Spectra of Irradiated NBG-18 on the surface (Left) and sputtered to 3 nm (Center), and 12 nm (Right)
Results of XPS analysis of the N 1s peak indicate that a majority of the nitrogen is bonded to both the irradiated POCOFoam® and the NBG-18 as a carbon-nitrogen species. The domination of the spectra by the N-O oxide in irradiated POCOFoam® is less significant slightly below the surface and the concentration is immeasurable after 12 min (~18 nm) of sputtering; this pattern is also observed for irradiated NBG-18, although the N-O oxide has a much lesser presence on the surface and is not detected below the surface. The C≡N bond peak also appears on the surface of irradiated NBG-18 in small quantities, and is present in both irradiated NBG-18 and POCOFoam® at depths beneath the graphite surface. Results from the analysis of the N 1s peak for the irradiated NBG-25 samples were inconclusive due to the lack of distinguishing the peak from the background signal, though the presence of both C-N and C=N bonds was observed in the analysis of the C 1s peak, as shown in Fig. 9.
SIMS results indicated the presence of a limited number of nitrogen containing species after LN immersion, corresponding well with XPS results. The most notable and definitive evidence that nitrogen plays some part in bonding to the surface of the graphite after irradiation is the appearance of likely cyano groups (C-N and C=N) that were also seen with XPS results. The most notable species are associated with m/z value 26 in NBG-25, and m/z value 29 in NBG-18 and NBG-25. Continued analysis of the surface found multiple CxHyNz molecular fragments in the mass range of 12-30 amu that confirmed the bonding of nitrogen to the surface of each of the graphites (Table V).
Table V. SIMS Spectral Comparison of CxHyNz Species (12-30 amu): Intensities Relative to 12C
m/z NBG-18 POCOFoam® NBG-25 Possible Species
14 0.0033 0.0039 0.4158 N, 14C, CH2
15 0.0033 0.0055 0.4494 NH, 14CH, CH3
18 0.0111 0.0667 N/A NH4, 14CH4
26 0.0166 0.0010 0.2713 CN, 14CC
28 0.5000 0.0833 0.1317 N2, 14CN, CH2N
29 0.1110 0.0153 0.6098 N2H, 14CNH, CH3N
11

WM2013 Conference, February 24-28, 2013, Phoenix, Arizona, USA
30 0.0444 0.0038 0.0369 NO, 14CO, N2H2
It is possible that the ion signature at ~14 amu in Table V may be activated C-14 atoms or a singly ionized nitrogen atom; however, as discussed above it is difficult to distinguish between the masses of the two atoms. The EDX results show significant nitrogen presence on the surface, and the XPS results indicate high nitrogen concentrations. Thus, it was assumed that singly ionized nitrogen atoms contribute a majority of the 14 amu peak.
The relative concentrations of the identified fragments were analyzed with respect to depth. While nitrogen functional groups decreased to between approximately 4-15% depending on the fragment, results indicated measureable concentrations of nitrogen atoms still remaining at a minimum of 100 nm into the sample.
Thermal Treatment – Off-gas Speciation
Thermal treatment off-gas speciation was measured during the experiments by the inline gas analyzer. Fig. 12 shows is corrected gas analyzer data representative of the unirradiated and irradiated POCOFoam® experiments at 700°C. CO and CO2 were the major species released from the graphite.
Fig 12. Off-gas Speciation during gasification of POCOFoam® at 700°C
12

WM2013 Conference, February 24-28, 2013, Phoenix, Arizona, USA
13
For POCOFoam® at 700°C and both oxygen levels the primary desorption pathway is CO2 for unirradiated graphite, whereas the primary desorption pathway is CO for irradiated graphite. The desorption rate appears to increase with respect to time at the experimental temperature for all unirradiated experiments. The increase at temperature likely indicates that as additional C-C bonds are broken there is an increase in active sites available for oxidation. The desorption rate appears to decrease with respect to time at the experimental temperature for irradiated graphites. The lower release rate during the time at experimental temperature likely indicates that the irradiated seems able to better overcome the decreased reactivity of irradiated POCOFoam® is less reactive; however, any decrease in reactivity due to irradiation seems to be sufficiently countered at the higher (5 volume %) oxygen concentration.
At the higher oxygen level the desorption of CO2 relative to CO decreases. Further, the shape of the oxygen curveappears to be inversely proportional to the CO2 and CO curves dictating that the oxygen carrier gas is the main oxidation source.
Similar plots for NBG-18 oxidation at 700°C are provided in Fig. 13.
Fig. 13. Off-gas Speciation during Gasification of NBG-18 at 700°C
WM2013 Conference, February 24-28, 2013, Phoenix, Arizona, USA
14
O2 is CO. Further the desorption rate appears to
in n from the NBG-18 at temperature is likely a result of the oxidation of the most chemically
active environments on the graphite.
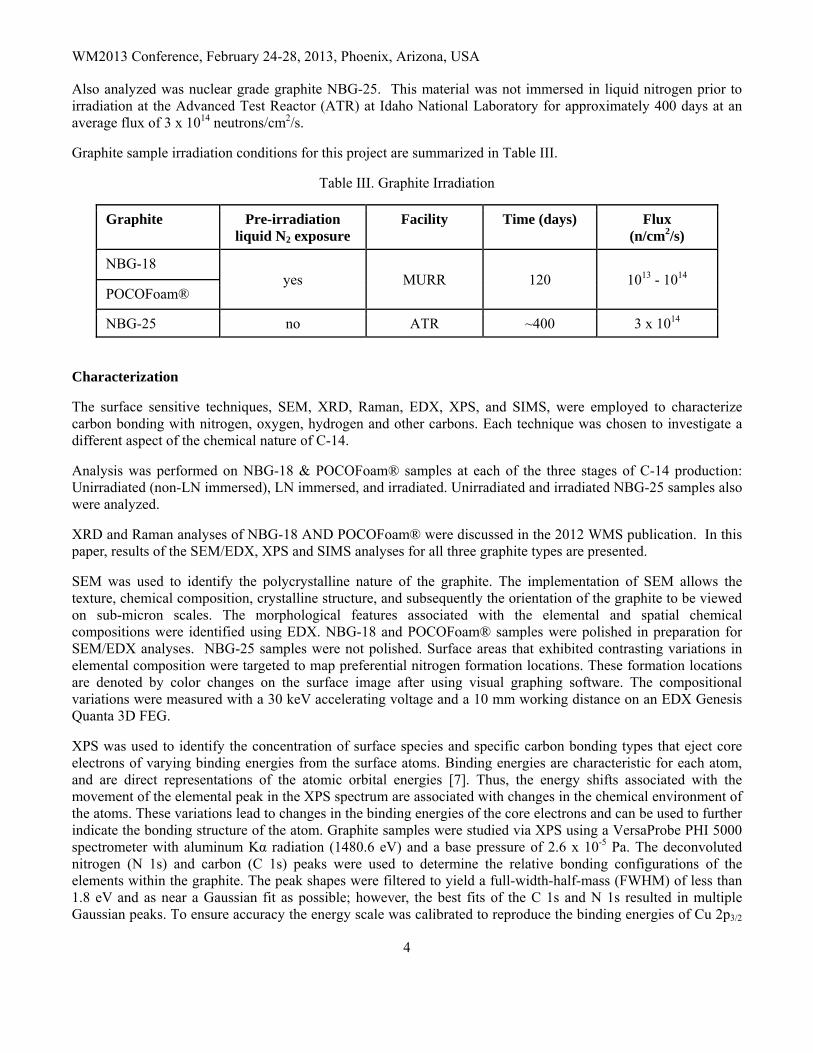
For POCOFoam® at 900°, the primary desorption pathway is CO2 for both unirradiated and irradiated graphites (Fig. 14). Plots for POCOFoam® at 900°C and 1400°C under Ar only conditions were performed with a built-in background subtracted; thus, results seen during heating and cooling conditions are inaccurate. All other profiles had the background subtracted manually after evaluating the total moles loss.
Fig. 14. Off-gas Speciation during Gasification of POCOFoam® at 900°C
At 1400°C there is a shape different from the off-gas species curves at 700°C and 900°C (see Fig. 15.) During heating (to 1400°C), the graphite oxidation kinetics is first dominated by chemical rate of reaction, then by reactant and product diffusion in the graphite (between approximately 800°C and 1200°C) and by boundary layer diffusion at the higher temperatures. Gasification occur n the diffusion controlled kinetic regime follow the same trends seen during the oxidation of graphite a me correlates to the change in primary desorption species. In the higher temperature kinetic regime, CO is the main desorption species. At 1400°C the release rate appears to increase with respect to time. The increase likely indicates that as additional C-C bonds are broken there is an increase in active sites available for oxidation. The increased oxygen within the carrier gas causes the release of CO2 relative to CO to decrease during the diffusion kinetic regime. The release ratio of CO2 to CO during gasification occurring within the boundary layer kinetic regime does not appear to change significantly with the change in oxygen level.
It appears that when NBG-18 oxidation is limited to use of previously adsorbed oxygen species (no oxygen in carrier gas) the removal of carbon is highly limited. The main desorption pathway during the gasification of both unirradiated and irradiated NBG-18 at 700°C and Ar + 5vol% decrease with respect to time at temperature. The low porosity and low impurity concentration of this graphite likely means fewer active sites available for oxygen adsorption and subsequent oxidation. The initial increasethe release of carbo
ring withit 700°C. The change in kinetic regi

WM2013 Conference, February 24-28, 2013, Phoenix, Arizona, USA
15
Fig. 15. Off-gas Speciation during Gasification of POCOFoam® at 1400°C
The only other significant quantity release from the unirradiated graphite was N2; however, it was significantly lower than the avulsion of CO and CO2. During the gasification of NBG-18, the gas analyzer did not detect substantial quantities of nitrogen above background indicating the increased nitrogen levels seen during the
asification of POCOFoam® are released from the graphite foam. It is not clear where the nitrogen is locatedPOCOFoam® only ur. Any adsorbed nitrogen would likely 2
g . has 5% closed porosity so it seems such a substantial release could not occ
be released with respect to CO and CO, thus starting at ~400°C.

WM2013 Conference, February 24-28, 2013, Phoenix, Arizona, USA
Off-gas species patterns similar to those for POCOFoam® were seen for gasification of NBG-18 at 1400°C (Fig. 16). The transition to the boundary layer kinetic regime occurs at a higher temperature than the POCOFoam®. The shift is likely caused by nuclear graphite being more chemically resistive than graphite foam. As seen during the gasification of NBG-18 at 700°C, CO is the primary desorption species during the diffusion controlled kinetic regime. Similarly to POCOFoam® CO is the main desorption species released during the boundary layer controlled regime.
16
Fig. 16. Off-gas Speciation during Gasification of NBG-18 at 1400°C
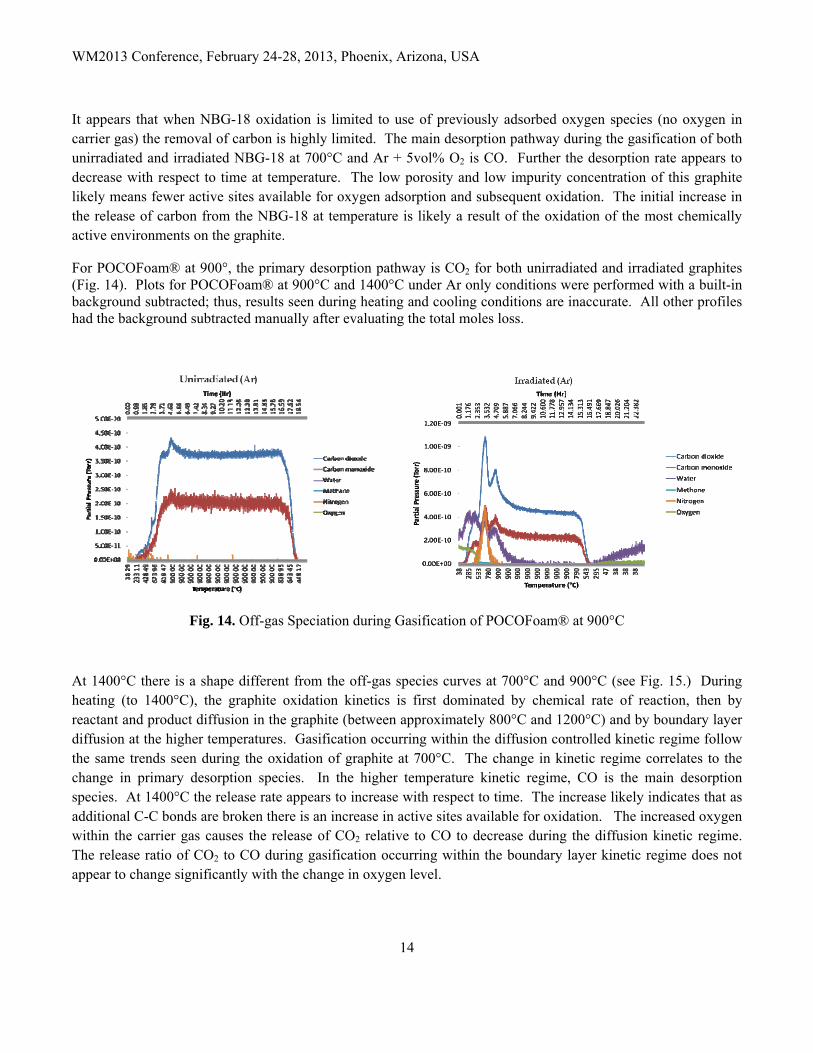
Thermal Treatment – Mass Loss
Mass loss during thermal treatment at experiment temperature is plotted in Fig. 17. As the relative mass of carbon-14 is insignificant to carbon-12, the mass loss can be equated with carbon-12 release during thermal treatment.
WM2013 Conference, February 24-28, 2013, Phoenix, Arizona, USA
17
Fig. 17. Average Percent Mass Loss During Time at Experimental Temperature (Mass loss data are identified inthe plot legend according to Temperature : Vol% O2 : I
rradiated Experiment or Unirradiated Experiment : Type of
graphite (NBG-18 or POCOFoam®.)) Based on the differences in the oxidation rates (slopes of lines in Fig. 17) in the two kinetic regimes, it is likely that the quantity of oxygen available to oxidize the graphite in the diffusion controlled kinetic regime has a larger influence on the gasification rate than it does in the boundary layer controlled regime. This contradicts literature indicating that the availability of the oxidation component is most influential during regime 3 [11-15]. Most oxidation studies in literature have not been performed on graphite foam. The work presented here did not include study of NBG-18 at two different oxygen levels within the boundary layer controlled regime. The contradiction between results presented here and l may be a result of the graphite foam’s lower reactivity.
A comparison of th ntal temperatures reveals that most unirradiated graphites oxidized at a slightly higher rate than their irradiated counterparts. These data support the conclusion that irradiated graphite is less reactive than unirradiated graphite, which is likely a
-14 were present in the irradiated graphite samples. The average C-14 activity per sample was 82,017 Bq (2.22 μCi).
iterature
e irradiated and unirradiated graphites’ averaged release rates at the experime
result of a change in the surface’s chemical environment.
Thermal Treatment – Carbon-14 Release
Results of LSC analysis of gas-collection solution confirmed significant quantities of C

WM2013 Conference, February 24-28, 2013, Phoenix, Arizona, USA
Fig. 18 displays the average C-14 and C-12 releases during time at the experimental temperature. While the absolute quantity of C-14 in each graphite sample was orders of magnitude less than the quantity of C-12, the relative percentage of C-14 released during thermal treatment was significantly higher than that for C-12 in all but one experiment (See Fig. 18, 1400-5-IE-N).
18
Fig. 18. Normalized Average Percent of Carbon-12 and Carbon-14 Released during Time at Experiment Temperature. (Carbon-12 and carbon-14 data are identified in the plot legend according to Temperature : Vol% O2 : I
rradiated Experiment or Unirradiated Experiment : Type of graphite (NBG-18 or POCOFoam®.))
To evaluate more thoroughly the selective release of 14C over 12C, the release data were normalized for each sample’s mass, activity, and the experimental time and then averaged over the number of samples tested. The results of these calculations are presented in Table VI. Larger values denote more selective release of C-14.

WM2013 Conference, February 24-28, 2013, Phoenix, Arizona, USA
19
Table VI. Relative Release of Carbon-14 during Thermal Treatment of Irradiated Graphites Normalized Averaged Relative Percentage Release Ratio C-14:C-12
700°C 900°C 1400°C
POCOFoam® NBG-18 POCOFoam® NBG-18 POCOFoam® NBG-18
(0 vol% O2)
195.49 (0 vol% O2)
42.14 (0 vol% O2)
38.49 (3 vol% O2)
8.08 (3 vol% O2)
2.85 (5 vol% O2)
5.89 (5 vol% O2)
11.17 (5 vol% O2)
1.57 (5 vol% O2)
2.55
The values in Table VI suggest that the oxygen level has the greatest influence on the selective release rate followed by temperature. Lower oxygen levels and lower temperatures within each oxygen level studied provide the most selective release of 14C.
DISCUSSION
Characterization
Previously reported results from structural characterization techniques indicated significant radiation damage and the formation of an amorphous phase on the graphite surface. These results indicate an increase in disorder and disorientation of the carbon atoms in the graphite lattice structure. Disruption to the graphite lattice can
le. Results of XPS analyses of post-irradiated samples indicate increased uantities of carbon-nitrogen and carbon-oxygen bonds are directly correlated to broken bonds in the graphite ttice caused by sample irradiation.
f 100 ons of
hrough
ic diation dictates that C-14 could also be found at these
cations. Furthermore, the presence of strongly bonded carbon-nitrogen atoms deep within the graphite structure lso indicates C-14 could be found at similar locations. SIMS results revealed that N2 drastically decreases within
ly exists as a weakly bonded sub-layer on the surface of the graphite. he activation of the weak N2 sub-layer should be readily removed by
provide multiple bonding sites where nitrogen can become chemically bound to the surface. The existence of micron-sized opaque nitrogen clusters, observed using SEM and EDX, along the planar edges of LN-immersed irradiated graphite samples supports this principqla
Chemical analysis mapped variations in the spatial chemical composition of the graphite surface after irradiation.XPS results confirmed increased concentrations of nitrogen on the surface and identified C-N, C=N, and C≡Nbonding types between the introduced nitrogen atoms and graphite surface after irradiation. Measurableconcentrations of the nitrogen atoms and corresponding bonding types were seen up to a minimum depth onm, indicating that the nitrogen atoms are chemically bound within the graphite structure. The concentratithe carbon-nitrogen and the amorphous carbon species decrease deeper into the graphite, observed tsputtering below the surface.
The observation of various CxHyNz species, particularly for m/z values 26 and 29, in SIMS results indicates the substitution of single nitrogen atoms into displaced carbon atom locations in the graphite lattice. It is interesting tonote that the relative concentrations of most nitrogen-containing species present on the surface of irradiated NBG-25 are greater than those for the irradiated LN-immersed graphites. The confirmation of single and diatomnitrogen atoms substituted into the carbon rings despite irraloathe first 30 nm of depth, indicating that it likeTherefore, any C-14 produced as a result of tthermal treatment. This removal may be evidenced by the high initial C-14 release rates seen during the first hour

WM2013 Conference, February 24-28, 2013, Phoenix, Arizona, USA
20
f thermal treatment. At all experimental temperatures, a large amount of C-14 was immediately released; the C-
sults presented here confirm an increased nitrogen presence in post-irradiated samples.
The quantity of carbon gasified is proportional to the temperature and oxygen level. Results of unirradiated experiments indicate the higher experiment temperature (1400°C) resulted in a larger carbon release rate and preferential CO avulsion.
Results also show that typically unirradiated experiments have a slightly higher release rate than the irradiated counterparts indicating that irradiated graphite is less reactive than unirradiated graphite. The change in reactivity is likely a result of a change in the surface’s chemical environment. Gasification of NBG-18 mimics the general shape of the POCOFoam®. During heating/cooling to 1400°C the transition to the boundary layer kinetic regime occurs at a higher temperature than the POCOFoam®. The shift is likely caused by nuclear graphite being more chemically resistive than graphite foam.
The main desorption pathway for unirradiated POCOFoam® gasified in the diffusion kinetic regime is CO2, but the primary desorption pathway switches to CO for irradiated POCOFoam®. The main desorption pathway during the gasification of both unirradiated and irradiated NBG-18 at 700°C and Ar + 5vol% O2 is CO.
At the higher oxygen level the desorption of CO2 relative to CO decreases. Further, the shape of the oxygen curve appears to be inversely proportional to the CO2 and CO curves dictating that the oxygen carrier gas is the main oxidation source.
All experiments except NBG-18 gasified at 1400°C and 5vol% O2 indicate that thermal treatment is an efficient waste management strategy for C-14. It is likely that the bulk nuclear graphite gasifies to quickly at 1400°C and 5vol% O2. Results suggest that the lowest oxygen level has the greatest influence on the selective release rate followed by a lower temperatures.
arbon-14 is created through the neutron activation of N-14. Understanding the location, bonding configuration,
f the gh
haracterization of irradiated graphite surfaces revealed strongly bound nitrogen clusters on the surfaces of irradiated POCOFoam® and NBG-18 graphites, which were immersed in liquid nitrogen prior to irradiation.
imilar clusters were not found on the surface of NBG-25 irradiated in the presence of He.
XPS analysis revealed that the most notable differences between the pre- and post-irradiated graphites are in the pes of C-C, C-N, and C-O bonding. Further, results of SIMS analysis indicate various combinations of
functional groups dominating according to graphite type. Namely, NBG-18 has high concentrations of functional
o14 release rate then decreased before again increasing.
It is important to note that the results of previously reported XRD, Raman, SIMS, and XPS analyses indicate that LN immersion does not induce a measureable change in the graphite structure prior to irradiation, while the re
Thermal Treatment
CONCLUSION
Cand chemical environment of N-14 is leading to a greater understanding of the locations, bonding configurations, and chemical environments in which C-14 is present in irradiated graphite. A greater understanding ochemical and physical environments of C-14 is helping to optimize its removal from irradiated graphite throuthermal treatment.
C
S
ty

WM2013 Conference, February 24-28, 2013, Phoenix, Arizona, USA
21
groups at m® has a significant proportion of f H4, CH2N, N2, 14CN) and NBG-25 has the greatest varietypossible formulas 14CH, NH, CN, C14C, C14CH HN2.
Thermal treatment demonstrated that graphite gasifies are a higher rate with respect to temperature and oxidant level; however, experime e of C-14 is greatest at the lowest oxidant level and temper oving a majority of the most significant long-lived radionu d reduce the volume of radioactive waste needing to be sent to a deep geological repository and allow the remaining nuclear grade graphit cled.
uture wor cludes the us nert carrier gas doped with carbon dioxide gas to increase the surface oxidation further evaluate the selective release of C-14.
28 and 29 amu, with likely formulas being N2, 14CN, C14CH3, CH3N, HN2. POCOFoaunctional groups with masses 16 and 28 amu (O, NH2, C
of high concentration functional groups (masses 14, 15, 26, and 29 amu with N, 14C, 3, CH3N, and
nts indicate that selective releasature. Rem clide woul
e to be recy
Fto
k in e of i

WM2013 Conference, February 24-28, 2013, Phoenix, Arizona, USA
22
1. FACHINGER, J., PODRUHZINA, T., VON LENSA, W., “Decontamination of Nuclear Graphite by Thermal
ecretariat, 2009.
AL LABORATORY, “Next Generation of Reactors.” https://inlportal.inl.gov/portal/server.pt?open=514&objID=1361&parentname=CommunityPage&parentid=9
NAL FORUM, “The Very-High-Temperature Reactor (VHTR) is a graphite-” http://www.gen-
cluding a Discussion of Safety-Related Issues,” EPRI Technical Report 1013091(March 2006)
8. Yates, J.T. Jr., Madey, T., Erickson, N., “ESCA Study of Carbon Monoxide and Oxygen Adsorption on
of Graphite,” Irradiation Damage in Graphite due to Fast Neutrons in Fission
(EPRI), “Graphite Decommissioning: Options for Graphite Treatment, Recycling, or Disposal, including a discussion of Safety-Related Issues,” Technical Report 1013091, Palo Alto, CA, 2006.
tomic Energy Agency (IAEA), “Characterization, Treatment and Conditioning of Radioactive
14. Snead, Lance, and Tim Burchell. “Oxidation of High-Quality Graphite for IFE”. Proceedings of the DOE/NE
anagement Office, “Graphite Oxidation Thermodynamics/Reactions,” s.l., DOE/SNF/REP-018 Rev 0, United States Department
REFRENCES
Treatment,” Solutions for Graphite Waste, Manchester, UK (March 2007).
2. NUCLEAR ENERGY AGENCY, “Generation IV International Forum,” Technical S
3. IDAHO NATION
&mode=2
4. GEN-IV INTERNATIOmoderated, helium-cooled reactor with a thermal neutron spectrum.4.org/Technology/systems/vhtr.htm
5. PODRUHZINA, TATJANA, “Graphite as radioactive waste: corrosion behavior under final repository conditions and thermal treatment,” Doctoral Dissertation, 2004.
6. ELECTRIC POWER RESEARCH INSTITUTE, “Graphite Decommissioning: Options for Graphite Treatment, Recycling, or Disposal, in
7. Briggs, D., Seah, M.P., “Practical Surface Analysis by Auger and X-ray Photoelectron Spectroscopy,” John Wiley and Sons, 1983.
Tungsten.” XPS PhotoElectron Spectroscopy, Benchmark Papers in Physical Chemistry and Chemical physics V.2. 1978.
9. IAEA, “The Thermal Oxidation and Fusion Systems, IAEA-TECDOC-1154, April 2000.
10. POCO Graphite, INC. http://www.POCOFoam®.com/tabid/130/Default.aspx
11. Electric Power Research Institute
12. International AGraphite from Decommissioning of Nuclear Reactors,” IAEA, Vienna, 2006.
13. Propp, W. A., “Graphite Oxidation Thermodynamics/Reactions,” Idaho National Engineering and Environmental Laboratory, Idaho Falls, Idaho, 1998.
High Average Power Laser Program Workshop, Pleasanton, CA, July 25-26, 2002.
15. United States Department of Energy Office of Environmental Management Spent Fuel M
of Energy Office of Environmental Management, 1998.