Embed Size (px)
Citation preview

CHEE 370Waste Treatment
Processes
Lecture #4
Wastewater Characterization Cont’d

Measurements of Gross Organic Content
Biochemical oxygen demand (BOD) Chemical oxygen demand (COD) Total organic carbon (TOC) Theoretical oxygen demand (ThOD)

Review from Last Class
Biochemical Oxygen Demand
“Carbonaceous” BOD
Measure of the amount of biodegradable organic matter in a WW sample
Oxygen consumed by bacteria as they use the organic matter in the WW as a food source to generate more bacteria
Organic Matter + O2 + bacteria CO2 + H2O + more bacteria

BODt=UBOD(1 - e-kt)
UBOD = measure of the initial amount of organic material in the WW minus the residual organic material
(recalcitrant organics) left after all the biomass decays
[BODt] = [UBOD] = mg/mL[k] = d-1
Typical k ~ 0.23 d-1 for municipal WWk is a function of temperature! (Recall CHEE 380)
BOD5 is the most common measure of organic pollution strength

Review from Last Class
Effect of Nitrification
Organic Matter + O2 + bacteria CO2 + H2O + more bacteria + NH3
NH3 + 3/2 O2 HNO2 + H20 (Nitrosomonas)
HNO2 + 1/2 O2 HNO3 (Nitrobacter)
When nitrification occurs:
BODmeasured = CBOD + NBOD
Overestimation of the organic content of the WW!

Chemical Oxygen Demand (COD)
Defined as the mass of oxygen theoretically required to completely oxidize an organic compound to carbon dioxide
Measured by mixing the WW with a very strong oxidant (i.e potassium dichromate)
Takes ~ 3 h (versus 5 days!)

BOD and COD
COD ≥ UBOD ≥ BOD5
If the organic content in the WW sample is completely biodegradable:
UBOD = COD

Total Organic Carbon (TOC)
Measure of WW pollutional characteristics Based on the chemical formula Test methods use heat and oxygen, UV
radiation, and/or chemical oxidants to convert organic carbon to carbon dioxide, which can then be measured
Can be assessed in 5 to 10 minutes Theoretical > Measured (but close!)

TOC Example
Glucose (C6H12O6)

Theoretical Oxygen Demand (ThOD)
WW generally contains a mixture of carbon, hydrogen, oxygen, and nitrogen
Calculated using stoichiometric equations
Considers both carbonaceous and nitrogenous oxygen demand

BOD, COD, and TOC
Typical range of BOD/COD for untreated municipal WW is 0.3 - 0.8
Typical range for BOD/TOC is 1.2 - 2.0
If BOD/COD > 0.5 WW is considered to be easily treatable by biological
means
If BOD/COD < 0.3 WW may have some toxic components and/or the addition
of acclimated micro-organisms may be required

Micro-organisms
Untreated wastewater includes a wide variety of pathogenic micro-organisms, such as:
Bacteria (i.e. E. coli, salmonella, vibrio cholerae) Protozoa (i.e. Balantidium coli, Entamoeba
histolytica) Helminths (i.e. pinworm, tapeworm) Viruses (i.e. Hepatitis, Norwalk agent, Parvovirus)
Refer to tables 2-23 and 2-24

Biological Characterization
Individual pathogenic micro-organisms are difficult to isolate and identify
Micro-organisms which are more numerous and more easily tested for can be used as indicators of biological contamination Indicator organism must be present when contamination is
present Indicator organism should have the same (or better) survival
characteristics as the pathogenic organism Procedure for identifying the indicator should be easier, faster,
and cheaper than looking directly for the pathogens NOTE: No “IDEAL” indicator has been found to date

Indicator Organisms
Every person discharges from 100 to 400 billion coliform bacteria every day
Coliform organisms are gram-negative, rod shaped bacteria whose normal habitat is the intestines of human and animals; some members are naturally found in the soil and vegetation Escherichia Enterobacter Klebsiella Citrobacter

Coliform Total Coliform
Species ferment lactose and produce CO2 gas when incubated at (35 ± 0.5) °C for (24 ± 2) h
Species produce a colony within (24 ± 2) h to (48 ± 3) h when incubated in a medium that facilitates growth Micro 221or 229- Agar Plates expts!
Fecal Coliform Species produce gas or colonies when incubated at the
higher temperature of (44.5 ± 0.2) °C for (24 ± 2) h
Total coliform is used as the indicator for drinking water and wastewater effluent

Bacterial Counts - Liquid Medium (Board EXAMPLE!)
Figure 3-23, Metcalf and Eddy
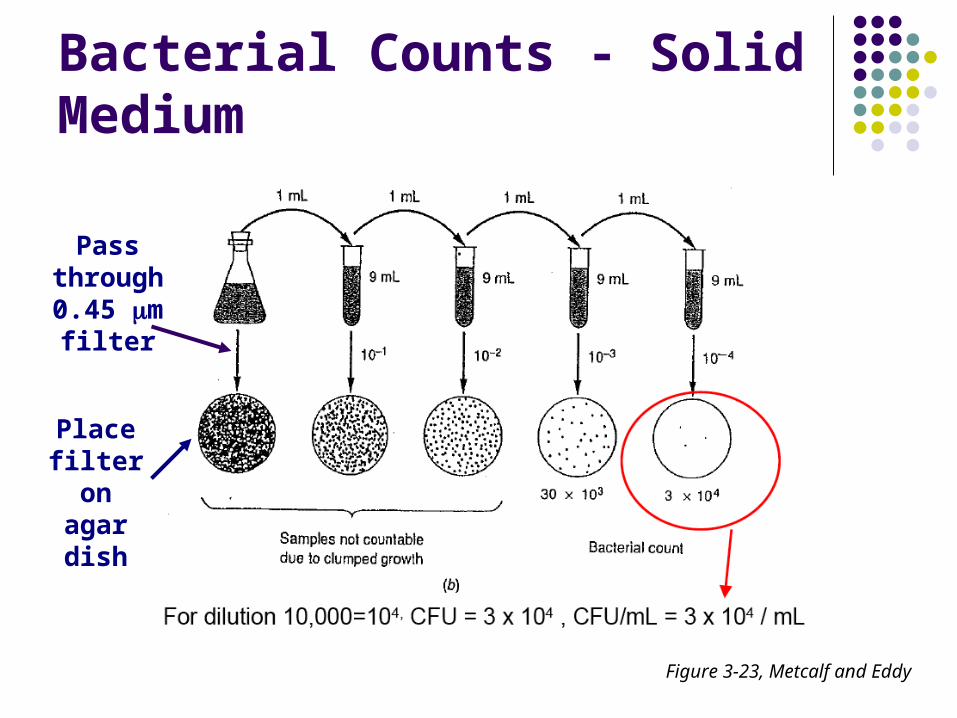
Bacterial Counts - Solid Medium
Figure 3-23, Metcalf and Eddy
Pass through 0.45 m
filter
Place filter on
agar dish

Reading: Textbook p. 118 - 130 on the experimental methods used for the characterization of bacteria and viruses in WW samples

Toxicity Testing (Overall Water Quality)
Performed on effluent before discharge
Measures the overall quality of the treated water and to establish acceptable discharge concentrations for conventional parameters (such as DO, pH, temperature, salinity, or turbidity)
Determines the efficacy of the waste treatment process
Determines compliance with federal regulations

Toxicity Testing - Bioassays Use “test”organisms (baby trout, minnows) sensitive to the
presence of contaminants in wastewater
Fish are placed in aquariums/vessels containing various dilutions of treated wastewater
Start test with about 10 fish/aquarium
Run the test for a fixed period of time (24, 48, 96 h) and count the number of dead fish
Plot results on semi-log paper

Toxicity Testing - Bioassays
LC50: Median lethal concentration for 50% of the organisms The diluted concentration of the wastewater that will kill
50% of the test population in a fixed time period
NOEC: No Observed Effect Concentration The highest concentration of diluted wastewater that has
no observable effect on the test organisms


What does a 96-h LC50 of 75% mean?
What is the 96-h LC50 measured?
Is the plant in compliance?
When the effluent is diluted to a concentration of 75% (v/v), 50% of the test organisms will die.
57%
No!

WW Flowrates
Rated capacity of a WW treatment plant is based on the average annual daily flowrate plus a factor of safety
Factors that can influence the plant design: WW characteristics Constituent concentrations Flowrates
Mass loading [kg/d] = (concentration [g/m3])*(flowrate [m3/d])(103 g/kg)


Design Flowrates and Mass Loadings
Process units and hydraulic conduits must be sized to accommodate the anticipated peak flowrates that will pass through the plant
Many WW treatment units are designed/sized based on the detention time or overflow rate (flowrate per unit surface area) required to achieve specific BOD and TSS levels in the effluent
Over-sizing the equipment can decrease the efficiency of the plant

Design Flowrates and Mass Loadings
A number of operating conditions must be considered in the design of a WW treatment facility: Peak hydraulic flowrate Minimum hydraulic flowrate Maximum mass loading Minimum mass loading Sustained mass loading
Refer to Table 3-20 in Metcalf and Eddy
Initial and future

Table 3-20, Metcalf and Eddy

Typical Municipal WW
TSS: 220 mg/L VSS: 165 mg/L BOD5: 220 mg/L COD: 500 mg/L TKN: 40 mg-N/L Ammonia: 25 mg-N/L TP: 8 mg-P/L Ortho-phosphate: 5 mg-P/L

Practice Problem
An industrial wastewater stream is known to contain only steric acid (C18H36O2), glycine (C2H5O2N), and glucose (C6H12O6). Laboratory analysis revealed the following: Organic N = 11 mg/L Organic C = 130 mg/L COD = 425 mg/L
What is the concentration of each of the constituents? SA ~ 45 mg/L
Gly ~ 59 mg/LGlu ~ 192 mg/L