Embed Size (px)
Citation preview

Prof. Adnan AlamerChemical Engineering Dept., KFUPM
1
CHE 425 CHE 425
Engineering Economics and Engineering Economics and Design PrinciplesDesign Principles

Prof. Adnan AlamerChemical Engineering Dept., KFUPM
2
CHAPTER 6CHAPTER 6
Estimation Estimation of of
Manufacturing CostsManufacturing Costs

Prof. Adnan AlamerChemical Engineering Dept., KFUPM
3
Purpose of Chapter Purpose of Chapter
To introduce important factors that affect To introduce important factors that affect manufacturing cost manufacturing cost
To provide method for the estimation of each factor To provide method for the estimation of each factor

Prof. Adnan AlamerChemical Engineering Dept., KFUPM
4

Prof. Adnan AlamerChemical Engineering Dept., KFUPM
5

Prof. Adnan AlamerChemical Engineering Dept., KFUPM
6
Estimation of Manufacturing CostsEstimation of Manufacturing Costs
Direct Costs Direct Costs Vary with production rateVary with production rate
Fixed Costs Fixed Costs Do not vary with production rateDo not vary with production rate
General Expenses General Expenses Costs associated with management levels not directly related Costs associated with management levels not directly related
to the manufacturing process to the manufacturing process –– overhead burdenoverhead burden
Prof. Adnan AlamerChemical Engineering Dept., KFUPM
7
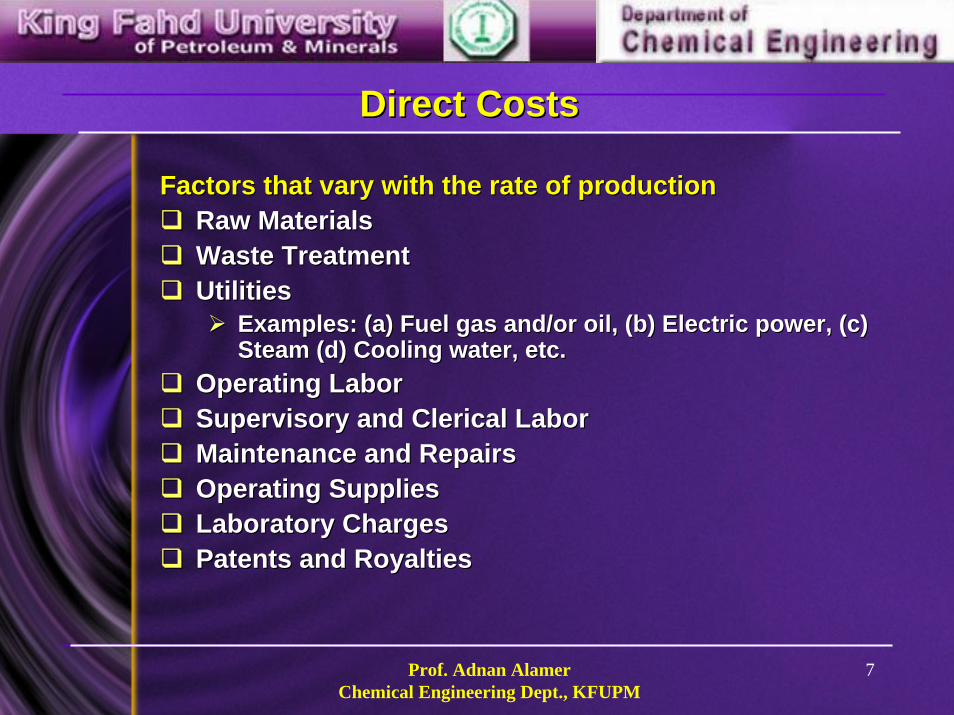
Direct CostsDirect Costs
Factors that vary with the rate of productionFactors that vary with the rate of productionRaw MaterialsRaw MaterialsWaste Treatment Waste Treatment Utilities Utilities
Examples: (a) Fuel gas and/or oil, (b) Electric power, (c) Examples: (a) Fuel gas and/or oil, (b) Electric power, (c) Steam (d) Cooling water, etc.Steam (d) Cooling water, etc.
Operating Labor Operating Labor Supervisory and Clerical LaborSupervisory and Clerical LaborMaintenance and Repairs Maintenance and Repairs Operating Supplies Operating Supplies Laboratory Charges Laboratory Charges Patents and RoyaltiesPatents and Royalties

Prof. Adnan AlamerChemical Engineering Dept., KFUPM
8
Fixed CostsFixed Costs
Factors not affected by the level of productionFactors not affected by the level of productionDepreciation Depreciation –– cover as a separate topic in cover as a separate topic in Chapter 7 Chapter 7
Local Taxes and Insurance Local Taxes and Insurance
Plant Overhead CostsPlant Overhead Costs

Prof. Adnan AlamerChemical Engineering Dept., KFUPM
9
General ExpensesGeneral Expenses
Administration Costs Administration Costs SalariesSalariesOther administrationOther administrationBuildingBuilding
Distribution and Selling Costs Distribution and Selling Costs Costs of sales and marketingCosts of sales and marketingSalariesSalariesMiscellaneous costsMiscellaneous costs
Research and DevelopmentResearch and DevelopmentSalaries and funds related to research Salaries and funds related to research equipments and supplies, etc.equipments and supplies, etc.

Prof. Adnan AlamerChemical Engineering Dept., KFUPM
10
Manufacturing Costs Manufacturing Costs Table 6.1 Table 6.1
Description of Items Description of Items
Table 6.2 Table 6.2 Factors for Estimating Costs Factors for Estimating Costs
We relate (historically) the relationship We relate (historically) the relationship between items in Table 6.1 to Direct Costs A between items in Table 6.1 to Direct Costs A (RM) , B (WT) , C (UT) , D (OL), and FCI of (RM) , B (WT) , C (UT) , D (OL), and FCI of PlantPlant

Prof. Adnan AlamerChemical Engineering Dept., KFUPM
11
Manufacturing Costs - examples
Cost associated with management level andCost associated with management level andadministrative activities not directly related to theadministrative activities not directly related to themanufacturing process.manufacturing process.
Maintenance and Repairs Maintenance and Repairs 2 2 –– 10 % FCI 10 % FCI Proportional to Size of Plant Proportional to Size of Plant
Supervisory and Clerical Labor Supervisory and Clerical Labor 10 10 –– 25 % COL 25 % COL Proportional to Op. Lab Proportional to Op. Lab
Depreciation Depreciation some % of FCIsome % of FCI

Prof. Adnan AlamerChemical Engineering Dept., KFUPM
12
Manufacturing Costs

Prof. Adnan AlamerChemical Engineering Dept., KFUPM
13

Prof. Adnan AlamerChemical Engineering Dept., KFUPM
14

Prof. Adnan AlamerChemical Engineering Dept., KFUPM
15
Manufacturing Costs
( )0.280 2.73 1.23OL UT WT RMCOM FCI C C C C= + + + + (6.1)
( )RMWTUTOLd CCCCFCICOM ++++= 23.173.2180.0 (6.2)
COM without Depreciation – we use this since we calculate depreciation more accurately in Chapter 7
with depreciation as 10% FCI

Prof. Adnan AlamerChemical Engineering Dept., KFUPM
16
How Do We Get…..
FCIFCI –– Chapter 5 Chapter 5 CCTMTM or or CCGR GR
CCRM RM
CCUT UT
CCWT WT
CCOL OL
Look At These Separately

Prof. Adnan AlamerChemical Engineering Dept., KFUPM
17

Prof. Adnan AlamerChemical Engineering Dept., KFUPM
18

Prof. Adnan AlamerChemical Engineering Dept., KFUPM
19
Cost of Operating Labor2 0.5(6.29 31.7 0.23 )OL npN P N= + +
NOL = the number of operators per shift
P = particulate processing steps
Nnp = non-particulate processing steps – compression, heating/cooling, mixing, separation, and reaction

Prof. Adnan AlamerChemical Engineering Dept., KFUPM
20
Example 6.2Estimate operating labor and cost of HDA facilityEstimate operating labor and cost of HDA facilityshown in Fig 1.3 and 1.5shown in Fig 1.3 and 1.5
NNOLOL = [6.29 + (31.7)(0)= [6.29 + (31.7)(0)0.10.1+ (0.23)(11)]+ (0.23)(11)]0.50.5 = 2.97= 2.97Number of operators required for one operator per shift = Number of operators required for one operator per shift = 4.5 4.5
= (49 wk/yr)(5 shifts/operator/wk) = (49 wk/yr)(5 shifts/operator/wk) = 245 shifts/year/operator = 245 shifts/year/operator Total shifts per year = (365)(3 shifts per day) Total shifts per year = (365)(3 shifts per day)
= 1095 shifts/year = 1095 shifts/year 1095 / 245 = 4.5 operators (for a single shift)1095 / 245 = 4.5 operators (for a single shift)

Prof. Adnan AlamerChemical Engineering Dept., KFUPM
21
Example 6.2 (cont.)
EquipmentEquipment Number ofNumber of NNnpnp
CompressorsCompressors 11 11ExchangersExchangers 77 77Heaters/FurnacesHeaters/Furnaces 11 11PumpsPumps 22 --ReactorsReactors 11 11TowersTowers 11 11VesselsVessels 44 --
TotalTotal 1111

Prof. Adnan AlamerChemical Engineering Dept., KFUPM
22
Example 6.2 (cont.)
Total Operators = (2.97)(4.5) = 13.4 Total Operators = (2.97)(4.5) = 13.4 ⇒⇒ 14 14
Salary = $50,000/yr Salary = $50,000/yr (2001 gulf coast average) (2001 gulf coast average)
CCOLOL = (50,000)(14) = $700,000/yr = (50,000)(14) = $700,000/yr

Prof. Adnan AlamerChemical Engineering Dept., KFUPM
23
Cost of Raw Materials, Utilities, and Waste Treatment
Flow Rates Flow Rates Get these from PFD Get these from PFD –– use stream factor use stream factor
Costs Costs Utilities and Waste Treatment Utilities and Waste Treatment -- Table 6.3 Table 6.3 ––see Section 6.6 for Utilities Estimation see Section 6.6 for Utilities Estimation Common Chemicals Common Chemicals –– Table 6.4, Chemical Table 6.4, Chemical Market Reporter, other sourcesMarket Reporter, other sources

Prof. Adnan AlamerChemical Engineering Dept., KFUPM
24
Stream FactorOperating hours per year divided by total Operating hours per year divided by total hours per year hours per year
Typical 8000 Operating Hours Typical 8000 Operating Hours 0.9 0.9 –– 0.95 Typical 0.95 Typical 8000/8760 = 0.913 8000/8760 = 0.913
*Flows on PFD are *Flows on PFD are kmolkmol/operating hour/operating hour

Prof. Adnan AlamerChemical Engineering Dept., KFUPM
25
Utilities – Fuel and ElectricityFuel for Fired Heaters Fuel for Fired Heaters
PFD gives process load ( energy balance) but total PFD gives process load ( energy balance) but total flow is more due to efficiency flow is more due to efficiency –– 7070--90% from 90% from Table 9.11 Table 9.11 –– item 13. item 13. Fuel Costs may vary wildly Fuel Costs may vary wildly –– Figure 6.1 Figure 6.1
Electricity for pumps and compressors Electricity for pumps and compressors –– Figure 6.7 Figure 6.7 Shaft Power Shaft Power –– Fluid Power/Efficiency Fluid Power/Efficiency Power to Drive Power to Drive –– Shaft Power/Drive Efficiency Shaft Power/Drive Efficiency
* PFD usually gives Shaft Power * PFD usually gives Shaft Power –– but be careful!but be careful!

Prof. Adnan AlamerChemical Engineering Dept., KFUPM
26
Cost of Fuel – Utility costs
Cost of Fuel Cost of Fuel –– Utility CostsUtility Costs

Prof. Adnan AlamerChemical Engineering Dept., KFUPM
27

Prof. Adnan AlamerChemical Engineering Dept., KFUPM
28

Prof. Adnan AlamerChemical Engineering Dept., KFUPM
29

Prof. Adnan AlamerChemical Engineering Dept., KFUPM
30
Utilities - SteamPressure Levels Pressure Levels
Low (30 Low (30 –– 90 90 psipsi) ) Medium (150 Medium (150 –– 250 250 psipsi) ) High (525 High (525 –– 680 680 psipsi) )
Available saturated but sometimes Available saturated but sometimes superheated superheated

Prof. Adnan AlamerChemical Engineering Dept., KFUPM
31
Utilities - SteamLarge chemical complexes generate high Large chemical complexes generate high pressure steam and use excess pressure to pressure steam and use excess pressure to generate electricity generate electricity –– Figure 6.6. Figure 6.6.
Steam can be used as a drive medium for Steam can be used as a drive medium for compressors and pumps compressors and pumps
Thermodynamic efficiency Thermodynamic efficiency -- Table 6.5 Table 6.5 Drive efficiency Drive efficiency –– Figure 6.7Figure 6.7

Prof. Adnan AlamerChemical Engineering Dept., KFUPM
32
Utilities - Steam

Prof. Adnan AlamerChemical Engineering Dept., KFUPM
33
Utilities - Condensate Return and Boiler Feed Water
Process
Steam
Condensate returned to steam generating systems
* Just use Steam Costs

Prof. Adnan AlamerChemical Engineering Dept., KFUPM
34
If Steam Lost in Process
Gas and Steam
Stripping Steam
Use Steam Cost + BFW since Condensate is not returned

Prof. Adnan AlamerChemical Engineering Dept., KFUPM
35
Steam Generated in Process
Process
BFW
Steam
* Just Take Credit for Steam – unless Steam is lost in Process

Prof. Adnan AlamerChemical Engineering Dept., KFUPM
36
Utilities - Cooling Water
Process30ºC 40ºC
Make Up and Chemicals
Purge (blowdown)
Evap + loss

Prof. Adnan AlamerChemical Engineering Dept., KFUPM
37

Prof. Adnan AlamerChemical Engineering Dept., KFUPM
38

Prof. Adnan AlamerChemical Engineering Dept., KFUPM
39

Prof. Adnan AlamerChemical Engineering Dept., KFUPM
40

Prof. Adnan AlamerChemical Engineering Dept., KFUPM
41
Utilities - Cooling Water
Make Make –– up based on up based on ΔΔTT (40 (40 -- 30) ! 30) !
Should charge Should charge cwcw based on energy used based on energy used Table 6.3 Table 6.3
Does not matter (much) if Does not matter (much) if cwcw returned at returned at 4040ººC or 45C or 45ººC C –– same energy same energy
4545ººC is absolute max C is absolute max –– due to fouling due to fouling

Prof. Adnan AlamerChemical Engineering Dept., KFUPM
42
Utilities - Refrigerated Water
Same as Previous Slide in that Energy Costs Same as Previous Slide in that Energy Costs are not are not ΔΔTT Dependent Dependent –– but cost based on but cost based on 55ººC supply temperature. C supply temperature.
Figure 6.4 shows cost of refrigeration as a Figure 6.4 shows cost of refrigeration as a function of temperature.function of temperature.

Prof. Adnan AlamerChemical Engineering Dept., KFUPM
43
Utilities - Refrigerated Water

Prof. Adnan AlamerChemical Engineering Dept., KFUPM
44
Utilities - Refrigerated Water

Prof. Adnan AlamerChemical Engineering Dept., KFUPM
45
Utilities - Refrigerated Water

Prof. Adnan AlamerChemical Engineering Dept., KFUPM
46
Prof. Adnan AlamerChemical Engineering Dept., KFUPM
47

Prof. Adnan AlamerChemical Engineering Dept., KFUPM
48

Prof. Adnan AlamerChemical Engineering Dept., KFUPM
49
Summary
FCI FCI CCOL OL
CCUTUT From these get From these get COMCOMdd
CCWT WT
CCRMRM

Prof. Adnan AlamerChemical Engineering Dept., KFUPM
50

Prof. Adnan AlamerChemical Engineering Dept., KFUPM
51

Prof. Adnan AlamerChemical Engineering Dept., KFUPM
52

Prof. Adnan AlamerChemical Engineering Dept., KFUPM
53

Prof. Adnan AlamerChemical Engineering Dept., KFUPM
54

Prof. Adnan AlamerChemical Engineering Dept., KFUPM
55