Embed Size (px)
Citation preview

Management of Agricultural Soils for Greenhouse Gas Mitigation:
Opportunities and Challenges
Charles W. Rice University Distinguished Professor
Department of Agronomy
IPCC Fourth Assessment Report, Working Group III, 2007
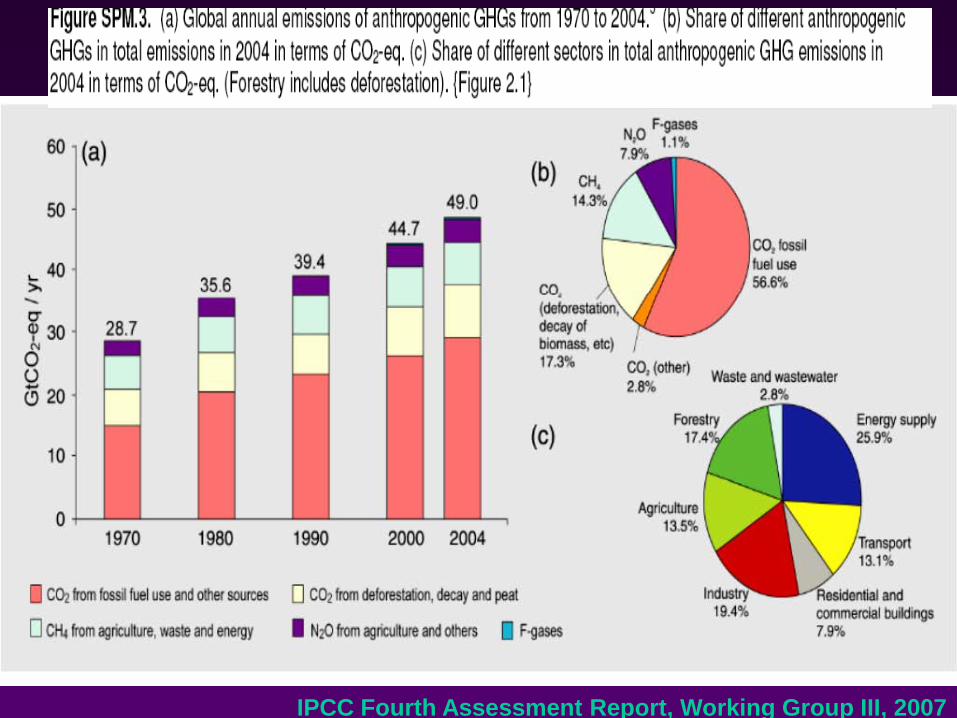
Global economic mitigation potential for different sectors at different carbon prices
IPCC, 2007

Agriculture • A large proportion of the mitigation potential of
agriculture (excluding bioenergy) arises from soil C sequestration, which has strong synergies with sustainable agriculture and generally reduces vulnerability to climate change.
• Agricultural practices collectively can make a significant contribution at low cost – By increasing soil carbon sinks, – By reducing GHG emissions, – By contributing biomass feedstocks for energy
use
IPCC Fourth Assessment Report, Working Group III, 2007

Global mitigation potential in agriculture
-200
0
200
400
600
800
1000
1200
1400
1600
Crop
land
man
agem
ent
Wate
r man
agem
ent
Rice
man
agem
ent
Setas
ide,
LUC
&ag
rofo
restr
y
Gra
zing
land
man
agem
ent
Resto
re cu
ltiva
tedor
gani
c soi
ls
Resto
re d
egra
ded
lands
Bioe
nerg
y (so
ilsco
mpo
nent
)
Live
stock
Man
ure m
anag
emen
t
Mitigation measure
Glo
bal b
ioph
ysica
l miti
gatio
n po
tentia
l (M
t CO2-e
q. y
r-1)
N2OCH4CO2
Smith et al. (2008)

Agriculture • Cropland
– Reduced tillage – Rotations – Cover crops – Fertility management – Erosion control – Irrigation management
• Rice paddies – Irrigation – Chemical and organic fertilizer – Plant residue management
No-till seeding in USA
Rice fields in The Philippines
Maize / coffee fields in Mexico
• Agroforestry – Improved
management of trees and cropland

Soil M icrobial Activity
Soil Organic Matter (C)
CO2
Harvestable Yield
Sunlight
Climate Soils Management

Biophysical GHG Mitigation Potential
Soil C
---- t CO2e/ha/yr ------
No-till* 1.09 (-0.26–2.60)
Winter cover crops* 0.83 (0.37–3.24)
Diversify Annual Crop Rotations*
0.58 (-2.50–3.01)
Olander et al., 2011

Year
1992 1995 1999 200220032004 2007
Soi
l org
anic
C (M
g ha
-1)
05
101520253035404550556065707580
0 - 0.05 m0.05 - 0.15 m0.15 - 0.30 m0 - 0.30 m
NT MF
∆ = 0.63 Mg ha-1 year-1
∆ = 0.32 Mg ha-1 year-1

Latitude Mean Temp
Mean Precip
Drainage Class Crop Time Depth ΔSOC
ºC mm years cm Mg ha-1 yr-1
46ºN 6 1000 well
drained soybean-barley 16 60 - 0.20
41ºN 10 920 poorly
drained corn-soybean 15 60 -1.58
41ºN 9 1000 s. poorly drained corn-soybean 8 60 -0.98
40ºN 10 960 well
drained corn-soybean 30 60 1.21
41ºN 8 1070 m. well drained corn-soybean 10 60 1.60
39ºN 11 800 m. well drained
corn 17 90 0.61
28ºS 19 1730 well
drained soybean-wheat-
soybean-oat 22 90 0.42

No-Tillage Cropping Systems Conservation Agriculture
•Restores soil carbon •Conserves moisture •Saves fuel •Saves labor •Lowers machinery costs •Reduces erosion •Improved soil fertility •Controls weed •Planting on the best date •Improves wildlife habitat

Carbon sequestration rate (C rate) expressed in equivalent mass (Mg C/ha/y) to a 30 cm depth for Manhattan, KS USA
Conversion from tilled to no-till
Rotation Continuous Soybean 0.066
Continuous Sorghum 0.292
Continuous Wheat 0.487
Soybean - Wheat
0.510
Soybean - Sorghum 0.311
12 Fabrizzi, 2006

Physical Protection
Chemical
Microbial composition and activity
Substrate quality
Plant characteristics
H2O Temperature
Clay
Biological factors
Organics
Clay
Plant C
CO2
O2
Disturbance
Conservation of Soil Carbon
Hie
rarc
hy o
f im
port
ance
Mineralogy

PG: prairie grass (big bluestem); NT: No-till sorghum; CT: Conventional till sorghum. SFWSA: sand-free water stable aggregate
Change in macroaggregate (>2000 um) over time
26
14
1.5
8
0
5
10
15
20
25
30
2004 2006 2008 2010
Year
SFW
SA (%
)
PG
NT
CT

After 3 yrs higher amounts of saprophytic fungi, and lower amounts of bacteria were characteristic of the less disturbed PG and NT, compared to tilled CT.
Soil PLFA 2006 (0-5 cm)
No-
Till
Sorg
hum
Pr
airie
Gra
ss
Actinomycetes
Mol
e %
16:1w7c 18:1w7c
cy19:0 10Me18:0 18:2w6,9c i15:0 i16:0
i17:0 10Me17:0
Tilla
ge S
orgh
um
0
2
4
6
8
10
12
14
Gm- Bacteria Fungi Gm+ Bacteria
Mol
e %

Anthropic Sources of Methane and Nitrous Oxide Globally
Total Impact 2.0 Pg Cequiv 1.2 Pg Cequiv
Source IPCC 2001; from Robertson 2004
Industry Industry
Agricultural soils
Biomass burning
Cattle & feedlots
Agriculture Agriculture
Energy
Other combustion
Landfills
Enteric fermentation
Waste treatment
Rice cultivation
Biomass burning
CH4 N2O
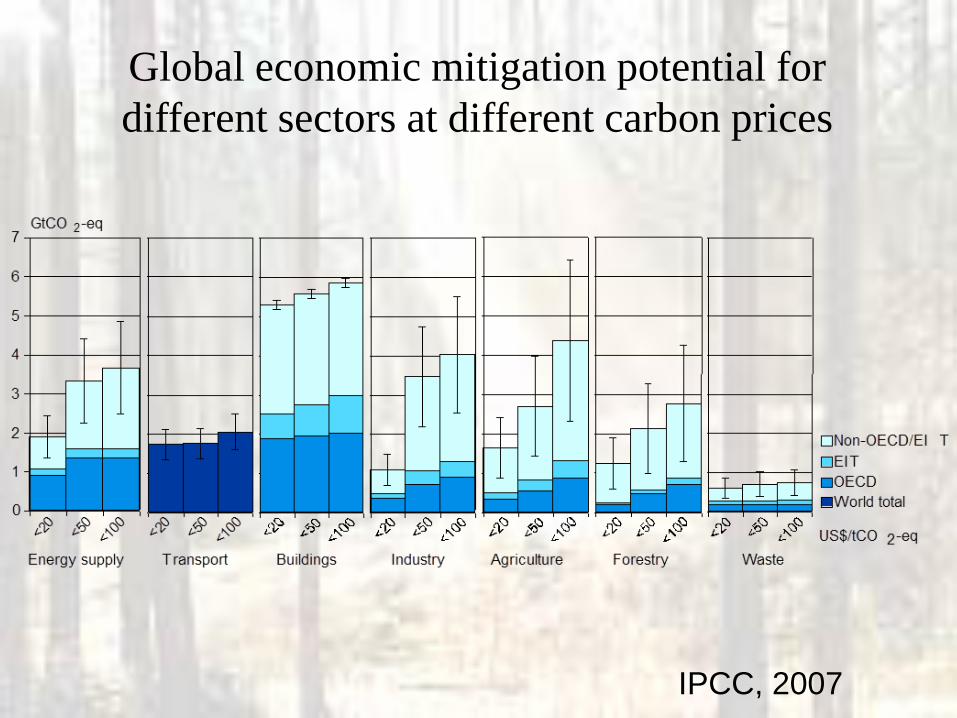
Long-Term Exp: Cumulative N2O-N emissions
Tillage
NT T
g N2O-
N ha
-1
0
2000
4000
6000
8000
10000
12000
14000
16000
18000
20000
SRNFSBSU
2010
b
ab b
b
a
ab
Arango et al., 2011

N2O Mitigation Potentials
Practice % Reduction Soil Emissions Soil N Tests 10 Fertilizer Timing 10 Cover Crops 5 N Fertilizer Placement 5 Nitrification & Urease Inhibitors 5 Indirect Fluxes Crop N use efficiency 20 Riparian Zone Management 5 Ammonia Management 5 Wastewater Treatment 5
Robertson

Barriers
2
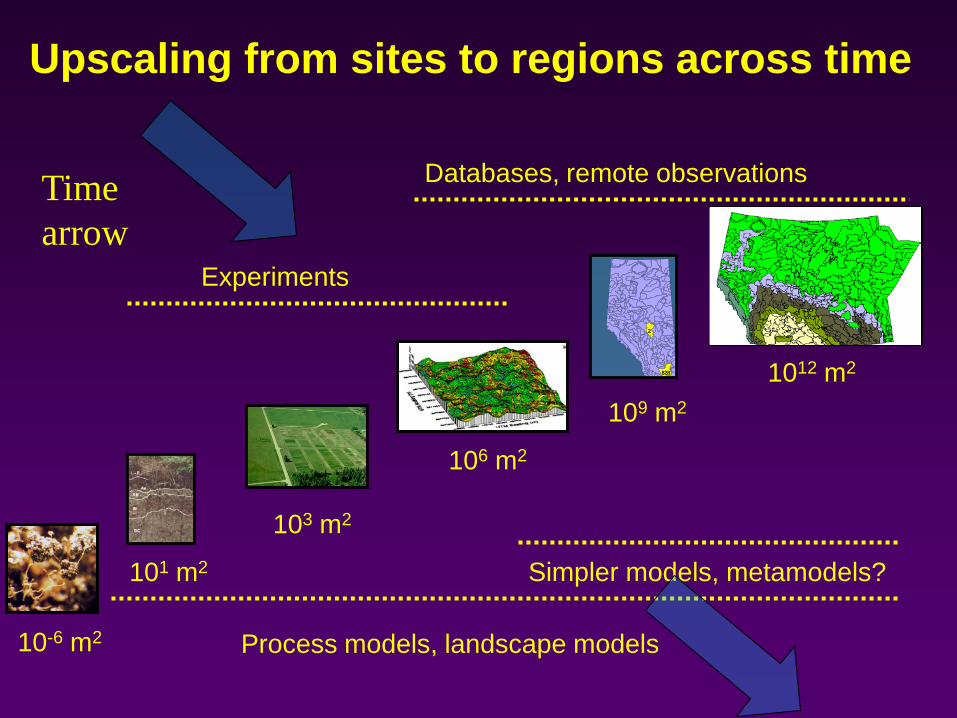
828 1012 m2 109 m2
106 m2
103 m2
101 m2
Experiments
Databases, remote observations
Process models, landscape models
Simpler models, metamodels?
Upscaling from sites to regions across time
Time arrow
10-6 m2

Measurement, Monitoring and Verification Detecting soil C changes
– Difficult on short time scales – Amount of change small compared to total C
Methods for detecting and projecting soil C changes (Post et al. 2001)
– Direct methods • Field measurements
– Indirect methods • Accounting
–Stratified accounting –Remote sensing –Models
Post et al. (2001)

Sampling strategies: account for variable landscapes

Geo-reference microsites
• Microsites reduces spatial variability • Simple and inexpensive
• Used to improve models • Used to adopt new technology
• Soil C changes detected in 3 yr
– 0.71 Mg C ha-1 – semiarid – 1.25 Mg C ha-1 – subhumid
Ellert et al. (2001)
Sampling location: initial subsequent electromagnetic marker
4 m
7 m

Crop identification for spatial modeling. Courtesy: P Doraiswamy, USDA-ARS, Beltsville, MD
Remote Sensing and Carbon Sequestration and GHG Reductions
Remote sensing cannot be used to measure soil C directly unless soil is bare.
Remote sensing useful for assessing: • Vegetation
– Type – Cover – Productivity
• Water, soil temperature
• Tillage intensity?

Methods to Extrapolate Measurements and Model Predictions from Sites to Regional Scales
• Models – CENTURY
• Comet VR – EPIC – RothC – Other models
also being developed
CENTURY MODEL
http://www.cometvr.colostate.edu/images/ecosystem.gif

Modeling

N2O Emission Rates: Conventional vs No-till (Irrigated corn)
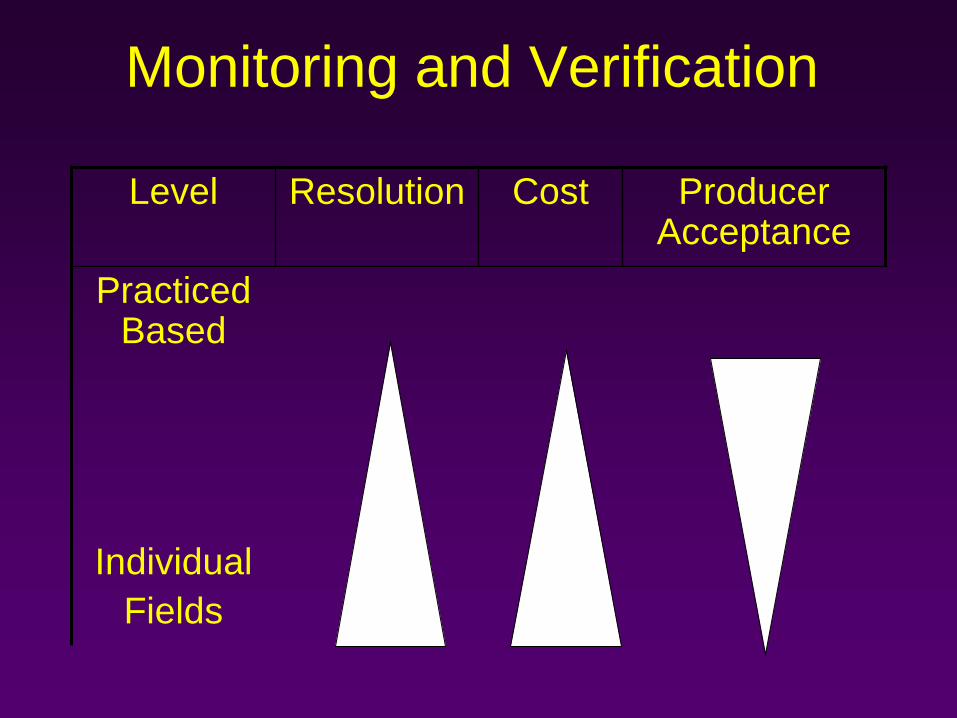
Monitoring and Verification
Level Resolution Cost Producer Acceptance
Practiced Based
Individual Fields

Mitigation Opportunities for Agriculture • Offsets
– Soil Carbon • Cropping systems: No-tillage, rotations • Grasslands • Rangelands
– Nitrous oxide reductions from improved N use efficiency
• Fuel reductions
• Energy efficiency
Conclusions: Mitigation • Agriculture has a significant role to play in climate mitigation
• Agriculture is cost competitive with mitigation options in other
sectors • Many mitigation options improve sustainability

• Website www.soilcarboncenter.k-state.edu/
Chuck Rice Phone: 785-532-7217 Cell: 785-587-7215 [email protected]