Embed Size (px)
Citation preview

See discussions, stats, and author profiles for this publication at: https://www.researchgate.net/publication/234021797
People and Organizational Culture: A Profile Comparison Approach to
Assessing Person-Organization Fit
Article in The Academy of Management Journal · September 1991
DOI: 10.2307/256404
CITATIONS
2,220
READS
1,332
3 authors:
Charles A O'Reilly
Stanford University
84 PUBLICATIONS 15,566 CITATIONS
SEE PROFILE
Jennifer A. Chatman
University of California, Berkeley
61 PUBLICATIONS 11,976 CITATIONS
SEE PROFILE
David F. Caldwell
Santa Clara University
60 PUBLICATIONS 8,858 CITATIONS
SEE PROFILE
All content following this page was uploaded by Charles A O'Reilly on 15 June 2015.
The user has requested enhancement of the downloaded file.

18People and Organizational Culture: A Profile ComparisonApproach to Assessing Person-organization Fit
Charles A. O’Reilly III, Jennifer Chatman & David F. Caldwell
Source: Academy of Management Journal 34 (3) (1991): 487–516.
The notion of organizational culture has been important in the study oforganizational behavior for the past decade (e.g., Barley, Meyer, & Gash,1988; O’Reilly, 1989, Smircich, 1983). In spite of disagreements over some
elements of definition and measurement, researchers seem to agree that culturemay he an important factor in determining how well an individual fits anorganizational context (e.g., Kilmann, Saxton, & Serpa, 1986; Schein, 1985)Implicit in writing on this theme is a logic of person-culture fit fundamentallydrawn from an interactional psychology perspective in which aspects of bothindividual and situation combine to influence a focal individual’s response to agiven situation (e.g., Chatman, 1989; Schneider, 1987; Terborg, 1981). In thisregard, aspects of individuals, such as values and expectations, interact with facetsof situations, such as incentive systems and norms, to affect the individuals’attitudinal and behavioral responses. As with similar fit theories of careers(Holland, 1985), job choice (Hackman & Oldham, 1980), work adjustment(Lofquist & Dawis, 1969), and organizational climate (Joyce & Slocum, 1984), thevalidation of the construct of person-culture fit rests on the ability to assess relevantaspects of both person and culture. This measurement problem is a significant andsometimes controversial issue (Keon, Latack, &Wanous, 1982; Rousseau, 1990)—one that is at the center of the person-situation debate, that is, the controversy overthe degree to which personality or context variables explain attitudes and behavior(Bem& Allen, 1974; Davis-Blake & Pfeffer, 1989; Kenrick & Funder, 1988). Thepurpose of this research was to examine person-culture fit and its implications forwork attitudes and behavior.We draw on recent developments in the applicationsof Q-sort, or template-matching,1 approaches to resolve some of the measurementissues that have hindered previous research on fit (Bem & Funder, 1978; Block,Block, & Morrison, 1981; Caldwell & O’Reilly, 1990).
Theoretical Background
Person-Situation Fit
The general notion of fit, or congruence, has long been important in psychologyand organizational behavior (Nadler & Tushman, 1980). In studying person-
situation fit, organizational behavior researchers have typically taken one of twobroad paths. One has led to exploration of the interaction of individualcharacteristics and broad occupational attributes, the other to exploration of thefit between specific characteristics of an organization and the people in it.Examples of the second approach range from studying the match of individualskills to job requirements to studying the relationship between individualcharacteristics and organizational climate (e.g., Downey, Hellriegel, & Slocum,1975). For example, the two major theories of vocational choice (Holland, 1985;Super, 1957) both postulate that an individual will select a career or occupationthat is similar to or that fits with that person’s self-concept. Empirical resultshave typically supported the hypothesis that congruence between individuals’personalities and the demands of their occupations are associated with positiveaffect (Mount & Muchinsky, 1978; Spokane, 1985) and a high likelihood of theirstaying in their jobs (Meir & Hasson, 1982). A similar logic characterizes a seriesof studies of work adjustment conducted by Lofquist and Dawis (1969). Forinstance, they proposed that satisfaction results from ‘‘a harmonious relationshipbetween the individual and his environment, suitability of the indIr idual to theenvironment and vice versa’’ (1969: 45). Tom (1971) recast this notion ofperson-situation complementarity to focus on person-organization fit. Hestudied the role of personality and organizational images in the recruitingprocess and found that the greater the similarity between an individual’sself-concept and his or her image of an organization, the more that individualpreferred that organization. In a similar vein, Keon and colleagues (1982) foundthat individuals with a positive self-image sought to enter graduate schools withpositive organizational images. Other studies have reported generally consistentfindings (e.g., Graham, 1976).More recent studies of early career adjustment and person-job fit have also
invoked notions of congruence For example, in a programmatic effort, Wanousand his colleagues showed how an accurate understanding of job requirementscan enhance a person’s adjustment to a job (Wanous, 1977). Similarly, thecongruence between a person and a job have embodied notions of fit (e.g.,O’Reilly, 1977): the degree to which individuals are suited to a job depends ontheir motives and needs and the job’s requirements (Hackman & Oldham, 1980).The cited studies and more general studies of person-situation interactions
(e.g., Diener, Larsen, & Emmons, 1984; Pervin, 1968) rest on the premise thatpositive responses will occur when individuals fit or match the requirements ofa situation. Although broadly used and intuitively compelling, the person-situation framework has spawned a number of disagreements. For example, arecent issue of the Academy of Management Review (1989, vol 14, no. 3) containedarticles dealing with those controversies. One important question raised Is howfit should he defined (Chatman, 1989).The definition of fit remains a critical and largely unanswered question (Rynes
& Gerhart, 1990). For instance, most studies of person-situation fit inorganizations have used normative measures of personality to assess individualcharacteristics and relatively broad classifications of tasks, occupations, or jobsto characterize situations. Thus, people are described with one language, or set
44 volume ii

of characteristics, and situations with a totally different language. This failure todescribe people and situations along commensurate dimensions limits scholars’ability to develop a coherent theory of person-situation interactions (Graham,1976; Pervin, 1968; Springfield, 1988) and makes it difficult to determine thereal impact of person-situation effects (Terborg, 1981). Further, the use of a verylimited set of descriptions of person and situation may make the detection of anytrue interaction effect difficult. Davis-Blake and Pfeffer, for example, observedthat similar jobs in different firms may vary greatly and concluded that the‘‘measurement of job characteristics requires moving beyond crude occupationalsurrogates to measures which actually reflect the characteristics of a particularjob as it is stuctured in a particular organizational setting’’ (1989: 394) A similarcriticism can be made of the extant treatments of personality, in which mostresearchers have relied on a few normative measures that may not only fail todescribe individuals adequately but may also assess personality characteristicsnot relevant to the people or situations under study (O’Reilly, Caldwell, &Mirabile, 1990; Weiss & Adler, 1984). Thus, although suggestive, previousresearch has generally failed to describe people and situations in a comprehen-sive manner along commensurate and relevant dimensions. This failure hashindered the development and empirical assessment of coherent theories ofperson-situation interaction.Recent work in interactional psychology has begun to identify the character-
istics of effective techniques for addressing person-situation effects. BemandFunder (1978) argued that, in addition to providing comprehensive measure-ments, effective techniques for assessing persons and situations should allow forholistic comparisons across multiple dimensions. Such an approach can bethought of as ‘‘semi-idiographic’’ in that it is idiographic (i.e., compares therelative strength of attributes within a single individual) with respect toindividual attributes but permits comparisons of person-situations (Luthans &Davis, 1982; Springfield, 1988). Since any given trait dimension will not beapplicable to all individuals, we want to be able to select only thosepersonological variables that are pertinent to a focal individual. Doing sorequires an idiographic approach rather than a nomothetic one in which allindividuals are rated in terms of a given attribute (Lamiell, 1981). The difficulty,however, with an idiographic approach is that it isn’t clear what to do once arating has been made. What is then needed is to be able to compare individualseven though descriptors may be differentially relevant to them.Using ‘‘Q-methodology’’ (Stephenson, 1953), Bem and Allen (1974) develop-
ed a template-matching technique to accommodate this dual concern withrelevance and comparability. This approach focuses on the salience andconfiguration of variables within a person rather than on the relative standing ofpersons across each variable. Since not all characteristics apply to all people andsince what differentiates people from each other is the set of traits salient to eachindividual, an assessment of person-situation fit must permit such idiographicmeasurement of each person while also allowing comparisons across situations.Such an approach requires a large number of items or descriptors thatcomprehensively describe individuals and are relevant to particular situations.
O’Reilly et al. � people and organizational culture 45

For instance, Bem and Funder (1978) created a 100-item profile of the idealperson for successful performance in an array of specific situations. How wellindividuals might do in a situation was predicted by how well they matched theideal person-in-situation profile. Thus, rather than comparing a person andsituation on a few dimensions, an appropriate person-situation investigationwould attempt to determine the overall fit of the person to the set of relevantsituational attributes.Drawing on the Q-sort technique used for template matching, Caldwell and
O’Reilly (1990) and O’Reilly and colleagues (1990) developed a profile-matchingprocess to assess person-job fit. Using a structured interview job analysis withjob incumbents and experts, they first developed a comprehensive set ofcompetencies required for successful job performance. This set (typically 60–90items) was then used to construct a consensus profile of the job. Individualprofiles were then obtained by using peers and superiors as assessors. Person-jobfit was measured by correlating the two profiles. Results of a series of studieshave shown that person-job fit predicts performance, satisfaction and turnoveracross a variety of jobs. Like template matching (Bem & Funder, 1978), theprofile comparison process comprehensively assesses individuals and situationsusing a common language, allows for the ipsative measurement of individualcharacteristics by arraying attributes in terms of their salience to the individual,and provides a direct measure of person-situation fit. The profile comparisonprocess goes beyond template matching by using items that are highly specificto a target situation and equally relevant to a person and a situation Thus, theapplication of a Q-sort technique appears to be a useful way to obtainsemi-idiographic assessments of fit and offers a way to resolve a number of themeasurement problems that have characterized earlier studies of person-situation interaction
Person-Culture Fit
Although a number of earlier studies have explored the general notion ofperson-organization fit (e.g., Graham, 1976; Joyce & Slocum, 1984; Tom,1971), more recent interest has centered on the idea that organizations havecultures that are more or less attractive to certain types of individuals (e.g.,Wilkins & Ouchi, 1983). As Barley and colleagues (1988) noted, the concept oforganizational culture has a long history, dating to early sociological studies(e.g., Gouldner, 1954; Selznick, 1949). Only recently, however, has tin term‘‘organizational culture’’ become prominent.Drawing on theories from anthropology, sociology, and social psychology,
researchers have made a number of efforts to understand the behavior ofindividuals and groups In organizations using cultural concepts such assemiotics, rituals, ceremonies, stories, and language (e.g., Ouchi & Wilkins,1985; Smircich, 1983, Swidler, 1986; Trice & Beyer, 1984). This process hasgenerated a series of debates over issues such as the definition of ‘‘culture,’’ theappropriate methodology for investigating it, and the proper level of analysis forits study. Barley (1983) pointed out that all studies of culture, whatever their
46 volume ii

theoretical origin, use reasonably similar terms and constructs. Differences existamong researchers in how objective or subjective, conscious or unconscious theiruse of these terms and constructs is and in what they see as appropriate elementsto study. Typically, researchers have agreed that culture can be thought of as aset of cognitions shared by members of a social unit (e.g., Geertz, 1973;Smircich, 1983). Rousseau (1990) provided an excellent description of thecommon elements in such sets and suggested a framework including fundamen-tal assumptions, values, behavioral norms and expectations, and larger patternsof behavior. Research on culture usually begins with a set of values andassumptions (Enz, 1988; Martin & Siehl, 1983; Schein, 1985; Weiner, 1988).These values, whether conscious or unconscious, typically act as the definingelements around which norms, symbols, rituals, and other cultural activitiesrevolve. Thus, Parsons argued that a cultural tradition emerges around values,defined as elements ‘‘of a shared symbolic system which serves as a criterion orstandard for selection among the alternatives of orientation which are intrinsi-cally open in a situation’’ (1951: 11–12). Rokeach offered a very similardefinition, proposing that ‘‘a value is an enduring belief that a specific mode ofconduct or end-state of existence is personally or socially preferable to anopposite or converse mode of conduct or end-state of existence’’ (1973: 5). Inthis vein, basic values may be thought of as internalized normative beliefs thatcan guide behavior. When a social unit’s members share values, they may formthe basis for social expectations or norms. Should these be even more widelyshared throughout a larger social grouping, an organizational culture or valuesystem may exist. Thus, researchers who investigate culture by focusing onnorms (e.g., Cooke & Rousseau, 1988; Harrison & Carroll, 1991; O’Reilly,1989) are studying social expectations that are based on underlying values.Others who study culture through rituals, stories, or myths (e.g., Louis, 1983;Martin & Siehl, 1983; Trice & Beyer, 1984) are examining phenotypicoutcroppings that reflect underlying beliefs and values.The pervasiveness and importance of values in organizational culture are
fundamentally linked to the psychological process of identity formation in whichindividuals appear to seek a social identity that provides meaning and connec-tedness (Ashforth & Mael, 1989). A substantial body of research has shown thatindividuals tend to classify themselves into social categories, such as gender,race, ethnicity, and organizational affiliation, and to use those categories todefine themselves. For instance, people appear particularly able to discriminatebetween in-groups and out-groups and to be attracted to those seen as similarto themselves (Brewer, 1979; Moreland, 1985). Drawing on underlying values,individuals may manage their lives in ways that help them choose congruentroles, occupations, and even organizations (Albert & Whetten, 1985; Sampson,1978; Stryker & Serpe, 1982). Schneider (1987) proposed that individuals maybe attracted to organizations they perceive as having values similar to their own.In addition, organizations attempt to select recruits who are likely to share theirvalues. New entrants are then further socialized and assimilated, and those whodon’t fit leave. Thus, basic individual values or preferences for certain modes of
O’Reilly et al. � people and organizational culture 47
conduct are expressed in organizational choices and then reinforced withinorganizational contexts. Just as research has shown that similar backgrounds,attitudes, and experience can increase liking between individuals (Tsui &O’Reilly, 1989), it may be that organizations that manifest and reward characteristic outcomes and behaviors will be more or less attractive todifferent types of people. Values provide the starting point, with the jointprocesses of selection and socialization acting as complementary means to insureperson-organization fit (Chatman, 1988). Thus, congruency between an individ-ual’s values and those of an organization may be at the crux of person-culture fit.
The Assessment of Person-Culture Fit
There are some fundamental areas of agreement in the definition of culture, butless agreement exists about its measurement. As Rousseau noted at the veryoutset of her review, ‘‘Quantitative assessment of culture is controversial’’ (1990:1). She discussed how advocates of qualitative methods for studying culture haveargued that much of what constitutes a culture may be a unique socialconstruction of reality, perhaps unconscious on the part of the culture’smembers (e.g., Schein, 1985, Smircich, 1983). Acknowledging that some aspectsof organizational culture may not be easily accessible, Rousseau also assertedthat certain dimensions of culture may be appropriately studied using quantitat-ive methods, indeed suggesting that quantitative assessments offer an opportun-ity to understand the systematic effects of culture on individual behavior.One way to assess culture quantitatively is to focus on the central values that
may be important to an individual’s self-concept or identity as well as relevantto an organization’s central value system. Weiner suggested this perspective,noting that ‘‘when a number of key or pivotal values concerning organization-related behaviors and state-of-affairs are shared across units and levels — bymembers of an organization, a central value system is said to exist’’ (1988: 535).To characterize an organization’s culture in terms of its central values requiresfirst that the range of relevant values be identified and then that an assessmentbe made of how much intensity and consensus there is among organizationalmembers about those values (Enz, 1988; Saffold, 1988). O’Reilly (1989), drawingon earlier research on measuring norms, noted two important characteristics ofstrong cultures. One is intensity on the part of organization members, that is,displaying approval or disapproval to those who act in certain ways; the secondis the presence of crystallization, or widespread agreement on values, amongmembers If there cs no substantial agreement that a limited set of values isimportant in a social unit, a strong culture cannot be said to exist. If there isstrong and widespread agreement about the salience and importance of specificvalues, a central value system or unit culture may exist.Much previous research has suggested that person-culture fit increases
commitment, satisfaction, and performance, but very little empirical research onthese relationships has been done The general research question examined herewas the following: To what extent is person-culture fit associated with individualcommitment, satisfaction, and longevity with an organization (Holland, 1985,
48 volume ii

Moir & Hasson, 1982; Mount & Muchinsky, 1978)? We expected to find thathigh levels of person-culture fit would be positively associated with thoseoutcomes.Addressing that question required two types of analyses. First, we needed to
demonstrate that preferences individuals have for organizational cultures arecomparable to cultures that exist. Second, the relationship between individualpreferences and organizational culture needed to be assessed across a broadrange of values. Therefore, we tested our general research question bydeveloping a method of assessing culture based on the extant values oforganizations and measuring person-culture fit through a semi-idiographictechnique based on the profile comparison process (Caldwell & O’Reilly, 1990;O’Reilly et al., 1990).
Methods
Overview
To investigate person-culture fit, we developed an instrument we called theOrganizational Culture Profile (OCP). This instrument contains a set of valuestatements that can be used to idiographically assess both the extent to whichcertain values characterize a target organization and an individual’s preferencefor that particular configuration of values. Person-culture fit can be calculatedby correlating the profile of organizational values with the profile of theindividual’s preferences.In a set of related investigations using multiple sets of respondents, we
explored the characteristics of the OCP and demonstrated its ability to assessboth organizations and people. In addition, we explored the relationshipbetween preferences for organizational values and individual personality vari-ables. Finally, we used the OCP to assess person-culture fit and test for therelationship between fit and work-related outcomes.
Development and Use of the Organizational Culture Profile
The OCP was developed and used to measure person-organization fit. Theapproach to its development followed Caldwell and O’Reilly (1990). The OCPcontains 54 value statements that can generically capture individual andorganizational values. Following the general procedure for generating Q-sortprofiles (Block, 1978), we had respondents sort the 54 items into nine categories,ranging, for instance, from most to least desirable or from most to leastcharacteristic, and to put a specified number of statements in each category; therequired item-category pattern is 2-4-6-9-12-9-6-4-2. Fewer items are requiredat the extremes than in the central, more neutral categories. The questionrespondents were asked to keep in mind while sorting the deck varied accordingto whether they were describing their own preferences or the value system orculture of a focal organization. To develop a profile of an organization’s culture,
O’Reilly et al. � people and organizational culture 49
we instructed respondents familiar with the organization to sort the 54 valuestatements according to the extent to which the items were characteristic of theorganization. For individual preferences, individuals were asked to sort accord-ing to their personal preferences for each value in their ideal organization. Withthis procedure, sep arate groups of individuals can be used to assess a firm’sculture and provide ratings of preferences. The degree to which the organiz-ation’s values are consistently shared can be investigated by the intercorrelationamong raters using a variation of the Spearman-Brown general prophecyformula (Nunnally, 1978). A more complete description of the development andgeneral use of the OCP follows.
Step 1 — Describing Organizational Values
The set of value statements was developed on the basis of an extensive review ofacademic and practitioner-oriented writings on organizational values and culture(cf. Davis, 1984; Deal & Kennedy, 1982; Kilmann, 1984; Ouchi, 1981; Peters &Waterman, 1982; Schein, 1985). The purpose of this review was to identify acomprehensive set of values that could be used to characterize both individualsand organizations. An attempt was made to identify items that (1) could be usedto describe any person or organization, (2) would not be equally characteristicof all people or organizations, and (3) would be easy to understandThe initial pool of items consisted of over 110 items. For the final set, we
used four criteria: (1) generality — an item should be relevant to any type oforganization, regardless of industry, size, and composition; (2) discriminability— no item should reside in the same category for all organizations; (3)readability — the items should be easily understandable to facilitate their havingcommonly shared meanings; and (4) no redundancy — the items should havedistinct enough meanings that they could not substitute for one anotherconsistently. Therefore, in addition to the literature search, we made asystematic empirical check to insure that the items met those criteria.We asked 38 undergraduates participating in a vocational interest feed
back program, all seniors majoring in business administration, and four facultymembers to screen the 110 items, identifying items that were redundant,irrelevant, or difficult to understand. They were also asked to identify anyunincluded items that would be important descriptors of an organization’sculture. We made a similar check with respondents from a set of accountingfirms. After several iterations, we obtained a final set of 54 value-basedcharacteristics, which are listed in the Appendix.
Step 2 — Assessing Characteristics of Firms
To obtain profiles of the cultures of firms, we identified sets of key informantswith broad experience and asked them to sort the 54 items in terms of howcharacteristic each was of their organization’s culture. Respondents received thefollowing definition and instructions. ‘‘Important values may be expressed in the
50 volume ii

form of norms or shared expectations about what’s important, how to behave orwhat attitudes are appropriate. Please sort the 54 values into a row of ninecategories, placing at one end of the row those cards that you consider to be themost characteristic aspects of the culture of your organization, and at the otherend those cards that you believe to be the least characteristic . . .To study eight accounting firms, Chatman (1988) used an average of 16 ac
countants per firm with an average tenure of eight years. She constructedseparate firm profiles by averaging the responses of the raters within each firm.The extent to which individuals in firm described it in a consistent way wasassessed through a variation of the Spearman-Brown general prophecy formula.The eight profiles showed substantial reliability, with an average alpha of .88,representing a range of .84 to .90, indicating relatively high levels of agreementamong the raters in each firm. The similarity of the cultures of the eight firmswas assessed by correlating the overall firm profiles with one another. Thesecorrelations ranged from .29 to .85, suggesting substantial variability in theextent to which any two firms had similar cultures. Reliabilities for thegovernment agency and other accounting firms used in the studies reported herewere also high.
Step 3 — Assessing Individual Preferences
To assess individual preferences for organizational cultures, respondents wereasked to sort the 54-item deck into the nine categories by responding to thequestion, ‘‘How important is it for this characteristic to be a part of theorganization you work for?’’ The answers ranged from ‘‘most desirable’’ to‘‘most undesirable.’’ To assess the test-retest reliability, or stability, of suchpreferences, we had 16 M.B.A.-degree candidates complete Q-sorts 12 monthsapart. The instructions for these respondents were identical to those for theother groups providing data for the overall effort reported here. Correlationsover the year averaged .73, suggesting a high stability of preferences. Toinvestigate possible social desirability bias in the sorts, we gave eight doctoralstudents at the same university a description and definition of what constitutessocial desirability bias and asked them to sort the 54 items in the most sociallydesirable way. Such biases, if undetected, could limit the variability of theprofiles. In order to minimize such limitation, we cast all items in the OCP insocially neutral or slightly positive terms. This social desirability profile was thencompared to firm profiles for the eight accounting firms. No evidence of socialdesirability bias emerged — organizations’ members did not appear to be sortingthe OCP in a way calculated to make their firms look like good places to work.
Step 4 — Calculating the Person-organization Fit Score
We calculated a person-organization fit score for each individual by correlatingthe individual preference profile with the profile of the firm for which the personworked. More thorough descriptions of this approach to assessing fit appear inChatman (1989) and in Caldwell and O’Reilly (1990).
O’Reilly et al. � people and organizational culture 51

Respondents
Data to develop and test the OCP were obtained from five separate groups ofrespondents. The first consisted of 131 first-year M.B.A. students at a west coastuniversity voluntarily participating in a managerial and personality assessmentproject (group 1). They completed the OCP to assess their preferences fororganization values and provided substantial personality data, completing theAdjective Check List (Gough & Heilbrun, 1980), a well-developed and widelyused measure of personality. Men comprised 57 percent of group 1, women 43percent; the average age was 27.7 and the average years of work experience was3.2. We used this group in two ways, first in combination with other groups toassess the structure of individual preferences for organizational values, andsecond, to investigate the relationship between personality and preferences fororganizational cultures.A second group of 93 M.B.A. students at a midwestern university provided
OCP data on individual culture preferences (group 2). Men comprised 54percent of this group; the average age was 26 and the average number of yearsof work experience was two. We combined this group with others to assess thestructure of individual preferences.The third group of respondents was part of a longitudinal study that tracked
new accountants as they entered and proceeded through their first two years inwest coast offices of eight of the largest U.S. public accounting firms (Chatman,1988). In each of the eight firms, most or all of the accountants hired in 1986 intothe audit function participated in the study; for all the firms, there were 171respondents, representing 84 percent of the eligible employees (the mean perfirm was 22, s.d�5) The demographic character istics of group 3 were as follows:47 percent were men; the average age was 24 in the fall of 1986; all had bachelor’sdegrees; and 25 percent had master’s degrees. At the time of data collection,salaries were nearly identical across the eight firms (x̄�$21,500, s d.�$1,000),and all respondents entered their firms with the title of staff accountant.These individuals provided data on their preferences by completing the OCP.
In addition, we surveyed them approximately 12 months later regarding theirjob satisfaction, organizational commitment, and intent to leave. A measure ofactual turnover was obtained approximately 24 months after the OCP data werecollected. Data from this group were used in two ways. First, we combined theirOCP responses with those obtained from the first two groups to assess thestructure of individual preferences for organizational values. Second, wecorrelated individual OCP data with firm-level measures of corporate culture(obtained from a fourth group of respondents) to provide a measure ofperson-culture fit. This fit score was related to the individual outcome variablesof job satisfaction, commitment, intent to leave, and actual turnover.Data were also obtained from 128 senior accountants employed by the eight
firms taking part in the longitudinal study of new accountants. Approximately18 individuals completed the OCP for each firm, describing the pattern of valuesthat characterized the organization. All these informants had at least two yearsexperience in the firm. We developed an overall profile of the culture of each
52 volume ii

firm by averaging the individual responses. There was a high level of agreementamong the members of each firm, as shown by Spearman-Brown coefficientsranging from .84 to .90. We used data from this sample to generate theaggregate profiles describing the culture of each of the eight accounting firms.These were then used to calculate the person-culture fit scores for the newlyhired accountants.The fourth group of respondents consisted of 96 certified public accountants
from six offices of major accounting firms in the west central United States. Ofgroup 4, 63 percent were men; the group’s average tenure was 85 months and55 percent were over 30 years of age. These respondents provided assessmentsof firm culture. We combined these data with data from a fifth group ofrespondents to analyze the structure of OCP descriptions of film cultures.The fifth group consisted of 730 middle-level managers employed by a
government agency who were attending a continuing management developmentprogram at an east coast university. In group 5, 88 percent of the respondentswere men; the average age was 45.9 and the average tenure with the employingagency was 21.4 years. All described the values of their organization bycompleting the OCP. We combined these data with those from group 4 toanalyze the structure of the values defining corporate culture.
Measures
To test the general hypothesis that person-organization fit is related to workoutcomes, we measured a number of other variables:
Person-organization Fit
The new accountants in group 3 sorted the items in the OCP in terms of theirown preferences for organizational culture. The senior accountants in group 3sorted the items in terms of how descriptive they were of their firms. Thus, wedeveloped a profile of the culture of each firm and calculated person-organization fit by correlating the rankings of the set of 54 individualpreferences obtained from the new accountants with the rankings of the 54values obtained from the senior accountants in the firm that employed them.The person-organization fit correlations ranged from �.36 to �.62.To establish the predictive validity of person-organization fit, follow-up data
were collected from the entry-level accountants, through surveying respondentsfrom seven of the eight firms about one year after the initial data collection.Because of a delay in collecting initial data at the eighth firm, it was impossibleto survey the individuals at this firm, although the firm provided informationabout turnover. This limitation reduced the potential number of respondents inthe second survey to 144. Of that number, 6 had left their firms and 2 were onextended leaves of absence at the time of the follow-up survey. Eligiblerespondents returned a total of 127 surveys, yielding a response rate of about 92percent. Questions in the survey used related to commitment, job satisfaction,and intent to leave.
O’Reilly et al. � people and organizational culture 53

Organizational Commitment
Commitment was measured using O’Reilly and Chatman’s (1986) 12-item scale.A principal components analysis with varimax rotation yielded two factors. Onefactor, normative commitment, was defined by eight items representing commit-ment based on an acceptance of an organization’s values. The second factor,instrumental commitment, was defined by four items describing commitmentbased on exchange, or in response to specific rewards. These factors areconsistent with recent findings (Caldwell, Chatman, & O’Reilly, 1990). Wecalculated separate factor scores for normative and instrumental commitmentand used them in subsequent analyses.
Job Satisfaction
Overall satisfaction with a job was measured using the single-item Faces Scale(Kunin, 1955). Recent research has shown this scale to be the most balanced jobsatisfaction measure in terms of capturing positive and negative affect andcognitions (Brief & Roberson, 1989).
Intent to Leave
Intentions of leaving an organization were measured with four 7-pointLikert-type questions: (1) ‘‘To what extent would you prefer another more idealjob than the one you now work in?’’ (2) ‘‘To what extent have you thoughtseriously about changing organizations since beginning to work here?’’ (3) ‘‘How long do you intend to remain with thisorganization?’’ and (4) ‘‘If you have your own way, will you be working for thisorganization three years from now?’’ Since a principal components analysis ofthe questions yielded a single factor, we calculated one factor score to me asureintent to leave.
Turnover
Approximately one year after the administration of the second survey and twoyears after person-organization fit was measured, each of the eight firmsprovided a list of individuals who had left and the dates of their departures.Although responses to the commitment, satisfaction, and intent-to-leave ques-tions were available from only 127 individuals, actual turnover data wereavailable for all the original respondents. Of the 171 individuals for whomperson-organization fit scores were available, about 28 percent (N�47) had lefttheir firms in the two-year period.
Control Variables
Since the initial person-organization fit data were obtained very soon afterindividuals joined their firms, during what is potentially a key time in shaping
54 volume ii
future attitudes (e.g., Louis, 1980), we controlled tenure with a firm at the timeinitial data were collected (x̄�19 days, s.d.�27). Age and gender were also usedas control variables. Although respondents differed in the degrees they hadobtained, we did not use degree as a control because all these individuals hadidentical jobs and because the quality of the programs from which they hadgraduated varied substantially. It therefore seemed that issues degree mightnormally index, such as expectations and career prospects, would not be relatedto that variable for the individuals studied.
Results
Although the initial development of the OCP showed good internal andtest-retest reliability, validity remained a major concern, did the OCP discrimi-nate among individuals and organizations in terms of their central value systemsand did the measure of individual-culture fit have predictive validity? To lestthose questions, we used two general types of analyses. First, we conductedseparate factor analyses of the individual (Table 1) and organizational profiles(Table 3) to examine the dimensionality underlying the OCP. To be useful, thedimensions of individual preferences and organizational cultures should becomparable. Evidence of such comparability would indicate that the types ofcultures individuals indicate they want are generally equivalent to the culturesorganizations offer, and lack of comparability would reduce the meaningfulnessof person-organization fit. In addition, evidence that the individual dimensionsof culture are associated with characteristically different personality types wouldsuggest that the underlying factors are psychologically meaningful (Table 2). Inaddition to seeking evidence of discriminant validity, we used a second set ofanalyses based on person-organization fit scores to predict satisfaction, commit-ment, and tenure (Tables 4–6). Taken together, the results of these analysesdemonstrate that person-organization fit possesses predictive validity and isorganizationally useful.
Discriminant Validity and the Factor Structure of the Organizational Culture Profile
Recall that each respondent was asked to sort the 54 items in the OCP into ninecategories ranging from most to least desirable according to how important itwas for the person that the characteristic represented be a part of anorganization’s culture. Following Block (1978), we analyzed data from the twogroups of M.B.A. students and the new accountants (groups 1, 2, and 3, N�395)using principal components analysis with varimax rotation. Results of an analysisof all 54 items revealed 33 items with loadings of greater than .40 on a singlefactor. Table 1 shows results; items with significant cross-loadings are notreported.From a scree test, eight interpretable factors with eigenvalues greater than 1.0
and defined by at least three items emerged. This pattern shows that anorganization’s culture can be characterized by innovation and risk taking (factor
O’Reilly et al. � people and organizational culture 55

Table
1:
Res
ults
ofFa
ctor
Ana
lysi
sof
Indi
vidu
alP
refe
renc
esa
Org
aniz
atio
nal
Atte
ntio
nO
utco
me
Em
phas
ison
Team
cultu
reIn
nova
tion:
tode
tail:
orie
ntat
ion:
Agg
ress
iven
ess:
Sup
port
iven
ess:
rew
ards
:or
ient
atio
n:D
ecis
iven
ess:
profi
leite
mfa
ctor
1fa
ctor
2fa
ctor
3fa
ctor
4fa
ctor
5fa
ctor
6fa
ctor
7fa
ctor
8
Sta
bilit
y�
.66
.04
�.2
5.0
4.0
5�
.03
�.0
1.0
6In
nova
tion
.51
�.0
5�
.07
.07
�.0
2�
.02
�.0
9�
.05
Expe
rimen
ting
.59
�.1
2�
.03
�.0
5�
.08
�.0
8�
.04
�.0
4R
isk
taki
ng.6
5�
.04
�.0
6.2
2�
.20
�.1
0�
.08
�.0
5C
aref
ul�
.42
.33
�.2
5�
.11
�.1
5�
.07
.06
.16
Rul
eor
ient
ed�
.43
.38
.06
�.0
4�
.16
�.0
2.0
7.0
9S
ecur
ity�
.53
�.2
4�
.30
�.0
6.1
0.1
5�
.03
.13
Hig
hly
orga
nize
d�
.47
.24
�.2
1�
.01
�.1
7�
.05
�.0
3�
.24
Ana
lytic
al.0
1.5
6.1
3�
.09
.01
�.0
3�
.03
.06
Atte
ntio
nto
deta
il�
.08
.75
�.0
502
�.0
6�
.06
�.0
3�
.08
Pre
cise
�.0
9.7
5.1
2.0
1�
.09
.01
�.0
5�
.11
Cal
m�
.16
10�
.46
.08
�.0
4�
.04
.00
.12
Ach
ieve
men
tor
ient
ed�
.14
�.0
4.6
2.0
8�
.00
.25
�.0
3.0
5D
eman
ding
.19
�.0
1.5
7.2
1�
.15
�.1
5�
.07
.02
Hig
hex
pect
atio
ns.1
2�
.03
.65
.08
�.1
4�
.06
.01
�.0
3R
esul
tsor
ient
ed.0
7�
.01
.49
�.1
5�
.18
.20
.05
�.1
4O
ppor
tuni
ties
.17
.01
�.0
8.5
5�
.05
2504
�.1
0A
ggre
ssiv
e.0
9�
.08
.13
.75
�.1
1�
.09
.12
.14
Soc
ially
resp
onsi
ble
.11
�.1
9�
.06
�.5
1�
.09
�.2
8�
.05
.06
Com
petit
ive
.00
�.0
9.1
8.5
5�
.40
.00
�.1
3.0
4S
hare
sin
form
atio
n.3
0�
.08
�.0
0�
.12
.44
�.0
1.2
1.2
4S
uppo
rtiv
e�
.08
.03
�.2
1�
.08
.63
�.0
3.1
4.0
9P
rais
espe
rfor
man
ce�
.19
�.1
1�
.06
.00
.54
.10
�.1
3.0
7Lo
ngho
urs
�.0
1.2
1.1
4.2
0�
.53
.02
.12
.16
Pro
fess
iona
lgro
wth
�.0
8�
.05
�.0
8.1
2�
.15
.68
.03
.03
Hig
hpa
yfo
rpe
rform
ance
.07
�.0
8.1
4.0
3.1
6.6
6�
.20
.06
Fitti
ngin
�.2
3�
.02
.00
�.0
9.1
7.4
1.0
3.2
1A
uton
omy
.19
�.0
2�
.04
�.2
7.2
1�
.00
�.4
5�
.07
Team
orie
nted
�.1
0.0
2�
.O6
.01
.07
.03
.75
.03
56 volume ii

Col
labo
ratio
n.0
4�
.09
.01
19�
.12
�.1
2.7
0.0
3P
redi
ctab
ility
�.3
3.2
2�
.03
.04
.03
�.0
0.0
2.4
4D
ecis
iven
ess
�.0
3.1
0�
.02
.09
�.0
4�
.06
�.1
5.6
5Lo
wco
nflic
t�
.26
�.2
0�
.25
�.1
5.0
9.0
9�
.09
.56
Eig
enva
lues
5.28
4.16
3.11
2.33
1.93
1.73
1.61
1.49
Pro
port
ion
ofva
rianc
eac
coun
ted
for
.10
.08
.06
.04
.04
.03
.03
.03
a N�
395
Bol
dfac
est
atis
tics
repr
esen
tlo
adin
gsgr
eate
rth
an.4
0on
that
fact
or.
O’Reilly et al. � people and organizational culture 57

1), attention to detail (factor 2), orientation toward outcomes or results (factor3), aggressiveness and competitiveness (factor 4), supportiveness (factor 5),emphasis on growth and rewards (factor 6), a collaborative and team orientation(factor 7), and decisiveness (factor 8). These eight orthogonal factors areunambiguously defined. In general, they approximate many of the dimensions towhich the qualitative literature on culture has often referred (e.g., Deal &Kennedy, 1982; Peters & Waterman, 1982).It would support the reasonableness of those dimensions if different types of
individuals reported preferences for cultures differing along the dimensions. Toinvestigate, we computed factor scores for the west coast M.B.A. students (group1, N�131). We then correlated those scores with a very well-developed measureof normal personality, the Adjective Check List (Gough & Heilbrun, 1980). Theinstrument, which provides multiple measures of the strength of motives such asaffiliation, aggression, and achievement, has demonstrated substantial reliabilityand validity, with a median scale alpha of .76. One indication of the validity ofthe OCP dimensions would be the emergence of distinctive preferences fordifferent organizational cultures among respondents with characteristicallydifferent personality attributes. Table 2 presents the correlations among a set ofAdjective Check List measures and the eight OCP factor scores.Although we do not report specific hypotheses here, good support for seven
of the eight factors can be seen in the form of easily interpretable patterns ofpersonality and cultural preferences. For instance, individuals with high needsfor achievement show a significant preference for aggressive, outcome-orientedcultures. Respondents with high needs for autonomy show a preference forinnovative cultures and negativity toward those characterized by an emphasis onsupportiveness and teamwork. Only the detail-orientation factor, defined by apreference for precision, analysis, and attention to detail, shows no correlationwith any personality dimension. This absence may reflect the fact that theAdjective Check List does not contain any assessment of obsessive-compulsivetendencies. Overall, the results suggest that the dimensions underlying individ-ual preferences for distinctive cultures are meaningfully associated with charac-teristic differences in underlying personality variables.Additional important questions are whether the OCP reflects meaningful
organizational dimensions and whether the individual and organizationalmatrices are similar. To address those issues, we had 826 respondents from thegovernment agency and six accounting firms (groups 4 and 5) profile the culturein their organizational units. Each respondent sorted the 54 items into ninecategories on the basis of how much each attribute characterized the focalorganization; that is, individuals described their organization’s culture, not theirpersonal preferences. We performed a principal components analysis andvarimax rotation using those data, again retaining items with loadings greaterthan .40. Table 3 shows the factor loadings for the 26 items that loaded cleanlyon factors retained on the basis of a scree test.In this instance, seven clearly defined factors emerged. An inspection of the
two factor analyses reveals that five of the eight factors shown in Table 1 arereplicated almost exactly — innovation, outcome orientation, aggressiveness,
58 volume ii

Table
2:
Cor
rela
tions
Bet
wee
nA
djec
tive
Che
ckLi
stM
easu
res
and
Org
aniz
atio
nalC
ultu
reP
rofil
eFa
ctor
sa
Adj
ectiv
eE
mph
asis
chec
klis
tA
ttent
ion
Out
com
eon
Team
scal
esIn
nova
tion
tode
tail
orie
ntat
ion
Agg
ress
iven
ess
Sup
port
iven
ess
rew
ards
orie
ntat
ion
Dec
isiv
enes
s
Aba
sem
ent
�.3
0**
.09
�.0
6�
.28*
*.1
9*.0
5.0
7�
.03
Ach
ieve
men
t.1
2�
.12
.24*
*.2
5**
�.1
3.0
4.0
4.0
3A
ffilia
tion
�.0
1�
.10
.05
.03
.02
�.1
9*.2
0**
.29*
*A
ggre
ssio
n.2
6**
�.0
1.0
6.1
6�
.27*
*.0
9�
.13
�.0
9A
uton
omy
.33*
*�
.07
�.0
3.1
0�
.22*
.05
�.2
1*�
.16
Cha
nge
.30*
*�
.13
�.0
1.0
5�
.18*
.04
�.0
7�
.05
Cre
ativ
ity�
.11
.02
.10
.19*
.30*
*�
.03
�.1
5�
.15
Def
eren
ce�
.40*
*.0
5�
.02
�.1
5.2
1*�
.07
.17
.13
Dom
inan
ce.2
6**
�.1
1.1
8*.2
8**
�.1
9*.0
5*�
.01
.04
End
uran
ce.0
2.0
4.1
9*.1
3.0
1�
.02
.08
.04
Exh
ibiti
on.2
3*�
.05
.05
.11
�.2
1*�
.09
�.0
7�
.05
Nur
tura
nce
�.1
9*�
.10
�.0
2�
.17
.14
�.2
5**
.28*
*.2
1*S
elf-
confi
denc
e20
*�
.10
.15
.18*
�.1
2�
.04
.12
.09
Suc
cora
nce
�.2
3*.1
0�
.08
�.2
2*.1
6.0
3.0
5�
.05
a N�
119.
*p�.
05.
**p�
.01.
O’Reilly et al. � people and organizational culture 59

detail orientation, and team orientation. Sixteen of the 20 items shown in Table3 that are also in Table 1 load on the same factors The nonreplication of theother three individual preference dimensions (supportiveness, emphasis onrewards, and decisiveness) seems to result from a lack of inclusion of the sameitems. Although direct comparison of the factor structures could be misleadingbecause of the different stem questions, overall there appears to be good comparability between cultures as defined byindividual preferences and actual organizational descriptions. The results of thefactor analyses suggest that the OCP can provide a reasonable mapping oforganizational culture.
Person-Organization Fit and Individual Outcomes
The evidence suggests that the 54 statements represent one possible approachto depicting culture, but an important question remains: Is person-organizationfit systematically related to relevant organizational outcomes such as satisfaction,commitment, and turnover? Table 4 shows the correlations between person-organization fit and a set of outcome and control variables. The correlationbetween an individual’s preferences and a firm’s characteristics across the entireset of 54 items measures person-organization fit.Of central interest are the correlations between person-organization fit and
normative commitment (r�.25, p�.01), overall job satisfaction (r�.35, p�.01),and intent to leave an organization (r��.37, p�.01). These relationshipssuggest clearly that high person-organization fit as measured at time 1, whenrespondents originally entered their firms, is associated with high positive affectand a low intent to leave at time 2, a year later. Person-organization fit is notsignificantly related to either age or gender; however, in order to insure thatthese variables were not affecting the bivariate relationships, we included themas controls in the regression equations Again, the results, reported in Table 5,are straightforward Person-organization fit is a significant predictor of norma-tive commitment, job satisfaction, and intentions to leave, independent of age,gender, and tenure.Approximately 12 months after the collection of satisfaction and commitment
measures or 24 months after we assessed person-organization fit, we collecteddata on the employment status of all respondents. To assess whether person-organization fit would predict actual turnover 24 months later, we used survivalanalysis (Kalbfleish & Prentice, 1980). Several recent papers (e.g., Fichman,1988; Morita, Lee, & Mowday, 1989; Peters & Shendan, 1988) have demon-strated the appropriateness of survival analysis for turnover research. Thistechnique takes explicit account of time in the analysis of turnover and correctsfor right censoring in the data. Table 6 presents these findings.To determine whether person-organization fit has an effect on staying with a
firm, the log likelihood of the base equation (model 1) was compared to the loglikelihood of model 2. The chi-square of this difference is statistically significant(�2�8.69, p�.01), indicating that person-organization fit positively predicts theprobability of a person’s staying with a firm. Although the form of the
60 volume ii

Table
3:
Res
ults
ofFa
ctor
Ana
lysi
sfo
rFi
rmD
escr
iptio
nsa
Org
aniz
atio
nal
Res
pect
for
Out
com
eA
ttent
ion
Team
cultu
reIn
nova
tion:
Sta
bilit
y:pe
ople
:or
ient
atio
n:to
deta
il.or
ient
atio
n:A
ggre
ssiv
enes
s:pr
ofile
item
fact
or1
fact
or2
fact
or3
fact
or4
fact
or5
fact
or6
fact
or7
Inno
vatio
n.7
6�
.08
.06
.07
.00
.12
�.0
4O
ppor
tuni
ties
.50
�.2
3�
.09
.07
�.0
1�
.03
.22
Exp
erim
entin
g.7
6�
.03
.04
�.1
5�
.11
�.0
6�
.06
Ris
kta
king
.76
�.0
8.0
2�
.08
�.1
3.0
4.0
7C
aref
ul�
.48
.27
�.0
9�
.14
.24
�.1
6�
.22
Rul
eor
ient
ed�
.45
.40
�.1
3�
.02
.14
�.1
6�
.18
Sta
bilit
y�
.09
.75
.08
�.1
1.0
1�
.01
.06
Pre
dict
abilit
y�
.39
.55
.04
�.1
0.0
3�
.06
�.0
3S
ecur
ity�
.23
.63
.09
�.0
6�
.25
�.1
2�
.17
No
rule
s.1
8�
.41
.09
�.2
0�
.11
�.0
3.3
2R
espe
ctfo
rin
divi
dual
�.0
5.0
6.7
5�
.04
�.1
2.0
0�
.14
Fairn
ess
.01
.06
.68
�.0
3�
.03
.07
�.1
0To
lera
nce
�.1
304
.49
�.2
8�
.06
.02
.11
Ach
ieve
men
tor
ient
ed.0
1�
.08
�.0
7.7
3�
.04
.00
�.0
3A
ctio
nor
ient
ed.1
4.0
4�
.05
.49
.11
.05
.34
Hig
hex
pect
atio
ns.0
2�
.33
�.1
5.4
1.0
5�
.01
.03
Res
ults
orie
nted
�.0
2�
.06
�.0
4.7
1.0
0.0
2.1
0P
reci
se�
.08
.03
�.0
6�
.05
.74
�.1
9�
.01
Atte
ntio
nto
deta
il�
.16
.02
�.O
6.0
0.7
0�
.07
.00
Ana
lytic
al�
.04
�.1
3�
.10
�.0
2.5
5.0
6�
.01
Team
orie
nted
.14
�.0
6.0
3�
.02
�.0
7.6
9.1
2C
olla
bora
tion
.00
�.2
2�
.03
�.0
1�
.15
.58
�.0
6P
eopl
eor
ient
ed.1
0.0
3.3
3�
.05
�.1
7.4
8�
.11
Agg
ress
ive
.13
�.1
7�
.24
.22
�.0
2�
.24
.42
Com
petit
ive
�.0
4�
.25
�.1
9.1
4�
.06
�.0
2.4
9S
ocia
llyre
spon
sibl
e�
.13
�.0
3.1
2�
.08
�.0
5�
.22
�.6
3E
igen
valu
es6.
754.
142.
202.
121.
841.
691.
54P
ropo
rtio
nof
varia
nce
acco
unte
dfo
r.1
3.0
8.0
4.0
4.0
3.0
3.0
3
a The
data
rep
rese
nt82
6ac
coun
tant
sin
seve
nfir
ms.
Bol
dfac
est
atis
tics
repr
esen
tlo
adin
gsgr
eate
rth
an.4
0on
that
fact
or.
O’Reilly et al. � people and organizational culture 61

Table
5:
Res
ults
ofR
egre
ssio
nA
naly
sisa
Nor
mat
ive
Inst
rum
enta
lJo
bIn
tent
toV
aria
bles
com
mitm
ent
com
mitm
ent
satis
fact
ion
leav
e
Per
son-
orga
niza
tion
fit.2
8**
�.0
7.3
6**
.36*
*A
ge�
.11
�.0
6�
.05
�.0
4G
ende
r�
.04
�.1
1�
.01
.12
Tenu
re.0
1.0
6.0
8.0
1A
djus
ted
R2
.06
.10
.12
F2.
62*
ns4.
31**
5.04
**
a Ent
ries
repr
esen
tst
anda
rdiz
edre
gres
sion
coef
ficie
nts.
*p�.
05**
p�.0
1.
Table
4:
Mea
ns,
Sta
ndar
dD
evia
tions
,an
dC
orre
latio
ns
Var
iabl
esM
eans
s.d.
12
34
56
78
1.P
erso
n-or
gani
zatio
nfit
0.23
0.19
2.A
ge23
.32
3.45
.14
3.G
ende
r1.
530.
50�
.08
�.1
04.
Tenu
resa
19.0
027
.00
.12
.04
�.0
15.
Nor
mat
ive
com
mitm
ent
0.00
1.00
.25*
*�
.08
.01
�.0
26.
Inst
rum
enta
lcom
mitm
ent
0.00
1.00
.15
�.0
3.0
1.0
2.0
07.
Job
satis
fact
ion
5.10
1.31
.35*
*.0
3�
.01
.09
.39*
*.6
2**
8.In
tent
tole
aveb
0.00
1.00
�.3
7**
�.1
1.1
2.0
0�
.34*
*�
.53*
*�
.75*
*9.
Turn
over
1.27
0.45
�.1
6*.1
3�
.06
.05
�.1
6*.1
0�
.30*
*.2
4**
a Ten
ure
was
mea
sure
din
days
.bTh
isva
riabl
eha
da
valu
eof
1fo
rin
tent
tost
ayan
d2
for
inte
ntto
leav
e.*p
�.05
.**
p�.0
1.
62 volume ii

Table 6: Results of Survival Analysis
Model 1 Model 2IndependentVariables Parameter estimatesaa s.e. Parameter estimatesa s.e.
Person-organization fit .64* .29Age �.02 .01 �.02 .01Gender .05 .10 .05 .10Scale parameter .34 .34Logarithmic likelihood �97.70 �93.36
aEstimates are unstandardized.*p�.05 for the chi-square value.
relationship between person-organization fit and st lying is nonlinear, anindividual with a perfect fit score would be predicted to stay approximately twiceas long as would be predicted using the base model alone. Similarly, anindividual with a very high negative fit score would be predicted to stay abouthalf as long as would be predicted with the base model.2
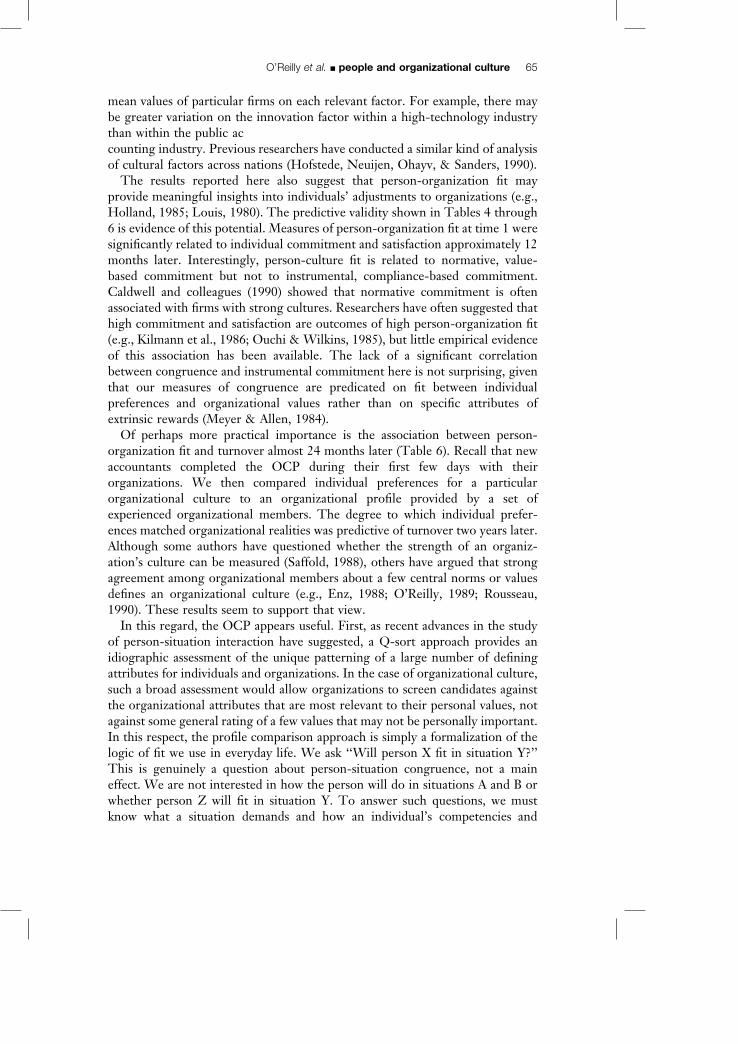
Figure 1 is a graph of the survival curve of the effects of person-organizationfit on the likelihood of staying with an organization. We estimated the survivorfunction using Kaplan and Meier’s nonparametric approach, as recommendedby Tuma and Hannan (1984). Because it makes no assumptions about thefunctional form of the curve, the Kaplan and Meier estimator is one of the mostcommon methods for assessing relationships when data are right-censored. Eachof the descending legs indicates one or more instances of leaving. We dividedthe data into quartiles based on person-organization fit scores; Figure 1 showsthe survival curves of the top and bottom quartiles. As shown, the curve forindividuals with low person-organization fit scores has a steeper descent than thecurve for high scorers — that is, low scorers are more likely to leave anorganization than high scorers. Taken together, the data shown in Table 6 andFigure 1 offer compelling evidence for the positive effect of person-organizationfit on an individual’s staying with an organization.Although it is not reported in detail, in addition to the measurement of
person-organization fit, we obtained an assessment of person-job fit. FolIowingthe approach of Caldwell and O’Reilly (1990), we conducted a job analysis forthe position held by all the entry-level accountants (group 1). We obtained aprofile consisting of 60 competencies using six subject-matter experts from eachof the eight firms. The reliability of this job profile across raters and withinfirms, assessed using a variation of the Spearman-Brown general prophecyformula, was quite high (.97). Entering accountants also provided a self-assessment using the same 60 competencies, and a person-job fit score wascomputed (average r�.27, s.d.�14). We then included this score in the analysesshown in Table 5 and as a control variable in the survival analysis. Althoughperson-job fit did have some independent effects on job satisfaction and intentto leave, it had no impact on the person-culture fit relationships reported. Thesimple con elation between person-job and person-organization fit was .16 (n.s.).
O’Reilly et al. � people and organizational culture 63
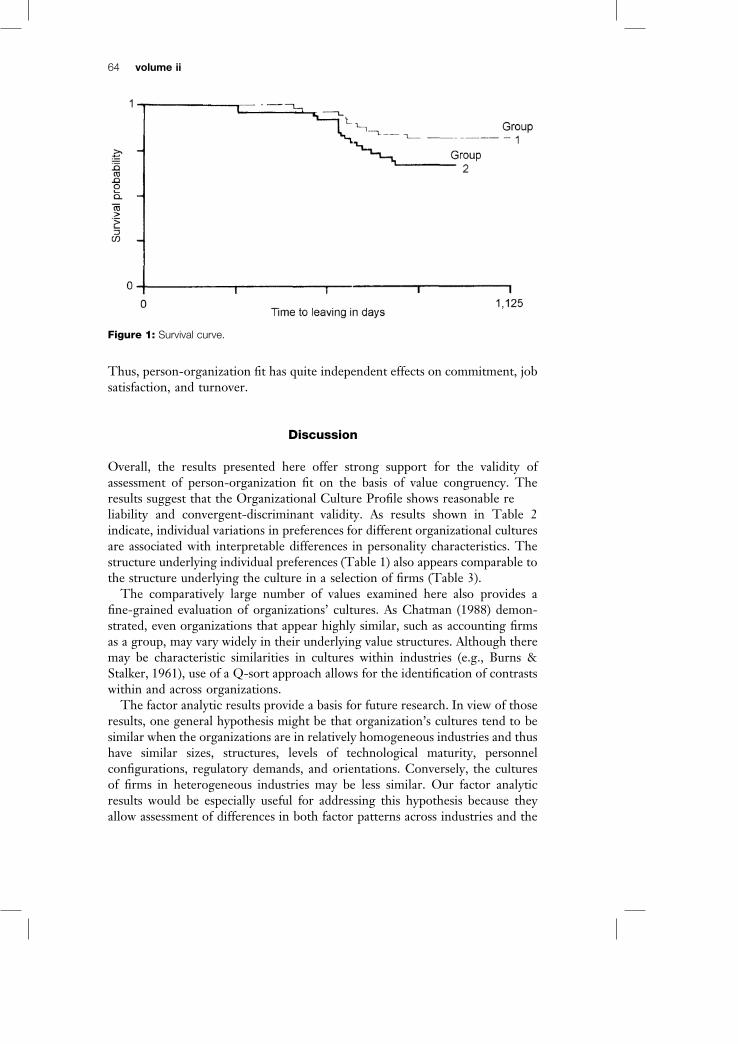
Figure 1: Survival curve.
Thus, person-organization fit has quite independent effects on commitment, jobsatisfaction, and turnover.
Discussion
Overall, the results presented here offer strong support for the validity ofassessment of person-organization fit on the basis of value congruency. Theresults suggest that the Organizational Culture Profile shows reasonable reliability and convergent-discriminant validity. As results shown in Table 2indicate, individual variations in preferences for different organizational culturesare associated with interpretable differences in personality characteristics. Thestructure underlying individual preferences (Table 1) also appears comparable tothe structure underlying the culture in a selection of firms (Table 3).The comparatively large number of values examined here also provides a
fine-grained evaluation of organizations’ cultures. As Chatman (1988) demon-strated, even organizations that appear highly similar, such as accounting firmsas a group, may vary widely in their underlying value structures. Although theremay be characteristic similarities in cultures within industries (e.g., Burns &Stalker, 1961), use of a Q-sort approach allows for the identification of contrastswithin and across organizations.The factor analytic results provide a basis for future research. In view of those
results, one general hypothesis might be that organization’s cultures tend to besimilar when the organizations are in relatively homogeneous industries and thushave similar sizes, structures, levels of technological maturity, personnelconfigurations, regulatory demands, and orientations. Conversely, the culturesof firms in heterogeneous industries may be less similar. Our factor analyticresults would be especially useful for addressing this hypothesis because theyallow assessment of differences in both factor patterns across industries and the
64 volume ii
mean values of particular firms on each relevant factor. For example, there maybe greater variation on the innovation factor within a high-technology industrythan within the public accounting industry. Previous researchers have conducted a similar kind of analysisof cultural factors across nations (Hofstede, Neuijen, Ohayv, & Sanders, 1990).The results reported here also suggest that person-organization fit may
provide meaningful insights into individuals’ adjustments to organizations (e.g.,Holland, 1985; Louis, 1980). The predictive validity shown in Tables 4 through6 is evidence of this potential. Measures of person-organization fit at time 1 weresignificantly related to individual commitment and satisfaction approximately 12months later. Interestingly, person-culture fit is related to normative, value-based commitment but not to instrumental, compliance-based commitment.Caldwell and colleagues (1990) showed that normative commitment is oftenassociated with firms with strong cultures. Researchers have often suggested thathigh commitment and satisfaction are outcomes of high person-organization fit(e.g., Kilmann et al., 1986; Ouchi & Wilkins, 1985), but little empirical evidenceof this association has been available. The lack of a significant correlationbetween congruence and instrumental commitment here is not surprising, giventhat our measures of congruence are predicated on fit between individualpreferences and organizational values rather than on specific attributes ofextrinsic rewards (Meyer & Allen, 1984).Of perhaps more practical importance is the association between person-
organization fit and turnover almost 24 months later (Table 6). Recall that newaccountants completed the OCP during their first few days with theirorganizations. We then compared individual preferences for a particularorganizational culture to an organizational profile provided by a set ofexperienced organizational members. The degree to which individual prefer-ences matched organizational realities was predictive of turnover two years later.Although some authors have questioned whether the strength of an organiz-ation’s culture can be measured (Saffold, 1988), others have argued that strongagreement among organizational members about a few central norms or valuesdefines an organizational culture (e.g., Enz, 1988; O’Reilly, 1989; Rousseau,1990). These results seem to support that view.In this regard, the OCP appears useful. First, as recent advances in the study
of person-situation interaction have suggested, a Q-sort approach provides anidiographic assessment of the unique patterning of a large number of definingattributes for individuals and organizations. In the case of organizational culture,such a broad assessment would allow organizations to screen candidates againstthe organizational attributes that are most relevant to their personal values, notagainst some general rating of a few values that may not be personally important.In this respect, the profile comparison approach is simply a formalization of thelogic of fit we use in everyday life. We ask ‘‘Will person X fit in situation Y?’’This is genuinely a question about person-situation congruence, not a maineffect. We are not interested in how the person will do in situations A and B orwhether person Z will fit in situation Y. To answer such questions, we mustknow what a situation demands and how an individual’s competencies and
O’Reilly et al. � people and organizational culture 65

preferences fit a specific situation. This is precisely the information the profilecomparison process yields. Most models of fit assess individual and environ-mental characteristics separately and then combine the two independentvariables to predict behavior and attitudes (e.g., Joyce, Slocum, & Von Glinow,1982); the profile comparison process, however, provides a direct evaluation ofthe simultaneous effects of person and situation. The process assesses therelative salience and configuration of characteristics within individuals and thenpermits a comparison across situations. By evaluating the individual andsituation on items that are relevant to both, the process is similar to what Wrightand Mischel (1987) referred to as the ‘‘competency demand hypothesis.’’ Thismethod also permits individuals to hold values that may, in a broad sense, beconflicting. Both Ashforth and Mael (1989) and Swidler (1986) noted that valueconflicts are common in organizations and are not measurable with morerestrictive approaches.In earlier studies, the idea of fit, although important, has remained elusive. As
Rynes and Gerhart (1990) pointed out, most discussions of fit have impliedsomething more than a simple match of an individual to a job’s requirementsand have frequently invoked notions of ‘‘chemistry’’ or finding the ‘‘right type’’of person. In a study of recruiting M.B.A. graduates, they showed thatfirm-specific characteristics had significant impacts on recruiters’ judgmentsbeyond general employability attributes such as grade point averages andprevious accomplishments. The results of the present study are consistent withthose findings and suggest the fit of firm-specific and individual values mayunderlie earlier discussions of chemistry. Controlling person-job fit did notaffect the results for person-culture fit as assessed here. Both are relevant. Foran individual to be satisfied and attached to an organization. the person mayneed both task competency and a value system congruent with the central valuesof the organization. As for the organizatien, it needs to select people who fit agiven situation, which is likely to include some combination of task and culturalrequirements. Failure to fit on either dimension may reduce employees’satisfaction and commitment and increase the likelihood of their leaving.The results of this study can contribute to future research in a number of
ways. First, as organizational researchers continue to debate the importance ofcongruence between individuals and situations, these results demonstrate that awidely used tool for assessing personality can be adapted to provide comparablemeasures of persons and situations. The development of such methods can allowfor research in a number of areas where fit to a job, occupation, or organizationis conceived as either an important causal or outcome variable. Second, andmore substantive, this research provides an empirically based definition of thepattern of values that define organizational culture. Although further validationof this approach to culture is necessary, the relatively consistent patterns of theindividual preferences for values and the observation of those values inorganizations suggests that the pattern defining organizational culture isrelatively robust. Third, and perhaps of greatest importance, these resultsdemonstrate that the fit between an individual’s preference for a particularculture and the culture of the organization the person joins is related to
66 volume ii

commitment, satisfaction, and turnover. This study and others like it can helpclarify both the nature of organizational culture and the impact of cultures onindividuals.
Notes
1. Q-methodology (Stephenson, 1953) is a well-established assessment technique In a typicalQ-sort procedure, the individual is presented with a large number of statements orcharacteristics and asked to sort the items into categories (normally nine) according to somecriterion (usually the extent to which the item is characteristic of the individual). Constraintsare typically imposed to force respondents to place fewer items in the extreme categories andmore items in the middle categories.2. For any respondent in this group, the predicted time of staying can be calculated by
multiplying the exponential of the coefficient for person-organization fit (164 in this group) byeach respondent’s person-organization fit score Thus, for a person who has a fit score of 1.0,the calculation would be e(.64�1)� 1.89. Conversely, for a person with the lowest possibleperson-organization fit score (�1), the calculation would be e(.64��1)�.53. The interpretationis that with a perfect score on person-organization fit, an individual is likely to stay twice aslong as we would have predicted without having information about their score. Conversely, aperson with the lowest possible person-organization fit score will stay approximately half thetime we would have predicted without knowing their score.
References
Albert, S., & Whetten, D. 1985 Organizational identity. In L. L. Cummings & B. M. Staw(Eds.), Research in organizational behavior, vol. 7, 263–295. Greenwich, CT: JAI Press.
Ashforth, B., & Mael, F 1989 Social identity theory and the organization. Academy ofManagement Review, 14, 20–39.
Barley, S. 1983. Semiotics and the study of occupational and organizational cultures.Administrative Science Quarterly, 28, 393–413.
Barley, S., Meyer, G., & Gash, D. 1988. Cultures of culture. Academics, practitioners, and thepragmatics of normative control. Administrative Science Quarterly, 33, 24–60.
Bem, D., & Allen, A. 1974. On predicting some of the people some of the time. The searchfor cross-situational consistencies in behavior. Psychological Review, 81, 506–520.
Bem, D., & Funder, D. 1978. Predicting more of the people more of the time. Assessing thepersonality of situations. Psychological Review, 85, 485–501.
Block, J. 1978. The Q-sort method in personality assessment and psychiatric research. Palo Alto, CA:Consulting Psychologists Press.
Block, J., Block, J., & Morrison, A. 1981. Parental agreement-disagreement on child rearingorientations and gender-related personality correlates in children. Child Development, 52,965–974.
Brewer, M. B. 1979. In-group bias in the minimal intergroup situation. A cognitive-motivational analysis. Psychological Bulletin, 86, 393–400.
Brief, A., & Roberson, L. 1989. Job attitude organization: An exploratory study. Journal ofApplied Social Psychology, 19, 717–727.
Burns, T., & Stalker, G. 1961. The management of innovation. London: Tavistock Publications.Caldwell, D., & O’Reilly, C 1990. Measuring person-job fit using a profile comparison process.
Journal of Applied Psychology, 75, 648–657.Caldwell, D., Chatman, J., & O’Reilly, C. 1990. Building organizational commitment. A
multi-firm study Journal of Occupational Psychology, 63, 245–261.
O’Reilly et al. � people and organizational culture 67

Chatman, J. 1988 Matching people and organizations: Selection and socialization in public accountingfirms. Unpublished doctoral dissertation, Walter A. Haas School of Business, University ofCalifornia, Berkeley.
Chatman, J. 1989 Improving interactional organizational research: A model of person-organization fit. Academy of Management Review, 14, 333–349.
Cooke, R., & Rousseau, D. 1988. Behavioral norms and expectations. A quantitative approachto the assessment of organizational culture. Group and Organizational Studies, 13, 245–273.
Davis, S. 1984. Managing corporate culture. Cambridge, MA: Ballinger.Davis-Blake, A., & Pfeffer, J. 1989. Just a mirage. The earth for dispositional effects in
organizational research. Academy of Management Review, 14, 385–400.Deal, T., & Kennedy, A. 1982. Corporate cultures. Reading, MA: Addison-Wesley.Diener E., Larsen, R., & Emmons R. 1984 Person�situation interactions. Choice of situations
and congruence response models. Journal of Personality and Social Psychology, 47, 580–592.Downey, H., Hellriegel, D., & Slocum, J. 1975. Congruence between individual needs,
organizational climate, job satisfaction and performance. Academy of Management Journal,18, 141–154.
Enz, C. 1988. The role of value congruity in intraorganizational power. Administrative ScienceQuarterly, 33, 284–304.
Fichman, M. 1988. Motivational consequences of absence and attendance. Proportional hazardestimation of a dynamic motivation model. Journal of Applied Psychology, 73, 119–134
Geertz, C 1973 The interpretation of cultures. New York: Basic Books.Gough, H., & Heilbrun, A. 1980. The Adjective Check List manual. Palo Alto, CA: Consulting
Psychologists Press.Gouldner, A. 1954 Patterns of industrial bureaucracy. New York, Free Press.Graham, W. 1976. Commensurate characterization of persons, groups, and organizations.
Development of the Trait Ascription Questionnaire (TAQ). Human Relations, 29, 607–622.Hackman, J. R., & Oldharn, C. 1980. Work redesign. Reading, MA. Addison-Wesley.Harrison, J., & Carroll, G. 1991. Keeping the faith. A model of cultural transmission in formal
organizations. Administrative Science Quarterly, 36, in press.Hofstede, G., Neuijen, B., Ohayv, D., & Sanders, G. 1990. Measuring organizational cultures.
A qualitative and quantitative study across twenty cases. Administrative Science Quarterly, 35,286–316.
Holland, J. L. 1985. Making vocational choices (2d ed). Englewood Cliffs, NJ: Prentice-HallJoyce, W., & Slocum, J. 1984. Collective climate. Agreement as a basis for defining aggregate
climates in organizations. Academy of Management Journal, 27, 721–742.Joyce, W., Slocum, J., & Von Glinow, M. 1982. Person-situation interaction. Competing
models of fit. Journal of Occupational Behavior, 3, 265–280.Kalbfleisch, J., & Prentice, R. 1980. The statistical analysis of failure time data.New York: Wiley.Kenrick, D., & Funder, D. 1988. Profiting from controversy. Lessons from the person-situation
debate. American Psychologist, 43, 23–35.Keon, T., Latack, J., & Wanous, J. 1982. Image congruence and the treatment of difference
scores in organizational choice research. Human Relations, 35, 155–165.Kilmann, R. 1984. Beyond the quick fix. San Francisco: Jossey-Hass.Kilmann, R., Saxton, M., & Serpa, R. 1986. Gaining control of the corporate culture. San Francisco:
Jossey-Bass.Kunin, T. 1955. The construction of a new type of attitude measure. Personnel Psychology, 8,
65–78.Lamiell, J. 1981. Toward an idiothetic psychology of personality. American Psychologist 36,
276–289.Lofquist, L., & Dams, R. 1969. Adjustment to work. New York: Appleton-Century-Crofts.Louis, M. 1980. Surprise and sense making What newcomers experience in entering unfamiliar
organizational settings. Administrative Science Quarterly, 25, 226–251.Louis, M. 1983. Organizations as culture-bearing milieux. In L. Pondy, P. Frost, G. Morgan,
& T. Dandridge (Eds.), Organizational symbolism: 186–218. Greenwich, CT JAI: Press.
68 volume ii

Luthans, F., & Davis, T. 1982. An idiographic approach to organizational behavior research.The use of single case experimental designs and direct measures. Academy of ManagementReview, 7, 380–391.
Martin, J., & Siehl, C. 1983. Organizational culture and counterculture. An uneasy symbiosis.Organizational Dynamics, 12(1), 52–64.
Meir, E., & Hasson, R. 1982. Congruence between personality type and environment type asa predictor of stay in an environment. Journal of Vocational Behavior, 21, 309–317.
Meyer, J. P., & Allen, N. J. 1984. Testing the ‘‘side-bet’’ theory of organizational commitment.Some methodological considerations. Journal of Applied Psychology, 69, 372–378.
Moreland, R. 1985. Social categorization and the assimilation of ‘‘new’’ group members.Journal of Personality and Social Psychology, 48, 1173–1190.
Morita, J., Lee, T., & Mowday, R. 1989. Introducing survival analysis to organizationalresearchers. A selected application to turnover research. Journal of Applied Psychology, 74,280–292.
Mount, M., & Muchinsky, P. 1978. Person-environment congruence and employee jobsatisfaction. A test of Holland’s theory. Journal of Vocational Behavior, 13, 84–100.
Nadler, D., & Tushman, M. 1980. A model for diagnosing organizational behavior. Applyinga congruence perspective. Organizational Dynamics, 9(3), 35–51.
Nunnally, J. C. 1978. Pychometric theory. New York: McGraw-Hill.O’Reilly, C. A., III. 1977. Personality-job fit. Implications for individual attitudes and
performance. Organizational Behavior and Human Performance, 18, 36–46.O’Reilly, C. A., III. 1989. Corporations, culture, and commitment. Motivation and social
control in organizations. California Management Review, 31(4), 9–25.O’Reilly, C. A., III, Caldwell, D., & Mirabile, R. 1990. More than a mirage: Disposition-situation
interaction as explanations of work behavior. Working paper, Walter A. Haas School ofBusiness, University of California, Berkeley.
O’Reilly, C. A., III, & Chatman, J. 1986. Organizational commitment and psychologicalattachment. The effects of compliance, identification, and internalization of prosocialbehavior. Journal of Applied Psychology, 71, 492–499.
Ouchi, W. 1981. Theory Z. Reading, MA: Addison-Wesley.Ouchi, W., & Wilkins, A. 1985. Organizational culture. In R. Turner (Ed.), Annual review of
sociology, vol. 11, 457–483. Palo Alto, CA: Annual Reviews.Parsons, T. 1951. The social system. New York: Free Press.Pervin, L, 1968. Performance and satisfaction as a function of individual-environment fit.
Psychological Bulletin, 69, 56–68.Peters, L., & Sheridan, J. 1988. Turnover research methodology. A critique of traditional
designs and a suggested survival model alternative. In K. Rowland & G. Ferris (Eds.),Research in personnel and human resources management, vol. 6, 231–262. Greenwich, CT: JAIPress.
Peters, T., & Waterman, R. 1982. In search of excellence. New York: Harper & Row.Rokeach, M. 1973 The nature of human values. New York: Free Press.Rousseau, D. 1990. Quantitative assessment of organizational culture. The case for multiple
measures. In B. Schneider (Ed.), Frontiers in industrial and organizational psychology, vol. 3,153–192. San Francisco: Jossey-Bass.
Rynes, S., & Gerhart, B. 1990. Interviewer assessments of applicant ‘‘fit’’. An exploratoryinvestigation. Personnel Psychology, 43, 13–34.
Saffold, G 1988 Culture traits, strength, and organizational performance. Moving beyond‘‘strong’’ culture. Academy of Management Review, 13, 546–558.
Sampson, E. 1978. Personality and the location of identity. Journal of Personality, 46, 552–568.Schein, E. 1985 Organizational culture and leadership. San Francisco: Jossey-Bass.Schneider, B. 1987. The people make the place. Personnel Psychology, 40, 437–453.Selznick, P. 1949. TVA and the grass roots. Los Angeles: University of California Press.Smircich, L. 1983. Concepts of culture and organizational analysis. Administrative Science
Quarterly, 28, 339–351.
O’Reilly et al. � people and organizational culture 69

Spokane, A. 1985. A review of research on person-environment congruence in Holland’s theoryof careers. Journal of Vocational Behavior, 26, 306–343.
Springfield, A. 1988 An Aristotelian resolution of the idiographic versus nomothetic tension.American Psychologist, 43, 425–430.
Stephenson, W. 1953. The study of behavior: Q-technique and its methodology. Chicago: Universityof Chicago Press.
Stryker, E., & Serpe, R. 1982. Commitment, identity salience, and role behavior. Theory andresearch example, In W. Ickes & E. Knowles (Eds.), Personality, roles, and social behavior:119–218. New Yolk: Springer-Verlag.
Super D. 1957. The psychology of careers. New York Harper & Row.Swidler, A. 1986. Culture in action. Symbols and strategies. American Sociological Review, 51,
273–286.Terborg, J. 1981. Interactional psychology and research on human behavior in organizations.
Academy of Management Review, 6, 569–576.Tom, V. 1971. The role of personality and organizational images in the recruiting process.
Organizational Behavior and Human Performance, 6, 573–592.Trice, H., & Beyer, J. 1984. Studying organizational cultures through rites and ceremonials.
Academy of Management Review, 9, 653–669.Tsui, A., & O’Reilly, C. A., III. 1989. Beyond simple demographic effects. The importance of
relational demography in superior-subordinate dyads. Academy of Management Journal, 12,402–423.
Tuma, N., & Hannan, M. 1984. Social dynamics: Models and methods. Orlando, FL: AcademicPress.
Wanous, J. P. 1977. Organizational entry. Newcomers moving from outside to inside.Psychological Bulletin, 87, 601–618.
Weiner, Y. 1988. Forms of value systems. A focus on organizational effectiveness and culturalchange and maintenance. Academy of Management Review, 13, 534–545.
Weiss, H., & Adler, S. 1984. Personality and organizational behavior. In B. M. Staw & L. L.Cummings (Eds.), Research in organizational behavior, vol. 4, 1–50. Greenwich, CT: JAIPress.
Wilkins, A., & Ouchi, W. 1983. Efficient cultures. Exploring the relationship between cultureand organizationaI performance. Administrative Science Quarterly, 28, 468–481.
Wright, J., & Mischel, W. 1987. A conditional approach to dispositional constructs. The localpredictability of social behavior. journal of Personality and Social Psychology, 53, 1159–1177.
Appendix
Organizational Culture Profile Item Set
1. Flexibility2. Adaptability3. Stability4. Predictability5. Being innovative6. Being quick to take advantage of6. opportunities7. A willingness to experiment8. Risk taking9. Being careful
10. Autonomy
11. Being rule oriented12. Being analytical13. Paying attention to detail14. Being precise15. Being team oriented16. Sharing information freely17. Emphasizing a single culture throughout6. the organization
18. Being people oriented19. Fairness20. Respect for the individual’s right
70 volume ii

21. Tolerance22. Informality23. Being easy going24. Being calm25. Being supportive26. Being aggressive27. Decisiveness28. Action orientation29. Taking initiative30. Being reflective31. Achievement orientation32. Being demanding33. Taking individual responsibility34. Having high expectations for performance35. Opportunities for professional growth36. high pay for good performance37. Security of employment
38. Offers praise for good performance39. Low level of conflict40. Confronting conflict directly41. Developing friends at work42. Fitting in43. Working in collaboration with others44. Enthusiasm for the job45. Working long hours46. Not being constrained by many rules47. An emphasis on quality48. Being distinctive-different from others49. Having a good reputation50. Being socially responsible51. Being results oriented52. Having a clear guiding philosophy53. Being competitive54. Being highly organized
O’Reilly et al. � people and organizational culture 71
View publication statsView publication stats