Embed Size (px)
Citation preview

Charcoal value chains in Kenya: A 20-year synthesis
Geoffrey Ndegwa, Phosiso Sola, Miyuki Iiyama, Irene Okeyo, Mary Njenga,Ignatius Siko, Jonathan Muriuki

Charcoal value chains in Kenya: a 20-year synthesis
Geoffrey Ndegwa, Phosiso Sola, Miyuki Iiyama, Irene Okeyo, Mary Njenga, Ignatius Siko, Jonathan Muriuki

ii
LIMITED CIRCULATION
Correct citation: Ndegwa G, Sola, P., Iiyama M, Okeyo I, Njenga M, Siko I., Muriuki, J.2020. Charcoal value chains in Kenya: a 20-year synthesis. Working Paper number 307. World Agroforestry, Nairobi, Kenya. DOI http://dx.doi.org/10.5716/WP20026.PDF
The titles of the Working Paper Series are intended to disseminate provisional results of
agroforestry research and practices and to stimulate feedback from the scientific community.
Other World Agroforestry publication series include Technical Manuals, Occasional Papers and
the Trees for Change Series.
Published by World Agroforestry (ICRAF)
PO Box 30677, GPO 00100
Nairobi, Kenya
Tel: +254(0)20 7224000, via USA +1 650 833 6645
Fax: +254(0)20 7224001, via USA +1 650 833 6646
Email: [email protected]
Website: www.worldagroforestry.org
© World Agroforestry 2020
Working Paper No. 307
Front cover photo: Charcoal retail in Nairobi. By Miyuki Iiyama
The views expressed in this publication are those of the authors and not necessarily those of
World Agroforestry.
Articles appearing in this publication may be quoted or reproduced without charge, provided the
source is acknowledged.
All images remain the sole property of their source and may not be used for any purpose without
written permission of the source.

iii
About the Authors
Geoffrey Ndegwa is an independent consultant who specializes in the field of renewable energy,
environment and natural resource management. He is currently engaged by the Norwegian
Capacity (NORCAP) as an Energy and Environment expert to support UN organizations in
sustainable energy programming in displacement settings. He has over 10 years of experience
working/consulting, teaching and conducting research in the fields of renewable energy, forestry,
environment, climate change and natural resource management. He holds a PhD in Geography,
focusing on Environment and Natural Resource Management from the University of Passau in
Germany. Email: [email protected]
Phosiso Sola* is a scientist at World Agroforestry (ICRAF) working on natural resource governance,
bioenergy and development of sustainable agroforestry value chains. She has over 25 years’ work
experience, most of which has been in action research and development projects on natural
resource management, commercialization of forest and agroforestry products, agro-market
linkages and value chain development. Her current work focuses on governance of woodfuel and
aims to contribute to the development of sustainable charcoal value chains in Africa’s drylands.
She obtained her PhD from the University of Wales, Bangor. Her studies focused on the impacts of
commercialization of non-timber forest products. Email: [email protected]
Miyuki Iiyama holds a PhD in Economics from the University of Tokyo. She has extensive
experience in quantitative and qualitative analysis of integrated farming system evolutions,
technological adoption and sustainable livelihoods in rural Africa. She has spent almost 20 years in
East and Southern Africa conducting research on the evaluation of socio-economic and
environmental viability of sustainable agricultural intensification within smallholder systems. She
is currently the Research Strategy Director at the Japan International Research Centre for
Agricultural Sciences (JIRCAS).
Irene Okeyo is a second year PhD student at the University of Queensland, Australia. She is
involved in investigating water quality and phytoplankton dynamics in a subtropical marine bay
along the Australian coast. She holds a Bachelor’s and Master’s degree in Environmental Studies
and Climate Change from Kenyatta University, Kenya. Irene previously worked with ICRAF as a
junior scientist. Her past research areas include environmental impact assessments; soil and
water conservation technologies; and integration of legumes in smallholder farming systems.
Email: [email protected]
Mary Njenga is a bioenergy research scientist at ICRAF and a visiting lecturer at the Wangari
Maathai Institute for Peace and Environmental Studies, University of Nairobi. Her research
focuses on sustainable and efficient biomass energy production and use systems, and their link to
the environment including climate change, livelihoods and rural-urban linkages. She holds a PhD
* Corresponding author
iv
from the University of Nairobi. Her area of speciality includes recovering bioenergy from organic
residues and its implications on the environment. She has over 20 years of experience in research
and development on dryland natural resource management, sustainable biomass for energy and
biochar, circular bioeconomy for bioenergy and climate impact assessments. She has produced
over 100 publications including journal papers, books and book chapters, policy and technical
briefs. Email: [email protected]
Ignatius Siko is a research fellow at ICRAF, currently working on supporting woodfuel research
focusing on governance of woodfuel value chains in Kenya. He holds an MA in Environmental
Policy from the University of Nairobi. His areas of interest range from environmental planning,
policy formulation and analysis, renewable energy access and sustainability, natural resource
use/management and sustainable development. Email: [email protected]
Jonathan Muriuki is the Kenya country representative and an associate scientist at ICRAF,
specializing in agroforestry systems and enhancing tree establishment practices on farms. His
current activities involve support to development partners in land restoration projects focusing
on natural regeneration of trees and associated practices. He has over 15 years’ experience in
research and development projects that span several countries in the East and Southern Africa
region. He obtained his PhD from the University of Natural Resources and Applied Life Sciences
(BoKU), in Vienna, Austria. Email: [email protected]

v
Abstract
Biomass fuels remain a very important energy source for millions of Kenyans, consistently
meeting close to 70% of domestic energy requirements over the decades. The charcoal sub-sector
is one of the most important sources of employment and is reported to be a major source of
livelihood for about 0.64 million people, with a market value worth billion. Woodfuel, especially in
the form of charcoal, is produced in rural areas and consumed in peri-urban and urban areas,
moving through connections between numerous actors, thus forming value chains and networks.
The aim of this study was to conduct a literature review to investigate, document and map these
value chains from production to consumption in order to assess overall economic significance of
charcoal and identify opportunities and priority interventions for developing sustainable charcoal
value chains. The value chain analysis approach was used to determine the flow of woodfuel and
ascertain distribution of income and profit within and among groups of actors along the value
chain.
The literature review established that the main value chain actors in Kenya comprise wood
producers, charcoal producers, transporters, wholesalers, retailers and consumers. In some cases,
the actors are supported by agents and brokers who facilitate linkages and transactions along
various stages of the value chain. For many of the charcoal-producing households, income from
sale of charcoal accounted for over 50% of the total household income. Monthly income of
transporters was estimated to have increased more than 1,100 times between 2000 and 2013,
with bribes paid at checkpoints accounting for 20-30% of the final retail price. Net profits of
retailers were estimated to be 14%. The charcoal value chain is dominated by men, except in
retailing where women accounted for 57% of the actors. In addition, charcoal value chains do
have negative environmental and health impacts which can be mitigated by adoption of
appropriate production and consumption technologies.
The review shows that, charcoal value chains remain an important energy, livelihood and income
source for many in Kenya but is increasingly associated with negative environment and health
outcomes. However, in the short- to medium-term there is need to increase investments in the
sub-sector and develop sustainable and competitive woodfuel value chains.
Keywords
Woodfuel, value chain, charcoal, biomass energy, gender, Kenya, greenhouse gases

vi
Table of Contents
About the Authors ............................................................................................................................ iii
Abstract .............................................................................................................................................. v
List of Tables .................................................................................................................................... vii
List of Figures ................................................................................................................................... vii
List of Acronyms .............................................................................................................................. viii
1. Introduction ................................................................................................................................... 1
1.1 Woodfuel supply and demand dynamic .................................................................................. 1
1.2 Woodfuel consumption in Kenya ............................................................................................ 2
2. Methodology .................................................................................................................................. 5
2.1 The value chain approach ........................................................................................................ 5
2.2 Literature search and synthesis ............................................................................................... 5
3. Charcoal Value Chain Actors .......................................................................................................... 7
3.1 Overview of the charcoal sub-sector ....................................................................................... 7
3.2 Wood producers ...................................................................................................................... 8
3.3 Charcoal producers .................................................................................................................. 8
3.4 Charcoal transporters ............................................................................................................ 10
3.5 Wholesalers and retailers ...................................................................................................... 11
3.6 Consumers ............................................................................................................................. 11
4. Elements and Economics of the Charcoal Value Chain in Kenya ................................................. 12
4.1 Tree management and sourcing ............................................................................................ 12
4.2 Charcoal production, technology and associated costs ......................................................... 14
4.2.1 Charcoal production hotspots ........................................................................................ 14
4.2.2 Charcoal production ....................................................................................................... 17
4.2.3 Charcoal production technology .................................................................................... 18
4.2.4 Charcoal producers’ income ........................................................................................... 18
4.3 Charcoal transportation ......................................................................................................... 19
4.3.1 Charcoal movement licensing ........................................................................................ 20
4.3.2 Income from charcoal transportation ............................................................................ 21
4.4 Charcoal wholesaling ............................................................................................................. 22
4.5 Retailing ................................................................................................................................. 23
4.6 Charcoal consumption ........................................................................................................... 24
4.6.1 Household charcoal consumption and budget ............................................................... 25
4.6.2 Access to alternative energy sources ............................................................................. 26
5. Charcoal-Related Sustainability Issues ......................................................................................... 28
5.1 Deforestation and forest degradation ................................................................................... 28
5.2 Climate change, GHG emissions and health outcomes ......................................................... 30
6. Gender Aspects in the Woodfuel Sector ...................................................................................... 33
7. Conclusion and Recommendations .............................................................................................. 35
8. References ................................................................................................................................... 38
Appendix 1: Search terms used during the scoping study ........................................................... 48

vii
List of tables
Table 1.1: Primary sources of domestic energy in Kenya in 2017 ...................................................... 3
Table 1.2: Household energy mix in Kenya in 1999 ........................................................................... 3
Table 2.1: Data/information analysis and synthesis .......................................................................... 6
Table 4.1: Cost of wood for charcoal in USD between 2000 and 2013 ............................................ 12
Table 4.2: Cost of fuelwood in USD from different counties in Kenya ............................................. 13
Table 4.3: Main charcoal-producing zones in Kenya covered in literature ...................................... 16
Table 4.4: Charcoal transporter costs and profit ............................................................................. 22
Table 4.5: Charcoal vendors expenses and profit share in a charcoal bag ...................................... 23
Table 4.6: Households energy expenditure based on income quartiles .......................................... 26
List of figures
Figure 2.1: The generic elements of a charcoal value chain.. ............................................................ 5
Figure 4.1: Different stages in preparation of the earth mound kiln: .............................................. 18
Figure 4.2: Charcoal producer price (USD) between 2000 and 2016 ............................................... 19

viii
List of Acronyms
AFF African Forest Forum
ALRI Acute Lower Respiratory Infection
ASAL Arid and Semi-Arid Land
CIFOR Centre for International Forestry Research
CPA Charcoal Producer Association
DFID Department for International Development
FAO Food and Agriculture Organization of the United Nations
FTA Forests, Trees and Agroforestry
GHG Greenhouse Gases
GLPGP The Global LPG Partnership
GoK Government of Kenya
GVEP Global Village Energy Partnership
GWP Global Warming Potential
HH Household
ICRAF World Agroforestry
ICS Improved Cook Stove
IEA International Energy Agency
KARI Kenya Agricultural Research Institute
KCCTA Kitui County Charcoal Transporters Association
KCJ Kenya Ceramic Jiko
KES Kenya Shilling
KFS Kenya Forest Service
KIPPRA Kenya Institute for Public Policy Research & Analysis
KNBS Kenya National Bureau of Statistics
LPG Liquefied Petroleum Gas
MENR Ministry of Environment and Natural Resources
MJ Megajoule
MoE Ministry of Energy
MT Metric Tonnes
NDU National Defense University
NMHC Nonmethane hydrocarbons
PLC Private limited Company
PM Particulate Matter

ix
ppm parts per million
SEI Stockholm Environment Institute
UN United Nations
UN-DESA United Nations Department of Economic and Social Affairs
UNDP United Nations Development Program
UNEP United Nations Environment Program
USA United Sates of America
USD United States Dollar
WHO World Health Organization

1. Introduction
Biomass fuels are very important for millions in Kenya, meeting over 70% of domestic energy
requirements over the decades (Kendagor and Prevost 2013). With increased urbanization
coupled with rapid population growth, of the middle to lower income groups, the demand is
projected to grow in the coming decades. Charcoal is the most preferred form of energy in urban
areas. It is used by more than 82% of urban households compared to 34% in rural areas (MoE,
2002). In addition, the charcoal sub-sector is one of the most important sources of employment,
reported to be a major source of livelihood for as many as 66% of rural households in some areas
(Angelsen et al., 2014). For many of the charcoal-producing households, income from the trade
comprises over 50% of the total household income. In 2013, it was estimated that about 0.64
million people were formally or informally employed in the sub-sector and its market value was
estimated at USD 1.6 billion, having registered a growth of 25% and 150-321% growth in jobs and
market value respectively within a period of 13 years of (KFS, 2013).
1.1 Woodfuel supply and demand dynamic
In 2000, the total biomass fuel demand in Kenya was estimated at 34.3 million tonnes, of which
15.1 million was for firewood and 16.5 million for charcoal (IEA, 2015; Mugo and Gathui, 2010).
Recent findings indicate that Kenya had a potential wood supply of 31.4 million m3 compared to a
demand of 41.7 million m3, hence a deficit of 10.3 million m3 (MENR, 2013b). While firewood is
mostly collected freely within a radius of less than 5 km, most of the wood for charcoal (75-90%) is
harvested in woodlands and rangelands in the arid and semi-arid lands, that have low productivity
of between 2-4% per annum and poor regeneration of harvested trees (Iiyama et al., 2014a). Past
studies reported a looming wood fuel crisis in the country based on the three physical indicators of
diminishing supply (Nyang, 1999; GoK, 1997). These indicators were; i) a switch by households to
poorer quality substitutes, especially agricultural residues; ii) increase in distances and
consequently travel time to the source and iii) increase in amount of gathering time and effort
per unit amount of woodfuel.
The three indicators have been observed in high agricultural potential areas like Nyeri (Boulkaid,
2015; Mwangi, 2013), Meru and Embu (Mugo and Gathui, 2010), and Kakamega (Wambua, 2011)
as well as in marginal areas like Turkana, Mandera, (wa Gathui and Ngugi, 2010), Taita Taveta
(Zschauer, 2012) and Garissa counties (Bizarri, 2010). During times of physical scarcity, well-off
households substitute woodfuel with other modern fuels like LPG, while the poor are forced to

2
switch to low quality fuels like crop residues and plastics, or change cooking and dietary habits to
those that consume less fuel (wa Gathui and Ngugi, 2010; Wambua, 2011; GoK, 1997).
1.2 Woodfuel consumption in Kenya
Biomass energy accounts for 68% of the country’s energy needs followed by petroleum products
at 22%, electricity at 9% and other forms of energy like solar and LPG at 1% (IEA, 2015). Rural
households mainly use firewood while urban households prefer charcoal. By 2000, about 89% of
rural households were reported to use firewood for cooking compared to only 7% in urban areas
(MoE, 2002). In comparison, it was reported that 82% of the population in urban areas compared
to 34% in rural areas relied on charcoal for cooking (MoE, 2002). The per capita consumption of
firewood was estimated at 741 kg and 691 kg in rural and urban areas respectively, while that of
charcoal was estimated at 152 kg and 156 kg, respectively (Mutimba and Barasa, 2005).
In a study based on the 2009 Kenya Housing and Population Census, 92.9%, 4.8%, 1.4% and 0.9%
of rural households used firewood, charcoal, kerosene and LPG and other fuels respectively, as
either their primary or secondary source of cooking fuel (KNBS, 2010). In comparison, 71.3% of
peri-urban households used firewood, while 25.5% used charcoal. Moreover, 68.8%, 14.0%, 7.9%
and 5.0% of the urban population use charcoal, paraffin, firewood and LPG respectively, as either
a primary or secondary fuel. More recent statistics (Dalberg, 2018) based on the Kenya Integrated
Household Budget Survey (KNBS, 2018) indicate that by 2017, the proportion of the urban
population using firewood as their primary cooking fuel stood at 16.1%, and those using charcoal
and LPG was 21.9% and 27.6%, respectively (Table 1.1). In rural areas, the population using
firewood as the primary fuel stood at 84.3%, while those using charcoal and LPG stood at 8.9%
and 2.5%, respectively.
While 82% of the urban population relied on charcoal for cooking compared to 34% in the rural
areas (MoE, 2002). Studies by Kenya National Bureau of Statistics (KNBS) and Dalberg based on
the 2009 Kenya Housing and Population Census showed the same trends of energy type
consumption in 2005, 2009 and 2015 (Table 1.1; KNBS, 2007; KNBS 2009; KNBS, 2018; Dalberg,
2018). In 2004, Mutimba and Barasa (2005), estimated the per capita consumption of firewood to
be at 741kg and 691kg respectively in the rural and urban areas and that of charcoal at 152Kg and
156 kg respectively.
These statistics indicate that there is a huge disparity in the fuel-use data in the country which
Dalberg (2018) associates with use of multiple fuels at household level making it impossible to

3
place a household into one category. A clear indication though is the rapid growth of LPG and
declining use of firewood in provision of energy in the urban areas over the last decade.
Table 1.1: Primary sources of domestic energy in Kenya in 2005 and 2015
Fuel type 2005 (% population) 2009 (% population) 2015 (% population)
Overall Urban Rural Urban P-urban Rural Overall Urban Rural
Firewood 68.3 10.0 87.7 7.9 71.3 92.9 54.6 16.1 84.3
Charcoal 13.3 30.2 7.7 68.8 25.5 4.8 14.6 21.9 8.9
Kerosene 13.2 44.6 2.7 14.0 1.4 14.0 29.0 2.3
LPG 3.5 11.9 0.7 - - 13.4 27.6 2.5
Electricity 0.6 1.8 0.2 - - 1.0 2.0 0.3
Other fuels 1.1 1.5 1.0 5.0 0.9 2.4 3.4 1.7 Source: KNBS, 2007, 2010 and 2018 * (The 2010 study included LPG and electricity among other fuels while the two other studies had disaggregated the two; it also included the peri-urban area consumption of charcoal and firewood) Energy use in Kenya defies the Energy Ladder Theory where a household is expected to transition
from low quality energy sources like crop residues and firewood to higher quality sources like LPG
and electricity, with increase in disposable income (KIPPRA, 2010; UNEP, 2006). Instead, over half
of households in Kenya concurrently utilize several energy sources at a time (Table 1.1), a theory
referred to as energy stacking (Nyang, 1999; GLPGP, 2013; Dalberg, 2018). Households however
designate one source for majority of their cooking, which is referred to as the primary cooking
energy source while the other less used types are either secondary or tertiary (Wambua, 2011;
KIPPRA, 2010). Charcoal and LPG are used as secondary and tertiary fuels in many households
nationally, a situation that might distort the overall consumption statistics if they are only based
on primary fuels (Dalberg, 2018; Table 1.2).
Table 1.2: Household energy mix in Kenya in 1999
Stacking groups
Firewood Kerosene Charcoal Electricity % population
Rural areas 1. Firewood + kerosene 50.8
2. Firewood + kerosene + charcoal 38.8
Urban areas 3. Kerosene + charcoal 29.6
4. Kerosene + charcoal + electricity 24.4 Source: Nyang, 1999
Woodfuel, especially in the form of charcoal is produced in rural areas and consumed in peri-
urban and urban areas through connections between numerous actors forming the woodfuel
value chains and networks. Two decades ago, 17% of the urban population that used firewood
relied on purchased from the market while the rest collected it themselves from their own farms

4
or other public and private lands (GoK, 2004). A decade later, statistics indicate that the situation
had reversed with urban households relying mainly on market supply (GLPGP, 2013; Dalberg,
2018) except for 20% of firewood users who collect for themselves from open spaces (UN-DESA,
2004). In the rural areas, 67% of the households who use charcoal and 24% of those that use
firewood rely on the market while the rest collect for themselves. The households that collect
wood for free were predominantly poor households located in rural areas while the mid-high-
income households in both the high agricultural potential rural and urban areas mostly either
purchase woodfuel or rely on other cleaner fuels like LPG (GLPGP, 2013; Mwangi, 2013; Hosier,
1985).
Other major consumers of woodfuel in the country are the cottage industry and institutions
estimated to consume about 1.8 million tonnes of firewood and 0.43 tonnes of charcoal
(converted from 4.3 million tonnes of wood using earth mound kilns with 10% efficiency (Mugo
and Gathui, 2010)). This comprised about 12% of the firewood and 27% of the charcoal consumed
in the country that year (Mugo and Gathui, 2010; IEA, 2015). Within the cottage industry sector,
restaurants and food kiosks (especially eateries that serve roast meat) are the largest consumers,
accounting for over 91% of the demand – 1.28 tonnes comprised firewood, while 4.28 tonnes
comprised wood for charcoal. Thus, the woodfuel, especially in the form of charcoal, is produced
in rural areas and consumed in peri-urban and urban areas through connections between
numerous actors, forming the woodfuel value chains and networks.
In the last decade the government enacted forestry legislations and charcoal rules to support,
guide and control woodfuel value chains. The sub-sector provides livelihoods, affordable energy,
income and employment for many. However, this has ensured the viability of this energy sub-
sector and in early 2018, production and trade of charcoal was banned, under the logging
Moratorium and Charcoal Ban Gazette Notice of 20181.
The aim of this study was to conduct a literature review to investigate, map and document these
value chains from production to consumption in order to, i) assess overall economic significance
of charcoal, ii) identify and gauge trends of development and, iii) identify priority interventions for
developing sustainable charcoal value chains.
1 http://www.environment.go.ke/wp-content/uploads/2018/11/4048264.pdf; https://www.nation.co.ke/news/Tobiko-extends-
logging-ban/1056-5357104-x76lbcz/index.html

5
This study will inform development and engagement interventions within the CIFOR-led four-year
program on sustainable woodfuel value chains, a component of the EU-funded program
‘Governing Multifunctional Landscapes in Sub-Saharan Africa’
2. Methodology
2.1 The value chain approach
The value chain approach seeks to investigate activities implemented by all actors from
production to consumption, including linkage service providers (van den Berg et al., 2009). The
approach aims to understand the direction of the flow of economic goods and services among
different actors at different stages of engagement in the production, distribution/transportation,
trading and consumption (KFS, 2013; Ndegwa, 2010; Sepp, no date). According to Sepp (No date),
the charcoal value chain has six generic stages and categories of actors as shown in Figure 2.1.
Figure 2.1: The generic elements of a charcoal value chain. Source: Sepp, no date
Not every value chain features all these generic elements and the shorter the value chain, the
higher the likelihood of the key actors getting more benefits. Introduction of other agents into the
value chain leads to sharing of benefits among the actors, thus making the products more
expensive for the final consumer (Ndegwa 2010; Ndegwa et al., 2011). Once the key elements and
categories of actors are mapped out in the value chain framework, quantifiable data on income
and profit, prices and quantities of goods handled by the different actors, will be added as
documented in literature. Using this information, an economic analysis will be conducted to
ascertain distribution of income and profit within and among various groups along the value
chain.
2.2 Literature search and synthesis
The study is based on a literature review that was guided by five components i) study
characteristics which were used to screen for inclusion, ii) trade flows detailing trade routes,
Wood production
Harvesting/ charcoaling Consumption Transport Wholes
aling Retailing
Producer Charcoal maker Transporter Wholesaler Retailer Consumer

6
governance systems, actors, etc. iii) levels of demand and markets describing volume of trade,
prices, characteristics of consumers, iv) supply/supply zones covering hotspots, tree species used,
sources of trees, levels of production, etc. v) key sustainability issues like production systems and
technologies, environmental and health outcomes, and gender issues regarding tree ownership
and access, roles of men and women in the value chain.
The systematic search was conducted using Boolean search logic where keywords are combined
with operators such as AND, NOT and OR. Online searches were conducted from various
bibliographic databases (Scopus, Google Scholar, Taylor and Francis, and Web of Science) as well
as websites of key woodfuel support organizations. Both original research articles and review
articles were included in this study. Table 2.1 presents a summary of the focus of the search. The
study was undertaken from April to June 2018 with 961 articles retrieved and 103 used in
data/information extraction after screening for relevance. The data/information extracted was
logged into an Excel spreadsheet and synthesized into the report.
Table 2.1: Data/information analysis and synthesis
Study focus Data/information needs
Study
characteristics
• Reference author
• Publication year
• Reference type (ex. journal; gov report;
report; media consultancy) Reference
quality (ex. scientific/data)
• Focus wood fuel (charcoal, firewood, both)
• Relevance for VC
Summary
trade flows
• Description of the route
• Mode of transport
• Countries/regions covered by trade
• Major markets
• Major production hot spots
• Key cross-border areas
• Description of major players
• Description of governance systems
• Description of significant sustainability
issues
• Value chain margins
Demand/
markets
• County
• Major market
• Population size of the major market
• Socio-economic characteristics of the
major consumers
• Estimated % or number of consumers in
the major market
• Estimated annual demand of charcoal/
firewood in the city
• Where woodfuel is sourced
• Main species used
• Unit of sales (ex. Bag, tins)
• High-season (months)
• High-season unit price
• Low-season (months)
• Low-season unit price
• Key governance regarding trade
• Key players in the sector
Supply/supply
zones
• Major hotspots
• Population of the area
• Socio-economic characteristics of the
major producers
• Estimated % or number of producers in the
area
• Mode of transport
• Tree sources
• Tree species
• Type of harvesting
• Type of processing

7
Study focus Data/information needs
• Estimated annual production of charcoal in
the zone
• Unit of sales (ex. bag, tins)
• High season (months)
• High season unit price
• Low season (months)
• Key sustainability issues
• Key gender issues
• Key factors affecting the availability or
alternatives
• Key governance issue
• Key players in the sector
• Key factors affecting the availability or
alternatives (livelihoods)
Charcoal Value Chain Actors
3.1 Overview of the charcoal sub-sector
The charcoal sub-sector is one of the most important sources of employment in the country with
reports indicating that it had employed about 0.5 million people as producers, traders and
transporters by the year 2000. These beneficiaries further supported over 2 million people as
dependants (Mutimba and Barasa, 2005). In the same year, the sub-sector was reported to have a
market value of KES 32 billion (USD 427 million at the prevailing exchange rate), highlighting the
important role it plays in the Kenyan economy (Mutimba and Barasa, 2005).
By 2013, the subsector had grown by 25% in jobs to employ an estimated 0.64 million people and
150-321% in market value to about KES135 billion (USD 1.6 billion) within the intervening period
of 13 years (KFS, 2013). Within the same period, charcoal consumption countrywide had grown
from an annual rate of 1.6 million tonnes (Mutimba and Barasa, 2005), to 2.5 million tonnes by
2009 (KFS 2013).
The charcoal value chain starts from tree production followed by harvesting, charcoal making
(carbonization), transportation and trade at various levels (KFS, 2013; Ndegwa, 2010; Sepp, no
date). The main value chain actors are wood producers, charcoal producers, transporters, vendors
(wholesalers and retailers), and consumers. In some cases, the actors are supported by the
services of agents and brokers facilitating linkages and transactions between various stages of the
value chain. Since most of the production is based on earth mound kilns that have about 10%
efficiency, the current charcoal production level requires 10 tonnes of wood to produce one

8
tonne of charcoal (Mugo and Gathui, 2010; IEA, 2015;). About 40-75% of the charcoal is produced
in arid and semi-arid lands (KFS, 2017; Iiyama et al, 2014; Burrow and Mogaka, 2007) and
especially in the Eastern region (Tharaka Nithi, Kitui Makueni and Machakos counties), Rift Valley
region (Narok, Kajiado, Baringo, Laikipia, Turkana counties), Coastal region (Kilifi, Kwale, Taita
Taveta and Tana River counties ) and North Eastern region (Marsabit and Garissa counties) (GoK,
2018; MENR, 2015; Burrow and Mogaka, 2007; GoK, 1997).
Nairobi is the largest charcoal market in the country accounting for 10% of all the charcoal
consumed (MENR, 2013). The Nairobi supply network spreads across the Rift Valley, Eastern and
North Eastern (Garissa) regions (Onekon and Kipchirchir, 2016; MENR, 2015). According to
Onekon and Kipchirchir (2016), 35% of the charcoal sold in Nairobi comes from Narok, while 20%
each comes from Kajiado and Ukambani.
3.2 Wood producers These are the tree growers or owners mostly residing in rural areas. They may either personally
produce charcoal or sell/give the trees to producers (KFS, 2013; Bailis, 2005). According to
Mutimba and Barasa (2005), in the year 2000, 44% of the charcoal consumed in the country was
produced from trees in the producers; own land, 38% from private land owned by other parties,
13% from land owned by the government and 5% from communal lands. In 2013, majority of the
trees were harvested in private lands but there was a substantial amount of charcoal coming in
from neighbouring countries mainly – Tanzania, Uganda, Ethiopia and Somalia (KFS, 2013).
Women representation is limited at the wood production and carbonization stages of the charcoal
value chain (Delahunty-Pike, 2012; Mutimba and Barasa, 2005), since traditions dictate that land
and the resources thereof belong to men, including both planted and naturally growing trees
(Zschauer, 2012; GoK, 2011; Muchiri, 2008). This means that wood production is dominated by
men, except in women-headed households.
3.3 Charcoal producers
Charcoal producers harvest the wood and carbonize it into charcoal. Majority of them are based
in rural areas where trees are in abundance. At the charcoal production stage, there is minimal
representation of women because production activities like tree felling and kiln preparation are
physically demanding and therefore regarded as more suited to men (Delahunty-Pike, 2012;
Ndegwa, 2017). Indeed, statistics show that in 2000, only 16% of charcoal producers in Kenya
were women, while 84% were men (Mutimba and Barasa, 2005). However, the statistics need to

9
be read with caution as charcoal production is mostly a family business as demonstrated by
Ruuska (2012) in a study conducted in Kilifi County. According to the findings, 27.5% of all
charcoal in the area was produced by women, while another 41.5% was produced with the input
of women as part of the family. Furthermore, KFS (2013) reported that more women than men
are registered as charcoal producers with CPAs in Kitui County. Having more women registered
with CPAs as charcoal producers may also signify women’s willingness to engage in legal
production compared to men who had largely dominated production before the enactment of the
Charcoal Rules (2009). According to Mutimba and Barasa (2005), there are four categories of
producers:
i. Sow and reap producers: These producers are usually located in the high agricultural
potential areas like Meru and Muranga counties and produce charcoal from planted trees
sourced from their own farms .
ii. Salvage producers: Produce charcoal from land cleared for other activities like
agricultural expansion (in Narok) or control of invasive species (in Baringo and Garissa).
iii. Sideline producers: They are wage labourers who are; either i) paid using wood to
produce charcoal; or ii) given trees to produce charcoal yet expected to give a share of
the charcoal to the tree owner. This is common in arid and semi-arid lands (ASALs) where
there are group and private ranches.
iv. Sneak and snip producers: This category involves those who sneak into government-
protected areas (forests) and illegally harvest trees to produce charcoal.
Nationally, charcoal is produced by 200,000-300,000 producers spread across the major
producing zones in Rift Valley, Eastern, Coast and North Eastern (Mutimba and Barasa, 2005; KFS,
2013). Even though this might seem like an insignificant figure considering the total population of
about 48 million, localized studies indicate that charcoal production is a major livelihood resource
for rural population in the arid lands. For instance, in Mutomo District, Kitui County, Ndegwa et al.
(2016b) reported that 52% of the respondents engage in charcoal production, while Kiruki et al.
(2016) reported 66% in the same area. Ruuska (2012) reported that 51% of households were
involved in charcoal production in Dakacha, Kilifi County.
There are two main categories of charcoal producers: full-time producers who undertake it as a
business, and; part-time or seasonal producers who only produce when they need money to meet
a certain need or during drought (Kiruki et al, 2016; Ndegwa et al., 2016b; Ruuska, 2012; Mutimba
and Barasa, 2005). At the national level, Mutimba and Barasa (2005) reported that 56% of the

10
producers are full-time, while 44% are part-time. In his findings from a study conducted in Kitui
County, Njoroge (2013) reported that 76% of the respondents were part-time producers while
24% engaged in production on a full-time basis.
In addition, charcoal producers can also be divided into three major groups based on the level of
production. The three groups are: small-scale producers who produce less than 10 bags per
month; medium-scale producers who produce up to 100 bags per month, and; large-scale
producers who produce over 100 bags per month (Ruuska, 2012). Small-scale producers are
mostly poor people with less diversified sources of income and, in many cases, engage in
production for subsistence purposes (Ndegwa et al., 2016b). Full-time producers who happen to
be either medium- or large-scale are the wealthy people able to finance large-scale charcoal
production operations (Ndegwa et al., 2016b; KFS, 2013). It is the latter category that poses the
greatest risk to forest and land degradation due to their high and unsustainable demand for
biomass.
3.4 Charcoal transporters
Transporters usually buy and transfer charcoal from producers in rural areas and sell it to either
wholesalers and/or retailers (KFS, 2013; Ndegwa, 2010). In some instances, they also sell directly
to consumers, especially in urban areas. Charcoal transportation is mainly dominated by men who
accounted for 86% of the transporters in 2000, compared to women who accounted for only 14%
as reported by Mutimba and Barasa (2005). Women are reported to play a significant role in
small-scale transportation especially where human labour, bicycles or donkey carts are used
(Delahunty-Pike, 2012). The large-scale and long-distance transportation is dominated by men
who have the required capital to invest in motorized means of transport. Involvement of women
in transportation is also curtailed by other factors such as unfamiliarity with the complicated and
sometimes long legal procedures to get permits, as well as rampant corruption (Ndegwa, 2017;
Delahunty-Pike, 2012). Further, women might be reluctant to undertake travel that requires them
to spend nights away from home for domestic and/or security reasons. Enactment of the Charcoal
Rules (2009) has however, seen an increased interest by women as charcoal transporters with
30% of transporters registered with the Kitui County Charcoal Transporters Association (KCCTA)
being women (KFS, 2013).

11
3.5 Wholesalers and retailers
Wholesalers purchase charcoal in bulk from either producers, transporters or brokers and sell to
retailers, and in some cases to consumers in bags (KFS, 2013; Ndegwa, 2010; Mutimba and
Barasa, 2005). On the other hand, retailers buy charcoal from either producers, transporters or
wholesalers and sell to consumers either in bags or smaller units like buckets and recycled tins.
The wholesale industry is dominated by men who can afford the required huge capital outlay to
buy a large consignment for resale (Delahunty-Pike, 2012). However, charcoal retail is dominated
by women who account for 57% of all retailers (Mutimba and Barasa, 2005). Delahunty-Pike
(2012) attributes this to the minimal capital outlay required to buy a few sacks of charcoal and sell
them in small units like tins and buckets.
3.6 Consumers Consumers are at the end of the value chain. A majority are households, but commercial
businesses (such as hotel, restaurants, roast meat eateries) and institutions (such as schools,
hospitals, prisons) also form a significant portion of the final consumers. Charcoal is sold to
commercial businesses in 35-kg bags, while majority of households purchase in either 35-kg bags
or 2-kg recycled tins (KFS, 2013, Mutimba and Barasa, 2005). At the consumption stage,
household cooking is almost entirely the responsibility of women, so they are the main charcoal
consumers (GoK, 2011; Muchiri, 2008). In urban areas, majority of the non-household charcoal
consumers are small to medium sized enterprises. According to Karekezi et al. (2008) most of the
charcoal-dependent enterprises are owned by women (70%). This means that the majority of
charcoal consumers within cottage industries are also women.

12
4. Elements and Economics of the Charcoal Value Chain in Kenya
4.1 Tree management and sourcing
Most of the charcoal in Kenya is produced from trees that are obtained at no cost either from
private or government land (UNEP, 2017; IEA, 2015; Tesot, 2012; Mutimba and Barasa 2005; DFID,
2002), which makes the price of charcoal “artificially” low compared to when producers purchase
or grow wood for charcoal (KFS, 2013; Nyang, 1999). Even though the charcoal production largely
relies on trees from private lands, few producers are said to be involved in tree planting for
charcoal as most of them rely on naturally regenerating trees (Mutimba and Barasa, 2005;
Ndegwa, 2010). Furthermore, between 90-99% of this charcoal is produced in rudimentary earth
mound kilns (KFS, 2013; Mutimba and Barasa, 2005) with efficiencies ranging from 8% to 20%,
depending on the moisture content of the wood and operator experience (Ndegwa, 2016; Iiyama
et al., 2014). About 8-10 tonnes of wood is required to produce a tonne of charcoal, signifying
massive wastage of biomass resources; there are technologies with three- or four-times more
efficiency such as, the improved earth kiln, the half-orange brick kiln (IEA, 2015; Mugo and
Gathui, 2010; Bailis, 2005; Nyang, 1999).
Nevertheless, a few isolated cases have revealed that charcoal producers can produce charcoal
from woody residues especially planted for charcoal and make profits at the prevailing market
rate. One such example is Kakuzi PLC in Murang’a County which used to produce charcoal from
residues of Eucalyptus that had been grown and cut for poles, using a half-orange brick kiln with
an efficiency of about 30% (Oduor, 2012; Mugo and Gathui, 2010). From their analyses, the cost
of wood required to produce a bag of charcoal was KES 75 (about USD 0.93)2. Other studies in
2000 estimated the cost of wood required to produce a bag of charcoal to be between USD 0.29
and USD 0.59, and about USD 1.44 in 2013 as shown in Table 4.1.
Table 4.1: Cost of wood for charcoal in USD between 2000 and 2013
Year of
study
Cost of a bag of charcoal Exchange rate
(1USD to KES)
Reference
(KES) USD
2000 22-44 0.29-0.59 76 Bailis, 2005
2010 100 1.25 80 Ndegwa, 2010
2010 75 0.59 80 Mugo and
Gathui, 2010
2013 125 1.44 87 KFS, 2013
2 See prevailing exchange rate in Table 4.1

13
Assuming a kiln efficiency of 10% and the weight of a bag of charcoal is 35 kg as stated by
Mutimba and Barasa, (2005), it can be deduced that 350 kg of wood for charcoal was priced at
USD 0.25-1.44. This low valuation of wood for charcoal is particularly one of the reasons the
farmgate price of charcoal has remained low. In fact, Table 4.2 demonstrates that the farmgate
price of 350 kg of firewood was about USD 9.4 in 2010 (Ndegwa, 2010) while retail price was
about USD 22.4 in 2009 (Ngetich et al., 2015) and USD 27 in 2015 (Boulkaid, 2015).
Table 4.2: Cost of fuelwood in USD from different counties in Kenya
Year of
study
Cost of wood in KES
(units in brackets)
Cost of 350
kg of wood
Exchange rate
(1USD KES to)
Location Reference
2009 500 (0.17 m3) * 22.4 *** 80 Nakuru Ngetich et al.,
2009
2010 800 (1 stere*) 9.4 ** 80 Murang’a Ndegwa, 2010
2011 76 (25 kg headload) 12 ** 89 Kakamega Wambua, 2011
2015 200 (25 kg) 27.0 *** 103 Nyeri Boulkaid, 2015 *1 stere = 0.65 m3 =374 kg; 1m3= 575 kg. (FAO, 2004); ** Farm gate price; ***Retail price
Considering the farmgate price of firewood was USD 9-12 around the year 2010 (Table 4.2), and
the cost paid for wood for charcoal (when it was paid) in the same period was USD 0.6-1.5 (Table
4.1), it can be concluded that wood for charcoal is undervalued 10 times compared to firewood.
Due to this, studies report that the portion of the final retail price of charcoal retained by tree
producers is 0-6% (FAO, 2017; KFS, 2013; Bailis, 2005), thus making investment in tree farming for
charcoal quite unattractive (MENR, 2013b; Iiyama et al., 2017).
According to Mutimba and Barasa (2005), the most preferred tree species for charcoal production
nationally are Acacia spp, (45%), Olea spp (9.5%) and Croton megalocarpus (7%) in that order.
Acacias A. Senegal, A. seyal, A. tortilis, A. nilotica, A. mellifera, A. polyacantha and A.
xhanthophloea are some of the most preferred (Ndegwa et al., 2016a; Onekon and Kipchirchir,
2016; KFS, 2013; GoK et al., 1997). Other trees are commonly used in localities where they are in
abundance. These include Prosopsis juliflora in Baringo, Turkana, and Garissa counties (KFS,
2013), Terminalia brownie in Kwale county (Wanjala, 2016), Olea Africana and Warbugia
ugandensis in Narok county (Tesot, 2012) and Terminalia prunoides, Terminalia brownii, Senna
abbreviata and Balanites aegyptica in Kitui county (Luvanda et al., 2016; Ndegwa et al., 2016a).
The Acacia spp., among other hardwood trees, are preferred for charcoal production because
they produce dense high-quality charcoal that lasts long in the cooking stove (Ndegwa et al.,
2018; Onekon and Kipchirchir, 2016; Zschauer, 2012; Mutimba and Barasa, 2005). While

14
harvesting in Narok and Kajiado counties is usually through clear-felling to open up land for
agriculture (Iiyama et al., 2017; KFS, 2013; Tesot, 2012; Bailis, 2005; Mutimba and Barasa, 2005),
harvesting in the eastern and coastal regions is usually selective where preferred hardwood trees
like Acacia spp are harvested, leaving the less desirable softwood trees like Commiphora spp
(Ndegwa et al., 2018; Kiruki et al., 2016; Burrow and Mogaka, 2007). The latter has led to
depletion of targeted species, and consequently loss of biodiversity in the woodlands (Iiyama et
al, 2017; Kiruki et al., 2016; Ndegwa et al., 2016a; Onekon and Kipchirchir, 2016).
4.2 Charcoal production, technology and associated costs
4.2.1 Charcoal production hotspots
Majority of the charcoal consumed in the country is produced in ASALs (GoK, 2018; Iiyama et al,
2014; Burrow and Mogaka, 2007). These cover over 70% of the country’s land mass and can be
found in almost all regions of the country. From the literature reviewed, several regions or
charcoal-producing zones have been extensively studied due to their importance in supply and
localized impact on the ecosystem (Table 4.3).
The Mau ecosystem, spanning Narok, Nakuru, Kakamega and Migori counties has been studied
extensively and 17 of the reviewed studies focus on it. The forests of focus in the Mau ecosystem
include: Nyakweli Forest, Kakamega Forest, West and East Mau Forest Reserve, Maasai Mau
Forest and Burnt Forest. Literature indicates that excisions and conversion of excised forest land
into agricultural land is the leading cause of deforestation in the area. Wood from forest
clearance is also used for charcoal production (Iiyama et al., 2017; KFS, 2013; Tesot, 2012;
Kipsisei, 2011; Bailis et al, 2005). In addition, some of the publications report of illegal charcoal
production inside protected forests especially close to the excision frontier (Iiyama et al., 2017;
Kipsisei, 2011). Some of the reported impacts of charcoal production in the area include
degradation of catchment areas leading to reduction in water levels in rivers originating from the
area. Loss of biodiversity, loss of ecosystem services, land degradation and extreme weather
events are the other impacts reported by the studies as resulting from indiscriminate felling of
trees for agriculture and charcoal production.
Kitui and Makueni counties in the Ukambani region are the next most studied charcoal production
zones. Charcoal production in this region is mostly through selective logging. Many of the private
farmlands and non-protected government and communal lands have been highly depleted of
preferred charcoal production tree species (Ndegwa et al., 2018; Iiyama et al, 2017; Kiruki et al,

15
2016; Ndegwa et al., 2016a; KFS, 2013; Ndegwa 2010). As a result, production has extended into
protected forests and woodlands like the Kitui South National Reserve which is meant to be a
wildlife conservancy and migration corridor (Ndegwa et al., 2018; KFS, 2013). In addition, charcoal
producers are also reported to cut trees on hillsides that have in the past enjoyed community
protection because of their critical role as water catchments and source of pasture during
drought. Loss of ecosystem services and danger of desertification due to unsustainable charcoal
production practices are some of the concerns raised in the publications (Iiyama et al, 2017; Kiruki
et al, 2016; Ndegwa et al., 2016a).
The coastal region comprising Kilifi, Kwale and Taita Taveta counties is the third most studied
charcoal production zone. Dakacha woodlands in Kilifi and Shimoni Forest in the South Coast are
some of the forests covered in the literature (Boulkaid, 2015; Birdlife International, 2013; Ruuska,
2012; Zschauer, 2012). Main observation made in the literature is that charcoal production is
rampant in protected forests leading to depletion of tree species preferred for charcoal. Kajiado
and the central region are the other key charcoal production sites highlighted as charcoal
production hotspots as shown in Table 4.3.

16
Table 4.3: Main charcoal-producing zones in Kenya covered in literature Region/zone County(s) Example of forest No. of
studies References Main issues highlighted in literature
Mau ecosystem
Narok Kakamega Nakuru Migori
Nyakweli forest- Narok Kakamega Forest- Kakamega West Mau Forest reserve Maasai Mau Forest Eastern Mau Forest Reserve Burnt Forest
17 GoK, 2018; Iiyama et al., 2017; Bailis, 2009; Bailis et al, 2005; KFS, 2013; Wambua 2011; Ngetich et al, 2009; Onekon and Kipchirchir, 2016; KFS, 2017; Chabeda-Barthe, 2013; Tesot, 2012; Njenga et al, 2013; Wanjala et al, 2015; Butynski and de Jong, 2016; Kipsisei, 2011; Ngaira and Omwayi, 2012
Land opened up for agriculture leading to deforestation is used for charcoal Production from indigenous species within protected forests Illegal settlements and charcoal production taking place in protected forest reserves. Deforestation and degradation could lead to loss of pastures, loss of biodiversity, loss of ecosystem services and extreme weather events like floods and drought. Forest excision a major cause of deforestation and degradation Most production activities in protected forests occurs close to the borders with the land exercised from the protected forest Heavy browsing in degraded forests affects natural regeneration Indiscriminate felling of wood has reduced water levels in Mara and Migori Rivers Destruction of water catchment led to reduction in water volumes in River Mau and Sondu Miriu
Ukambani Kitui Makueni
South Kitui National Reserve
16 GoK, 2018; Ndegwa et al., 2018; Ndegwa et al., 2016a; KFS, 2013; Ndegwa 2010; Bar and Ehrensperger, 2018; Kadenyi, 2017; Gikonyo, 2004; Luvanda et al. 2016; Kiruki et al, 2016; IIyama et al, 2017; Hosier, 1985; Onekon and Kipchirchir, 2016; Kitui County, 2018; Njoroge, 2013; Okoko et al, 2017
Private farmlands highly depleted off preferred hardwood species Production in Kitui encroaching on protected/gazetted lands like Kitui South National Reserve Preferred species being rapidly depleted leaving woodlands with softwoods only Risk of losing ecosystem services and animal habitats due to deforestation/forest degradation Indiscriminate charcoal production could lead to desertification Felling of trees on hillsides that are water catchment and dry season grazing areas
Kajiado Kajiado 5 GoK, 2018; KFS, 2013; Musembi et al., 2010; Muchiri, 2008; Onekon and Kipchirchir, 2016
Land opened-up for agriculture leading to deforestation Decline in charcoal production feedstock in recent years
Central Nyandarua Nyeri Meru Tharaka Nithi
Mount Kenya, Aberdare
5 GoK, 2018; KFS, 2013; Osawa and Muchunku, 2006; Njenga et al, 2013; Mbugua, 2005;
Charcoal production is a major cause of degradation of the two water towers (Mount Kenya and Aberdare) in the central region
Coastal Kilifi Taita Taveta Kwale
Dakacha, Shimoni Forest (South Coast)
7 GoK, 2018; Boulkaid, 2015; Ruuska, 2012; Zschauer, 2012; Muchiri, 2008; Onekon and Kipchirchir, 2016; Birdlife International, 2013
Preferred tree species have been depleted Illegal charcoal production going on in protected forests
Turkana and Baringo
Baringo Marigat 4 KFS, 2013; Burrow and Mogaka 2007; Wangechi, 2015; Opiyo et al, 2015
Production promoted to control the invasive Prosopis julifora but other trees still being targeted. Some charcoal producers in Turkana apply salt on trees to make them dry so that they can use them for charcoal production
Nyanza Siaya Migori
Got Ramogi
2 Otuoma et al, 2011; Ngaira and Omwayi, 2012
The decline in forest density Reduction on the proportion of key merchantable woody species Soil erosion, reduction in water volume in rivers and loss of biodiversity are some of the effects of charcoal production

17
4.2.2 Charcoal production
Many charcoal producers use family labour or form loose partnerships of 2-4 people, where they assist
one another set up and manage each other’s kiln, to minimize the cost of production (KFS, 2013; Bailis
2005). This is unpaid labour which should be valued at local labour costs for precise estimation of
charcoal production. The under-valuation makes it quite difficult to estimate the cost of labour for
producing one bag of charcoal, but Ndegwa (2010) gives a rough estimate of KES 50 (USD 0.6) based on
local labour costs. Some large-scale producers, however, engage causal labourers to produce charcoal
for them at an agreed daily wage, in which case the cost of labour is about KES 160 (USD 1.8) per bag of
charcoal (KFS, 2013). In some cases, especially where the trees targeted for felling are quite large,
charcoal producers are forced to hire equipment like power saws to fell and chop the stem into logs of
manageable sizes. Some producers hire hoes, axes and spades to prepare the kilns. For example,
Luvanda et al. (2016) reports a monthly fee of KES 1,250 (USD 12.5) for equipment and a monthly
production rate of 28 bags. The equipment expenses for one bag is therefore, about KES 45 (USD 0.5). In
Kakuzi, Murang’a County, the total cost of producing one bag of charcoal from residues of Eucalyptus
was estimated at KES 159 (USD 2.0) inclusive of tree growing, kiln construction, harvesting of wood,
operational cost, store and stock (Mugo and Gathui, 2010). Going by these estimates, we can estimate
the total cost associated with production of one bag of charcoal in 2010, in addition to that of the trees
to be about KES 100-160 (USD 1.3-2.0).
Monthly charcoal production varies from place to place depending on the scale of operations of
producers and the quantity of feedstock at their disposal. Nationally, Mutimba and Barasa (2005)
estimated that a charcoal producer makes an average of 230 bags of charcoal annually; each weighing
about 35 kg. Studies also suggested that the average producers seemed to increase their level of
production substantially, perhaps as production become more and more recognised as a business. This
suggestion has been supported by other studies such as by Luvanda et al. (2016), who reported 28 bags
per month and Ruuska (2012), who reported 38 bags per month. In 2013, KFS (2013) reported that an
average producer in the country produced 40-60 bags of charcoal per month which amounted to 480-
720 bags per annum.

18
4.2.3 Charcoal production technology
Charcoal is usually produced in traditional earth mound kilns (Figure 2). In this type of kiln, wood is cut
into manageable sizes (around 1-2 m logs) and stacked in a semi-conical or a trapezoidal prism shape on
the ground (KFS, 2013; Bailis, 2005; Mutimba and Barasa, 2005). Small twigs are inserted into the stack
to fill empty spaces and support combustion when lighting. The wood is then covered with dry
herbaceous vegetation (like grass) as well as soil, and then ignited (Ndegwa, 2016a; Mutimba and
Barasa, 2005).
Figure 4.1: Different stages in preparation of the earth mound kiln: Top left - Stacked wood; Top right -
wood covered with herbaceous vegetation; Bottom left - complete kiln covered with soil; Bottom
right - fired kiln. (Photos by Geoffrey Ndegwa)
Carbonization takes place under controlled conditions for 2-4 days and left to cool for 2-3 days
depending on the size of the stack (Ruuska, 2012; Bailis, 2005). In total, the entire charcoal production
process may take 3-10 days from stacking wood to off-loading, depending on the size of kiln.
4.2.4 Charcoal producers’ income
The price of charcoal has been changing over time with a marginal rise from about USD 2.5 to USD5 per
bag between 2000 and 2015. Mutimba and Barasa (2005) reported that the farmgate price of charcoal

19
was KES 201 (USD 2.6) by 2000. Ten years later, Ndegwa (2010) reported the producer price to be KES
300 (USD 3.8) while by 2013, the average national producer price was KES 438 (USD 5.0), KFS (2013).
Luvanda et al. (2016) and Ndegwa et al. (2018) reported the producer price in Kitui to be KES 400 (USD
4.0) per bag in 2016 (Figure 3). This gradual increase in the price offered to the producers may however
not be significant when adjusted for inflation as cautioned by Bailis et al. (2017).
Figure 4.2: Charcoal producer price (USD) between 2000 and 2016
The average monthly income of a charcoal producer was estimated at KES 4,496 (USD 59) in the year
2000 (Mutimba and Barasa, 2005). This income had only risen marginally in a decade with 2013
estimates by Njoroge (2013) being KES 6,000 (USD 69.0) per month income for producers in Kitui while
nationally KFS, (2013) estimated net average earnings to range between KES 6,000-14,000 (USD 68-160)
per month per charcoal producer. For many of the charcoal-producing households, income from the
product represents over 50% of the total household income (Ndegwa et al., 2016b; Ruuska, 2012) and is
thus an important source of livelihood. Charcoal producers are usually price takers from traders and
transporters but belonging to a Charcoal Producers Association (CPA) is helpful as the CPAs help
members negotiate better prices (Luvanda et al., 2016). All charcoal producers are required to be
members of Charcoal Producers Associations (KFS, 2013) as stipulated in the Forest (Charcoal) Rules
(2009); they pay a subscription fee of KES 300 (USD 3.0) per annum (Delahunty-Pike, 2012).
4.3 Charcoal transportation
Once charcoal is off-loaded from the kiln, it is packed into recycled 90-kg capacity polypropylene bags,
with each bag carrying 28-50 kg of charcoal (Ndegwa, 2018; Ruuska, 2012; Zschauer, 2012; Mutimba and
Barasa, 2005). The charcoal is either sold to transporters or wholesalers. In some cases, producers who
0
1
2
3
4
5
6
1998 2000 2002 2004 2006 2008 2010 2012 2014 2016 2018
Char
coal
pric
e pe
r bag
in U
SD
Year of data
Producer price (USD) between 2000 and 2016

20
are close to the major highways, especially the Nairobi-Mombasa highway, transport their charcoal to
the roadside and sell to motorists where the product could fetch up to twice the price offered by
transporters and wholesalers on site (KFS, 2013). Charcoal is transported using a combination of
methods depending on the destination. In 2000, 70% of the charcoal was transported using lorries, 20%
using carts and 10% using bicycles (Mutimba and Barasa, 2005). Human labour is mostly used to
transport charcoal from the carbonization site to the nearest place where it can be loaded onto
motorized transport. In Kilifi County, Ruuska (2012) reported that 44% of the charcoal was transported
by lorries, 29% by canters3, 16% by matatus (public passenger service vehicles) and 11% by bicycles. In
2013, KFS (2013) reported that motorcycles were fast replacing most ofnon-motorized transport means
such as carts and donkeys4 . This is because the motorcycles can easily manoeuvre rough terrains and
can also be used to transport charcoal for slightly longer distances to the nearest market, and still
remain within the law of transporting a minimum of three bags of charcoal or less without the need for
a permit (KFS, 2013). Mutimba and Barasa (2005) also reported that 67.5% of the transporters owned
their means of transport while 32.5% hired means or were employed as drivers.
4.3.1 Charcoal movement licensing
Transportation of charcoal requires a transport permit (Iiyama et al, 2013; KFS, 2013; Owen, 2013; wa
Gathui et al., 2012). The permit is either issued by the KFS County Ecosystem Coordinator or the local
KFS officers after payment of KES 20 (USD 0.2) per bag (Owen, 2013a; KFS, 2013) although permit fees
mostly rounds off to either KES 1,000 (USD 10) or 2,000 (USD 20) based on the capacity of the means of
transport to avoid actual verification. There is, however, lack of clarity on who is responsible for
issuance of the permit, which sometimes makes the process long and cumbersome (Owen, 2013).
The business of charcoal transportation is one segment of the charcoal value chain that is riddled with
corruption. The bribes paid by charcoal transporters are generally estimated to range between 20% to
30%of the final retail price (Ndegwa, 2010; FAO, 2017). Bailis (2005) estimated that bribes paid by
transporters from Narok to Nairobi at 15 checkpoints added up to KES 30,000-34,000 (USD 395-453),
3 Canters is a naturalized term in the Kenya transport sector that implies trucks of with a load capacity of 3 tons, while lorries are trucks that
carry 7 tons and above
4 Motorcycles have become ubiquitous in the country’s transport sector after the government zero-rated all motorcycles below 250 cc in 2008,
making them very affordable. In addition, it is now easier to access affordable models from China

21
which translated to KES 120 (USD 1.6) per bag or 26% of the final retail price. In 2013, KFS (2013) also
reported that bribes paid during charcoal transportation at 16 checkpoints from Kajiado County to
Nairobi ranged between KES 20,000-80,000 (USD 230-920) per trip accounting for 5-13% of the final
retail price.
The illegal payments are passed over to the consumers, which increases the final market price while also
reducing the transporters’ profit margins. Furthermore, the transporter is required to pay KES 20 (USD
0.2) cess per bag in each of the counties the consignment passes through (Luvanda et al., 2016; KFS,
2013; Owen, 2013). In some counties like Kilifi and Mombasa, the cess is set at KES 200 (USD 2) for pick-
up trucks and KES 500 (USD 5) for canters to avoid the need of actual verification of the number of bags
(Ruuska, 2012).
4.3.2 Income from charcoal transportation
A lorry can transport 150-350 bags depending on its size and the size of the bags (KFS, 2013; Ruuska,
2012; Ndegwa, 2010). On average, a lorry transports 300 bags of charcoal and could make two trips in a
week (KFS, 2013; Ndegwa, 2010). This means that a single transporter can ferry 2,400 bags in a month.
The final price of the charcoal is dependent on: distance between the source and destination market;
expenses incurred in transportation (including bribes); supply and demand dynamics, and the season as
it tends to be more expensive during the rainy season due to labour scarcity arising from peak in farm
activities and the poor condition of many of the rural earth roads (KFS, 2013; Luvanda, 2016; Tesot,
2012; GoK, 2004).
The transporters’ buying price depends on production cost, geographic location as well as other factors
like season, producer organization5 and supply and demand dynamics (KFS, 2013; Luvanda et al., 2016).
Thus, profit margins depend on the capacity of the means of transport, the destination market prices
and on whether they own it or hire (KFS, 2013; Bailis, 2005). For example, Bailis (2005) reports that a
transporter who owned a lorry and transported charcoal from Narok to Nairobi made a profit of 18%,
while those who hired only made 7%.
5 CPAs negotiate for better prices for members such as in Kitui County as noted earlier

22
Table 4.4: Charcoal transporter costs and profit
Year of study
Transporter buying price (KES)
Transporter expenses (KES)
Transporter selling price (KES)
Estimated monthly income (KES)
Market location
Profit per bag (KES)
% profit
Reference
2013 450
(Baringo)
295 1000 189,000 Nairobi 255 25.5 KFS, 2013
2010 350 (Kitui) 256 639 26,000 Nairobi 23 4 Ndegwa 2010
2000 260 (Kakuzi) 50 350 - Nairobi 40 11 Mugo and
Gathui, 2010
2000 201
(National)
- 335 11,200 Nairobi 134 - Mutimba and
Barasa, 2005
2012 400 (Kilifi) - 600-1000 - Mombasa 200-
500
Ruuska, 2012
2000 108 188-220 350 - Nairobi 54-22 7-18 Bailis 2005
USD to KES Exchange rates: 2013: USD 1=KES87; 2012: USD 1=KES84; 2010: USD 1=KES80; 2000: USD 1=KES76.
The monthly income for transporters was estimated at KES 11,200 (USD 147) in 2000 (Mutimba and
Barasa, 2005), KES 26,000 (USD 325) in 2010 (Ndegwa, 2010) and KES 189,000 (USD 2172) in 2013 (KFS,
2013) as shown in Table 4.4.
4.4 Charcoal wholesaling
Wholesalers buy charcoal from either producers or transporters and sell to retailers in bulk (usually full
bags). The buying price for the wholesaler is mostly dictated by the transporters, who seek to recoup all
expenses incurred during the transportation (KFS, 2013; Ndegwa, 2010). Another observation made by
KFS (2013) is that the price of charcoal in Nairobi differs depending on the source, location of market
and cartels in control. For instance, charcoal from Baringo fetches higher prices compared to that from
Kajiado. Traders are however not at liberty to stock the cheaper charcoal as transportation is controlled
by powerful cartels that determine where charcoal from each production zone is sold in the city (KFS,
2013). For example, it was reported that charcoal from Kajiado can only be sold in Pangani and its
environs, that from Kitui in South B, from Tana River in Kiambu and from Baringo in Dagoretti Corner,
Satellite, Kawangware and surrounding areas. As such, a transporter from Kajiado cannot be allowed by
the cartels to sell his/her charcoal in South B or Kawangware where they would earn higher profits (KFS,
2013).
The charcoal wholesale price in 2000 was estimated at KES 400-450 (USD 5.3-6.6) (Bailis, 2005) rising to
KES 1000-1500 (USD 11.5-17.20) in 2013 KFS (2013) an increase of 150-233% within a period of 13 years.

23
This percentage change is comparable to the producer price change over the same period, which rose
from KES 108 ($1.4) (Bailis, 2005) to KES 450 (USD 5.2) (KFS, 2013), which is a 317% increase.
Since many charcoal wholesalers are also operating on a retail basis (selling whole sacks as well as
breaking it down into smaller units like tins and buckets), many of the studies on traders have lumped
them together into one category, dubbed vendors. One exception is the KFS (2013) report that was able
to estimate the average monthly income of wholesalers independently at KES 48,800 (USD 561).
Between 56% (Mutimba and Barasa, 2005) and 78% (Bailis, 2005) of the charcoal sold in Nairobi by
vendors is bought from transporters with large trucks, whilst the rest is bought from individuals from
nearby sources using smaller trucks and pickups.
4.5 Retailing
Retailers mostly buy charcoal from either wholesalers or transporters. Their most distinguishing
characteristic is that they break the bag down into small units that the consumers can afford (Dalberg,
2018; Bailis, 2005). However, these smaller units have been found to cost consumers more than they
would spend on a whole bag basis (Dalberg, 2018; Karekezi et al, 2008). In 2000, Mutimba and Barasa
(2005) estimated that a charcoal vendor was earning an average of KES 7,500 (USD 99) per month.
Ndegwa (2010), on the other hand, estimated the monthly income of retailers at KES 6,900 (USD 86) in
2010 while KFS (2013) reported it to be about KES 12,600 (USD 145) in 2013. The vendors’ gross profit
ranges from 15% to 52% of the final retail price as shown in Table 4.5.
Table 4.5: Charcoal vendors expenses and profit share in a charcoal bag
Yr of study
Vendor buying price (KES)
Vendor expenses (KES)
Vendor expenses % of retail price
Vendor selling price (KES)
Gross profit (% retail price)
Net profit in KES
Net profit (% of retail price)
Market location
Estimated mthly (KES)
Bags sold per mth
Ref
2000 350 53
11 470
26
67
14) Nairobi 3,350
50 Bailis, 2005
2000 335 nd nd 700
52
- - Nairobi 11,200
7,503 Mutimba and Barasa, 2005
2010 639 50 6 779
18
90 12
Nairobi 6,928
80 Ndegwa, 2010
2011 591
nd nd 688
15
Kakamega Not given
Wambua, 2011
2013 1,400
nd nd 1,949
28
Nairobi 16,470
30 KFS, 2013

24
USD to KES Exchange rates: 2013: USD 1=KES 87; 2012: USD 1= KES 84; 2011: USD 1=KES 89;
2010: USD 1=KES 80; 2000: USD 1=KES 76.
At a retail price of KES 470 (USD 6.2) per bag (when it was already broken down into smaller units),
Bailis, 2005 estimated the expenses and net profit of the vendor to be KES 53 (USD 0.7) and KES 67 (USD
0.9) respectively, which is 11% and 14% of the final retail price, respectively. In 2010, Ndegwa (2010)
estimated vendor expenses and net profit to be 6% and 12%, respectively, of the final charcoal retail
price in Nairobi.
4.6 Charcoal consumption
As reported by MoE (2002), charcoal is used by 82% of urban households and 34% of rural households.
The per capita consumption in rural areas is, however, higher (156 kg) than that of urban areas (152 kg
per annum). In 1999, Nyang (1999) reported that the average monthly consumption of charcoal was
higher (52 kg) for urban households using purchased charcoal than for those using self-produced
charcoal (25 kg). Indeed, Hosier (1985) reported that there is a direct relationship between the amount
of woodfuel consumed by a household and the amount of time required to collect it. In this case,
producing charcoal for personal use in urban areas has a higher opportunity cost due to low access to
wood, and is also quite laborious compared to buying, thus the low consumption level among
producers. In rural areas, there was a slight difference between households using purchased charcoal
(39 kg per month) and those using self-produced charcoal (33 kg per month) (Nyang, 1999).
Several attributes make charcoal the fuel of choice in urban areas compared to firewood. These
attributes include; i) less or no smoke, hence can comfortably be used indoors; ii) higher calorific value
per unit weight of wood; iii) easier and less expensive to transport over long distances (IEA, 2015;
Ndegwa, 2010; Mbugua, 2005). In addition, the charcoal market system is also well developed – from
production, transportation and trade (Ndegwa 2010) – which ensures it is readily accessible to all who
need it, especially in urban areas (Mbugua, 2005). Indeed, Dalberg (2018) reports that charcoal can be
accessed from between 50-150 m by many urban households.

25
4.6.1 Household charcoal consumption and budget
For a long time, charcoal was the cheapest cooking fuel in urban areas regardless of income levels (IEA,
2015; Ndegwa, 2011; Hosier, 1985). For example, the cost of cooking with charcoal in the year 2000 was
KES 12,000 (USD 150) per household per annum compared to KES 31,760 (USD 397) for LPG and KES
59,200 (USD 740) for electricity (Ndegwa, 2011). Moreover, charcoal is normally sold in small units (tins,
plastic bags or buckets) which makes it affordable for the urban poor, in the short term (Dalberg, 2018;
IEA, 2015; Ruuska, 2012; Karekezi et al., 2008). However, recent studies have shown that kerosene is
much cheaper than charcoal, especially where charcoal is bought in small portions like tins and buckets
(Dalberg, 2018; KFS, 2013; Bailis, 2005). Indeed, Bailis (2005) reports that the cost of charcoal increases
by 20-25% when it is bought in smaller units. In their study, wa Gathui and Ngugi (2010) reported that
by 2010, Kisumu residents also stated that cooking with charcoal had become quite expensive compared
to cooking with firewood or kerosene.
Although majority of the urban charcoal users buy in small units, Gikonyo (2004) reported that more
(about 90%) rural charcoal users in Kitui buy charcoal in bulk (whole bags) compared to 10% who buy in
tins. Nyang (1999) reports three main findings that may have influenced this observation: charcoal is
cheaper in rural areas (KES 4.0 per kg) compared to urban areas (KES 5.1 per kg); the distance travelled
by rural households to buy charcoal being over three times that covered by urban dwellers (6.2 km
compared to 1.9km); consumers of charcoal in the rural areas usually being the well-off who can afford
to buy in bulk while majority of those in the urban areas are the poor and middle-income households.
Moreover, high-income urban households also use LPG and electricity together with charcoal (Mwangi,
2013).
Charcoal has an inelastic demand to income in urban areas. IPPRA (2010) also concurs with this
observation, adding that unlike other solid biomass fuels like crop residues and firewood which get
substituted with cleaner fuels like charcoal and LPG, households don’t stop using charcoal even with an
increase in the level of income. However, charcoal and other cleaner fuels like LPG have an elastic
demand to price, meaning that with increase in charcoal or LPG price, households tend to switch to
other cheaper options like kerosene and vice versa (Mwangi, 2013; Ruuska, 2012; KIPPRA, 2010; Nyang,
1999; GoK, 1997).

26
The price of charcoal has been increasing gradually over the years with Nyang (1999) reporting prices to
be KES 4-5 (USD 0.08-0.10)6 per kg in 1995 and KFS (2013) reporting KES 56 (USD 0.64) per kg in 2013.
This indicates that the price of charcoal increased six-fold in a span of 14 years. Siemens (2017) also
reports that the price of a 4-kg pack of charcoal has progressively increased from KES 67 (USD 0.77)7 in
January 2013 to KES 82 (USD 0.79)8 in June 2017. However, Bailis et al. (2017) caution that if the price is
inflation-adjusted, then it registers a marginal increase in the price over this period.
Energy consumes a substantial part of household budget, especially for very low-income group which
Siemens (2017) reported could spend up to 43% of their income on energy. Wambua (2011) in a study in
Kakamega County observed that the absolute household expenditure on energy increases with income
while the proportion (percentage relative to income) of money spent on energy reduces with increase in
income (Table 4.6).
Table 4.6: Households energy expenditure based on income quartiles
Household characteristics Ultra-poor Poor Non-poor Well-off Average HH size 6.4 5.8 5 4.5 5.5
Annual HH expenditure (KES ‘000) 76.7 111.8 144.0 219.8 130.8
HH annual energy budget (KES ‘000) 5.2 7.5 8.5 13.5 7.7
HH energy share of budget (%) 8.0 6.8 6.0 6.1 6.9
Source: Wambua, 2011
4.6.2 Access to alternative energy sources
Apart from woodfuel, there are other fuels available in the Kenyan energy market. These include
kerosene, LPG, biogas, electricity and bioethanol (Dalberg, 2018; KIPPRA, 2010). Kerosene is considered
the cheapest fuel in the country and is indeed the primary fuel for 70-80% of the poor slum population
in Nairobi (Dalberg, 2018; Bizzarri, 2010). LPG is considered too expensive for majority of Kenyans
because of the high cost of the cylinder, burners and refilling the gas (Dalberg, 2018; Bizzarri, 2010;
UNEP, 2006). Electricity adoption has always been hampered by low penetration rate and high cost of
connection to the national grid, as well as high consumer tariffs (Nyang, 1999). Finally, cooking with
bioethanol would be relatively cheaper than most fuels in the market, apart from kerosene, if it was put
6 In 1995, $1= KES 51 7 In 2013, $1= KES 87 8 In 2017, US$1= KES 103

27
under a favourable tax regime like other fuels (Dalberg, 2018). Briquettes are another source of biomass
energy used for cooking and heating and saved 30% and 70% of income spent on cooking energy,
depending on whether the households produced or purchased them (Njenga et al., 2013b). They were
made by women and youth groups mainly located in low-income urban settlements using charcoal dust
collected from charcoal trading sites. The briquettes burn cleaner and more evenly than firewood and
charcoal depending on the raw materials used (Njenga et al., 2013c). Several factors influence the
choice of a household’s energy. They include:
• Level of income: with increase in level of income, households switch from lower quality fuels like
firewood and crop residue to cleaner fuels like LPG and charcoal (Mwangi, 2013; KIPPRA, 2010; GoK,
1997). The vice versa is also true if the household income situation deteriorates.
• Household size: as household size increases, energy demand rises, and households may switch to
lower quality and cheaper energy sources to meet the overall demand at the least cost (Wambua,
2011; KIPPRA, 2010; GoK, 1997).
• Cost of alternatives: The cost of cooking technology/options and fuel is a key determinant if a
household adopts an alternative energy source or not (KIPPRA, 2010; PISCE, 2010). For example,
since the initial cost of investment in the LPG cylinder and cooker is so high, acting as a barrier poor
potential user (Dalberg, 2018; Mwangi, 2013; Karekezi et al., 2008). Moreover, Kariuki and Mutinda
(2017) reported that the higher the cost of an improved cookstove, the lower its penetration as many
people would not afford it. Boulkaid (2015) further affirms that the cost of many modern fuels like
LPG is so high compared to solid biomass fuels that many rural households in Nyeri are forced to stick
to the latter.
• Accessibility: Households adopt energy sources they can easily access when and where they need
them. For example, one of the reasons kerosene and charcoal have high usage in Nairobi is because
they are easily accessible to the population. Dalberg (2018) reports that there are over 1,500
kerosene dispensing points in Nairobi, while most people live within 50-150 m from a charcoal
vendor. For the same reason, Mwangi (2013) reported that in Mukaro, Nyeri County, LPG was not
readily available in the shopping centres and most households had to travel to town to access it,
hence few people adopted it. Zschauer (2012) also attributed the lower rate of adoption of energy-
saving charcoal stoves in Taita Taveta County was because they were not readily available in the local
markets.
• Education level: the level of education of the household head has been found to be directly related
to adoption of cleaner energy resources (Mwangi, 2013; Wambua, 2011; KIPPRA, 2010). More

28
educated household heads easily understand the problems associated with use of low-quality fuels
and thus easily switch to cleaner fuels when the situation allows (Onekon and Kipchirchir, 2016;
KIPPRA, 2010). Higher education is also associated with better chances of accessing better
employment opportunities, and with the income, such household heads can afford the more
expensive energy alternatives (Wambua, 2011).
5. Charcoal-Related Sustainability Issues
5.1 Deforestation and forest degradation
Charcoal production has been blamed for rampant deforestation, especially in forested lands close to
major urban centres (UNEP, 2006; Mbugua, 2005). Onekon and Kipchirchir (2016) estimated that
production of one bag of charcoal depletes 0.35 ha of forest cover while KFS (2013) estimates that
production of one tonne of charcoal using the highly inefficient earth mound kilns leads to loss of 0.1 ha
of forest cover. Based on the 0.35 ha depletion assumption, Onekon and Kipchirchir’s (2016) estimates
that charcoal consumption in Nairobi alone leads to loss of 15,175 ha of forest cover annually. Since
Nairobi accounts for 10% of charcoal consumption in the country (KFS, 2013) this means that charcoal
production for the entire country leads to depletion of 151,750 ha of forest cover annually. This
estimate is about 10 times that reported by Iiyama et al. (2013) of 871,712 ha and over three times that
reported by UNEP (2006) of 50,000 ha. These are huge discrepancies and more research is required if
the real contribution of charcoal to deforestation and forest degradation are to be known and
appropriate mitigation measures instituted.
Clearing vegetation for charcoal production has several negative impacts to the ecosystems and the
environment. Some of the impacts are: loss of biodiversity; loss of animal habitat; loss of ecosystem
services like food, pasture, shade, climate modulation etc; land degradation through exposure to agents
of erosion, and; GHG emissions that leads to global warming and climate change (Kadenyi, 2017; Sola et
al, 2017; Wanjala et al., 2015; Ngaira and Omwayi, 2012; Tesot, 2012; Zschauer, 2012; Mugo and Gathui,
2010; wa Gathui and Ngugi, 2010; Bailis, 2009). Vegetation clearance for charcoal production can be

29
through clear felling where all the trees are felled regardless of species or size, and; selective logging
where only trees from preferred species and size are felled (Ndegwa et al., 2018). but both approaches
are detrimental to ecosystem health.
Clear felling is mostly practised where forest land is being opened up for agricultural activities, especially
in Narok and Kajiado areas (Kipsisei, 2011; Bailis, 2005; Mutimba and Barasa, 2005). Unless the agricultural
land is left fallow after several years of farming, and trees allowed to regenerate, clear felling usually leads
to permanent deforestation and land use change (Ndegwa et al., 2018; FAO, 2017). Bailis (2005) reported
that forest loss driven by agricultural expansion and charcoal production has led to total loss of vegetation
cover in the high potential uplands of Narok and a reduction in vegetative cover in low potential shrubland
and woody savannah areas. Ndegwa et al., 2018; FAO, 2017).
The impact of selective logging depends on the amount of wood harvested, which is commensurate with
the number and size of preferred tree species available in an area (Ndegwa et al., 2016a). Selective
logging for charcoal, however, leads to forest degradation (Kiruki et al, 2016; Ndegwa et al., 2016a) as
the remnant forest or woodland has lower species diversity and evenness (FAO, 2017; Ndegwa et al.,
2016a).
The residual forest is also predominantly composed of low-value softwood species and small saplings that
are not suitable for charcoal production (Ndegwa et al., 2018; Otuoma et al., 2011; Mugo and Gathui,
2010). This change in composition could impair ecosystem functions, resilience and productivity (Iiyama
et al., 2014). Ndegwa (2018) estimated that a dry woodland in Kitui County degraded through selective
logging for charcoal production would take 25 – 31 years to recover when no biomass is harvested.
Deforestation and forest degradation are exacerbated by poor natural regeneration in the dry lands
which is hampered by harsh climatic conditions and exposure to browsing livestock (Ndegwa et al.,
2016a; Kadenyi, 2017; Tesot, 2012; Muchiri, 2008). In addition, many residents of ASALs in Kenya do not
have the culture of planting trees for woodfuel in their farmlands, but rather rely on naturally
regenerated trees (Luvanda et al, 2016; Kadenyi, 2017; Ndegwa 2010; Mutimba and Barasa, 2005). For

30
these reasons, if wood harvesting is not properly managed, charcoal production could essentially lead to
desertification in the ASALs (Kadenyi, 2017; Ngaira and Omwayi, 2012).
Other constraints to production of sustainable woodfuels in farmlands, including charcoal, are: low
adoption of agroforestry practices such as woodlots due to competing land uses; unfavourable weather
conditions; insecure land tenure; lack of awareness on forest restoration; low availability of fast-growing
tree species for woodfuel; unsatisfactory economic turnover; low rates of return and the time factor in
investing in trees for woodfuel (Luvanda et al, 2016; MENR, 2013b; Delahunty-Pike, 2012; wa Gathui and
Ngugi, 2010).
5.2 Climate change, GHG emissions and health outcomes
Kenya is a party to the UN Framework Convention on Climate Change, which commits to avoidance of
any increase in GHGs into the atmosphere (UNEP, 2006). However, use and production of biomass fuels
in the country leads to emission of approximately 35 MT CO2eq into the atmosphere which is about 30-
40% of the country’s total GHG emission (Dalberg, 2018). Even though wood is considered a renewable
resource when it is sustainably harvested, inefficient charcoal production and consumption leads to
emissions of GHG into the atmosphere (FAO, 2017). The gases include, CO2, CO, N2O, NOx, CH4, NMHCs
and PMs, and have a range of negative impacts on human health and the environment (UNEP, 2006).
GHG emissions in the charcoal value chain occur during wood harvesting, wood carbonization, charcoal
and wood transportation, and charcoal consumption.
FAO (2017) reports that 1.4-4.4 kg of CO2e (global warming potential {GWP}) per MJ are emitted in the
charcoal value chain. On average, 29-61% of these emissions occur at the wood harvesting stage, 28-
61% at the carbonization stage and 9-18% at the consumption stage (FAO, 2017). Emissions during
transportation and distribution are minimal. Due to use of inefficient carbonization and combustion
technologies, charcoal has 5-10 times the global warming impact of firewood and is roughly five times
worse than many fossil fuels (Bailis, et al., no date).

31
FAO (2017) estimated a GHG maximum emission value of 5.7-9 kgCO2 eq9 per kg of charcoal produced
from very unsustainable and inefficient processes including forest degradation and deforestation. Based
on this emission rate, the GHG emissions associated with production of charcoal (based on 2.5 million
tonnes consumption) in Kenya is about 16.8 kgCO2e. This figure is comparable to the Njenga et al. (2013)
estimate that GHG emissions from the Kenyan charcoal sector ranges from 14.4 to 21.6 million tonnes
per annum. Adopting efficient carbonization kilns can reduce the GHG emissions by 4,541 g CO2e per kg
of charcoal produced (an 80% reduction) for a 100-year global warming potential (GWP) (FAO, 2017).
Thus, GHG emissions can be reduced by 86% in the charcoal value chain through technological
interventions in sustainable wood production, use of alternative sources of biomass energy, briquetting
tree and crop wastes, improved kilns, cogeneration of charcoal and electricity, reducing fossil fuel in
transportation and use of improved cook stoves (FAO, 2017). For instance, use of Acacia mearnsii
plantation that has capacity to regrow integrated with improved kilns and briquette production from the
charcoal dust reduces GWP by 75% compared to naturally growing woodlands combined with low
efficient kilns and disposal of charcoal dust (Njenga et al., 2014).
At the consumption stage, shift from traditional to improved stoves could reduce GHG emissions by 63%
(FAO, 2017). The use of improved cook stoves (ICS) has the potential to reduce household charcoal
consumption by up to 50%, and with it the wood-for-charcoal demand which leads to a reduction in
GHG emissions (Boulkaid, 2015; Ndegwa, 2010; Mugo and Gathui, 2010). For example, Njogu and Kungu
(2015) reported that adopting the Kenya Ceramic Jiko (KCJ), an improved metallic cookstove with a
ceramic liner, led to a 42% reduction in charcoal consumption and savings of around 600 kg of charcoal
per household per annum. This demonstrates the huge potential of improved cookstoves in reduction of
the quantity of charcoal consumed and consequently, the wood demand for carbonization. This would
in turn lead to reduced GHG throughout the entire charcoal value chain.
The GHG emitted during charcoal production and use poses a considerable health risk to the people
under exposure (FAO, 2017). The impact may range from simple respiratory infections to serious chronic
illnesses like asthma, emphysema bronchitis and cancer (Dalberg, 2018; UNEP, 2006). Studies indicate
9 Estimate at 20-year global warming potential

32
that households using unimproved charcoal stoves are typically exposed to particulate matter (PM10)
concentrations of about 500 micrograms per m3, while those using firewood in open fires have PM10
concentrations of more than 3,000 micrograms per m3 (Bailis et al., 2004). Similar work by Njenga et al.,
(2017) found indoor concentration of fine particulate matter (PM2.5) from cooking with firewood to be
over 100 times higher than charcoal (Njenga et al., 2017). PM2.5 is a common and useful indicator of the
risk associated with exposure to a mixture of pollutants from diverse sources (Lim, et al., 2012) and in
this respect it is safer for households to cook with charcoal. This could thus reduce the more than 50%
of deaths that occur among children under five, due to pneumonia from ALRI, caused by particulate
matter (soot) from household air pollution (WHO, 2016).
Dalberg (2018) reports that about 8-10% of early deaths in Kenya are as a result of indoor air pollution
from charcoal and wood emissions while cooking. Moreover, health complications resulting from indoor
air pollution exacerbates poverty among the poor through reduced labour productivity and exerts
pressure on their meagre income resources while seeking treatment (UNEP, 2006). However, there are
consequences related to wood wastage in converting firewood to charcoal in traditional earth mound
kilns. For instance, a kiln with 14% efficiency requires 72% more feedstock to produce charcoal to a cook
meal compared to cooking with firewood in the three stone fire (Njenga et al., 2017). The wood wastage
could be reduced through use of more efficient kilns. Cooking with more efficient stoves can help reduce
indoor air pollution as well as fuel wastage.

33
6. Gender Aspects in the Woodfuel Sector
Gender refers to socially constructed roles and relations between men and women. These vary between
cultures, ethnicity and socio-economic class (Muchiri, 2008). The gender aspect in energy access and use
cannot be overlooked, since fuel sourcing is primarily regarded as a responsibility of woman with some
assistance from the children (Zschauer, 2012; wa Gathui and Ngugi, 2010; Nyang, 1999). For example,
Mwangi (2006) reported that in 98% of the households in Mukaro Location, Nyeri County, fuelwood was
collected by women who were assisted by children.
Generally, men control exploitation of natural resources in many African societies, Kenya included
(Delahunty-Pike, 2012; Nyang, 1999). Since men set the agenda on what is to be prioritized at the
national, community and household level, woodfuel being the domain of women and children has rarely
received much attention (Mwangi, 2013; Muchiri, 2008; Nyang, 1999). At the household level, land
ownership is bestowed to men in many cultures and therefore they control which trees can be planted
and when they can be harvested (Delahunty-Pike, 2012; Zschauer, 2012; Muchiri, 2008). This
domination by men does not only have a negative impact on fuel access by women, but also limits
access to economic benefits from tree resources (Delahunty-Pike, 2012). Women therefore have less
voice insofar as wood resources management is concerned but they are the ones who are seriously
affected by energy access challenges (Muchiri, 2008).
The gender disparity is also reflected in the national energy access stage where more female-headed
households rely on woodfuel as a primary fuel (GoK, 2011), with 81% using firewood compared to 68.1%
for male-headed households (Muchiri, 2008). In addition, a higher percentage of male-headed
households are connected to electricity than the female-headed households (Muchiri, 2008). In some
cases, men are also involved in fuelwood sourcing especially when physical strength is needed to fell
large trees or transport heavy loads over long distances (Delahunty-Pike, 2012; Kiefer and Busman,
2008; Nyang, 1999). This happens as it is generally accepted that women are physically weaker and
cannot cope with highly physical activities (Delahunty-Pike, 2012). Apart from such circumstances, men
and boys mostly engage in woodfuel activities that have economic returns like charcoal production
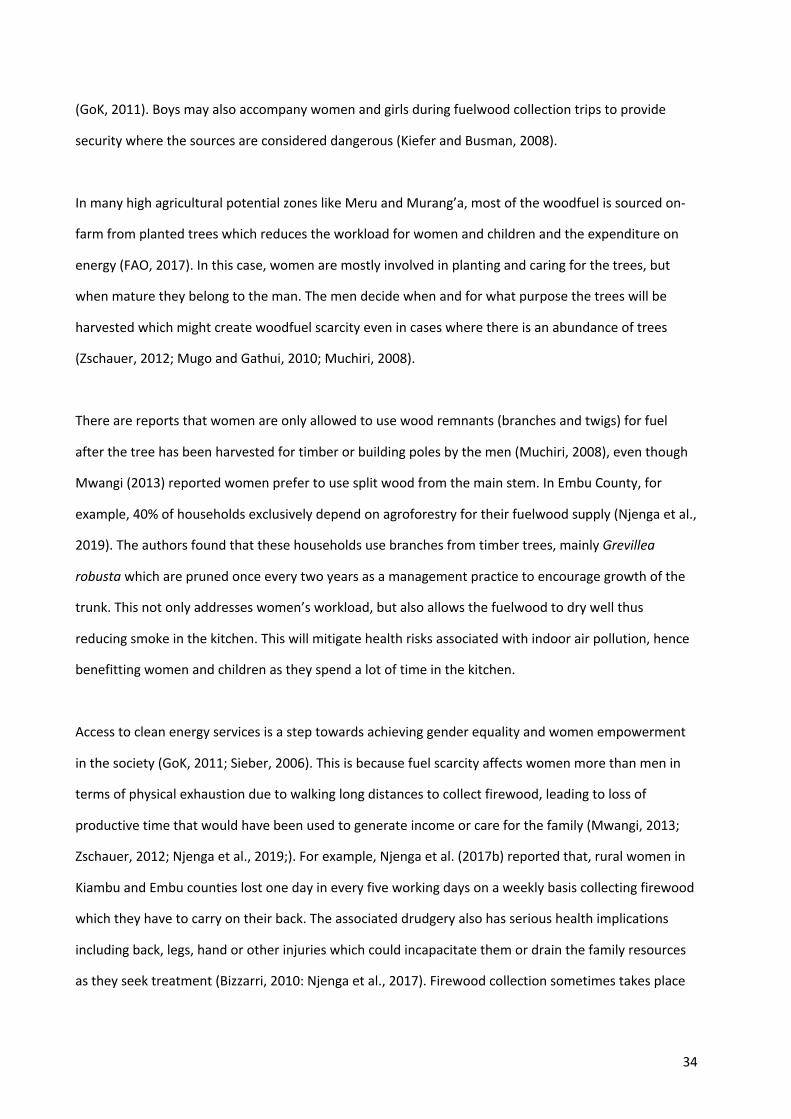
34
(GoK, 2011). Boys may also accompany women and girls during fuelwood collection trips to provide
security where the sources are considered dangerous (Kiefer and Busman, 2008).
In many high agricultural potential zones like Meru and Murang’a, most of the woodfuel is sourced on-
farm from planted trees which reduces the workload for women and children and the expenditure on
energy (FAO, 2017). In this case, women are mostly involved in planting and caring for the trees, but
when mature they belong to the man. The men decide when and for what purpose the trees will be
harvested which might create woodfuel scarcity even in cases where there is an abundance of trees
(Zschauer, 2012; Mugo and Gathui, 2010; Muchiri, 2008).
There are reports that women are only allowed to use wood remnants (branches and twigs) for fuel
after the tree has been harvested for timber or building poles by the men (Muchiri, 2008), even though
Mwangi (2013) reported women prefer to use split wood from the main stem. In Embu County, for
example, 40% of households exclusively depend on agroforestry for their fuelwood supply (Njenga et al.,
2019). The authors found that these households use branches from timber trees, mainly Grevillea
robusta which are pruned once every two years as a management practice to encourage growth of the
trunk. This not only addresses women’s workload, but also allows the fuelwood to dry well thus
reducing smoke in the kitchen. This will mitigate health risks associated with indoor air pollution, hence
benefitting women and children as they spend a lot of time in the kitchen.
Access to clean energy services is a step towards achieving gender equality and women empowerment
in the society (GoK, 2011; Sieber, 2006). This is because fuel scarcity affects women more than men in
terms of physical exhaustion due to walking long distances to collect firewood, leading to loss of
productive time that would have been used to generate income or care for the family (Mwangi, 2013;
Zschauer, 2012; Njenga et al., 2019;). For example, Njenga et al. (2017b) reported that, rural women in
Kiambu and Embu counties lost one day in every five working days on a weekly basis collecting firewood
which they have to carry on their back. The associated drudgery also has serious health implications
including back, legs, hand or other injuries which could incapacitate them or drain the family resources
as they seek treatment (Bizzarri, 2010: Njenga et al., 2017). Firewood collection sometimes takes place

35
in isolated and dangerous places which exposes the women and girls to sexual and gender-based
violence (Bizzarri, 2010; Gikonyo, 2004).
In times of absolute scarcity of woodfuel, households are forced to adopt negative coping strategies like
cooking approaches that compromise their nutrition intake or use low quality or unhealthy fuels like
crop residue and plastics which expose the family to poisonous fumes (FAO, 2017; Zschauer, 2012;
Muchiri, 2008; UN-DESA, 2004). Some of the negative coping strategies include changing diets to less
energy demanding foods; undercooking food or skipping meals to save fuel; eating raw food; and
bartering food and other household assets for fuel (Sola et al, 2016; Zschauer, 2012; Bizzarri, 2010). Girls
are also more involved in fuel-sourcing compared to boys, which means that they lose valuable time
which could have been better invested in their academics or even in socialising (Zschauer, 2012; Bizzarri,
2010; Muchiri, 2008). This has an impact on their social development, and essentially limits future
income-generating opportunities at their disposal (Sieber, 2016; Delahunty-Pike, 2012; Zschauer, 2012;
GoK, 2011).
Addressing challenges in accessing energy would contribute to gender equality and improve the
wellbeing of women and girls. For instance, through reduced drudgery, and time saved could be
invested in self and family empowerment, education, social and economic activities. There would be
reduced health risks from physical injuries from carrying heavy loads while families could cook the food
types of their preference.
7. Conclusion and Recommendations
This working paper has given a detailed account of the status of woodfuel value chains in Kenya over the
past two decades based on literature published between 1999 and 2018. Throughout the years there is
consistent literature that summarizes woodfuel value chains. Here we synthesise key issues on
outcomes, impacts, gaps and opportunities in order to inform future research and highlight evidence-
based recommendations for sustainable woodfuel value chains in Kenya.

36
Woodfuel in the form of charcoal will remain one of the most important energy sources for millions of
people in Kenya and Sub-Saharan Africa in general. With increased urbanization, demand will increase
even more over the coming decades. Therefore, more investment and support for sustainable sourcing,
production and trade in woodfuel is crucial (MENR, 2013b).
Charcoal production and trade is a livelihood issue. The charcoal sub-sector is one of the most
important sources of employment and income. Although up-to-date figures are not readily available, the
sub-sector has been supporting and benefitting millions of people (Mutimba and Barasa, 2005; KFS,
2013a). Yet it does not feature highly in the national socio-economic development agenda.
Most of the charcoal, is produced in highly inefficient earth mound kilns requiring as much as 10
tonnes of wood for just one tonne of charcoal. Yet very few initiatives have been mooted, let alone
rolled out to develop and scale out efficient charcoal kilns. Improving stove efficiency is quite noble and
comes with important health outcomes. However, failure to reduce tree cutting by improving
carbonization, will see trees continue to be cut at unnecessarily high rates, thus increasing GHG
emission.
Inadequate energy access, women and girls lose productive time fetching firewood in degraded
landscapes and are the ones exposed to PM which cause respiratory diseases and fatalities; skipping
melas and poorly cooked food contribute to poor nutrition, especially for children, Thus it is imperative
that energy access should be improved to free women for more productive engagement, as well as save
lives.
Charcoal consumption transcends wealth classes and the Energy Ladder Theory does not hold.
Although charcoal is relatively cheap for low income households, it is also preferred by the wealthier for
cooking (Mbugua, 2005; Ndegwa, 2010; IEA, 2015; Dalberg, 2018). Thus, there is no complete transition
from traditional to cleaner energy sources but energy stacking, depending on the circumstances
(income, type/quantity of meal, etc.) (Dalberg, 2018). Therefore, elimination of woodfuel will remain a
fallacy for a long time. This means there is need to invest in making production and consumption more
efficient, cleaner and sustainable.

37
Unfortunately, the sub-sector is inadequately governed and supported, even with a market value
estimated in the billions, it is beset with illegality and registers billions in revenue losses, while
corruption-related activities account for as much as 30% of the final charcoal retail price. Better
governance and institutional mechanisms, plus incentives to improve enforcement and compliance are
urgently required if the sector is to contribute to both woodfuel value chain actors’ income and the
national economy.

38
8. References
Angelsen A., Jagger P., Babigumira R., Belcher B., Hogarth N. J., Bauch S., ... & Wunder S. (2014).
Environmental income and rural livelihoods: a global-comparative analysis. World Development,
64, S12-S28.
Bailis R., Wang Y., Drigo R., Ghilardi A., Masera O. (2017). Getting the numbers right: revisiting woodfuel
sustainability in the developing world. Environmental Research Letters 12. DOI:
doi.org/10.1088/1748-9326/aa83ed.
Bailis R. (2009). Modelling climate change mitigation from alternative methods of charcoal production in
Kenya. Biomass and Bioenergy 33:1491–1502.
Bailis R. (2005). Fuel from the Savanna: The Social and Environmental Implications of the Charcoal Trade
in Sub-Saharan Africa. PhD Thesis. University of California, Berkeley, USA.
Bailis R., Pennise D., Ezzati M., Kammen D.M., Kituyi E. (No date). Impacts of greenhouse gas and
particulate emissions from woodfuel production and end-use in Sub-Saharan Africa. Energy and
Resources Group, University of California, Berkeley, CA, USA
Bar R., Ehrensperger A. (2018). Accounting for the boundary problem at subnational level: The supply–
demand balance of biomass cooking fuels in Kitui County, Kenya. Resources 7 (1).
doi:10.3390/resources7010011.
Birdlife International (2013). Biodiversity Status and Trends Report for the Eastern Arc Mountains and
Coastal Forests of Kenya and Tanzania Region, 2012. Birdlife International – Africa Partnership
Secretariat, Nairobi.
Bizzari M. (2010). Safe access to firewood and alternative energy in Kenya: An appraisal report. Rome,
World Food Program of the United Nations (WFP).
Boulkaid Y. (2015). Quantifying the Potential Impact of Improved Stoves in Nyeri County, Kenya. Master
Thesis. KTH Royal Institute of Technology, Stockholm, Sweden.
Burrow E., Mogaka H. (2007). Kenya’s drylands – wastelands or an undervalued national economic
resource. IUCN - The World Conservation Union, Eastern Africa Regional Office, Nairobi.

39
Butynski T.M., de Jong Y.A. (2016). South Western Mau Forest Reserve Game-proof Barrier Feasibility
Study. Nairobi, Initiative for Sustainable Landscapes (ISLA).
Chabeda-Barthe J. (2013). Are rural women to blame for misusing wood for livelihood and household
use in Burnt Forest Area, Kenya. Paper presented at the Rural History 2013 Conference at the
University of Bern from 19-22 August 2013. Bern, European Rural History Organization (EURHO).
Cheboiwo J.K. (2016). Private forestry sector in Kenya: status and potential. AFF Report. Nairobi, African
Forest Forum.
County Government of Kitui (2018). County fiscal strategy paper (2018/19). County Government of Kitui,
County Treasury. Kitui.
Dalberg (2018). Scaling up clean cooking in urban Kenya with LPG & Bio-ethanol: A market and policy
analysis. Nairobi, Dalberg Research.
Delahunty-Pike A. (2012). Gender equity, charcoal and the value chain in western Kenya: Working brief
prepared for PISCES by Practical Action Consulting. Practical Action, Nairobi, Kenya.
DFID (2002). Historical Framework: Major events that have affected inter-fuel substitution in Kenya from
1960s to Present. London, Department for International Development (DFID).
FAO (2017). The charcoal transition: Greening the charcoal value chain to mitigate climate change and
improve local livelihoods. Rome, Food and Agriculture Organization of the United Nations.
wa Gathui T., Mugo F., Ngugi W., Kamau S. (2012). The Kenya Charcoal Regulations Pocketbook.
Prepared for PISCES by Practical Action Consulting. Practical Action, Nairobi, Kenya.
wa Gathui T, Ngugi W. (2010). Bioenergy and poverty in Kenya: Attitudes, actors and activities. Working
paper prepared for PISCES by Practical Action Consulting. Practical Action, Nairobi, Kenya.
Gikonyo J.M. (2004). The effects of biomass energy use by rural households in a dryland environment –
case study of Mwingi District. Master Thesis. University of Nairobi, Kenya.
GLPGP (2013). Kenya Market Assessment. Nairobi, The Global LPG Partnership (GLPGP).
GoK (2018). A report on forest resources management and logging activities in Kenya: findings and
recommendations. Ministry of Environment and Forestry, Nairobi.

40
GoK and UNDP (2016). Access to clean energy in rural Kenya through innovative market-based solutions.
Nairobi, Government of the Republic of Kenya (GoK) and United Nations Development
Programme (UNDP).
GoK (2016). Sustainable Energy for All (Se4all). Kenya Action Agenda. Nairobi, Government of the
Republic of Kenya.
GoK (2011). Scaling-up renewable energy program (SREP) investment plan for Kenya. Nairobi,
Government of the Republic of Kenya (GoK).
GoK (2004). Sessional paper no. 4 on energy. Nairobi, Ministry of Energy.
GoK (1997). National land degradation assessment and mapping in Kenya. Nairobi, Government of the
Republic of Kenya.
Hosier R. (1985). Energy use in rural Kenya: Household demand and rural transformation. Stockholm,
Beijer Institute.
IEA (2015). Situational analysis of energy industry, policy and strategy for Kenya. Nairobi, Institute of
Economic Affairs (IEA).
Iiyama M., Neufeldt H., Njenga M., Derero A., Ndegwa G., Mukuralinda A., Dobie P., Jamnadass R.,
Mowo J. (2017). Conceptual Analysis: The Charcoal-Agriculture Nexus to Understand the Socio-
Ecological Contexts Underlying Varied Sustainability Outcomes in African Landscapes. Frontiers in
Environmental Science 5: 31. doi: 10.3389/fenvs.2017.00031.
Iiyama M., Chenevoy A., Otieno E., Kinyanjui T., Ndegwa G., Vandenabeele J., Njenga M., Johnson O.
(2014). Achieving sustainable charcoal in Kenya: Harnessing the opportunities for cross-sectoral
integration. Nairobi, World Agroforestry (ICRAF) and Stockholm Environment Institute (SEI).
Iiyama M., Neufeldt H., Dobie P., Njenga M., Ndegwa G., Jamnadass R. (2014a). The potential of
agroforestry in the provision of sustainable wood fuel in sub-Saharan Africa. Current Opinion in
Environmental Sustainability 6, pp 138-47.
Kadenyi N. (2017). Assessment of socioeconomic importance of roadside tree planting in arid and semi-
arid areas: Case study at Kathome/Kawongo, Kitui County. Master Thesis. South Eastern Kenya
University.
KFS (2014). Drylands forest livelihoods. Factsheet no. 2: Charcoal. The Kenya Forest Service. Nairobi.

41
Karekezi S., Kimani J., Onguru O. (2008). Energy access among the urban poor in Kenya. Energy for
Sustainable Development 7(4):38-48.
Kariuki J.W., Mutinda J. (2017). Assessment of the contribution firewood conservation stove in
sustainable use of wood fuel energy in Embu North Sub–County, Kenya. International Journal of
Scientific and Research Publications 7(11): 599-605.
Kendagor, L.K., Prevost, R.J. (2013). Energy diversity and development in Kenya: Kenya: National
Defense University (NDU).
Kenya Land Alliance (2015). Land use in Kenya: The case for a national land use policy. Nairobi, Kenya
Land Alliance.
Kiefer S., Bussmann R.W. (2008). Household energy demand and its challenges for forest management
in the Kakamega area, Western Kenya. Ethnobotany Research & Applications 6:363-371.
Kiruki H.M., van der Zanden M.H., Malek Z., Verburg P.H. (2016). Land cover change and woodland
degradation in a charcoal-producing semi-arid area in Kenya. Land Degradation & Development.
DOI: 10.1002/ldr.2545.
KFS (2013). Analysis of the charcoal value chain in Kenya. A report commissioned by the Kenya Forest
Service (KFS), coordinated by the National REDD+ Coordinating Office (NRCO) and carried out by
Camco Advisory Services (Kenya) Limited. Nairobi, Kenya.
KFS (2017). Forest law enforcement and governance in Kenya. A paper prepared for the East African
Community-led regional process in the framework of the Ministerial Declaration, Yaoundé,
Cameroon, October 16, 2003 on the Africa Forest Law Enforcement and Governance (AFLEG).
Nairobi, Kenya Forest Service (KFS).
Kenya National Bureau of Statistics (KNBS). (2007). Basic report on well-being in Kenya based on Kenya
Integrated Household Budget Survey – 2005/06. Nairobi, Kenya National Bureau of Statistics
(KNBS).
Kenya National Bureau of Statistics (KNBS). (2018). Report on well-being in Kenya based on Kenya
Integrated Household Budget Survey – 2015/16. Nairobi, Kenya National Bureau of Statistics
(KNBS).

42
Kenya National Bureau of Statistics (KNBS). (2010). The Kenya 2009 Population and Housing Census
Population Distribution by Administrative Units: Volume 2. KNBS, Nairobi, Kenya.
KIPPRA (2010). A comprehensive study and analysis on energy consumption patterns in Kenya: A
synopsis of the draft final report. Nairobi, Kenya Institute for Public Policy Research and Analysis
(KIPPRA).
Kipsisei G.C. (2011). Environmental degradation and social conflict in Trans Mara District, South Rift
Valley of Kenya. Master Thesis. University of Nairobi, Kenya.
Lim S.S., Vos T., Flaxman A.D., Danaei G., Shibuya K., Adair-Rohani H., Ezzati, M. (2012). A comparative
risk assessment of burden of disease and injury attributable to 67 risk factors and risk factor
clusters in 21 regions, 1990–2010: a systematic analysis for the Global Burden of Disease Study
2010. Lancet, 380(9859), 2224–2260. http://doi.org/10.1016/S0140-6736(12)61766-8.
Luvanda A.M., Kitheka E., Oduor N., Kyalo E.M., Githiomi J. (2016). Impact and assessment of charcoal
marketing system through community associations in Kitui County, Kenya. Octa Journal of
Environmental Research, 4(2), 086–091.
Mbugua G. (2005). Energy sources in Kenya: Implications for forests. Wajibu 20 (2):10-11.
MENR (2015). Widening informed stakeholder engagement in REDD+: Charcoal and REDD+ in Kenya.
Ministry of Environment and Natural Resources. Republic of Kenya, Nairobi.
MENR (2013b). Analysis of demand and supply of wood products in Kenya. Nairobi Ministry of
Environment, Water and Natural Resources (MENR).
Ministry of Energy (MoE), Government of Kenya, (2002). Study on Kenya’s Energy Demand, Supply and
Policy Strategy for Households, Small Scale Industries and Service Establishments. Final Report for
the Ministry of Energy. May, Kamfor Company Ltd.
Muchiri L. (2008). Gender and equity in bioenergy access and delivery in Kenya. Working paper prepared
for PISCES by Practical Action Consulting. Practical Action, Nairobi, Kenya.
Mugo F., Gathui T. (2010). Biomass energy use in Kenya. A background paper prepared for the
International Institute for Environment and Development (IIED) for an international ESPA
workshop on biomass energy, 19-21 October 2010, Parliament House Hotel, Edinburgh. Practical
Action, Nairobi, Kenya.

43
Musembi F.J., Nandokha T., Njeru P., Mbure G.H., Matere S., Emongor R. (2010). Baseline study on
status of biofuel technology in Kajiado and Kisii regions. Paper presented at the 12th KARI Scientific
Conference Proceedings 2010. Nairobi, Kenya Agricultural Research Institute (KARI).
Mutimba S., Barasa M. (2005). National charcoal survey: Summary report. Exploring the potential fora
sustainable charcoal industry in Kenya. Nairobi: Energy for Sustainable Development Africa
(ESDA).
Mwangi V.W. (2013). Energy consumption among rural households in Mukaro Location of Nyeri County,
Kenya. Master Thesis. University of Nairobi, Kenya.
Ndegwa G.N. (2010). Woodfuel value chains in Kenya and Rwanda: Economic analysis of the market
oriented woodfuel sector. Master Thesis. Cologne University of Applied Sciences, Germany.
Ndegwa G.M., Nehren U., Anhuf D., Iiyama M. (2018). Estimating sustainable biomass harvesting level
for charcoal production to promote degraded woodlands recovery: A case study from Mutomo
District, Kenya. Land Degradation & Development 29 (5): 1521-1529. DOI: 10.1002/ldr.2938.
Ndegwa GM. (2017). Evaluating dry woodlands degradation and on-farm tree management in Kenyan
drylands. PhD Thesis. University of Passau, Germany.
Ndegwa G., Nehren U., Grüninger F., Iiyama M., Anhuf D. (2016a). Charcoal production through selective
logging leads to degradation of dry woodlands: a case study from Mutomo District, Kenya. J Arid
Land 8(4): 618–631. doi: 10.1007/s40333-016-0124-6.
Ndegwa G.M., Anhuf D., Nehren U., Ghilardi A., Iiyama M. (2016b). Charcoal contribution to wealth
accumulation at different scales of production among the rural population of Mutomo District in
Kenya. Energy for Sustainable Development 33:167-175. Doi: 10.1016/j.esd.2016.05.002
Ndegwa G., Breuer T., Hamhaber J. (2011). Woodfuels in Kenya and Rwanda: powering and driving the
economy of the rural areas. Rural 21, the International Journal for Rural Development no. 2/2011.
Available at: www.rural21.com.
Ndegwa J. (2011). Bioenergy market system development: comparing participatory approaches in Kenya
and Sri Lanka. Working paper prepared for PISCES by Practical Action Consulting. Practical Action,
Nairobi, Kenya.

44
Ngaira J.K.W., Omwayi K. (2012). Climate change mitigation: Challenges of adopting the green energy
option in the Lake Victoria basin. International Journal of Physical Sciences 41: 5615-5623.
Ngetich K.A., Birech R.J., Bett K.E., Ereyer B. (2009). Caught between energy demands and food needs:
Dilemmas of smallholder farmers in Njoro, Kenya. Journal of Agriculture and Rural Development in
the Tropics and Subtropics 110 (1): 23-28.
Njenga M., Gitau J., Iiyama M., Jamnadass R., Mahmoud Y., Karanja N. (2019). Innovative biomass
cooking approaches for Sub-Saharan Africa. Afr. J. Food Agric. Nutr. Dev. 19(1):14066-14087
Njenga M., Karanja N., Karlsson H., Jamnadass R., Iiyama M., Kithinji J., Sundberg C. (2014). Additional
cooking fuel supply and reduced global warming potential from recycling charcoal dust into
charcoal briquette in Kenya. Journal of Cleaner Production. 81, 81-88
Njenga M., Karanja N., Munster C., Iiyama M., Neufeldt H., Kithinji J., Jamnadass R. (2013). Charcoal
production and strategies to enhance its sustainability in Kenya. Development in Practice, 23:3,
359-371, DOI:10.1080/09614524.2013.780529.
Njenga M., Mahmoud Y., Mendum R., Iiyama M., Jamnadass R., Roing de Nowina K., Sundberg C.,
(2017), Quality of charcoal produced using micro gasification and how the new cook stove works
in rural Kenya. Environ Research Letters, 12 (9).
Njenga M., Mendum R., Gitau J., Iiyama M., Jamnadass R., Watson C. (2017b). Trees on farms could
satisfy household firewood needs, The tree farmers magazine for Africa Issue No. 33: 20-23,
Better Globe Forestry Ltd, Nairobi, Kenya.
Njenga M., Yonemitsu A., Karanja N., Iiyama M., Kithinji J., Dubbeling M., Sundberg C., Jamnadass R.
(2013b). Implications of charcoal briquette produced by local communities on livelihoods and
environment in Nairobi, Kenya. International Journal of Renewable Energy Development (IJRED). 2
(1) 19-29.
Njoroge N. (2013). Influence of charcoal trade on the livelihoods of rural communities: a case of
Mitamisyi Location in Kusyo District of Kitui County. Master Thesis. University of Nairobi, Kenya.
Njogu P.K., Kungu J.B. (2015). Factors influencing adoption of woodfuel energy saving technologies in
Nakuru County, Kenya. International Journal of Science and Research (IJSR) 4(2): 1028-1036.

45
NL Agency (2010). Making charcoal production in Sub Sahara Africa sustainable. NL Agency, Utrecht, The
Netherlands.
Nyang, F.O. (1999). Household energy demand and environmental management in Kenya. PhD Thesis.
University of Amsterdam, The Netherlands.
Nyong’a E., Rajamani H., Carruthers A. (2018). An investigation of the environmental impact of rising
household energy demand in Kenya. Paper presented at the 16th International Conference on
Clean Energy (ICCE-201 8) 9-11 May 201 8, Famagusta, N. Cyprus.
Oduor N. (2012). Sustainable feedstock management for charcoal production in Kenya: Resources,
initiatives and options. Working brief prepared for PISCES by Practical Action Consulting. Practical
Action, Nairobi, Kenya.
Okoko A., Reinhard J., von Dach S.W., Zah R., Kiteme B., Owuor S., Ehrensperger A. (2017). The carbon
footprints of alternative value chains for biomass energy for cooking in Kenya and Tanzania.
Sustainable Energy Technologies and Assessments 22: 124–133.
Onekon W.A., Kipchirchir K.O. (2016). Assessing the effect of charcoal production and use on the
transition to a green economy in Kenya. Tropical and Subtropical Agroecosystems, 19: 327 – 335.
Opiyo F., Wasonga O., Nyangito M., Schilling J., Munang R. (2015). Drought adaptation and coping
strategies among the Turkana pastoralists of northern Kenya. Int J Disaster Risk Sci (2015) 6:295–
309.
Osawa B., Muchunku C. (2006). Energy conflicts in the Meru region. FWU 5: 31-41.
Otuoma J., Odera J., Bodo E., Ongugo P., Oeba V., Kamondo B. (2011). Annual allowable cut for
merchantable woody species in a community managed forest in western Kenya. Forest Ecology
and Management 262: 2281–2286.
Owen M. (2013). The legally compliant charcoal industry and its barriers to growth in Kenya. Nairobi,
Kenya Forest Service (KFS).
Ruuska E. (2012). The significance and sustainability of charcoal production in the changing landscape of
Dakatcha Woodland, SE Kenya. Master Thesis. University of Helsinki, Finland.
Sepp (No date). Analysis of charcoal value chains general considerations. Eco Consulting Group –
Germany.

46
Sieber P. (2016). Implications of improved biofuel management for climate change: An LCA-based
evaluation of biochar and charcoal in Kenyan smallholder farming. Master thesis, University of
Natural Resources and Life Sciences Vienna (BOKU).
Siemens J. (2017). Exploring the feasibility of a biomass briquette enterprise with a youth cooperative in
Nairobi. University Project. University of Victoria, Canada.
Sola P., Ochieng C., Yila J. et al. (2016). Links between energy access and food security in sub Saharan
Africa: an exploratory review. Food Sec. (2016) 8: 635. doi:10.1007/s12571-016-0570-1.
Sola P., Cerutti P.O., Zhou W., et al. (2017). The environmental, socioeconomic, and health impacts of
woodfuel value chains in Sub-Saharan Africa: a systematic map. Environ Evidence (2017) 6:4 DOI
10.1186/s13750-017-0082-2
Tesot A.K. (2014). Environmental implications of the charcoal business in Narok-South Sub-County,
Narok County. Master Thesis. Kenyatta University, Kenya.
TRANSrisk (2017). Energy Access and Climate Change in Sub-Saharan Africa: linkages, synergies and
conflicts. Sussex, UK, Transitions Pathways and Risk Analysis for Climate Change Mitigation and
Adaptation Strategies.
UN-DESA (2004). Sustainable Energy Consumption in Africa. New York, United Nations Department of
Economic and Social Affairs.
UNEP (2017). Improving efficiency in forestry operations and forest product processing in Kenya: A
viable REDD+ policy and measure. Nairobi, United Nations Environment Programme (UNEP).
UNEP (2006). Kenya: Integrated assessment of the energy policy with focus on the transport and
household energy sectors. Nairobi, United Nations Environment Programme (UNEP).
Wambua S.M. (2011). Household energy consumption and dependency on common pool forest
resources: The case of Kakamega Forest, Western Kenya. PhD Thesis. Georg-August-University
Göttingen, Germany.
Wangechi J. (2015, April). Charcoal burning ban opposed by residents. Reject 107:6.
Wanjala M.C. (2016). Sustainable charcoal production technologies in Kenya: The case of Kwale, Narok
and Taita Taveta counties. Final report on field project activities. Kenya Forest Service, Nairobi,
Kenya.

47
Wanjala F., Obwoyere G., Eshiamwata G. (2015). Wood fuel utilization patterns and cooking devices
efficiency analysis for Likia residents, Njoro Kenya. Journal of Natural Sciences Research 5(24):
158-173.
WHO (2016). Household air pollution and health Fact sheet N°292 (Geneva: WHO)
Zshauer K., (2012). Households energy supply and the use of fuelwood in the Taita Hills, Kenya;
https://helda.helsinki.fi/bitstream/handle/10138/29517/househol.pdf?sequence=1

48
Appendix 1: Search terms used during the scoping study
Value-chain
("Wood fuel" OR “Wood-fuel”) AND (charcoal OR firewood) AND "value-chain" AND Kenya
("Wood fuel" OR “Wood-fuel”) AND (charcoal OR firewood) AND (trade OR market) AND Kenya
("Wood fuel" OR “Wood-fuel”) AND (charcoal OR firewood) AND (income OR revenue OR returns) AND
Kenya
("Wood fuel" OR “Wood-fuel”) AND (charcoal OR firewood) AND (price OR cost) AND Kenya
Production
("Wood fuel" OR “Wood-fuel”) AND production AND Kenya
Charcoal AND (production OR burning) AND Kenya
Charcoal AND production AND “hot-spots” AND Kenya
Charcoal AND “hot-spots” AND Kenya
("Wood fuel" OR “Wood-fuel”) And (charcoal OR firewood) AND “forest degradation” AND Kenya
("Wood fuel" OR “Wood-fuel”) AND (charcoal OR firewood) AND deforestation AND Kenya
Movement
Charcoal AND (transport OR movement) AND Kenya
("Wood fuel" OR “Wood-fuel”) AND (charcoal OR firewood) AND (“transport routes” OR “trade routes”)
AND Kenya
Cross-border
("Wood fuel" OR “Wood-fuel”) AND (charcoal OR firewood) AND “cross-border” AND (transport OR
movement) AND Kenya AND Tanzania
("Wood fuel" OR “Wood-fuel”) AND (charcoal OR firewood) AND “cross-border” AND (transport OR
movement) AND Kenya AND Uganda
("Wood fuel" OR “Wood-fuel”) AND (charcoal OR firewood) AND “cross-border” AND (transport OR
movement) AND Kenya AND Somali
("Wood fuel" OR “Wood-fuel”) AND (charcoal OR firewood) AND “cross-border” AND trade AND Kenya
AND Uganda
("Wood fuel" OR “Wood-fuel”) AND (charcoal OR firewood) AND “cross-border” AND trade AND Kenya
AND Tanzania
("Wood fuel" OR “Wood-fuel”) AND (charcoal OR firewood) AND “cross-border” AND trade AND Kenya
AND Somali
("Wood fuel" OR “Wood-fuel”) AND (charcoal OR firewood) AND border AND control AND Kenya AND
Somali
("Wood fuel" OR “Wood-fuel”) AND (charcoal OR firewood) AND border AND control AND Kenya AND
Tanzania

49
("Wood fuel" OR “Wood-fuel”) AND (charcoal OR firewood) AND border AND control AND Kenya AND
Uganda
("Wood fuel" OR “Wood-fuel”) AND (charcoal OR firewood) AND (conflict OR war) AND Somali
Sites
("Wood fuel" OR “Wood-fuel”) AND (charcoal OR firewood) AND production AND Kitui
("Wood fuel" OR “Wood-fuel”) AND (charcoal OR firewood) AND production AND Garissa
("Wood fuel" OR “Wood-fuel”) AND (charcoal OR firewood) AND (trade OR market) AND Nairobi
("Wood fuel" OR “Wood-fuel”) AND (charcoal OR firewood) AND (trade OR market) AND Mombasa
("Wood fuel" OR “Wood-fuel”) AND (charcoal OR firewood) AND (trade OR market) AND Garissa
("Wood fuel" OR “Wood-fuel”) AND (charcoal OR firewood) AND (trade OR market) AND Kisumu
Gender
("Wood fuel" OR “Wood-fuel”) AND (charcoal OR firewood) AND gender AND Kenya
("Wood fuel" OR “Wood-fuel”) AND (charcoal OR firewood) AND women AND Kenya.

50
Working Paper Series 2018
290. Indonesia Rural Economic Development Series. Growing plants on a barren hill: local knowledge as part of
land restoration in Sumba Timur, Indonesia. http://dx.doi.org/10.5716/WP18030.PDF
291. Assessing the Downstream Socioeconomic Impacts of Agroforestry in Kenya
http://dx.doi.org/10.5716/WP18033.PDF
2019
292. Los árboles fuera del bosque en la NAMA forestal de Colombia. Elementos conceptuales para su
contabilización. http://dx.doi.org/10.5716/WP19002.PDF
293. Gender and Adaptation: An Analysis of Poverty and Vulnerability in Yunnan, China.
http://dx.doi.org/10.5716/WP19004.PDF
294. Tree Cover on Agricultural Land in the Asia Pacific Region http://dx.doi.org/10.5716/WP19005.PDF
295 What do we really know about the impacts of improved grain legumes and dryland cereals? A critical
review of 18 impact studies. http://dx.doi.org/10.5716/WP19006.PDF
296. Breeders’ views on the production of new and orphan crops in Africa: a survey of constraints and
opportunities http://dx.doi.org/10.5716/WP19007.PDF
297. Biomass Resources in Rhino Camp and Imvepi Refugee Settlements and the Buffer Zone around these
Settlements in West Nile, Uganda http://dx.doi.org/10.5716/WP19031.PDF
298. Option for restocking woody biomass in refugee-hosting areas: Perspectives from communities in Rhino
Camp and Imvepi Settlements, Uganda. http://dx.doi.org/10.5716/WP19032.PDF
299. Restoring ecosystems in refugee settlements using tree-based systems: The case of Rhino Camp and
Imvepi Settlements in Uganda. http://dx.doi.org/10.5716/WP19033.PDF
300. A theory-based evaluation of the Agroforestry Food Security Programme, Phase II in Malawi (AFSPII):
Lessons for Scaling Up Complex Agronomic and Natural Resource Management Practices Developed and
Tested in Research Settings. http://dx.doi.org/10.5716/WP19036.PDF
301. Fuentes semilleras y especies agroforestales de los bosques secos tropicales del norte del Perú: estado
actual y prioridades futuras. (Spanish) http://dx.doi.org/10.5716/WP19057.PDF
302. Seed sources and agroforestry species of tropical dry forests of northern Peru: current status and future
priorities. (English) http://dx.doi.org/10.5716/WP19058.PDF
303. Turmeric Production under Shade Management and Fertilization in Degraded Landscapes of Sumba Timur.
http://dx.doi.org/10.5716/WP19066.PDF
2020
304. From “Tree-planting” to “Tree-growing”: Rethinking Ecosystem Restoration Through Trees.
http://dx.doi.org/10.5716/WP2020001.PDF
305. Agroforestry species of Peru: Reference list and contribution to prioritization for the conservation of
agroforestry genetic resources. http://dx.doi.org/10.5716/WP20013.PDF

51
306. An exploratory analysis of cost-benefit analysis of landscape restoration.
http://dx.doi.org/10.5716/WP20014.PDF

World Agroforestry (ICRAF) is a centre of scientific and developmentexcellence that harnesses the benefits of trees for people and theenvironment. Leveraging the world’s largest repository of agroforestryscience and information, we develop knowledge practices, fromfarmers’ fields to the global sphere, to ensure food security andenvironmental sustainability.
ICRAF is the only institution that does globally significant agroforestryresearch in and for all of the developing tropics. Knowledge producedby ICRAF enables governments, development agencies and farmersto utilize the power of trees to make farming and livelihoods moreenvironmentally, socially and economically sustainable at multiplescales.
Acknowledgements
This study has been conducted with the generous support of the European Union through the Governing Multifunctional Landscapes in Sub-Saharan Africa (GML) project, implemented by the Center for International Forestry Research (CIFOR) in partnership with World Agroforestry (ICRAF), the Deutsche Gesellschaft für Internationale Zusammenarbeit (GIZ), the Forest and Farm Facility (FFF), the Food and Agriculture Organization of the United Nations (FAO), and national and local organizations. We are also grateful for the support received from the CGIAR Programme on Forests, Trees and Agroforestry (FTA).
United Nations Avenue, Gigiri • PO Box 30677 • Nairobi, 00100 • Kenya Telephone: +254 20 7224000 or via USA +1 650 833 6645
Fax: +254 20 7224001 or via USA +1 650 833 6646Email: [email protected] • www.worldagroforestry.org
Governing Multifunctional Landscapes