Embed Size (px)
Citation preview

University of Wisconsin MilwaukeeUWM Digital Commons
Theses and Dissertations
May 2018
Characterizing the Geochemical Changes Across aStrain Gradient in the Beja-Acebuches MetabasitesDue to Retrograde Metamorphism and Fluid FlowAlong the Southern Iberian Shear ZoneSheryl StephensonUniversity of Wisconsin-Milwaukee
Follow this and additional works at: https://dc.uwm.edu/etdPart of the Geology Commons
This Thesis is brought to you for free and open access by UWM Digital Commons. It has been accepted for inclusion in Theses and Dissertations by anauthorized administrator of UWM Digital Commons. For more information, please contact [email protected].
Recommended CitationStephenson, Sheryl, "Characterizing the Geochemical Changes Across a Strain Gradient in the Beja-Acebuches Metabasites Due toRetrograde Metamorphism and Fluid Flow Along the Southern Iberian Shear Zone" (2018). Theses and Dissertations. 1926.https://dc.uwm.edu/etd/1926
CHARACTERIZING THE GEOCHEMICAL CHANGES ACROSS A
STRAIN GRADIENT IN THE BEJA-ACEBUCHES METABASITES
DUE TO RETROGRADE METAMORPHISM AND FLUID FLOW
ALONG THE SOUTHERN IBERIAN SHEAR ZONE
by
Sheryl Isabella Stephenson
A Thesis Submitted in
Partial Fulfillment of the
Requirements for the Degree of
Master of Science
in Geosciences
at
The University of Wisconsin-Milwaukee
May 2018

ii
CHARACTERIZING THE GEOCHEMICAL CHANGES ACROSS A
STRAIN GRADIENT IN THE BEJA-ACEBUCHES METABASITES
DUE TO RETROGRADE METAMORPHISM AND FLUID FLOW
ALONG THE SOUTHERN IBERIAN SHEAR ZONE
by
Sheryl Isabella Stephenson
University of Wisconsin-Milwaukee, 2018
Under Supervision of Dr. Dyanna Czeck
The Southern Iberian Shear Zone (SISZ), SW Spain, provides an ideal
location to study the effects of syntectonic fluid on rock chemistry, deformation,
and metamorphism. The SISZ is a 60km long, 300-500m wide shear zone, striking
115 and dipping approximately 50 degrees to the NNE, that follows the contact
between metamorphosed MORB-derived Acebuches metabasites (AB) of the
Ossa-Morena zone and the metamorphosed Pulo do Lobo (PdL) accretionary
prism. Both units underwent two deformational events: 1) a HT/LP event that
reached amphibolite facies and significantly dehydrated the rocks, and 2) a
retrograde metamorphic event from amphibolite-greenschist facies that required
the addition of H2O. Major element geochemical characterization of the AB was

iii
undertaken using x-ray fluorescence to enable a better understanding of fluid-rock
interaction. These geochemical data from the shear zone indicate enrichments in
K2O, CaO, and Al2O3 with a depletion in SiO2. Element vs distance from shear
zone plots demonstrate that the movement of CaO, Al2O3, and SiO2 is related to the
retrograde metamorphic event because the enrichments (CaO, Al2O3) and depletion
(SiO2) is greater with increasing retrograde metamorphism. However, sporadic
and variable K2O enrichment is documented throughout the shear zone, even in
lithologies furthest from the shear zone. The movement of CaO, Al2O3, and SiO2
within the lithologies closest to the shear zone support the Conduit-Barrier Fluid
Flow model for parallel fluid flow. The sporadic enrichment of K2O in samples
away from the shear zone suggests that fluid migrated outward in localized
pathways through brittle fractures.

iv
TABLES OF CONTENTS
List of Figures……………………………………………………vi
List of Tables …….………………………………………………ix
Acknowledgements ……………………………………………….x
Introduction………………………………………………………1
Objective …………………………………………………..1
Fluid-rock interaction in shear zones …………………………1
Geologic Background …………………………………………..…10
Methods…………………………………………………….........22
Field methods ……………………………………………...22
Geochemical methods ……………………………………....29
Results …………………………………………………………..35
Geochemistry vs. distance from the top of the structure ………..35
Isocon analysis …………………………………………..... 56
Discussion ……………………………………………………….76
Evaluating isocon methods…………………………………..76
Elemental trends…………………………………………….80

v
Data limitations ……………………………………………..87
Major element changes and metamorphic reactions, structural
fabrics, and distance from shear zone………………………….89
Fluid composition …………………………………………...91
Fluid pathways ……………………………………………...92
Conclusion ………………………………………………………. 96
References ………………………………………………………..100
Appendices ……………………………………………………….107
A. XRF data for transect 1 ………………………………..…108
B. XRF data for transect 2 …………………………………...109
C. XRF data for transect 3 …………………………………...110
D. XRF data for transect 5 ………………………………...…111
E. XRF data for transect 6 …………………………...………111
F. XRF data for transect 8 …………………...………………112

vi
LIST OF FIGURES
Figure Page No.
1. Map depicting the Southern Iberian Shear Zone, formed by the
contact between the South Portuguese Zone (SPZ) and the Ossa
Morena Zone (OMZ) during the collision between
Laurentia-Baltica and Gondwana .……………………………. 11
2. Map of the central portion of the Southern Iberian Shear zone with
contact between Acebuches Metabasites and Pulo do Lobo
Terrane…………………………………………………….. 13
3. Map showing the extent of Southern Iberian Shear zone between
the towns of Aroche and Aracena …………………………….. 14
4. The four rock domains of the Acebuches Metabasites …………... 21
5. Relative position of the sampled transects across the length of the
shear zone …………………………………………………... 23
6. Google earth image of each transect and the sample locations …… 26
7. Element vs Distance from top of structure for Transect 1
a. SiO2, Al2O3, Na2O, CaO ………………………………… 38
b. MgO, Fe2O3, MnO, TiO2 ………………………………... 39
c. K2O, P2O5, color key ……………………………………. 40
8. Element vs Distance from top of structure for Transect 2
a. SiO2, Al2O3, Na2O, CaO ………………………………… 41
b. MgO, Fe2O3, MnO, TiO2 ………………………………... 42
c. K2O, P2O5, color key ……………………………………. 43
9. Element vs Distance from top of structure for Transect 3

vii
a. SiO2, Al2O3, Na2O, CaO ………………………………… 44
b. MgO, Fe2O3, MnO, TiO2 ………………………………... 45
c. K2O, P2O5, color key ……………………………………. 46
10. Element vs Distance from top of structure for Transect 5
a. SiO2, Al2O3, Na2O, CaO ………………………………… 47
b. MgO, Fe2O3, MnO, TiO2 ………………………………... 48
c. K2O, P2O5, color key ……………………………………. 49
11. Element vs Distance from top of structure for Transect 6
a. SiO2, Al2O3, Na2O, CaO ………………………………… 50
b. MgO, Fe2O3, MnO, TiO2 ………………………………... 51
c. K2O, P2O5, color key ……………………………………. 52
12. Element vs Distance from top of structure for Transect 8
a. SiO2, Al2O3, Na2O, CaO ………………………………… 53
b. MgO, Fe2O3, MnO, TiO2 ………………………………... 54
c. K2O, P2O5, color key ……………………………………. 55
13. Variation in protolith geochemistry across each transect;
variation in K2O (top), SiO2 (middle), TiO2, (bottom) …………… 62
14. Isocon plots for transect 1; method 1 (top), method 2 (middle) and
method 3 (bottom) …………………………………………….. 70
15. Isocon plots for transect 2; method 1 (top), method 2 (middle) and
method 3 (bottom) …………………………………………….. 71
16. Isocon plots for transect 3; method 1 (top), method 2 (middle) and
method 3 (bottom) …………………………………………….. 72

viii
17. Isocon plots for transect 5; method 1 (top), method 2 (middle) and
method 3 (bottom) …………………………………………….. 73
18. Isocon plots for transect 6; method 1 (top), method 2 (middle) and
method 3 (bottom) …………………………………………….. 74
19. Isocon plots for transect 8; method 1 (top), method 2 (middle) and
method 3 (bottom) …………………………………………….. 75
20. Conduit-Barrier Fluid Flow model ……………………………... 94

ix
LIST OF TABLES
Tables Page No.
1. Summary table for the results of isocon method 1;
Enrichments/depletions of elements across the length of the
shear zone ………………………………………………. 59
2. Summary table for the results of isocon method 2;
Enrichments/depletions of elements across the length of the
shear zone ………………………………………………. 65
3. Average protolith compositions before and after standard
deviation correction ……………………………………… 67
4. Summary table for the results of isocon method 3;
Enrichments/depletions of elements across the length of the
shear zone ………………………………………………. 69
5. Geochemistry data tables for all samples across transects 1,2,3,
5,6, and 8 ……………………………………………….. 107

x
ACKNOWLEDGMENTS
First and foremost, I would like to thank my thesis advisor, Dr. Dyanna Czeck, for
the endless support and dedication with regards to both the analysis and writing
aspects of my project. Dyanna’s patience and non-judgmental nature allowed me to
approach her for help without hesitation. Dyanna’s dedication to her students’
understanding and growth is commendable. She offers a balance of constructive
criticism and encouragement, which made me feel continuously pushed and
challenged, yet capable and confident. Finally, Dyanna’s help in the field and
funding for our field work does not go unnoticed. I would also like to give thanks
to Carlos Fernandez and Manuel Diaz-Azpiroz for their guidance and hospitality in
the field, as well as their contribution of figures and supplemental direction when
needed. Carlos and Manuel’s previous publications and vast knowledge of the field
area aided my research project tremendously. Throughout my research project they
were always available even through communication and time-zone barriers and
offered invaluable input. I would like to thank Nancy Duque and Dulce Hernandez
Blanchard for dedicating their time and effort to help with sample preparation.
Finally, I want to express my deepest gratitude to my parents who were an
unremitting source of support and encouragement during my Master’s work and
will remain so indefinitely.

xi
Field work was funded by a University of Wisconsin-Milwaukee RACAS grant to
Dyanna Czeck. The geochemical analysis portion of this project was made possible
by the Geological Society of America Graduate Research Award.

1
1. INTRODUCTION
1.1 Objective of research
This research will test the hypothesis that the retrograde metamorphism in
the Southern Iberian Shear Zone (SISZ) was accompanied by fluid interaction that
resulted in geochemical alteration, strain softening, and enhanced deformation
localization. By testing this hypothesis, we aim to better understand how syn-
deformational water may affect geochemistry, metamorphism, and microstructure
within shear zones.
1.2 Fluid-rock interaction in shear zones
Fluid-rock interaction and the subsequent effects on rock chemistry,
deformation, and metamorphism have been studied extensively (Carter et al. 1990,
Newman and Mitra, Kisters et al. 2000, Yonkee et al. 2013). Fluid can accumulate
within the crust from a variety of sources. The changing temperature and pressure
along with continuous and discontinuous reactions within metamorphic belts,
release volatile-bearing fluids into the surrounding rocks. Due to the instability of
porosity structures within deforming rocks, compaction of porous, fluid-containing
media will drive expulsion of fluids into the surrounding rocks. Finally, high-
temperature metamorphism promotes dehydration reactions, which extract water
from the on-going reactions and release it into surrounding rocks (Holness, 1997,

2
Carter et al., 1990). The rocks do not have the ability to maintain this water and it
is quickly dispersed within the system. The water is dispersed by a variety of flow-
mechanisms, such as thermal convection, advection (infiltration), and surface and
intracrystalline diffusion. The distance of flow varies from grain scale to hundreds
of kilometers (Carter et al., 1990).
When this fluid interacts with surrounding rocks, it has significant effects on
deformation mechanisms and thus affects deformation processes such as folding,
faulting, and shear-development. It also exerts partial control on rock strength,
deformation heterogeneity, and strain localization (Carter et al., 1990). Rock
strength can be altered in one of two ways; 1) chemical change via mineral
reactions along fluid pathways and 2) mechanical change via fluid pressure and
associated stress (Cox, 2002). Therefore, fluid-rock interaction can affect whether
rock accommodates stress by brittle or ductile deformation (e.g. Wawrzyniec et al.,
1999). If the fluid pressure rapidly exceeds rock strength, the rock will undergo
brittle deformation and fracture, which plays a large role in faulting (Axen et al.,
2001). Conversely, fluid-rock interaction can promote ductility within high-strain
zones. Two of the critical mechanisms during deformation are: 1) movement of
dislocations, which is grain size dependent and, 2) diffusion across grain
boundaries, which is inversely proportional to the cube of the grain size (Beach,
1980). Due to this relationship between grain size and deformation mechanisms,

3
the initial stages of deformation may be dominated by dislocation mechanisms,
which eventually produces smaller sub-grains or recrystallized grains, which in
turn favors diffusion mechanisms over dislocation.
The relationship between deformation and metamorphism within shear
zones is closely related and can be demonstrated in the fact that shear zones
typically show a metamorphism that is not recorded in the undeformed rocks
outside of the shear boundary (Beach, 1980). Many authors have studied this
observation and recognized that certain metamorphic fabrics, associated textures,
and assemblages were confined to shear zones (Ramsay and Graham 1970, Beach
1976).
During metamorphic reactions, mineral solution, nucleation, and growth
occur. Metamorphic products typically exhibit grain-size reduction with unbound
and disorganized grain boundaries, which promote grain boundary diffusion
mechanisms and subsequent fast strain rates during the initial reaction stage. As
minerals grow and the reactions cease, deformation by dislocation will dominate
and often overprint earlier diffusion-dominated mechanism (White and Knipe,
1978).
Water is a common feature within many shear zones (Kerrich et al., 1980,
McCaig, 1984, Knipe and Wintsch 1985, Sinha et al., 1986, O’Hara 1988,

4
Selverstone et al., 1991, Marquer et al., 1994), and water is responsible for
promoting many retrograde metamorphic reactions that enhance the grain-size
reduction and subsequent diffusion mechanisms. In this sense, fluid-rock
interaction and the subsequent effects on metamorphism can be seen as a catalyst
for strain-softening and enhancement of ductility within shear zones. It can also
promote dislocation glide by phyllosilicate production (Sinha et al., 1986, Wintsch
et al., 1995). This strain-softening plays a large role in folding mechanisms of
rocks and the development of shear zones (Wintsch and Yi, 2002).
The positive feedback between deformation, fluid, and metamorphism also
promotes strain localization (Carter et al. 1990, Barnes et al., 2004). Although
deformation heterogeneity is largely a function of rock heterogeneity and
contrasting rheologies, fluids can also affect deformation heterogeneity by
promoting strain localization. Abnormal pore pressure caused by fluid infiltration
and dynamic recrystallization during deformation often leads to an increase in rock
permeability and porosity, which in turn creates favorable pathways for fluid flow.
Alternatively if fluid pressure exceeds rock strength it will result in brittle
fractures, which are also considered favorable pathways for flow (Axen et al.,
2001). As more water passes through these favorable paths, it may chemically
alter the rocks due to element mobility, which can control metamorphic reactions.
Metamorphic effects, such as grain size reduction and production of weaker,

5
schistose minerals, create zones of weakness that can more easily accommodate
strain compared to surrounding rock (White et al., 1980). For example, in Mg-rich
mafic rocks, in shallow meteoric H2O-dominated environments, it is typical for
weaker phyllosilicates, such as chlorite or biotite, to replace stronger framework
and chain silicates. With increasing phyllosilicate content and the subsequent
preferred orientation, these areas of phyllosilicate-replacements are weaker than
the feldspar-rich protolith (Wintsch et al. 1995, O’Hara, 1988). Phyllosilicates that
are shortened at 45° to (001) are orders of magnitude weaker than quartz and
feldspars (Kronenberg et al., 1990). When these phyllosilicates are aligned, they
can deform by dislocation glide even at low temperature and pressure (Wintsch et
al., 1995).
There are two end-member systems considered when it comes to fluid-rock
interaction in magnesium-rich rocks; water-dominated and rock-dominated
(Wintsch et al. 1995). Water-dominated systems are shallow (<15km) and the
fluid/rock ratio is high. This high fluid/rock ratio means that there is more fluid
present relative to the reacting rock and therefore the fluid composition remains
unchanged by the interaction. It is in these systems that muscovite mica is expected
to precipitate. Rock-dominated systems are deeper (~10-15km) and the fluid/rock
ratio is low. Consequently in rock-dominated systems the chemistry of the fluid is

6
affected by the rock with which it interacts. In these systems chlorite (<11km) or
biotite (>10km) may precipitate. Chlorite replacement may lead to volume loss and
a subsequent increase in porosity with reaction progress. This weakening of rocks
due to phyllosilicate replacement is more significant in Mg-rich rocks than Mg-
poor rocks and for this reason, strain softening is more likely to occur in mafic
rocks (Wintsch et al. 1995).
When a fluid interacts with a rock under solid conditions and changes it
chemically, it is termed “metasomatism.” The definition of metasomatism
according to the IUGS Subcommission on the Systematics of Metamorphic Rocks
(SSMR), is a “metamorphic process by which the chemical composition of a rock
or a rock portion is altered in a pervasive manner and which involves the
introduction and/or removal of chemical components as a result of the interaction
of the rock with aqueous fluids (solutions). During metasomatism the rock remains
in a solid state.” There are two types of metasomatism, 1) modal or patient
metasomatism, which involves the introduction of new minerals and 2) cryptic
metasomatism, which describes compositional changes of pre-existing minerals
without the formation of new phases (Harlov and Austerheim, 2013). The process
occurs when a fluid migrates into a host rock and creates a state of chemical
disequilibrium, prompting re-equilibrium reactions to occur (Harlov and
Austerheim, 2013). These re-equilibrium reactions cannot occur without the

7
transport of chemical elements. Fluids are the catalysts for these reactions, by
dissolving and transporting these elements either by removing mobile elements
from the rock, or introducing mobile elements from elsewhere. These changes are
typically identified by unusual enrichments of certain elements that are not
naturally found in the rock or enrichment of immobile elements (e.g. TiO2) due to
the depletion of mobile elements (e.g. SiO2).
Although fluid is abundant within the lithosphere (Carter et al. 1990) and
massive fluid transport is thought to occur in collisional boundaries (Fyfe and
Kerrich, 1985), its transient nature makes it impractical to study its effects directly
in the mid-low crust. Therefore fluid is best studied through evidence of ancient
fluid flow such as geochemical/structural indicators including certain metamorphic
reactions (Wintsch and Yi, 2002) and alignment of minerals to form fabrics (Ault
and Selverstone, 2008), both of which weaken the rock through strain softening.
Geochemical indicators in the rock may remain after fluid flow, such as depletion
of mobile element and enrichment of immobile elements. Such studies are
common (Kerrich et al., 1980, McCaig, 1984, Knipe and Wintsch 1985, Sinha et
al., 1986, O’Hara 1988, Selverstone et al., 1991, Newman and Mitra, 1993,
Marquer et al., 1994), however, they are typically performed in granitic complexes
or metasedimentary rocks where the starting chemistry is often heterogeneous.

8
Shear zones are particularly important when studying fluid-rock interaction
because the increased permeability relative to wall rocks, related to shear fabric
development, provides favorable large-scale channels for flow through the crust
(Holness, 1997). Fluid flow through shear zones is thought to be an important part
of the crustal fluid-flow budget (Fyfe et al., 1978). Axen et al. (2001) argue that the
ductile-to-brittle transition of two shear zones was a function of fluid-pressure and
associated strain rather than a function of temperature and pressure.
Understanding shear zone dynamics and the effects of fluid-rock interaction
is important for a variety of reasons. Since fluids can greatly alter the strength and
deformation character of rocks, they exert control on the location of the brittle-
ductile transition and therefore exert partial control over crustal strength,
earthquake nucleation, orogenesis, and continental dynamics (Axen et al. 2001). In
addition, understanding fluid-rock interaction during deformation proves
invaluable in the exploration industry. Shear zones have been associated with
significant fluid-related mineral deposits (Gater, 1991, Kolb et al. 2004,
Micklethwaite et al. 2010) and may provide insight into the conditions preferable
for mineral deposition. For example, gold-bearing quartz veins often occur in
steeply dipping shear zones (Sibson, 1988). Additionally, abrupt drops in fluid
pressure caused by shear failure within faults, which can be caused by fluid-

9
interaction, is also thought to play an important role in gold-bearing quartz vein
deposition (Sibson, 1988).
This research will study the fluid-rock interaction along one prominent shear
zone, the Southern Iberian Shear Zone in southwest Spain. This ancient shear zone
is well-exposed and provides an ideal natural setting to study the effects of fluid
interaction during shear zone deformation. The shear zone separates two units, the
Acebuches Metabasites (AB) and the Pulo do Lobo metasedimentary rocks (PdL).
This research focuses primarily on the AB because: 1) the SISZ has a wider effect
on the AB compared to the PdL, and 2) the relatively simple starting geochemistry
will make identifying alteration easier than in more heterogeneous rocks (Yonkee
et al., 2013). The AB metabasites were the main reason the SISZ was chosen for
this research, however, other factors include: well exposed transects across the
shear zone strain gradient, previous evidence for fluid in retrograde reactions
(actinolite alteration to chlorite), and well-understood kinematics (Díaz-Azpiroz
and Fernández, 2005, Díaz-Azpiroz et al., 2006, Fernández et al., 2013).

10
2. GEOLOGIC BACKGROUND
During the Carboniferous period, about 300 million years ago, the majority
of Iberia was assembled during the tectonic collision between the Laurentia-Baltica
and Gondwana continents. During this collision a solo microplate, now known as
the South Portuguese zone, collided and attached to the edge of Gondwana, now
known as the Ossa-Morena zone, forming the Variscan Iberian Massif (Crespo-
Blanc and Orozco, 1988). The suture between these two terranes, the Ossa-Morena
Zone and the South Portuguese zone, is the Aracena metamorphic belt (fig. 1).
11
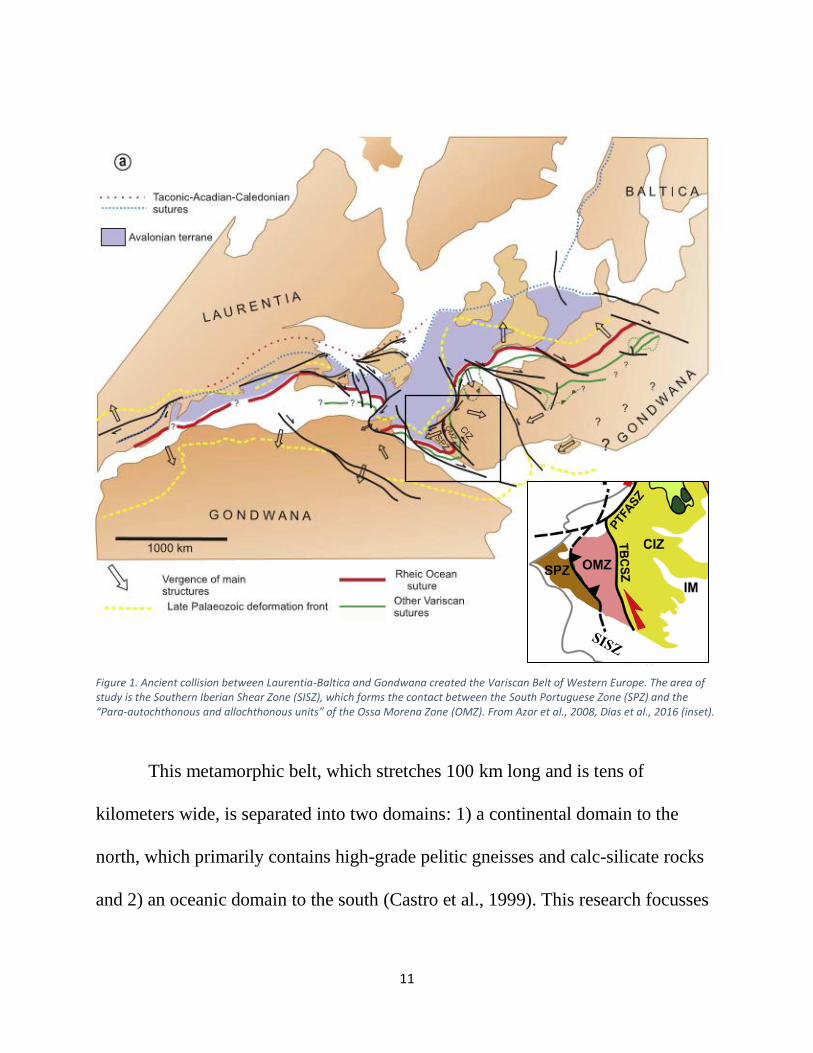
Figure 1. Ancient collision between Laurentia-Baltica and Gondwana created the Variscan Belt of Western Europe. The area of study is the Southern Iberian Shear Zone (SISZ), which forms the contact between the South Portuguese Zone (SPZ) and the “Para-autochthonous and allochthonous units” of the Ossa Morena Zone (OMZ). From Azor et al., 2008, Dias et al., 2016 (inset).
This metamorphic belt, which stretches 100 km long and is tens of
kilometers wide, is separated into two domains: 1) a continental domain to the
north, which primarily contains high-grade pelitic gneisses and calc-silicate rocks
and 2) an oceanic domain to the south (Castro et al., 1999). This research focusses

12
on the southern oceanic domain, which can be further subdivided into two groups
of rocks that are separated by the Southern Iberian Shear Zone (SISZ).
The SISZ follows the contact between metamorphosed MORB-derived
(Bard and Moine, 1979) Acebuches metabasites (AB) of the Ossa-Morena zone to
the north and schists of the metamorphosed Pulo do Lobo (PdL) accretionary prism
to the south, part of the South Portuguese Zone (Castro et al., 1999, fig. 2). The
shear contact extends at least 60 km in length between the Spanish towns of
Aracena and Aroche and is 300-500 m wide (fig 3).

13
Fig
ure
2. M
ap
of
the
cen
tra
l po
rtio
n o
f th
e SI
SZ s
ho
win
g t
he
Ace
bu
ches
Met
ab
asi
tes
(am
ph
ibo
lites
an
d m
afi
c sc
his
ts)
in s
hea
r co
nta
ct w
ith
th
e P
ulo
do
Lo
bo
ter
ran
e (p
elit
ic s
chis
ts).
Tra
nse
ct li
nes
1-3
are
sh
ow
n. F
rom
Día
z-A
zpir
oz
an
d F
ern
án
dez
, 20
05
.

14
Fig
ure
3. T
ran
sect
s T1
-T8
an
d s
tru
ctu
ral d
ata
fro
m t
he
SISZ
. Th
e lo
cati
on
of
Fig
. 1 is
sh
ow
n b
y th
e ou
tlin
ed b
ox.
Fro
m F
ern
an
dez
et
al.,
20
13
.

15
Shear fabrics extend broadly into the Acebuches metabasites and only
locally affect the schists of the Pulo Do Lobo domain (Díaz-Azpiroz and
Fernández, 2005). Both the AB and PdL underwent two deformational events; first
a high temperature, low pressure (HT/LP) event related to collision in the AB
(Castro et al., 1996) while the PdL underwent low-grade metamorphism and
folding (Onezime et al., 2002) and second a retrograde metamorphic event. The
first HT/LP metamorphic event (M1), related to the Variscan orogeny, reached the
transition between amphibolite/granulite facies. Within the AB, M1 is
characterized by the development of two, NW-SE sub-parallel foliations with a
steep NE dip defined by the orientation of amphibole crystals. These rocks also
developed a metamorphic, grain-size banding of alternating plagioclase and
amphibole-rich layers. Lineation shows a high rake/pitch with a NE-E plunge and
is composed of a preferred orientation of long axes of amphibole prisms. The
metamorphic grade increases toward the top of the structure, evident by an increase
in metamorphic banding and the introduction of clinopyroxene (Díaz-Azpiroz and
Fernández, 2005). The rocks affected by D1 only can be separated into two
domains: coarse-grained banded amphibolites containing clinopyroxene at the top
of the unit and medium grained amphibolites without clinopyroxenes below. The
following paragraph discusses the mineral assemblages and uses these
abbreviations: Plagioclase (Pl), hornblende (Hbl), Clinopyroxene (Cpx), Titanite

16
(Ttn), ilmenite (Ilm), magnetite (Mgt), apatite (Ap), quartz (Qtz), edenite-pargasite
(Ed-Prg), chlorite (Chl), epidote (Ep), actinolite (Act), albite (Ab), and calcite
(Cal). The assemblages of these two domains are characterized by Diaz-Azpiroz
(2000) as follows:
1) Coarse-grained (2 mm) banded amphibolites with clinopyroxene (highest
grade) (Banded cpx)
a. Pl + Hbl + Cpx + Ttn + Ilm + Mgt ± Ap
b. Pl + Hbl + Qtz + Ttn + Ilm + Mgt ± Ap (rare quartz-rich lithology)
2) Medium grained (1-2 mm)banded amphibolites without clinopyroxene:
(Banded w/o cpx)
a. Pl + Hbl + Ttn ± Ilm ± Mgt ± Ap
b. Pl + Hbl + Qtz + Ttn ± Ilm ± Mgt ± Ap (rare quartz-rich lithology)
Diaz-Azpiroz (2000) studied the minerals via microprobe and determined
the following detailed mineralogy. The plagioclase in the upper banded
amphibolite domain (with cpx) is characterized by Andesine-labradorite (An30-
An60). Lower in the structural column, the banded amphibolites without
clinopyroxene become more sodic and are characterized by Oligoclase-Andesine
(An20-An40). The amphiboles in both of these domains are dominated by
17
magnesiohornblendes in which a combination of edenite and pargasite substitution
dominates, in addition to Ti-tschermakite substitution by introducing Ti from the
consumption of titanite in these upper levels of the banded amphibolites. Titanite
within the banded amphibolites with cpx is included within magnetite and ilmenite
or forms a reaction rim around them. The composition of the titanite remains
relatively constant throughout all domains.
The structural top (north) of the Achebuches metabasites preserved this
D1/M1 metamorphism while the base (south) of the metabasites underwent the
second deformation event, related to the thrusting of the metabasites onto the Pulo
do Lobo terrane and subsequent development of the SISZ, the focus of this
research. This second deformation event (D2) produced amphibolite-greenschist
retrograde metamorphism (M2). Diaz-Azpiroz (2000) described the following
mineralogy in the two units that were affected by both D1 and D2.
1) Sheared amphibolites (<1mm) (SA)
a. Pl + Hbl + Ttn ± Ed-Prg ± Act(D1) ± Ep ± Chl ± Ilm ± Mgt ±Ap ±Qtz
2) Mafic schists (MCS) (<0.5mm)
a. Pl + Hbl + Act(D2) + Ep ± Qtz ± Chl ± Ab ± Cal ± Ttn ± Ilm ± Mgt ±
Cpx (ig)

18
Diaz-Azpiroz (2000) studied the phases using microprobe and determined
the following detailed mineralogy. The plagioclase in these D2-affected domains
ranges between An 15-An 45. There is often some zonation with an andesine
nucleus (An37-An41) and oligoclase border (An17-An32). Albite (An3-An7)
appears in the structurally lowest part of the MCS. There are also labradorite-
bytownite (An62-An80) crystals in the MCS domain, which are interpreted to most
likely be relicts from D1-deformation or igneous relicts. The amphiboles within
these domains are much more heterogeneous and actinolite, hornblende, edenite,
pargasite, and hastingsite coexist. Here, the most important substitution is
pargasite, which is accompanied by minor edenite, tschermakite, Fe- and Ti-
tschermakite substitutions. All of these amphiboles, except actinolite, are relicts of
D1. Chlorite and epidote also appear together in these D2-affected domains, with
chlorite confined to the MCS domain. Both chlorite and epidote show no real
variation in composition. Díaz-Azpiroz (2000) suggests that the Mg # (mean=0.64)
of chlorite corresponds to a composition between clinochlore and chamosite.
Epidote, which appears in both D2 domains but is more abundant in the MCS,
occurs within pressure shadows of porphyroclasts or is concentrated within
epidote-rich bands. The epidote is determined to belong to the clinozoisite-epidote
series, with a high proportion of the Pistacite molecule (Ps65-Ps98). The titanite in
the SA and MCS appears together with magnetite, which forms “trains” that follow

19
foliation. The composition remains constant as determined by a 0.86-1.13 Ti/Ca
ratio. Al does not replace Fe3+ in the tetrahedral sites. Díaz-Azpiroz (2000) also
documents very sporadic K-feldspar grains throughout D2 rocks.
D2 also produced mylonitic shear fabrics oriented 115° and dipping 50° to
the NNE (D2) (Castro et al., 1996, Díaz-Azpiroz and Fernández, 2005, Fernández
et al., 2013). The stretching lineation (L2), evident from plagioclase ribbons,
fluctuates from a SE plunge in the east and west to a NW plunge in the center of
the shear zone and is always oblique relative to the strong strike orientation of the
shear zone (Díaz-Azpiroz and Fernández, 2005)
The boundary of this D2 deformation is represented by the folding of the
D1 banded amphibolites without clinopyroxene. These folds eventually become so
tight and isoclinal that the rocks grade into sheared amphibolites (pl-hbl
assemblages). At the shear contact, the rocks are chlorite-rich mafic schists. The
retrograde M1 is marked with actinolite, epidote and chlorite assemblages as well
as pl-hbl near the base of the AB and the SISZ contact.
Díaz-Azpiroz and Fernández (2005) characterize the SISZ as having a listric
shape with several shear zones deviating from a main basal shear zone, evident by
shear anastomosing of mafic schists around amphibolite lenses. Based on these
varying L2 stretching lineations that juxtapose a stable WNW-ESE strike, Díaz-

20
Azpiroz and Fernández (2005) interpret that the SISZ was formed via triclinic
transpression with oblique extrusion (further modeled by Fernández et al., 2013).
The four rock domains analyzed in this research, starting from the top of the
metabasites structure are: 1) coarse-grained banded amphibolites containing
clinopyroxene, 2) medium-grained banded amphibolites without clinopyroxene, 3)
folded and eventually sheared amphibolites, and finally 4) mafic chlorite schists.
(Castro et al., 1996; Díaz-Azpiroz and Fernández, 2005) (fig. 4).

21
Fig
ure
4. T
he
fou
r ro
ck d
om
ain
s fr
om
to
p o
f st
ruct
ure
(le
ft)
tow
ard
th
e sh
ear
con
tact
(ri
gh
t). F
old
ed a
mp
hib
olit
es a
re in
clu
ded
her
e to
sh
ow
th
e o
ute
r b
ou
nd
ary
o
f th
e sh
ear
zon
e.

22
3. METHODS
3.1 Field methods
Fieldwork and subsequent data collection took place starting in January
2017. Six transects (1,2,3,5,6,8 corresponding with numbering used by Díaz-
Azpiroz and Fernández, 2005) within the AB between Aracena and Aroche were
densely sampled across the strain gradient, starting from outside the shear
boundary through the shear contact and slightly into the PdL (fig. 5).

23
Fig
ure
5. S
ho
ws
the
rela
tive
loca
tio
n o
f ea
ch s
am
ple
d t
ran
sect
, wit
h n
um
ber
ing
co
rres
po
nd
ing
to
th
ose
use
d b
y D
íaz-
Azp
iro
z a
nd
Fer
ná
nd
ez, 2
00
5. F
igu
re is
ad
ap
ted
fro
m
Fern
an
dez
et
al.,
20
13
.

24
Most of the samples were collected along public roadways where the
outcrops were large and relatively fresh, and the most continuous sections of AB
could be found (fig. 6). All samples and outcrops were located using a map and a
hand-held GPS.
The number of samples collected across the six transects totals to 92, 78
from the MB, and the remaining 14 from the PdL. Breakdown of sample collection
is as follows: Transect 1: 16 MB, 6 PdL, Transect 2: 21 MB, 4 PdL, Transect 3: 17
MB, 1 PdL, Transect 5: 4 MB, 1 PdL, Transect 6: 7 MB, 2 PdL, Transect 8: 13
MB, 0 PdL. The metabasites were sampled across the four rock domains discussed
previously. The PdL samples, not discussed further here, will be analyzed by other
members of our research team. At each location, we collected two separate
samples: one for this geochemical study and another for a complimentary
microstructural study to be completed by other members of the research group.
When possible, the top of the structure was identified by locating calc-
silicate rocks, belonging to the northern continental domain (Castro et al., 1996).
The first metabasite outcrop below these calc-silicate rocks was sampled as our top
of structure and this lithology was the first of four rock domains; coarse-grained,
banded amphibolites containing clinopyroxene. When calc-silicate rocks were not
available for reference, top of structure was deemed as the uppermost outcrop
matching rock domain 1. A reduction in grain size and a loss of clinopyroxene
25
marks rock domain 2; medium-grained, banded amphibolites without
clinopyroxene. These top two domains are apparently unaffected by the D2
retrograde metamorphism and are simply collected as the “unaltered samples” for
geochemical comparison. Towards the shear zone, these medium-grained
amphibolites become folded, which marks the outermost boundary of the shear
zone and subsequently leads into rock domain three; sheared amphibolites (pl-hbl
assemblages). Rock domain 4 is found nearest to the shear zone contact and
consists of chlorite mafic schist, which is identified by the alteration of actinolite to
chlorite. Pinpointing the transitions between these rock domains relied on
availability of outcrop.
At each outcrop, orientations of foliation and lineation (when present) were
measured and the associated strength of each was noted (strong vs weak). Where
folds were present in the rocks, trend and plunge of the hinge were measured.
Structural information was noted to identify rock domains, such as identification of
folds for locating the outer boundary of the shear zone, but the geochemically-
dominated nature of this project meant that our focus was on sample collection
within rock domains. Much of the structural data was previously collected by our
field companions Diaz-Azpiroz and Fernandez (Diaz-Azpiroz and Fernandez,
2005, Diaz-Azpiroz et al., 2006, Diaz-Azpiroz et al., 2007).

26
Fig
ure
6.T
ran
sect
s a
nd
th
e lo
cati
on
s o
f ea
ch c
olle
cted
sa
mp
le.

27
Sampling was conducted primarily along roadways that cut across structure,
but normally the roads are not perpendicular to structural layering. Therefore, a
series of calculations were performed to transform roadside distance (Dm) to the
distance (D) from the structural top of the metabasites (AB). Starting from the
structural top of the series, at each sample location, the following were recorded:
distance from the previous location using a tape measure along the roadside (dm),
the azimuth of this measurement (𝜇), and the azimuth () and dip () of the
foliation. The angle (𝜂)between road azimuth () and the normal to foliation () is
determined (eq. 2). The horizontal distance between samples located perpendicular
to foliation (dh) equals the horizontal distance along the road (dm) times the cosine
of 𝜂 (eq. 3).
The sine of the foliation dip () multiplied by the horizontal distance
between samples located perpendicular to foliation (dh) give us the true distance
across the foliation from the previous point (eq. 4). This value is then added to the
value obtained from the previous point to give the real distance across the main
structure measured from the uppermost structural boundary (d) (eq. 5).
The relevant calculations are described below:
𝐷𝑚 = 𝑑𝑖𝑠𝑡𝑎𝑛𝑐𝑒 𝑚𝑒𝑎𝑠𝑢𝑟𝑒𝑑 𝑎𝑙𝑜𝑛𝑔 𝑡ℎ𝑒 𝑟𝑜𝑎𝑑 𝑓𝑟𝑜𝑚 𝑡ℎ𝑒 𝑢𝑝𝑝𝑒𝑟 𝑠𝑡𝑟𝑢𝑐𝑡𝑢𝑟𝑎𝑙
𝑏𝑜𝑢𝑛𝑑𝑎𝑟𝑦 𝑜𝑓 𝑡ℎ𝑒 𝐴𝐵

28
𝑑𝑚 = 𝑑𝑖𝑠𝑡𝑎𝑛𝑐𝑒 𝑚𝑒𝑎𝑠𝑢𝑟𝑒𝑑 𝑓𝑟𝑜𝑚 𝑝𝑟𝑒𝑣𝑖𝑜𝑢𝑠 𝑝𝑜𝑖𝑛𝑡 𝑎𝑙𝑜𝑛𝑔 𝑡ℎ𝑒 𝑟𝑜𝑎𝑑
𝜇 = 𝑎𝑧𝑖𝑚𝑢𝑡ℎ 𝑜𝑓 𝑡ℎ𝑒 𝑑𝑖𝑠𝑡𝑎𝑛𝑐𝑒 𝑚𝑒𝑎𝑠𝑢𝑟𝑒𝑑 𝑓𝑟𝑜𝑚 𝑡ℎ𝑒 𝑝𝑟𝑒𝑣𝑖𝑜𝑢𝑠 𝑝𝑜𝑖𝑛𝑡 𝑎𝑙𝑜𝑛𝑔 𝑡ℎ𝑒 𝑟𝑜𝑎𝑑
𝛼 = 𝑎𝑧𝑖𝑚𝑢𝑡ℎ 𝑜𝑓 𝑓𝑜𝑙𝑖𝑎𝑡𝑖𝑜𝑛
𝜐 = 𝑎𝑧𝑖𝑚𝑢𝑡ℎ 𝑜𝑓 𝑡𝑟𝑎𝑐𝑒 𝑛𝑜𝑟𝑚𝑎𝑙 𝑡𝑜 𝑠𝑡𝑟𝑢𝑐𝑡𝑢𝑟𝑒
𝜂 = 𝑎𝑛𝑔𝑙𝑒 𝑏𝑒𝑡𝑤𝑒𝑒𝑛 𝑑𝑖𝑠𝑡𝑎𝑛𝑐𝑒 𝑓𝑟𝑜𝑚 𝑝𝑟𝑒𝑣𝑖𝑜𝑢𝑠 𝑝𝑜𝑖𝑛𝑡 𝑎𝑙𝑜𝑛𝑔 𝑡ℎ𝑒 𝑟𝑜𝑎𝑑
𝑎𝑛𝑑 ℎ𝑜𝑟𝑖𝑧𝑜𝑛𝑡𝑎𝑙 𝑑𝑖𝑠𝑡𝑎𝑛𝑐𝑒 𝑛𝑜𝑟𝑚𝑎𝑙 𝑡𝑜 𝑠𝑡𝑟𝑢𝑐𝑡𝑢𝑟𝑒
𝑑ℎ = ℎ𝑜𝑟𝑖𝑧𝑜𝑛𝑡𝑎𝑙 𝑑𝑖𝑠𝑡𝑎𝑛𝑐𝑒 𝑏𝑒𝑡𝑤𝑒𝑒𝑛 𝑠𝑎𝑚𝑝𝑙𝑒𝑠 𝑙𝑜𝑐𝑎𝑡𝑒𝑑 𝑝𝑒𝑟𝑝𝑒𝑛𝑑𝑖𝑐𝑢𝑙𝑎𝑟 𝑡𝑜 𝑓𝑜𝑙𝑖𝑎𝑡𝑖𝑜𝑛 (𝑑ℎ)
𝛽 = 𝐹𝑜𝑙𝑖𝑎𝑡𝑖𝑜𝑛 𝑑𝑖𝑝
𝑑 = 𝑅𝑒𝑎𝑙 𝑑𝑖𝑠𝑡𝑎𝑛𝑐𝑒 𝑎𝑐𝑟𝑜𝑠𝑠 𝑡ℎ𝑒 𝑠𝑡𝑟𝑢𝑐𝑡𝑢𝑟𝑒 𝑓𝑟𝑜𝑚 𝑡ℎ𝑒 𝑝𝑟𝑒𝑣𝑖𝑜𝑢𝑠 𝑝𝑜𝑖𝑛𝑡
𝐷 = 𝑅𝑒𝑎𝑙 𝑑𝑖𝑠𝑡𝑎𝑛𝑐𝑒 𝑎𝑐𝑟𝑜𝑠𝑠 𝑡ℎ𝑒 𝑠𝑡𝑟𝑢𝑐𝑡𝑢𝑟𝑒 𝑚𝑒𝑎𝑠𝑢𝑟𝑒𝑑 𝑓𝑟𝑜𝑚 𝑡ℎ𝑒 𝑢𝑝𝑝𝑒𝑟
𝑠𝑡𝑟𝑢𝑐𝑢𝑟𝑎𝑙 𝑏𝑜𝑢𝑛𝑑𝑎𝑟𝑦 𝑜𝑓 𝑡ℎ𝑒 𝐴𝐵
To find the azimuth of trace normal to structure (𝜐):
(1) 𝜐 = 𝛼 − 90
To find the angle between the distance measured from previous point along the
road and the horizontal distance normal to the structure azimuth (𝜂) (angle
between dm and dh):
(2) 𝜂 = 180 − (𝜇 − 𝜐) (𝑖𝑓 𝜇 > 180°)
𝜂 = 𝜇 − 𝜐 (𝑖𝑓 𝜇 ≠> 180°)

29
To find horizontal distance between samples located perpendicular to foliation
(dh):
(3) 𝑑ℎ = 𝑑𝑚 𝑐𝑜𝑠 𝜂
The dip is measured at each outcrop and converted to radians as discussed above.
To find the real distance across the main structure, which is the distance used in the
distance vs major element plots:
(4) 𝑑 = 𝑑ℎ 𝑠𝑖𝑛𝛽
(5) 𝐷 = ∑ 𝑑𝑖 i: number of sample locations
3.2 Geochemical Methods
3.2.1 Sample preparation
Major element geochemistry was determined by x-ray fluorescence (XRF),
using the Bruker S4 Pioneer XRF at the Department of Geosciences at the
University of Wisconsin-Milwaukee. To prepare a sample for XRF analysis, each
rock sample was broken into small, fresh fragments using a 4lb hammer. These
fresh, unweathered fragments were crushed into a powder using a Rocklabs
shatterbox mill for 4 minutes. Once the rock was powdered, the sample was
transferred into a glass vial and labeled. Each vial was placed in a low temperature
oven (105°C) for a period of 8-10 hours to dry. Samples were cooled in a glass
desiccator.

30
To calculate Loss On Ignition (LOI) for each sample, four empty crucibles
were pre-ignited for 5 minutes in a high temperature oven (1050°C) to burn off any
residual material, and then cooled in a desiccator. Each crucible was placed on a
balance and tared, and approximately 0.5g of sample was added. The sample
weight was recorded and the crucible and sample were weighed together and
recorded. Four crucibles at a time containing samples were placed into the high
temperature oven for 15 minutes. After 15 minutes each crucible was placed in the
desiccator until cool to the touch. The sample and crucible were then weighed and
recorded. The weight of the sample and crucible after heating was subtracted from
the weight of the sample and crucible before heating to measure the mass lost. This
mass lost was divided by the original mass of sample in the crucible and multiplied
by 100 to get an LOI percentage. This was entered into the XRF software before
analysis of the prepared samples.
To prepare glass beads for XRF analysis, we mixed 1g of powdered rock
sample with 1g of ammonium nitrate and 10 grams of a 50/50 lithium tetraborate/
lithium metaborate flux with an integrated LiBr non-wetting agent. The flux and
sample measurements need to be accurate to 0.0003g. This mixture was transferred
into a platinum crucible and fused in a Claisse M4 fluxer for ~21 minutes using a
pre-programed routine designed for silicate rocks. Each bead was then analyzed for
major, minor, and some trace elements using the Bruker S4 Pioneer XRF.

31
Concentrations were calculated using a calibration based on 11 USGS rock
standards (detailed methods of McHenry, 2009; Byers et al., 2017). For data
quality, the following standards are applied: 1) Elemental values should be more
than twice the lower limit of detection (LLD) and if not then they should be
eliminated, and 2) elements with more than 12% error should be eliminated. No
element analyzed in this data failed these standards and therefore no samples were
omitted.
3.2.2 Data plots
To visualize our elemental concentrations, two different plots are used; 1)
Geochemistry vs. distance from top of structure and 2) Isocon plot comparison.
The first plots demonstrate how major elements change across each transect with
distance from the top of the structure. Each graph is color-coded by rock domain as
follows: 1) Coarse-grained banded amphibolites containing clinopyroxene; dark
green shading, 2) Medium-grained banded amphibolites with no clinopyroxene;
bright green shading, 3) Sheared amphibolites; pale green shading and 4) Chlorite
mafic schists; pale blue shading. Areas of folds/microfolds are represented as a zig-
zag/ wavy symbol in the scale bar below each graph. The color-coding of the
graphs allows identification of major element trends as we move through the four
rock domains, from the top of the structure toward to the shear contact. This will

32
allow chemical characterization of the shear zone and possibly relate chemical
changes with metamorphism patterns.
The second analytical approach involves isocon plots, which are used
frequently in geochemical research (Webb and Golding, 1998, Whitbread and
Moore, 2004, Marsh e al., 2011). Isocon plots allow comparison of an altered
sample against its unaltered protolith to see which elements were lost or gained
during alteration of the system. For this research, a number of “protoliths” were
chosen to which the samples were compared. First, the samples were compared to
the unaltered protolith of each transect, which is a sample from domain one, the
coarse-grained banded amphibolites with pyroxene which were only affected by
D1 (figs. 14-19 top). This domain signifies the top of transect and the furthest from
the shear contact and therefore the most undeformed of the rocks sampled. These
rocks preserve the D1 deformation and, by using this rock as the unaltered
comparison, we can see which elements were gained or lost to the system as a
product of the retrograde metamorphism (D2). When comparing transects, it
became clear that there are differences in elemental composition between
“protolith” samples, so next the samples were compared to a “protolith” of average
MORB composition from Gale et al. (2013; figs 14-19 middle). A comparison to
MORB is reasonable because previous work (Bard 1969, Bard and Moine 1979,
Dupuy et al., 1979) determined that the AB had a MORB affinity. These isocon

33
plots contain all samples collected from each transect, so all samples (those that
experienced only D1 and those that experienced both D1 and D2) are compared to
the “protolith” for this analysis. A third method compared the samples of each
transect to an averaged, representative protolith. The protolith is an average
composition of the upper banded amphibolite domains across all transects (domain
1 and domain 2) that were unaffected by D2 and therefore preserve D1. A standard
deviation calculation was then performed on these values to obtain an upper and
lower range. Any samples with values outside of this field were omitted and a new
average was calculated (figs 14-19 bottom).
For all isocon plots, mass-balance considerations were ignored and the slope
is assumed to be 1:1 with no change in bulk composition. The 1:1 line is calculated
by joining all of the major element compositions within the unaltered protolith, so
any enrichments or depletions of elements will fall above or below this line,
respectively. In order to fit all of the major elements appropriately on one graph,
the weight percent of each element was adjusted using the following ratios:
SiO2: 1:0.5
Al2O3: 1:1
Fe2O3: 1:1.75
TiO2: 1:10

34
Na2O: 1:1
CaO: 1:1
MgO: 1:1
MnO: 1:30
P2O5: 1:5
K2O: 1:20
These adjustments were arbitrarily chosen to fit all of the elements evenly spaced
on the same graph to be readable without overlaps. These adjustments are
consistent throughout each transect. While scaling may affect the slope line and
yield misleading results (Mukherjee and Gupta, 2008), this is not the case for our
plots as all samples are compared against one value for each element within the
unaltered protolith. The isocon plots were color coded by each domain as well as
symbol-coded in areas of folding. The color coding is as follows: 1) Coarse-
grained banded amphibolites containing clinopyroxene (protolith); dark green
circle, 2) Medium-grained banded amphibolites with no clinopyroxene; bright
green circle, 3) Sheared amphibolites; pale green circle and 4) chlorite mafic
schists; pale blue circle. Samples collected in areas of obvious folding are
represented by the triangle symbol and colored according to the rock domain to
which they belong.

35
4. RESULTS
4.1 Geochemistry vs. distance from the top of the structure
Transect 1: (figs. 7a-c)
The 300 m mark, which approximately coincides with the sheared
amphibolite/mafic chlorite schist transition boundary, marks a decrease in Fe2O3,
TiO2, and MnO, and an increase in Al2O3. Within 100 m of the shear zone
boundary a sharp increase in MgO coincides with a decrease in SiO2 and Na2O.
P2O5 and CaO show varying trends of enrichment and depletion.
Transect 2: (figs. 8a-c)
The sheared amphibolite/mafic chlorite schist transition boundary is
approximately 200 m from the top of the structure. However, strain is not as
uniformly gradational as in transect 1 and sheared amphibolite appears again at
approximately the 250 m mark for about 70 m after the initial mafic chlorite schist
transition. The first sheared amphibolite/mafic-chlorite schist transition is marked
with a decrease in Fe2O3, TiO2, SiO2, and P2O5. Na2O decreases toward the shear
boundary. K2O, MnO, CaO, MgO, and Al2O3 show varying trends of enrichment
and depletion. Unlike the patterns seen in transect 1, there are no obvious changes
immediately adjacent to the shear zone.

36
Transect 3: (figs. 9a-c)
Few of the elements display prominent patterns with distance from the shear
boundary in transect 3. Al2O3 trends are relatively stable before showing chaotic
patterns after the sheared amphibolite/mafic chlorite schist transition. MgO shows
an increase immediately before the shear boundary. SiO2 and Na2O decrease at the
sheared amphibolite/mafic chlorite schist transition before increasing again toward
the shear boundary.
Transect 5: (figs. 10a-c)
Unfortunately, transect 5 had limited outcrops and thus limited samples.
The four samples collected only cover two domains; the medium-grained banded
amphibolite without pyroxene (domain 2) and the sheared-amphibolites (domain
3). The plots show an increase in SiO2 and Na2O from domain 2 to 3. All other
elements show no discernable trends.
Transect 6: (figs. 11a-c)
Transect 6 is another transect with relatively little outcrop and contained no
domain 2 (medium-grained banded amphibolites without clinopyroxenes), which
was likely covered. However, the most important units of the two retrograde
domains and the protolith were all sampled in this transect. The plots show a
37
steady decrease in SiO2, MgO, and K2O toward the shear contact. Na2O increases
at the banded amphibolite/sheared amphibolite boundary and then steadily
decreases towards the shear zone. Conversely, CaO decreases at the banded
amphibolite/sheared amphibolite boundary and then steadily increases towards the
shear zone with some variability in the chlorite schists.
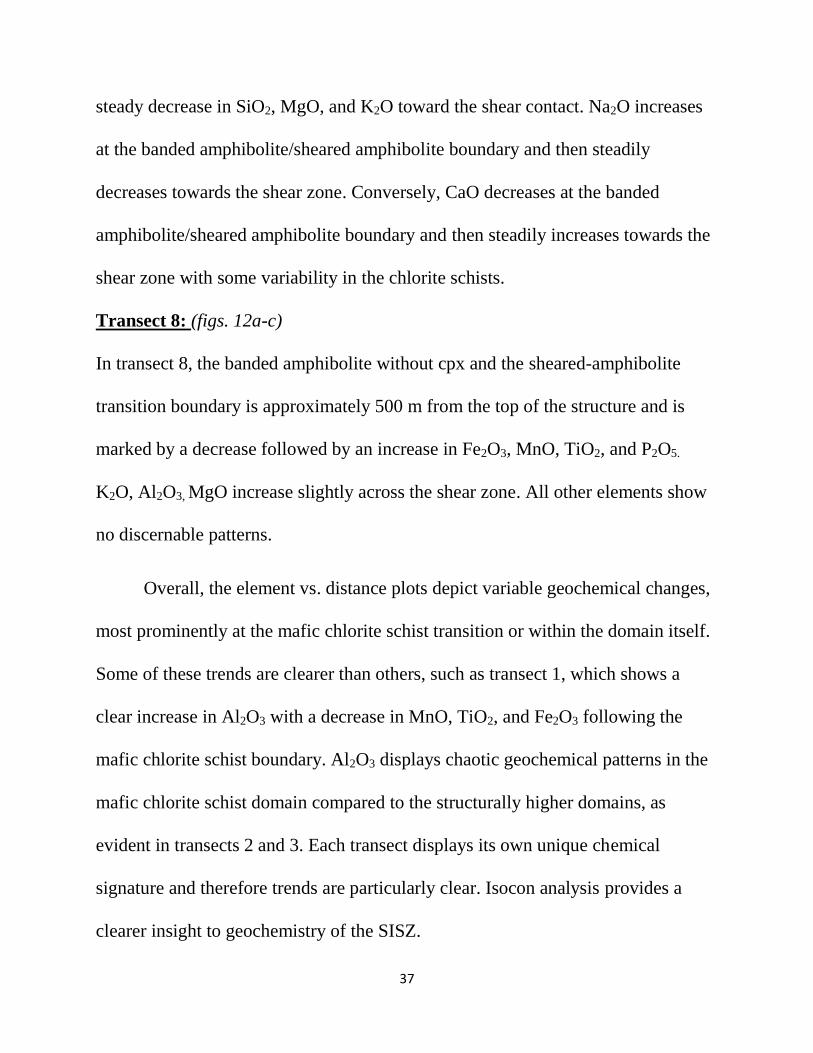
Transect 8: (figs. 12a-c)
In transect 8, the banded amphibolite without cpx and the sheared-amphibolite
transition boundary is approximately 500 m from the top of the structure and is
marked by a decrease followed by an increase in Fe2O3, MnO, TiO2, and P2O5.
K2O, Al2O3, MgO increase slightly across the shear zone. All other elements show
no discernable patterns.
Overall, the element vs. distance plots depict variable geochemical changes,
most prominently at the mafic chlorite schist transition or within the domain itself.
Some of these trends are clearer than others, such as transect 1, which shows a
clear increase in Al2O3 with a decrease in MnO, TiO2, and Fe2O3 following the
mafic chlorite schist boundary. Al2O3 displays chaotic geochemical patterns in the
mafic chlorite schist domain compared to the structurally higher domains, as
evident in transects 2 and 3. Each transect displays its own unique chemical
signature and therefore trends are particularly clear. Isocon analysis provides a
clearer insight to geochemistry of the SISZ.

38
Fig
ure
7a
. Tra
nse
ct 1
: Si
O2,
Al 2
O3, N
a2O
, an
d C
aO
va
ria
tio
n w
ith
dis
tan
ce f
rom
to
p o
f st
ruct
ure
(m
).

39
Fig
ure
7b
. Tra
nse
ct 1
: Mg
O, F
e 2O
3, M
nO
, an
d T
iO2
vari
ati
on
wit
h d
ista
nce
fro
m t
op
of
stru
ctu
re (
m).

40
Fig
ure
7c.
Tra
nse
ct 1
: K2O
an
d P
2O5
vari
ati
on
wit
h d
ista
nce
fro
m t
op
of
stru
ctu
re (
m).

41
Fig
ure
8a
. Tra
nse
ct 2
: Si
O2,
Al 2
O3, N
a2O
, an
d C
aO
va
ria
tio
n w
ith
dis
tan
ce f
rom
to
p o
f st
ruct
ure
(m
).

42
Fig
ure
8b
. Tra
nse
ct 2
: Mg
O, F
e 2O
3, M
nO
, an
d T
iO2
vari
ati
on
wit
h d
ista
nce
fro
m t
op
of
stru
ctu
re (
m).

43
Fig
ure
8c.
Tra
nse
ct 2
: K2O
an
d P
2O5
vari
ati
on
wit
h d
ista
nce
fro
m t
op
of
stru
ctu
re (
m).

44
Figure 8c. Transect 2: K2O and P2O5 variation with distance from top of structure (m).
Fig
ure
9a
. Tra
nse
ct 3
: SiO
2, A
l 2O
3, N
a2O
, an
d C
aO
va
ria
tio
n w
ith
dis
tan
ce f
rom
to
p o
f st
ruct
ure
(m
).

45
Fig
ure
9b
. Tra
nse
ct 3
: Mg
O, F
e 2O
3, M
nO
, an
d T
iO2
vari
ati
on
wit
h d
ista
nce
fro
m t
op
of
stru
ctu
re (
m).

46
Fig
ure
9c.
Tra
nse
ct 2
: K2O
an
d P
2O5
vari
ati
on
wit
h d
ista
nce
fro
m t
op
of
stru
ctu
re (
m).

47
Fig
ure
10
a. T
ran
sect
5: S
iO2
an
d A
l 2O
3, N
a2O
an
d C
aO
va
ria
tio
n w
ith
dis
tan
ce f
rom
to
p o
f st
ruct
ure
(m
).

48
Fig
ure
10
b. T
ran
sect
5: M
gO
, Fe 2
O3,
Mn
O, a
nd
TiO
2 v
ari
ati
on
wit
h d
ista
nce
fro
m t
op
of
stru
ctu
re (
m).

49
Fig
ure
10
c. T
ran
sect
5: K
2O a
nd
P2O
5 va
ria
tio
n w
ith
dis
tan
ce f
rom
to
p o
f st
ruct
ure
(m
).

50
Fig
ure
11
a. T
ran
sect
6: S
iO2
an
d A
l 2O
3, N
a2O
an
d C
aO
va
ria
tio
n w
ith
dis
tan
ce f
rom
to
p o
f st
ruct
ure
(m
).

51
Fig
ure
11
b. T
ran
sect
6: M
gO
, Fe 2
O3,
Mn
O, a
nd
TiO
2 va
ria
tio
n w
ith
dis
tan
ce f
rom
to
p o
f st
ruct
ure
(m
).

52
Fig
ure
11
c. T
ran
sect
6: K
2O a
nd
P2O
5 va
ria
tio
n w
ith
dis
tan
ce f
rom
to
p o
f st
ruct
ure
(m
).

53
Fig
ure
12
a. T
ran
sect
8: S
iO2
an
d A
l 2O
3, N
a2O
an
d C
aO
va
ria
tio
n w
ith
dis
tan
ce f
rom
to
p o
f st
ruct
ure
(m
).

54
Fig
ure
12
b. T
ran
sect
8: M
gO
, Fe 2
O3,
Mn
O, a
nd
TiO
2 va
ria
tio
n w
ith
dis
tan
ce f
rom
to
p o
f st
ruct
ure
(m
).

55
Fig
ure
12
c. T
ran
sect
8: K
2O a
nd
P2O
5 va
ria
tio
n w
ith
dis
tan
ce f
rom
to
p o
f st
ruct
ure
(m
).

56
4.2 Isocon analysis
Isocon plots were also used to assess major element changes across the four
domains. This method follows Grant (1986) and uses immobile elements, which do
not typically move during fluid rock interaction, to define a line, which also goes
through the origin. In this analysis we are comparing a range of samples to a
protolith sample and thus the line is defined by the composition of the protolith.
Data points that plot above this line represent samples that are enriched in a
particular element relative to the protolith. Data points that plot below this line
represent samples that are depleted in a particular element relative to the protolith.
These do not quantitatively show mass loss or gain, but rather a comparison of
samples closer to the shear zone with their protolith. For this analysis, three
different methods of isocon plots were used, each comparing the samples of each
transect to a different protolith each time. The first method compared the samples
of each transect to the furthest rock outside of the shear boundary in the associated
transect belonging to the banded amphibolite with cpx domain. This method
subsequently had different protoliths for each transect. The second method
compared the samples of each transect to a standardized protolith, the average
MORB-composition (Gale et al., 2013). The third method uses the average
protolith to determine a representative protolith. All of the upper banded
amphibolite domains across all transects (domain 1 and domain 2) that were

57
unaffected by D2 and therefore preserve D1, were compiled and averaged,
regardless on their position in the upper structures, and regardless of whether they
were folded. A standard deviation calculation was then performed on these values
to get an upper and lower range. Any samples with values outside of this field were
omitted and a new average was calculated. This third method is preferred because
of contrasting geochemical signatures among the protoliths of each transect, and
therefore comparing all samples to the same, averaged protolith composition
yielded more reliable results. Each transect has three isocon plots total depicting
the results of each method. All elements are shown on each isocon plot. The results
of each transect are as follows:
Transect 1: (fig. 14 top)
Within transect 1 there are no major elements that, when compared with the
unaltered protolith, show depletion or enrichment for all of the altered samples.
However, if we consider the mafic chlorite schists separately against the protolith
because of their proximity to the shear contact, all samples of this domain are
enriched in Al2O3 and CaO and depleted in Na2O, TiO2 , MnO, Fe2O3, and SiO2.
MgO, K2O and P2O5 are neither enriched nor depleted.
Transect 2: (fig. 15 top)

58
The isocon plots for transect 2 show a strong trend of K2O enrichment. Most
of the samples show enrichment of Al2O3 and MnO with depletion in SiO2. Na2O,
Fe2O3, TiO2, P2O5, MgO, and CaO show varying trends of enrichment and
depletion.
Transect 3: (fig. 16 top)
Contrary to trends in transect 2, the isocon plots for transect 3 show strong
depletion of K2O accompanied by an enrichment of SiO2 and Al2O3. Fe2O3, TiO2,
P2O5, Na2O, MnO, MgO, and CaO show varying trends of enrichment and
depletion.
Transect 5: (fig. 17 top)
Because of the limited domains represented in transect 5, the “protolith”
used in this isocon plot is from rock domain 2, the medium grained banded
amphibolite without pyroxene. This is not the same domain as the other protoliths,
however, it is the closest to the structural top of the metabasites for this transect.
The isocon plot shows a depletion of P2O5, MgO, Al2O3, TiO2 and Fe2O3 with an
enrichment in Na2O and SiO2. CaO, MnO and K2O show varying trends of
enrichment and depletion.
Transect 6: (fig. 18 top)
Because of the lack of banded amphibolites without clinopyroxene samples,
only sheared amphibolites and mafic schists are compared to the unaltered

59
protolith. The plot shows depletion of K2O, SiO2 and MgO along with an
enrichment in TiO2, Fe2O3, P2O5, and MnO. Na2O, CaO, and Al2O3 show varying
trends of enrichment and depletion.
Transect 8: (fig. 19 top)
The isocon plots for transect 8 show enrichment of K2O, MgO, Al2O3, and
SiO2 with depletion of P2O5, MnO, Fe2O3, and TiO2. Na2O and CaO show no
discernable trends.
The general trends for each element across each transect within the shear
zone, starting at the most western transect (T5) and moving east (T6) are
summarized below. The table indicates E if the majority of the samples are
showing enrichment, D if the majority of the samples are showing depletion and
N/A if the samples show no discernable trend of enrichment of depletion.
Element T5 T3 T1 T2 T6 T8
K2O N/A D N/A E D E
Al2O3 D E E E N/A E
SiO2 E E D D D E
TiO2 D N/A D* D E D
Fe2O3 D N/A D* N/A E D
P2O5 D N/A N/A N/A E D
Na2O E N/A N/A N/A N/A N/A
MnO N/A N/A D E E D
MgO D N/A N/A N/A D E
CaO N/A N/A E N/A N/A N/A Table 1. Table showing enrichments/depletions of elements as compared to each transects protolith across each transect. E=enriched
D=depleted
N/A=no trend
*in MCS samples only
60
In summary, as evident in Table 1, the results of method 1 show very
contrasting trends across each transect and fail to provide any consistent depletion
or enrichment trends.
These contrasting trends, especially for K2O, TiO2, and SiO2, prompted
analysis of the geochemical nature of the protoliths across the length of the shear
zone. Major element changes were analyzed separately within the banded
amphibolite with cpx domain (protolith), starting at the westernmost transect (T5)
toward the east (T8). By analyzing the protolith samples across each of these
transects, we can determine how similar or different the chemistry of this domain
is across strike, which is of vital importance for interpreting the isocon plots. The
distance between each transect is approximate, determined from Google Earth, and
spans a total of ~40km from west to east.
There are three datasets in this analysis for all elements: 1) the sample
collected from the top of each transect and used in the isocon plots (dark green
points connected with the line), 2) previous data collected by Castro et al., (1996)
(orange points) and 3) the remaining samples from T1 and T2 collected with the
others, but not used in the isocon plots (yellow dots). The reason for using the
second and third data points is to determine how representative the chemistry of
the first data set is.

61
From these plots (fig. 13) it is clear that there are contradicting trends in the
protolith samples across transect, most prominently in K2O, SiO2, and TiO2. For
reference, the mean MORB composition is added to each graph to compare the
validity of each protolith (Gale et al., 2013). For example, T3 and T6 have a
protolith that seems to be relatively enriched in K2O compared to the average
MORB, which explains why the rest of the samples of each transect are showing
depletion trends in their isocon plots (figs. 16 top and 18 top). On the other hand,
protolith samples in T2 and T8 fall within close range of the average MORB value
and therefore the K2O enrichment trends in each isocon (figs. 15 top and 19 top)
are considered more reliable than the depletion trends of T3 and T6. Similarly
when analyzing SiO2 across each transect we see that T3 and T8 have protoliths
depleted in SiO2 compared to the mean MORB content, which explains why the
isocon trends for these transects show SiO2 enrichment patterns in all samples
compared to the protolith (figs. 16 top and 19 top). The protolith for T6 is depleted
and T8 is enriched in TiO2 compared to the average MORB, which explains why
the T6 isocon displayed strong enrichment trends and why T8 displayed strong
depletion trends compared to their protoliths (figs 18 top and 19 top).

62
Figure 13. Plots showing element variation within the protolith samples across the length of the shear zone. Top: K2O variation across transects. Middle: SiO2 variation across transects. Bottom: TiO2 variation across transects. Transect 5 does not have a protolith sample and is therefore excluded.

63
From this it is clear that the geochemical nature of the protolith is not consistent
across the length of the shear zone and comparing the remaining samples in each
transect to their local protolith may not give accurate geochemical trends. To
obtain clearer results, each transect is compared to the same standardized protolith.
Previous publications (Bard, 1969) have attributed the Acebuches amphibolite
series to a tholeiitic ocean-basalt protolith (MORB), which prompted the
comparison to MORB, as averaged over 422 samples (Gale et al., 2013) (figs. 14-
19 middle). To compare each element correctly to this average MORB data, the
Fe2O3 values were converted to FeO (as published in Gale et al., 2013). This
changes our isocon plots to produce more consistent geochemical trends across the
length of the shear zone (figs 14-19 middle).
Transect 1 (fig. 14, middle)
Transect 1 shows enrichment of K2O and Al2O3 with depletion of SiO2.
MnO and TiO2 show depletion trends within the MCS only. P2O5, Na2O, MgO,
FeO, and CaO show varying trends of enrichment and depletion.
Transect 2 (fig. 15, middle)
Transect 2 shows enrichment of K2O and Al2O3 with depletion of SiO2 and
TiO2. P2O5, Na2O, MnO, MgO, FeO, and CaO show varying trends of enrichment

64
and depletion. MnO and Na2O may be considered depleted and enriched,
respectively, however due to their proximity to the line this is not a strong trend.
Transect 3 (fig. 16, middle)
The trends within transect 3 now contradict the original isocon trends
produced when compared to the protolith. Instead of a strong K2O depletion, trends
now display a strong enrichment that follows the trends of the other transects. This
enrichment is accompanied with an enrichment of Al2O3 with depletion of SiO2
and CaO. P2O5, Na2O, MnO, MgO, FeO, and TiO2 show varying trends of
enrichment and depletion.
Transect 5 (fig. 17, middle)
Transect 5 shows enrichment of K2O, FeO, and Na2O. P2O5 also shows
enrichment trends, however due to their proximity to the line this is not considered
a strong trend. MgO, CaO, and SiO2 show depletion trends. MnO, Al2O3, and TiO2
show varying trends of enrichment and depletion.
Transect 6 (fig. 18, middle)
Similar to previous transects, transect 6 shows strong enrichment of K2O with
depletion of SiO2. P2O5, Al2O3, Na2O, MnO, MgO, FeO, CaO, and TiO2 show
varying trends of enrichment and depletion. When only considering the MCS

65
samples, CaO shows enrichment. The scattered pattern of these samples suggests
significant alteration of samples.
Transect 8 (fig. 19, middle)
Transect 8 shows enrichment of K2O and FeO and depletion of SiO2 in most
samples. MnO also shows depletion trends however due to their proximity to the
line this is not considered a strong trend. CaO shows enrichment within MCS only.
P2O5, Na2O, MgO, Al2O3, and TiO2 show varying trends of enrichment and
depletion.
The general trends within of each element across each transect within the
shear zone, starting at the westernmost transect (T5) and moving east (T6) are
summarized below. The table indicates E if the majority of the samples are
showing enrichment, D if the majority of the elements are showing depletion and
N/A if the samples show no discernable trend of enrichment of depletion.
Element T5 T3 T1 T2 T6 T8
K2O E E E E E E
Al2O3 N/A E E E N/A NA
SiO2 D D D D D D
TiO2 N/A N/A D* D N/A N/A
FeO E N/A N/A N/A N/A E
P2O5 N/A N/A N/A N/A N/A N/A
Na2O E N/A N/A E N/A N/A
MnO N/A N/A D* D N/A D
MgO D D N/A N/A D N/A
CaO D D N/A N/A E* E*

66
Table 2. Table showing enrichments/depletions of elements as compared to average MORB values across each transect. E=enriched
D=depleted
N/A=no trend
*in MCS samples only
As you can see from Table 2 the most consistent trend across each transect is
depletion of SiO2 and enrichment of K2O.
The third method uses the average protolith in order to determine a
representative protolith as discussed above. Five steps were performed to find the
composition of the representative protolith: 1) All of the samples collected in the
two upper banded amphibolite domains were grouped into an excel file. 2) The
average of each element across all of the upper banded amphibolite samples was
calculated, regardless of the location of the sample across the structure and
regardless of whether they were folded or not. 3) A standard deviation (one
standard deviation) calculation was performed in excel for each element. From this
standard deviation value, upper and lower limits were put into place (upper
limit=average element composition + standard deviation, lower limit= average
element composition – standard deviation). 4) Any element values that were
outside of these upper and lower limits were discarded. 5) Once all of the outlying
samples were eliminated, a new average was calculated from the remaining values
and deemed the representative composition. The average values for each element
after the standard deviation correction do not differ from the average obtained prior
to the standard deviation correction, except for K2O, in which the most enriched

67
(or contaminated) protoliths were omitted. The average of the protoliths before and
after standard deviation removal are shown in Table 3.
Na2O MgO Al2O3 SiO2 P2O5 K2O CaO TiO2 Fe2O3 MnO
Average 1 (wt. %) 3.18 7.20 14.97 49.44 0.21 0.26 10.27 1.63 10.85 0.18 # included in average 1 22 22 22 22 22 22 22 22 22 22 Standard deviation (wt. %) 0.63 0.87 0.84 1.28 0.07 0.28 1.28 0.36 1.44 0.03 Range top (wt. %) 3.81 8.07 15.80 50.71 0.28 0.54 11.55 2.00 12.29 0.21 Range bottom (wt. %) 2.55 6.32 14.13 48.16 0.13
-0.02 8.99 1.27 9.41 0.15
# omitted 6 6 4 4 4 3 5 7 5 4 Average 2 (protolith) (wt. %) 3.03 7.03 14.96 49.46 0.21 0.16 10.12 1.56 10.79 0.18 # included in average 2 16 16 18 18 18 19 17 15 17 18
Table 3. Shows elemental averages before (Average 1) and after std dev. Correction (Average 2). For most elements these averages are similar, except for K2O which was reduced.
The average after the standard deviation removal were used for isocon plots (figs.
14 to 19 bottom). These trends show similar results to method two (MORB
protolith):
Transect 1 (fig. 14 bottom)
Transect 1 shows enrichment of K2O and Al2O3 with depletion of SiO2.
MnO and TiO2 show depletion trends within the MCS only. P2O5, Na2O, MgO,
FeO, CaO show varying trends of enrichment and depletion.

68
Transect 2 (fig. 15 bottom)
Transect 2 shows enrichment of K2O Al2O3, and CaO with depletion of TiO2
and Fe2O3. P2O5, Na2O, MnO, MgO, and SiO2 show varying trends of enrichment
and depletion.
Transect 3 (fig. 16 bottom)
The trends within transect 3 show K2O, Al2O3, and MnO enrichment with SiO2
depletion. P2O5, Na2O, MgO, CaO, Fe2O3, and TiO2 show varying trends of
enrichment and depletion.
Transect 5 (fig. 17 bottom)
Transect 5 shows enrichment of Na2O, and K2O with a depletion of MgO
and Al2O3. MnO, CaO, SiO2, Fe2O3, P2O5 and TiO2 show varying trends of
enrichment and depletion.
Transect 6 (fig. 18 bottom)
Transect 6 shows strong enrichment of K2O with depletion of SiO2 and
MgO. P2O5, Al2O3, Na2O, MnO, MgO, Fe2O3, and TiO2 show varying trends of
enrichment and depletion. When only considering the MCS samples, CaO shows
enrichment. The strong scattered pattern of these samples suggests signicant
alteration of samples.

69
Transect 8 (fig. 19 bottom)
Transect 8 shows enrichment of K2O and Fe2O3 in most samples. CaO shows
enrichment within MCS only. P2O5, Na2O, MnO, MgO, Al2O3, TiO2 and SiO2
show varying trends of enrichment and depletion.
The general trends for each element across each transect within the shear
zone, starting at the most western transect (T5) and moving east (T6) are
summarized below. The table indicates E if the majority of the samples are
showing enrichment, D if the majority of the elements are showing depletion and
N/A if the samples show no discernable trend of enrichment of depletion.
Element T5 T3 T1 T2 T6 T8
K2O E E E E E E
Al2O3 D E E E N/A N/A
SiO2 N/A D D N/A D N/A
TiO2 N/A N/A D* D N/A N/A
Fe2O3 N/A N/A N/A D N/A E
P2O5 N/A N/A N/A N/A N/A N/A
Na2O E N/A N/A N/A N/A N/A
MnO N/A E D* N/A N/A N/A
MgO D N/A N/A N/A D N/A
CaO N/A N/A E E E* E* Table 4. Table showing enrichments/depletions of elements as compared to average protolith values across each transect. E=enriched
D=depleted
N/A=no trend
*in MCS samples only
As you can see from Table 4 the most consistent trend across each transect is
enrichment of K2O, with a more moderate enrichment and depletion of Al2O3 and
SiO2, respectively.

70
Figure 14. Isocon plots for three methods for transect 1.

71
Figure 15. Isocon plots for three methods for transect 2.

72
Figure 16. Isocon plots for three methods for transect 3.

73
Figure 17. Isocon plots for three methods for transect 5.

74
Figure 18. Isocon plots for three methods for transect 6.

75
Figure 19. Isocon plots for three methods for transect 8.

76
5. DISCUSSION
5.1 Evaluating isocon methods
For isocon analysis, three methods were used to compare samples to a
“protolith.” Three different methods were attempted because in this case, it is not
obvious which is the best protolith or unaltered sample for comparison. First,
Method 1 compared samples to the furthest rock from the shear boundary within
the upper amphibolite domain within each transect. Therefore, this “protolith” was
a different rock for each isocon plot (each transect had a different “protolith”).
Next, Method 2 compared the samples of each transect to a standardized protolith,
the average MORB (Gale et al., 2013). MORB was selected in concordance with
previous publications (Bard 1969, Bard and Moine 1979, Dupuy et al., 1979) that
linked the Acebuches Metabasites with MORB-affinity. This MORB geochemistry
published by Gale et al., (2013) uses FeO whereas the geochemistry in this study
uses Fe2O3. Our Fe2O3 values were converted to FeO for accurate comparison to
the MORB geochemistry. Finally, Method 3 compared the samples to a calculated
average composition of the upper D1-amphibolite domains. This average was
calculated by using all of the concentrations of the D1 rocks except those outside
the standard deviation.

77
In some cases, Method 1 produces opposite trends between transects (e.g.
K2O enrichment in transects 2 and 8 and depletion in transects 3 and 6) because of
protolith variability. This method allowed recognition of the substantial differences
between D1 “protolith” samples, particularly for K2O. However, it does not offer a
dependable way to evaluate shear zone related changes in composition. Methods 2
and 3 give more consistent results because all samples are compared to a standard
“protolith.” Regardless of which is used, they show consistent trends across the
length of the shear zone.
When only considering Methods 2 and 3, all transects show, most
prominently, a strong enrichment in K2O and moderate depletion of SiO2. There
may also be weak enrichment in Al2O3, which is apparent in transects 1, 2, and 3.
When considering Method 3 only, CaO shows enrichment in MCS samples
compared to the average protolith in all transects except one (T5). In method 2 the
CaO content shows enrichment in MCS samples in transects 6 and 8, depletion in
T3 and T5 and no trends in T1 and T2. Both of these methods show depletion of
TiO2 in D2 samples across transects 1 and 2, which are both located in the central
portion on the shear zone. Method 3 shows depletion of Fe2O3 in transects 1 and 2
but also shows enrichment in transect 8. All other elements show variable trends.
There have been numerous studies performed on shear zones, all of which
produce varying results in response to shearing of various protoliths. For example,
78
shear zones cutting granitic rocks in various localities show increasing, constant, or
decreasing SiO2 contents with increasing deformation (e.g Beach, 1976, Vocke et
al, 1987, O’Hara, 1988, respectively). All other elements show similarly variable
behavior from one shear zone to another. It is clear that geochemical changes in
shear zones are not straight-forward, and that chemical variation within a shear
zone is a product of varying protoliths, fluid composition and source (internal or
external), and the P-T conditions under which shearing occurred. While many
elements in this study vary across the shear zone, the strong K2O enrichment with
moderate Al2O3 enrichment and moderate SiO2 depletion are consistent across all
transects using methods 2 and 3. This consistency suggests similar fluid
composition and fluid source, protolith, P-T conditions, and degree of fluid
infiltration across the length of the shear zone.
In conclusion, the geochemical trends of the shear zone as shown by three
methods of isocon analysis are as follows:
Method 1: Transect protoliths
K2O: Increases for T2 and T8, decreases for T3, T6, other transects vary
SiO2: Decreases for T1, T2, and T5, increases for T3, T6 and T8
Al2O3: Increases in all transects, except T5
TiO2: Decreases for T1, T2, T5, and T8, increases for T6, varies for T3

79
MgO, CaO, Fe2O3, Na2O, MnO, P2O5: no clear trends
Method 2: MORB-average protolith
K2O: Increases
SiO2: Decreases
Al2O3: Increases for T1, T2, T3, remaining transects shows no trend
CaO: Increases for T6 and T8; remaining transects show no trend
TiO2: Decrease in MCS in T1, T2
MgO, Fe2O3, Na2O, MnO, P2O5: no clear trends
Method 3: Average protolith with standard deviation
K2O: Increases
SiO2: Decreases in 3, 1, and 6, remaining transects show no trend
Al2O3: Increases in T1-T3, also increases, although less sharply, in the other
transects
CaO: Increases in all transects, except T3
TiO2: Decrease in MCS in T1, T2
Fe2O3: Decrease in T1 and T2, Increase in T8
MgO, Na2O, MnO, P2O5: no clear trends

80
5.2 Elemental trends
5.2.1 K2O
There is a clear and consistent K2O enrichment across all transects of the
shear zone. Due to the mobile nature of K2O and the unusual enrichment trends not
typical of a MORB-derived rock, it is plausible that this K2O was transported into
the shear zone during fluid infiltration from an external source. Due to the absence
of potassium-rich minerals such as biotite or muscovite, it is likely the additional
K2O is being incorporated into the amphibole and chlorite structures. K2O
enrichment is consistent across the shear zone, but the degree of K2O enrichment
varies. The enrichment of potassium across the entirety of the shear zone within
all lithologies including those far from the shear zone as far as the upper D1-
domains, suggests that fluid infiltration could have spanned across a wider area
than originally thought. Minor epidote veins were seen in the D1 domains, which
suggest that some very localized fluid infiltration occurred in these areas during
D2, but does not explain the K2O. Considering the metabasites overthrust a
sequence of metamorphosed sediments (accretionary prism of the PdL), it is
possible that fluid-rock interaction with these PdL sediments produced the K2O
and perhaps the Al2O3 that was added to the metabasites.
K2O enrichment is particularly important when considering strain softening
because K2O alteration is expected to increase production of micas, clays, and

81
chlorite. These phyllosilicate minerals retain water, and therefore the amount of K
added partly controls the proportion of H2O retained within the rock (Tomkins et
al., 2009). This could create a reinforcing feedback for fluid-rock interaction, in
which the fluid promotes phyllosilicate production that in turn retains more water
for phyllosilicate productions and softens rock, promoting strain localization.
Tomkins et al., (2009) suggests that the typical assemblage of mafic rocks
that have not been subjected to K metasomatism is
chlorite+plagioclase±quartz±actinolite but states that increasing K alteration
promotes the growth of biotite and muscovite at the expense of chlorite. There is
no formation of biotite or muscovite in the rocks within the SISZ, which is
surprising due to the higher than average K2O value. This is most likely because
typically potassium-rich phyllosilicates, such as muscovite, biotite, or phengite,
have K2O values between ~8.01 and ~11.53 wt. % as reported from studies in
Deer, Howie and Zussman (2013). While the SISZ samples are enriched in K2O
compared to their MORB-protolith, they are not necessarily enriched enough for
these potassium-dominated minerals to grow. It is more likely that the additional
K2O was incorporated into the structures of the amphiboles that occur within the
SISZ. The amphiboles are more specifically hornblendes, calcic amphiboles
(Díaz-Azpiroz 2000). The upper amphibolite domains and the sheared
amphibolites are dominated by magnesiohornblendes in which a combination of

82
edenite and pargasite substitution dominates (Díaz-Azpiroz 2000). The structure of
magnesiohornblende does not easily incorporate K, however the edenite and
pargasite substitutions replace Si with Al and incorporate Na in an otherwise
vacant A-site. More specifically, edenite substitutions commonly replace one Si
with an Al, while pargasite substitutions replace two Si for two Al, which is
balanced partly by Al for (Mg, Fe) and Na in the A-site. Both of these substitutions
introduce Na into the A site, however, it is common for K and Na to be
interchangeable and therefore it is possible that the increasing K is being
incorporated more readily into these A-sites over Na. This may explain the
increase in both of these elements within the protolith domains as the amphibole
readily took them in within its structure.
The amphiboles within Mafic Chlorite Schist domains are much more
heterogeneous and actinolite, hornblende, edenite, pargasite, and hastingsite
coexist (Díaz-Azpiroz 2000). Here, the most important substitution is pargasite,
which is accompanied by minor edenite, tschermakite, Fe- and Ti-tschermakite
substitutions. All of these amphiboles, except actinolite, are relicts of D1. Diaz-
Azpiroz (2000) also documents sporadic potassium feldspar grains within the
mafic chlorite schists, which may incorporate some K2O; however, it is not
expected that any of these rare K-feldspar samples were sampled in this study.
83
While there are no obvious geochemical trends occurring for Na2O, the
plagioclase chemistry seems to get more sodic as we move down the Acebuches
structure toward the shear boundary (Díaz-Azpiroz 2000). This is due to the
increased stability of Na-rich plagioclase at lower temperatures in the greenschist
facies. The presence of sodic plagioclase, more specifically andesine rimmed by
oligoclase, and the presence of minor albite in the MCS suggests the Na2O remains
constantly bound within the plagioclase structure, allowing K to substitute easily in
the typical Na-occupied A-site of the amphiboles.
5.2.2 Al2O3:
Using method 1 we see enrichment trends for Al2O3 in all transects, except
for T5, which shows depletion. Method 2 shows enrichment in transects 1, 2, and
3, with varying trends in 5, 6, and 8. Method 3 shows enrichment in transect 1, and
2, with varying trends in the remaining transect. From this it is clear that there is a
consistent enrichment in transects 1 and 2 using all three methods. The distance
plots also show steady enrichment across domains 1-3 and a chaotic, spiked
character of Al2O3 within the MCS. This chaotic spiked geochemical pattern, most
noticeable in transect 2 and 3, is a common indication of kilometer scale
dissolution and transport (O’hara and Blackburn 1989, Goddard and Evans 1995).

84
The overall enrichment of Al2O3 across the strain gradient within the
transects could be because either 1) The immobile nature of Al2O3 reveals a
relative enrichment after loss of more mobile constituents toward the shear
boundary or 2) The banded amphibolites from the top of the structure, that
preserve the HT/LP D1 deformation, are depleted in aluminum compared to the
rocks toward the shear contact. Aluminum is assumed to be immobile during fluid-
rock interaction and therefore Al2O3 is often used to determine the slope line for
isocon plots (e.g. Grant 1986, Ferry 1987). Beitter et al., (2008) argue, however,
that Al can be mobile within medium-high grade metamorphic rocks, and that
sufficient amounts of Al can be transported in medium-to high grade metamorphic
fluids. The fluid expulsions during the dehydration of these rocks during the D1
HT/LP metamorphism could have carried Al2O3 out of the system. Bebout and
Barton (1989) also record Al mobility on a local scale. Since we do not know the
origin and composition of the fluid considered in this study, this remains uncertain.
5.2.3 SiO2
The depletion of SiO2 in transects 3, 1, and 6 suggests fluid moving through
the shear zone removed SiO2 from the system. If so, the incoming fluid would have
been undersaturated in silica. The removal of Si may promote some of the edenite
or pargasite substitutions, by prompting removal of Si in order for the Al to easily

85
replace Si. By promoting this substitution it may also be promoting the
incorporation of K into the A site.
5.2.4 CaO:
CaO shows varying patterns of enrichment and depletion, however, all mafic
chlorite schists are enriched across all samples compared to the protolith in most
transects (except T5) of the shear zone using method 3. Certain minerals may
increase the CaO content within the MCS, such as epidote and the various calcic-
amphiboles present. The Ca necessary for epidote formation was probably released
from the An-rich plagioclase as they became more unstable at lower temperatures
toward the shear zone.
5.2.5 TiO2
TiO2 shows depletion trends in the MCS domain in transects 1 and 2 across all
three isocon methods. In the distance plot, transect 1 shows depletion of TiO2 at the
amphibolite/mafic chlorite schist transition boundary, and transect 2 shows a more
gentle decrease with distance from the top of the structure. Due to the immobile
nature of TiO2, it is frequently used as an immobile element for 1:1 lines on isocon
plots (Goddard and Evans, 1995). Not only would we expect this element not to
move into solution, but it is common to see a relative enrichment in TiO2 within
altered rocks due to the loss of more mobile elements from the system, which is
not apparent across any of the transects.

86
Díaz-Azpiroz (2000) documented a titanite-present lithology that sometimes
exists between the banded amphibolites without clinopyroxene and the sheared
amphibolites. From highest to lowest grade within the banded amphibolites that
preserve D2 deformation, he documents: banded amphibolites with clinopyroxene,
banded amphibolites without titanite and without clinopyroxene, and banded
amphibolites with titanite and without clinopyroxene. This minor lithology was not
considered important before sampling, and therefore was not a rock domain used
here. It may have been sampled within rock domain 2, banded amphibolites
without pyroxene. If this is the case, the high content of titanium within titanite
would produce plots in which the banded amphibolites are enriched compared to
samples toward the shear zone boundary, which is observed in transect 1. A large
spike of titanium within transects 1 and 2 occur in the banded amphibolites without
clinopyroxenes, and therefore these samples may be this titanite rich lithology.
Transect 8’s protolith is the most enriched in titanium, which is related to the
HT/LP metamorphic event that exceeded the titanite-out isograd and subsequent
movement of titanium into ilmenite and magnetite grains (Díaz-Azpiroz, 2000). In
this model, during the HT/LP metamorphic event, the titanite phase was reduced to
form ilmenite.
(1) Oxidized mafic phase+ttn=reduced mafic phase+Ilm+O2.
87
This does not explain why T1 and T2 show depletion patterns compared to the
MORB protoliths (figs 14 and 15 middle).
5.3 Data limitations
It is important to note certain limitations when it comes to the reliability of
each transect’s data. Starting at the western end of the shear zone, due to lack of
outcrop, transect 5 contains limited samples and subsequently limited domains.
Transect 5 only contains 4 samples from only two domains (banded amphibolite
without clinopyroxene and sheared amphibolites). Since this transect contains
neither the “protolith” nor the most deformed domain, mafic chlorite schists, the
data from this transect is not considered strong nor reliable.
Transect 3 contains 17 samples, including samples from each of the four
domains. For the most part, transect 3 has a continuous, gradational strain gradient
(low to high) apart from a few appearances of sheared amphibolites that appear
within the mafic chlorite schist domain.
Transects 1 and 2 are well exposed transects that allowed sufficient sampling
across all four domains. Transect 1 offered a gradational, consistent strain gradient
from low to high strain toward the shear zone. Transect 2, like transect 3, has a
gradational strain gradient (low to high) apart from a few appearances of sheared
amphibolites that appear within the mafic chlorite schist domain.

88
Transect 6 is a limited sample transect, with 6 samples covering 3 of the
domains (minus the protolith). Transect 8 is a densely sampled transect that covers
all four domains and offers a consistent strain gradient. However, it contains areas
that are highly folded.
Each domain has a different grain size, which grades from coarse (2mm) in
the banded amphibolites with clinopyroxene at the top of the structure, medium
grained (1-2mm) in the banded amphibolites without clinopyroxene, <1mm in the
sheared amphibolites and eventually very-fine grained in the mafic chlorite schists
at the shear contact. Because of this difference in grain size, each domain requires
a different powdered sample amount in order for the XRF results to be
representative of the bulk composition of the rock. For the coarser-grained rocks at
the top of the structure more grains are required in order for the powdered sample
to be representative of the bulk. For example, certain elements (Ti, P) are tied to
particular trace phases, such as apatite. If the trace phase is not included in the
powdered sample, the abundances of the associated elements are decreased. Due
to the large sample required for the coarse-grained rocks and the difficulty of
obtaining a powdered sample due to the solid nature of the rock, certain
discrepancies may be present in the data for such elements. The sheared
amphibolite and mafic chlorite schist domains are fine-grained, and therefore there
is more certainty associated with the representative-nature of the samples. When

89
the average of the upper banded amphibolite domains was calculated, it fell in very
close range to the values of MORB-geochemistry, which suggests the samples
obtained in the coarse-grained domains are sufficient.
5.4 Major element changes and metamorphic reactions, structural fabrics, and
distance from shear zone
The most obvious trends across the shear zone are enrichment in K2O, Al2O3
and CaO with depletion in SiO2. The next step is to consider where these changes
occur with regards to the lithology of the shear zone.
Al2O3 is enriched in transects 1, 2, and 3. The distance graph (fig. 7a) for
transect 1 indicates that this increase in Al2O3 occurs right at the transition between
sheared amphibolites and mafic chlorite schists. Transects 2 and 3 (figs. 8a and 9a)
also suggest that the increase occurs at this boundary as they display relatively
stable chemical trends, denoted by a relatively flat line, until the pattern changes to
chaotic and spiked at the mafic chlorite schist boundary. This chaotic geochemical
pattern is usually indicative of fluid-interaction and suggests that much of the
Al2O3 alteration occurs within this lithology.
SiO2 is depleted across transects 1, 3, and 6. In transect 1 (fig. 7a) most of
the SiO2 is lost after the mafic chlorite schist boundary, particularly 100m from the
shear contact. Transect 3 (fig. 9a) shows a steady decrease in silica right after the

90
transition from the banded amphibolites of D1 and the sheared amphibolites of D2.
There are a few spikes within the mafic chlorite schist domain, however, most of
the silica-lows in the transect are confined to this domain. This suggests that SiO2
depletion happened primarily in the lithologies that underwent retrograde
metamorphism.
CaO is enriched across the easternmost transects 2, 6, and 8 (figs. 8a, 11a,
12a). This enrichment seems to take place at the transition between the D1 and D2
domains, the banded amphibolites with clinopyroxene and the sheared
amphibolites. While the geochemical pattern for transects 2 and 8 are chaotic, they
show an increase at the onset of the sheared amphibole domain and onwards.
Transect 6 shows a clear, steady increase in CaO from the sheared amphibole
boundary.
The plots for K2O are chaotic and do not appear to show a relationship
between enrichment and lithology. It appears that there is no pattern to the K2O
enrichment, which is random across all domains of the shear zone.
Most of the geochemical changes occur within the domains that underwent
retrograde metamorphism, sheared amphibolite and to a greater extent, the mafic
chlorite schists. Chlorite and epidote are both present exclusively in the sheared
amphibolite and mafic chlorite schist domains, but mostly in the latter. The
91
retrograde reaction that dominated the mafic chlorite schists was probably:
Hornblende + fluid Chlorite + Actinolite + Epidote + Qtz. This fluid-assisted
breakdown of hornblende weakened the rock, as the chain-silicate structure of
hornblende is much stronger than the phyllosilicate and sorosilicate structures of
chlorite and epidote, respectively. Sharp and Buseck (1988) demonstrated that
retrograde growth of chlorite in place of amphibole is typically parallel or
subparallel to the amphibole orientation. This suggests the growth of chlorite in the
SISZ could have been parallel to strike of the shear zone, demonstrated by NW/SE
aligned amphiboles. The alignment of chlorites in place of amphiboles could have
created a much weaker rock and perhaps lead to strain softening and strain
localization. This could be the reason the shear fabrics extend much more broadly
into the Acebuches Metabasites relative to the neighboring Pulo do Lobo terrane.
The geochemical trends discussed above, apart from K2O, seem to have
occurred in these domains where epidote and chlorite were present, suggesting that
the increased fluid flow in these areas facilitated in both the weakening of the rock
and geochemical alteration.
5.5 Fluid composition
The geochemical alteration across the shear zone allows us to elucidate the
nature of the fluid that moved through the shear zone during the D2 retrograde

92
metamorphism. The depletion of SiO2 across three transects suggests the fluid
could have been silica undersaturated. The mobile nature of K2O and the
unexpected enrichment of it in rocks of MORB-affinity suggests the fluids that
interacted with the shear zone brought the K2O from elsewhere. The Acebuches
metabasites overthrust the PdL terrane which is interpreted to be a metamorphosed
accretionary prism, and therefore it is plausible that the schists of the PdL were a
K2O source. Interestingly, the mafic chlorite schists seem to be enriched in CaO,
despite the plagioclase becoming more sodic toward the shear boundary. CaO is
required for the formation of epidote. Moreover, transects 1 and 2, which are
located in the center of the shear zone, display depletion trends in Fe2O3 and TiO2
within their mafic chlorite schist domains.
5.6 Fluid pathways
The K2O-rich nature of the fluid, along with the possibility that it was also
enriched in Al2O3 and CaO, suggest that it may have passed through the PdL
terrane prior to interacting with the Acebuches Metabasites. To confirm this,
geochemical samples across the PdL terrane would be needed to assess any K2O
depletions related to fluid-interaction. However, determining geochemical changes
within the PdL would not be easy due to the heterogeneous nature of the rocks
within this domain.
93
When considering the pathways of fluid flow within shear zones, it is useful
to consider the Conduit-Barrier Fluid Flow model (Yonkee et al., 2003) (fig. 20).
Typically, when a fluid of any origin moves through a shear zone, it does so in
localized pathways. The positive feedback between fluid-flow, metamorphism, and
strain softening leads to strain localization, which is often accompanied by the
alignment of phyllosilicate minerals. This alignment of phyllosilicates creates a
conduit for fluid flow to move in a manner which is parallel to the strike of the
shear zone. On the other hand, this alignment of phyllosilicate minerals creates
anisotropic impermeability to the rocks on either size of the shear zone and
therefore the phyllosilicates act as a barrier for lateral fluid flow (cross-fault flow)
(McCaig, 1987, Selverstone et al., 1991, Barton et al., 1995, Caine et al., 1996,
Kisters et al., 2000, Barnes et al., 2004). This model is applicable to a variety of
conditions including in the shallow crust (Bense and Person, 2006 and Boulton et
al., 2016) and in deeper conditions (Yonkee et al., 2013 and Quilichini et al.,
2015). By this model, we would expect to see the elemental changes confined to
the SISZ, however, there is evidence that the fluid in the SISZ did not behave as
localized to the shear zone as expected. The sporadic enrichment of K2O across all
domains of the shear zone, including the upper amphibolite domains, is evidence
for cross-fault flow, which originates from the metamorphosed accretionary prism
of the PdL terrane (fig. 20). Yonkee et al., (2003) also documents chemically

94
altered rocks outside of a shear zone, which he attributes to late fractures that
create localized pathways for fluid to reach rocks outside of the shear zone. The
greenschist facies metamorphism in the SISZ is associated with temperatures
which are close to the brittle-ductile transition zone and therefore it is plausible
that late, localized fractures created conduits for lateral fluid flow. This is evident
from the seemingly “random” enrichment of particular protolith samples and not
others, as well as epidote veins recorded in the upper banded amphibolite domains.
Figure 20. The Conduit-Barrier Fluid flow model. Alignment of phyllosilicates favors parallel fluid flow and limits cross-fault flow.

95
6. CONCLUSION
In summary:
1. The average protolith with standard deviation isocon method yields better
and more consistent results than the other two isocon methods tested.
2. Using this method, the clearest geochemical trends across the shear zone are
increases in K2O, Al2O3, and CaO with a decrease in SiO2.
The most prominent geochemistry trends of the SISZ document an enrichment
in K2O with a more moderate increase in Al2O3, along with a moderate depletion of
SiO2. These enrichment and depletion trends are interpreted to be a consequence of
fluid-rock interaction, which may have brought fluids rich in these elements from
the underlying metamorphosed accretionary prism, onto which the Achebuches
metabasites were thrust.
Because of the clear variation in major elements within “protoliths” across
the length of the shear zone, the presumed localization of the fluid must be
reconsidered. Other studies document fluid-rock interaction that is confined into
shear bands due to a positive feedback between strain softening, strain localization,
and subsequent development of favorable fluid pathways within shear zones
(Yonkee et al., 2013). Due to the inconsistent protolith chemistry across the length
of the shear zone, it is possible that the fluid did not behave as locally as the

96
Conduit-Barrier Fluid Flow model suggests but instead reached outer areas of the
shear zone through localized fractures. However, fluid interaction near the shear
zone boundary did play a role in strain-softening and partial strain localization
caused by the interaction and subsequent breakdown of hornblende and plagioclase
to produce chlorite and epidote, which are weaker minerals. This fluid infiltration
and the associated textural softening and grain-size reduction probably enhanced
strain accumulation and may explain why the shear fabrics extend more broadly
into the metabasites compared to the PdL. While it is not known whether the fluid
promoted shear development or the shear zone provided a more favorable conduit
of flow, or whether it was an amalgamation of both, fluid interaction with this
shear zone is evident.

97
7. FUTURE WORK
Future work would include extensive geochemical analysis of the Pulo Do
Lobo terrane to try and constrain the source of the fluid that moved through the
SISZ. The K2O enrichment across the shear zone suggests that the metamorphosed
accretionary prism (PdL) is a plausible source. If this is true, it is expected that
geochemical analysis of the PdL would reveal a depletion of K2O as it moved into
a fluid that eventually moved through the SISZ.
Because of the complexity of shear zone geochemical characterization,
future work should combine this major-element analysis with trace-element
analysis and mass-balance calculations to understand the fluid-rock interaction in
greater detail (Beinlich et al, 2010). The addition of K, a large-ion-lithophile
element (LILE), to our rocks implies an external fluid source and therefore using
trace elements would allow identification of other LILE and LREE additions to the
system to better constrain the composition and source of the incoming fluid. This
may help us understand whether the fluids came from the neighboring PdL terrain.
Other studies use trace elements to understand fluid-rock interaction (e.g. You et
al., 1996, John et al., 2008, Beinlich et al, 2010).
Mass balance and microprobe analysis allows a quantitative understanding
of element mobility during fluid infiltration and metamorphic reactions. By

98
understanding the chemical composition of the minerals within each domain, it
will allow for a better understanding of how the elements are moving within the
shear zone and which minerals are incorporating which elements, such as K2O. By
determining volume loss, we can better understand the feedback system between
fluid-rock interaction and element mobility, as volume loss leads to enhanced fluid
infiltration (Straaten et al., 2008), which enhances element mobility. Possible
volume loss also has implications for prior kinematic analyses (Fernandez et al.,
2013) because differential volume loss affects the orientations of strain fabrics that
are used to constrain kinematic models.
Other possibilities include isotope and electron-microprobe analysis to
understand fluid-rock interaction in greater detail. For example, Losh (1997) uses
grain-scale Sr isotopic variations in amphibolites to understand fluid origins and
flow behavior of a retrograde fluid, such as composition/source of the external
fluid and how many, or few, fluid influxes occurred. Similarly, variations in
oxygen isotopes are commonly used to understand mass transfer and unravel the P-
T-t-fluid evolution of the crust (Chamberlain and Conrad, 1993, John et al., 2008).
It would be advantageous to determine whether the fluids moving through
the shear zone are meteoric, magmatic, or metamorphic in nature by analyzing
fluid inclusions that become trapped during crystal plastic deformation. Fluid
inclusions rich in CO2 represent immiscible fluids associated with metamorphism

99
whereas saline brines represent immiscible fluids associated with the
crystallization of magma (Siebenaller et al., 2012). A meteoric fluid source is
distinguished from these two by hydrogen isotope (δD) values, where meteoritic
fluid is characterized by lower δD values between -40 and -46‰ and
metamorphic/magmatic fluids are characterized by δD values between -56‰ and -
66 ‰ (Siebenaller et al., 2012).

100
8. REFERENCES
Ault, A.K., Selverstone, J., 2008, Microtextural constraints on the interplay
between fluid-rock reactions and deformation. Contrib. Mineral Petrology,
156, 501-515.
Austrheim, H., 1986, Eclogitization of lower crustal granulites by fluid
migration through shear zones. Earth and Planetary Science Letters 81, 221-
232.
Axen, G., J., 2001, High-temperature embrittlement of extensional Alpine
mylonite zones in the midcrustal ductile-brittle transition. Journal of
Geophysical Research 106, 4337-4348.
Bard, J. P., 1969, Le metamorphisme regional progressif des Sierras
d'Aracena en Andalousie occidentale (Espagne): sa place dans le segment
hercynien sud-iberique. Theses, USTL Montpellier. 397p.
Bard, J.P., Moine, B., 1979, Acebuches amphibolites in the Aracena
Hercynian metamorphic belt (southwest Spain): Geochemical variations and
basaltic affinities, Lithos 12, 271-282.
Barnes, J. D., Selverstone, J., Sharp, Z. D, 2004, Interactions between
serpentine devolitization, metasomatism and strike-slip strain localization
during deep-crustal shearing in the Eastern Alps. Journal of Metamorphic
Geology 22(4), 283-300.
Barton, C.A., Zoback, M.D., Moos, D., 1995, Fluid flow along potentially
active faults in crystalline rock. Geology, 23, 683-686.
Beach, A., 1976, The interrelations of fluid transport, deformation,
geochemistry and heat flow in early Proterozoic shear zones in the Lewisian
Complex, Philos. Trans. R. Soc. London, 280, 569–604.
Beach, A., 1980, Retrogressive metamorphic processes in shear zones with
special reference to the Lewisian complex. Journal of Structural Geology, 2,
257-263.
Bebout, G.E., and Barton, M.D., 1989, Fluid flow and metasomatism in a
subduction zone hydrothermal system: Catalina Schist terrane, California.
Geology, 17, 976-980.
Beinlich, A., Klemd, R., John T., Gao, J., 2010, Trace-element mobilization
during Ca-metasomatism along a major fluid conduit: Eclogitization of
blueschist as a consequence of fluid-rock interaction. Geochemica et
Cosmochimica Acta, 74, 1982-1922.

101
Beitter, T., Wagner, T., Markl, G., 2008, Formation of kyanite-quartz veins
of the Alpe Sponda, Central Alps, and Switzerland: implications for Al
transport during regional metamorphism. Contribution to Mineralogy and
Petrology, 156, 689-707.
Bense, V.F., and Person, M.A., 2006, Faults as conduit-barrier systems to
fluid flow in siliciclastic sedimentary aquifers. Water Resources Research,
42.
Boulton, C., Mensies, C.D., Toy, V., G., Townend, J., Sutherland, R., 2016,
Geochemical and microstructural evidence for interseismic changes in fault
zone permeability and strength, Alpine Fault, New Zealand. Geochemistry,
Geophysics, Geosystems.
Byers, H.L., McHenry, L.J., Grundl, T.J., 2016, Forty-nine major and trace
element concentrations measured in soil reference materials NIST SRM
2586, 2587, 2709a, 2710a, 2711a using ICP-MS and Wavelength Dispersive
XRF. Geostandards and Geoanalytical Research.
Caine, J.S., Evans, J.P., Forster, C.B., 1996, Fault zone architecture and
permeability structure. Geology, 24, 1025-1028.
Carter, N.L., Kronenberg, A.K., Ross, J.V., Wiltschko, D.V., 1990, Control
of fluids on deformation of rocks. In: Knipe, .R.J., Rutter, E.H. Eds.,
Deformation Mechanisms, Rheology and Tectonics. Geol. Soc. Spec. Publ.
54, 1–13.
Castro, A., Fernández, C., de la Rosa, J. D., Moreno-Ventas, I., Rogers, G.,
1996, Significance of MORB-derived amphiboles from the Aracena
Metamorphic Belt, southwest Spain, J. Petrol. 37, 235–260.
Castro, A., Fernandez, C., El-Hmidi, H., El-Biad, M., Dıaz, M., Rosa, J.D.,
and Stuart, F., 1999, Age constraints to the relationships between
magmatism, metamorphism and tectonism in the Aracena metamorphic belt,
southern Spain, Int.J.EarthSci. 88, 26–37.
Chamberlain, C.P., and Conrad, M.E., 1993, Oxygen-isotope zoning in
garnet: A record of volatile transport. Geochimica et Cosmochimica Acta,
57, 2613-2629.
Cox, S. F., 2002, Fluid flow in mid- to deep crustal shear systems:
Experimental constraints, observations on exhumed high fluid flux shear
systems, and implications for seismogenic processes. Earth Planets Space
54, 1121-1125.
Crespo-Blanc, A., and Orozco, M., 1988, The southern Iberian shear zone: A
major boundary in the Hercynian folded belt, Tectonophysics, 148, 221–227.
Dahn, D. R. L., Braid, J. A., Murphy, J. B., Quesada, C., Dupuis, N.,
Mcfarlane, C. R. M., 2014, Geochemistry of the Peramora Mélange and Pulo

102
do Lobo schist: geochemical investigation and tectonic interpretation of
mafic mélange in the Pangean suture zone, Southern Iberia. Int. J. Earth Sci.
1415–1431.
Deer, W.A., Howie, R.A., and Zussman, J., 2013, An introduction to rock
forming minerals. The Mineralogical Society.
Díaz Azpiroz, M., 2000, Evolucion tectono-metamorfica del dominio de alto
grado de la banda metamorfica de Aracena. Tesis Doctoral, Univ.
Huelva. Publicada en 2006 en: Lab. Xeol. Laxe, Serie Nova Terra, 36, 857
pages.
Díaz Aspiroz, M., Lloyd, G. E., Fernández, C., 2007, Development of lattice
preferred orientation in clinoamphiboles deformed under low-pressure
metamorphic conditions. A SEM/EBSD study of metabasites from the
Aracena metamorphic belt (SW Spain). Journal of Structural Geology 29,
629-645.
Díaz-Azpiroz, M., Fernández, C., 2005, Kinematic analysis of the Southern
Iberian shear zone and tectonic evolution of the Acebuches metabasites (SW
Variscan Iberian Massif). Tectonics 24, TC3010.
Díaz Azpiroz, M., Fernández, C., Castro, A., El-Biad, M, 2006,
Tectonometamorphic evolution of the Aracena metamorphic belt (SW
Spain) resulting from ridge‐trench interaction during Variscan plate
convergence." Tectonics 25, TC1001.
Dupuy, C., Dostal, J., Bard, P., 1979, Trace element geochemistry of
Paleozoic amphibolites from S.W. Spain. Minerology and Petrology, 29, 87-
93.
Fernández, C., Czeck D., Díaz-Azpiroz, M., 2013, Testing the model of
oblique transpression with oblique extrusion in two natural cases: Steps and
consequences. Journal of Structural Geology, 54, 85-102.
Ferry, J.M., 1987, Metamorphic hydrology at 13-km depth and 400–500°C.
American Mineralogist, 72, 39–58.
Fyfe W. S., Price N. J., Thompson A. B, 1978, Fluids in the Earth's Crust.
Elsevier, Amsterdam.
Fyfe, W.S., Kerrich, R., 1985, Fluids and thrusting. Chemical Geology 49,
353-362.
Gale, A., Dalton, C. A., Langmuir, C.H., Yongjun, S., Schilling J., 2013,
The mean composition of ocean ridge basalts. American Geophysical Union,
14, 489-518.
Gater, A. E., 1991, Shear zone control on mineral deposits in the State-line
serpentinite, Pennsylvania Piedmont. Ore Geology Reviews 6.2-3, 171-184.

103
Goddard, J.V., and Evans, J.P., 1995, Chemical changes and fluid-rock
interaction in faults of crystalline thrust sheets, northwestern Wyoming,
U.S.A. Journal of Structural Geology, 17, 533-547.
Grant, J.A., 1986, The isocon diagram; a simple solution to Gresens’
equation for metasomatic alteration. Economic Geology, 81, 1976-1982.
Gutiérrez-Alonso, G., Murphy, J. B., Fernández-Suárez, J., Weil, A. B.,
Franco, M. P., Gonzalo, J. C., 2011, Lithospheric delamination in the core of
Pangea: Sm-Nd insights from the Iberian mantle. Geology 39(2), 155-158.
Harlov, D. E., and Austrheim, H., 2013, Metasomatism and the chemical
transformation of rock the role of fluids in terrestrial and extraterrestrial
processes. Heidelberg: Springer.
Holness, M. B., 1997, Lithological, Structural, and Deformation Controls on
Fluid Flow during Regional Metamorphism. Deformation-Enhanced Fluid
Transport in the Earth's Crust and Mantle, Chapman & Hall, pp. 196–222.
John, T., Klemd, R., Gao, J., Garbe-Schonberg, C.D., 2008, Trace-element
mobilization in slabs due to non-steady-state fluid-rock interaction:
Constraints from an eclogite-facies transport vein in blueschist (Tianshan,
China). Lithos, 103, 1-24.
Kerrich, R., Allison, I., Barnett, R. L., Moss, S., Starkey, J., 1980,
Microstructural and chemical transformations accompanying deformation of
granite in a shear zone at Miéville, Switzerland; with implications for stress
corrosion cracking and superplastic flow. Contrib. Minerology and
Petrology, 7, 221-242.
Kisters, F.M.A., Kolb, J., Meyer, F. M., Hoernes, S., 2000, Hydrologic
segmentation of high-temperature shear zone: structural, geochemical, and
isotope evidence from auriferous mylonites of the Renco mine, Zimbabwe.
Journal of Structural Geology 22, 811-829.
Knipe R. J., and Wintsch R. P., 1985, Heterogeneous Deformation, Foliation
Development, and Metamorphic Processes in a Polyphase Mylonite.
Metamorphic Reactions. Advances in Physical Geochemistry, 2, 180-210.
Kolb, J., Rogers, A., Meyer, F. M., Vennemann, T. W., 2004, Development
of fluid conduits in the auriferous shear zones of the Hutti Gold Mine, India:
evidence for spatially and temporally heterogeneous fluid flow.
Tectonophysics, Vol. 378, 65-84.
Kronenberg, A. K., Kirby, S. H., Pinkston, J., 1990, Basal slip and
mechanical anisotropy of biotite. Journal of Geophysical Research, 95,
19257-19278.

104
Losh, S., 1997, Stable isotope and modeling studies of fluid-rock interaction
associated with the Snake Range and Mormon Peak detachment faults,
Nevada. Bulletin of the Geological Society of America, 109, 300-323.
Marquer, D., Baudin T., Peaucat, J., Persoz, F., 1994, Rb-Sr mica ages in the
Alpine shear zones of the Truzzo granite: Timing of the Tertiary alpine P-T-
deformations in the Tambo nappe (Central Alps, Switzerland). Ecology
Geology Switzerland, 87, 225-229.
Marsh, J.H., Gerbi, C.C., Culshaw, N.G., Potter, J., Longstaffe, F.J.,
Johnson, S.E., 2011, Initiation and development of the Twelve Mile Bay
shear zone: the low viscosity sole of granulite nappe. Journal of
Metamorphic Geology, 29, 167-191.
McCaig, A. M., 1984, Fluid interaction in some shear zones from the
Pyrenees. Journal of Metamorphic Geology, 2, 129-141.
McCaig, A. M., 1987, Deformation and fluid-rock interaction in
metasomatic dilatant shear bands. Tectonophysics, 135, 121-132.
McHenry, L.J, 2009, Element mobility during zeolitic argillic alteration of
volcanic ash in a closed-basin lacustrine environment: Case study Olduvai
Gorge, Tanzania. Chemical Geology, 540-552.
Micklethwaite, S., Sheldon, H. A., Baker, T., 2010, Active fault and shear
processes and their implications for mineral deposit formation and
discovery. Journal of Structural Geology Vol. 32.2, 151-165.
Mukherjee, K., and Gupta, P.K., 2008, Arbitrary scaling in ISOCON method
for geochemical mass balance: An evaluation of the graphical approach.
Geochemical Journal, 42, 247-253.
Newman, J., Mitra, G., 1993, Lateral variations in mylonite zone thickness
as influenced by fluid-rock interactions, Linville Falls fault, North Carolina.
Journal of Structural Geology 15, 849-863.
O’Hara, K., 1988, Fluid flow and volume loss during mylonitization: an
origin for phyllonite in an overthrust setting, North Carolina U.S.A.
Tectonophysics, 156, 21-36.
O’Hara, K., and Blackburn, W.H., 1989, Volume-loss model for trace-
element enrichments in mylonites. Geology, 17, 524-527.
Onezime, J., Charvet, J., Faure, M., Chauvet, A., Panis, D, 2002, Structural
evolution of the southernmost segment of the West European Variscides.
The South Portuguese Zone (SW Iberia). Journal of Structural Geology 24,
451-468.
Quilichini, A., Siebenaller, L., Nachlas, W.O., Teyssier, C., Vennemann,
T.W., Heizler, M.T., Mulch, A., 2015, Infiltration of meteoric fluids in an
extensional detachment shear zone (Kettle dome, WA, USA): How quartz

105
dynamic recrystallization relates to fluid-rock interaction. Journal of
Structural Geology, 71, 71-85.
Ramsay, J.G., Graham, R.H., 1970, Strain variation in shear belts. Canadian
Journal of Earth Science, 7, 786-813.
Secor, D. T., 1965, Role of Fluid Pressure in Jointing. American Journal of
Science 262, 633-646.
Selverstone, J., Morteani, G, Staude, J. M., 1991, Fluid channeling during
ductile shearing: transformation of granodiorite into aluminous schist in the
Tauern Window, eastern Alps. Journal of Metamorphic Geology, 9, 419–
431.
Sharp, T.G., and Buseck P.R., 1988, Prograde versus retrograde chlorite-
amphibole intergrowths in calc-silicate rock. American Mineralogist, 73,
1292-1301.
Sibson, R. H., Robert, F., Poulsen, K. H., 1988, High-angle reverse faults,
fluid-pressure cycling, and mesothermal gold-quartz deposits. Geology
16(6), 551-555.
Siebenaller, L., Boiron, M.C., Vanderhaeghe, O., Hibsch, C., Jessell, M.W.,
Andre-Mayer, A.S., France-Lanord, C., Photiades, A., 2012, Fluid record of
rock exhumation across the brittle-ductile transition during formation of a
Metamorphic Core Complex (Naxos Island, Cyclades, Greece). Journal of
Metamorphic Geology, 21, 313-338.
Sinha, A. K., Heitt, D.A., Rimstidt, D.J., 1986, Fluid interaction and element
mobility in the development of ultramylonites. Geology, 14, 883-886.
Straaten, F., Schenk, V., John, T., and Gao, J., 2008, Blueschist-facies
rehydration of eclogites (Tian Shan, NW-China): Implications for fluid-rock
interaction in the subduction channel. Chemical Geology, 255, 195-219.
Tomkins, A.G., Weinberg, R.F., McFarlane, C.R.M., 2009, Preferential
magma extraction from K- and metal-enriched source regions in the crust.
Mineralium Deposita, 44, 171.
Vocke, R.D., Hanson, G.N., Grunenfelder, M., 1987, Rare earth element
mobility in Roffna Gneiss, Switzerland. Contributions to Minerology and
Petrology, 95, 145-154.
Wawrzyniec, T., Selverstone, J., Axen, G. J., 1999. Correlations between
fluid composition and deep-seated structural style in the footwall of the
Simplon low-angle normal fault, Switzerland. Geology 27(8), 715-718.
Webb, J.A., and Golding, S.D., 1998, Geochemical mass-balance and
oxygen-isotope constraints on Silcrete Formation and its paleoclimatic
Implications in Southern Australia. Journal of Sedimentary Research, 5,
981-993.

106
Whitbread, M.A., and Moore, C.L., 2004, Two lithogeochemical approaches
to the identification of alteration patterns at the Elura Zn-Pb-Ag deposit,
Cobar, New South Wales, Australia: Use of Pearce Element Ratio Analysis
and Isocon Analysis. Geochemistry: Exploration, Environment, Analysis, 4,
129-141.
White, S. H., and Knipe, R. J., 1978, Transformation and reaction enhanced
ductility in rocks. J. Geol. Soc. London 135, 513–516.
White S. H., Burrows, S.E., Carreras J., Humphreys F.J., Shaw, N., 1980,
On mylonite in ductile shear zones. Journal of Structural Geology, 2, 175-
187.
Wintsch, R. P., Christoffersen, R., Kronenberg, A. K., 1995, Fluid-rock
reaction weakening of fault zones. Journal of Geophysical Research, 100,
13021-13032.
Wintsch, R. P., Yi, K., 2002, Dissolution and replacement creep: a
significant deformation mechanism in mid-crustal rocks. Journal of
Structural Geology 24, 1179–1193
Yonkee, W.A., Parry, W.T., Bruhn, R.I., 2003, Relations between
progressive deformation and fluid-rock interaction during shear zone growth
in a basement-bored thrust sheet, Sevier Orogenic Belt, Utah. American
Journal of Science, 303, 1-59.
Yonkee, W. A., Czeck, D. M., Nachbor, A. C., Barszewski, C., Pantone, S.,
Balgord, E. A., & Johnson, K. R., 2013, Strain accumulation and fluid-rock
interaction in a naturally deformed diamictite, Willard thrust system, Utah
(USA): Implications for crustal rheology and strain softening. Journal of
Structural Geology 50, 91–118.
You, C.F., Castillo, P.R., Gieskes, J.M., Chan, L.H., Spivack, A.J., 1996,
Trace element behavior in hydrothermal experiments: Implications for fluid
processes at shallow depths in subduction zones. Earth and Planetary
Science Letters, 140, 41-52.

107
APPENDICES
Appendix 1: Geochemistry tables

108
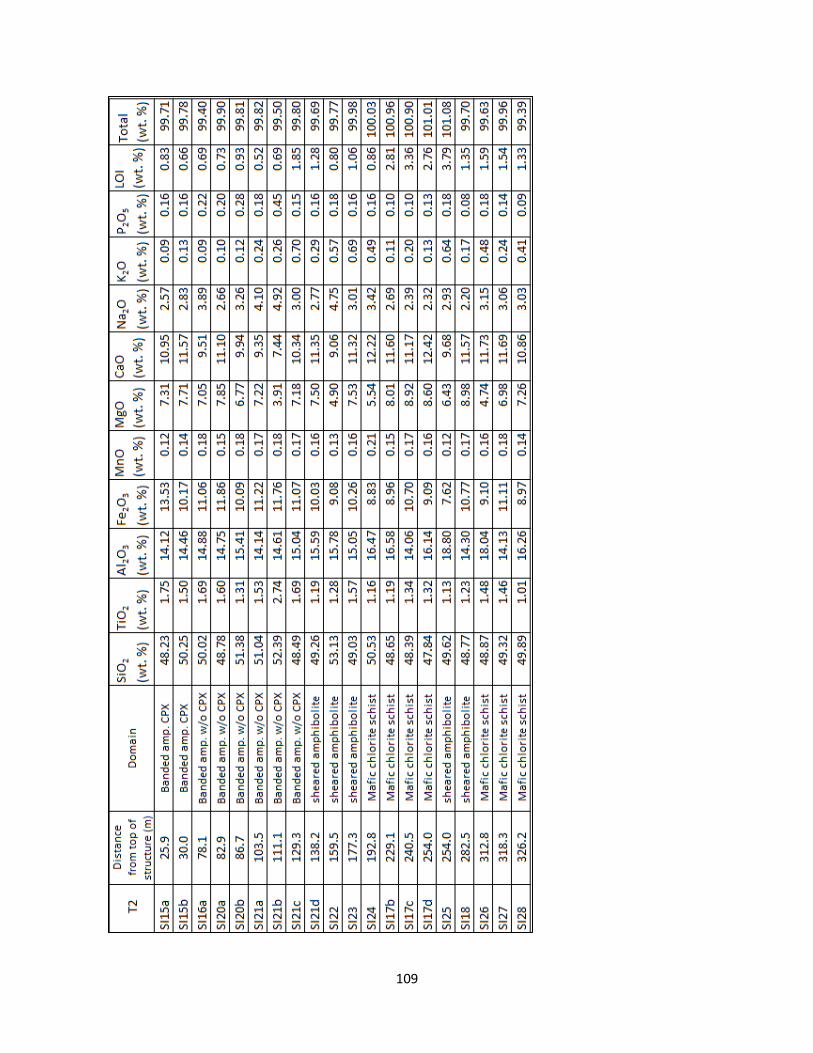
109

110

111

112


![PPIM-ILI2-16 - Stress Engineering Services, Inc · such as Roark’s Formulas for Stress and Strain, or Peterson’s Stress Concentration Factors [5, 6]. Characterizing discontinuities](https://img.dokumen.tips/doc/110x75/5e691abdaa96e93e875670ff/ppim-ili2-16-stress-engineering-services-inc-such-as-roarkas-formulas-for-stress.jpg)