Embed Size (px)
Citation preview

Paper ID #11616
Characterizing Student Music Preference and Engineering Major Choice
Mr. Frank Blubaugh, Purdue University
Frank Blubaugh is a graduating senior in Multidisciplinary Engineering at Purdue University. He has adiverse academic background in acoustical engineering, education, and music performance.
Dr. Joyce B. Main, Purdue University, West Lafayette
Joyce B. Main is an Assistant Professor in the School of Engineering Education at Purdue University.She holds a Ph.D. in Learning, Teaching, and Social Policy from Cornell University, and an Ed.M. inAdministration, Planning, and Social Policy from the Harvard Graduate School of Education.
c©American Society for Engineering Education, 2015
Page 26.347.1

Characterizing Student Music Preference and Engineering Major Choice
Introduction College major choice has important implications for a student’s academic experiences, professional development skills, employment opportunities, future earnings, social prestige, and other social-related factors. Academic institutions in the United States offer dozens of majors to choose from, and in addition to a student’s individual preferences, academic advisors, faculty, peers, and family members may also influence a student’s major selection. Researchers have identified factors, such as career prospects, personal interests, parental influence, effects of climate and culture, to be important. Although a few models of major choice exist, relatively little attention has been given to examining engineering disciplinary choice (e.g. Mechanical, Environmental, Civil, Chemical, or Industrial). Our research aims to fill this gap from a unique perspective—since music genre preference can represent diversity in the broad dimension of experiences, we explore whether there is an association between music genre preference and engineering discipline choice. Music penetrates all aspects of modern society, including academic settings—students wear concert t-shirts showcasing their favorite music artists, instructors play music during class to promote a particular learning environment, groups of students listen to music as they work together on a project or as they attempt to solve a homework question. Previous research has linked musical preference to personality and values, both of which correlate to social identity, and to a lesser extent, academic study habits. Pierre Bourdieu's landmark text La Distinction also asserts that social class influences judgments of taste and choices in cultural activities. Researchers have also used markers such as genre taste as a cultural indicator, focusing on "high" arts, such as classical music, ballet, and art museums as measures of culture.1 Using a similar approach of measuring cultural consumption and preferences by proxy, we examine student music genre preference as a potential mediating factor in engineering students’ discipline choice. We situate our examination in the context of self-efficacy, which has been shown to have a significant impact on student behavior, including major choice. Self-efficacy, the belief in one's abilities, plays a central role in the achievements of individuals throughout their careers. Differing levels of self-efficacy has been documented to impact student behavior from academic achievement to the success in a job search.2 Furthermore, self-efficacy has been shown to have a significant impact on students’ decisions to major in engineering. Therefore, we examine student music genre preference in the context of self-efficacy to reflect multiple aspects of the student experience. With the nation’s call for more diverse engineering professionals, engaging music preference may provide a unique approach to broadening participation in engineering. Therefore, we explore whether music preference plays a role in engineering discipline choice. Our research findings have the potential to inform how diversity in experiences and preferences may play a role in student choices. The findings therefore may have implications for how key stakeholders,
Page 26.347.2

instructors, academic professionals, and students can apply musical and other interests to engage a wider range of students in the study of engineering. Background Researchers have identified several factors that influence student major choice; for example, career prospects, personal interests, parental influence, effects of climate and culture, prior academic achievement, levels of self-efficacy, motivation, and demographic factors. Wade et al. determined that the choice of science technology engineering and mathematics (STEM) was directly influenced by high school math achievement, the intent to major in STEM, and a strong sense of self-efficacy related to mathematical achievement.3 Race and gender have also been extensively examined as factors correlated with students’ choice of engineering as a course of study.4-5 Keshishian, in particular, points out that the self-reported findings of familial pressure and racial background directed students into their particular major.6 Researchers have also explored self-efficacy to determine why there are fewer women in engineering. For example, Concannon et al. found that self-efficacy correlates positively with GPA, degree persistence, and career success.7 Early findings showed that men possess a higher level of self-efficacy than women;8 however, more recent studies have shown this to not be the case—men and women persist in engineering at roughly the same rate while sharing similar levels of self-efficacy.9 One notable result from this line of study has been the development of the Longitudinal Assessment of Engineering Self-Efficacy (LAESE), an accurate and validated tool that measures engineering self-efficacy. In regard to student preferences and interests, Arcidiacono determined that the choices of a particular major are not closely associated with the ability of a particular student, but align more with the interests of the student. The majors studied were aggregated fields holding dozens of majors. The National Longitudinal Study (NLS72), analyzed by Arcidiacono, only includes natural science as a major while today this might be further broken down into natural and applied science or even further into the constituent fields that make up this über-major.10 Although the data analyzed were collected in 1972-1986, this study provides a strong indication that personal preference is a factor in choosing a major course of study. Many other studies have also examined why students remain in or transfer out of STEM fields and personal interest is a common thread between these studies. These studies, however, focused only on students who have previously declared a STEM major.11-12 Although there is a robust body of literature on student major choice, there are few studies on the selection of engineering major disaggregated by discipline. Previous studies have tended to examine the choice of engineering as a field, rather than why or how students select a specific engineering discipline (e.g., mechanical, chemical, industrial, or civil). This treatment of engineering as a broad field does not account for the variety of experiences and motivations that influence a student to select one of the many different engineering disciplines. There are several studies that look at the motivations and causes for students to join a particular discipline in engineering. For example, Ngambeki demonstrated a relationship between interest, personality, and social structures in the choice of an engineering discipline.13 Since student academic experiences and post-graduation employment trajectories are influenced by their engineering
Page 26.347.3
discipline, a more detailed understanding of the forces behind these choices is important. Given the existing knowledge about personal interests, personality, and identity in relation to major choice, an examination of student music genre preferences will add another layer of understanding of how the diversity of student experiences and preferences can influence student major choice across engineering disciplines.14-15 Why Music? Rentfrow and Gosling conducted a study in 2003 where they discovered a strong relationship between personality profiles and musical preference.16 Their later and continuing research shows that people are able to rapidly identify the values of an individual with knowledge of that individual’s musical preferences.17 These extra-musical associations have been confirmed by other studies using populations in the UK and Germany18-19. People have been found to use musical preference as a method of social grouping and gravitate towards those with similar musical tastes as themselves.20 Additionally, Carpentier et al. have also shown that rebellious behavior and rebellious music are strongly correlated although the authors suggest that music is acting as a social signal, rather than an influencing factor.21 Studies have also been conducted on the uses of music in society in the formal field of Ethnomusicology and by practitioners in other disciplines. The exposure of music can influence the behavior of individuals,22 and music has been used as social signal to indicate cultural identity.23 Examples of the latter include declaring national identity through the playing of one’s national anthem, or political campaign songs showing solidarity with a particular candidate. With the extension of the cultural identity of particular songs and the association of genres with behaviors,24 the links between personality, values, and grouping behavior related to musical preference suggest that there may be a relationship between musical preference and major choice. The perceived cultural differences between engineering disciplines25 and the factors of personal interest and social pressures on engineering discipline choice26 may also extend this relationship towards the choice of an engineering discipline. Therefore, we explore whether a preference for a particular musical genre(s) correlates with the selection of a particular engineering discipline. Theoretical Framework Many different theoretical models have been proposed to explain the behavior of students, particularly as it relates to major selection and persistence. Examples of these factors include future career prospects, personal interest of the student, and parental influence. The theoretical frameworks often applied are Social-Learning theory and Social-Cognitive-Career Theory. Social-Learning theory is most closely associated with the work of Albert Bandura.27 The theory draws its initial prospectus by making the assumption that people learn their behavior by imitating those around them. The main mechanism of social learning theory is that individuals create a schema of what kind of behavior is acceptable and what kind of behavior is not. The individual can then apply this schema to a new kind of behavior and can more accurately predict if the behavior will be acceptable to other individuals. In this same way, music genre preference may serve as an indicator or signal for what types of behavior (or preferences) may be acceptable in a given environment.
Page 26.347.4

The extension of Social-Learning theory when applied to major and career choice is Social-Cognitive-Career Theory (SCCT).28-29 The premise behind SCCT is that career interests and choices of an individual are influenced and set by the environment around the individual. This theory rests on three pillars: self-efficacy, outcome expectations, and desired goals. Self-efficacy is an individual’s internal belief of what they are capable of achieving. An individual's successes, if praised by those around them, will be associated with higher sense of self-efficacy than if those same successes are criticized by society. The outcome expectations are set by society as well. If high achievers surround an individual, then there will be a societal expectation that the individual should also achieve similar levels of success. The intersection of the beliefs of self-efficacy and outcome expectations help to form the goals for that individual, which are the motivating thoughts and decisions that drive the actions of the individual.30 Whereas the application of social learning theory suggests that music genre preference may signal acceptable behaviors and preferences, SCCT provides context for a student’s outcome expectations and selection of major. Data Collection A survey was administered to first-year engineering students at a large Midwestern, research-intensive university in October 2014 resulting in 1,576 respondents (90% response rate). Collection occurred during the eighth week of the semester. At this point in the semester, the students have been exposed to all available engineering disciplines and the academic requirements for each major through in-class information sessions for each discipline. Importantly, the students have not yet completed enough coursework for them to know whether they would meet the required grade point average (GPA) for their intended discipline. Therefore, their responses would be based more on their interest and preferences, rather than their chances of being accepted into a particular discipline. (Several disciplines have a GPA requirement that could be a factor in a student’s level of interest in the discipline.) We collected the following information: intended discipline; information about the student’s belief in their academic ability; information about pre-college exposure to engineering; information about the context of students’ music listening habits; how much time a student spends studying per week; the preferred music genres of the student;; and the students’ perception of their peers’ preferred music genres. While we have a breadth of measures to generate a comprehensive study of major choice, we focus on exploring the viability of using music preference as a potential factor in student engineering major choice. The measured factors analyzed in this paper therefore include the student’s intended discipline, preference of a variety of musical genres, and the self-efficacy of the student. If a student was undecided in their engineering discipline selection, the student instead indicated the disciplines that they were considering. We used the LAESE subscales developed by Marra and Bogue to collect data on student’s self-efficacy.31 This tool has been validated by multiple studies as an accurate tool for this purpose and validated for use among engineering students.
Page 26.347.5

Summary Statistics Activities while listening to music To examine the prevalence of music in students’ lives, the survey participants were asked basic questions about the daily context in which they listened to music. Results are shown in Fig. 1. Commuting, exercising, relaxing, and studying are all major activities student perform while listening to music. Interestingly, students typically use music during solitary activities and less so during social or communal time. We also examined more closely how often students listened to music while studying disaggregated by the student’s intended engineering major (Fig. 2). Students intending to major in biological, civil, and electrical engineering were more likely to report listening to music frequently while studying.
Fig.1. Summary of Student Activities While Listening to Music
Fig. 2. Normalized summary of prevalence of listening to music while studying by intended engineering major
0100200300400500600700800900
Nu
mb
er
of
Re
spo
nse
s
Studying
Exercising
Relaxing
Socializing
Commuting
Sleeping
Active Listening
0%
20%
40%
60%
80%
100%
120%
AAE AGE BIO CHE CIV ECE IND OTH UND MEC
Studying
Never
Rarely
Seldom
Sometimes
Most of the time
Frequently
Page 26.347.6

Engineering major interests Table 1 summarizes the students’ engineering discipline interests. If a student was undecided at the time of the survey, they were asked to indicate which majors they were considering. A student could select as many majors as they wished if they were undecided. At the eighth week of their first semester, the majority of engineering students have already selected an engineering discipline (86.5%), whereas 212 students (13.5%) remain undecided. Of the 1,576 students in the sample, 31 have already decided to leave engineering at this relatively early time point. Table 1. Summary of Students’ Intended Disciplines
Major Decided Indication
Undecided Indication
Aeronautical and Astronautical (AAE) 141 58 Agricultural and Biological (ABE) 46 23 Biomedical (BME) 73 35 Chemical (CHE) 152 44 Civil (CIV) 87 67 Electrical and Computer (ECE) 226 66 Industrial (IND) 95 43 Mechanical (MEC) 383 137 Other (OTH) 130 142 Undecided (UND) 212 N/A Leaving Engineering (LEAVING) 31 0 Number of respondents 1,576
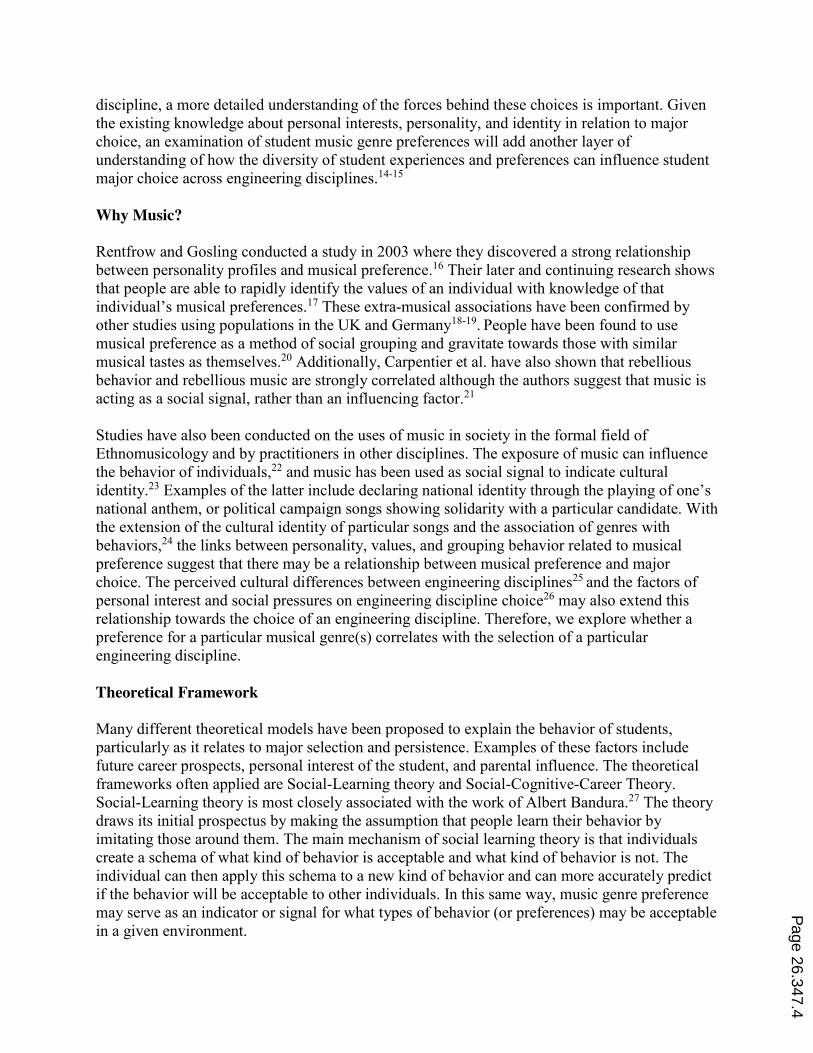
Music genre preferences For the indication of musical preference, the students were asked how often they listened to each of the 11 musical genres on a 6-point Likert scale; these genres were based on the work of Rentfrow and Gosling (2003). Fig. 3 summarizes the average frequency that the engineering students listened to the different genres of music. Students, on average, listened to rock, alternative, rap, top 40, and dance music most often. An overall summary of the results of the genre preferences is shown in Fig. 4.
Fig. 3. Average response to how often students listened to music genres
Never
Rarely
Seldom
Sometimes
Frequently
Most ofthe Time
Page 26.347.7
Fig. 4. Listening Preference for Musical Genres Engineering self-efficacy The Longitudinal Assessment of Engineering Self-Efficacy (LAESE) was developed in 2006 to measure the self-efficacy of women studying engineering. Since then, the tool has expanded and been validated to use for the entire spectrum of engineering students. There are several different subscales of the LAESE that measure the various factors of the engineering experience ranging from outcome-expectations, engineering self-efficacy, feeling of inclusion, and coping self-efficacy. While the tool is the most comprehensive when all of the items are used together, for the purposes of this study, only the sections measuring engineering self-efficacy were utilized. The LAESE subscales measuring self-efficacy asks questions about how the student feels about their ability to succeed in their engineering studies. The student indicates their confidence in
050
100150200250300350400450
Nu
mb
er
of
Re
spo
nse
s
Rock
Alternative
Rap
Soundtracks
Dance
Pop
0100200300400500600700800900
Nu
mb
er
of
Re
spo
nse
s
Country
Religious
Jazz
Classical
Folk
Page 26.347.8

their ability to complete their core curriculum studies of physics, math, engineering, and chemistry; the survey also asks separately about the student's confidence in earning an “A” or “B” grade in those same courses. There are two questions in these subscales that measure general engineering academic success as well as the confidence in engineering academic success while maintaining a personal life outside of their academic pursuits. The complete list of eleven questions from the LAESE tool, are shown in table 2. Typically, when researchers use the LAESE, they deploy the survey in its entirety; however, we chose to only deploy the sections directly related to engineering self-efficacy. This is not without precedent as previous researchers have omitted parts of the LAESE in the interest of more focused data collection.32-33 The limitation of this approach, however, is that the data cannot be compared to other collections to compare the efficacy of this subject group against others. Table 2. Self-Efficacy questions used from the LEASE tool.
Survey Question SE1:Engr I can succeed in an engineering curriculum
SE2:ExtraCurr I can succeed in an engineering curriculum while not having to give up participation in my outside interests (e.g. extra-curricular activities, family, sports)
SE3:Physics I will succeed in my physics courses SE4:Math I will succeed in my math courses SE5:MathReqs I can complete the math requirements for most engineering majors SE6:PhysReqs I can complete the physics requirements for most engineering majors SE7:ChemReqs I can complete the chemistry requirements for most engineering majors SE8:Excel I will earn mostly A's and B's in my engineering requirement courses SE9:CurrentYear I can excel in my engineering courses during the current academic year SE10:AnyEngr I can complete any engineering degree at this institution SE11:Stay I will still be an engineering major during the next year
The subjects answered each question on a LAESE by rating the question on a Likert-like scale from 1-7 (strongly disagree to strongly agree). We summed the responses to each question and found the average value for each student by dividing by the total number of questions (11), this is the mean self-efficacy level for each student. The results from the mean self-efficacy level obtained from the LAESE is shown in figure 5. Using Kruskal-Wallis test we found evidence of significant difference in mean self-efficacy by major, this test was used due to the non-normality of this variable. We also performed Bonferroni’s multiple comparisons of means to identify the majors with such significant differences. A group of majors (AAE, ECE, CHE, MEC and BME) showed higher mean self-efficacy scores than most of the other majors (CIV, ABE, IND, OTH, UND) but not between them. This second group of majors (CIV, ABE, IND, OTH, UND) showed mixed results when compared between them. The group of students in the “leaving engineering” group showed the lowest mean self-efficacy (4.70 out of 7) when compared to all other groups, which is consistent previous literature. Summary statistics of all the self-efficacy responses detailed by intended major are presented in Appendix 1.
Page 26.347.9

Fig. 5. Average Student Engineering Self-Efficacy Score by Intended Major
Methods
Model 1 - Music Genre Preference To examine the impact of music genre preference on the selection of a specific major within engineering, we used a logistic regression model with a logit link function. The outcome is a dummy variable, which is equivalent to “1” when the student has selected the given discipline or “0” if the student has selected a different discipline. Music genre preferences were coded into a categorical variable where a value of “Most of the Time” and “Frequently” became a 2, “Sometimes” and ”Seldom” became a 1, and “Rarely,” and “Never” became 0. This coding was used to account for the variability of interpretation of the individual survey takers. This was then treated as a continuous explanatory variable. The model is expressed in equation (1). (1) 𝑙𝑜𝑔𝑖𝑡[𝑝(𝑚𝑎𝑗𝑜𝑟)] = log ( )
( ) = 𝛽 +𝛽 𝐺𝑒𝑛𝑟𝑒 + 𝛽 𝐺𝑒𝑛𝑟𝑒 + ⋯+ 𝛽 𝐺𝑒𝑛𝑟𝑒 In the model, 𝑝(𝑚𝑎𝑗𝑜𝑟) represents the probability of selecting the specific major. This model was executed for all the engineering majors considered, including the “undecided”, “other” and “leaving” engineering categories. To interpret the model estimates we use the odds ratio (OR), which indicates the ratio between the probability of selecting the major over the probability of not selecting such major (e.g. an odds ratio of 1.4 would imply a that the odds of choosing the major would be 40% higher than not choosing that major given that the student have a higher level of preference for the music genre). Odds ratios smaller than one would imply a negative effect of the music genre preference on the selection of the major while odds ratios greater than one imply a positive effect of the genre preference on selecting the major. Finally, odds ratios equal to one would represent no effect due to the genre preference. Given that these models are exploratory in nature, we consider variables at a significance level of α=0.05 and α=0.10.
Page 26.347.10

Model 2 - Self-Efficacy Each component of the LAESE subscales was also analyzed using its original scale from 1 to 7. While the LAESE has been validated to work as an instrument for measuring total engineering self-efficacy and that the questions are independent of each other, the test does not tell us if there is particular question that is more closely related to one engineering major or another. To test for this potential relationship, another model of logistic regression was applied using the individual responses of the LAESE questions as the predictor variables.
(2) 𝑙𝑜𝑔𝑖𝑡[𝑝(𝑚𝑎𝑗𝑜𝑟)] = 𝛽 +𝛽 𝑆𝐸 + 𝛽 𝑆𝐸 +⋯+ 𝛽 𝑆𝐸 Full Model: Music Genre Preference and Self-Efficacy To form a more comprehensive understanding of the data collected, a full model using music genre preference and self-efficacy were included as predictor variables for estimating the probability of selecting a given engineering major. The mean self-efficacy calculated is the only measurement used for this trait.
(3) 𝑙𝑜𝑔𝑖𝑡[𝑝(𝑚𝑎𝑗𝑜𝑟)] = 𝛽 +𝛽 𝐺𝑒𝑛𝑟𝑒 + 𝛽 𝐺𝑒𝑛𝑟𝑒 + ⋯+ 𝛽 𝐺𝑒𝑛𝑟𝑒 + 𝛽 𝑀𝑒𝑎𝑛𝑆𝐸 All models were executed in SAS, using the logistic procedure with a logit link function. Acknowledging that the resulting estimates could be biased due to the small number of favorable cases in each model, we also used the exact method of Firth logistic regression which uses penalized likelihood estimation. This execution did not show any significant differences in the estimates. Full OR estimates are presented in the Appendices accompanied with some indicators of model quality. We included the p-values of the Hosmer-Lemeshow goodness of fit test, which indicate better models with higher p-values. We report the proportion of favorable and unfavorable cases for each model. Finally, we present the R-square value for each model. The following section only present a summary of the significant effects at the 0.05 and 0.10 level, and their possible interpretations. Results Model 1 - Music Genre Preference Model 1 was executed for each intended major to explore any possible relationship between music preferences and the probability of selecting such major. Table 3 summarizes the positive and negative effects identified in the different models; empty values represent absence of significant effects. Detailed values of the effects for all models can be found in Appendix 2. Majors with the higher number of effects were AAE and ECE. For AAE students liking rock and classical showed a higher probability of selecting the major, while students liking country, jazz or religious music showed lower probability of selecting the major. In the case of ECE, students liking soundtracks showed higher probability of selecting the major while liking alternative, country or religious had lower probabilities of selecting the major. ABE and MEC showed only one significant positive effect; in the case of ABE, liking country music increased the probabilities of selecting it, while liking rap/hip-hop music increased the probabilities of selecting MEC. Alternative and pop genre showed a positive effect in the selection of other and
Page 26.347.11

undecided classes respectively. Similarly, religious music showed an association with higher probability of leaving engineering.
Table 3. Significant effects of music genre preference on major choice (Model 1).
Bold = Significant at 0.05 level: Italics = Significant at 0.10 level Model 2 - Self-Efficacy This model explored the different elements of the LAESE scale of self-efficacy as predictors of the proclivity of the students to select a specific major. In this case, the interpretation of a positive effect would be as follows: having a higher level of self-efficacy in the factor/variable would increase the probability of selecting the given major, while a negative effect would imply that a higher level of this element of self-efficacy would decrease the probability of selecting the major. The latter could also be interpreted as an effect favoring the selection of other majors over the major being analyzed. The summary of the significant effects is shown in Table 4 and the exact dimension of all the effects can be found in Appendix 3.
The confidence on completing the chemistry requirements for engineering (SE7:ChemReqs) has a positive effect on the probability of selecting CHE, while it decreases the probability of selecting ECE or MEC. Confidence on succeeding in the engineering curriculum without giving up in extra-curricular activities (SE2: ExtraCurr) had a positive effect on the probability of selecting Industrial engineering while it decreases the probability of leaving engineering. Higher levels of confidence on completing the physics requirements (SE6:PhysReqs) are positively related to higher probabilities of selecting AAE and MEC and with lower probabilities of selecting CHE and IND. Confidence on succeeding in the engineering curriculum (SE1:Engr) is positively related to ABE, BME but also with leaving, and negatively related to IND and undecided.
Major Genres Positive Effects Negative Effects
AAE Rock, Classical Country, Religious, Jazz ABE Country - BME - Dance CHE - - CIV Folk - ECE Soundtracks Alternative, Country, Religious IND Religious, Soundtracks Rock MEC Rap - OTH Alternative Dance UND Pop Soundtracks LEAVING Religious Country, Soundtracks
Page 26.347.12

Table 4. Significant effects of self-efficacy measures on major choice (Model 2).
Major Self-Efficacy measures
Positive Effects Negative Effects
AAE SE6:PhysReqs, SE11:Stay SE5:MathReqs
ABE SE1:Engr SE9:CurrentYear BME SE1:Engr - CHE SE7:ChemReqs SE6:PhysReqs CIV - -
ECE - SE7:ChemReqs, SE9:CurrentYear
IND SE2:ExtraCurr SE1:Engr, SE6:PhysReqs MEC SE6:PhysReqs SE7:ChemReqs
OTH SE4:Math SE5:MathReqs, SE8:Excel, SE10:AnyEngr
UND - SE1:Engr, SE10:AnyEngr LEAVING SE1:Engr SE2:ExtraCurr, SE11:Stay
Bold = Significant at 0.05 level: Italics = Significant at 0.10 level
Full Model: Music Genre Preference and Self-Efficacy When considering the mean self-efficacy level of students together with students’ music preferences, the models show the same effects presented for music genres. Self-Efficacy was significant as a positive effect for the selection of some majors and a negative effect for the selection of other majors. There was a positive effect of mean self-efficacy for AAE, CHE, ECE and MEC, i.e. higher levels of mean self-efficacy were related to higher probabilities of selecting these majors. On the other hand, there was a negative effect of mean self-efficacy for ABE, IND, OTH, UND and leaving, i.e. higher levels of mean self-efficacy were related to lower probabilities of selecting these groups.
Table 5. Significant effects identified in the Full Model.
Major Music Genres and Self-Efficacy
Positive Effects Negative Effects
AAE Rock, Classical, Self-Efficacy
Country, Jazz, Religious
ABE Country Self-Efficacy BME - Dance CHE Self-Efficacy Soundtracks, Folk CIV Folk -
ECE Self-Efficacy Alternative, Country, Religious
IND Religious Rock, Self-Efficacy
Page 26.347.13

MEC Rap, Self-Efficacy -
OTH Alternative Rock, Dance, Self-Efficacy
UND Alternative Soundtracks, Self-Efficacy
LEAVING Religious Self-Efficacy Bold = Significant at 0.05 level: Italics = Significant at 0.10 level Based on the Hosmer-Lemeshow goodness of fit tests, the full model incorporating both self-efficacy and music genre preference measures provided the best representation of the data.
Discussion
We found that engineering students in their first year of study listened to music in a variety of contexts. Students listened to music most consistently while exercising, commuting, and relaxing. Engineering students showed preferences for a wide variety of musical genres. The most popular appear to be rock, alternative, rap, dance, and pop music. The students, in general, are less likely to indicate folk and religious music as high preferences. Importantly, many students indicated listening to music frequently and most of the time while studying. Since working in teams and completing projects constitute a significant portion of engineering education, the types of music different students listen to may have implications for group dynamics if this listening behavior carries into the group setting.
We examined whether there are patterns and associations between music preference and major choice. The greatest proportion of students showed interest in majoring in mechanical engineering, followed by electrical and computer and chemical engineering. The logistic regression analyses revealed several interesting points. From the models showing appropriate levels of quality, it was shown that there was a positive relationship between liking rock and classical music and choosing Aeronautical and Astronautical engineering. Students who preferred country music were more likely to be interested in Agricultural and Biological Engineering. This result may be consistent with previous music industry studies on music fan demographics that show an above average rate of country music fans living and working in rural environments33. There was a positive effect of liking Rap/Hip-Hop with selecting Mechanical engineering. There was some evidence of a relationship between preferences for religious music and a higher probability to consider transferring out of engineering at the end of the semester. First-year students in some groups of majors displayed similar levels of self-efficacy. AAE, ECE, CHE, MEC and BME showed higher means self-efficacy than most of the second group of majors comprised by CIV, ABE, IND, UTH and UND. Perhaps not surprisingly, chemical engineers exhibited a large amount of confidence in their chemistry abilities and this effect was statistically significant in the logistic regression model (Table 4). Students who indicated they were planning to leave engineering at the end of the semester exhibited lower levels of engineering self-efficacy. Aeronautical and Astronautical Engineers possessed the highest overall levels of self-efficacy, followed by Electrical and Computer Engineers, Chemical Engineers and Mechanical Engineers.
Page 26.347.14
There are, however, limitations associated with the quality of the models as suggested by the goodness of fit tests. Although the full model including both self-efficacy and music genre factors provided improved measures, additional variables and student characteristics could be included to explain the variability in the data more accurately. For example, including student demographic characteristics, such as gender and race/ethnicity, would provide a more comprehensive model. Nevertheless, this was a first approach to the analysis and exploration of the relationship between music preferences and major choice in engineering. These findings can help inform future examinations about the potential connections between student taste and preferences and their engineering discipline choices.
Conclusions and Future Work The associations between music preference and major choice identified in the logistic regression results suggest that there is grouping or sorting among students consistent with the theoretical framework from Rentfrow and Gostling’s (2013) research. We will continue to explore these relationships in the context of a variety of measures that we have also collected (demographic factors, work style preferences, pre-college activities and factors, etc.) to determine whether music preference mediates or can be a proxy for factors that influence major choice. Chief among our objectives is to determine whether music can be applied as a measure for diversity of taste and experience and how music preference interacts with other factors. While previous research have examined demographic and student academic characteristics, social influences (such as peers, family, etc.), psychosocial factors (self-efficacy, sense of belonging, etc.), and culture and academic environment, we explore another potential pathway to contribute to further understanding the complexities surrounding student major choice within engineering. We examined the prevalence of music in students’ lives measuring how much and when they listen to music, the types of music they listen to, and whether there are patterns associated with music preference and engineering major choice. The relationship discovered here presents many opportunities for future studies. The relationships found between musical preference and major choice suggest, based on theories of personality and social grouping, that students may tend sort with students with similar tastes/preferences. Research findings will help to shed light on the diversity of engineering students, beyond more visible demographic factors, and how diversity in taste and musical preference may influence the composition of students in the different engineering disciplines. With the nation’s call for more diverse engineering professionals, engaging music preference may provide a unique approach to broadening participation in engineering. Acknowledgments The authors thank Stephen Hoffmann for assistance with this project, the survey respondents for their participation, and the members of the SPHERE Lab for helpful discussions.
Page 26.347.15
References
1Scott-Lennox, Jane A, Blau, Judith R, Reid, Helen M (1993). "Cultural supply, demand and funding: A framework for the measurement of cultural indicators." Poetics 21: 481-498. 2Hackett, G. (Director) (2013, February 1). Social Cognitive Career Theory of Career Choice. Lecture conducted
from University Missouri Kansas City, 3Leuwerke, W., Robbins, S., Sawyer, R., & Hovland, M. (2004). Predicting Engineering Major Status From
Mathematics Achievement and Interest Congruence. Journal of Career Assessment, 12(135). 4Zafar, B. (2013). College major choice and the gender gap. Journal of Human Resources, 48(3), 545-595. 5Mann, A., & Diprete, T. A. (2013). Trends in gender segregation in the choice of science and engineering majors.
Social science research, 42(6), 1519-1541. 6Keshishian, F., Brocavich, J. M., Boone, R. T., & Pal, S. (2010). Motivating Factors Influencing College Students'
Choice of Academic Major. American journal of pharmaceutical education, 74(3). 7Concannon, James P and Barrow, Lloyd H. “A Cross-Sectional Study of Engineering Students' Self-Efficacy by
Gender, Ethnicity, Year, and Transfer Status.” Journal of Science Education and Technology Vol. 18, No. 2 (APRIL 2009): 163-172. Published by: Springer
8Betz, N. E., and Hackett, G. (1981). “The relationship of career-related self-efficacy expectations to perceived career options in college women and men.” Journal of Counseling & Psychology Vol 28: 399-410
9Concannon, James P and Barrow, Lloyd H. “A Cross-Sectional Study of Engineering Students' Self-Efficacy by Gender, Ethnicity, Year, and Transfer Status.” Journal of Science Education and Technology Vol. 18, No. 2 (APRIL 2009): 163-172. Published by: Springer
10 Arcidiacono, P. (2004). Ability sorting and the returns to college major. Journal of Econometrics, 121(1), 343-375.
11 Adelman, C. (1998). Women and Men of the Engineering Path: A Model for Analyses of Undergraduate Careers. U.S. Department of Education Monograph
12 Johnson, M.J. & Sheppard, S.D. (2004). Relationships between engineering student and faculty demographics and stakeholders working to affect change. Journal of Engineering Education, 92(2), 137-151
13Ngambeki, I. (2012). Dissertation: Finding a place in engineering: Examining students’ choice of engineering discipline.
14 Walden, S.E. and Foor, C. (2008) "What's to keep you from dropping out?" Student Immigration into and within Engineering. Journal of Engineering Education, 97: 191-205. 15 Lord, S.M, Layton, R.A, Ohland, M.W. (2011). "Trajectories of Electrical Engineering and Computer Engineering Students by Race and Gender." IEEE Transactions Vol: 54 no 4. 16Rentfrow, Peter J., and Samuel D. Gosling. "Do Re Mi's of Everyday Life: The Structure and Personality
Correlates of Music Preferences." Journal of Personality and Social Psychology Vol. 84, No. 6 (2003): 1236-1256.
17Rentfrow, Peter J., Jennifer A. McDonald, and Julian A. Oldmeadow. (2009) "You Are What You Listen To: Young People's Stereotypes about Music Fans." Group Processes and Intergroup Relations Vol 12, no. 3: 329-344.
18Pearson, Jodi L., and Stephen J. Dollinger. "Music preference correlates of Jungian types." Personality and Individual Differences Vol 36, no. 5 (April 2004): 1005-1008.
19Kristen, Susanne, and Mark Shevy. "A comparison of German and American listener's extra musical assocaitions with popular music genres." Psychology of Music Vol 41, no. 6 (2013): 764-778.
20Boer, Diana, Ronald Fischer, Micha Strack, Michael H. Bond, Eva Lo, and Jason Lam. "How Shared Preferences in Music Create Bonds Between People: Values as the Missing Link." Personality and Social Psychology Bulletin Vol 37, no. 9 (2011): 1159-1171.
21Carpentier, F., Knobloch, S., & Zillmann, D. (2003). Rock, rap, and rebellion: Comparisons of traits predicting selective exposure to defiant music. Personality and Individual Differences,35, 1643-1655.
22Richard Yalch Eric Spangenberg, (1990),"Effects of Store Music on Shopping Behavior", Journal of Services Marketing, Vol. 4 Iss 1 pp. 31– 39.
23Clayton, M., Herbert, Trevor, & Middleton, Richard. (2003). The cultural study of music : A critical introduction. New York: Routledge.
24Peter J. Rentfrow and Samuel D. Gosling. "Message in a Ballad: The Role of Music Preferences in Interpersonal Perception." Psychological Science. Vol. 17, No. 3 (Mar., 2006) , pp. 236-242
Page 26.347.16

25Godfrey, E. (2014). Understanding disciplinary cultures: The first step to cultural change. In Johri, A. & Olds, B.
(eds.) Cambridge Handbook of Engineering Education Research. Cambridge University Press, New York, NY 26 Lent, R.W., Sheu, H., Singley, D., Schmidt, J.A., Schmidt, L.C. & Closter, C.S. (2008). Longitudinal relations of
self-efficacy to outcome expectations, interest, and major choice goals in engineering students. Journal of Vocational Behavior, 73(2): 3238-335.
27Bandura, A. (1989). Social cognitive theory. In R. Vasta (Ed.), Annals of Child Development Vol. 6: Six theories of Child Development (pp. 1-60). Greenwich, CT: JAI Press.
28Lent, R. W., & Hackett, G. (1987). Career self-efficacy: Empirical status and future directions. Journal of Vocational Behavior, 30, 347-382.
29Hackett, G. (Director) (2013, February 1). Social Cognitive Career Theory of Career Choice . Lecture conducted from University Missouri Kansas City.
30 Lent, R. W., Brown, S.D. & Hackett, G. (1994). Toward a unified social cognitive theory of career/academic interest, choice, and performance. Journal of Vocational Behavior, 45, 79-122.
31 Marra R., Bogue B. (2006) “Women engineering students self efficacy: a longitudinal multi-institution study.” Proceedings of the 2006 women in engineering programs and advocates network conferences, Pittsburgh.
32 Concannon, J. P., & Barrow, L. H. (2009). “A cross-sectional study of engineering students’ self-efficacy by gender, ethnicity, year, and transfer status.” Journal of Science Education and Technology, 18(2), 163-172.
33 Backer, Patricia R., Halualani, Rona T. "Impact of Self-efficacy on Interest and Choice in Engineering Study and Careers for Undergraduate Women Engineering Students." American Society for Engineering Education Annual Conference: 2012. San Antonio.
Page 26.347.17

Appendices Appendix 1. Summary Statistics of Engineering Self-Efficacy Responses by Intended Major
Self-Efficacy Element
AAE ABE BME CHE CIV ECE
M SD M SD M SD M SD
M SD M SD
SE1 6.41 0.69 6.14 0.70 6.34 0.80 6.32 0.79 6.06 0.83 6.29 0.79
SE2 5.95 1.11 5.18 1.74 5.64 1.36 5.70 1.34 5.53 1.21 5.74 1.36
SE3 6.23 0.92 5.33 1.19 5.58 1.13 5.63 1.28 5.56 1.04 6.09 0.94
SE4 6.24 0.91 5.61 1.06 5.96 0.95 6.09 0.85 5.83 1.09 6.27 0.88
SE5 6.40 0.83 5.87 0.98 6.30 0.81 6.36 0.90 6.11 0.92 6.45 0.74
SE6 6.39 0.80 5.67 1.17 5.89 0.95 5.92 1.11 5.79 0.97 6.29 0.81
SE7 6.08 1.04 5.91 0.98 6.21 1.07 6.54 0.66 5.94 0.96 5.95 1.11
SE8 6.11 1.03 5.43 1.42 6.08 1.04 6.16 0.89 5.83 1.10 6.11 0.93
SE9 6.33 0.80 5.61 1.11 6.14 1.06 6.31 0.79 5.92 0.94 6.12 0.95
SE10 6.01 1.43 5.70 1.43 5.93 1.25 6.04 1.20 5.60 1.41 5.88 1.35
SE11 6.68 0.61 6.37 1.06 6.58 0.69 6.58 0.73 6.45 0.76 6.56 0.74 Mean Self-
Efficacy 6.27 0.65 5.79 0.69 6.07 0.71 6.17 0.62 5.91 0.69 6.18 0.68
IND MEC OTH UND LEAVING
Self-Efficacy Element
M SD M SD
M SD M SD M SD
SE1 5.89 0.89 6.26 0.77 6.01 0.95 5.99 0.81 5.26 1.63 SE2 5.67 1.19 5.74 1.22 5.42 1.42 5.48 1.21 4.35 1.72 SE3 5.51 1.16 5.98 1.00 5.56 1.23 5.57 1.12 4.90 1.37 SE4 5.73 1.10 6.06 0.96 5.86 1.01 5.83 1.00 5.23 1.75 SE5 5.97 1.03 6.29 0.87 5.97 1.05 6.16 0.77 5.10 1.83 SE6 5.63 1.10 6.19 0.81 5.76 1.09 5.91 0.91 4.63 1.52 SE7 5.72 1.11 5.97 1.03 5.83 1.10 5.94 0.95 5.00 1.80 SE8 5.62 1.20 6.03 0.98 5.52 1.24 5.79 1.11 4.72 1.81 SE9 5.82 1.02 6.14 0.92 5.75 1.16 5.92 1.01 5.10 1.58
SE10 5.46 1.31 5.84 1.25 5.27 1.53 5.36 1.57 4.77 1.92 SE11 6.30 0.86 6.53 0.71 6.34 0.91 6.42 0.76 2.14 1.60
Mean Self-Efficacy 5.76 0.87 6.11 0.67 5.80 0.87 5.90 0.67 4.70 1.47
Page 26.347.18

Appendix 2: Model 1 summary of results.
Music Genre AAE ABE BME CHE CIV ECE
OR 95% CI OR 95% CI OR 95% CI OR 95% CI OR 95% CI OR 95% CI Rock 1.72 [1.2,2.3] 0.80 [0.5,1.2] 1.02 [0.6,1.4] 0.85 [0.6,1.1] 0.95 [0.6,1.3] 0.90 [0.7,1.1]
Alternative 1.02 [0.7,1.3] 1.01 [0.6,1.6] 1.01 [0.7,1.4] 1.20 [0.9,1.5] 0.95 [0.6,1.3] 0.66 [0.5,0.8]
Rap/Hip-hop 0.82 [0.6,1.0] 0.73 [0.4,1.1] 1.24 [0.8,1.7] 0.90 [0.7,1.1] 1.03 [0.7,1.3] 0.90 [0.7,1.1]
Country 0.68 [0.5,0.8] 2.09 [1.4,3.0] 1.01 [0.7,1.3] 1.01 [0.8,1.2] 1.23 [0.9,1.6] 0.75 [0.6,0.9]
Soundtracks 1.14 [0.8,1.4] 0.91 [0.5,1.4] 0.91 [0.6,1.3] 0.82 [0.6,1.0] 1.00 [0.7,1.3] 1.22 [0.9,1.5]
Jazz 0.76 [0.5,1.0] 0.82 [0.4,1.4] 1.30 [0.8,1.9] 1.19 [0.8,1.5] 0.90 [0.6,1.3] 1.00 [0.7,1.2]
Pop/Top 40 0.83 [0.6,1.0] 1.09 [0.7,1.6] 1.29 [0.9,1.8] 1.04 [0.8,1.3] 0.94 [0.6,1.2] 0.90 [0.7,1.0]
Religious 0.69 [0.4,0.9] 1.26 [0.8,1.9] 0.93 [0.6,1.4] 0.83 [0.6,1.1] 1.19 [0.8,1.6] 0.79 [0.6,1.0]
Dance/EDM 0.98 [0.7,1.2] 0.81 [0.5,1.2] 0.74 [0.5,1.0] 1.05 [0.8,1.3] 0.94 [0.6,1.2] 1.14 [0.9,1.3]
Classical 1.36 [1.0,1.7] 0.80 [0.4,1.3] 1.03 [0.6,1.5] 0.94 [0.7,1.2] 0.76 [0.5,1.0] 1.19 [0.9,1.4]
Folk 0.97 [0.6,1.3] 1.29 [0.7,2.1] 0.94 [0.5,1.4] 0.75 [0.5,1.0] 1.44 [0.9,2.0] 1.08 [0.8,1.4]
H-L GOF p-value 0.429 0.971 0.129 0.812 0.401 0.024
R-Sq 0.08 0.08 0.01 0.01 0.02 0.06
Favorable/unfavorable cases 129/1342 44/13427 66/1405 142/1329 83/1388 210/1261
Music Genre IND MEC OTH UND LEAVING
OR 95% CI OR 95% CI OR 95% CI OR 95% CI OR 95% CI Rock 0.73 [0.5,1.0] 1.13 [0.9,1.3] 0.81 [0.6,1.0] 1.00 [0.7,1.2] 1.37 [0.7,2.5] Alternative 0.97 [0.6,1.3] 0.92 [0.7,1.1] 1.61 [1.2,2.1] 1.19 [0.9,1.4] 0.83 [0.4,1.4] Rap/Hip-hop 1.16 [0.8,1.5] 1.19 [1.0,1.4] 1.06 [0.8,1.3] 1.01 [0.8,1.2] 0.66 [0.3,1.1] Country 1.06 [0.7,1.4] 1.02 [0.8,1.1] 0.93 [0.7,1.1] 1.17 [0.9,1.4] 1.55 [0.9,2.5] Soundtracks 1.31 [0.9,1.8] 1.02 [0.8,1.2] 0.95 [0.7,1.2] 0.73 [0.5,0.9] 1.62 [0.9,2.8] Jazz 1.01 [0.6,1.4] 0.93 [0.7,1.1] 1.14 [0.8,1.5] 1.12 [0.8,1.4] 0.99 [0.5,1.8] Pop/Top 40 1.11 [0.8,1.5] 0.91 [0.7,1.0] 1.09 [0.8,1.4] 1.26 [1.0,1.5] 0.86 [0.5,1.4] Religious 1.56 [1.1,2.1] 1.10 [0.9,1.3] 0.88 [0.6,1.2] 1.02 [0.7,1.3] 1.92 [1.1,3.1] Dance/EDM 1.25 [0.9,1.7] 1.13 [0.9,1.3] 0.76 [0.5,0.9] 0.95 [0.7,1.1] 1.09 [0.6,1.8] Classical 0.80 [0.5,1.1] 1.07 [0.8,1.2] 0.87 [0.6,1.1] 0.97 [0.7,1.2] 0.62 [0.3,1.1] Folk 1.28 [0.8,1.8] 0.85 [0.6,1.0] 1.18 [0.8,1.6] 1.00 [0.7,1.3] 0.74 [0.3,1.5] H-L GOF p-value 0.042 0.612 0.496 0.448 0.854 R-Sq 0.05 0.02 0.03 0.02 0.08 Favorable/unfavorable cases 86/1385 360/1111 126/1345 198/1273 27/1444
Bold=significant at 0.05; italic=significant at 0.10
Page 26.347.19

Appendix 3: Model 2 summary of results.
Self-Efficacy Element AAE ABE BME CHE CIV ECE
OR 95% CI OR 95% CI OR 95% CI OR 95% CI OR 95% CI OR 95% CI
SE1 1.01 [0.6,1.4] 1.569 [0.8,2.7] 1.648 [1.0,2.6] 1.18 [0.8,1.6] 0.79 [0.5,1.1] 0.95 [0.7,1.2]
SE2 1.066 [0.8,1.2] 0.909 [0.6,1.1] 0.92 [0.7,1.1] 0.99 [0.8,1.1] 1.03 [0.8,1.2] 0.95 [0.8,1.0]
SE3 1.21 [0.8,1.7] 0.775 [0.5,1.2] 0.813 [0.5,1.1] 0.81 [0.6,1.0] 0.9 [0.6,1.2] 1.16 [0.8,1.5]
SE4 1.041 [0.7,1.4] 0.913 [0.5,1.4] 0.846 [0.5,1.2] 0.94 [0.6,1.2] 0.92 [0.6,1.3] 1.22 [0.9,1.6]
SE5 0.649 [0.4,1] 0.859 [0.5,1.4] 1.177 [0.7,1.9] 1.02 [0.7,1.4] 1.09 [0.6,1.7] 1.14 [0.7,1.6]
SE6 1.853 [1.1,3] 0.902 [0.5,1.4] 0.758 [0.5,1.1] 0.64 [0.4,0.8] 0.91 [0.6,1.3] 1.25 [0.8,1.7]
SE7 0.851 [0.6,1.0] 1.061 [0.7,1.5] 1.232 [0.8,1.7] 3.07 [2.1,4.3] 1.04 [0.7,1.3] 0.75 [0.6,0.8]
SE8 0.852 [0.6,1.1] 0.905 [0.6,1.3] 1.139 [0.7,1.6] 0.94 [0.7,1.2] 1.04 [0.7,1.4] 1.22 [0.9,1.5]
SE9 1.175 [0.8,1.6] 0.691 [0.4,1.0] 0.935 [0.6,1.3] 1.24 [0.9,1.6] 1 [0.7,1.4] 0.76 [0.5,0.9]
SE10 1.048 [0.8,1.2] 1.222 [0.9,1.6] 1.051 [0.8,1.3] 1.08 [0.9,1.2] 0.97 [0.8,1.1] 1.07 [0.9,1.2]
SE11 1.368 [0.9,1.9] 1.34 [0.8,2.0] 1.049 [0.7,1.4] 0.94 [0.7,1.1] 1.24 [0.8,1.7] 1.04 [0.8,1.2]
H-L GOF p-value 0.49 0.42 0.42 0.59 0.01 0.62
R-Sq 0.06 0.07 0.04 0.13 0.01 0.05
Favorable/unfavorable cases 136/1340 44/1432 69/1407 147/1329 82/1394 212/1264
Self-Efficacy Element IND MEC OTH UND LEAVING
OR 95% CI OR 95% CI OR 95% CI OR 95% CI OR 95% CI SE1 0.614 [0.4,0.9] 0.956 [0.7,1.2] 0.987 [0.6,1.3] 0.73 [0.5,0.9] 3.11 [1.1,8.1] SE2 1.629 [1.2,2.1] 0.99 [0.8,1.1] 1.048 [0.8,1.2] 1.05 [0.8,1.2] 0.54 [0.2,1.0] SE3 1.052 [0.7,1.4] 1.166 [0.9,1.4] 0.995 [0.7,1.3] 0.83 [0.6,1.0] 2.32 [0.6,8.5] SE4 0.954 [0.6,1.3] 0.873 [0.7,1.0] 1.4 [1.0,1.9] 0.88 [0.6,1.1] 1.01 [0.3,2.7] SE5 0.981 [0.6,1.5] 0.938 [0.7,1.2] 0.703 [0.4,1.0] 1.11 [0.7,1.5] 0.77 [0.2,2.3] SE6 0.675 [0.4,0.9] 1.268 [0.9,1.6] 0.912 [0.6,1.3] 1.23 [0.9,1.6] 0.54 [0.1,2.2] SE7 0.923 [0.7,1.1] 0.832 [0.7,0.9] 1.154 [0.9,1.4] 1.03 [0.8,1.2] 0.81 [0.3,1.8] SE8 0.844 [0.6,1.1] 1.111 [0.9,1.3] 0.736 [0.5,0.9] 1.05 [0.8,1.3] 0.76 [0.3,1.8] SE9 1.03 [0.7,1.4] 1.014 [0.8,1.2] 1.019 [0.7,1.3] 1.01 [0.7,1.2] 1.38 [0.6,3.0]
SE10 0.987 [0.8,1.1] 1.055 [0.9,1.1] 0.838 [0.7,0.9] 0.84 [0.7,0.9] 1.48 [0.6,3.5] SE11 1.174 [0.8,1.5] 1.069 [0.9,1.2] 1.133 [0.8,1.4] 1.19 [0.9,1.4] 0.13 [0.0,0.2]
H-L GOF p-value 0.92 0.34 0.66 0.92 0.89 R-Sq 0.06 0.02 0.04 0.03 0.84
Favorable/unfavorable cases 89/1387 370/1106 120/1356 184/1292 23/1453
Bold=significant at 0.05; italic=significant at 0.10
Page 26.347.20
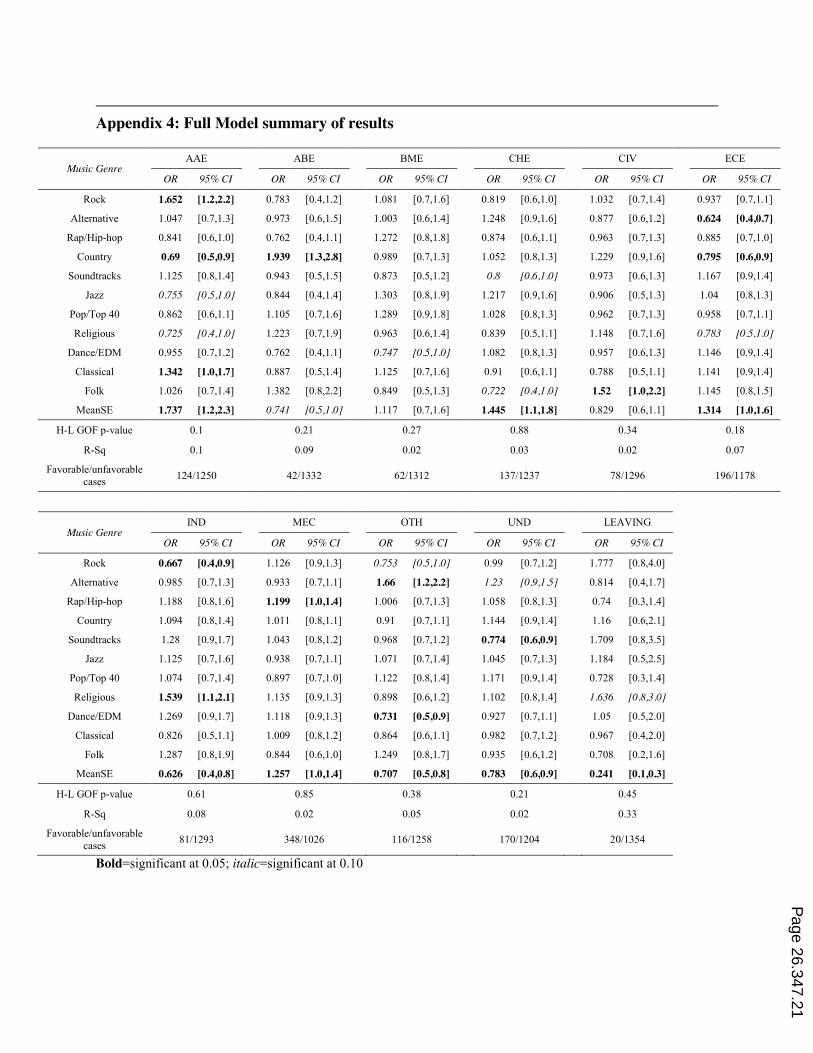
Appendix 4: Full Model summary of results
Music Genre AAE ABE BME CHE CIV ECE
OR 95% CI OR 95% CI OR 95% CI OR 95% CI OR 95% CI OR 95% CI
Rock 1.652 [1.2,2.2] 0.783 [0.4,1.2] 1.081 [0.7,1.6] 0.819 [0.6,1.0] 1.032 [0.7,1.4] 0.937 [0.7,1.1]
Alternative 1.047 [0.7,1.3] 0.973 [0.6,1.5] 1.003 [0.6,1.4] 1.248 [0.9,1.6] 0.877 [0.6,1.2] 0.624 [0.4,0.7]
Rap/Hip-hop 0.841 [0.6,1.0] 0.762 [0.4,1.1] 1.272 [0.8,1.8] 0.874 [0.6,1.1] 0.963 [0.7,1.3] 0.885 [0.7,1.0]
Country 0.69 [0.5,0.9] 1.939 [1.3,2.8] 0.989 [0.7,1.3] 1.052 [0.8,1.3] 1.229 [0.9,1.6] 0.795 [0.6,0.9]
Soundtracks 1.125 [0.8,1.4] 0.943 [0.5,1.5] 0.873 [0.5,1.2] 0.8 [0.6,1.0] 0.973 [0.6,1.3] 1.167 [0.9,1.4]
Jazz 0.755 [0.5,1.0] 0.844 [0.4,1.4] 1.303 [0.8,1.9] 1.217 [0.9,1.6] 0.906 [0.5,1.3] 1.04 [0.8,1.3]
Pop/Top 40 0.862 [0.6,1.1] 1.105 [0.7,1.6] 1.289 [0.9,1.8] 1.028 [0.8,1.3] 0.962 [0.7,1.3] 0.958 [0.7,1.1]
Religious 0.725 [0.4,1.0] 1.223 [0.7,1.9] 0.963 [0.6,1.4] 0.839 [0.5,1.1] 1.148 [0.7,1.6] 0.783 [0.5,1.0]
Dance/EDM 0.955 [0.7,1.2] 0.762 [0.4,1.1] 0.747 [0.5,1.0] 1.082 [0.8,1.3] 0.957 [0.6,1.3] 1.146 [0.9,1.4]
Classical 1.342 [1.0,1.7] 0.887 [0.5,1.4] 1.125 [0.7,1.6] 0.91 [0.6,1.1] 0.788 [0.5,1.1] 1.141 [0.9,1.4]
Folk 1.026 [0.7,1.4] 1.382 [0.8,2.2] 0.849 [0.5,1.3] 0.722 [0.4,1.0] 1.52 [1.0,2.2] 1.145 [0.8,1.5]
MeanSE 1.737 [1.2,2.3] 0.741 [0.5,1.0] 1.117 [0.7,1.6] 1.445 [1.1,1.8] 0.829 [0.6,1.1] 1.314 [1.0,1.6]
H-L GOF p-value 0.1 0.21 0.27 0.88 0.34 0.18
R-Sq 0.1 0.09 0.02 0.03 0.02 0.07
Favorable/unfavorable cases 124/1250 42/1332 62/1312 137/1237 78/1296 196/1178
Music Genre IND MEC OTH UND LEAVING
OR 95% CI OR 95% CI OR 95% CI OR 95% CI OR 95% CI Rock 0.667 [0.4,0.9] 1.126 [0.9,1.3] 0.753 [0.5,1.0] 0.99 [0.7,1.2] 1.777 [0.8,4.0]
Alternative 0.985 [0.7,1.3] 0.933 [0.7,1.1] 1.66 [1.2,2.2] 1.23 [0.9,1.5] 0.814 [0.4,1.7] Rap/Hip-hop 1.188 [0.8,1.6] 1.199 [1.0,1.4] 1.006 [0.7,1.3] 1.058 [0.8,1.3] 0.74 [0.3,1.4]
Country 1.094 [0.8,1.4] 1.011 [0.8,1.1] 0.91 [0.7,1.1] 1.144 [0.9,1.4] 1.16 [0.6,2.1] Soundtracks 1.28 [0.9,1.7] 1.043 [0.8,1.2] 0.968 [0.7,1.2] 0.774 [0.6,0.9] 1.709 [0.8,3.5]
Jazz 1.125 [0.7,1.6] 0.938 [0.7,1.1] 1.071 [0.7,1.4] 1.045 [0.7,1.3] 1.184 [0.5,2.5] Pop/Top 40 1.074 [0.7,1.4] 0.897 [0.7,1.0] 1.122 [0.8,1.4] 1.171 [0.9,1.4] 0.728 [0.3,1.4] Religious 1.539 [1.1,2.1] 1.135 [0.9,1.3] 0.898 [0.6,1.2] 1.102 [0.8,1.4] 1.636 [0.8,3.0]
Dance/EDM 1.269 [0.9,1.7] 1.118 [0.9,1.3] 0.731 [0.5,0.9] 0.927 [0.7,1.1] 1.05 [0.5,2.0] Classical 0.826 [0.5,1.1] 1.009 [0.8,1.2] 0.864 [0.6,1.1] 0.982 [0.7,1.2] 0.967 [0.4,2.0]
Folk 1.287 [0.8,1.9] 0.844 [0.6,1.0] 1.249 [0.8,1.7] 0.935 [0.6,1.2] 0.708 [0.2,1.6] MeanSE 0.626 [0.4,0.8] 1.257 [1.0,1.4] 0.707 [0.5,0.8] 0.783 [0.6,0.9] 0.241 [0.1,0.3]
H-L GOF p-value 0.61 0.85 0.38 0.21 0.45 R-Sq 0.08 0.02 0.05 0.02 0.33
Favorable/unfavorable cases 81/1293 348/1026 116/1258 170/1204 20/1354
Bold=significant at 0.05; italic=significant at 0.10
Page 26.347.21