Embed Size (px)
Citation preview
“Characterizing Rho kinase activity using a novel PET tracer
in hypertrophied cardiomyocytes”
Steven Moreau
This thesis is submitted as a partial fulfillment of the M.Sc. program in Cellular and
Molecular Medicine
Date of Submission:
June 1st, 2012
Place of Submission:
Roger Guindon Hall Room 3206
451 Smyth Road,
Ottawa, Ontario
Canada, K1H 8M5
© Steven Moreau, Ottawa, Canada, 2012

ii
Authorization
The following authorizations were given by Elsevier in order to create Figure 2 in this
thesis:
1. Licensee: Steven M Moreau
License Date: Apr 4, 2012
License Number: 2881730573804
Publication: Applied Radiation and Isotopes
Title: Radiosynthesis of N-[11C]-methyl-hydroxyfasudil as a new potential PET
radiotracer for rho-kinases (ROCKs)
Type Of Use: reuse in a thesis/dissertation
Total: 0.00 USD
2. Licensee: Steven M Moreau
License Date: Apr 3, 2012
License Number: 2881171381493
Publication: Structure
Title: Protein Kinase A in Complex with Rho-Kinase Inhibitors Y-27632,
Fasudil, and H-1152P: Structural Basis of Selectivity
Type Of Use: reuse in a thesis/dissertation
Total: 0.00 USD
iii
Abstract
Cardiac hypertrophy is a compensatory response to increased work load or stress
on the heart, but over time can lead to heart failure and death. The molecular mechanisms
underlying this disease are still not completely understood, however the Rho/Rho kinase
pathway has been shown to play a role. N-[11
C]-methyl-hydroxyfasudil, a PET
radiotracer, binds to active Rho kinase and could be a possible tracer for hypertrophy.
Hypertrophy was induced in vitro using the β-adrenergic receptor agonist isoproterenol to
evaluate optimal Rho kinase activity. Rho kinase activity data was correlated to N-[11
C]-
methyl-hydroxyfasudil binding. Cardiac hypertrophy was verified with an increase in
nuclear size (1.74 fold) and cell size (~2 fold), activation of hypertrophic signalling
pathways, and increased Rho kinase activity (1.64 fold). This correlated to a 10.3%
increase in N-[11
C]-methyl-hydroxyfasudil binding. This data suggests that N-[11
C]-
methyl-hydroxyfasudil may be useful as a radiotracer for detecting cardiac hypertrophy
and merits further in vivo investigation.
iv
Table of Contents
Authorization ............................................................................................................. ii
Abstract ..................................................................................................................... iii
Table of Contents ....................................................................................................... iv
List of Figures............................................................................................................vii
List of Abbreviations ................................................................................................viii
Acknowledgements ...................................................................................................... x
Statement of Contribution .......................................................................................... xi
1.0 Introduction ........................................................................................................... 1
1.1 Cardiac hypertrophy ............................................................................................. 2
1.1.1 Subtype classification of cardiac hypertrophy ................................................. 2
1.1.2 Pathological cardiac hypertrophy .................................................................... 3
1.1.3 Causes of hypertrophic cardiomyopathy ......................................................... 4
1.1.4 Physiological and morphological changes during hypertrophic
cardiomyopathy...................................................................................................... 5
1.2 Isoproterenol ........................................................................................................ 7
1.3 Hypertrophic molecular signalling pathways ......................................................... 8
1.3.1 G-protein coupled receptor signalling: β-adrenergic receptors.......................... 8
1.3.2 mTOR/rapamycin in hypertrophic signalling................................................. 13
1.3.3 Rho kinase in hypertrophic signaling ............................................................ 14
1.3.4 Apoptotic signalling in hypertrophic cardiomyopathy.................................... 16
1.4 Rho kinase inhibitors .......................................................................................... 18
1.4.1 Possible uses in treatment of cardiac disease ................................................. 18
1.4.2 Fasudil, Hydroxyfasudil & Y27632 .............................................................. 18
1.5 Biological Radiotracers ...................................................................................... 19
1.5.1 PET versus SPECT ...................................................................................... 19
1.5.2 Conceptualizing PET ................................................................................... 21
1.5.3 N-[11
C]-methyl-hydroxyfasudil ..................................................................... 22
v
1.6 Research Plan..................................................................................................... 24
1.6.1 Rationale ..................................................................................................... 24
1.6.2 Hypotheses .................................................................................................. 25
1.6.3 Objectives ................................................................................................... 25
2.0 Materials and Methods ........................................................................................ 27
2.1 Cell culture ........................................................................................................ 28
2.1.1 H9C2 cell culture ......................................................................................... 28
2.1.2 Primary cardiomyocyte cell culture............................................................... 28
2.2 Isoproterenol treatment ....................................................................................... 30
2.3 Generation of cell lysates .................................................................................... 30
2.4 Western blotting ................................................................................................. 31
2.5 ROCK activity assay .......................................................................................... 33
2.6 Hematoxylin and Eosin staining .......................................................................... 34
2.7 Immunocytochemistry ........................................................................................ 34
2.8 Cell viability experiments ................................................................................... 35
2.8.1 Trypan blue exclusion assay ......................................................................... 35
2.8.2 MTT assay................................................................................................... 35
2.9 N-[11
C]-methyl-hydroxyfasudil tracer experiments .............................................. 36
2.9.1 Standardization of gamma counter ................................................................ 36
2.9.2 N-[11
C]-methyl-hydroxyfasudil synthesis and analysis................................... 36
2.9.3 N-[11
C]-methyl-hydroxyfasudil binding ........................................................ 36
2.10 Statistical analysis ............................................................................................ 38
3.0 Results .................................................................................................................. 39
3.1 Cell viability after ISO treatment ........................................................................ 40
3.2 Morphological changes in cell size and nuclear size after ISO treatment ............... 41
3.3 Evaluating isolated cardiomyoctes population purity ........................................... 44
3.4 Evaluating signalling pathways of ISO induced cardiac hypertrophy in primary
cardiomyocytes ........................................................................................................ 47
3.5 ROCK1/2 activity during ISO induced cardiac hypertrophy in primary
cardiomyocytes ........................................................................................................ 48
3.6 N-[11
C]-methyl-hydroxyfasudil binding under ISO-induced cardiac hypertrophy in
primary cardiomyocytes .......................................................................................... 52

vi
4.0 Discussion ............................................................................................................ 59
4.1 Brief summary of findings .................................................................................. 60
4.2 Cell viability after ISO treatment ........................................................................ 61
4.3 Morphological changes in cell size and nuclear size after ISO treatment ............... 62
4.4 Evaluating isolated cardiomyocyte population purity ........................................... 63
4.5 Evaluating ERK1/2 and mTOR signalling pathways during ISO induced cardiac
hypertrophy in primary cardiomyocytes .................................................................... 65
4.6 Rho kinase activity and regulation during ISO induced cardiac hypertrophy in
primary cardiomyocytes ........................................................................................... 67
4.7 N-[11
C]-methyl-hydroxyfasudil synthesis and binding to Rho kinase during ISO
induced hypertrophy in primary cardiomyocytes ....................................................... 69
4.8 Conclusions ....................................................................................................... 72
5.0 References ............................................................................................................ 74
vii
List of Figures
Figure 1: Isoproterenol treatment leading to cardiac hypertrophy through cross-talk
GPCR signaling pathways.
Figure 2: The chemical structures of Rho kinase inhibitors
Figure 3: Positron emission tomography
Figure 4: Timeline for primary cardiomyocyte isolation and cell culture
Figure 5: Cell viability trypan blue exclusion assay of multiple concentrations of ISO
treatment on H9C2 cells over multiple incubation times.
Figure 6: MTT assay of ISO treated H9C2 cells.
Figure 7: Nuclear and cell size comparisons between ISO treated and non-treated H9C2
cells.
Figure 8: Verification of cardiomyocytes cultured from neonatal rat pups.
Figure 9: Phosphorylated ERK1/2 levels during ISO treatment in primary
cardiomyocytes.
Figure 10: Phosphorylated mTOR levels during ISO treatment on primary
cardiomyocytes.
Figure 11: ROCK1 expression in cardiomyocytes after 24-72h of 10μM ISO treatment.
Figure 12: ROCK activity in primary cardiomyocytes after ISO treatment.
Figure 13: N-[11
C]-methyl-hydroxyfasudil preparation and analysis.
Figure 14: N-[11
C]-methyl-hydroxyfasudil binding in ISO treated primary
cardiomyocytes.

viii
List of Abbreviations
Abbreviation Full Term
AC adenylyl cyclise also known as adenylate cyclase
ANP atrial natriuretic peptide
ATP adenosine triphosphate
β-AR beta-adrenergic receptor
BLI bioluminescence imaging
β-MHC β-myosin heavy chain
CRD cysteine-rich domain
CREB cAMP response element binding protein
IGF insulin-like growth factor
ISO isoproterenol
cAMP cyclic adenosine monophosphate
DAG diacyl glycerol
ERK1/2 p42 & p44 MAP kinase
ERM ezrin, radixin, and moesin
Gα/β/γ heterotrimeric G protein with subunits alpha, beta, & gamma
GDP guanasine diphosphate
GPCR G-protein coupled receptor
GTP guanasine tri-phosphate
HCM hypertrophic cardiac myopathy
IP3 inositol 1,4,5-triphosphate
JNK c-Jun terminal kinase
LDH lactate dehydrogenase

ix
MBS myosin binding subunit
MEK1/2 mitogen-activated protein kinase kinase
MLCP myosin light chain phosphatase
MRI magnetic resonance imaging
mTOR mammalian target of rapamycin
MYH7 gene encoding β-myosin heavy chain
MYBPC3 gene encoding myosin binding protein C
MYL2 gene encoding regulatory myosin light chain
PET positron emission tomography
PH pleckstrin homology
PIP2 phosphoinositol 4,5-biphosphate
PI3K phosphoinositol 3 kinase
PKA protein kinase A
PKB protein kinase B
PKC protein kinase C
PKN protein kinase N
PLC phospholipase C
RBD Rho binding domain
ROCK1/2 Rho associates kinases 1 & 2 also known as Rho kinase
SKA α-skeletal actin
SPECT single photon emission tomography
TNF-α tumor necrosis factor alpha

x
Acknowledgements
In completing this Master’s thesis I have had the support and assistance of
multiple colleagues and friends who I wish to thank. I will start by first and foremost
thanking my primary supervisor, Dr. Pasan Fernando, for his expertise, support and
patience throughout this learning experience and the completion of my degree. Also in
high regards, I would like to thank my co-supervisor, Dr. Jean DaSilva, for his expertise
and contribution into shaping and guiding my project along the way. Without these two
individuals I would not have been able to complete my degree and for this I will always
be gracious.
I would next like to thank the members of my thesis advisory committee, Dr. Rob
Beanlands and Dr. Balwant Tuana, for their input and knowledge that contributed to my
projects design and refinement, as well as their encouragement throughout the years.
Thirdly, thank you to the Ontario Preclinical Imaging Consortium (OPIC) for funding this
project, without them my research would never have been possible. Next, I would like to
thank all the people who have assisted me with experiments and analysis of my project at
the Ottawa Heart Institute. Thank you to Adam Smith and Dan Duan for showing me the
ropes in the lab and helping me wherever possible in refining my experimental techniques
and procedures. Also, I would like to thank the staff at the animal care facility and
radiochemistry for their assistance throughout my time here as well as Stephanie Thorn
for her advice and guidance in areas out of my expertise.
Finally, I would like to thank my friends, family and girlfriend, for their patience
and support throughout the completion of this degree. You have always been there for me
during the ups and downs of these last few years and for this I owe the utmost thanks.
xi
Statement of Contribution
Dr. Pasan Fernando, Dr. Jean DaSilva and I designed the project with input from
my thesis advisory committee. Dr. Ana Valdivia designed and was the first to synthesize
N-[11
C]-methyl-hydroxyfasudil tracer which was later published, while Keegan Flowers
synthesized the tracer specifically for the use in my project. Dr. Pasan Fernando assisted
with the experimental data analysis and as well as with the statistical analysis.

1
INTRODUCTION

2
1.1 Cardiac Hypertrophy
1.1.1 Subtype classification of cardiac hypertrophy
Cardiac hypertrophy results in an overall change in the geometry, mass, and function
of the heart. The progression to cardiac hypertrophy can manifest from either physiologic
or pathologic mechanisms. Physiological hypertrophy is common among aerobically
trained and conditioned athletes and is a result of increased heart rate and blood pressure
for prolonged periods of time. This physiological state can also be displayed during
pregnancy via neurohormonal, endothelial, and electrophysiological mechanisms.
Whereas pathological hypertrophy leads to maladaptive cardiovascular function,
physiologic hypertrophy creates a state of preserved or enhanced cardiac function
(McMullen et al. 2007).
To further classify cardiac hypertrophy, there are two categories depending on the
type of stimulus or trigger that initiates this process. The two classes are concentric and
eccentric hypertrophy. These two classes can also be defined by the phenotype of the
cardiomyocytes. Concentric hypertrophy occurs when the myocyte length increases less
than its width and results from chronic pressure overload of the ventricles. Overall this
leads to an increase in wall thickness and a decrease in the volume capacity of the left
ventricle. In comparison, eccentric hypertrophy phenotypically results from a greater
increase in myocyte length than width as the result of a volume overload in the heart. This
results in cardiac dilation causing a thinning of the ventricle walls (Rohini et al. 2010).
Physiological hypertrophy is a reversible process while pathological hypertrophy is not.
During pathological hypertrophy the increase in wall thickness is initially a mechanism to

3
maintain normal cardiac function at a resting state, but over time remodeling can occur
leading to cardiac dilation and heart failure. Physiological hypertrophy does not adapt in
similar ways to pathological hypertrophy and also does not regress to a state of dilated
cardiomyopathy or heart failure (Beltrami et al. 2001; Nadal-Ginard et al. 2003). The
molecular mechanisms underlying these phenotypes and physiological changes differ
between the two processes although some cell signalling pathways may overlap. The
signal transduction pathways underlying pathological cardiac hypertrophy will be
discussed later on.
1.1.2 Pathological Cardiac Hypertrophy
Pathological cardiac hypertrophy, also known as hypertrophic cardiomyopathy, is one
of the leading causes of sudden death from cardiac disease and occurs in approximately
0.2% of the global population (Schlossarek et al. 2011). This is mainly due to the fact that
it can be completely asymptomatic or unnoticed until the disease has severely progressed.
The causes of pathological cardiac hypertrophy can vary from patient to patient and can
also be an outcome of many forms of heart disease such as ischemia, hypertension, heart
failure and valvular disease (Frey et al. 2004).
Cardiac hypertrophy can be divided into three stages of development (Meerson 1961).
The first stage of cardiac hypertrophy initiates when the work load created on the heart is
greater than its capable output at that time. The second stage is where the heart begins to
compensate for this increased load and is termed compensatory hypertrophy.
Compensatory hypertrophy results in normalized workload/cardiac mass ratio allowing
cardiac output to be maintained at rest. The third stage takes place in response to the
4
constant activation of the hypertrophic response and this is overt heart failure. From this
comes ventricular dilation from a process known as “remodeling” as well as a large
decrease in cardiac output (Frey et al. 2004). The molecular mechanisms and signalling
pathways involved in the transition from an adaptive response to heart failure are still far
from completely understood making treatment and detection difficult.
1.1.3 Causes of Hypertrophic Cardiomyopathy
Pathological hypertrophic cardiomyopathy can develop in patients from a
previous disease that had placed stress on the heart. The increased blood pressure in the
heart ventricles due to prolonged hypertension or the increase in workload needed to
pump blood through plaque-filled arteries such as the aorta during atherosclerosis, are
two examples of disease states that can lead to hypertrophic cardiomyopathy (Satoh et al.
2001; Abe et al. 2004). Not only can cardiac hypertrophy be induced through other
cardiovascular diseases, but it can also lead to such ailments as atrial fibrillation and
arrhythmias, which occur in 25% of affected patients (Maron 2002; Kubo et al. 2009).
Genetically, hypertrophic cardiomyopathy is conventionally caused by dominant
mutations in the genes encoding proteins that compose the contractile sarcomeres (Wang
et al. 2010). Genetic studies have shown that there are approximately 900 mutations
found in 13 genes for familial clustering of cardiac hypertrophy which account for
approximately 15% of familial cardiac hypertrophy (Alcalai et al. 2008). The affected
genes in the sarcomere usually affect the thick and thin filament proteins (Marian 2008),
for example MYH7 encoding β-myosin heavy chain, MYBPC3 encoding myosin binding
protein C, and MYL2 encoding regulatory myosin light chain (Keren et al. 2008).

5
Although genetic studies may be able to predict the severity of hypertrophic
cardiomyopathy in patients, it is not yet able to predict the patterns of the disease such as
eccentric versus concentric hypertrophy or the affected hypertrophic area of the heart,
whether it be apical, septal, or ventricular (Arad et al. 2005). These genetic alterations can
also affect proteins involved in calcium homeostasis (Fatkin et al. 2000; Haim et al. 2007)
as well as cause loss of function/alteration of function of regulatory proteins in the
hypertrophic molecular signalling pathways (Palmiter et al. 2000; Debold et al. 2007).
During the hypertrophic response there is activation of the “fetal gene program”. As the
name implies, this involves the activation of transcription of genes normally only
activated during the fetal stage of development. Some of these include atrial natriuretic
peptide (ANP), β-myosin heavy chain (β-MHC) and α-skeletal actin (SKA), which are all
markers of hypertrophy. There is also activation of the immediately early genes c-jun, c-
fos and c-myc (Rohini et al. 2010).
1.1.4 Physiological and Morphological Changes During Hypertrophic
Cardiomyopathy
Cardiac hypertrophy induces a range of heart defects that involve not only its
structure and size but also systolic dysfunction, hypertrophic remodeling and dilation.
Most noticeably, there is an increase in ventricular mass commonly occurring in the left
ventricle (Fielitz et al. 2008). Performance wise, the overall ejection fraction
progressively decreases accompanied by a decrease in fractional shortening. There is an
increase in left ventricular end systolic and diastolic diameter within the heart and an
eventual decrease in heart rate indicating cardiac demise (Heather et al. 2009).

6
The morphological feature most noticeable at the cellular level of cardiac
hypertrophy is increased cardiomyocyte size, relative to the non-hypertrophied cell. By
definition hypertrophic growth comes from an increase in cardiomyocyte size in the
absence of significant cell division (Hannan et al. 2003). Underneath this feature lies a
complex network of signalling pathways and mechanisms that although not well
understood, can be modeled in vivo and in vitro. In vitro studies of cardiac hypertrophy
commonly use primary cardiomyocytes isolated from neonatal rat pups because of their
similarity to native cardiomyocytes in vivo. This in vitro model has permitted the
characterization of a wide variety of signalling pathways, phenotypic changes and
transcriptional changes during cardiomyocyte hypertrophy.
During cardiac hypertrophy there is an increase in the levels of protein synthesis
and degradation, however, protein synthesis levels are much higher and therefore create
an overall net increase in protein content. This phenomenon is often demonstrated
experimentally by comparing overall protein to DNA content in the cell. Factors affecting
the increase in protein content include increases in transcription as well as regulation of
mRNA translation; the latter said to be more heavily responsible (Hannan et al. 2003).
During these increased states of transcription the nuclei become measurably larger.
Gerdes et al. in 1994 demonstrated up to a 56% increase in nuclear size during cardiac
hypertrophy surgically induced in rats (Gerdes et al. 1994). Originally papers from
Simpson in 1983 showed that isoproterenol, a known inducer of hypertrophy, was unable
to increase the protein to DNA content and cell size of primary cardiomyocytes isolated
from neonatal rat pups (Simpson 1983). This was later countered by several researchers
who published work showing that the protein/DNA content of ISO treated

7
cardiomyocytes did increase (Bogoyevitch et al. 1996; Zou et al. 1999). The currently
accepted theory is that isoproterenol increases both the cell size and the protein/DNA
content in neonatal rat cardiomyocytes through β-adrenergic receptor (βAR) stimulation
(Morisco et al. 2001).
Histological studies have shown that along with the increase in cardiomyocyte and
nuclear size there is a reorganization of the collagen matrix and collagen deposition in the
extracellular matrix resulting in fibrosis. This collagen reorganization and increased
fibrosis, known as remodeling, causes increased wall thickness and impaired cardiac
contractibility (Jalil et al. 1989). Within the cell, there is also reorganization and addition
of sarcomeres in response to the increased hemodynamic load (Chu et al. 2011).
1.2 Isoproterenol
Isoproterenol (ISO) is a dual β1 and β2AR agonist that is capable of inducing
pathological cardiac hypertrophy in in vitro and in vivo models (Heather et al. 2009). In
vitro, ISO can be administered to the cells at various concentrations by simply treating the
media (Morisco et al. 2001), with signalling cascades being activated within the first
10min of treatment (Zheng et al. 2004). In vivo experiments have been carried out using
an assortment of delivery methods, treatment durations, drug vehicles and ISO
concentrations. Chronic or acute infusion methods are another variable in the drug’s
delivery. Acute high-dose treatments with ISO can cause cardiac infarctions, cardiac
dysfunction, and β-adrenergic receptor desensitization (Ribeiro et al. 2009). Chronic
delivery of ISO in lower dose concentrations induces cardiac hypertrophy over time, in
comparison to acute administration (Zhang et al. 2005). Along with causing cardiac
8
hypertrophy, ISO has also been shown to induce cell death through apoptosis and necrosis
with other possible effects including increased fibrosis, oxidative damage and
inflammation (Heather et al. 2009).
1.3 Hypertrophic Molecular Signalling Pathways
1.3.1 G-Protein Coupled Receptor Signalling: β-Adrenergic Receptors
Although there is a vast array of guanine nucleotide binding regulatory protein (G-
protein) coupled receptors (GPCRs), ligands, and agonists that are capable of inducing
cardiac hypertrophy, we will focus on the β-adrenergic receptors and their interactors in
specific. β-ARs come from a large family GPCRs and are partially responsible for
controlling increased activity in the heart in response to adrenergic sympathetic
stimulation such as adrenaline or noradrenaline (Chakraborti et al. 2000). After the class
of adrenergic receptors had been categorized into α- and β-adrenergic receptors by
Alquist in 1948 (Ahlquist 1948) they were later distinguished into their α1-, α2-, β1-, β2-,
β3- and the recently hypothesized existence of β4- subtypes (Lands et al. 1967; Brodde
1991; Bylund et al. 1994; Kaumann et al. 1997). Cardiomyocytes contain both β1- and
β2-ARs in most mammals including humans, however β1-AR is much more predominant
and is found at a β1:β2 ratio of 70-80%:30-20% in the ventricles and a 60-70%:40-30% in
the atria (McDevitt 1989).
The β-ARs are a class of GPCRs and therefore interact with G proteins. G proteins
are composed of three subunits termed Gα, Gβ, and Gγ, each performing a different
function in GPCR downstream signalling (Sprang 1997). Gα binds either GDP or GTP
while Gβ has very versatile binding functions which can create numerous protein-protein

9
interactions and is found stably dimerized to the Gγ subunit (Smith et al. 1999). Gγ has a
C-terminal isoprenyl moiety which, in turn, localizes it to the cell membrane making any
protein that binds to Gβγ essentially membrane bound. When GDP binds to Gα, it forms a
stable complex with Gβγ which can be separated by the exchange of GDP for GTP due to
a change in protein conformation (Smith et al. 1999). This association/disassociation of
the Gα subunit to Gβγ upon either activation or deactivation by the presence of GTP or
GDP is what creates downstream signalling necessary for cardiac function (Bourne 1997).
It can now be seen that a disruption or desensitization of the β-adrenergic receptors could
cause a disruption in proper cardiac function and participate in some of the underlying
mechanisms of multiple types of cardiomyopathies (Chakraborti et al. 2000).
Due to the cross-talk and complexity of the signalling pathways involved in
cardiac hypertrophy there is an abundance of overlap between proteins and molecules and
their functions depending on the stimulation for the initiation of cardiac hypertrophy.
GPCR signalling has been shown to participate in this cross-talk; an example of this being
the activation of β-ARs leading to the activation of other G proteins (see Figure 1)
(Rohini et al. 2010). Both the β1 and β2 subtypes are coupled to the Gs protein and upon
activation cause the downstream elevation of cyclic-AMP (cAMP). This is accomplished
by the activation of adenylyl cyclase (AC) by both β1- and β2-ARs’ Gsα G-protein
stimulation. Active AC produces cAMP which activates downstream pathways including
the activation of protein kinase A (PKA) which in turn can phosphorylate multiple
proteins involved in positive chronotropic and inotropic cardiac responses (Marian 2006).
10
β-AR
ISO
Gαs Gβ Gγ
AC
ATP cAMP
PKA
P
L-typeCalciumchannel
phospholamban troponin
increased contraction force
P P
GTPGαq Gα11
GPCR activation stimulates crosstalk activation of other G proteins
Cell membrane
PLC
PIP2 +DAG IP3
PKC
Sarcoplasmicreticulum
Ca2+
HYPERTROPHY
RhoA
Rho kinase
Myosin phophatase ERM proteins, Adducin, LIM-kinase
PP
GTP GTP
Figure 1: Isoproterenol treatment leading to cardiac hypertrophy through cross-talk
GPCR signaling pathways. Abbreviations: ISO: Isoproterenol; β-AR: beta-adrenergic
receptor; Gαs: G-protein S subunit alpha ; GTP: guanasine tri-phosphate; Gβ: G-protein
subunit beta; Gγ: G-protein subunit gamma; AC: adenylyl cyclase; ATP: adenosine tri-
phosphate; cAMP: cyclic adenosine mono-phosphate; PKA: protein kinase A; ℗:
phosphorylation; Gαq: G-protein Q alpha subunit; Gα11: G-protein 11 alpha subunit; PLC
phospholipase C; PIP2: phosphoinositol 4,5-biphosphate; DAG: diacylglycerol; IP3:
inositol 1,4,5-triphosphate; PKC: protein kinase C; Ca2+
: free calcium; ERM: ezrin,
radixin, moesin. Note: this schematic does not demonstrate all hypertrophic GPCR
pathways.

11
As shown in Figure 1, β-AR agonists such as ISO activate Gαs bound to GTP
which then activates downstream AC (Marian 2006). Simultaneously, this leads to cross-
talk with other GPCR pathways such as Gq/G11 (Molkentin et al. 2001). The Gs
activation allows for AC to covert adenosine tri-phosphate (ATP) to cyclic adenosine
monophosphate (cAMP). Increased levels of intracellular cAMP can further activate PKA
which is responsible for activating multiple downstream targets involved in cardiac
contraction through phosphorylation. These targets include phospholamban, troponin, and
the L-type calcium channel (Marian 2006). Activation of the L-type calcium channel will
in turn increase intracellular levels of calcium ions which can activate other hypertrophic
signalling pathways. This increase in contraction is part of the initiation of the
hypertrophic condition.
The simultaneous activation of the Gq/G11 pathway activates various small G-
proteins such as Ras and Rho, thus initiating multiple downstream pathways (Molkentin
et al. 2001; Proud 2004; Lezoualc'h et al. 2008). While in its GTP-bound active state, Ras
activates multiple downstream targets involved in the hypertrophic signalling paths
including Raf, phosphatidylinositol 3-kinase (PI3K), and c-Jun terminal kinases (JNKs)
(Ramirez et al. 1997). Active Raf leads to the phosphorylation and activation of mitogen-
activated protein kinase kinase 1/2 (MEK1/2). Active MEK1/2 phosphorylates ERK1/2
(also known as p42 and p44 MAP kinase) (Proud 2004). Other mechanisms are capable
of activating the Raf-MEK1/2-ERK1/2 pathway such as cell receptor agonists, cell
stretch, and pressure overload in cell and animal models (Proud 2004). This makes it a
good molecular biomarker of cardiac hypertrophy. There are, however, discrepancies in
terms of the signalling pathways involved in cardiac hypertrophy in vitro, mainly due to

12
the differences in approaches used to induce the disease. The possible different signalling
connections in adult versus neonatal cardiomyocytes along with the different end-points
used in individual experiments are two examples of what may cause some of these
discrepancies. This is seen to occur not only for the ERK1/2 pathways, but also for many
others such as the JNK and mTOR pathways (Wang et al. 2001; Frey et al. 2003; Proud
2004).
The Gq/G11 as well as the G12/13 GPCR pathways are, in part, responsible for
the activation of Rho through different mechanisms. The Gq/G11 path upon stimulation
can activate phospholipase C (PLC). PLC converts phosphoinositol 4,5-biphosphate
(PIP2) to diacyl glycerol (DAG) and inositol 1,4,5-triphosphate (IP3). These two products
are capable of activating Rho in two ways. DAG can activate protein kinase C (PKC)
which in turn can activate Rho. IP3 can trigger calcium release from the sarcoplasmic
reticulum to the intracellular space which has been shown to activate Rho as well
(Molkentin et al. 2001; Arimoto et al. 2006) (see Figure 1). Through agonist induced
G12/13 activation, Rho can be directly activated, or as with Gq/G11 pathways can be
activated through DAG/PKC activation (Shimokawa et al. 2005). Downstream effectors
of Rho include protein kinase N (PKN), rhophilin, rhotekin, citron, p140mDia, citron
kinase, and Rho kinase (Hall 1998; Kaibuchi et al. 1999). Rho kinase however is the only
downstream effector studied in detail. Both Rho and Ras subfamilies of small G proteins
have demonstrated involvement in the regulation of cytoskeletal organization and cardiac
growth via hypertrophic gene expression control.

13
1.3.2 mTOR/rapamycin in hypertrophic signalling
Mammalian target of rapamycin (mTOR), has been shown to play a role in mediating
cardiac hypertrophy (Shioi et al. 2003). Although this role is not completely understood,
it has been demonstrated that mTOR coordinates inputs from various factors including
hormones, mitogens and nutrients such as branched chain amino acids, to control protein
synthesis, gene expression, cell size and proliferation (Thomas et al. 1997; Rohde et al.
2001; Proud 2002; Hannan et al. 2003). Rapamycin inhibits mTOR and has been a useful
reagent in teasing out the functions of mTOR’s multiple signalling cascades.
Upstream of mTOR, signalling initiates with activation of the Gq/11-Ras pathway.
This further activates Raf and PI3K which through diverse signalling pathways can
activate mTOR during hypertrophy. Raf lies upstream of the MEK/ERK1/2 pathway and
interact downstream with hamartin and tuberin (McManus et al. 2002; Proud 2004).
Hamartin and tuberin are two known important regulators of mTOR and are also negative
regulators of cell size and the cell cycle. Hamartin and tuberin have been shown to
interact downstream from the PI3K/PKB pathway which also regulates their control of
mTOR activation (Proud 2004). Tuberin, while heterodimerized to hamartin, can be
phosphorylated by PKB and by the MEK/ERK1/2 pathway (McManus et al. 2002; Proud
2004). This phosphorylation allows for the progression of mTOR signalling. A further
downstream target of tuberin and hamartin, Rheb in its GTP bound form can associate
with this heterodimer and is believed to activate mTOR signalling and the stimulation of
protein synthesis needed for hypertrophy (Manning et al. 2003). mTOR’s downstream
targets include multiple proteins and transcription factors such as ribosomal proteins, S6
14
kinases, 4E-BP1/2 and eEF2, which act to elevate translational activity and increase
protein synthesis during hypertrophy (Proud 2004).
1.3.3 Rho kinase in Hypertrophic Signalling
Rho associated kinases, also known as rho-associated coiled-coil protein, or
ROCK1 and ROCK2, are collectively known as Rho kinase. ROCK1 and ROCK2 are
isoforms which are both found in the mammalian system and were established to be the
first downstream targets of RhoA (Matsui et al. 1996). ROCK1 and ROCK2 are both
ubiquitously expressed in tissues but ROCK1 mRNA is preferentially expressed in the
lung, liver, spleen, kidney and testis, while ROCK2 mRNA is highly expressed in the
heart and brain (Nakagawa et al. 1996; Wei et al. 2001). Rho kinase, while being part of
the regulation system for cell growth, migration, and apoptosis by use of the actin
cytoskeleton assembly, is also involved in the regulation of cell contraction through its
kinase capabilities (Noma et al. 2006). ROCK1 and ROCK2, although recently shown to
demonstrate different functions in the cell especially with regards to the onset and
progression of cardiac hypertrophy, share an overall 65% amino acid sequence homology
and in particular a 92% homology in their kinase domains (Nakagawa et al. 1996). Rho
kinase’s structure is composed of an amino-terminal kinase domain, a mid-coiled-coil
forming lesion containing a Rho-binding domain (RBD) and a carboxy-terminal cysteine-
rich domain (CRD) in a pleckstrin homology (PH) motif which are all folded when found
in its inactive state. Upon RhoA-RBD binding, Rho kinase unfolds and releases from the
PH-RBD carboxy terminal region, exposing it’s catalytic domain (Noma et al. 2006).
This open conformation can also be activated through the cleavage of the carboxy
15
terminus initiated by caspase 3 (Coleman et al. 2001). Furthermore, this demonstrates the
initiation of Rho kinase involvement in apoptosis.
Rho kinase has several roles within the cell through its phosphorylation of
multiple downstream targets which create diverse effects. ROCK phosphorylates its
downstream targets using the either R/KXS/T or R/KXXS/T as the target phosphorylation
sites (Kawano et al. 1999; Sumi et al. 2001). Rho kinase uses serine-threonine
phosphorylation of downstream targets including: adducin, ezrin-radixin-moesin (ERM)
proteins, LIM kinase, myosin light chain phosphatase (MLCP) and Na/H exchanger 1 to
regulate this cellular contraction via enhancement of actin-myosin association (Denker et
al. 2000; Riento et al. 2003). This enhancement comes from the downstream effects of
increased myosin light chain phosphorylation and the prevention of actin
depolymerisation (Maekawa et al. 1999). ROCK phosphorylates the MBS domain on
MLCP which attenuates its activity and has even been demonstrated to completely
dissociate MLCP from myosin. This also leads to the phosphorylation of myosin light
chain which in turn leads to the contraction of vascular smooth muscle cells (Somlyo et
al. 2000).
The ERM family of proteins are responsible for the crosslinking of actin filaments
to membrane proteins which helps create the structure of the cell. With the
phosphorylation of the ERM proteins by Rho kinase, this crosslinking is disrupted which
in turn causes the reorganization of the cytoskeleton observed during cardiac diseases
such as hypertrophy where ROCK activity and expression is increased (Matsui et al.
1998). A further downstream effect of ROCK activation is the inhibition of cofilin
mediated actin filament disassembly. This is started by ROCK1 phosphorylating LIM

16
kinase 1 which can then phosphorylate cofilin, inhibiting its function (Maekawa et al.
1999; Ohashi et al. 2000; Sumi et al. 2001). The contractile response can also be
increased via ROCK’s phosphorylation of adducin. Adducin is a membrane skeletal
protein located at cell-cell contact sites which promotes the association of spectrin to F-
actin. It caps the fast growing ends of actin filaments while recruiting spectrin. Upon
adducin’s phosphorylation by ROCK, its binding activity to F-actin increases thereby
augmenting the contractile response (Kimura et al. 1998; Fukata et al. 1999; Noma et al.
2006).
In addition to having downstream targets that affect the cytoskeleton, ROCK can
also regulate other cellular activities. In particular, ROCK can inhibit insulin signalling
through phosphorylation of insulin receptor substrate-1 (Farah et al. 1998) as well as
regulate cell size through phosphorylation of IGF-induced cAMP response element
binding protein (CREB) (Sordella et al. 2002). Phosphorylation of CREB demonstrates
another possible role of ROCK in cardiac hypertrophy and how its inhibition could lead
to the prevention of the hypertrophic process. Studies have shown however that ROCK1,
independent of ROCK2, is involved in the fibrosis component of cardiac hypertrophy as
well as the transition from cardiac hypertrophy to dilation and dysfunction (Shi et al.
2010).
1.3.4 Apoptotic Signalling in Hypertrophic Cardiomyopathy
During cardiac hypertrophy 15-20% of cardiomyocytes undergo apoptosis (Singh et
al. 2010). This cell death is what is believed, at least in part, to cause the transition from
cardiac hypertrophy to further remodeling and cardiac dilation which clinically can lead

17
to sudden death in patients (Shi et al. 2010). Apoptosis can be triggered intrinsically or
extrinsically depending on the stimuli. Intrinsic stimuli include such events as irreparable
cell or DNA damage while extrinsic stimuli include such events as a death ligand binding
to death receptors. Examples of this death receptor binding include the Fas ligand binding
to the Fas receptor or the tumor necrosis factor α (TNF-α) binding to the TNF-α receptor,
both of which activate downstream pro-apoptotic signalling cascades (Kang et al. 2003).
The apoptotic pathways are hallmarked by the proteolytic family of proteins known as the
caspases. Depending on the activation of either the intrinsic or extrinsic apoptotic
signalling pathway, various combinations of these caspases are activated in a signalling
cascade that eventually activates caspase 3. Caspase 3 is activated during the effector
phase of apoptosis and therefore is termed a terminal effector caspase. It cleaves the
DEXD consensus site on target proteins and can be activated by multiple upstream
proteins such as initiator caspase 8 and caspase 9 which is part of the apoptosome (Kirsch
et al. 1999). Caspase 3 also takes part in a positive feedback activation loop with Rho
kinase. The zymogen form of caspase 3, procaspase 3, is cleaved and activated by these
upstream caspases which can then cleave and activate ROCK, unfolding it into its active
form. Active ROCK is then capable of activating further caspase 3 proteases which
continues this positive feedback loop of activation during apoptosis (Chang et al. 2006).
During the late stages of the apoptotic process, membrane blebbing initiates. This process
occurs in order to compartmentalize the intracellular cytosol and degraded proteins which
later are endocytosed by macrophages. Without this compartmentalization, the membrane
would be disrupted releasing the intracellular cytokines and creating an inflammatory
response (Rock et al. 2008). Active Rho kinase participates in this membrane blebbing
18
process. It does so by its kinase capabilities, phosphorylating downstream targets
involved in reorganization of the actin cytoskeleton and cell contraction as previously
discussed.
1.4 Rho kinase inhibitors
1.4.1 Possible uses in treatment of cardiac disease
ROCK has an important role in mediating several diseases, many of which belong to
the realm of cardiovascular disease. Importantly, ROCK has a prominent role in the
etiology and progression of cardiovascular diseases such as cardiac hypertrophy (Higashi
et al. 2003) and hypertension (Abe et al. 2004). As such, its inhibition is thought to be a
possible target in the prevention and treatment of these cardiovascular diseases as well as
coronary and cerebral vasospasm (Shimokawa et al. 1999; Sato et al. 2000), pulmonary
hypertension (Abe et al. 2004), atherosclerosis (Satoh et al. 2001; Matsumoto et al. 2004),
ischemia-reperfusion injury (Yada et al. 2005), stroke (Satoh et al. 2001), heart failure
(Hisaoka et al. 2001), cardiac allograft vasculopathy (Hattori et al. 2004) and vein graft
disease (Kozai et al. 2005).
1.4.2 Fasudil, Hydroxyfasudil, & Y27632
Fasudil, also known as HA-1077, was the first clinically approved ROCK inhibitor,
mechanistically working by competing with ATP for binding to the active kinase (Asano
et al. 1989; Davies et al. 2000). Fasudil and hydroxyfasudil enter the cell based on their
hydrophobic properties which make them cell-permeable (Takemoto et al. 2002).
Although initially used for treatment of cerebral vasospasm, it has potent vasodilatory
activity currently being investigated in clinical trials for treating ischemic heart disease

19
(Ono-Saito et al. 1999; Shimokawa et al. 2002; Hirooka et al. 2005). Upon oral
administration, fasudil is metabolized to its more potent inhibitor hydroxyfasudil, also
known as HA-1100, which has a more selective inhibitory effect on ROCK than fasudil
itself (Shimokawa et al. 1999; Higashi et al. 2003). H-1152P is another analog of fasudil
that differs based on its dimethylation and is the most potent of the three analogs (see
Figure 2). However, H-1152P has not been used in the treatment of cardiovascular
disease (Sasaki et al. 2002). Y27632 is a pyridine derivative that has been developed as a
potent ROCK inhibitor (Uehata et al. 1997). It inhibits ROCK1 and ROCK2 non-
specifically in similar fashion to fasudil by competing with ATP for binding to the active
catalytic sites of ROCK (Dong et al. 2010).
1.5 Biological Radiotracers
1.5.1 Positron Emission Tomography versus Single Photon Emission Computed
Tomography
With respect to the heart and cardiovascular biology, molecular imaging has provided
a significant understanding of real time cellular and physiological events in vivo. In vivo
imaging instrumentation encompasses a wide variety of technologies. Some of these
include the positron emission tomography (PET), single photon emission computed
tomography (SPECT), bioluminescence imaging (BLI) and magnetic resonance imaging
(MRI) (Levin 2005; Meikle et al. 2006). Both PET and SPECT have their advantages and
disadvantages for imaging biological processes and can often only be compared
specifically case by case on which one would be the optimal choice. The most significant

20
AB
C D E
Figure 2: The chemical structures of Rho kinase inhibitors A) Y-27632, B) H-1152P,
C) HA-1007, (Fasudil), D) Hydroxyfasudil, E) N-[11
C]-methyl-hydroxyfasudil. Adapted
from Breitenlechner et al., 2003, and Valdivia et al., 2009, with publisher’s permission.
21
advantage of using PET over SPECT is the higher sensitivity with PET to the degree of
two to three orders of magnitude, but at the same time, PET is often hindered by the
isotopes’ generally short half-lives compared to those used for SPECT (Rahmim et al.
2008). This short half life can be advantageous and disadvantageous as mentioned
previously. The benefit of this short decay time translates into the capability of injecting
much larger amounts of activity into the patient without creating any additional radiation
burden. This results from the total amount of exposure over time equaling the same total
exposure as a lesser amount of radiation injected that has a longer half life. This allows
for increased detection sensitivity for a short time period (Rahmim et al. 2008). Because
of the short half-lives and biologically similar isotopes, PET allows for the determination
of kinetic properties of certain pathways or biological events specific to the target of the
tracer (Meikle et al. 2006). There are many other factors based on the physics of PET
imaging that lead to either its choice or the choice of SPECT for each specific case but
these will not be discussed here [for further details see (Rahmim et al. 2008)].
1.5.2 Conceptualizing PET
PET imaging is based on the concept that a molecule of interest is attached to a
positron emitting radionucleotide, a molecule with the same mass as an electron but with
an opposite charge (Levin 2005), to track its biodistribution. Some of the PET isotopes
used in tracer synthesis include 18
F, 15
O, 13
N and 11
C. Positrons from a proton rich nuclei
are ejected from the radio-nucleus and go on to encounter and interact with electrons and
nuclei of nearby atoms scattering their own pathway. This process slows the positron
down through the loss of energy. If it then collides and merges with an electron they will
annihilate and their mass will convert into electromagnetic energy (high-energy photons).

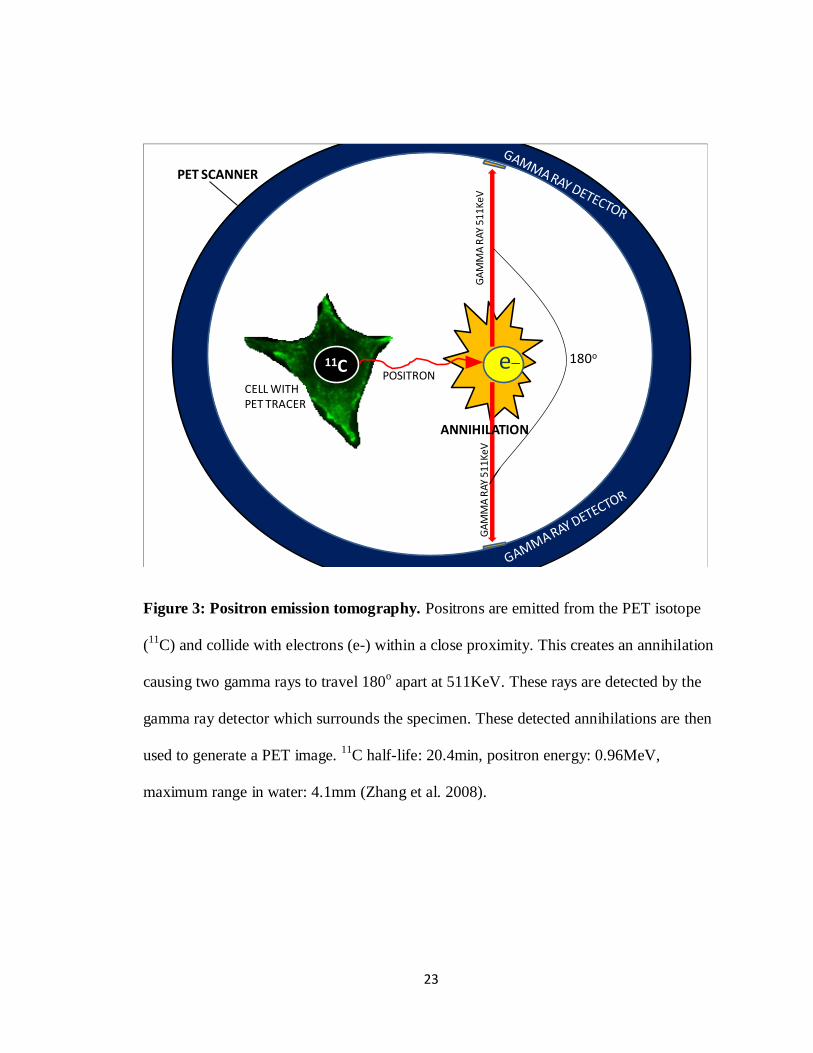
22
These photons will be emitted in opposite 180o directions each with energy of 511keV
which can be detected by the PET scanner and used to compose an image (Levin 2005)
(see Figure 3).
1.5.3 N-[11
C]-methyl-hydroxyfasudil
The concept of being able to biologically track Rho kinase activity and
upregulation during cardiovascular disease led to the synthesis of a PET radiotracer
derived from the potent Rho kinase inhibitor hydroxfasudil. Using a two-step one-pot
radiosynthesis, N-[11
C]-methyl-hydroxyfasudil was synthesized at the University of
Ottawa Heart Institute as a potential PET tracer for Rho kinase (Valdivia et al. 2010).
Previous studies performed structure-activity relationship experiments with
fasudil derivatives. Through these experiments it was found that the secondary amine in
the homopiperazine ring is important for its activity in both fasudil and hydroxyfasudil
(Tamura et al. 2005). Using the crystal structure of ROCK1 bound to fasudil it was
determined that the isoquinoline moiety binds to ROCK1 via two hydrogen bonds. The
first bond occurs via the nitrogen at the isoquinoline ring accepting a hydrogen bond from
the amide nitrogen of the Met156 residue of ROCK1. The second bond occurs via
fasudil’s C-1 donating a weak hydrogen bond to the carbonyl oxygen of the Glu154
residue of ROCK1. Hydroxyfasudil binds to ROCK1 in a reverse orientation to that of
fasudil. This occurs by the carbonyl oxygen of the isoquinolinone of the inhibitor
accepting a hydrogen bond from the Met156 amide nitrogen and the protonated nitrogen
hydrogen binding to Glu154 of ROCK1 (Jacobs et al. 2006; Liao 2007). The inactive
conformation of Rho kinase is a folded monomer with the N-terminal catalytic domain
23
11C e_ 180o
CELL WITH PET TRACER
POSITRON
ANNIHILATION
GA
MM
A R
AY
51
1K
eV
GA
MM
A R
AY 5
11Ke
V
PET SCANNER
Figure 3: Positron emission tomography. Positrons are emitted from the PET isotope
(11
C) and collide with electrons (e-) within a close proximity. This creates an annihilation
causing two gamma rays to travel 180o apart at 511KeV. These rays are detected by the
gamma ray detector which surrounds the specimen. These detected annihilations are then
used to generate a PET image. 11
C half-life: 20.4min, positron energy: 0.96MeV,
maximum range in water: 4.1mm (Zhang et al. 2008).

24
bound to the C-terminal PH domain. Upon phosphorylation, Rho kinase unfolds to reveal
an active and accessible catalytic domain allowing fasudil to bind.
In order to synthesize this tracer there was first the methylation of the precursor N-
Boc-hydroxyfasudil-sodium salt/benzo-15-crown-5 complex with [11
C]methyl iodide,
which was then followed by the deprotection of the tert-butocarbonyl protecting group. It
is believed that the methyl group incorporated at the nitrogen of the isoquinolinone ring in
hydroxyfasudil did not alter its binding to ROCK which occurs at two hydrogen bonds.
The first hydrogen bond to ROCK is at the amine in the homopiperazine ring and the
second is at the carbonyl oxygen of the isoquinolinone (Valdivia et al. 2010).
1.6 Research Plan
1.6.1 Rationale
Cardiac hypertrophy increases in severity as the heart becomes less functional
during the progression of the disease. This begins with events such as thickening of the
ventricle walls to maintain cardiac output to contractile dysfunction and decreased
ejection fraction to cardiac dilation and eventually sudden death. Increased activity and
upregulation of certain molecular signalling pathways are a hallmark of this disease and,
therefore, select targeting of pathway components could possibly be used to track either
the disease progression or regression upon treatment or intervention. Since Rho kinase is
activated during cardiac hypertrophy, it presents a possible target for detecting and
following hypertrophy. PET radiotracers are currently in use for tracking numerous
cardiac processes and dysfunctions such as blood flow, atherosclerosis, cardiac infarcts,
25
etc., and allow for the possible tracking of cardiac hypertrophy using the recently
synthesized ROCK radiotracer, N-[11
C]-methyl-hydroxyfasudil. This radiotracer will be
examined in an in vitro experimental model as a marker of cardiac hypertrophy.
In the present study we wish to examine ROCK’s activity and regulation in
hypertrophic neonatal rat primary cardiomyocytes in vitro. From this data we will then
determine an optimal time point after the onset of hypertrophy for our PET tracer uptake
and binding, in order to compare ROCK activity in hypertrophic and non-hypertrophic
control cells.
1.6.2 Hypotheses
For this project we had two main hypotheses:
1. Rho kinase activity will increase in hypertrophied cardiomyocytes induced by
isoproterenol compared to control non-treated cells.
2. N-[11
C]-methyl-hydroxyfasudil binding to Rho kinase in hypertrophied cells
will increase in association with increased Rho kinase activity.
1.6.3 Objectives
The hypotheses will be investigated according to the following objectives:
1. To determine the effect of isoproterenol in inducing cellular hypertrophy in
cultured primary cardiomyocytes.

26
2. To determine the effect of cardiac hypertrophy induced by isoproterenol
administration in cultured primary cardiomyocytes on ROCK1/2 activity.
3. To determine the correlation between ROCK1/2 activity and N-[11
C]-methyl-
hydroxyfasudil binding during isoproterenol induced cardiac hypertrophy.

27
MATERIALS & METHODS

28
2.1 Cell Culture
Rat left ventricular cardiomyocytes (H9C2 cells) and primary cardiomyocytes
isolated from neonatal rat pups were used for in vitro experiments. Both cell types were
kept incubated at 37oC with 5% CO2.
2.1.1 H9C2 cell culture
H9C2 cells (CRL-1446 from ATCC) were used between passages 2-18. H9C2
cells were cultured in DMEM with 10% fetal bovine serum (FBS) and 1%
penicillin/streptomycin (Pen Strep). These culturing conditions were similar to those used
by Cselenyak et al. (Cselenyak et al. 2010). To passage the H9C2 cells, media was
aspirated; cells were washed with PBS, and lifted using Trypsin. The trypsinization
process was halted by the addition of culture media and cells were divided and re-plated
as needed.
2.1.2 Primary cardiomyocyte isolation and culture
Primary cardiomyocytes were isolated from neonatal rat pups 2-3 days old. This
procedure was adapted from Joseph Wu’s lab at Standford University (van der Bogt et al.
2008). Rat pups were sterilized with ethanol then decapitated and the chest was opened
using surgical scissors and forceps. The hearts were cut out and placed in ice cold calcium
and bicarbonate free Hank’s with HEPES (CBFHH) buffer (136.9mM NaCl, 5.36mM
KCl, 0.81mM MgSO4·7H2O, 5.55mM glucose, 0.44mM KH2PO4, 0.31mM
Na2HPO4·7H2O, 20mM HEPES, pH 7.4). One litter’s hearts were kept in approximately
15mL of buffer in a 50mL conical tube. After the entire litter’s worth of hearts were
removed, the hearts were washed in 15mL of buffer then poured into a 10cm culture dish.
29
Buffer was aspirated off and hearts were minced using fine surgical scissors into a paste-
like consistency. The minced hearts were then transferred back into a 50mL conical tube.
Nine milliletres of buffer was added along with 1mL of 10x-collagenase, to create a 1x-
collagenase working solution. The minced hearts were then allowed to digest for 10min at
37oC with gentle swirling every minute to ensure proper mixing. After 10min the solution
was triturated using a 10mL pipette for 2min and allowed to settle. The remaining layer of
buffer on top was aspirated off and a second digestion was started using the same
quantities of collagenase for 10min under similar conditions and mixing times. After the
second digestion, trituration, and settling of the partially digested hearts, the supernatant
was collected and stored at 37oC in 3mL of pure FBS. A third digestion was performed in
a similar fashion as the second digestion. The supernatant from the third digestion was
collected and added to the second digestion supernatant. This supernatant containing the
primary cardiomyocytes/FBS was centrifuged in order to pellet the cells. The supernatant
was then aspirated off and the pellet was dissolved in Day 1 media (DMEM, 10% horse
serum (HS), 5% FBS, 1% Pen Strep) and filtered through a 74μM mesh filter (Corning
Plate Netwell, Fisher Scientific) to remove any undigested pieces of heart tissue. The
filtered media/cardiomyocytes were then plated onto a plastic culture dish and incubated
for 1 hour. This step allowed fibroblasts to adhere to the culture plate and excluded
cardiomyocytes thereby enriching the cardiomyocyte population. After an hour the media
was lifted off and collected. The plate was given a gentle wash wish media, and the wash
was added to the media collection. This was then plated on plastic cell culture dishes
coated with FBS to help the cardiomyocytes adhere and was not disturbed for 24 hours of
incubation under cell culture conditions. After 24 hours the media was changed to Day 2+
media (DMEM, 5% FBS, 1% Pen Strep) and cells could then be used as desired (see

30
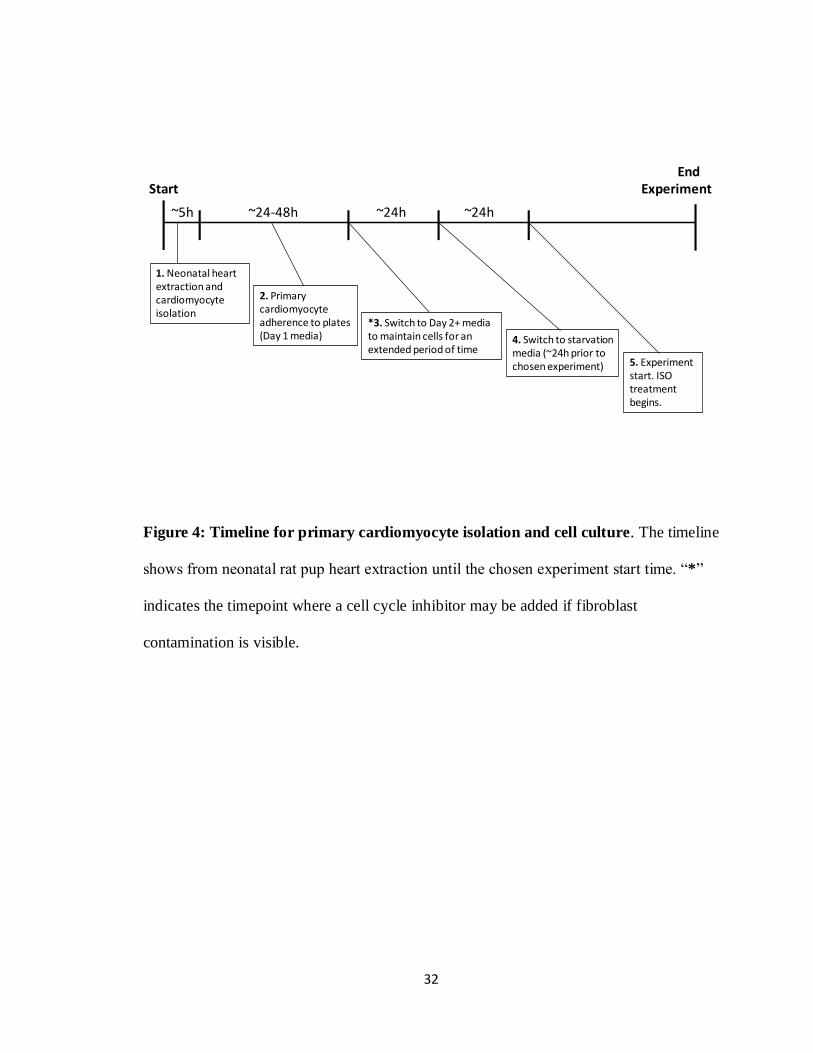
Figure 4 for a summary timeline of this procedure). One litter (approximately 15 rat pup
hearts) yields approximately 1.5-2.0x10⁷ cells.
2.2 Isoproterenol Treatment
(-)-Isoproterenol hydrochloride (Sigma) dissolved in 0.01M ascorbic acid as a
vehicle at a concentration of 2.5mg/mL. Cells were starved in low serum media (DMEM
with 0.5% FBS and 1% Pen Strep) for 24hours prior to ISO treatment. ISO was then
added in cell culture media at a concentration of 10μM and allowed to incubate with the
cells for up to 72hours. Controls were used that contained the media plus the vehicle
(ascorbic acid) or just media alone. Treatment methods were adapted from Morisco et al.
and Ramos et al. who had previously determined optimal concentrations of ISO treatment
to induce the desired hypertrophic effects (Ramos et al. 1983; Ramos et al. 1983; Morisco
et al. 2001).
2.3 Generation of cell lysates
The cell culture media was collected in a 50mL conical tube. The cells were then
washed with 5mL of phosphate-buffered saline (PBS) which was added to the collected
media. Five millilitres of PBS was then added to the plate and cells were scraped off and
added to the conical tube. The plate was then washed once more with 5mL of PBS and
the wash was added to the conical tube as well. This was all performed on ice. The
collected cells were centrifuged, lysed with modified radio-immunoprecipitation buffer
(RIPA) [0.05M Tris, 0.15M NaCl, 0.0087M sodium dodecyl sulphate (SDS), 1% NP-40,
0.001M EDTA, protease inhibitors, phosphatase inhibitors, pH 8.0], and allowed to
incubate at 4oC with gentle agitation for 45 minutes. Lysates were then spun at 14 000rpm

31
for 10min to pellet out cellular debris. The supernatent was stored as frozen aliquots at -
80oC.
2.4 Western Blotting
Forty to eighty micrograms of protein lysate were run on SDS polyacrylamide
gels ranging in concentration of 8-12% acrylamide for the separation. Large gels
(approximately 15x15cm) were run overnight at 60V at room temperature while smaller
gels (approximately 6x8cm) were run at 100V for the necessary time in running buffer
(0.025M Tris base, 0.192M glycine, 0.0035M SDS, pH 8.3). All gels were transferred to
polyvinylidene fluoride (PVDF) membranes using the Owl HEP-1 semi-dry transfer
system (Thermo-scientific) for the necessary time depending on the size of the gel using
semi-dry transfer buffer (0.048M Tris base, 0.039M glycine, 20% methanol, optional
0.694mM SDS for transferring large proteins). Membranes were blocked either at 4oC
overnight or at room temperature for 2 hours using 5% skim milk in Tris-buffered saline
with Tween (TBST). Blots were then probed for using specific antibodies against:
phospho-ERK1/2 (Millipore, Cat. # 04-797) used at 1/1000 dilution, total ERK1/2 (Cell
Signalling Technology, Cat. # 9102) used at 1/4000 dilution, phospho-mTOR (Abcam,
ab51044) used at 1/1000 dilution, total mTOR (Abcam, ab2732) used at 1/1000 dilution,
ROCK1 (Abcam, ab45171) used at 1/500 dilution, and β-actin (Abcam, ab8227) used at
1/1000 dilution. Secondary antibodies were used at 1:75 000 dilution specific for the
primary antibody and blots were developed using the enhanced chemiluminescence
(ECL) detection method (SuperSignal West Femto Maximum Sensitivity Substrate from
Thermo Scientific). These protocols were adapted from those given by the manufacturers.
32
End Start Experiment
~5h ~24-48h ~24h ~24h
1. Neonatal heart extraction and cardiomyocyte isolation
2. Primary cardiomyocyte adherence to plates (Day 1 media)
*3. Switch to Day 2+ media to maintain cells for an extended period of time
4. Switch to starvation media (~24h prior to chosen experiment) 5. Experiment
start. ISO treatment begins.
Figure 4: Timeline for primary cardiomyocyte isolation and cell culture. The timeline
shows from neonatal rat pup heart extraction until the chosen experiment start time. “*”
indicates the timepoint where a cell cycle inhibitor may be added if fibroblast
contamination is visible.
33
2.5 ROCK Activity Assay
ROCK activity was measured using a colourimetric assay (96-well ROCK activity
assay kit from Cell Biolabs Inc.) similarly done by Gonzalez-Ferero et al. (Gonzalez-
Forero et al. 2012) . The ROCK activity assay was performed following the
manufacturer’s protocol. Briefly, equal concentrations of protein lysates collected from
ISO treated and control cells were added to the wells of the activity assay’s 96-well
MYPT1 coated plate. Along with the protein lysates, 10x kinase reaction buffer was
added containing ATP (2mM) and DTT (10mM) to initiate the reaction. These contents
were allowed to incubate for 45min at 30oC with gentle shaking. Zero point five molar
EDTA was added to cancel the reaction after 45min and the wells were washed 3 times
with the provided wash buffer. Primary antibody anti-phospho-MYPT1 (Thr696
) was then
added to the wells and allowed to bind for one hour at room temperature with gentle
shaking. After 1 hour, the primary antibody was removed and the wells were washed 3
times with wash buffer. HRP-conjugated secondary antibody was then added to each well
and allowed to incubate for 1 hour at room temperature with gentle shaking. After 1 hour
the wells were once again washed 3 times with wash buffer and the substrate solution
provided was added to each well. Substrate solution was allowed to incubate for 15
minutes at room temperature with gentle shaking in the dark. After 15min, the provided
stop solution was added to cancel the enzyme reaction and absorbance readings were
immediately read at 450nm. A standard curve was created depicting absorbance at 450nm
versus ROCK2 concentration, using the provided concentrated ROCK2, to ensure the
unknown absorbances were within an accurate linear range of the kit.

34
2.6 Hematoxylin and Eosin Staining
Cells were fixed using 4% paraformaldehyde for 10min at 37oC then rinsed 3
times with PBS. Fixed cells were stained with Hematoxylin (Sigma-Aldrich) for 2min
then rinsed with tap water. Fixed cells were then rinsed twice in acid alcohol (0.25% HCl
in alcohol) and once more with tap water. Staining was allowed to “blue” in tap water for
45 seconds and then was rinsed with 95% EtOH for 30 seconds. The fixed cells were then
couterstained with Eosin Y (Sigma-Aldrich) for 60 seconds and rinsed with tap water.
Stained cells were then set to dehydrate. This protocol was adapted from those given by
the manufacturer.
2.7 Immunocytochemistry
Cells were fixed with 4% paraformaldehyde for 10min at 37oC then rinsed three
times with PBS. Cells were then stained with DAPI nuclear stain (Sigma), alpha-
sarcomeric actin (Abcam, ab49672) or both. Alpha-sarcomeric actin was used at 1/750
diluted in PBS for one hour at room temperature. Cells were washed 3 times with PBS
then Alexa Fluor 488 goat anti-mouse IgG (H+L) secondary antibody (Invitrogen) was
added at 1/250 dilution in PBS and incubated at room temperature for one hour. DAPI
was diluted to 1mg/mL in water and used at 1/1000 dilution in water for a 5 minutes
incubation. The cells were then washed 3 times with PBS to remove excess stain and
mounted on slides for fluorescent microscopy. These protocols were adapted from those
given by the manufacturers.
35
2.8 Cell Viability Experiments
In order to determine cell viability and to verify optimal ISO concentrations for future
experiments two assays were performed: a trypan blue exclusion assay and a MTT assay.
These protocols were adapted from those given by the manufacturers.
2.8.1 Trypan Blue Exclusion Assay
Trypan blue exclusion assay was performed to examine cell death. Trypan blue
was added to ISO (0-50μM concentrations over 24-72h) treated cells (50:50 proportions
trypan blue:cell sample). Ten microlitres of this sample was loaded into a Countess
counting chamber slide (Invitrogen) and percent viability was determined using the
Countess automated cell counter (Invitrogen).
2.8.2 MTT Assay
MTT assay was performed to examine cell viability. A colourmetric MTT assay
was performed according to manufacturer’s protocol on ISO treated cells (MTT Cell
Proliferation Assay from ATCC bioproducts). Briefly, 100 000 cells were plated per well
in a 96 well plate and cells were treated with either 10μM ISO or vehicle only for 24-72h.
At each timepoint, MTT reagent was added to the wells and incubated for 2-4 hours at
37oC until a purple precipitate was visible. Detergent was then added and allowed to
incubate for 2 hours in the dark to lyse the cells. Absorbance was then read at 570nm.

36
2.9 N-[11
C]-methyl-hydroxyfasudil Tracer Experiments
2.9.1 Standardization of the Gamma Counter
[11
C]-acetate was used to standardize the gamma counter at 511KeV. Multiple
dilutions ranging from 1nCi to 50μCi where measured and a standard curve was created
depicting counts per minute (CPM) versus microcurries of radioactivity. The linear
portion of the curve was used to create a trend line in order to create an equation to
calculate microcurries from CPMs for our work with N-[11
C]-methyl-hydroxyfasudil.
2.9.2 N-[11
C]-methyl-hydroxyfasudil synthesis and analysis
The radiotracer was synthesized as described by Valdivia in 2010 (Valdivia et al.
2010). High performance liquid chromatography (HPLC) was performed to purify the
tracer. During the semi-preparation the radiation peak for N-[11
C]-methyl-hydroxyfasudil
corresponding to the UV peak at the correct elution time for the cold compound was
collected in a rotovap. After solvent evaporation and reformulation a sample was
analyzed for quality control testing of the product and for determining specific activity
using analytical HPLC. From the analytical HPLC, the mass of the unlabelled standard
product co-eluted with the labelled product were used to determine specific activity
taking into account the standard used. These methods were adapted from Valdivia et al.
(Valdivia et al. 2011).
2.9.3 N-[11
C]-methyl-hydroxyfasudil binding and hydroxyfasudil blocking
Primary cardiomyocytes were isolated and cultured as described above. Cells
were plated at a density of 950 000 cells/well on a 6-well cell culture plate. Prior to the
37
experiment cells were starved for 24 hours in low serum media. Cell media was treated
with N-[11
C]-methyl-hydroxyfasudil (5μCi with specific activity varying per trial) for
30min at 37oC. After 30min of N-[
11C]-methyl-hydroxyfasudil treatment, 10μM ISO was
added to the media for 20min. After this 20min ISO treatment, the media was aspirated
off and cells were washed with PBS. Cells were then lifted and collected by trypsinization
and the wells were washed once more with PBS and added to the cells collected. The
collected cells were then counted in the gamma counter (Automatic Gamma Counter
Wizard2 by Perkin Elmer) standardized to 511KeV.
In order verify tracer specificity, blocking study was initiated using
hydroxyfasudil on primary cardiomyocytes. In these studies cardiomyocytes were treated
with hydroxyfasudil (Calbiochem) in culture medium (final concentration of 10μM) for
1h at 37˚C. Cells were then incubated with 5μCi N-[11
C]-methyl-hydroxyfasudil and
analyzed as described above. Decay calculations were then done to correct for time
passed since the experiment start time. Standards were also performed as per section
2.9.1. To calculate the molar amount of compound that bound, the following steps were
calculated:
1. Counts per minute (CPM) detected were compared to the standard to get the
microcurries of compound that had bound.
2. Using the microcurries detected from (1), the decay factor was used to calculate
the initial amount of radioactivity present.
3. After the decay factor was introduced, the specific activity was used to determine
the molar amount of compound bound.

38
2.10 Statistical Analysis
The data provided is the mean ± standard error unless otherwise stated. Statistical
analysis was performed using a two-way T-test assuming equal variance (Microsoft
Excel) or a two-way ANOVA assuming equal variance (GraphPad Prism version 5.0)
depending on the experiment (stated with the results). Data was considered to be
statistically significant if the probability value of P<0.05.
39
RESULTS

40
3.1 Cell viability after ISO treatment
ISO can induce cell toxicity at high concentrations through the production of
lactate dehydrogenase (LDH) and oxidation products (Ramos et al. 1983; Ramos et al.
1983). In order to determine any possible toxic effects of ISO induced by LDH in our
cell culture model, H9C2 cells were treated with multiple concentrations of ISO ranging
from 0-50μM. The vehicle for the delivery of the ISO was 0.01M ascorbic acid which has
been shown to reduce the toxic effects during prolonged ISO treatment (Ramos et al.
1983; Ramos et al. 1983; Morisco et al. 2001). ISO was allowed to incubate with the cells
for up to 72h following which, cell viability was measured using a trypan blue-based
assay (see Figure 5). Percent viability at 24, 48, and 72 hour time points remained similar
at all concentrations of ISO treatment (n=3). There were slight non-significant variations
between control and treated samples at each timepoint, but in general all concentrations
and time points showed over 90% viability. Between all the data there was a very small
degree of variance which would account for this lack of significant difference.
Concentrations of ISO of up to 50μM had no effect on viability for at least 48h whereas
more reasonable concentrations of 10 and 20μM had minimal impact on viability for up
to 72h. Although appearing to have had less viability, the 50μM ISO concentration at 72h
was not a significant decrease compared to control levels at that time. Regardless, 50μM
was a much higher concentration than we had planned on using for our future
experiments.
To coincide with the trypan blue exclusion assay, a MTT assay was performed to
ensure cell viability and not solely cell death which the trypan blue exclusion assay more
fairly represents. Using 10μM ISO did not affect cell viability at 24, 48 and 72h of
41
incubation when compared to non-treated cells. A significant drop in viability was not
seen between any of the conditions or timepoints tested in the MTT assay. Absorbance at
570nm was used as a relative viability level for this colourmetric assay with higher
absorbance representing higher cell viability (Figure 6, n=3). These results suggest that
ISO treatment on H9C2 cells did not adversely affect cell viability.
3.2 Morphological changes in cell size and nuclear size after ISO treatment
To evaluate the increase in nuclear size as a result of ISO induced cardiac
hypertrophy, H9C2 cell cultures were administered ISO at concentration of 10μM which
had been determined by Morisco et al. in 2001 to be the optimal concentration for
inducing hypertrophy in vitro (Morisco et al. 2001). These cells were allowed to incubate
with the ISO treated media for up to 72 hours. At multiple time points cells were fixed
and stained with the nuclear stain, DAPI. Nuclear size was then measured by digital pixel
counting on Adobe Photoshop version 6.0.1 to compare size throughout the time points.
Untreated (CNV) and vehicle treated (CV) (0.01M ascorbic acid) H9C2 cells were used
as controls. Nuclear size had significantly increased over control levels by 24 hours of
treatment (1.50 ±0.10 fold over control, p <0.001). This fold change was further elevated
to 1.61 ±0.04 by 48h (p <0.001) and 1.74 ±0.06 by 72h (p< 0.001) compared to controls
(Figure 7A,C). These results were analyzed using a two-way ANOVA assuming equal
variance (Figure 7D). Along with the increase in nuclear, an increase in the overall cell
size was observed as can be seen in Figure 7B (approximately 2-fold in ISO treated cells
compared to non-treated cells). Hematoxylin and Eosin staining was used in order to
visualize the cell size with red outlines added surrounding the cell membrane using

42
A
B
75
85
95
Pe
rce
nt
Via
bili
ty o
f Ce
lls
Timepoints-Concentrations of ISO Treatment (hours-μM concentration)
Concentration of ISO (μM)
0 2 5 10 20 50
ISO Treatment Times (hours) Viability [%(± SE)]
24 95.3(0.3) 94.3(0.3) 96.7(0.3) 96.7(0.3) 96(0.6) 97.7(0.7)
48 95.3(0.9) 95.3(0.9) 95.3(0.3) 96.3(0.7) 94.3(1.5) 98(0.6)
72 93.7(0.3) 93.3(0.3) 96(0.6) 95.7(0.3) 96.3(0.3) 92(0.6)
Figure 5: Cell viability trypan blue exclusion assay of multiple concentrations of ISO
treatment on H9C2 cells over multiple incubation times. 0.01M ascorbic acid was
used as the vehicle for ISO administration (A/B). (B) Graphical representation of data.
Time points are stated first on the x-axis followed by the concentration of ISO (μM) for
the corresponding treatment. No significant decrease in viability compared to controls.
Bars represent standard error (SE), n=3.
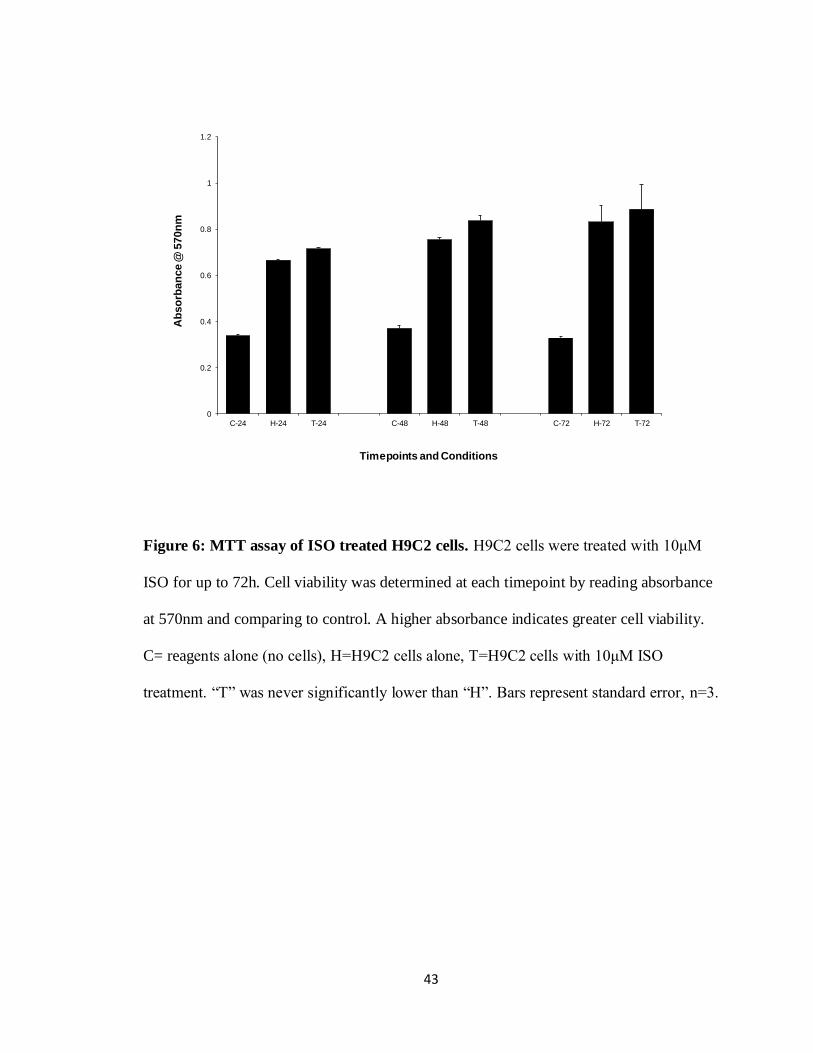
43
0
0.2
0.4
0.6
0.8
1
1.2
C-24 H-24 T-24 C-48 H-48 T-48 C-72 H-72 T-72
Ab
so
rban
ce @
570n
m
Timepoints and Conditions
Figure 6: MTT assay of ISO treated H9C2 cells. H9C2 cells were treated with 10μM
ISO for up to 72h. Cell viability was determined at each timepoint by reading absorbance
at 570nm and comparing to control. A higher absorbance indicates greater cell viability.
C= reagents alone (no cells), H=H9C2 cells alone, T=H9C2 cells with 10μM ISO
treatment. “T” was never significantly lower than “H”. Bars represent standard error, n=3.
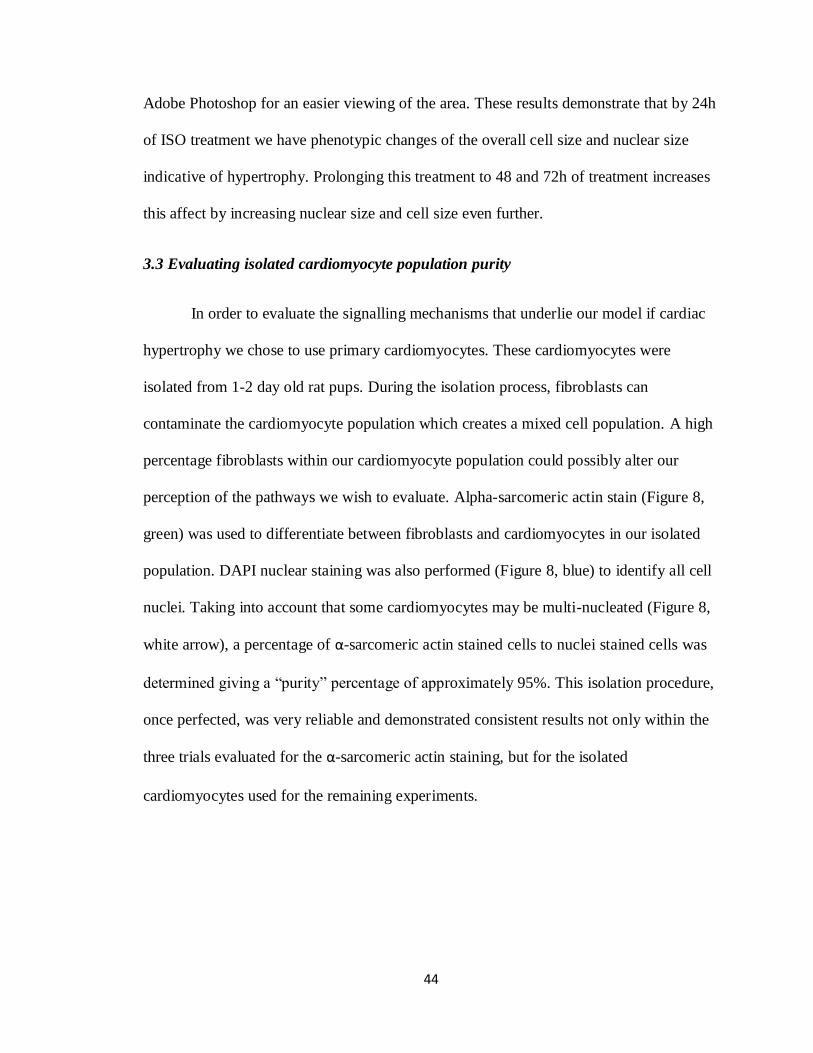
44
Adobe Photoshop for an easier viewing of the area. These results demonstrate that by 24h
of ISO treatment we have phenotypic changes of the overall cell size and nuclear size
indicative of hypertrophy. Prolonging this treatment to 48 and 72h of treatment increases
this affect by increasing nuclear size and cell size even further.
3.3 Evaluating isolated cardiomyocyte population purity
In order to evaluate the signalling mechanisms that underlie our model if cardiac
hypertrophy we chose to use primary cardiomyocytes. These cardiomyocytes were
isolated from 1-2 day old rat pups. During the isolation process, fibroblasts can
contaminate the cardiomyocyte population which creates a mixed cell population. A high
percentage fibroblasts within our cardiomyocyte population could possibly alter our
perception of the pathways we wish to evaluate. Alpha-sarcomeric actin stain (Figure 8,
green) was used to differentiate between fibroblasts and cardiomyocytes in our isolated
population. DAPI nuclear staining was also performed (Figure 8, blue) to identify all cell
nuclei. Taking into account that some cardiomyocytes may be multi-nucleated (Figure 8,
white arrow), a percentage of α-sarcomeric actin stained cells to nuclei stained cells was
determined giving a “purity” percentage of approximately 95%. This isolation procedure,
once perfected, was very reliable and demonstrated consistent results not only within the
three trials evaluated for the α-sarcomeric actin staining, but for the isolated
cardiomyocytes used for the remaining experiments.
45
Isoproternol Induced NucleiHypertrophy
cnv cv 24 48 720
2500
5000
7500
10000cnv
cv
24
48
72
Timepoints of IsoproterenolIncubation (hours)
Nu
cle
i A
rea (
pix
el
co
un
t)
Timepoint Comparison Significance (P Value)
cnv vs cv P > 0.05
cnv vs 24 P < 0.001
cnv vs 48 P < 0.001
cnvvs 72 P < 0.001
cv vs 24 P < 0.001
cvvs 48 P < 0.001
cv vs 72 P < 0.001
24 vs 48 P < 0.05
24 vs 72 P < 0.001
48 vs 72 P < 0.01
A
B
C D
CV CNV 24ISO 48ISO 72ISO
DAPI
*
Figure 7: Nuclear and cell size comparisons between ISO treated and non-treated
H9C2 cells. Cells were treated with 10μM ISO for up to 72h then and fixed at specific
time points. A) Cells were stained with DAPI to visualize nuclear size. n= approximately
280 nuclei/condition, white bars represent equal distances B) Cells were stained with
H&E to visualize overall cell size. Red outlines of the cell membranes were made in
Adobe Photoshop to help visualize cell size. Black bars represent equal distances, n=3 C)
Quantitative evaluation of nuclear size after ISO treatment compared to controls (from
panel A). Size was determined by pixel count on Adobe Photoshop. D) Statistical
summary of panel C. CV= control vehicle only (0.01M ascorbic acid), CNV= control no
vehicle treatment, 24, 48, 72-ISO = hours of incubation with ISO (10μM ISO in 0.01M
ascorbic acid) treatment before fixation. 24, 48, and 72h ISO all showed significant
increase over controls (*).

46
A
B
C
α-sarcomeric actin
DAPI
200x
200x
400x
Figure 8: Verification of cardiomyocytes cultured from neonatal rat pups. Isolated
primary cardiomyocytes were stained with a sarcomeric specific marker, α-sarcomeric actin
(green), and then counterstained with DAPI (blue) to visualize nuclei. α-sarcomeric actin +
DAPI stained cells were counted and divided by total DAPI stained nuclei (taking into
consideration cells with multiple nuclei) to create a ratio of cardiomyocytes within the cell
population. Panel A) and B) are taken at 200x magnification while panel C) is taken at 400x
magnification. A white arrow exemplifies a cell with multiple nuclei. A red arrow exemplifies
a non-cardiac cell. Images are representative of all data collected, n=3.

47
3.4 Evaluating signalling pathways of ISO induced cardiac hypertrophy in primary
cardiomyocytes
In order to verify cellular hypertrophy in our isolated primary cardiomyocytes at
the molecular level, increases in the phosphorylation of ERK1/2 and mTOR were
examined in control (vehicle treated) and ISO treated cells. These experiments were
based upon similar experimental setups as the nuclear size and H&E staining. Shorter ISO
treatment times were used since these molecular signalling events were expected to occur
far before phenotypic changes became detectable in the cell. Protein lysates were
collected after selected treatment times with 10μM ISO treated primary cardiomyocytes.
Forty micrograms of protein was run for each condition on an SDS polyacrylamide gel
and transferred to a membrane. Membranes were probed for phospho-ERK1/2 and
phospho-mTOR, and compared to levels of total ERK1/2 and total mTOR as controls.
These control measures were used because traditional cytoskeletal protein controls such
as β-actin and GAPDH may change under hypertrophic conditions from the rearranging
cell structures and increased protein synthesis (Morgan et al. 1987; Balasubramanian et
al. 2010). Phosphorylation of ERK1/2 was observed within the first 30 minutes of ISO
treatment and diminished by 60 minutes. There was not always exact timing of the
phosphorylation event with some trials showing slightly earlier increases in phospho-
ERK1/2 levels (10min) and some slightly later (30min) after ISO treatment. This made
statistical evaluation and graphical representation of the means difficult to accurately
show and therefore all three trials were plotted (Figure 9B) over the control baseline
condition. Note that ERK1/2 appears as a doublet when blotting at 42 and 44 KDa (Figure
9A). Phosphorylation levels of mTOR after ISO treatment showed a significant increase

48
of 29.4% ±9.8% (p <0.05) compared to non-treated cells (Figure 10B, n=4). Although
from Figure 10B the 10 minute timepoint visually appears to have a much larger fold
increase over control, the high degree of variance in the data suggests that it is not
significant. This phosphorylation diminished by 60 minutes similar to the ERK1/2
phosphorylation.
We next evaluated ROCK1 accumulation during prolonged ISO treatment of up to
72 hours similar to the experimental conditions used for the nuclei staining explained
earlier. ROCK1 levels did not show a significant increase throughout the 72h ISO
treatment but an increasing trend was seen towards the 72h timepoint (Figure 11B, n=4).
This data was standardized to β-actin as a more suitable control was unavailable. As
stated before, the cellular concentration of cytoskeletal proteins can vary during
hypertrophy and this may account for the lack of significance and high standard error
when ROCK1 accumulation was quantified.
3.5 ROCK1/2 activity during ISO induced cardiac hypertrophy in primary
cardiomyocytes
Using isolated primary cardiomyocytes we then went on to examine ROCK
activity under the ISO-induced hypertrophic conditions. We first examined ROCK
activity at the timepoints where morphological hypertrophic changes were seen; cell and
nuclear size increases. A colourimetric ROCK activity assay based on increasing
absorbance at 450nm from increased ROCK activity was used to evaluate activity in ISO
treated versus control cells. A standard curve showing absorbance at 450nm compared to
49
A
B
0
2
4
6
8
10
12
10 20 30 60
Ph
osp
ho
ryla
tio
n fo
ld in
crea
se o
ver c
on
tro
l
ISO incubation time (min)
Trial 1 Trial 2 Trial 3 control
p-ERK1/2
ERK1/2
Figure 9: Phosphorylated ERK1/2 levels during ISO treatment in primary
cardiomyocytes. Cells were treated with 10μM ISO for up to 60min. Protein lysates were
collected at each timepoint and examined through western blotting and densitometry. (A)
Western blot demonstrating phosphorylated ERK1/2 (p-ERK1/2) and total ERK1/2 at 0-
60min in control (C) and ISO treated (I) cells (B) p-ERK1/2 levels were compared to
control levels at selected timepoints and demonstrated as a fold ratio and standardized to
total ERK1/2 through densitometry. n=3
50
C-10 C-20 C-30 C-60 I-10 I-20 I-30 I-60
p-mTOR
mTOR
A
B
0
0.5
1
1.5
2
2.5
10min 20min 30min 60min
ph
osp
ho
ryla
ted
fold
incr
eas
e o
ver
con
tro
l
ISO incubation time (minutes)
*
Figure 10: Phosphorylated mTOR levels during ISO treatment on primary
cardiomyocytes. Cells were treated with 10μM ISO for up to 60min. Protein lysates were
collected at each timepoint and examined through western blotting. (A) Western blot
demonstrating phosphorylated mTOR (p-mTOR) and total mTOR at 0-60min in control
(C) and ISO treated (I) cells. (B) p-mTOR levels were analyzed between control and ISO
treated cells with levels being standardized to total mTOR levels at each timepoint
through densitometry. p-mTOR expressed as a fold increase over control levels. Error
bars represent standard error. “*” represents significant increase over control levels
(p<0.05), n=4.

51
C-24 C-48 C-72 I-24 I-48 I-72
ROCK1
A
B
0
0.5
1
1.5
2
2.5
3
24h 48h 72h
Exp
ress
ion
fold
incr
eas
e o
ver c
on
tro
l
ISO treatment times (hours)
β-actin
Figure 11: ROCK1 expression in cardiomyocytes after 24-72h of 10μM ISO
treatment. A) Western blot demonstrating ROCK1 and β-actin expression at the given
hour timepoints in ISO (I) compared to control non-treated (C) cells. B) Expression
values are shown as a fold increase over control non-treated cells where control equals 1
and standardized through densitometry to β-actin. No significant increase over controls
seen. n=4
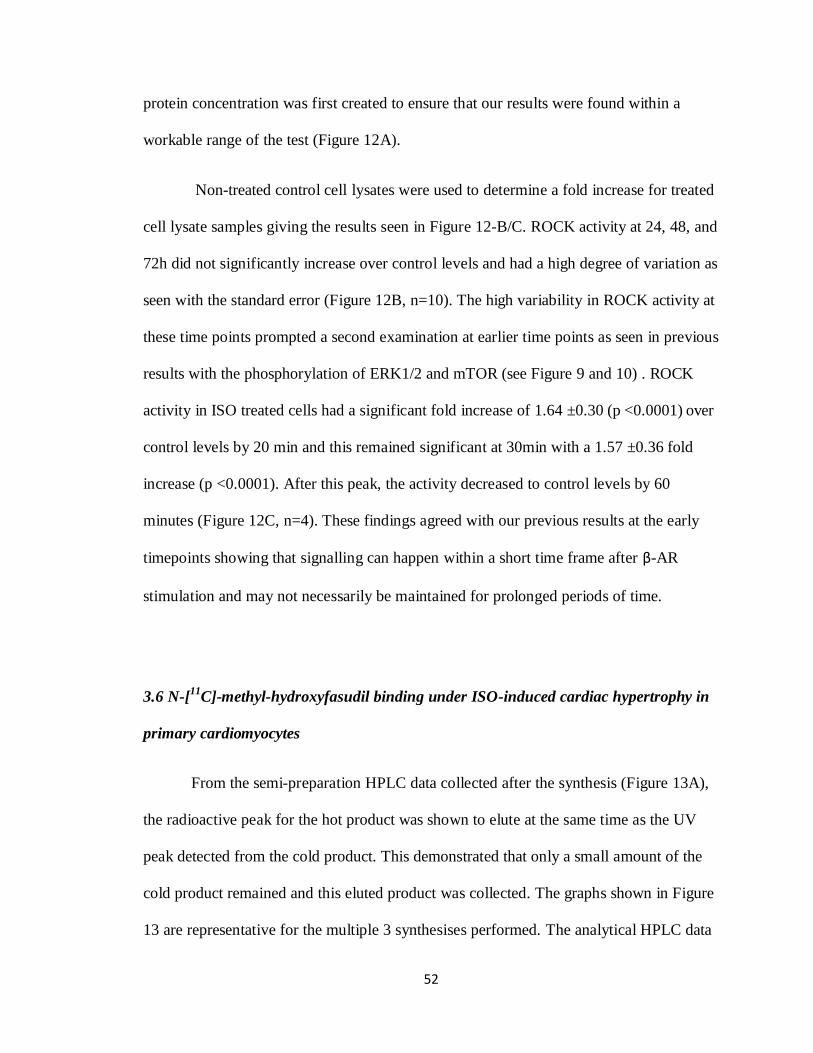
52
protein concentration was first created to ensure that our results were found within a
workable range of the test (Figure 12A).
Non-treated control cell lysates were used to determine a fold increase for treated
cell lysate samples giving the results seen in Figure 12-B/C. ROCK activity at 24, 48, and
72h did not significantly increase over control levels and had a high degree of variation as
seen with the standard error (Figure 12B, n=10). The high variability in ROCK activity at
these time points prompted a second examination at earlier time points as seen in previous
results with the phosphorylation of ERK1/2 and mTOR (see Figure 9 and 10) . ROCK
activity in ISO treated cells had a significant fold increase of 1.64 ±0.30 (p <0.0001) over
control levels by 20 min and this remained significant at 30min with a 1.57 ±0.36 fold
increase (p <0.0001). After this peak, the activity decreased to control levels by 60
minutes (Figure 12C, n=4). These findings agreed with our previous results at the early
timepoints showing that signalling can happen within a short time frame after β-AR
stimulation and may not necessarily be maintained for prolonged periods of time.
3.6 N-[11
C]-methyl-hydroxyfasudil binding under ISO-induced cardiac hypertrophy in
primary cardiomyocytes
From the semi-preparation HPLC data collected after the synthesis (Figure 13A),
the radioactive peak for the hot product was shown to elute at the same time as the UV
peak detected from the cold product. This demonstrated that only a small amount of the
cold product remained and this eluted product was collected. The graphs shown in Figure
13 are representative for the multiple 3 synthesises performed. The analytical HPLC data

53
0
0.002
0.004
0.006
0.008
0.01
0.012
0 0.5 1 1.5 2
RO
CK
co
nce
ntr
atio
n (μ
g/m
L)
Absorbance reading (@450nm)
0
0.5
1
1.5
2
2.5
24h 48h 72h
Act
ivit
y fo
ld d
iffe
ren
ce o
ver
con
tro
l
ISO incubation times (hours)
0
0.5
1
1.5
2
2.5
10min 20min 30min 60min
Act
ivit
y fo
ld in
cre
ase
ove
r co
ntr
ol
ISO incubation times (minutes)
**
A B
C
Figure 12: ROCK activity in primary cardiomyocytes after ISO treatment. (A)
Positive control (pure ROCK2) standard curve showing absorbance readings at 450nm for
multiple concentrations of ROCK to determine the linear range of accurate reading for the
activity assay. (B/C) ROCK activity after long and short term treatments with ISO on
primary cardiomyocytes. ROCK activity was quantified using cell lysates from
cardiomyocytes treated with 10μM ISO in 0.01M ascorbic acid for selected timepoints.
Equal protein concentrations were tested per condition. Readings are compared to control
levels standardized to 1 for differences between assay kits. “*” represent significant
increases over control levels (p<0.0001). Error bars represent standard error. (B) n=10
(C) n=4

54
(Figure 13B/C) which show the standard mass peak and the collected radioactive peak
were used to determine the specific activity and for quality assurance. Specific activity of
the N-[11
C]-methyl-hydroxyfasudil was determined to range from 330-880mCi/μmol
depending on the trial of synthesis.
In order to ensure that our N-[11
C]-methyl-hydroxyfasudil tracer could be
accurately counted using our available gamma counter, a standard curve was created for
multiple ranges of 11
C radioactivity using [11
C]-actetate. Concentrations of [11
C]-actetate
ranged from 1nCi to 50μCi. Staying within the accurate linear region of gamma counts
versus microcurries, it was concluded that we could accurately read counts ranging from
1nCi to ~6.5μCi (Figure 14A). This was suitable for our designed tracer experiment. This
allowed us to calculate microcurries of tracer binding from our counts per minute that the
gamma counter produced.
As determined from the ROCK activity assay results, primary cardiomyocytes
were treated with N-[11
C]-methyl-hydroxyfasudil for 30min and then subjected to 10μM
ISO treatment for 20min. Twenty minutes of ISO treatment was chosen based on the
previous ROCK activity assay which showed the largest increase in ROCK activity after
ISO treatment at that time (see Figure 12C). After 20 minutes of ISO treatment, gamma
counting demonstrated a significant 10.3% ± 2% (p <0.001) increase in tracer binding
compared to control cells which were not treated with ISO (Figure 14B, n=8). This
increase was brought back to control levels when cells were pretreated with 10μM
hydroxyfasudil to block active ROCK binding sites demonstrating the tracer binding
specificity for Rho kinase (Figure 14B, n=5).

55
A ratio of ISO treated cell counts over control cell counts was created for each
individual trial. Here ISO treated cell counts were represented as a fold increase over
control counts due to differences in the specific activity of the N-[11
C]-methyl-
hydroxyfasudil tracer between synthesises and the use of multiple isolated cell
populations. All concentrations of the tracer were used in the picomolar range to avoid
saturating the cells with excess tracer resulting in inaccurate gamma counts coming from
non-specific binding. These findings demonstrated that although the percent increase in
tracer binding did not match the percent increase in ROCK activity, a positive correlation
between ROCK activity and tracer binding was observed.

56
A
Standard mass peakRetention time ~4min
Radioactive peakRetention time ~4min
B C
Retention time (min) Retention time (min)
57
Figure 13: N-[11
C]-methyl-hydroxyfasudil preparation and analysis. (A) HPLC semi-
preparation data for the purification of N-[11
C]-methyl-hydroxyfasudil. Notice an overlap
of the radioactive peak for the radiolabelled compound corresponding to the UV peak at
254mm of the cold compound (B) Using analytical HPLC, the standard compound UV
peak displays similar retention time as radioactive peak (C) when analyzing a sample of
the final product. These are representative graphs from the multiple syntheses performed,
n=3.

58
0.0E+00
1.0E+06
2.0E+06
3.0E+06
4.0E+06
5.0E+06
6.0E+06
0 1 2 3 4 5 6 7
Gam
ma
Co
un
ts (
CP
M)
c-11 acetate (uCi)
0.0E+00
5.0E+06
1.0E+07
1.5E+07
2.0E+07
2.5E+07
0 20 40 60 80
gam
ma
cou
nts
(CP
Ms)
c-11 acetate (μCi)
A B
0.9
0.95
1
1.05
1.1
1.15
Control ISO ISO + HF
Fold
incr
eas
e in
bin
din
g o
ver
con
tro
l
Conditions
*
Figure 14: N-[11
C]-methyl-hydroxyfasudil binding in ISO treated primary
cardiomyocytes. (A) [11
C]-acetate was used to create a standard curve to detect gamma
counts within the accurate linear range of the gamma counter. A line of best fit was
created for the linear region to be later used for the N-[11
C]-methyl-hydroxyfasudil
experiments. (B) Cardiomyocytes were treated with 5μCi of N-[11
C]-methyl-
hydroxyfasudil for 30min prior to a 20min treatment with 10μM ISO (n=8). Blocking was
performed with 10μM hydroxyfasudil (HF) prior to the addition of the tracer (n=5).
Tracer binding was compared by gamma counting between non-ISO treated control cells,
ISO treated cells, and ISO+HF treated cells. Control values were standardized to 1 due to
differences in specific activity between trials. Error bars represent standard error. “*”
indicates significant increase (p<0.001).

59
DISCUSSION

60
4.1 Brief summary of findings
Cardiac hypertrophy involves a complex network of signalling cascades that often
vary depending on the type of hypertrophy, be it pathological or physiological, and the
stimulus. We examined some of the pathways involved in pathological cardiac
hypertrophy in vitro through β-AR stimulation using the β-AR agonist ISO in neonatal rat
primary cardiomyocytes. Through the development of a reliable hypertrophic model we
then went on to examine the effect of ISO on Rho kinase whose involvement in
hypertrophy is not yet completely understood. It is known, however, that Rho kinase
activity is important for cellular remodeling, contraction and the development of cardiac
hypertrophy. This, therefore, makes it a candidate as a potential target for PET tracking of
disease progression or regression. Using the PET tracer N-[11
C]-methyl-hydroxyfasudil, a
11C-labelled derivative of a known inhibitor of Rho-kinase, we wished to explore this
prospective target.
We began by first developing our in vitro hypertrophic model using ISO. To
verify hypertrophy we initially investigated the optimal concentrations of ISO needed to
be administered to induce the disease but not cause toxic effects in the cells. We then
went on to further examine our model and found increased cell and nuclear size after ISO
treatment as well as increased ERK1/2 and mTOR phosphorylation, which together
indicated the onset of hypertrophy. Next, we examined Rho kinase activity after ISO
treatment and found increased levels shortly after the administration of the β-AR agonist.
The mRNA levels of the fetal genes were not examined after ISO treatment. As stated
previously, ISO initiates the pathological hypertrophic pathway and therefore these could
be analyzed in future experiments through RT-PCR. The time point examined and
61
determined to have the largest increase in Rho kinase activity (20min post-treatment) was
subsequently used to test N-[11
C]-methyl-hydroxyfasudil binding under similar controlled
conditions. An increase in N-[11
C]-methyl-hydroxyfasudil binding correlated to increased
Rho kinase activity in ISO treated versus control cells demonstrating this PET tracer’s
potential use to track cardiac hypertrophy.
4.2 Cell viability after ISO treatment
During prolonged stages of cardiac hypertrophy and in the transition to cardiac
dilation and heart failure, 15-20% of cardiomyocytes undergo apoptosis (Singh et al.
2010). ROCK is involved with the activation of the pro-apoptotic protease caspase 3 and
is in turn activated by caspase 3 during late stage apoptotic membrane blebbing.
Therefore, ROCK may show increased activity under apoptotic conditions (Chang et al.
2006). At high concentrations, ISO can induce a toxic environment by increasing levels
of LDH and oxidative by-products (Ramos et al. 1983; Ramos et al. 1983), triggering
apoptosis and necrosis in affected cells (Ramos et al. 1983) therefore increasing ROCK
activity. In order to deduce that ROCK activity in our model was not due to increased
levels of apoptosis in ISO treated cardiomyocytes, trypan blue exclusion and MTT assays
were performed. These experiments demonstrated that our chosen concentration of ISO
treatment did not induce significant apoptotic or necrotic effects. H9C2 cells remained
above 90% viable for both control and ISO treated cells within the ranges of 0-50μM over
24-72 hours of treatment.

62
Based on these results a concentration of 10μM ISO was chosen for future
experiments which agreed with previous methods for inducing optimal hypertrophy
(Morisco et al. 2001; Iaccarino et al. 2006). Similar results were seen in the MTT assay
which demonstrated that 10μM ISO treated H9C2 cells were as equally viable as control
cells over a 72hour treatment period. Seventy-two hours of ISO treatment was the longest
timepoint to be used in future experiments and therefore we could conclude that ROCK
activity due to apoptosis would not be of concern. These viability results were most likely
due to apoptosis mainly being triggered at the later stages of hypertrophy in contrast to
the 15-20% apoptotic rates stated before. Higher apoptotic rates occur when the condition
is no longer compensatory, but instead hinders cardiac function and performance. The
possible outcome of the transition to cardiac dilation also induces apoptosis (Shi et al.
2010), but this process would not be studied within our cellular model but rather in a
prolonged ISO treatment in vivo.
4.3 Morphological changes in cell size and nuclear size after ISO treatment
Morphologically, the increase in cardiomyocyte size is what physically results in
the heart’s demise during cardiac hypertrophy, be it physiologically or pathologically
induced. In 1994, Gerdes’ lab published findings that demonstrated that during this
hypertrophic state, both cell size and nuclear size are increased (Gerdes et al. 1994). This
could be attributed to the increase in transcription rates needed to produce the large
increase in protein synthesis characteristically occurring during hypertrophy (Hannan et
al. 2003). Using surgically induced hypertrophy in a rat model they observed up to a 56%
63
increase in nuclear size (Gerdes et al. 1994). While observing an increase in overall cell
size in our H9C2 cardiomyocytes, we measured this increase in nuclear size as a strong
predictor of cardiac hypertrophy. Comparably to Gerdes’ findings, by 24 hours of ISO
treatment we had a significant increase in nuclear size of 1.5-fold over control, solely
vehicle treated and non-treated cells. This increased slightly up to 1.74-fold larger than
controls by 72 hours of ISO treatment and coincided nicely with our images of increased
overall cell size visualized by H&E staining. Increased cell size can vary depending on
the type of hypertrophy such as eccentric versus concentric (Kehat et al. 2011) and also
may be harder to determine since cardiomyocytes naturally occur in small groupings in
vitro and may overlap and cluster together. We noticed an increased cell size that
followed the pattern of increased nuclear size in our cell culture model. Significant
differences in nuclear size were seen between controls and each time point chosen. An
insignificant difference was seen between the 24 and 48 hour time points but this may be
attributable to a plateau or a β-AR desensitization effect from prolonged ISO treatment
(Lohse et al. 1990). Importantly, the two control groups, CV and CNV, did not show
significant differences suggesting that the 0.01M ascorbic acid vehicle was not affecting
hypertrophy.
4.4 Evaluating isolated cardiomyocyte population purity
H9C2 cells were selected for our first grouping of experiments. This cell culture
line of rat ventricular cardiomyocytes was chosen to determine ISO conditions for future
experiments with primary cardiomyocytes, based on the facts that they are much simpler
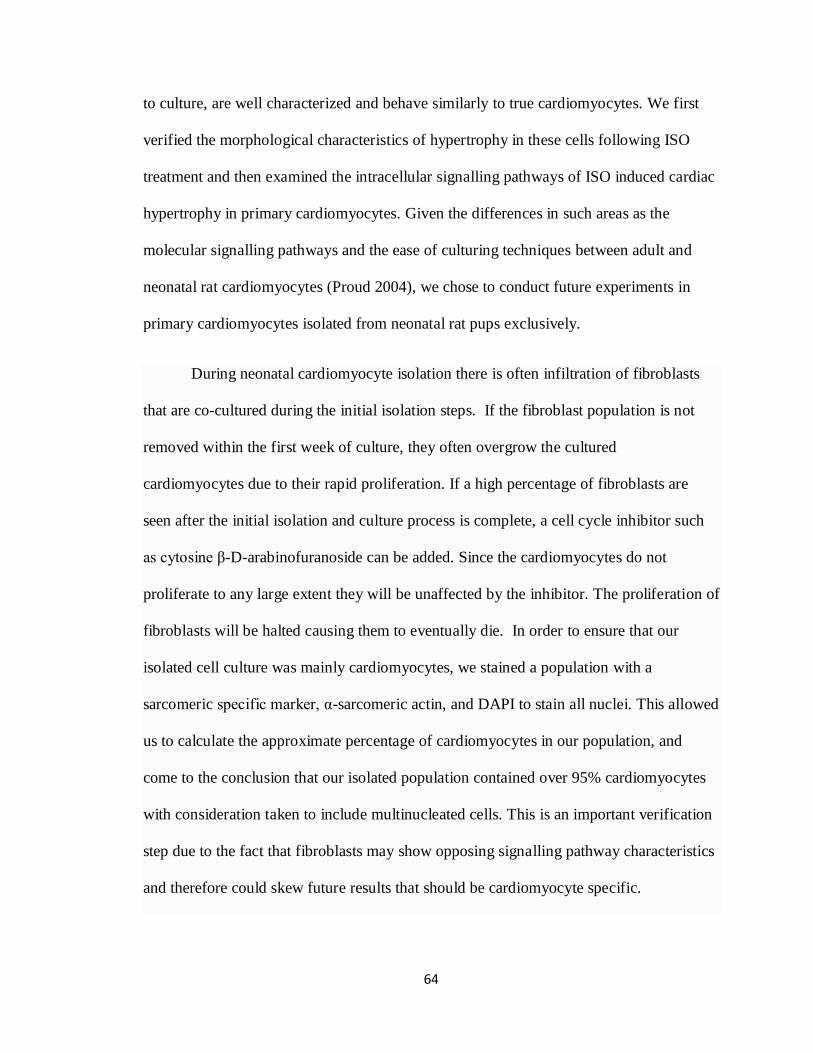
64
to culture, are well characterized and behave similarly to true cardiomyocytes. We first
verified the morphological characteristics of hypertrophy in these cells following ISO
treatment and then examined the intracellular signalling pathways of ISO induced cardiac
hypertrophy in primary cardiomyocytes. Given the differences in such areas as the
molecular signalling pathways and the ease of culturing techniques between adult and
neonatal rat cardiomyocytes (Proud 2004), we chose to conduct future experiments in
primary cardiomyocytes isolated from neonatal rat pups exclusively.
During neonatal cardiomyocyte isolation there is often infiltration of fibroblasts
that are co-cultured during the initial isolation steps. If the fibroblast population is not
removed within the first week of culture, they often overgrow the cultured
cardiomyocytes due to their rapid proliferation. If a high percentage of fibroblasts are
seen after the initial isolation and culture process is complete, a cell cycle inhibitor such
as cytosine β-D-arabinofuranoside can be added. Since the cardiomyocytes do not
proliferate to any large extent they will be unaffected by the inhibitor. The proliferation of
fibroblasts will be halted causing them to eventually die. In order to ensure that our
isolated cell culture was mainly cardiomyocytes, we stained a population with a
sarcomeric specific marker, α-sarcomeric actin, and DAPI to stain all nuclei. This allowed
us to calculate the approximate percentage of cardiomyocytes in our population, and
come to the conclusion that our isolated population contained over 95% cardiomyocytes
with consideration taken to include multinucleated cells. This is an important verification
step due to the fact that fibroblasts may show opposing signalling pathway characteristics
and therefore could skew future results that should be cardiomyocyte specific.

65
4.5 Evaluating ERK1/2 and mTOR signalling pathways during ISO induced cardiac
hypertrophy in primary cardiomyocytes
During cardiac hypertrophy there are multiple signalling pathways that are
activated many of which happen through kinase phosphorylation reactions. As discussed
earlier, the MEK/ERK pathway has been extensively studied, with phosphorylation of
both p42 and p44 being a common marker of cardiac hypertrophy in both in vivo (Wang
et al. 2011) and in vitro studies (Zheng et al. 2004). Zheng et al in 2004 using isolated
mouse cardiomyocytes have demonstrated that ERK1/2 phosphorylation can occur as
early as 5 minutes after ISO treatment in cardiomyocytes and begins to diminish by one
hour of stimulation (Zheng et al. 2004). This demonstrates that the signalling pathways
that underlie cellular cardiac hypertrophy occur much earlier in comparison to the
morphological changes in cell size which we observed previously.
As seen in Figure 9, our 10μM ISO treatment increased ERK1/2 phosphorylation
over control levels in all 3 trials within the first 60min. The initiation of ERK1/2
activation (phosphorylation) tended to differ between trials. Our earliest time point
examined was at 10min after ISO treatment. As seen at the 10min time point, two trials
showed peaked increase in ERK1/2 phosphorylation, while one trial peaked slightly later,
closer to 20-30min after initial stimulation. This variance made it difficult to average the
trials to determine significance. All trials at one point peaked higher than control levels
within the first hour, but the timing varied slightly. This could possibly be due to
overlapping signalling pathways interfering with the ERK1/2 cascade or procedural
timing in terms of the protein isolation process. Inevitably, ERK1/2 phosphorylation
peaked within a close 30 minute time frame and then began to diminish by 60 minutes

66
which demonstrated its activation then deactivation once downstream cascades were
stimulated. This phosphorylation of ERK1/2 was always put in contrast to the total
amount of ERK1/2 found within the cell. Isoforms of ERK were analyzed together often
due to the lacking resolution between the two bands on the western blot. In particular this
was noticed for the total ERK1/2 which had a high concentration of protein creating very
thick bands. This is a necessary comparison in lieu of traditional structural proteins being
used as loading controls such as β-actin. During cardiac hypertrophy there is an
abundance of cellular structural remodeling leaving these structural proteins in varying
quantities (Balasubramanian et al. 2010). If traditional controls were used and an increase
in phosphorylation of ERK1/2 was seen, it could simply be due to an overall increase in
ERK1/2 in one sample compared to another.
mTOR has been shown to be involved in pathways leading to protein synthesis
and therefore, is activated during multiple forms of agonist induced cardiac hypertrophy
such as phenylephrine, endothelin-1, and ISO (Proud 2004). However, these pathways are
not fully understood and not all the mechanisms underlying this increased synthesis are
known. ERK1/2 lies upstream of mTOR and thus its activation during hypertrophy should
lead to increased mTOR activity and protein synthesis, even though other mechanism
have been shown that bypass mTOR activation to induce similar increased translation
rates (Proud 2004). ERK1/2 has been shown to activate pathways such as the Mnk1/2-
eIF4E pathway, which can also induce increased protein synthesis during hypertrophy but
this pathway is not fully understood in cardiomyocytes (Ishida et al. 2003) . We noticed
that by 20min after ISO stimulation there was a significant increase in mTOR
phosphorylation which was observed in vivo by Zhang et al. using excised hearts from

67
ISO treated mice (Zhang et al. 2011). When compared to 2 out of the 3 ERK1/2
phosphorylation trials which had activation at 10min, it suggests that mTOR
phosphorylation occurred post-ERK1/2 phosphorylation as seen in the literature. The
activation of mTOR diminished back to control levels by 30-60min, demonstrating that it
may follow a similar pattern to ERK1/2 with a rise then a fall in activity after downstream
targets are triggered.
4.6 Rho kinase activity and regulation during ISO induced cardiac hypertrophy in
primary cardiomyocytes
Following our results demonstrating that morphological changes occurred after a
prolonged ISO treatment of 24 to 72 hours, we investigated our radiotracer’s target
protein Rho kinase. Rho kinase activity was investigated at these time points due to its
known involvement in cellular remodeling and contraction as described previously. This
was performed using our isolated primary cardiomyocytes under similar conditions as
previously used with our nuclear size experiments. We determined that Rho kinase
activity at these prolonged ISO treatment time points was not significantly different from
that of the control cells. From this we concluded that some of the hypertrophic signalling
pathways may be occurring at earlier time points after ISO stimulation of the β-adrenergic
receptors. This may be similar to ERK1/2 and mTOR phosphorylation, which both can be
seen within the first hour of stimulation.
Based on published studies and previously determined signalling time points (see
Figure 9 and 10) we examined Rho kinase activity within the first hour of ISO stimulation
68
and as suspected saw an increase in activity by 20 minutes of ISO stimulation (see Figure
12C). This peaked at 20-30 minutes compared to control levels and decreased back to
control levels by 60 minutes. Activity was based on Rho kinase’s ability to phosphorylate
its downstream target myosin light chain (Amano et al. 1996). The collected values were
all found within a linear portion of a standard curve created which demonstrated Rho
kinase’s activity at multiple concentrations of pure ROCK2 (a positive standard control)
(Figure 12A). These results made the previous ROCK activity results at the longer ISO
incubation times of up to 72h understandable since it was determined to be a much earlier
response. The increased activity at 20min of ISO treatment is thought to be a response of
solely increased activity and not to the upregulation of Rho kinase. Upregulation of Rho
kinase would not have occurred within such a short timeframe (20min), as that process
requires a much longer time period to occur. To our knowledge, increased Rho kinase
activity in an in vitro setting has not been examined through ISO stimulation in primary
cardiomyocytes. This peak in activity followed by a decrease appeared to be a common
trend in our investigated signalling pathways. Once activated and its downstream effects
initiated, the active protein may not longer be needed and therefore becomes inactive.
Previous studies by Wang et al. in 2011 have shown an increase in ROCK1
mRNA during hypertrophy through ISO stimulation in an in vivo rat model (Wang et al.
2011). Other in vivo hypertrophy studies, such as that done by Shi et al. where
hypertrophy was induced through cardiac Gαq overexpression in mice, have shown that
ROCK1 protein levels increased during late stage hypertrophy and during the transition to
cardiac dysfunction (Shi et al. 2010). This led us to investigate our ROCK1 protein levels
due to the fact that mRNA levels do not always directly correlate to protein levels. We

69
noticed a trend towards increased levels of ROCK1 after 72 hours of ISO treatment but
due to high levels of variability at this time these numbers were not significant. A
possible reason for these results and an overall restriction in examining upregulation of a
protein during a hypertrophic state is that our control, β-actin, is a cytoskeletal protein
whose levels may vary due to the morphological changes of the cardiomyocytes
(Balasubramanian et al. 2010). Most loading control proteins such as β-actin or tubulin
are involved with the cytoskeleton as stated before, which makes standardization very
difficult and creates increased variance in our densitometry comparisons.
4.7 N-[11
C]-methyl-hydroxyfasudil synthesis and binding to Rho kinase during ISO
induced hypertrophy in primary cardiomyocytes
In order to determine the optimal range for treating the hypertrophic
cardiomyocytes with N-[11
C]-methyl-hydroxyfasudil we first had to determine the linear
range in which our gamma counter could accurately quantify the amount of radioactivity
used. As seen in Figure 14A, quantities ranging from 1nCi to approximately 6.5μCi
remained in the linear portion of our standard curve. Knowing this viable range, we
wished to use a low amount of radioactivity but with high specific activity in order to
reduce the mass of product and saturation of specific binding to ROCK (see Figure 13).
This was done to avoid non-specific binding that would saturate our cells and make it
difficult to interpret differences between ISO treated hypertrophied cardiomyocytes and
non-treated control cells.

70
In vitro studies were necessary to determine N-[11
C]-methyl-hydroxyfasudil’s
uptake and binding to Rho kinase since its original synthesis in 2010 (Valdivia et al.
2010). Shown here are some of the preliminary results to determine these properties
however the binding affinities and kinetics of this reaction are yet to be examined. N-
[11
C]-methyl-hydroxyfasudil, if it behaves similar to its derived compound
hydroxyfasudil, diffuses across the cell membrane and binds to active Rho kinase. After
our primary cardiomyocytes were incubated with this radiotracer we saw an uptake and
retention of approximately 2.3-3.9% with the slight variation between our multiple trials.
We did not wish to saturate our cell culture with excess radiotracer because this tends to
create non-specific binding. This non-specific binding makes differentiating between ISO
treated and control cells difficult and inaccurate and therefore our concentrations stayed
in the 0.1-0.25 picomolar range. The tracer used in our experiments had a specific activity
ranging from 305-880mCi/μmol making it detectable after the full length of our
experiment even with the short half-life of 11
C. Although our percent uptake appears
fairly low this could simply be due to the number of cells/well in each experiment.
Approximately 950 000 cells were plated per condition, but this amount is drastically
smaller than would be available in an in vivo model and less realistic. Therefore this data
should not be solely used as an indicator of the uptake and retention of N-[11
C]-methyl-
hydroxyfasudil.
After a 30min incubation time with the tracer to allow for uptake the
cardiomyocytes were stimulated with ISO for 20min; a previously determined optimal
time for ROCK activation (see Figure 12). After 20min of incubation the activity of tracer
remaining within the cells was compared between ISO treated and non-ISO treated

71
conditions. To conclude that these amounts directly correlate to active ROCK binding
would be inaccurate without considering a few facts first. Firstly, uptake does not ensure
that what has been uptaken is bound to our desired protein. Secondly, N-[11
C]-methyl-
hydroxyfasudil can cross the cell membrane by simple diffusion which does not ensure
that what does bind to ROCK remains bound and/or intracellular for any extent of time.
The tracer may be transiently moving in and out of the cell or may bind only
temporarily/semi-permanently to its target. The blockage of AT-1 receptors is a perfect
example of this. Candesarten and Losartan are both AT-1 receptor blockers but greatly
differ in the amount of time they remain bound to their targets. While Candesartan binds
tightly and persistently for 152 minutes, Losartan remains bound for only 5min and is
then released (Unger 2001). This type of transient binding creates the possibility that
blocking experiments with our tracer may be very difficult to quantify in vitro until these
parameters are known. However our blocking with hydroxyfasudil brought tracer binding
in ISO treated cells back down to control levels. This indicates that our tracer was
specifically bound to active ROCK in our previous binding experiment.
To properly deduce the binding kinetics and affinities of N-[11
C]-methyl-
hydroxyfasudil, cell-free experiments with purified protein lysates of active versus non-
active ROCK would have to be performed which could greatly differ from in vitro and
even future in vivo experimentation. These types of biochemical experiments have been
performed for the parent compound, fasudil, and show a IC50 of 1.9μM and a
concentration of 20μM being able to inhibit Rho kinase activity over 92% as compared to
controls (Davies et al. 2000). We suspect that because our methylation of the compound

72
does not interfere with the catalytic domain as stated before (Valdivia et al. 2010), that
the kinetics should be similar but this has not yet been determined.
As seen in our results, ISO treated cardiomyocytes had a 10.3% ± 2% average
increase in N-[11
C]-methyl-hydroxyfasudil CPMs over our control cells, which we relate
to an increase in active Rho kinase binding assuming equal variance among trials and
cellular conditions. Blocking with hydroxyfasudil abolished this increase demonstrating
N-[11
C]-methyl-hydroxyfasudil’s specificity for ROCK. Although this is not the same
increase as seen in our ROCK activity assay of 1.64-fold over control levels at 20minutes
it may be more physiologically realistic of what our tracer can demonstrate being that this
is an in vitro study as opposed to a cell-free assay. How this increase would correlate in
vivo and whether this would be a large enough fold increase in binding to image using
PET is yet to be determined.
4.8 Conclusions
We have demonstrated that ISO is capable of inducing hypertrophy in
cardiomyocytes in vitro and determined the time at which there is the greatest increase in
ROCK activity. To our knowledge, this is the first demonstration of ISO induced
hypertrophy with a direct implication of Rho kinase activity in a neonatal cardiomyocyte
model. We examined N-[11
C]-methyl-hydroxyfasudil activity in this primary cell culture
model and saw a significant increase in the uptake and retention which correlated with
increased activity of the ROCK protein at 20min post-ISO treatment. Although the
binding kinetics and affinities of the tracer are yet to be determined these preliminary

73
results demonstrate that this tracer could potentially be used to track cardiac hypertrophy
in vivo. Inducing cardiac hypertrophy in vivo in animal models such as rat and mouse
using ISO is commonly performed. Clinically N-[11
C]-methyl-hydroxyfasudil could
potentially be used one day to evaluate the progression or regression of cardiac
hypertrophy after pharmacological or surgical treatment. Rho kinase is involved in
multiple cardiac diseases such as cardiac infarctions, making this tracer applicable to
other diseases as well as hypertrophy. This tracer could aid in studying intracellular
mechanistic signalling involving increased ROCK activity in other cardiac diseases and
potentially help guide therapies. These results show promise in the use of N-[11
C]-methyl-
hydroxyfasudil and merits further investigations by our lab.

74
5.0 References:
Abe, K., H. Shimokawa, K. Morikawa, T. Uwatoku, K. Oi, Y. Matsumoto, T. Hattori, Y. Nakashima, K. Kaibuchi, K. Sueishi and A. Takeshit (2004). "Long-term
treatment with a Rho-kinase inhibitor improves monocrotaline-induced fatal pulmonary hypertension in rats." Circ Res 94(3): 385-93.
Ahlquist, R. P. (1948). "A study of the adrenotropic receptors." Am J Physiol 153(3): 586-600.
Alcalai, R., J. G. Seidman and C. E. Seidman (2008). "Genetic basis of hypertrophic cardiomyopathy: from bench to the clinics." J Cardiovasc Electrophysiol 19(1):
104-10. Amano, M., M. Ito, K. Kimura, Y. Fukata, K. Chihara, T. Nakano, Y. Matsuura and K.
Kaibuchi (1996). "Phosphorylation and activation of myosin by Rho-associated kinase (Rho-kinase)." J Biol Chem 271(34): 20246-9.
Arad, M., M. Penas-Lado, L. Monserrat, B. J. Maron, M. Sherrid, C. Y. Ho, S. Barr, A. Karim, T. M. Olson, M. Kamisago, J. G. Seidman and C. E. Seidman (2005).
"Gene mutations in apical hypertrophic cardiomyopathy." Circulation 112(18): 2805-11.
Arimoto, T., Y. Takeishi, H. Takahashi, T. Shishido, T. Niizeki, Y. Koyama, R. Shiga, N. Nozaki, O. Nakajima, K. Nishimaru, J. Abe, M. Endoh, R. A. Walsh, K. Goto and
I. Kubota (2006). "Cardiac-specific overexpression of diacylglycerol kinase zeta prevents Gq protein-coupled receptor agonist-induced cardiac hypertrophy in
transgenic mice." Circulation 113(1): 60-6. Asano, T., T. Suzuki, M. Tsuchiya, S. Satoh, I. Ikegaki, M. Shibuya, Y. Suzuki and H.
Hidaka (1989). "Vasodilator actions of HA1077 in vitro and in vivo putatively mediated by the inhibition of protein kinase." Br J Pharmacol 98(4): 1091-100.
Balasubramanian, S., S. K. Mani, H. Kasiganesan, C. C. Baicu and D. Kuppuswamy (2010). "Hypertrophic stimulation increases beta-actin dynamics in adult feline
cardiomyocytes." PLoS One 5(7): e11470. Beltrami, A. P., K. Urbanek, J. Kajstura, S. M. Yan, N. Finato, R. Bussani, B. Nadal-
Ginard, F. Silvestri, A. Leri, C. A. Beltrami and P. Anversa (2001). "Evidence that human cardiac myocytes divide after myocardial infarction." N Engl J Med
344(23): 1750-7. Bogoyevitch, M. A., M. B. Andersson, J. Gillespie-Brown, A. Clerk, P. E. Glennon, S. J.
Fuller and P. H. Sugden (1996). "Adrenergic receptor stimulation of the mitogen-
activated protein kinase cascade and cardiac hypertrophy." Biochem J 314 ( Pt 1): 115-21.
Bourne, H. R. (1997). "How receptors talk to trimeric G proteins." Curr Opin Cell Biol 9(2): 134-42.
Brodde, O. E. (1991). "Beta 1- and beta 2-adrenoceptors in the human heart: properties, function, and alterations in chronic heart failure." Pharmacol Rev 43(2): 203-42.
Bylund, D. B., D. C. Eikenberg, J. P. Hieble, S. Z. Langer, R. J. Lefkowitz, K. P. Minneman, P. B. Molinoff, R. R. Ruffolo, Jr. and U. Trendelenburg (1994).
"International Union of Pharmacology nomenclature of adrenoceptors." Pharmacol Rev 46(2): 121-36.
75
Chakraborti, S., T. Chakraborti and G. Shaw (2000). "beta-adrenergic mechanisms in
cardiac diseases: a perspective." Cell Signal 12(8): 499-513. Chang, J., M. Xie, V. R. Shah, M. D. Schneider, M. L. Entman, L. Wei and R. J.
Schwartz (2006). "Activation of Rho-associated coiled-coil protein kinase 1 (ROCK-1) by caspase-3 cleavage plays an essential role in cardiac myocyte
apoptosis." Proc Natl Acad Sci U S A 103(39): 14495-500. Chu, M., R. Iyengar, Y. E. Koshman, T. Kim, B. Russell, J. L. Martin, A. L. Heroux, S.
L. Robia and A. M. Samarel (2011). "Serine-910 phosphorylation of focal adhesion kinase is critical for sarcomere reorganization in cardiomyocyte
hypertrophy." Cardiovasc Res 92(3): 409-19. Coleman, M. L., E. A. Sahai, M. Yeo, M. Bosch, A. Dewar and M. F. Olson (2001).
"Membrane blebbing during apoptosis results from caspase-mediated activation of ROCK I." Nat Cell Biol 3(4): 339-45.
Cselenyak, A., E. Pankotai, E. M. Horvath, L. Kiss and Z. Lacza (2010). "Mesenchymal stem cells rescue cardiomyoblasts from cell death in an in vitro ischemia model
via direct cell-to-cell connections." BMC Cell Biol 11: 29. Davies, S. P., H. Reddy, M. Caivano and P. Cohen (2000). "Specificity and mechanism of
action of some commonly used protein kinase inhibitors." Biochem J 351(Pt 1): 95-105.
Debold, E. P., J. P. Schmitt, J. B. Patlak, S. E. Beck, J. R. Moore, J. G. Seidman, C. Seidman and D. M. Warshaw (2007). "Hypertrophic and dilated cardiomyopathy
mutations differentially affect the molecular force generation of mouse alpha-cardiac myosin in the laser trap assay." Am J Physiol Heart Circ Physiol 293(1):
H284-91. Denker, S. P., D. C. Huang, J. Orlowski, H. Furthmayr and D. L. Barber (2000). "Direct
binding of the Na--H exchanger NHE1 to ERM proteins regulates the cortical cytoskeleton and cell shape independently of H(+) translocation." Mol Cell 6(6):
1425-36. Dong, M., B. P. Yan, J. K. Liao, Y. Y. Lam, G. W. Yip and C. M. Yu (2010). "Rho-
kinase inhibition: a novel therapeutic target for the treatment of cardiovascular diseases." Drug Discov Today 15(15-16): 622-9.
Farah, S., Y. Agazie, N. Ohan, J. K. Ngsee and X. J. Liu (1998). "A rho-associated protein kinase, ROKalpha, binds insulin receptor substrate-1 and modulates
insulin signaling." J Biol Chem 273(8): 4740-6. Fatkin, D., B. K. McConnell, J. O. Mudd, C. Semsarian, I. G. Moskowitz, F. J. Schoen,
M. Giewat, C. E. Seidman and J. G. Seidman (2000). "An abnormal Ca(2+) response in mutant sarcomere protein-mediated familial hypertrophic
cardiomyopathy." J Clin Invest 106(11): 1351-9. Fielitz, J., M. S. Kim, J. M. Shelton, X. Qi, J. A. Hill, J. A. Richardson, R. Bassel-Duby
and E. N. Olson (2008). "Requirement of protein kinase D1 for pathological cardiac remodeling." Proc Natl Acad Sci U S A 105(8): 3059-63.
Frey, N., H. A. Katus, E. N. Olson and J. A. Hill (2004). "Hypertrophy of the heart: a new therapeutic target?" Circulation 109(13): 1580-9.
Frey, N. and E. N. Olson (2003). "Cardiac hypertrophy: the good, the bad, and the ugly." Annu Rev Physiol 65: 45-79.
76
Fukata, Y., N. Oshiro, N. Kinoshita, Y. Kawano, Y. Matsuoka, V. Bennett, Y. Matsuura
and K. Kaibuchi (1999). "Phosphorylation of adducin by Rho-kinase plays a crucial role in cell motility." J Cell Biol 145(2): 347-61.
Gerdes, A. M., Z. Liu and H. G. Zimmer (1994). "Changes in nuclear size of cardiac myocytes during the development and progression of hypertrophy in rats."
Cardioscience 5(3): 203-8. Gonzalez-Forero, D., F. Montero, V. Garcia-Morales, G. Dominguez, L. Gomez-Perez, J.
M. Garcia-Verdugo and B. Moreno-Lopez (2012). "Endogenous Rho-kinase signaling maintains synaptic strength by stabilizing the size of the readily
releasable pool of synaptic vesicles." J Neurosci 32(1): 68-84. Haim, T. E., C. Dowell, T. Diamanti, J. Scheuer and J. C. Tardiff (2007). "Independent
FHC-related cardiac troponin T mutations exhibit specific alterations in myocellular contractility and calcium kinetics." J Mol Cell Cardiol 42(6): 1098-
110. Hall, A. (1998). "Rho GTPases and the actin cytoskeleton." Science 279(5350): 509-14.
Hannan, K. M., Y. Brandenburger, A. Jenkins, K. Sharkey, A. Cavanaugh, L. Rothblum, T. Moss, G. Poortinga, G. A. McArthur, R. B. Pearson and R. D. Hannan (2003).
"mTOR-dependent regulation of ribosomal gene transcription requires S6K1 and is mediated by phosphorylation of the carboxy-terminal activation domain of the
nucleolar transcription factor UBF." Mol Cell Biol 23(23): 8862-77. Hannan, R. D., A. Jenkins, A. K. Jenkins and Y. Brandenburger (2003). "Cardiac
hypertrophy: a matter of translation." Clin Exp Pharmacol Physiol 30(8): 517-27. Hattori, T., H. Shimokawa, M. Higashi, J. Hiroki, Y. Mukai, K. Kaibuchi and A.
Takeshita (2004). "Long-term treatment with a specific Rho-kinase inhibitor suppresses cardiac allograft vasculopathy in mice." Circ Res 94(1): 46-52.
Heather, L. C., A. F. Catchpole, D. J. Stuckey, M. A. Cole, C. A. Carr and K. Clarke (2009). "Isoproterenol induces in vivo functional and metabolic abnormalities:
similar to those found in the infarcted rat heart." J Physiol Pharmacol 60(3): 31-9. Higashi, M., H. Shimokawa, T. Hattori, J. Hiroki, Y. Mukai, K. Morikawa, T. Ichiki, S.
Takahashi and A. Takeshita (2003). "Long-term inhibition of Rho-kinase suppresses angiotensin II-induced cardiovascular hypertrophy in rats in vivo:
effect on endothelial NAD(P)H oxidase system." Circ Res 93(8): 767-75. Hirooka, Y. and H. Shimokawa (2005). "Therapeutic potential of rho-kinase inhibitors in
cardiovascular diseases." Am J Cardiovasc Drugs 5(1): 31-9. Hisaoka, T., M. Yano, T. Ohkusa, M. Suetsugu, K. Ono, M. Kohno, J. Yamada, S.
Kobayashi, M. Kohno and M. Matsuzaki (2001). "Enhancement of Rho/Rho-kinase system in regulation of vascular smooth muscle contraction in tachycardia-
induced heart failure." Cardiovasc Res 49(2): 319-29. Iaccarino, G., R. Izzo, V. Trimarco, E. Cipolletta, F. Lanni, D. Sorriento, G. L. Iovino, F.
Rozza, N. De Luca, O. Priante, G. Di Renzo and B. Trimarco (2006). "Beta2-adrenergic receptor polymorphisms and treatment-induced regression of left
ventricular hypertrophy in hypertension." Clin Pharmacol Ther 80(6): 633-45. Ishida, M., T. Ishida, H. Nakashima, N. Miho, K. Miyagawa, K. Chayama, T. Oshima, M.
Kambe and M. Yoshizumi (2003). "Mnk1 is required for angiotensin II-induced protein synthesis in vascular smooth muscle cells." Circ Res 93(12): 1218-24.
77
Jacobs, M., K. Hayakawa, L. Swenson, S. Bellon, M. Fleming, P. Taslimi and J. Doran
(2006). "The structure of dimeric ROCK I reveals the mechanism for ligand selectivity." J Biol Chem 281(1): 260-8.
Jalil, J. E., C. W. Doering, J. S. Janicki, R. Pick, S. G. Shroff and K. T. Weber (1989). "Fibrillar collagen and myocardial stiffness in the intact hypertrophied rat left
ventricle." Circ Res 64(6): 1041-50. Kaibuchi, K., S. Kuroda and M. Amano (1999). "Regulation of the cytoskeleton and cell
adhesion by the Rho family GTPases in mammalian cells." Annu Rev Biochem 68: 459-86.
Kang, P. M. and S. Izumo (2003). "Apoptosis in heart: basic mechanisms and implications in cardiovascular diseases." Trends Mol Med 9(4): 177-82.
Kaumann, A. J. and P. Molenaar (1997). "Modulation of human cardiac function through 4 beta-adrenoceptor populations." Naunyn Schmiedebergs Arch Pharmacol
355(6): 667-81. Kawano, Y., Y. Fukata, N. Oshiro, M. Amano, T. Nakamura, M. Ito, F. Matsumura, M.
Inagaki and K. Kaibuchi (1999). "Phosphorylation of myosin-binding subunit (MBS) of myosin phosphatase by Rho-kinase in vivo." J Cell Biol 147(5): 1023-
38. Kehat, I., J. Davis, M. Tiburcy, F. Accornero, M. K. Saba-El-Leil, M. Maillet, A. J. York,
J. N. Lorenz, W. H. Zimmermann, S. Meloche and J. D. Molkentin (2011). "Extracellular signal-regulated kinases 1 and 2 regulate the balance between
eccentric and concentric cardiac growth." Circ Res 108(2): 176-83. Keren, A., P. Syrris and W. J. McKenna (2008). "Hypertrophic cardiomyopathy: the
genetic determinants of clinical disease expression." Nat Clin Pract Cardiovasc Med 5(3): 158-68.
Kimura, K., Y. Fukata, Y. Matsuoka, V. Bennett, Y. Matsuura, K. Okawa, A. Iwamatsu and K. Kaibuchi (1998). "Regulation of the association of adducin with actin
filaments by Rho-associated kinase (Rho-kinase) and myosin phosphatase." J Biol Chem 273(10): 5542-8.
Kirsch, D. G., A. Doseff, B. N. Chau, D. S. Lim, N. C. de Souza-Pinto, R. Hansford, M. B. Kastan, Y. A. Lazebnik and J. M. Hardwick (1999). "Caspase-3-dependent
cleavage of Bcl-2 promotes release of cytochrome c." J Biol Chem 274(30): 21155-61.
Kozai, T., M. Eto, Z. Yang, H. Shimokawa and T. F. Luscher (2005). "Statins prevent pulsatile stretch-induced proliferation of human saphenous vein smooth muscle
cells via inhibition of Rho/Rho-kinase pathway." Cardiovasc Res 68(3): 475-82. Kubo, T., H. Kitaoka, M. Okawa, T. Hirota, K. Hayato, N. Yamasaki, Y. Matsumura, T.
Yabe, J. Takata and Y. L. Doi (2009). "Clinical impact of atrial fibrillation in patients with hypertrophic cardiomyopathy. Results from Kochi RYOMA Study."
Circ J 73(9): 1599-605. Lands, A. M., A. Arnold, J. P. McAuliff, F. P. Luduena and T. G. Brown, Jr. (1967).
"Differentiation of receptor systems activated by sympathomimetic amines." Nature 214(5088): 597-8.
Levin, C. S. (2005). "Primer on molecular imaging technology." Eur J Nucl Med Mol Imaging 32 Suppl 2: S325-45.
78
Lezoualc'h, F., M. Metrich, I. Hmitou, N. Duquesnes and E. Morel (2008). "Small GTP-
binding proteins and their regulators in cardiac hypertrophy." J Mol Cell Cardiol 44(4): 623-32.
Liao, J. J. (2007). "Molecular recognition of protein kinase binding pockets for design of potent and selective kinase inhibitors." J Med Chem 50(3): 409-24.
Lohse, M. J., J. L. Benovic, M. G. Caron and R. J. Lefkowitz (1990). "Multiple pathways of rapid beta 2-adrenergic receptor desensitization. Delineation with specific
inhibitors." J Biol Chem 265(6): 3202-11. Maekawa, M., T. Ishizaki, S. Boku, N. Watanabe, A. Fujita, A. Iwamatsu, T. Obinata, K.
Ohashi, K. Mizuno and S. Narumiya (1999). "Signaling from Rho to the actin cytoskeleton through protein kinases ROCK and LIM-kinase." Science 285(5429):
895-8. Manning, B. D. and L. C. Cantley (2003). "Rheb fills a GAP between TSC and TOR."
Trends Biochem Sci 28(11): 573-6. Marian, A. J. (2006). "Beta-adrenergic receptors signaling and heart failure in mice,
rabbits and humans." J Mol Cell Cardiol 41(1): 11-3. Marian, A. J. (2008). "Genetic determinants of cardiac hypertrophy." Curr Opin Cardiol
23(3): 199-205. Maron, B. J. (2002). "Hypertrophic cardiomyopathy: a systematic review." Jama 287(10):
1308-20. Matsui, T., M. Amano, T. Yamamoto, K. Chihara, M. Nakafuku, M. Ito, T. Nakano, K.
Okawa, A. Iwamatsu and K. Kaibuchi (1996). "Rho-associated kinase, a novel serine/threonine kinase, as a putative target for small GTP binding protein Rho."
Embo J 15(9): 2208-16. Matsui, T., M. Maeda, Y. Doi, S. Yonemura, M. Amano, K. Kaibuchi, S. Tsukita and S.
Tsukita (1998). "Rho-kinase phosphorylates COOH-terminal threonines of ezrin/radixin/moesin (ERM) proteins and regulates their head-to-tail association."
J Cell Biol 140(3): 647-57. Matsumoto, Y., T. Uwatoku, K. Oi, K. Abe, T. Hattori, K. Morishige, Y. Eto, Y.
Fukumoto, K. Nakamura, Y. Shibata, T. Matsuda, A. Takeshita and H. Shimokawa (2004). "Long-term inhibition of Rho-kinase suppresses neointimal
formation after stent implantation in porcine coronary arteries: involvement of multiple mechanisms." Arterioscler Thromb Vasc Biol 24(1): 181-6.
McDevitt, D. G. (1989). "In vivo studies on the function of cardiac beta-adrenoceptors in man." Eur Heart J 10 Suppl B: 22-8.
McManus, E. J. and D. R. Alessi (2002). "TSC1-TSC2: a complex tale of PKB-mediated S6K regulation." Nat Cell Biol 4(9): E214-6.
McMullen, J. R. and G. L. Jennings (2007). "Differences between pathological and physiological cardiac hypertrophy: novel therapeutic strategies to treat heart
failure." Clin Exp Pharmacol Physiol 34(4): 255-62. Meerson, F. Z. (1961). "On the mechanism of compensatory hyperfunction and
insufficiency of the heart." Cor Vasa 3: 161-77. Meikle, S. R., F. J. Beekman and S. E. Rose (2006). "Complementary molecular imaging
technologies: High resolution SPECT, PET and MRI." Drug Discov Today 3(2): 8.
Molkentin, J. D. and G. W. Dorn, 2nd (2001). "Cytoplasmic signaling pathways that regulate cardiac hypertrophy." Annu Rev Physiol 63: 391-426.
79
Morgan, H. E., E. E. Gordon, Y. Kira, H. L. Chua, L. A. Russo, C. J. Peterson, P. J.
McDermott and P. A. Watson (1987). "Biochemical mechanisms of cardiac hypertrophy." Annu Rev Physiol 49: 533-43.
Morisco, C., D. C. Zebrowski, D. E. Vatner, S. F. Vatner and J. Sadoshima (2001). "Beta-adrenergic cardiac hypertrophy is mediated primarily by the beta(1)-subtype in the
rat heart." J Mol Cell Cardiol 33(3): 561-73. Nadal-Ginard, B., J. Kajstura, A. Leri and P. Anversa (2003). "Myocyte death, growth,
and regeneration in cardiac hypertrophy and failure." Circ Res 92(2): 139-50. Nakagawa, O., K. Fujisawa, T. Ishizaki, Y. Saito, K. Nakao and S. Narumiya (1996).
"ROCK-I and ROCK-II, two isoforms of Rho-associated coiled-coil forming protein serine/threonine kinase in mice." FEBS Lett 392(2): 189-93.
Noma, K., N. Oyama and J. K. Liao (2006). "Physiological role of ROCKs in the cardiovascular system." Am J Physiol Cell Physiol 290(3): C661-8.
Ohashi, K., K. Nagata, M. Maekawa, T. Ishizaki, S. Narumiya and K. Mizuno (2000). "Rho-associated kinase ROCK activates LIM-kinase 1 by phosphorylation at
threonine 508 within the activation loop." J Biol Chem 275(5): 3577-82. Ono-Saito, N., I. Niki and H. Hidaka (1999). "H-series protein kinase inhibitors and
potential clinical applications." Pharmacol Ther 82(2-3): 123-31. Palmiter, K. A., M. J. Tyska, J. R. Haeberle, N. R. Alpert, L. Fananapazir and D. M.
Warshaw (2000). "R403Q and L908V mutant beta-cardiac myosin from patients with familial hypertrophic cardiomyopathy exhibit enhanced mechanical
performance at the single molecule level." J Muscle Res Cell Motil 21(7): 609-20. Proud, C. G. (2002). "Regulation of mammalian translation factors by nutrients." Eur J
Biochem 269(22): 5338-49. Proud, C. G. (2004). "Ras, PI3-kinase and mTOR signaling in cardiac hypertrophy."
Cardiovasc Res 63(3): 403-13. Rahmim, A. and H. Zaidi (2008). "PET versus SPECT: strengths, limitations and
challenges." Nucl Med Commun 29(3): 193-207. Ramirez, M. T., V. P. Sah, X. L. Zhao, J. J. Hunter, K. R. Chien and J. H. Brown (1997).
"The MEKK-JNK pathway is stimulated by alpha1-adrenergic receptor and ras activation and is associated with in vitro and in vivo cardiac hypertrophy." J Biol
Chem 272(22): 14057-61. Ramos, K. and D. Acosta (1983). "Prevention by L(-) ascorbic acid of isoproterenol-
induced cardiotoxicity in primary cultures of rat myocytes." Toxicology 26(1): 81-90.
Ramos, K., A. B. Combs and D. Acosta (1983). "Cytotoxicity of isoproterenol to cultured heart cells: effects of antioxidants on modifying membrane damage." Toxicol Appl
Pharmacol 70(2): 317-23. Ribeiro, D. A., J. B. Buttros, C. T. Oshima, C. T. Bergamaschi and R. R. Campos (2009).
"Ascorbic acid prevents acute myocardial infarction induced by isoproterenol in rats: role of inducible nitric oxide synthase production." J Mol Histol 40(2): 99-
105. Riento, K. and A. J. Ridley (2003). "Rocks: multifunctional kinases in cell behaviour."
Nat Rev Mol Cell Biol 4(6): 446-56. Rock, K. L. and H. Kono (2008). "The inflammatory response to cell death." Annu Rev
Pathol 3: 99-126.
80
Rohde, J., J. Heitman and M. E. Cardenas (2001). "The TOR kinases link nutrient sensing
to cell growth." J Biol Chem 276(13): 9583-6. Rohini, A., N. Agrawal, C. N. Koyani and R. Singh (2010). "Molecular targets and
regulators of cardiac hypertrophy." Pharmacol Res 61(4): 269-80. Sasaki, Y., M. Suzuki and H. Hidaka (2002). "The novel and specific Rho-kinase
inhibitor (S)-(+)-2-methyl-1-[(4-methyl-5-isoquinoline)sulfonyl]-homopiperazine as a probing molecule for Rho-kinase-involved pathway." Pharmacol Ther 93(2-
3): 225-32. Sato, M., E. Tani, H. Fujikawa and K. Kaibuchi (2000). "Involvement of Rho-kinase-
mediated phosphorylation of myosin light chain in enhancement of cerebral vasospasm." Circ Res 87(3): 195-200.
Satoh, S., T. Utsunomiya, K. Tsurui, T. Kobayashi, I. Ikegaki, Y. Sasaki and T. Asano (2001). "Pharmacological profile of hydroxy fasudil as a selective rho kinase
inhibitor on ischemic brain damage." Life Sci 69(12): 1441-53. Schlossarek, S., G. Mearini and L. Carrier (2011). "Cardiac myosin-binding protein C in
hypertrophic cardiomyopathy: mechanisms and therapeutic opportunities." J Mol Cell Cardiol 50(4): 613-20.
Shi, J., Y. W. Zhang, Y. Yang, L. Zhang and L. Wei (2010). "ROCK1 plays an essential role in the transition from cardiac hypertrophy to failure in mice." J Mol Cell
Cardiol 49(5): 819-28. Shimokawa, H., K. Hiramori, H. Iinuma, S. Hosoda, H. Kishida, H. Osada, T. Katagiri,
K. Yamauchi, Y. Yui, T. Minamino, M. Nakashima and K. Kato (2002). "Anti-anginal effect of fasudil, a Rho-kinase inhibitor, in patients with stable effort
angina: a multicenter study." J Cardiovasc Pharmacol 40(5): 751-61. Shimokawa, H., M. Seto, N. Katsumata, M. Amano, T. Kozai, T. Yamawaki, K. Kuwata,
T. Kandabashi, K. Egashira, I. Ikegaki, T. Asano, K. Kaibuchi and A. Takeshita (1999). "Rho-kinase-mediated pathway induces enhanced myosin light chain
phosphorylations in a swine model of coronary artery spasm." Cardiovasc Res 43(4): 1029-39.
Shimokawa, H. and A. Takeshita (2005). "Rho-kinase is an important therapeutic target in cardiovascular medicine." Arterioscler Thromb Vasc Biol 25(9): 1767-75.
Shioi, T., J. R. McMullen, O. Tarnavski, K. Converso, M. C. Sherwood, W. J. Manning and S. Izumo (2003). "Rapamycin attenuates load-induced cardiac hypertrophy in
mice." Circulation 107(12): 1664-70. Simpson, P. (1983). "Norepinephrine-stimulated hypertrophy of cultured rat myocardial
cells is an alpha 1 adrenergic response." J Clin Invest 72(2): 732-8. Singh, M., M. Roginskaya, S. Dalal, B. Menon, E. Kaverina, M. O. Boluyt and K. Singh
(2010). "Extracellular ubiquitin inhibits beta-AR-stimulated apoptosis in cardiac myocytes: role of GSK-3beta and mitochondrial pathways." Cardiovasc Res
86(1): 20-8. Smith, T. F., C. Gaitatzes, K. Saxena and E. J. Neer (1999). "The WD repeat: a common
architecture for diverse functions." Trends Biochem Sci 24(5): 181-5. Somlyo, A. P. and A. V. Somlyo (2000). "Signal transduction by G-proteins, rho-kinase
and protein phosphatase to smooth muscle and non-muscle myosin II." J Physiol 522 Pt 2: 177-85.
Sordella, R., M. Classon, K. Q. Hu, S. F. Matheson, M. R. Brouns, B. Fine, L. Zhang, H. Takami, Y. Yamada and J. Settleman (2002). "Modulation of CREB activity by
81
the Rho GTPase regulates cell and organism size during mouse embryonic
development." Dev Cell 2(5): 553-65. Sprang, S. R. (1997). "G protein mechanisms: insights from structural analysis." Annu
Rev Biochem 66: 639-78. Sumi, T., K. Matsumoto and T. Nakamura (2001). "Specific activation of LIM kinase 2
via phosphorylation of threonine 505 by ROCK, a Rho-dependent protein kinase." J Biol Chem 276(1): 670-6.
Takemoto, M., J. Sun, J. Hiroki, H. Shimokawa and J. K. Liao (2002). "Rho-kinase mediates hypoxia-induced downregulation of endothelial nitric oxide synthase."
Circulation 106(1): 57-62. Tamura, M., H. Nakao, H. Yoshizaki, M. Shiratsuchi, H. Shigyo, H. Yamada, T. Ozawa,
J. Totsuka and H. Hidaka (2005). "Development of specific Rho-kinase inhibitors and their clinical application." Biochim Biophys Acta 1754(1-2): 245-52.
Thomas, G. and M. N. Hall (1997). "TOR signalling and control of cell growth." Curr Opin Cell Biol 9(6): 782-7.
Uehata, M., T. Ishizaki, H. Satoh, T. Ono, T. Kawahara, T. Morishita, H. Tamakawa, K. Yamagami, J. Inui, M. Maekawa and S. Narumiya (1997). "Calcium sensitization
of smooth muscle mediated by a Rho-associated protein kinase in hypertension." Nature 389(6654): 990-4.
Unger, T. (2001). "Pharmacology of AT1-receptor blockers." Blood Press Suppl(3): 5-10. Valdivia, A. C., M. Estrada, T. Hadizad, D. J. Stewart, R. S. Beanlands and J. N. Dasilva
(2011). "A fast, simple, and reproducible automated synthesis of [18F]FPyKYNE-c(RGDyK) for αvβ3 receptor positron emission tomography imaging." Journal of
Labelled Compounds and Radiopharmaceuticals(55): 4. Valdivia, A. C., S. Mason, J. Collins, K. R. Buckley, P. Coletta, R. S. Beanlands and J. N.
Dasilva (2010). "Radiosynthesis of N-[(11)C]-methyl-hydroxyfasudil as a new potential PET radiotracer for rho-kinases (ROCKs)." Appl Radiat Isot 68(2): 325-
8. van der Bogt, K. E., A. Y. Sheikh, S. Schrepfer, G. Hoyt, F. Cao, K. J. Ransohoff, R. J.
Swijnenburg, J. Pearl, A. Lee, M. Fischbein, C. H. Contag, R. C. Robbins and J. C. Wu (2008). "Comparison of different adult stem cell types for treatment of
myocardial ischemia." Circulation 118(14 Suppl): S121-9. Wang, L., I. Gout and C. G. Proud (2001). "Cross-talk between the ERK and p70 S6
kinase (S6K) signaling pathways. MEK-dependent activation of S6K2 in cardiomyocytes." J Biol Chem 276(35): 32670-7.
Wang, L., J. G. Seidman and C. E. Seidman (2010). "Narrative review: harnessing molecular genetics for the diagnosis and management of hypertrophic
cardiomyopathy." Ann Intern Med 152(8): 513-20, W181. Wang, N., P. Guan, J. P. Zhang, Y. Q. Li, Y. Z. Chang, Z. H. Shi, F. Y. Wang and L. Chu
(2011). "Fasudil hydrochloride hydrate, a Rho-kinase inhibitor, suppresses isoproterenol-induced heart failure in rats via JNK and ERK1/2 pathways." J Cell
Biochem 112(7): 1920-9. Wei, L., W. Roberts, L. Wang, M. Yamada, S. Zhang, Z. Zhao, S. A. Rivkees, R. J.
Schwartz and K. Imanaka-Yoshida (2001). "Rho kinases play an obligatory role in vertebrate embryonic organogenesis." Development 128(15): 2953-62.
Yada, T., H. Shimokawa, O. Hiramatsu, T. Kajita, F. Shigeto, E. Tanaka, Y. Shinozaki, H. Mori, T. Kiyooka, M. Katsura, S. Ohkuma, M. Goto, Y. Ogasawara and F.
82
Kajiya (2005). "Beneficial effect of hydroxyfasudil, a specific Rho-kinase
inhibitor, on ischemia/reperfusion injury in canine coronary microcirculation in vivo." J Am Coll Cardiol 45(4): 599-607.
Zhang, G. X., S. Kimura, A. Nishiyama, T. Shokoji, M. Rahman, L. Yao, Y. Nagai, Y. Fujisawa, A. Miyatake and Y. Abe (2005). "Cardiac oxidative stress in acute and
chronic isoproterenol-infused rats." Cardiovasc Res 65(1): 230-8. Zhang, W., N. Yano, M. Deng, Q. Mao, S. K. Shaw and Y. T. Tseng (2011). "beta-
Adrenergic receptor-PI3K signaling crosstalk in mouse heart: elucidation of immediate downstream signaling cascades." PLoS One 6(10): e26581.
Zhang, Y., M. Ruel, R. S. Beanlands, R. A. deKemp, E. J. Suuronen and J. N. DaSilva (2008). "Tracking stem cell therapy in the myocardium: applications of positron
emission tomography." Curr Pharm Des 14(36): 3835-53. Zheng, M., R. Hou, Q. Han and R. P. Xiao (2004). "Different regulation of ERK1/2
activation by beta-adrenergic receptor subtypes in adult mouse cardiomyocytes." Heart Lung Circ 13(2): 179-83.
Zou, Y., I. Komuro, T. Yamazaki, S. Kudoh, H. Uozumi, T. Kadowaki and Y. Yazaki (1999). "Both Gs and Gi proteins are critically involved in isoproterenol-induced
cardiomyocyte hypertrophy." J Biol Chem 274(14): 9760-70.