Embed Size (px)
Citation preview

ABSTRACT
Title of Thesis: CHARACTERIZING CIGARETTE LIGHTER FLAMES TO
REDUCE UNWANTED IGNITION
Justin Wade Williamson, Master of Sciences, 2003
Thesis Directed By: Professor André W. Marshall
Department of Fire Protection Engineering
This investigation provides detailed measurements and analysis for improved
understanding of ignition from the ‘small’ flames produced by cigarette lighters. This
research program is motivated by the need to improve the fire safety of cigarette
lighters in response to the juvenile firesetter problem. A novel cigarette lighter
concept for improved ignition safety has been developed, characterized, and
compared with conventional lighters. Diagnostics were performed to measure laminar
near-field plume behavior and turbulent far-field behavior in these small-scale (75W)
flames. Plume diagnostics include centerline temperature, heat flux to a horizontal
flat plate, and ignition of filter paper. Data was scaled and compared to plume theory

and measurements. Other practical cigarette lighter performance related properties
were also noted, such as lighter surface temperatures and cigarette ignition
effectiveness.

CHARACTERIZING CIGARETTE LIGHTER FLAMES TO
REDUCE UNWANTED IGNITION
by
Justin Wade Williamson
Thesis submitted to the Faculty of the Graduate School of the University of Maryland, College Park in partial fulfillment
of the requirements for the degree Master of Science
2003
Advisory Committee: Professor André W. Marshall, Chair Professor James G. Quintiere Professor Arnaud Trouvé

©Copyright by
Justin Wade Williamson
2003

ii
Acknowledgments
First I would like to thank Mr. Frank McGarry of the National Association of
State Fire Marshals (NASFM) for providing funding for this study and for motivating
me to produce results. I would also like to thank Ms Marjorie Armacost for her
constructive criticism and complete support concerning the completion of this study.
I would also like to thank all of the members of the Fire Flow research group and all
of the students from the Fire Engineering and Thermal Sciences Laboratory. They
have provided me with a friendly and supportive working environment, as well as
plenty of constructive feedback and suggestions. I would also like to thank Mr. Steve
Hill of the Bureau of Alcohol, Tobacco, and Firearms (ATF) for the use of equipment
critical to the success of this research. I also wish to acknowledge Professor Jim
Qunitiere for his useful suggestions and productive discussions. Finally, I would like
to thank Professor André W. Marshall for his infinite patience and willingness to
assist in any way possible with the success of this project.

iii
Table of Contents
List of Tables................................................................................................................. v List of Figures .............................................................................................................. vi Chapter 1: Introduction ................................................................................................. 1 1.1 Overview ............................................................................................... 1 1.2 Literature Review.................................................................................. 2 1.3 Objectives.............................................................................................. 9 Chapter 2: Experimental Approach............................................................................. 11 2.1 General Methodology.......................................................................... 11 2.1.1 Nozzle Designations................................................................ 11 2.1.1.1 Diffusion Lighter............................................. 11 2.1.1.2 Premixed1 Lighter........................................... 14 2.1.1.3 Premixed2 Lighter........................................... 16 2.1.1.4 Prototype Lighter............................................. 18 2.1.2 Key Operation Parameters ...................................................... 22 2.2 Experimental Apparatus...................................................................... 23 2.2.1 Flow Calibration...................................................................... 25 2.2.2 Stability and Alignment .......................................................... 26 2.3 Diagnostics .......................................................................................... 26 2.3.1 Temperature and Transition to Turbulence............................. 27 2.3.2 Heat Flux to a Horizontal Flat Plate........................................ 29 2.3.3 Ignition of Filter Paper ............................................................ 32 2.4 Summary ............................................................................................. 34 Chapter 3: Results ....................................................................................................... 35 3.1 Characterizing Existing Cigarette Lighters ......................................... 35 3.1.1 Flame Height ........................................................................... 35 3.1.2 Temperature ............................................................................ 36 3.1.3 Heat Flux ................................................................................. 42 3.1.4 Unwanted Ignition................................................................... 48 3.2 Development and Characterization of Prototype ................................ 51 3.2.1 Prototype Flame Height .......................................................... 53 3.2.2 Prototype Temperature............................................................ 53 3.2.3 Prototype Surface Temperature............................................... 57 3.2.4 Prototype Heat Flux ................................................................ 59 3.2.5 Prototype Unwanted Ignition .................................................. 63 Chapter 4: Conclusions ............................................................................................... 64 4.1 Temperature Measurements ................................................................ 64 4.2 Heat Flux Measurements..................................................................... 65 4.3 Ignition of Filter Paper Measurements................................................ 66 4.4 Overall Prototype Performance........................................................... 67

iv
Appendix A: Illustration of Fuel Orifice................................................................... 69 Appendix B: Proposed Cigarette Lighter Design Utilizing the Prototype Concept................................................................................................ 70 Appendix C: Illustration of the National Instruments Program Diagram used for
High Frequency Temperature Measurements ..................................... 71 Appendix D: Matlab Program for Processing Heat Flux to a Horizontal Flat Plate..................................................................................................... 73 Appendix E: Prototype Surface Temperature Prediction Method............................ 77 Bibliography................................................................................................................ 81

v
List of Tables
1. Key nozzle physical characteristics.................................................................... 21 2. Existing cigarette lighter hazard characteristics................................................. 54 3. Hazard characteristics for all nozzles tested ...................................................... 68

vi
List of Figures 1. Number of fires started by juveniles, Rochester Fire Department, 1985-1993.... 3 2. Percentage of fires started by juveniles resulting in structural damage, injury or
death, Rochester Fire Department, 1985-1993..................................................... 3 3. Percentage of juvenile fires started by matches and lighters, Rochester Fire
Department, 1985-1993........................................................................................ 4 4. Scale drawing of a commercial Diffusion Cigarette Lighter ............................. 13 5. Scale drawing of a commercial Premixed1 Cigarette Lighter ........................... 15 6. Scale drawing of a commercial Premixed2 Cigarette Lighter ........................... 17 7. Scale drawing of the Prototype cigarette nozzle ................................................ 20 8. Nozzles with images of visible flames............................................................... 21 9. Experimental setup............................................................................................. 24 10. Illustration of one side of the water-cooled clamp............................................. 24 11. Flow calibration data.......................................................................................... 25 12. Thermocouple probe design ............................................................................... 29 13. Water-cooling device for the prototype nozzle .................................................. 30 14. Illustration of the radial energy balance of the copper plate .............................. 32 15. Sample IR image with associated best-fit temperature profile .......................... 33 16. Centerline temperature profiles for the three existing cigarette lighter nozzle
designs................................................................................................................ 37
17. Scaling analysis of centerline temperature data compared to data from
McCaffrey .......................................................................................................... 39 18. Scaling analysis of temperature fluctuations...................................................... 42 19. Premixed1 surface temperature performance for 110 s of operation without the
water-cooling clamp........................................................................................... 43

vii
20. Heat flux profiles corresponding to the maximum observed incident heat
flux ..................................................................................................................... 44 21. Stagnation point heat fluxes as a function of height .......................................... 44 22. Scaling analysis of stagnation point heat flux assuming laminar flow and
laminar stagnation point theory.......................................................................... 47 23. Sample plume shadowgraphs............................................................................. 48 24. Ignition data for the three existing nozzles ........................................................ 49 25. Ignition data versus stagnation point heat flux data........................................... 50 26. Scaling of ignition data ...................................................................................... 50 27. Centerline temperatures of all tested nozzles..................................................... 55 28. Scaling analysis of all tested nozzles compared to data taken by McCaffrey.... 56 29. Temperature fluctuations of all tested nozzles................................................... 56 30. Legend for Figures 30 to 32 ............................................................................... 60 31. Tube 1 (inner tube) surface temperatures........................................................... 60 32. Tube 2 (middle tube) surface temperatures........................................................ 61 33. Tube 3 (outer tube) surface temperatures........................................................... 61 34. Radial heat flux profiles corresponding to the peak observed stagnation point
heat flux for all nozzles ...................................................................................... 62 35. Stagnation point heat fluxes versus height for all nozzles tested....................... 62

1
Chapter 1: Introduction
1.1 Overview
Small flames, such as those found in candles, matches, cigarette/utility
lighters, and the incipient fire pose a significant fire hazard. These small flames can
release enough thermal energy to cause unwanted ignition and sustain burning. This
investigation focuses on the ignition hazard from small cigarette lighter flames.
Small ignition sources are dangerous and can produce a small fire that can go
unnoticed for a long period of time. Of these small sources, candles are most
commonly recognized as fire hazards. The National Fire Protection Association
(NFPA) recognizes this risk and has published a fact sheet with safety tips for using
candles in the home.1 Other small ignition sources include matches and cigarette
lighters. The NFPA also recognizes the risk from these sources in Hall’s publication,
Children Playing with Fire.2 Cigarette lighter flames produce a high risk of ignition
and also an opportunity for modification, and therefore need special consideration.
Recent efforts for improving lighter safety have centered on developing
mechanical child safety features.3 However, these child safety features do not reduce
the unwanted ignition propensity of the lighter flame. There is a need for detailed
flame characterization of cigarette lighters in order to determine the ignition
propensity of these devices and to develop methods for reducing ignition propensity.
The current standard for improving safety focuses on adding mechanical child safety
features.4 These additional mechanical child safety features do nothing to resolve the
unwanted ignition propensity of the lighter flame. This research focuses on

2
characterizing and modifying the driving force of ignition, the flame, and illustrates
methods that reduce the ignition hazard from that source.
The cigarette lighter safety problem is particularly interesting. Existing
mechanical safety features are cumbersome and are often bypassed by the user in
order to improve ease of use. These “child safety” features are intended to inhibit use
of the lighter by persons who lack the motor skills and understanding to operate the
lighter. Studies conducted by the National Association of State Fire Marshals
(NASFM), such as the Juvenile Firesetter Program, have shown that these features are
insufficient for reducing unwanted ignition by juveniles ages 4 to 16 as shown in
Figures 1 to 3.3 Also, the American Society for Testing and Materials (ASTM)
standard for regulation of cigarette lighters, ASTM F400-00, is qualitative in nature
with respect to unwanted ignition propensity and does not characterize the increased
hazard of many new cigarette lighter designs.4 The NASFM recognizes that there is a
need for detailed thermal characterization of cigarette lighters in order to determine
the ignition propensity and methods for reducing the ignition propensity.
1.2 Literature Review
There is very little previous work characterizing the ignition hazard from
cigarette lighters. However, previous work on the thermal behavior of fire plumes
may be applied to cigarette lighters with appropriate scaling. Many studies have
characterized the gas temperature above a fire source, heat transfer to surfaces above
a fire source, ignition of materials with external heating, and transition to turbulence
in plumes.

3
Figure 1: Number of fires started by juveniles, Rochester Fire Department, 1985-1993.3
Figure 2: Percentage of fires started by juveniles resulting in structural damage, injury or death, Rochester Fire Department, 1985-1993.3
180
160
140
120
100
80
60
40
20
01 2 3 4 5 6 7 8 9 10 11 12 13 14 15 16
Age of Children
2 3 4 56 7 8 9 10 11 12 13 14 15
Age of Children
Structural Damage Structural Damage
100%
0%

4
Figure 3: Percentage of juvenile fires started by matches and lighters, Rochester Fire Department, 1985-1993.3
Temperature profiles are a key thermal characteristic of fire flows as they are
indicative of the heating potential of the flow. Lighter nozzles that produce higher
plume temperatures should correspondingly have a higher risk of ignition than those
with lower temperatures assuming comparable velocities. Morton et al. previously
determined the centerline velocity and temperature distributions in a turbulent plume
issuing from a point source.5 He found that the centerline temperature decay along
the plume axis followed a (-5/3) power law:5
3/53/1
10
9
6
5 −−
∞
∞
=
−zQ
Q
T
TT &&α
α, (1)
where T is the centerline plume temperature, T� is the ambient temperature, Q& is the
energy release rate of the flame, is the plume entrainment coefficient constant
experimentally found to be 0.11, and z is the characteristic height above the source,
based on integral analysis of the turbulent plume equations. McCaffrey measured the
2 3 4 56 7 8 9 10 11 12 13 14 15
Age of Children
100%
0%
Matches Lighters

5
centerline temperature decay along the plume axis above fire sources.6 He found that
the temperature decayed according to the same theoretical power law in the plume
zone sufficiently far from the source. He also identified a flame zone with constant
temperature and an intermittent zone where the temperature decayed inversely with
position along the plume axis. Flows from cigarette lighter flames are rarely
turbulent near the source; therefore it is important to observe the laminar
characteristics and compare them to classical laminar theories for appropriate
analysis. The laminar plume equations were solved by Fujii using similarity
analysis.7 His laminar analysis predicted that centerline temperatures should decay
inversely with position above the plume. The flow generated by cigarette lighters can
be considered a forced flow, especially in cases where the fuel is premixed with air.
Morton has investigated plumes generated by a steady release of mass, momentum
and buoyancy, analytically illustrating the difference between forced plumes and
purely buoyant plumes. The results of his analysis show that forced plumes decay
similarly to a jet in the near field with (-1) power law decay, transitioning to plume
decay in the far field with an offset.7
Transition to turbulence has been studied extensively for vertical plumes.
Determining if and where this turbulence occurs is of great importance to scaling data
in the flows produced by cigarette lighter flames because the flow is initially laminar,
eventually transitioning to turbulence. Krishnamurthy et al. and Jiang et al. have
studied buoyant flows adjacent to a vertical surface using experimental and modeling
approaches respectively.21,22 This geometry is of particular interest for convective
heating of the side wall, as the convective heating coefficient has a strong dependence

6
on the level of turbulence. Bejan and Kimura et al. have studied free buoyant plumes,
and provide a fundamental method for determining the transition to turbulence.23,24
Using the instability analysis prescribed by Kimura et al., a predictor of the transition
to turbulence can be predicted by zt ~ Q-1/2, where zt is the turbulent transition height
and Q is the energy release rate of the flame.24 Similarly, a critical Rayleigh number
approach,
Raq = 102
10)(
≤∞Tk
Qgz
air
tr
αν
&, (2)
where g is the gravitational constant, ztr is the height for transition to turbulence, and
( k)air are the thermal diffusivity, kinematic viscosity, and conductivity of air
respectively, can be used as described by Bejan.23
Heat transfer to horizontal surfaces above large fire sources has also been
studied extensively. This configuration has been used for studying heat loading on
ceilings and other objects above fires. Heat transfer to the horizontal surface results
from plume impingement and the formation of a wall jet traveling radially outward
below the horizontal surface. In this study, this heat flux was used as a metric for
ignition propensity of the source. Alpert determined an analytical solution from
integral analysis for ceiling jet temperatures, velocities, and jet thicknesses.9 He was
able to determine a local heat flux to the ceiling from the theory that he developed for
ceiling jets. He found a dimensionless heat flux:
QHq &/" 2=ξ , (3)
where "q is the incident heat flux, and H is the ceiling height, from his turbulent heat
transfer analysis.9 Veldman et al. and Faeth et al. conducted experiments for ceiling

7
jet heat transfer.10,11 They found significant scatter in the heat flux data with only
limited agreement with the Alpert’s ceiling jet theory. They attributed the scatter to
other phenomena that may be important to the ceiling heat transfer including radiation
effects. Chow and Motevalli have performed numerical studies of the ceiling jet to
characterize the velocity and temperature profile of the flow as a function of the
radius.12,13 These profiles are useful for calculating heat flux to the ceiling surface,
however, the studies do not evaluate the steady state solution for a thermally thin
ceiling. The thermally thin ceiling case is of great importance to the technique used
in this study because the temperature of the surface was determined by Infra Red
imaging of the back-side of the ceiling at the steady state condition. This is discussed
in detail in 2.3.2. Motevalli et al. has investigated the small scale steady state case.
His study illustrates that there is negligible difference between the transient and the
steady state ceiling jet flow; however, it does not characterize heat transfer to the
ceiling.14 This study will develop a method to calculate total heat transfer to the
ceiling without characterizing the fluid flow.
The ability of a cigarette lighter to ignite thin materials is of particular interest
in determining the devices safety performance. This study focuses on the ignition of
thermally thin flat materials oriented in the horizontal ‘ceiling’ configuration.
Unfortunately, much of the ignition research conducted is focused on the thermally
thick or semi-infinite solid assumption. Relatively little work has been done with
thermally thin solids. This configuration is identical to the heat flux measurement
configuration and the heat flux results are directly correlated with the ignition tests.
This comparison will help to determine if the heat flux measurements alone are in fact

8
indicative of ignition propensity. Drysdale has discussed the theory behind ignition
of thermally thin slabs based on the solution of the differential one-dimensional heat
conduction equation, showing that regardless of the mode of heat transfer, ignition
time is directly proportional to the thermal capacity per unit area (τρc) where τ is the
thickness, ρ is the density and c is the specific heat of the ignition material.15 Studies
performed by Zhou et al., Thomson et al., Atreya et al., and Moghtaderi et al. discuss
methods for determining critical heat fluxes and temperatures for ignition of various
materials under several different heating conditions. These studies used piloted
ignition and thermally thick materials.16,17,18,19 However, the energy balance method
used is quite similar to the method used in the current investigation for thermally thin
solids:
θθτρ cht
cq +¶¶=" , (4)
where hc is the convective cooling rate of the far side due to natural convection, and
∞−= TTigθ such that Tig is the ignition temperature of the solid.15 Nelson et al.
performed a study of thermally thin solids in the cone calorimeter illustrating that the
critical heat flux can be determined graphically by from 1/tig versus the incident heat
flux, q ′′& , where tig is the time to ignition.20 We will use a similar technique in this
study using cigarette lighter flames as the heat source. Ignition testing of different
cigarette lighters will illustrate that each lighter has the propensity to ignite a specific
material within a region of the plume where the energy transfer is sufficient, and it
will illustrate that modifications can be made to the nozzle geometry that can reduce
this region of ignition.

9
1.3 Objectives
The objectives of this study are to characterize ignition propensity of cigarette
lighters, and to create a concept that will demonstrate an improvement in unwanted
ignition propensity from a cigarette lighter without adding mechanical child safety
features. A method was developed to characterize the ignition propensity of cigarette
lighters. The ignition propensity of three existing cigarette lighters were characterized
using this methodology, followed by an evaluation of one prototype design using the
same methodology. Three characteristic parameters that describe ignition propensity
were evaluated:
• centerline temperature profiles while noting transition to turbulence,
• heat flux profiles to a horizontal flat plate ,
• and ignition of filter paper.
Each of these characteristics was determined experimentally such that a comparison
of the unwanted ignition propensity of the three existing designs and the prototype
design can be made.
The prototype design was fabricated based on characteristics of the three
existing lighters. Some of the characteristics of the three existing lighters
demonstrate improved unwanted ignition propensity or a need for improvement.
These characteristics were observed, and then utilized in the prototype concept.
There is a large opportunity for modification of cigarette lighters because they can be
designed based on simple geometry and the low ignition energy requirements of
cigarettes. These properties allow for a simple design that will provide local heating
to the cigarette and reduced heating to other objects. A simple flame recession was

10
introduced to achieve this. The recession was designed according to the geometry of
the cigarette such that only objects of similar geometry or objects smaller than a
cigarette could be inserted into the recession. The recession acts as a medium to
absorb energy from the flame while increasing the distance between the flame source
and the exit of the hot gasses. Compared to an open flame, this prototype has a
hidden flame that is less enticing to curious children, and has significantly improved
exit gas properties. Design modifications will be discussed in more detail in the
approach section. The prototype lighter characterization measurements demonstrated
that unwanted ignition propensity could be improved without the addition of
mechanical child safety features.

11
Chapter 2: Experimental Approach
2.1 General Methodology
In order to create a set of controlled experiments that would accurately and
consistently compare different cigarette lighter designs, important operation
parameters were determined and a system was created that could control those
parameters for every case. The methodology for testing was based on characterizing
different types of cigarette lighter nozzles. The experiment was designed in order to
keep certain parameters constant while evaluating the effects of varying nozzles on
ignition propensity.
2.1.1 Lighter Nozzle Designations
Changes in flame behavior were evaluated while varying the nozzle type and
or burner geometry. All data are illustrated using the designations listed below.
Using this methodology, flow structures, heat fluxes, plume centerline temperatures
and ignition propensity were measured for each flame configuration. The
configurations are designated as Diffusion, Premixed1, Premixed2 and Prototype
depending on the burner type. Illustrations of these lighters are provided in Figures
4-7.
2.1.1.1 Diffusion Lighter
For the Diffusion lighter, a standard port-type nozzle is used to produce a
candle like flame that is widely recognized. Cigarette lighters with port-type nozzles
can be easily obtained from any store where cigarettes are purchased. A scale

12
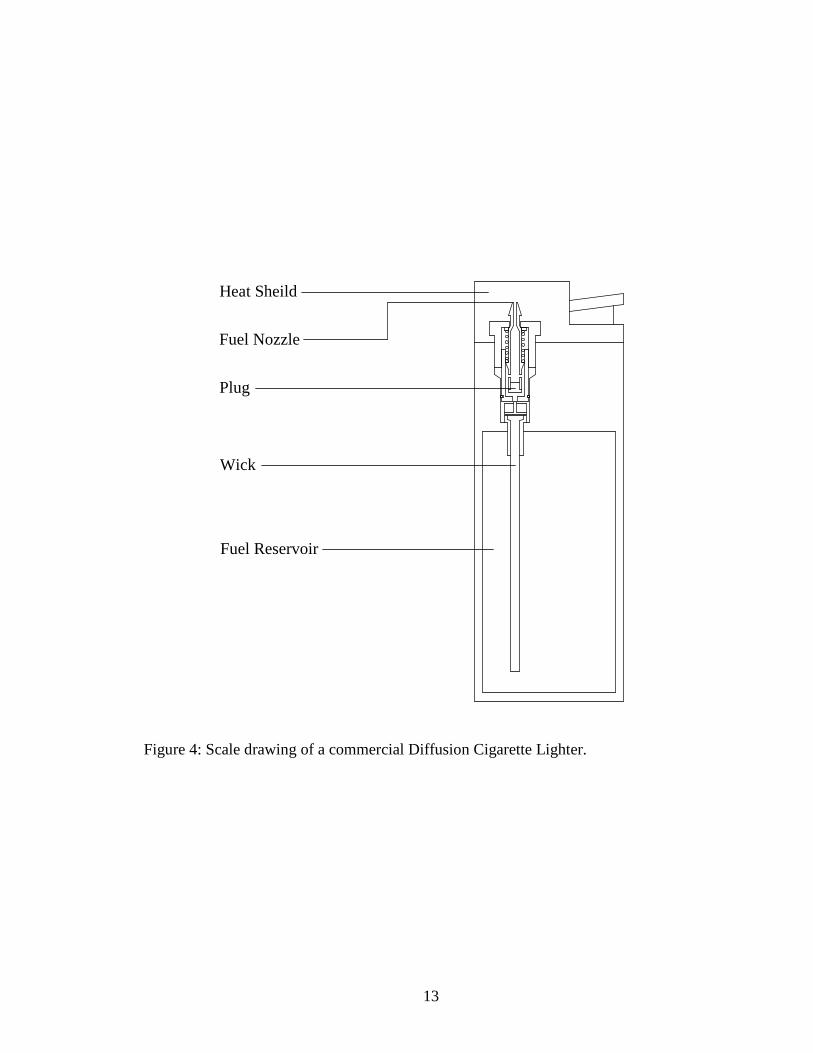
drawing detailing the fuel system of the commercial design is illustrated in Figure 4.
In this case, the fuel is directly injected through a 0.5 mm diameter opening into the
ambient air where is begins to mix diffusely. The fuel is ignited using a spark that
allows for steady, sustained burning of the fuel. The reaction zone only occurs at the
fuel-air interface as determined by diffusion. The orange/yellow color as seen in
Figure 8 is attributed to heated carbon particles in the flow formed by decomposition,
or pyrolysis, of the fuel prior to burning. For testing of this nozzle, the fuel pathway
was modified slightly from its original configuration. In the commercial design, the
default fuel pathway is closed by a simple plug, as labeled in Figure 4, forced closed
by a spring. Removal of the plug made the default pathway open without
significantly changing the fuel injector geometry. The heat shield was also removed
for testing purposes because of its weak structural significance and negligible impact
on flame behavior. The flame does not exist within the flame shield in the actual
design because no air can be entrained through the shield. Therefore, this
modification had no impact on the flame behavior. Details of some design
characteristics are listed in Table 1.
13
Plug
Wick
Fuel Reservoir
Heat Sheild
Fuel Nozzle
Figure 4: Scale drawing of a commercial Diffusion Cigarette Lighter.

14
2.1.1.2 Premixed1 Lighter
The Premixed1 lighter uses a novelty Bunsen burner type nozzle, which is
widely available at specialty stores and online. A scale drawing of the commercial
design focusing on the fuel flow system is illustrated in Figure 5. This nozzle
produces a blue flame due to fuel air mixing prior to combustion. The fuel is injected
through a 70 µm orifice, as shown in Appendix A, to produce a high velocity jet.
This jet is injected through a vented chamber where it entrains air prior to
combustion. The fuel air mixture is then injected into a small combustion chamber of
depth δlight = 6 mm, where it is ignited by a piezoelectric spark device. A simple wire
mesh, or flame stabilizer, encloses the combustion chamber to provide limited
stability of the flame in windy conditions. Some of the fuel reacts in this chamber
and the remainder of the unburned fuel and air pass through the flame stabilizer prior
to its combustion. The mixing nozzle, combustion chamber, and the part of the flame
that exists outside of the chamber are illustrated in Figure 8. Since this nozzle
produces a combustible fuel air mixture, the reaction zone occurs evenly at all
locations in the flame, not only at the outer edge of the flame, but along the centerline
as well. This uniform combustion zone produces a blue flame because little soot is
formed, reducing its luminosity. Details of some design characteristics are listed in
Table 1. No design modifications were made to the burner geometry in the
experimental configuration.

15
Flame Stabilizer
Combustion Chamber
Vented Chamber
Orifice
Fuel Metering
Fuel Reservoir
Figure 5: Scale drawing of a commercial Premixed1 Cigarette Lighter.

16
2.1.1.3 Premixed2 Lighter
The Premixed2 lighter also uses a novelty Bunsen burner type. This lighter is
also widely available at specialty stores and online. A scale drawing of the
commercial design focusing on the fuel flow system is illustrated in Figure 6. The
lighter produces a blue flame due to fuel air mixing prior to combustion. The fuel is
injected through a 70 µm orifice to produce a high velocity jet. This jet is injected
through a vented chamber where it entrains air prior to combustion, similar to
Premixed1. The fuel air mixture is then injected into a small combustion chamber of
depth δlight = 3 mm, where it is ignited by a piezoelectric spark device. This lighter
does not use a flame stabilizer as described in Premixed1, and much of the
combustion occurs outside of the chamber as illustrated in Figure 8. The geometry of
the nozzle results in a different flame compared to Premixed1. These differences
become apparent in the results. Details of the design characteristics are listed in
Table 1. No design modifications were made to the nozzle or burner geometry in the
test configuration.

17
Combustion Chamber
Vented Chamber
Orifice
Fuel Metering
Fuel Reservoir
Figure 6: Scale drawing of a commercial Premixed2 Cigarette Lighter.

18
2.1.1.4 Prototype Lighter
This lighter was developed based on characteristics of the previous three
nozzles that demonstrated improved unwanted ignition propensity or a need for
improvement. This design utilizes the same nozzle used by Premixed1; however, the
combustion chamber is different. The combustion chamber consists of three
concentric, vented stainless steel tubes linked together using setscrews, and a wire
mesh flame stabilizer as illustrated in Figure 7. Vented tubes (offset vents, 3.2 mm
diameter on Tube 1 and Tube 2 and 4.8 mm diameter on Tube 3, spaced at 3.2 mm on
center and at 60 degree intervals) were required to reduce velocities within the tube
for flame stabilization. When the tubes were not vented, the flame propagated rapidly
away from the point of ignition, rapidly expelling burning gasses out the end of the
tube followed by flame extinction. By introducing vented tubes, the flame speed was
reduced significantly resulting in a stable flame. This flame is completely contained
within the combustion chamber leaving no visible combustion, as illustrated in Figure
8. The inner tube was designed to accommodate the outside diameter (8 mm) and
length (83 mm) of a standard filtered cigarette. The inner tube acts as a heat sink that
absorbs a portion of energy produced by the flame. In the previous cases, all of the
energy released by the flame was convected away by the hot gasses in the plume. In
this case, some of the energy is conducted away by the steel tube and the remaining
energy is convected away by the hot gasses. The principle behind this design is that
when the energy capacity of the hot gasses is reduced, the ignition propensity of those
hot gasses will also be reduced. The energy conducted away by the inner tube is
gradually released by natural convection and radiation to the outer two tubes. The

19
three-tube configuration was observed based on qualitative observations of surface
temperature of the outer tube. In the two-tube configuration, the surface temperature
of the outer tube increased to the threshold of pain much more rapidly than in the
three-tube configuration. This performance characteristic led to fabrication of a
simple model. This model predicts surface temperatures of the prototype based on
inputs defined by the user. The user can modify inputs in order to predict the design
with the best performance. The model is a one-dimensional heat transfer model with
two zones for each tube. The lower zone is the region below the flame stabilizer and
the upper zone is the region above the flame stabilizer. The two zones communicate
through a simple conduction assumption. Energy is transferred between the tubes by
convection and radiation using equations and methods described by Incropera.26
Surface temperatures of each tube are calculated iteratively to simulate non-transient
heat transfer. Inputs and equations used in the model will be explained in greater
detail in the results. Some geometric design characteristics of the Prototype are listed
in Table 1. A proposed cigarette lighter design utilizing the Prototype concept is
illustrated in Appendix B.

20
Inner Tube (Tube 1)
Middle Tube (Tube 2)
Outer Tube (Tube 3)
Flame Stabilizer
Combustion Chamber
See Premixed2
All Tubes are Vented Similarly
Figure 7: Scale drawing of the Prototype cigarette nozzle.

21
Diffusion Premixed1
Fuel
Fuel
Air Air
Fuel
Premixed2
AirFuel
Prototype
Figure 8: Nozzles with corresponding images of visible flames height above the exit plane, h, height above the source, z, and height of the combustion chamber, δlight, are illustrated graphically. No flame is visible in the Prototype.
Table 1: Key nozzle physical characteristics
Lighter Designation
Burner Type
Flame Stabilizer
Recession Depth,
δlight (mm)
Fuel Injection Diameter (mm)
Diffusion Port No 0 .5
Premixed1 Bunsen Yes 6 .07
Premixed2 Bunsen No 3 .07
Prototype Bunsen Yes 80 .07
δlight
h
z
probe

22
2.1.2 Key Operation Parameters
The key parameters that remained constant during testing were the energy
release rate of the flame, fuel type, and the vertical orientation of the lighter flame.
The vertical orientation was necessary in order to accurately sample data at the
centerline of the plume at all heights. Butane fuel was selected because it is the
consensus fuel type for, adjustable, refillable, gas cigarette lighters. Liquid fuel
lighters, such as Zippo® lighters, were not examined because the flame is considered
to behave similarly to the standard butane diffusion lighter. The selected energy
release rate of the flame was determined through qualitative analysis of ASTM F400-
00 from flame height requirements for diffusion lighters, and the characteristic flow
limitations of the actual cigarette lighters as they were purchased commercially. The
ASTM standard dictates that the maximum flame height of adjustable diffusion
lighters is 120 mm at the highest flow setting, and 75 mm for premixed lighters.4
Preliminary qualitative testing, using the commercial designs, showed flow rates from
Premixed1 and Premixed2 had mass flow rate upper limits of 1.6 × 10⁻⁶ kg/s and 1.8
× 10-6 kg/s, with corresponding flame heights of 20 mm and 15 mm respectively,
while the diffusion lighter had no apparent limiting flow rate. All three of the lighters
complied with ASTM F400-00, however the diffusion lighter could easily be
modified to produce a non-compliant flame. Based on this information, 1.5 × 10⁻⁶
kg/s was an achievable and characteristic fuel mass flow rate for each of the selected
lighter designs, corresponding to an energy release rate of 75 Watts using Equation
(5) (Section 2.2.1). The flame heights associated with this energy release rate are 20
23
mm, 10 mm, and 15 mm for Diffusion, Premixed1 and Premixed2 respectively. This
setting is well within the requirements prescribed by ASTM F400-00.
2.2 Experimental Apparatus
The test facility as illustrated in Figure 9, was designed to produce a constant
energy release rate while varying the cigarette lighter nozzle type. In order to achieve
these characteristics, materials and processes were used that would allow for precise
measurements in a small sampling region. To ensure constant energy release rate, the
mass flow rate of the fuel must be constant and reproducible. The fuel was gaseous
butane stored as a saturated liquid in a small pressure vessel. A pressure regulator
was used to ensure that the fuel was supplied at a constant pressure of 69 kPa. A
precision metering valve with a Vernier scale (+/- 0.01 turns with 2 turns from open
to closed) was used to control the flow rate. The pressure regulator and metering
valve were designed to mimic the pressure drop achieved internally by the portable
designs available in commercial cigarette lighters. In preliminary testing, the fuel
nozzles had a tendency to increase in temperature with time. As the temperature of
the nozzle increased, thermal expansion caused a variation in the diameter of the
orifice in Premixed1 and Premixed2. The diameter of the orifice has a significant
effect on the mass flow rate of the fuel, therefore the temperature of the nozzle must
be maintained near room temperature to reduce the variation of the mass flow rate
with time. A water-cooled clamp was introduced to maintain the nozzle at a constant
temperature, and for mechanical stability, as illustrated in Figure 10.

24
AGEMA500 Infrared Camera
Copper Plate (.8 mm thick, soot coating)
Type R Thermocouple (50 microns)
Water Out
BurnerFine MeteringValve
Water In
Butane FuelCanister
PressureReg.
(69kPa)
IsolationValve
IsolationValve
IsolationValve
CooledClamp
5B40-05 SignalConditioner
Data AcquisitionComputer
Figure 9: Experimental setup: diagnostic systems (top) and fuel system (bottom).
.75
1132
" DIA
14
" DIA
2"
1"
12
"
.40
38
"
4"
Figure 10: Illustration of one side of the water-cooled clamp. Water is circulated length-wise through both sides of the clamp to achieve cooling.

25
2.2.1 Flow Calibration
With the aforementioned flow metering features in place, flow calibrations
were performed for each lighter nozzle tested. Prior to each test, the mass of the fuel
vessel was measured with a high-accuracy mass scale (+/- 10-4 grams). The nozzle
was then operated for a long period of time measured with a stopwatch from the
opening of the fuel flow to the closure of the fuel flow. During the test, the flame was
observed to ensure that there were no significant variations in size, shape or color,
which would indicate a change in the energy release rate of the flame. After each
test, the mass of the fuel vessel was measured again and the mass flow rate was
determined from the mass loss and the time of operation by a simple calculation:
t
mhmhQ cc ∆
∆∆=∆= && , (5)
Valve Position
Mas
sF
low
Rat
e,m
(kg/
s)
4 6 8 10 124E-07
8E-07
1.2E-06
1.6E-06
2E-06
Figure 11: Flow calibration data where the dashed line indicates the desired mass flow rate associated with 75 W, the Prototype is the same as Premixed2. - Diffusion, -Premixed1, -Premixed2.

26
Where ∆hc = 45,690kJ/kg for butane. The test was performed at different settings of
the fine metering valve until the setting that produced the mass flow rate
corresponding to 75 Watts was obtained. Calibration results are illustrated in Figure
11. The valve settings were different for the various nozzle types because of different
internal restrictions and the associated pressure drops for each nozzle.
2.2.2 Stability and Alignment
Once the flow system was established, a system was constructed to mount
diagnostics above the source such that they would measure centerline characteristics
of the plume at any height. A vertically mounted Velmex A1509K1M-S1.5 Vernier
scale traverse mounting system was selected, with an accuracy of +/- 10-4 m, such that
it could be easily connected to any diagnostic device. The traverse was aligned with a
plum line, and careful attention was given to ensure that the fuel nozzle was also
vertically aligned. Alignment was evaluated by determining the position of the
centerline of the plume at multiple heights by imaging a horizontal flat copper plate
with an IR camera as described in Section 2.3.2. When the location of the centerline
was the same at all heights, the nozzle was perfectly aligned. In order to achieve
stability in alignment, a double enclosure was built around the test facility to limit
ambient instabilities.
2.3 Diagnostics
There were three main diagnostics used to evaluate the ignition propensities of
the nozzles. Diagnostic tools were designed that would measure centerline plume

27
temperature, heat flux to a horizontal flat plate, and ignition propensity of a selected
material. These diagnostics produce highly accurate results in a small-scale flame,
such that the data taken could be compared to existing data from larger scale fire
tests.
2.3.1 Temperature and Transition to Turbulence
The temperature diagnostics consisted of a type-R micro-thermocouple
connected to a signal conditioner and read by a data acquisition computer. A small
micro-thermocouple (50 µm diameter) was selected because it produced the accuracy
desired for temperature measurements. It was less likely to disturb the plume than a
larger thermocouple, and the probe was designed to be unobtrusive to the flow, as
illustrated in Figure 12.27 It had a low time response of 27 ms for accurate
measurement of the turbulent fluctuations that occur below 37 Hz. A sampling rate
of 100 Hz was selected to fully characterize the response of the thermocouple. Power
spectra analysis showed that very little power occurred at frequencies higher than 37
Hz, illustrating that the thermocouple accurately represents the instantaneous gas
temperature along the centerline of the plume. Another benefit of a smaller
thermocouple is the reduced affect of radiative losses however; the data was corrected
for radiation by calculating the energy balance to the thermocouple bead using the
following equation:15
tctcc
TTTh
T +−= ∞ )( 44σε, (6)

28
Where T is the corrected thermocouple temperature, σ is the Stefan Boltzman
constant, 1.0=ε for platinum, Ttc is the recorded thermocouple temperature, and hc is
determined by heat transfer correlations from Incropera et al.:26
5/23/22/1 Pr)Re06.0Re4.0(2 ++==air
cd k
dhNu , (7)
Where d is the diameter of the thermocouple bead, Pr = .68 for air and the Reynolds
number is:
air
ud
ν=Re , (8)
Where airν is the kinematic viscosity of air, and uis the velocity of the plume as
correlated by Morton et al.:5
3/1
9.3
=
∞ zcT
Qgu
p
&, (9)
Where cp is the specific heat of air, and z is the height above the source. The
thermocouple was connected to a National Instruments (NI) 5B40-05 signal
conditioner, which magnified the signal from the device and simultaneously filtered
the background electrical noise measured, improving the signal-to-noise ratio. The
signal conditioner was connected to the data acquisition computer via a NI PCI-MIO-
16XE-50 board, which converted the signal to digital data using NI Lab View
software program (Appendix C), specialized for high frequency thermocouple
measurements. Centerline temperatures were calculated as the time average (mean)
value of the sampling period of 100 s to 300 s, increasing with height. Average
temperature measurement is based on a steady state combustion condition.
Temperature standard deviation was also calculated and used as an indicator for

29
transition to turbulence. In the case of the Prototype nozzle, the steady state condition
occurred after a long period of operation when all three tubes reached a steady state
temperature. This dictates that the prototype nozzle be thermally isolated from the
tubes to ensure that its temperature remains constant, because the flow calibrations
rely on maintaining a room temperature nozzle. Regulation of the nozzle temperature
was achieved using a water-circulating micro-cooling device that mounted the nozzle
to Tube 1, as illustrated in Figure 13.
2.3.2 Heat Flux to a Horizontal Flat Plate
The heat flux diagnostics consisted of an Infra Red (IR) Camera (Agema 550)
connected to a data acquisition computer using a frame grabber program. The camera
imaged a thin flat copper plate (30.5 cm × 28 cm × 0.08 cm), uniformly coated with a
thin film of soot to ensure a constant and known surface emissivity (ε = 0.95), held
horizontally in the plume. Copper was selected for its high thermal conductivity to
ensure a nearly uniform temperature over the thickness of the plate. The plate was
imaged at 10 Hz for 30 seconds. The digital thermal images provide high-resolution
Figure 12: Thermocouple probe design.27
Ceramic Insulation
Probe Supports
Modified Jack
10 mm
125 mm
Pt / Pt-13%Rh (dw = 50 µm)
Support Adjustment

30
Water out
Threaded to fit nozzle
Water in
Side View
Top View
Figure 13: Water-cooling device for the prototype nozzle.
temperature data from 0.6 mm/pixel to 0.8 mm/pixel, depending on the field of view
with an image size of 240 × 320 pixels. The images were then time and spatially
averaged (mean), assuming that the flow is axis-symmetric. From the average data,
the location of the peak temperature of the plate was determined. Temperatures were
recorded outwardly from that point in the positive and negative x and y directions.
These four temperatures were again averaged and used as the temperature data for
each sampling height. The temperature data were reduced to a best-fit function
similar in form to the equation used by Veldman et al.:10
1)(
74
6
542
33
24
1
++++++=
RCRC
CRCRCRCRCRT , (10)
where R = r2 as illustrated in Figure 15. The processed temperatures were then
analyzed with a numerical Matlab code illustrated in Appendix D, that solved for the
heat flux to the plate at a radial position, using an energy balance method described
by Zukoski:25
outradoutconvoutnetcondin qqqq ,,, &&&& ++= , (11)

31
A graphical representation of this energy balance model is illustrated in Figure 14.
Application of Newton’s law of cooling, Fourier’s law, and the Stefan-Boltzmann
law yields:
( ) ( )44
2
2
2 ambpambppp
in TTTThr
Tr
r
T
r
ktq −+−+
¶¶
+
¶−=′′ εσ& , (12)
Equation (2) is transformed in order to avoid the singularity at r = 0. This singularity
prevents estimation of the stagnation point heat flux. The transformation variable R
= r2 provides:
( ) ( )44
2
2" 24 ambpambp
ppin TTTTh
R
TR
R
Tktq −+−+
¶¶
+¶¶
−= εσ , (13)
where the convective heat transfer coefficient, h, was determined from Incropera:
3/115.0 LL RaNu = , (14)
where L ≡ As /P and RaL is based on an average (mean) plate temperature.26 The
image averaging and best fit were necessary to reduce noise in the data because the
derivative of Equation (9) could be evaluated exactly. The numerical method
developed for evaluating the empirical heat transfer equations, Equation (11), was
very sensitive to low levels of noise in the data, such that reliable numerical
differentiation was impossible. The combination of each of the methods used in this
formulation allowed for very precise calculations of the heat flux with radial position,
even at the stagnation point.

32
Figure 14: Illustration of the radial energy balance of a section of the copper plate.
2.3.3 Ignition of Filter Paper
While the heat flux measurements provided a quantitative basis for assessing
the unwanted ignition risk from the lighters used in this study, the ignition tests
provide context for these measurements. Ignition testing alone however, is not a
good indicator for ignition propensity of actual combustibles. There can be a wide
range of ignition performance from material to material in actual use, and it would be
incorrect to assume that the results of ignition data taken with only one combustible
material would be representative of that of all other materials.
Filter paper was selected because of its availability, low expense, thermally
thin characteristics, repeatability, and ease of use. The ignition experiments were
designed such that the filter paper was mounted as horizontal flat plate geometry.
This ensured that the heat flux to the surface was the same as in the case of the heat
(q”cond )in
(q”cond )out
q”conv
q”rad
q”radq"flame
0.8 mm

33
Radius, r (mm)
Tem
pera
ture
ofC
oppe
rPl
ate,
Ts(K
)
0 20 40 60 80310
315
320
325
330
Figure 15: Sample IR image (top) with associated best-fit temperature profile (bottom).
310 K
330 K

34
flux diagnostics. Ignition was determined visually as either the appearance of flame
or smoldering, as indicated by glowing of the filter paper. A stopwatch, starting at
the onset of exposure of the filter paper to the hot gasses and stopping at visual
ignition, measured the time to ignition. This method was repeated three to five times
at each height, and averaged. A critical height was determined from this data as the
maximum height of ignition and given the designation (hig)crit tabulated for each
lighter. This ignition time was then compared to the incident heat flux data to
evaluate a critical ignition heat flux for the filter paper.
2.4 Summary
The experimental approach resulted in very accurate and highly resolved data
for each of the desired thermal characteristics. Such high resolution was needed to
fully characterize the scales associated with cigarette lighter flames. This also
allowed for a detailed comparison of unwanted ignition propensity from each of the
nozzles tested. Data from each of the nozzles were collected and important
performance characteristics were derived from its analysis.

35
Chapter 3: Results
3.1 Characterizing Existing Cigarette Lighters
Three cigarette lighter nozzles were tested in order to characterize the ignition
propensity of existing cigarette lighters. Each lighter is designated as Diffusion,
Premixed1, Premixed2 and Prototype and is illustrated in Figures 4-7. Figure 8
illustrates the visible flames produced by these lighters, as well as an illustration of
the definitions of hand z. Temperature measurements, heat flux measurements and
filter paper ignition measurements were performed to characterize the ignition
propensity of those devices. A comparison of the performance of each of these
lighters will illustrate design characteristics of each nozzle that demonstrate improved
unwanted ignition propensity or a need for improvement.
3.1.1 Flame Height
The flame height, hf, is an important flame characteristic related to the lighter
ignition propensity. Ignition characteristics are expected to be quite different in the
flame region than in the plume region. Flame heights with respect to the lighter exit
plane, h = 0, corresponding to the three lighters with visible flames were determined
optically from Figure 8. The corresponding flame heights for each nozzle are: hf =
20 mm for Diffusion, hf = 9 mm for Premixed1, and hf = 15mm for Premixed2.
Each nozzle produces a different flame height based on their geometry and the type of
combustion. The Diffusion nozzle produces the longest flame height because the fuel
air mixing is limited by diffusion, making the reaction zone longer. Premixed1
produces a dramatically shorter flame height based on the geometry of the burner, and

36
corresponding fuel-air mixing. Part of the flame exists within the combustion
chamber as illustrated in Figure 8, and only the unburned fuel reacts outside of the
nozzle, greatly reducing the visible flame height measured from the lighter exit plane.
Premixed2 produces a much longer flame height than Premixed1 because of its
geometry. The Premixed2 nozzle creates a partially premixed flame with a fuel rich
center. This partially premixed central core reacts more slowly than the well-mixed
Premixed1 lighter, resulting in a longer reaction zone. For scaling purposes, a flame
height with respect to the source will be the appropriate length scale such that zf = hf
+ δlight. The flame heights based on the source datum are zf = 20mm, zf = 15mm,
and zf = 18 mm for Diffusion, Premixed1 and Premixed2 respectively as noted in
Figure 8, where values for δlight are listed in Table 1.
3.1.2 Temperature
Average centerline temperatures were measured using a micro-thermocouple
and adjusted for radiation losses. Adjusted temperature data is illustrated in Figure
16; maximum temperature adjustments were approximately 70 K. Clearly, each
nozzle has drastically different centerline temperature behavior in the near field. The
Diffusion flame produces a temperature of 1032 K at a height of h = 1.0mm,
gradually increasing to a peak temperature of 1930 K at h = 19.0mm just below the
flame height hf = 20mm. This temperature is near the adiabatic flame temperature
for butane. It is slightly lower due to radiative heat losses from the flame. The
Premixed1 flame produces a nearly constant temperature reaction zone within the
flame where the peak temperature is 1763 K at h = 1.0mm and 1700 K at h = hf =

37
9.0 mm. The Premixed2 flame produces a strange centerline temperature behavior.
Near the exit plane, the temperature behavior is similar to that of the flame zone
described for Premixed1 such that there is a nearly constant temperature initially
ranging from 1687 K to 1724 K for 1.0 mm < h < 3.5mm. There is a rapid decrease
in temperature between h = 3.5 mm and h = 4.5mm before the temperature begins to
behave similarly to that of the Diffusion nozzle with a maximum temperature of 2022
K at h = 13.5mm just below the flame height. This behavior suggests a premixed
reaction in the near field and mixing controlled reaction further downstream of the
source. This behavior is characteristic of partially premixed flames. The temperature
profile of each nozzle illustrates rapid temperature decay at locations above the flame
height.
Height Above Exit Plane, h (cm)
Cen
terl
ine
Tem
pera
ture
,T(K
)
100 101 102
500
1000
1500
2000
2500
Figure 16: Centerline temperature profiles for the three existing cigarette lighter nozzle designs. - Diffusion -Premixed1 -Premixed2

38
Based on the data illustrated in Figure 16, a scaling analysis can be performed
for a comparison to existing data. Morton et al. has performed scaling analysis on the
flow equations for fire plumes, and McCaffrey has tabulated data from several fire
tests illustrating 3/5~* −θz relationship between dimensionless temperature and
dimensionless height where the dimensionless temperature is defined as:
∞
∞−=
T
TTθ (15)
and the dimensionless height is defined as:
*
* 0
D
zzz
−= (16)
where z is illustrated in Figure 8, the virtual origin of the source 0z is calculated using
amethod prescribed by Quintiere, and D* is a characteristic length scale defined as:
5/2
2/10
*
=
∞ gTc
QD
pρ
&= 21.5mm (17)
Where 0ρ is the density of air, and pc is the specific heat of air.5,6,30 The results of
applying this scaling method to the data is illustrated in Figure 17.
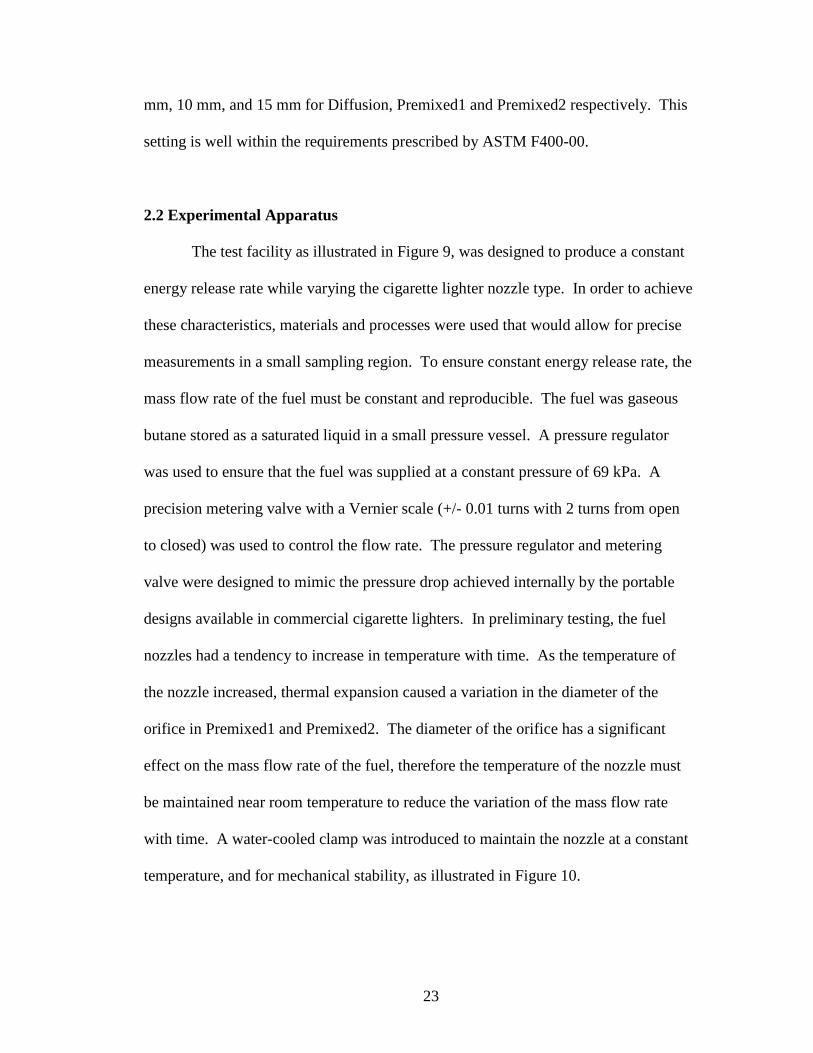
The scaling of the data shows that for a sufficiently large z* the temperature
decays with the (-5/3) power law despite having significantly lower energy release
rates (75 W) when compared to the experiments of McCaffrey (14.4 kW to 57.5 kW)
and the correlation presented by Heskestad.6,30 This suggests that far from the source,
the flow becomes sufficiently turbulent to decay at the same rate as the fully turbulent
pool fires tested by McCaffrey and Heskestad. Based on Figure 17, the
dimensionless height where fully turbulent flow is observed is z* ~ 3 for Diffusion

39
Dimensionless Height, z*
Dim
ensi
onle
ssT
empe
ratu
re,θ
10-1 100 10110-1
100
101
Figure 17: Scaling analysis of centerline temperature data compared to data from McCaffrey and a correlation presented by Heskestad,6,30 indicating fully established turbulent flow behavior at z* ~ 3-5 for the conventional lighters. - Diffusion - Premixed1 - Premixed2 - McCaffrey Heskestad
and Premixed1, and z* ~ 5 for Premixed2. This dimensionless height range, z* ~ 3 to
5 corresponds to Raq ~ 109 using Equation (2). This value is consistent with the
critical value presented by Bejan that the turbulent transition must occur at Raq <
1010.23 McCaffrey’s data illustrates multiple regions indicated by different
temperature decays. There is a constant temperature region which he calls the flame
zone, and a transition region with a (-1) power law decay caused by the intermittent
flame region.6 The flames observed in this study do not all have constant temperature
reaction zones because of the laminar flow condition. These flames do not have an
intermittent flame zone as would be expected in turbulent pool fires, but there is an
analogous temperature decay transition, which is thought to be due to a transition to

40
turbulent flow. More credible approximations for turbulent transition can be
determined from fluctuating temperature measurements discussed below.
Although the (-5/3) power law decay is observed in the temperature rise data
for each lighter, the temperature decay curves are not coincident as illustrated in
Figure 17. These offsets are due to the higher flame temperatures achieved in laminar
and weakly turbulent flames, which have significantly lower entrainment rates than
fully turbulent flames. This effect is illustrated by variation of α in Equation (1).
The behavior prior to the (-5/3) decay is difficult to correlate because the contributing
factors of mass flux, buoyancy flux, and momentum flux cause different flow
behaviors as described by Morton. Morton calls this case the forced plume, and he
describes the behavior generally as a flow that initially behaves like a jet,
transitioning to plume behavior in the far field.8 Reaction in the near field also
changes the scaling , making correlation difficult. However, for the reacting plume,
flames with lower entrainment will have higher temperatures, which is consistent
with the observed trends.
The standard deviation, T’ of each sample temperature measurement was also
recorded. This data can be correlated as an indicator to transition to turbulence where
the temperature fluctuation rapidly begins to increase. Figure 18 illustrates
dimensionless temperature fluctuation, defined as
∞−
′=′
TT
Tθ , (18)
Where T is the plume centerline temperature, versus dimensionless height, z*. Figure
18 illustrates an increase in temperature fluctuation at z* ~ 2 to 3, which is slightly
less than the prediction from the scaling analysis illustrated in Figure 17. This value

41
is expected to be less than that found from Figure 17 because fully established
turbulent flow will occur slightly downstream from the onset of transition to
turbulence. This corresponds to a turbulent transition height of zt ~ 4.3cm to 6.5 cm
with respect the source.
Analysis of mean temperature data may be used to make a comparison of
ignition performance of the three nozzles tested. At this point, only temperature
information is being considered, therefore the nozzle that produces the lowest gas
temperatures will have better unwanted ignition propensity performance. The
Premixed1 nozzle produced the lowest maximum temperature of the three nozzles.
This nozzle produces a lower gas temperature because the geometry of the
combustion chamber and the flame stabilizer act as a heat sink for the flame. Since
the combustion chamber and the flame stabilizer absorb some of the energy release
rate of the flame, less energy is convected away by the hot gasses, resulting in a lower
gas temperature. This concept was explored in development of the Prototype nozzle.
The caveat of this feature is that the surface temperature of the nozzle will increase
due to heating from the flame. The surface temperature of Premixed1 was measured
with thermocouples to reveal the surface temperature performance of the nozzle
without the water-cooling clamp illustrated in Figure 10. The results of the Premixed1
surface temperature test are illustrated in Figure 19 for a fuel cutoff time of 110 s, and
the peak surface temperature of the nozzle was 453 K at 110 s. This surface
temperature seems unreasonably high, although typical shutoff times for lighters in
actual use are much lower than 110 s, which would result in a correspondingly lower

42
surface temperature. This surface temperature data is an indicator of an acceptable
surface temperature performance level for existing cigarette lighters.
3.1.3 Heat Flux
Heat Fluxes to a horizontal flat copper plate were calculated from IR imaging
of the back side of the copper plate. A Matlab program, provided in Appendix D,
was developed to solve Equation (13) for all R. The results were then transformed
back to radial coordinates using the definition R = r2. Using this methodology, the
maximum heat fluxes were determined to be max0 )(q ′′& = 63 kW/m2 for the Diffusion
nozzle, max0 )(q ′′& = 169kW/m2 for Premixed1 and max0 )(q ′′& = 326kW/m2 for Premixed2.
All peak heat fluxes occurred at the stagnation point of the impinging flow. The heat
flux profiles corresponding to the maximum heat flux are illustrated in Figure 20.
These profiles illustrate that the incident heat flux to the copper plate was highly
Dimensionless Height, z*
Dim
ensi
onle
ssT
empe
ratu
reFl
uctu
atio
n,θ’
10-1 100 1010
0.2
0.4
0.6
0.8
z* = 3z* = 2
Figure 18: Scaling analysis of temperature fluctuations, indicating turbulent transition in the range z* ~ 2-3. - Diffusion - Premixed1 - Premixed2

43
Time, t (s)
Noz
zle
Sur
face
Tem
pera
ture
,Tn
(K)
0 60 120 180 240300
400
500
110 s
Figure 19: Premixed1 surface temperature performance for 110 s of operation without the water-cooling clamp.
concentrated near the stagnation point, especially for Premixed1 and Premixed2. The
Diffusion flame produces a lower peak heat flux, but affects a larger area than the
other two. At each sampling height, the peak incident heat flux occurred at the
stagnation point. Figure 21 illustrates the stagnation point heat flux versus height. In
this figure, the dashed line indicates a critical heat flux of 50 kW/m2 discovered from
ignition of filter paper as described below. Integral analysis of the heat flux profiles
illustrated that the total energy transferred to the surface varied with height, and
ignition scaling based on the area of exposed heating was inconclusive. The
maximum heat flux is most indicative of a worst-case scenario for ignition. All
nozzles illustrate a generally decreasing incident heat flux with the ceiling height.

44
Radius, r (cm)
Hea
tFlu
x,q"
(kW
/m2 )
0 0.5 1 1.5 20
100
200
300
400
Premixed2, h = 1.5 cm
Premixed1, h = 1.5 cm
Diffusion, h = 4 cm
Figure 20: Heat flux profiles corresponding to the maximum observed incident heat flux.
Height above Exit Plane, h (mm)
Sta
gnat
ion
Poi
ntH
eatF
lux,
q" 0(k
W/m
2 )
0 50 100 1500
100
200
300
400
50 kW/m2
Figure 21: Stagnation point heat fluxes as a function of height, with a dashed line indicating 50 kW/m2 as a critical heat flux determined from ignition of filter paper. - Diffusion - Premixed1 - Premixed2

45
Scaling analysis of the heat flux data can be performed to illustrate agreement
of the data with theoretical predictions. Kokkala has presented a method for scaling
heat flux data using ξRaq1/6, where ξ is defined by Equation (3) and Raq is defined by
Equation (2), and a dimensionless height defined by z/zf.28 However, the data from
the three nozzles does not correlate well using this scaling method. A new scaling
term, ξRaq-3/8 was determined from Williamson and Marshall, assuming laminar flow
and laminar stagnation point theory following Faeth and You.29,11 The method for
determining this scaling parameter follows:
2/1
02/15/3 )(Pr
−∝′′ =
−rwps dr
dvTTcq ρν& , (19)
where Pr is the Prandtl number, Tw is the wall temperature, and v is the flow velocity:
e
c
r
v
dr
dv
/1
∝ , (20)
where vc is the characteristic velocity of the flow at radius r1/e or the plume width.
Substitution yields:
2/1
/1
)(
−∝′′
e
cws r
vTTq& , (21)
recognizing that:
)(2/1 wcep TTvrcQ −∝ ρ , (22)
substitution yields:
2/5/1
2/1 −−∝′′ ecs rQvq , (23)
where laminar plume scaling from Bejan illustrates:
z
Rav q
c
2/1
∝ , (24)

46
and:
4/1/1
−∝ qe zRar , (25)
such that substitution and arrangement yields:
18/38/32
∝=′′ −−
qqs RaRaQ
zq ξ&
, (26)
as the appropriate scaling parameter for laminar stagnation point heat flux to a
horizontal flat ceiling.23 The data correlates to an order of magnitude as illustrated in
Figure 22 as long as z/zf is greater than unity. This scaling illustrates laminar flow at
all heights for impingement to a horizontal flat ceiling, despite the indication of
turbulent transition in the range of 4.3 cm < z < 6.5 cm predicted from temperature
fluctuation measurements without a ceiling. The possibility of laminar condition is
not entirely unrealistic because the calculated Raq < 1010 which is the critical
transition limit prescribed by Bejan.23 In fact, introduction of the flat plate was
observed by shadow graphing to increase the stability of the flow, allowing the
turbulent transition height to increase as illustrated in Figure 23.
This heat flux information can be used to compare unwanted ignition
propensity from each lighter. Flammable materials typically have a critical incident
heat flux associated with ignition, such that exposure to a heat flux below the critical
heat flux will not result it ignition. Since the stagnation point heat fluxes from these
nozzles is generally decreasing with increasing height, if a critical ignition flux is
known, a critical height can be determined from Figure 21, such that no ignition will
occur above that height for a specific material. This critical height can be used as a
performance characteristic of unwanted ignition propensity. The cigarette lighter

47
nozzle with the lower values of max0 )(q ′′& will have better unwanted ignition propensity
than the others using only information about the heat flux as a comparison assuming
that the stagnation point heat flux is more important than the average value. Based on
the data, the Diffusion nozzle produces the lower max0 )(q ′′& in the near field. However,
the data for Premixed1 illustrates lower stagnation point heat fluxes in the far field,
illustrating that Premixed1 will have better unwanted ignition propensity than the
other two nozzles sufficiently far away from the source. Premixed1 produces better
performance compared to Premixed owing to the energy loss to the combustion
chamber and flame stabilizer as described in Section 3.1.2. Each of these nozzles
demonstrate heat fluxes above the critical value for ignition of filter paper discussed
below, and thus pose an unwanted ignition hazard.
Dimensionless Height, z/zf
Dim
ensi
onle
ssH
eatF
lux
(q’’ 0z
2 /Q)R
a q(-3/
8)
0 2 4 6 810-4
10-3
10-2
Figure 22: Scaling analysis of stagnation point heat flux assuming laminar flow and laminar stagnation point theory illustrating order of magnitude agreement. - Diffusion - Premixed1 - Premixed2

48
Figure 23: Sample plume shadowgraphs indicating a delayed turbulent transition in the impinging plume configuration. The turbulent transition occurs at the maximum sampling height observed in this study, and the turbulent transition in the impinging plume case is approaching the critical laminar condition at Raq < 1010 as prescribed by Bejan.23
3.1.4 Unwanted Ignition
An ignition test was designed in a simple configuration to evaluate the
unwanted ignition propensity in a controlled environment. This test can also provide
avalidation of the heat flux measurements by showing that ignition time is consistent
compared to the measured stagnation point heat flux at the same location while
varying the cigarette lighter nozzle. A thin sheet of filter paper was oriented
horizontally above the lighter. This orientation was the same as the thin copper plate
such that the heat transfer to the filter paper would be analogous to that of the copper
plate. Figure 24 illustrates the ignition data taken for the three existing nozzles. This
data indicates critical ignition heights for the filter paper. The maximum heights of
ignition were, h = 5.5cm for Diffusion, h= 6.1cm for Premixed1, and h = 9.6cm
for Premixed2. Using an energy balance method assuming lumped heat capacitance
Unconfined plume Impinging plume
z ~ 100 mm Raq ~ 2.7× 10⁹
z = 200 mm Raq = 1.1 × 10¹⁰
z = 150 mm Raq = 6.0 × 10⁹

49
as illustrated in Equation (4), there is a direct association between time to ignition and
incident heat flux. Figure 25 illustrates ignition time versus the observed stagnation
point heat flux corresponding to the height of the test. This indicates good agreement
between ignition time and stagnation point heat flux, and it also indicates an apparent
critical heat flux of critigq )( ′′& = 50kW/m2 as illustrated by the dashed line in Figure 25.
Scaling analysis can be performed on Equation (4). Nelson et al. found that
the reciprocal of dimensionless ignition time is directly proportional to the incident
heat flux assuming that the ignition temperature of the material is constant. They
define dimensionless temperature as:
)(
*c
htt cig
τρ= , (27)
Height Above Exit Plane, h (m)
Ave
rage
Igni
tion
Tim
e,t ig
(s)
0 0.025 0.05 0.075 0.10
5
10
15
20
25
Figure 24: Ignition data for the three existing nozzles indicating a critical ignition height (hig)crit for each of the nozzles. - Diffusion - Premixed1 - Premixed2

50
Stagnation Point Heat Flux, q0" (kW/m2)
Ave
rage
Igni
tion
Tim
e,t ig
(s)
0 100 200 3000
5
10
15
20
50 kW/m2
Figure 25: Ignition data versus stagnation point heat flux data, illustrating good agreement between ignition and heat flux information and a critical ignition heat flux
critigq )( ′′& as indicated by the dashed line at 50 kW/m2.
- Diffusion - Premixed1 - Premixed2
Stagnation Point Heat Flux, q’’0 (kW/m2)
Rec
ipro
calo
fD
imen
sion
less
Igni
tion
Tim
e,1/
t*
0 100 2000
0.0025
0.005
50 kW/m2
Figure 26: Scaling of ignition data indicating good agreement near the critical heat flux of critigq )( ′′& = 50kW/m2.
- Diffusion - Premixed1 - Premixed2

51
Where the convective heat transfer coefficient is assumed constant at hc = 30kW/m2-
K as described by Nelson et al., and )( cτρ = 111.9 J/m2-K for filter paper.20 Figure 26
illustrates the results of this scaling method demonstrating excellent agreement near
the critical ignition flux.
Now that a critical ignition flux has been obtained, the critical heat flux can be
applied to the stagnation point heat flux profile in Figure 21 to determine a critical
ignition height based on heat flux. From this information the critical ignition heights
are, (hig)crit = 5.5 cm for Diffusion, (hig)crit = 6.1 cm for Premixed1, and (hig)crit = 9.6
cm for Premixed2. These values agree with those reported in the data from Figure 24.
Based on this information, the nozzle with the lowest value of (hig)crit will have better
unwanted ignition propensity performance. Using this information, Diffusion
produces the best performance. Premixed1 produces significantly better performance
than Premixed2. This may be due to the energy transferred to the combustion
chamber and flame stabilizer as described in section 3.1.2 or a difference in injection
velocity which could change convective heat transfer or entrainment of the flow.
3.2 Development and Characterization of Prototype
The purpose of developing this prototype nozzle is to evaluate the
effectiveness of design modifications, which do not involve mechanical child safety
features, on improving the unwanted ignition propensity performance of a cigarette
lighter. Performance information from the three existing lighters, Table 2, was
analyzed in order to determine a concept for the Prototype. The visible flame height,
maximum heat flux, maximum centerline temperature, and ultimately the maximum

52
ignition height performance will all be targeted for deduction in the Prototype design.
Among these characteristics, maximum heat flux is the most influential factor in
predicting unwanted ignition propensity performance. Premixed1 demonstrates that
each of these characteristics can be significantly reduced when the geometry of the
nozzle dictates that the combustion chamber and flame stabilizer absorb some of the
energy from the flame. Thus, a combustion chamber and flame stabilizer can be
designed to completely contain the flame and maximize energy losses to the
geometry. This must be done while accounting for geometry characteristics of
cigarettes, and addressing the temperature rise of the nozzle.
The Prototype was designed following the concept of a combustion chamber
into which a cigarette would be inserted for ignition. The flame stabilizer is needed
to limit the insertion of the cigarette, because inserting the cigarette too close to the
source will cause extinction of the flame. This combustion chamber and flame
stabilizer will also act as a heat sink for the flame. The Prototype design approach
utilized three, concentric, stainless steel tubes, where the inside diameter of the inner
tube (Tube 1) was 9.65 mm, slightly greater than the diameter of a cigarette. Details
of the Prototype design are illustrated in Figure 7 and Appendix B. Three tubes were
selected because the outer tubes act as a radiation shield for the inner tube; effectively
increasing the time over which the energy absorbed by the inner tube is released to
the environment. This recession concept was successful in reducing all of the
unwanted ignition hazard characteristics as will be illustrated by data taken from the
Prototype. Scaling of data from the Prototype will not be performed in most cases
because the design introduces too many factors that can influence its behavior.

53
The Prototype nozzle was evaluated for using the same technique described
for the existing nozzles. However, since the steady state condition of the Prototype
occurred when the three tubes were heated to a steady state temperature, the
temperature and heat flux measurements are not completely representative of the
actual conditions of use. Reasonably, the steady state condition of the Prototype is
more indicative of an absolute worst-case scenario. Typically, the values measured
for temperature and heat flux will be higher than at the initial condition; however the
steady state experiments still provide a conservative estimate of the actual
performance.
3.2.1 Prototype Flame Height
The combustion chamber of the Prototype nozzle was designed to completely
contain the flame. This resulted in a condition where there was no visible flame.
This is a very beneficial condition, because the peak temperatures observed in the
three existing lighters all occurred within the flame. The ‘invisible’ flame condition
also precludes scaling of the Prototype heat flux data because of difficulties in
determining zf.
3.2.2 Prototype Temperature
The radiation corrected temperature results for the Prototype illustrate
significant near field improvement over the performance of the three existing nozzles.
The maximum observed temperature for the Prototype is 1095 K at h = 2.0 mm. This
is a temperature reduction of 928 K below the existing Premixed2 maximum

54
Table 2: Existing Cigarette Lighter Hazard Characteristics.
Lighter Label
Visible Flame Height, hf (mm)
Maximum Heat Flux,
max)( oq ′′& (kW/m2)
Maximum Temperature,
maxT (K)
Maximum Ignition Height,
max)( igh (cm)
Diffusion 20 63 1930 5.5
Premixed1 9 169 1763 6.1
Premixed2 15 326 2022 9.6
temperature (Prototype uses the same fuel nozzle as Premixed2). Clearly, the amount
of energy transferred to the combustion chamber and flame stabilizer is significant.
While the near field temperature is greatly reduced, the far field temperature is not
significantly reduced. This may result from a delayed turbulent transition compared
to the existing nozzles. This delayed turbulent transition can be explained using Raq
where a reduced effective energy release rate, Q& , is used. This energy reduction is
due to heat absorption by the combustion chamber and flame stabilizer. A reduction
in the effective energy release rate will cause a proportional reduction in Raq causing
adelayed turbulent transition.
A temperature scaling analysis can roughly be performed on the Prototype
data however, it does not account for an effective reduction in Q& such that z* is
defined in the same way for the Prototype as it is for the existing nozzles. This
analysis the z0 = 0 assumption is no longer valid. The introduction of the tube causes
avirtual origin based on reduced entrainment when the flow is still in the tube. Thus
the virtual origin should be approximately equal to the recession depth (δlight)Prototype =

55
Height Above Exit Plane, h (cm)
Cen
terl
ine
Tem
pera
ture
,T(K
)
100 101 102
500
1000
1500
2000
2500
Figure 27: Centerline temperatures of all tested nozzles indicating that the temperature of the Prototype near the exit plane is much lower than those observed for the existing nozzles. - Diffusion - Premixed1 - Premixed2 - Prototype
79 mm because that is the height at which air can be freely entrained. A virtual origin
was determined for the Prototype by matching the far field temperature decay to the (-
5/3) power law decay observed for plumes. This method resulted in (z0)Prototype = 85
mm, which is conceptually correct because the flow propagating from a tube is not
expected to behave as a plume initially. The finite area of the tube and the finite
velocity of the flow at the exit plane will dictate that entrainment does not follow
plume behavior for some distance above the exit plane. The results of this scaling
analysis are illustrated in Figure 28. According to this information, fully established
turbulent flow occurs at z* ~ 6 which is greater than that of the existing nozzles.
Temperature fluctuations also indicate a delay in the turbulent transition at z* ~ 4 as
illustrated in Figure 29.
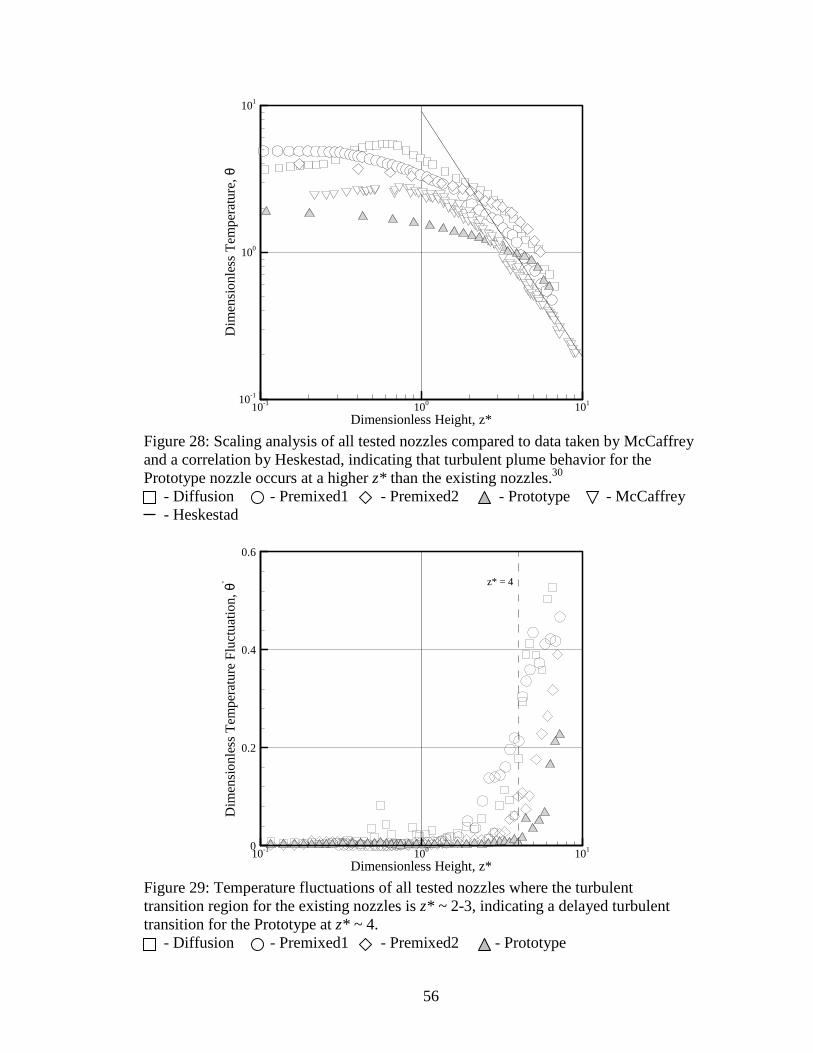
56
Dimensionless Height, z*
Dim
ensi
onle
ssT
empe
ratu
re,θ
10-1 100 10110-1
100
101
Figure 28: Scaling analysis of all tested nozzles compared to data taken by McCaffrey and a correlation by Heskestad, indicating that turbulent plume behavior for the Prototype nozzle occurs at a higher z* than the existing nozzles.30
- Diffusion - Premixed1 - Premixed2 - Prototype - McCaffrey - Heskestad
Dimensionless Height, z*
Dim
ensi
onle
ssT
empe
ratu
reF
luct
uatio
n,θ’
10-1 100 1010
0.2
0.4
0.6
z* = 4
Figure 29: Temperature fluctuations of all tested nozzles where the turbulent transition region for the existing nozzles is z* ~ 2-3, indicating a delayed turbulent transition for the Prototype at z* ~ 4.
- Diffusion - Premixed1 - Premixed2 - Prototype

57
3.2.3 Prototype Surface Temperature
Surface temperatures of the Prototype are a significant factor describing its
performance and its commercial viability. If the surface temperature of the nozzle
increases rapidly to the threshold of pain or even high enough to cause ignition of
nearby materials, its unwanted ignition propensity performance will be suspect. A
simple heat transfer analysis was performed using a two-zone approach based on
thermal resistance methods. A two-zone approach was used to account for the
temperature difference along the length of each tube as illustrated by the data in
Figures 30 to 32. Each tube was split into two zones at the height of the flame
stabilizer. The resistance analog was applied to the concentric radial tube
configuration of the Prototype lighter. The effects of radiation and natural convection
were evaluated for each zone based on simple correlation using a first order
approximation of Fourier’s Law, Newton’s Law of cooling and the Stefan-Boltzmann
Law presented by Incropera.26 Zone wise energy balance equations are presented
below where j = 1 or 2 corresponding to the bottom zone and the top zone
respectively.
� Tube 1 (inner tube)
convnetradcondj
jp qqqQSt
Tmc &&&& −−−+Χ=
∆∆
−21,)()1( , (28)
� Tube 2 (middle tube)
convnetradcondj
netradp qqqqt
Tmc &&&& −−−+=
∆∆
−− 32,21, )()1()( , (29)
� Tube 3 (outer tube)

58
convnetradcondj
netradp qqqqt
Tmc &&&& −−−+=
∆∆
∞−− 3,32, )()1()( , (30)
The details of the heat transfer analog equations and the method for solving the
problem are illustrated in Appendix E. The model was also designed to resolve
temperature performance after the nozzle was shut off. This was necessary to
investigate the surface temperature increase of the outer tubes after the nozzle is shut
off due continued heating from the inner tube, which is at a higher temperature.
In testing an un-cooled Prototype, a natural cutoff time occurred regularly at
110 s. This natural cutoff time was a result of extreme heating and thermal expansion
of the orifice such that the fuel flow was reduced to the point of extinction. Therefore
data was taken for the nozzle while the nozzle was shut off at t = 110s and the model
predictions were calculated using the same cutoff time. The results of the model
temperature predictions are illustrated along surface temperature measurements taken
with a similar shutoff time in Figure 31 to 33 for each tube. A legend is provided in
Figure 30 illustrating the locations of thermocouples and zones. The model illustrates
reasonably accurate predictions of surface temperature for all tubes when the model
inputs were set to known values for stainless steel. The key inputs for the model
included the physical, thermal and geometric properties of all three tubes, a shutoff
time, a time step, the total energy release rate of the flame, and an approximation of
the fraction of energy transferred from the flame to tube 1. The only input requiring
engineering judgment is the fraction of energy transferred from the flame to tube 1.
This value was approximated qualitatively by matching the results of the tube 1
surface temperature calculations to the data taken for tube 1. Input values for the
model are illustrated in Appendix E.

59
This model can also be used in predicting surface temperature performance
differences when the construction material properties are changed. Sensitivity
analysis of the model for designs of similar geometry shows that material with high
density, high specific heat and low emissivity illustrate improved performance.
Polished stainless steel appears to have been a good selection of material, because it
has a high density, high specific heat and a low emissivity. The three-tube
configuration also demonstrates a dramatic surface temperature improvement over the
two-tube configuration.
The peak exposed surface temperature of the Prototype also has better
performance in comparison to that of Premixed1 for similar operation time, as
illustrated in Figure 34. The peak exposed temperature of the Prototype is 344 K at t
= 379.5 s and the peak exposed temperature for Premixed1 is 453 K at t = 110s. In
fact, the performance of Tube 2 (middle tube) is better than Premixed1. Depending
on the level of safety desired a two-tube design might be determined as sufficiently
safe.
3.2.4 Prototype Heat Flux
The heat flux measurements for the Prototype design demonstrate a dramatic
improvement over the existing nozzles. The maximum observed heat flux was
max)( oq ′′& = 51kW/m2 at h = 2 mm. The radial heat flux profile corresponding to the
peak observed heat flux for all of the lighters is illustrated in Figure 34. The
stagnation point heat flux versus height is illustrated in Figure 35 for all lighters. The
data for the Prototype is indicative of the worst-case scenario. In actual use, the

60
Figure 30: Legend for Figures 31 to 33.
Time, t (s)
Tub
eSu
rfac
eT
empe
ratu
re,T
s(K
)
0 120 240 360 480300
400
500
600110 s
Figure 31: Tube 1 (inner tube) surface temperatures, the fraction of energy transferred to tube 1 was the only unknown input for the model, therefore its value was modified to make the surface temperatures at t = 110 s match the data taken for a similar cutoff time.
Top Thermocouple
Mid Thermocouple
Bot Thermocouple
Bottom Zone
Top Zone

61
Time, t (s)
Tub
eSu
rfac
eT
empe
ratu
re,T
s(K
)
0 120 240 360 480300
350
400
450110 s
Figure 32: Tube 2 (middle tube) surface temperatures, illustrating similar surface temperature behavior predicted by the analysis compared to that observed in the data.
Time, t (s)
Tub
eSu
rfac
eT
empe
ratu
re,T
s(K
)
0 120 240 360 480300
325
350110 s
Figure 33: Tube 3 (outer tube) surface temperatures, illustrating similar surface temperature behavior predicted by the analysis compared to that observed in the data.

62
Radius, r (cm)
Hea
tFlu
x,q"
(kW
/m2 )
0 0.5 1 1.5 20
100
200
300
400
50 kW/m2
Premixed2, h=1.5 cm
Premixed1, h=1.5 cm
Diffusion, h=4 cmPrototype, h=0.2 cm
Figure 34: Radial heat flux profiles corresponding to the peak observed stagnation point heat flux for all nozzles.
Height above Exit Plane, h (mm)
Sta
gnat
ion
Poi
ntH
eatF
lux,
q" 0(k
W/m
2 )
0 50 100 1500
100
200
300
400
50 kW/m2
Figure 35: Stagnation point heat fluxes versus height for all nozzles tested indicating significant improvement of the Prototype over all other nozzles. - Diffusion - Premixed1 - Premixed2 - Prototype

63
unwanted ignition propensity performance will be lower than the values reported for
nearly all instances of operation. Scaling of the heat flux information for the
Prototype is impossible because of the difficulties in measuring zf.
3.2.5 Prototype Unwanted Ignition
The results of several ignition test trials with the prototype nozzle, no flaming
ignition was observed. Only a few tests resulted in any visible smoldering of the
filter paper, while many tests at the same height illustrated no visible ignition.
Therefore ignition testing of the Prototype nozzle illustrated no significant ignition
time.

64
Chapter 4: Conclusions
This study illustrates a detailed investigation into the ignition propensity of
small flames such as cigarette lighters. The objectives of this study were to
characterize ignition propensity of conventional cigarette lighters, and to create a
concept that will demonstrate an improvement in unwanted ignition propensity from a
cigarette lighter without adding mechanical child safety features. An experimental
facility was designed and constructed to characterize centerline temperatures, heat
flux to a horizontal flat plate, and ignition of filter paper in order to investigate the
ignition propensity of flames from these lighters. Innovative diagnostics were
employed to account for the scale of the experiment without sacrificing accuracy. A
concept cigarette lighter was designed based on characteristics of existing cigarette
lighters that demonstrated improved ignition propensity or need for improvement.
The concept was tested using the same methodology developed for the existing
cigarette lighters. The results of the investigation illustrate many interesting behavior
of each lighter tested.
4.1 Temperature Measurements
Laminar flames, such as those produced by cigarette lighters can produce
dramatically different centerline temperature profiles within the flame. The peak
temperatures of these laminar flames can vary widely based on fuel-air mixing and
energy losses to the combustion chamber. Diffusion flames and premixed flames that
do not have energy losses illustrate maximum temperatures near the adiabatic flame
temperature for the fuel. Centerline temperatures observed sufficiently far away from

65
the source decay similarly to turbulent plume scaling and data taken by McCaffrey.6
Temperature fluctuations indicate that turbulence levels dramatically increase at the
height where turbulent plume scaling behavior is observed. The turbulent transition
agrees to within an order of magnitude of the maximum turbulent transition height
where Raq = 1010 as prescribed by Bejan.23 In the laminar region, temperature decay
is difficult to scale because of variations in mass, momentum and buoyancy flux as
discussed by Morton.8
Centerline temperature profiles, however, are a weak indicator of ignition
propensity performance. The most significant parameter for determining ignition
propensity from centerline temperature profiles is the peak temperature. Turbulent
transition is only significant in scaling of the data, and does not provide a significant
impact on ignition propensity. Results from the Prototype demonstrate that the peak
centerline temperature can be significantly reduced with a simple modification of the
combustion chamber and flame stabilizer.
4.2 Heat Flux Measurements
The stagnation point heat fluxes observed in this study illustrate extremely
high local heat transfer. Maximum values reported by Veldman et al. are on the order
of 1 kW/m2 at the stagnation point for fires having energy release rates of 1.17 kW to
1.53 kW.10 Faeth and You have reported maximum values for stagnation point heat
fluxes of 8 kW/m2 to 12 kW/m2 for fires having energy release rates of 1.67 kW and
8.51 kW respectively.11 This study reports peak stagnation point heat fluxes of 51
kW/m2 to 326 kW/m2 for 75 W flames. Clearly the local heat loading from these
66
small flames is significantly higher, one to two orders of magnitude, than that for a
larger flame. It also illustrates that flames having the same energy release rate can
produce dramatically different heat loadings based on different nozzle geometry.
Scaling of the heat fluxes illustrates very little scaling agreement with traditional
scaling methods. A laminar scaling term was developed to produce better correlation,
resulting in an order of magnitude agreement as illustrated in Figure 22. The study
performed by Kokkala shows that heat flux scaling is only accurate to an order of
magnitude.28 More research is needed to validate the scaling methods for heat flux.
Practically, heat flux measurements are the strongest indicator for ignition
propensity performance. Ignition time is dependent on incident heat flux, and the
material properties. The peak incident heat flux is an indicator of the various types of
materials that can be ignited, while the heat flux versus height profile can indicate a
region of the plume in which a particular material can be ignited. These two
parameters can be used in a comparison of ignition propensity performance. Results
from the Prototype illustrate that both peak incident heat flux and the ignition region
of a cigarette lighter can be significantly reduced by a simple modification of the
combustion chamber and flame stabilizer of the nozzle.
4.3 Ignition of Filter Paper Measurements
Simple ignition testing demonstrates that the method used to determine the
incident heat flux produces consistent results for all the cigarette nozzles tested.
Ignition time and incident stagnation point heat flux measurements were directly
correlated to find a critical ignition heat flux for filter paper of 50 kW/m2. This

67
information allowed for a determination of a specific region of the plume where each
lighter produced ignition of the filter paper. This region provides a specific example
for comparison of the cigarette lighters. Results from the Prototype illustrate that the
region of ignition for filter paper can be effectively reduced to zero by a simple
modification of the combustion chamber and flame stabilizer.
4.4 Overall Prototype Performance
A simple comparison of the critical parameters describing ignition propensity
illustrates that the Prototype concept successfully improves unwanted ignition
propensity performance when compared to existing cigarette lighter designs. The
hazard parameters for all four tested nozzles are listed in Table 3. The Prototype
demonstrates significant reduction in flame height, peak centerline temperature,
maximum observed incident heat flux, and critical ignition region. Actual
performance improvements are:
• visible flame height is reduced to zero,
• peak centerline temperature is reduced by 836 K, 668 K, and 928 K for
Diffusion, Premixed1, and Premixed2 respectively,
• maximum observed heat flux is reduced by a factor of 1.24, 3.23, and 6.42
from Diffusion, Premixed1, and Premixed2 respectively,
• critical ignition height for filter paper is reduced effectively to zero because
ignition tests demonstrated insignificant information.

68
Table 3: Hazard characteristics for all nozzles tested
Lighter Label
Visible Flame Height, hf (mm)
Maximum Heat Flux,
max)( oq ′′& (kW/m2)
Maximum Temperature,
maxT (K)
Maximum Ignition Height,
max)( igh (cm)
Diffusion 20 63 1930.1 5.5
Premixed1 9 169 1762.5 6.1
Premixed2 15 326 2022.1 9.6
Prototype 0 51 1094.5 0
The performance caveat of the Prototype is the exposed surface temperature of the
nozzle. This caveat can be resolved by selecting materials with high density, high
specific heat and low surface emissivity as well as by increasing the number of
concentric tubes in the design. The design selected illustrates lower exposed surface
temperatures than those observed for Premixed1 demonstrating an acceptable
performance level for commercial viability. The Prototype also has sufficient heating
capacity to ignite a cigarette when the cigarette is inserted into the combustion
chamber to the flame stabilizer. Overall, the Prototype illustrates an effective concept
in reducing the unwanted ignition propensity of cigarette lighters without introducing
mechanical child safety features.

69
Appendix A: Illustration of Fuel Orifice in Premixed1, Premixed2 and Prototype

70
Appendix B: Proposed Cigarette Lighter Design Utilizing the Prototype Concept
12
3
4
5
6
7
8
10
9
12
11
3.25"
4.75"
1. Tube 1 (inner tube), Inside Diameter: 0.38 in, Outside Diameter: 0.5 in 2. Tube 2 (middle tube), Inside Diameter: 0.63 in, Outside Diameter: 0.75 in 3. Tube3 (outer tube), Inside Diameter: 0.87 in, Outside Diameter: 1 in 4. Titanium wire flame stabilizer 5. Spark ignition wire 6. Burner nozzle 7. Piezoelectric spark device 8. Operation button 9. Butane fuel reservoir 10. Air mixing chamber 11. Orifice (Appendix A) 12. Fuel connection tube

71
Appendix C: Illustration of the National Instruments Program Diagram used for High Frequency Temperature Measurements
Program Window:

72
Diagram Window:

73
Appendix D: Matlab Program for Processing Heat Flux to a Horizontal Flat Plate
clc clear all % Input parameters H = .15; % Sampling traverse height, m Ta = 300; % Ambient temperature, K dr = 0.000603125; % Pixel size, m emiss = .95; % Emissivity of flat plate k = 386; % Conductivity of flat plate, W/m-K d = .000762; % Thickness of flat plate, m H = H - .005; % Offset correction, m %Image loading start=1; End=300; average = zeros(240,320); % Creates a matrix of zeros % Loads the image files and adds them all together for k=start:End; str = int2str(k); file=[’two_cm_’,str,’’] ; Mo=load (file) ; matlab= getfield(Mo,file); average=average+matlab; end % Divides the sum of all the images and divides by the mumber of images % to get the mean temperature of any point average=average./(End-start+1); % Output results to file save results.dat average -ascii % Finds the location of the peak temperature at point [I,J] [C,J]=max(max(average)); [C,I]=max(max(average,[],2));

74
% Best function constant parameters m1 = 343.29 m2 = 7.5192e+05 m3 = -1.095e+07 m4 = 3.9334e+09 m5 = 2.4084e+13 m6 = 2248.7 m7 = 7.5308e+10 % Model for convective heat transfer coefficient Tbar = mean(mean(average)); h = (9.81*(Tbar-Ta)/(Ta*.00001589*.0000225)*(38.5*27/(38.5*2+27*2))^3)^(1/3)*.15*.0263/(38.5*27/(38.5*2+27*2)); % Numerical evaluation for m=1:115;
% Spatial temperature average T_R1(m,1) = average(I,J+m-1); T_L1(m,1) = average(I,J-m+1); T_U1(m,1) = average(I+m-1,J); T_D1(m,1) = average(I-m+1,J); T_1(m,1) = (T_R1(m,1)+T_L1(m,1)+T_U1(m,1)+T_D1(m,1))/4; T_bar(m,1) = T_1(m,1);
% Convection, W/m^2 Q_h(m,1) = h*(T_bar(m,1)-Ta);
% Radiation, W/m^2 Q_r(m,1) = emiss*5.67*10^-8*(T_bar(m,1)^4 - Ta^4)*2;
% Convection plus radiation, W/m^2 Q_(m,1) = Q_h(m,1)+Q_r(m,1); end % Determination of r and R = r^2 r_1 = (0:m-1)*dr; r = transpose(r_1); for t=1:m R(t,1) = (r(t,1))^2; end

75
% Evaluation of derivatives for n=1:m;
y(n,1) = (m1+m2*x2(n,1)+m3*x2(n,1)^2+m4*x2(n,1)^3+m5*x2(n,1)^4)/(1+m6*x2(n,1)+m7*x2(n,1)^4);
dy(n,1) =
(m2+2*m3*x2(n,1)+3*m4*x2(n,1)^2+4*m5*x2(n,1)^3)/(1+m6*x2(n,1)+m7*x2(n,1)^4)-(m1+m2*x2(n,1)+m3*x2(n,1)^2+m4*x2(n,1)^3+m5*x2(n,1)^4)/(1+m6*x2(n,1)+m7*x2(n,1)^4)^2*(m6+4*m7*x2(n,1)^3);
dydy(n,1) =
(2*m3+6*m4*x2(n,1)+12*m5*x2(n,1)^2)/(1+m6*x2(n,1)+m7*x2(n,1)^4)-2*(m2+2*m3*x2(n,1)+3*m4*x2(n,1)^2+4*m5*x2(n,1)^3)/(1+m6*x2(n,1)+m7*x2(n,1)^4)^2*(m6+4*m7*x2(n,1)^3)+2*(m1+m2*x2(n,1)+m3*x2(n,1)^2+m4*x2(n,1)^3+m5*x2(n,1)^4)/(1+m6*x2(n,1)+m7*x2(n,1)^4)^3*(m6+4*m7*x2(n,1)^3)^2-12*(m1+m2*x2(n,1)+m3*x2(n,1)^2+m4*x2(n,1)^3+m5*x2(n,1)^4)/(1+m6*x2(n,1)+m7*x2(n,1)^4)^2*m7*x2(n,1)^2;
end % Net conduction, W/m^2 for n=1:m; dTp(n,1) = dy(n,1)*-4*k*d; dTdTp(n,1) = dydy(n,1)*R(n,1)*-4*k*d; Q_cp(n,1) = dTp(n,1)+dTdTp(n,1); end % Total heat flux for g=1:m; Qp_flux(g,1) = Q_cp(g,1)+Q_r(g,1)+Q_h(g,1); end % Create output file mat(:,1) = H; % Height of flat plate mat(:,2) = r; % Radial position mat(:,3) = Qp_flux; % Total heat flux at r mat(:,4) = dr; % Pixel size mat(:,5) = 2*pi*x*dr; % Differential area mat(:,6) = 2*pi*dr*x.*Qp_flux; % Differential heat transfer

76
% Output to file str1 = num2str(H); file1 = [str1,’_m.txt’]; dlmwrite(file1,mat)

77
Appendix E: Prototype Surface Temperature Prediction Method
Inputs:
General Input Characteristics
Fraction of Energy
absorbed by Tube 1
Energy Release Rate,
Q (W)
Ambient Temperature,
Tamb (C)
Shutoff time, toff (s)
Surface Emissivity, ε
Time Step, ∆t(s)
0.5 75 23 110 0.18 0.1
Tube Input Characteristics
Tube 1 (inner tube) Tube 2 (middle tube) Tube 3 (outer tube) ID (in) 0.38 ID (in) 0.63 ID (in) 0.87 OD (in) 0.5 OD (in) 0.75 OD (in) 1 L (in) 3.27 L (in) 3.27 L (in) 3.27
Lzone1 (in) 0.9 Lzone1 (in) 0.9 Lzone1 (in) 0.9 Lzone2 (in) 2.37 Lzone2 (in) 2.37 Lzone2 (in) 2.37 No. holes 132 No. holes 132 No. holes 132 No.zone1 30 No.zone1 30 No.zone1 30 No.zone2 102 No.zone2 102 No.zone2 102
hole dia. (in) 0.125 hole dia. (in) 0.125 hole dia. (in) 0.1875 ρ (kg/m^3) 8238 ρ (kg/m^3) 8238 ρ (kg/m^3) 8238
cp (J/kg-K) 468 cp (J/kg-K) 468 cp (J/kg-K) 468
K (W/m-K) 13.4 k (W/m-K) 13.4 k (W/m-K) 13.4

78
Diagram of heat transfer:
Analog resistance network (not labeled for the sake of simplicity)
Methods and equations: The model was solved numerically starting from the initial condition that all tubes
were at ambient temperature. Energy balances were calculated iteratively by
approximating the unknown surface temperature as the temperature calculated by the
0.25XQ
0.75XQ
qconv
qconv
qconv
qconv
qconv
qconv
qconv
qconv
qconv
qconv
(qrad)net
(qrad)net
(qrad)net
(qrad)net
(qrad)net
(qrad)net
qcond qcond qcond

79
previous time step using Equations (20) to (22). Temperature rises for each tube and
time step were calculated starting at the inner tube, and stopping at the outer tube.
The energy transferred to tube 1 from the flame was approximated by
QSq jjin&Χ=)( , (31)
where Χ is the fraction of energy transferred from the flame to tube 1 and jS is the
fraction of energy transferred to zone j such that 121 =+ SS where 75.01 =S and
25.02 =S as an order of magnitude assumption. The natural convection was
approximated by
ic
iiconv R
TTq
,,
)( ∞−= , (32)
where cq& is the total energy transfer due to convection at a surface i, Ti is the surface
temperature of element i, and Rc,i = 1/ hcAi such that hc = 10W/m2-K for natural
convection flows and Ai is the surface area of surface i.26 Radiation heat transfer was
calculated by
i
iiiitoinetrad R
TTAq
)()(
41
4
1,+
+−
=σ
, (33)
where 1,)( +itoinetradq& is the net energy transfer between surface i and i+1 dueto
radiation, σ is the Stefan-Boltzmann Constant, and
−+=+1
11
i
ii r
rR
εε
ε, (34)
whereε is the surface emissivity and ri is the radius of surface i. The radiation at the
outer surface of tube three was calculated by
=∞tonetradq 3,)( )( 44∞−TTA jjεσ , (35)

80
where the surroundings are assumed to be isothermal.26 The two zones
communicated through a simple first order conduction approximation
)( topbotc
cond TTL
kAq −= , (36)
where condq is the total energy conducted from the bottom zone to the top zone, L is
the distance between the geometric centers of the top and bottom zones, k is the
thermal conductivity of the material, and Ac is the cross sectional area of the tube.

81
Bibliography [1] Laitinen, D., “Candle Fires on the Rise,” NFPA Journal, National Fire
Protection Association, URL: http://www.nfpa.org/Research/NFPAFactSheets/CandleSafety/ CandleFiresOnTheRise/CandleFiresOnTheRise.asp, Nov 2003.
[2] Hall, J. R. Jr., Children Playing with Fire, National Fire Protection Association,
June 2001. [3] Juvenile Firesetter Intervention Research Project Final Report, National
Association of State Fire Marshalls, 2001. [4] Annual Book of ASTM Standards, “ASTM F400-00, Standard Consumer Safety
Specification for Lighters”, American Society for Testing and Materials, Philadelphia, 2003.
[5] Morton, B. R., Taylor, G., and Turner, J. S., “Turbulent Gravitational
Convection from Maintained and Instantaneous Sources,” Proceedings of the Royal Society of London, Series A, Vol. 234, pp. 1-23, 1956.
[6] McCaffrey, B. J., “Purely Buoyant Diffusion Flames: Some Experimental
Results,” Center for Fire Research, National Engineering Laboratory, National Bureau of Standards, No. NBSIR 79-1910, 1979.
[7] Fujii, T. I., “Theory of Steady Laminar Natural Convection Above a Horizontal
Line Heat Source and a Point Heat Source,” International Journal of Heat and Mass Transfer, Vol. 6, pp. 597-606, 1963.
[8] Morton, B. R., “Forced Plumes,” Department of Mathematics, University of
Manchester, pp. 151-163, 1958. [9] Alpert, R. L., “Fire Induced Turbulent Ceiling Jet,” Factory Mutual Research
Corporation, FMC 19722-2, 1971.
[10] Veldman, C. C., Kubota, T., and Zukoski, E. E., “An Experimental Investigation of the Heat Transfer from a Buoyant Gas Plume to a Horizontal Ceiling – Part 1. Unobstructed Ceiling,” Center for Fire Research, National Engineering Laboratory, National Bureau of Standards, No. NBS-GCR-77-97, 1975.
[11] Faeth, G. M., and You, H. Z., “An Investigation of Fire Impingement on a
Horizontal Ceiling,” Center for Fire Research, National Engineering Laboratory, National Bureau of Standards, No. NBS-GCR-81-304 (1981).

82
[12] Chow, W. K., “Numerical Studies on the Transient Behaviour of a Fire Plume and Ceiling Jet,” Mathematical and Computer Modelling, Vol. 17, pp. 71-79, 1993.
[13] Motevalli, V., “Numerical Prediction of Ceiling Jet Temperature Profiles
During Ceiling Heating Using Empirical Velocity Profiles and Turbulent Continuity and Energy Equations,” Fire Safety Journal, Vol. 22, pp. 125-144, 1994.
[14] Motevalli, V., and Marks, C. H., “Transient and Steady State Study of Small-
Scale, Fire-Induced Unconfined Ceiling Jets,” 5th AIAA/ASME Thermophysical and Heat Transfer Conferences, ed. Quintiere, J. G. and Cooper, L. Y., American Society of Mechanical Engineers, New York, pp. 49-61, 1990.
[15] Drysdale, D. D., An Introduction to Fire Dynamics, Second Edition, Ch. 6, John
Wiley and Sons, New York, pp. 193-232, 1998. [16] Zhou, Y. Y., Walther, D. C., and Fernandez-Pello, A. C., “Numerical Analysis
of Piloted Ignition of Polymeric Materials,” Combustion and Flame. Vol. 131, pp. 147-158, 2002.
[17] Thomson, H. W., Drysdale, D. D., and Beyler, C. L., “An Experimental
Evaluation of Critical Temperature as a Criterion for Piloted Ignition,” Fire Safety Journal, Vol. 13, pp. 185-196, 1988.
[18] Atreya, A., and Wichman, I. S., “Heat and Mass Transfer During Piloted
Ignition of Cellulosic Solids,” Journal of Heat Transfer, Vol. 111, pp. 719-725, 1989.
[19] Mohgtaderi, B., Novozhilov, V, Fletcher, D. F., and Kent, J. H., “A New
Correlation for Bench-Scale Piloted Ignition Data of Wood,” Fire Safety Journal, Vol. 29, pp. 41-59, 1997.
[20] Nelson, M. I., Brindley, J., and McIntosh, A. C., “Ignition Properties of
Thermally Thin Materials in the Cone Calorimeter: A Critical Mass Flux Model,” Combustion Science and Technology, Vols. 113-114, pp. 221-241, 1996.
[21] Krishnamurthy, R., and Gebhart, B., “An Experimental Study of Transition to
Turbulence in Vertical Mixed Convection Flows,” Journal of Heat Transfer, Vol. 111, pp. 121-130, 1989.
[22] Jiang, X., and Luo, K. H., “Dynamics and Structure of Transitional Buoyant Jet
Diffusion Flames with Side-Wall Effects,” Combustion and Flame, Vol. 133, pp. 29-45, 2003.

83
[23] Bejan, A., Convection Heat Transfer, Ch. 6, John Wiley and Sons, New York, pp. 202-223, 1983.
[24] Kimura, S., and Bejan, A., “Mechanism for Transition to Turbulence in Buoyant
Plume Flow,” International Journal of Heat and Mass Transfer, Vol. 26, pp. 1515-1532, 1983.
[25] Zukoski, E. E., and Cox, G., Combustion Fundamentals of Fire, Ch. 3,
Academic, San Diego, 1995. [26] Incropera, F. P., and De Witt, D. P., Fundamentals of Heat and Mass Transfer,
Fifth Edition, John Wiley and Sons, New York, 2002. [27] Marshall, A. W., “Effects of Jet Momentum Distribution on Combustion
Characteristics in Co-Swirling Flames,” Ph.D. Dissertation, University of Maryland, College Park, MD, 1996.
[28] Kokkala, M., “Heat Transfer to and Ignition of Ceiling by an Impinging
Diffusion Flame,” Technical Research Center of Finland, Research Reports.No. 586, 1989.
[29] Williamson, J. W. and Marshall, A. W., “Thermal Behavior of Small Fire
Plumes,” Proceedings of the Third Joint Meeting of the United States Sections of the Combustion Institute, Chicago, 2003.
[30] Quintiere, J. G., “Fundamentals of Fire Phenomena, Draft,” University of
Maryland, Department of Fire Protection Engineering, College Park, MD, 2003.