Embed Size (px)
Citation preview

Characterization of the Upper Cambrian and
Lower Ordovician Formations for C02 Sequestration,
Scioto County, Ohio
Senior ThesisSubmitted in partial fulfillment of the requirements for the
Bachelor of Science Degreeat The Ohio State University
by
Brad Allen HullThe Ohio State University
2012
Approved By
~d(;&Dr. David Cole, Advisor
School of Earth SciencesSubsurface Energy Materials Characterization and Analysis Lab

2
Abstract
Carbon dioxide sequestration into porous rock intervals beneath the Earth’s surface is an
emerging technique of reducing the amounts gaseous CO2 emitted by energy production through
the burning of coal/peat. Target intervals of rock must have sufficient pore space, permeability,
thickness, depth from the surface, and must be located beneath an impermeable geologic seal to
serve as a reservoir for the sequestration of supercritical CO2. The Upper Cambrian-Early
Ordovician Knox Supergroup including the Copper Ridge Dolomite, Rose Run Sandstone, and
Beekmantown Dolomite formations found within the Aristech Well in Scioto County, Ohio may
have all the necessary requirements to serve as a viable combination of CO2 reservoir and
geologic seal. This research seeks to characterize samples drawn from these formations on the
basis of petrography, porosity, pore size and distribution, permeability, bulk mineralogy, and
brine chemistry to distinguish suitable sequestration horizons in conjunction with an overlying
caprock.
Light microscopy, scanning electron microscopy, mercury porosimetry, and x-ray
diffraction analyses established a porous and permeable reservoir interval including the upper
Copper Ridge and entire Rose Run overlain by the impermeable Beekmantown Dolomite. The
Rose Run Sandstone was the most favorable for CO2 storage, while vertical heterogeneity within
the Copper Ridge Dolomite limited the reservoir thickness. Porosity measurements for the
reservoir were between 3 and 8%, permeability was 16-50 mDarcies, while the caprock porosity
was 1% and permeability of 7 mDarcies. Porosity and pore size distribution between and within
samples is controlled by mineralogy, mineral nucleation, diagenesis, and heterogeneity.
Volumetric estimations show that the Copper Ridge/Rose Run reservoir could hold up to
5.6 million metric tonnes of supercritical CO2 under the most favorable conditions.

3
Table of Contents
Page
Abstract…………………………………………………………………………………………...2
Acknowledgements………………………………………………………………………………4
Unit I: Overview
Chapter 1 INTRODUCTION………………………………………………………..6
Project Overview…………………………………………………6
Objectives………………………………………………………...7
Previous Work……………………………………………………8
Chapter 2 METHODOLOGY………………………………………………………11
Chapter 3 GEOLOGIC SETTING………………………………………………….14
Unit II: Results
Chapter 4 COPPER RIDGE DOLOMITE …………………………………………20
Dolomicrite facies………………………………………………..20
Intradolomicrie facies……………………………………………30
Chapter 5 ROSE RUN SANDSTONE……………………………………………...38
Chapter 6 BEEKMANTOWN DOLOMITE………………………………………..48
Unit III: Discussion & Conclusion
Chapter 7 DISCUSSION……………………………………………………………56
Chapter 8 CONCLUSION…………………………………………………………..63
Chapter 9 SUGGESTIONS FOR FUTURE WORK……………………………….64
Chapter 10 BIBLIOGRAPHY………………………………………………………65

4
Acknowledgements
I would like to mention the following individuals and organizations, all of whom only
represent a fraction of those who made this project possible. The Ohio Department of Natural
Resources Core Facility for providing the samples for this study and for maintaining such an
incredible depository of rocks. Everyone associated with the Subsurface Energy Materials
Characterization and Analysis Lab (SEMCAL): Dr. Dave Cole, Dr. Jeff Daniels, Dr. Julie
Sheets, Dr. Susan Welch, Dr. Ann Cook, Alex Swift, Mike Murphy, Matt Hawrylak, Nick
Leeper, Kyle Cox, and Ting Ting Liu for use of their facilities, knowledge, guidance,
collaboration, and fellowship. Thank you to the Shell Corporation’s Shell Undergraduate
Research Experience, for my summer funding and for putting together such a great program
encouraging interest in the research of Earth Science. Gratitude goes to the entire faculty,
students, and staff of The Ohio State University’s School of Earth Sciences and the Orton
Memorial Geology Library for being a truly special place to spend my collegiate career. I’m
also completely indebted to the School of Earth Sciences for maintaining their Field Geology
program; to Dr. David Elliot, Dr. Terry Wilson, Dr. Shelley Judge, the states of Utah & Nevada,
Matt Hawrylak, Zach Phillips, John Volk, Joel Main, Joe Voyles, Andi Portier, Dana Borg,
Claire Mondro, Amanda Howard, and Sarah Starkey for making Field Camp the BEST and most
affirming experience of my life. Thank you to every one of the friends I’ve mentioned, and to
those I haven’t: Jameson “Dino” Scott, Edwin Buchwalter, Nick Leeper, Jeff Thompson,
“Dr.”Alex Rytel, Andrew Tenison and Kelsey Dailey for satisfying all the great clichés about
geologists. Special thanks to my undergraduate advisor Dr. Anne Carey for her guidance,
encouragement, and patience. The utmost appreciation goes to my research advisor Dr. Dave
Cole, for his wealth of knowledge, the great minds he has assembled, top-notch facilities, and

5
guidance. Lastly, I would like to thank the Earth for being the only subject of study for me, and
just an incredible place to live.

6
Chapter I
Introduction
A. Overview
As of 2009, the annual global output of carbon dioxide, or CO2, into the atmosphere from
energy production by burning of coal/peat was 12493.1 million tonnes (IEA, 2011).
Sequestration of CO2 has the possibility of mitigating much of the emissions from coal-based
energy that contribute to the greenhouse effect and global warming without sacrificing energy
production (Cook, 2012). The process of sequestering CO2 is the collection of CO2 in its gaseous
state, condensing the gas into a liquid, and injecting the liquid CO2 into a porous reservoir deep
beneath the Earth’s surface as opposed to into the atmosphere. (Benson & Cole, 2008). A
reservoir targeted for CO2 injection must have suitable porosity and sufficient volume as to store
large amounts of supercritical CO2 in order for sequestration to be viable (Benson & Cole, 2008).
In addition, a reservoir must have enough permeability to allow the sequestered CO2 to penetrate
and permeate throughout the selected horizon. Formations of the Upper Cambrian- Early
Ordovician Knox Dolomite supergroup, including the Copper Ridge Dolomite, Rose Run
Sandstone, and Beekmantown Dolomite, have been previously identified as potential reservoirs
for CO2 sequestration in Southern Ohio (Wickstrom et al, 2010).
The criteria by which these formations of the Knox Supergrouphave been identified as
possible sequestration horizons include: 1.) Location within the Ohio River Valley, a region with
many major coal-burning electricity facilities that emit large amounts of CO2gas that could
otherwise be sequestered within these formations (Benson & Cole, 2008). 2.) Depth of at least
eight hundred meters; the target boundary past which high pressures increase CO2 density as to
fill available pore space as supercritical fluid and limit CO2 buoyancy when it encounters fluids

7
within a reservoir. (Benson & Cole, 2008). The Copper Ridge, Rose Run, and Beekmantown
formations each lie well below this depth threshold. 3.) Porous, permeable horizons of
reasonable thickness to serve as CO2 storage reservoirs (Wickstrom et al, 2010). 4.) Presence of
an impermeable geologic seal to contain the injected CO2 within the targeted formation. Non-
porous, impermeable layers within Early Ordovician Beekmantown formation has been
mentioned as a possible geologic seal for both the underlying Copper Ridge Dolomite and Rose
Run Sandstone (Wickstrom et al, 2010).
The samples used for this study were taken from the Aristech well located in Scioto
County, Ohio. Samples include: one sample from the Beekmantown Dolomite near the Rose Run
contact, two samples from the Rose Run Sandstone, and six samples from the Copper Ridge
Dolomite.
B. Objectives
The goal of this research project is to accomplish the following:
i. Gain a sense of the stratigraphic, petrographic, structural, and bulk mineralogical
characteristics of the Copper Ridge Dolomite, Rose Run Sandstone, and
Beekmantown Dolomite that would ultimately allow or inhibit its use as a reservoir
for the sequestration of supercritical CO2.
ii. Identify ideal horizons for sequestration and understand vertical heterogeneity within
formations based upon porosity, permeability, and pore characteristics.
iii. Identify intervals that would act as either interstitial or overlying geologic seals that
would prohibit the migration of sequestered CO2 into overlying layers.

8
iv. Provide an estimate for the amount of supercritical CO2an identified horizon can
sequester based upon interval thickness, temperature, porosity, pressure, density, and
pore-filling efficiency.
C. Previous Work
The Upper Cambrian Copper Ridge Dolomite formation has been evaluated as a
hydrocarbon reservoir and possible sequestration reservoir many times in the past. It’s
characterization as a CO2 reservoir has been largely overlooked in favor of other Cambrian
formations such as the Mount Simon Sandstone due to higher porosity levels and historic use as
a target formation for hazardous waste and brine injection. In Morrow County, Ohio the Copper
Ridge was the target formation for oil production beginning in 1959, reaching its peak in the
1960’s, and production continues to this day, though the yields are a fraction of what they once
were (Hansen, 1998). Characterization of petrography, diagenesis, hydrocarbon content, and seal
characteristics confined to Morrow County was completed by Kenneth Petrie as an unpublished
senior thesis at The Ohio State University (Petrie, 1982). In 2010, the Midwest Regional Carbon
Sequestration Partnership (MRCSP) published Phase I of their extensive evaluation of possible
sequestration reservoirs throughout the Midwestern United States, in which the Copper Ridge is
mentioned as a target for further evaluation of its CO2 sequestration capability, to be completed
in Phase II (Wickstrom et al, 2010). Encompassed within the MRSCP Report, The Ohio
Department of Natural Resources Division of Geological Survey published a more specialized
report that included the Copper Ridge within a list of CO2 sequestration horizons near the
Mountaineer Power Plant in New Haven, West Virginia (Baronoski & Riley, 2010). Building off
of the ODNR’s findings, the Battelle corporation has also evaluated the Copper Ridge, and

9
observed the presence of a 50ft porous zone as the target of sequestration for the near the
Mountaineer Plant (Bacon, et al. 2010).
The Upper Cambrian Rose Run Sandstone has been the subject of hydrocarbon
exploration with gas production wells starting in 1965; drilling for gas has escalated dramatically
since 1988 (Hansen, 1998). Following the trend of other Cambrian formations, the Rose Run has
been evaluated as a possible CO2 sequestration target, commonly in favor of the Copper Ridge
Dolomite. The MRCSP mentioned in Phase I of its study that the Rose Run had all the
characteristics of an acceptable sequestration reservoir and seal combination with the
Beekmantown Dolomite, though it raised questions regarding lateral porosity/permeability
homogeneity and stated that no injection had been initiated as of 2010 (Wickstrom et al, 2010).
The ODNR report on the area near New Haven, West Virginia identified the Rose Run as an
optimal sequestration horizon for the area due to its porosity, permeability, and confines between
nonporous intervals of the Copper Ridge and Beekmantown Dolomites (Baranoski & Riley,
2010). Interactions between the brine chemistry of the Rose Run Sandstone and CO2 have also
been modeled, concluding that mineral trapping will allow large quantities of CO2 to be
sequestered over the long term, with solubility trapping being the short-term mechanism (Zerai,
2006). Structural viability by use of pressure and stress models to measure possible deformation
from CO2 injection ultimately reflected favorably for the Rose Run as a sequestration reservoir.
(Goodarzi et al, 2011)
The Beekmantown Dolomite formation of the Early Ordovician has been primarily
mentioned as a seal for the underlying Copper Ridge and Rose Run formations (Wickstrom et
al., 2010). From the gathered literature, there is no mention of CO2sequestration capabilities
within the Beekmantown Dolomite due to a lack of porosity and permeability. Although the

10
Beekmantown is known to be a hydrocarbon reservoir in some areas of Ohio, this is not the case
in Scioto County. According the MRSCP Phase I report, there are few observed fractures within
the Beekmantown Dolomite and its use as an overall geologic seal for any potential CO2
sequestration in the underlying Rose Run or Copper Ridge is viable (Wickstrom et al. 2010).

11
Chapter II
Methodology
All research and analyses were conducted in the Subsurface Energy Materials
Characterization and Analysis Lab (SEMCAL) at The Ohio State University School of Earth
Sciences. Nine samples of the Knox Dolomite Supergroup were taken from the Aristech well
Scioto County, Ohio, and were obtained from the Ohio Department of Natural Resources
Division of Geologic Survey’s Core Facility. Five were drawn from the Copper Ridge Dolomite,
two from the Rose Run Sandstone, and one sample is from the base of the Beekmantown
Dolomite. Analyses performed on these samples were based upon mineralogy, grain
size/geometry/type, porosity, pore size/geometry/type/distribution, diagenesis, permeability, and
bulk mineralogy.
Aristech Well
Figure 1.—County map of Ohio showing
the location of the Aristech Well, from
which samples were taken for this study
N

12
A.) Petrography: Mineralogy, Grain/Pore Characteristics, Diagenesis
Analyses of mineralogy, grain and pore characteristics, and diagenetic
processes/generations were completed by use of polarized light microscopy (PLM) and scanning
electron microscopy (SEM).
Polarized light microscopy was performed by observation of polished thin sections of the
core samples using an Olympus BX53 with 4x, 10x, and 40x objective lenses. Olympus SC30
image capturing hardware integrated with the microscope and separate image processing
software allowed further sample interpretation, measurement, and image presentation. PLM
allowed for detailed analysis of mineralogy, grain and pore type/relationships, cement type,
structures present, and diagenesis. Due to the ease of use of PLM compared to SEM, this was the
primary method used to evaluate petrographic characteristics.
A scanning electron microscope uses a beam of concentrated electrons contained within a
chamber to scan any focal point of a sample. Images are collected and processed from secondary
and backscattered electrons that are collected by detectors after contact with the sample within
the beam chamber. These images are then analyzed to determine mineral distribution and
association as well as the microtexture of a sample. Mineral mapping is also available by use of
QEMScan, which analyzes mineral and pore distribution within a given scan area and assigns
mineral identification based upon known values of electron scattering for each mineral.
B.) Porosity& Permeability:
The detailed measurements of porosity type,pore volume relative to sample size, pore
size distribution, and permeability are required to quantify a potential reservoir’s capacity for
13
storing sequestered CO2. These crucial measurements were collected by PLM, SEM, and
mercury porosimetry.
Often referred to as “mercury intrusion”, mercury porosimetry is measured using
Micromeritics Autopore mercury porosimeter, or Hg φ. This technique applies a range of
pressures to a sample immersed in liquid mercury to measure the amount of mercury intruded
into the sample over an increasing pressure gradient followed by a decreasing pressure gradient.
Pore size can then be quantified as it is inversely proportional to the pressure at which mercury
penetrates into the sample. The Hg φ evaluation mechanism is dual stage process to evaluate the
pore size variation within the sample. The first stage utilizes nitrogen gas to pressurize the
mercury and sample system from 0-50 psia. Further penetration of mercury into the sample is
then evaluated by the Hg φ use of a high pressure fluid to increase the system pressure from
atmospheric to 60,000 psia, and then back down to normal ambient air pressure.
C.) Bulk Mineralogy
X-ray diffraction analysis, or XRD, was completed by use of a PANalytical X’Pert PRO
XRD analysis machine. The x-ray diffraction method is based upon focusing x-rays at a
homogenized powder sample at a fixed angle. The x-rays diffract off of the powered sample at
variable angles based upon mineral composition, yielding a sense of the bulk mineralogy of the
sample. As the sample is analyzed, the machine focuses the x-rays over the entire surface of the
sample, and the angles of the diffracted rays are then absorbed by a detector. The output XRD
analysis is a graph of Position (˚2 Theta) (based upon copper standard) vs. Counts, which is then
analyzed by matching peak intensities for the ˚2 Theta values against a database of minerals with
known ˚2 Theta values. As there are many different minerals for the same peaks, matching every

14
peak value for a given signal and having the true bulk mineralogy exactly right takes time,
experience, and a thorough understanding of the mineralogy of the sample based upon
petrography.

15
Chapter III
Stratigraphy and Geologic Setting
The Copper Ridge Dolomite is a Late Cambrian (500 Ma) carbonate that can be found
from Eastern Indiana, Northern Kentucky, and throughout Ohio and is recognized as a sandy
dolostone with interbedded sandstone, and thick intervals of vuggy dolostone (Wickstrom et al.,
2010). Equivalent carbonate formations of the same age as the Copper Ridge can be found from
eastern Maryland spanning to west to Indiana and north to Michigan, as much of the Laurentia
craton was covered by a shallow proto-Atlantic Ocean, the Iapetus Sea (Hansen, 1998). The
platform created by the shallow seas of the Iapetus allowed the deposition of carbonate
sediments and marine sands (Figure 3). A regression caused by “cessation of extensional
tectonics on the passive margin” extended these sediments outward from the platform across all
of Ohio, and most of Michigan and Indiana (Wickstrom et al., 2010). Over time, the Cambrian
Knox Unconformity
Figure 2.– Stratigraphic column of
Ohio showing the age, stratigraphic
relationship between the Copper
Ridge, Rose Run, and
Beekmantown formations (500 -485
Ma), and the Knox Unconformity
(Wickstrom et al. 2010).

16
carbonates dolomitized creating thick layers of dolomite with interbedded terrestrial sediments.
The Copper Ridge in Ohio follows the progradation of sediments as it shallows and thins toward
the north and west below the Knox Unconformity. To the southeast, the formation plunges and
thickens toward the Rome trough alucogen due to the Waverly Arch (Figure 7) (Hansen, 1998).
Overlying the Copper Ridge is the only sandstone within the Knox Dolomite, the Rose
Run Sandstone. The upper contact of the Upper Cambrian Rose Run forms an unconformity with
the Beekmantown Dolomite and is considered the division between the Upper Cambrian and
Early Ordovician time periods (Freeman, et al. 2003, Wickstrom, et al. 2010). The Rose Run is
known by various names, and is found from Kentucky through Ohio into West Virginia,
Pennsylvania, and New York as it follows the rest of the Knox Dolomite dipping and thickening
eastward toward the Rome trough alucogen (Figure 5) (Wickstrom, et al. 2010). In southern
Figure 3.--Map showing the United States and the extent of the Iapetus Sea during the
Late Cambrian (500Ma). The star marks the position of the Aristech Well where the
Copper Ridge Dolomite and Rose Run Sandstone were deposited upon the shallow sea
carbonate shelf (Blakey, 2007).

17
Ohio, the Rose Run’s thickness is ~26-30 feet as it follows an eastward dip of ~70 feet per mile.
The origin of the Rose Run is considered to be a “peritidal to shallow subtidal marine
environment” in which sedimentation of siliciclastics occurred with carbonates deposited on a
carbonate shelf when the Iapetus Sea was found within the Laurentian craton (Wickstrom, et al.
2010).
The last formation that will be discussed in this study is the Beekmantown Dolomite
formation which unconformablyoverlies the Rose Run Sandstone, and marks the beginning of
the Early Ordovician (485 Ma) within the Aristech Well. The Beekmantown Dolomite represents
the last unit of the Knox Supergroup, and the upper contact istruncated by the Knox
Unconformity.
The Beekmantown composed primarily of carbonate sediments with thin interbeds of clastics
deposited on the shallow platform of the Iapetus Sea (Wickstrom, et al 2010 & Hansen, 1998).
Figure 4. – Map showing the United States during the Early Ordovician (485 Ma) as the Iapetus Sea began
to regress, shallowing the carbonate platform upon which the Beekmantown Dolomite was deposited. The
star marks the position of the Aristech Well. (Blakey, 2007)

18
The Ordovician is when the Iapetus Sea began to close and shallow (Figures 3 & 4), and
following the trend of the rest of the Knox formation, the Beekmantown dips and thickens
toward the east as it thins and truncates to the west. From well logs, the Beekmantown is shown
to be ~270 feet thick in southern Ohio.
Structurally, the members of the Knox formation are affected by the Upper Cambrian
Waverly Arch, an anticline that along with the Middle Ordovician Knox Unconformity, causes
the Copper Ridge to thin, while the Rose Run Sandstone &Beekmantown Dolomite thin and
pinch out toward the west (Figures 5& 6). Each formation thickens toward the Rome Trough to
the east and tectonic features surround southern Ohio, but the Waverly Arch is the only major
feature (Figures 5-7) (Wickstrom, et al. 2010, Baronski & Riley, 2010). These other major
features are observed in eastern Kentucky, western West Virginia, western Pennslyvania, and
northeastern Ohio. Causes of these structures are typically tectonic faults, or faults resulting from
the dramatic drop-off of the Rome trough alucogen. (Wickstrom et al. 2010)
Figure 5.– Geologic cross-section showing the Waverly Arch, which
caused the Copper Ridge, Rose Run, and Beekmantown to dip to the
east. The subsequent Knox Unconformity caused the formations to thin
or pinch out to the west (Riley et al, 2002)

19
Figure 7.– Map showing major structures present during the Ordovician in relation to the Aristech
Well (Baronoski& Riley, 2010).
Figure 6.–Map showing major structures present during the Cambrian in relation to the Aristech
Well, primarily the Rome Trough to the Southeast (Baronoski& Riley, 2010).

20
Chapter VI
Copper Ridge Dolomite
A shallow marine carbonate shelf is an ever-changing depositional setting, and vertical
heterogeneity within formations like Copper Ridge Dolomite record the dynamics of such an
environment (Figure 8). Vertical changes in lithology within Copper Ridge can be considered
different facies that reflect the evolution of the Iapetus Sea carbonate shelf through the Upper
Cambrian (500 Ma). These facies differ according to mineralogy, grain size/structure,
intrasample heterogeneity, diagenesis, porosity, and permeability. Facies of Dolomicrite
andIntradolomicrite are present in various samples drawn from a 101.2 ft section of the Copper
Ridge Dolomite in the Aristech Well in southern Ohio between 4222.2 ft and 4321.4 ft and
alternate with depth (Figure 8).Due to the differences between these facies,they will each be
discussed individually according to their potential for the sequestration of CO2.
Copper Ridge Dolomicrite Facies
A. Petrology
Dolomicrite is the most common type of dolomite found within this interval of the
Copper Ridge Dolomite from the Aristech Well in Scioto County, Ohio. Dolomicrite is derived
from the dolomitization of micritic limestone, or lime mud.Dolomicrite facies within the Copper
Ridge alternate with depth, and include the following samples: AR1-5 from 4222.2 ft-4222.6 ft,
AR1-8 from 4304.1 ft-4304.3 ft, AR1-9 from 4309.0 ft-4309.2 ft, and AR1-11 from 4321.1 ft-
4321.4 ft. Within these samples, the major mineral is dolomite, making up 80 to 90%. Dolomite
grains are cloudy with organics and are typically subhedral to anhedral crystals averaging

21
0.1mm, with euhedral rhombs displaying zoning (Figure 9 & 10). Zoning and euhedral crystals
are more common in the shallower AR1-5 sample due to mineral nucleation around organic rich
ooids withspace for mineral growth, yielding increased porosity (Figures 9-12). Euhedral rhombs
also occur as secondary mineralization on the rims of vugs, growing inward closing the pore
space.Dolomite nucleation increases with depth, as ooid occurrence, dolomite crystal size, and
euhedral rhomb occurrence decreases. Blocky or sparry types of dolomite with homogeneous
interlocking crystal growth increase with depth as well (Figures 8-12).
Figure 9.- Thin section photo of AR1-5
with organic rich ooids serving as nuclei
for dolomite mineral growth and euhedral
crystals. Blue spaces are areas of pore
space filled with epoxy. 4x, crossed-
polarized light.
Figure 10.- Thin section photo of AR1-8
with fewer organic rich ooids, more
mineral nucleation, and more sparry
dolomite mineral growth. Blue spaces are
areas of pore space filled with epoxy. 4x,
plain-polarized light.

22
Fig
ure
8.-
Dia
gra
m o
f th
e C
op
per
Rid
ge
Do
lom
ite
wit
h t
hin
sec
tio
n p
ho
tos
and
sam
ple
id
enti
fica
tio
n d
isp
layin
g f
acie
s al
tern
atin
g w
ith d
ep
th.
This
dia
gra
m a
lso
ill
ust
rate
s th
e d
ata
gap
bet
wee
n s
am
ple
s th
at l
imit
the
com
pre
hensi
venes
s o
f th
is s
tud
y.
Dep
th o
f b
ou
nd
arie
s b
etw
een f
acie
s ar
e no
t
rep
rese
nta
tive
of
true
faci
es b
ound
arie
s.

23
Secondary mineral sand cement within the dolomicrite facies of this interval of the
Copper Ridge Dolomite make up between 5-15% of each of the four samples. The most common
secondary mineral is quartz in the form of silica cement and overgrowth binding dolomite
crystals and filling pore space (Figure 13). In order of descending abundance, other secondary
minerals include: organics in the form of ooids occurring within dolomite crystals, micas and
clay minerals occurring as secondary mineralization from silica-rich pore-filling fluid and
styolites, glauconite as secondary mineralization, and pyrite from precipitation within silica-rich
fluid. AR1-9 has a significant amount of silt and clay minerals occurring as fracture-fill up to
6mm wide visible primarily in hand sample.
Ooids are the primary structures present in the dolomicrite facies, serving as dolomite
crystal nuclei in shallower samples (Figures 9, 10, & 12), and areas of dark organics within
sparry dolomite (Figure 11). Vugs occur within samples AR1-8, AR1-9, and AR1-11 where
areas void spaces were created from the dolomitization of the original micritic limestone, and
Figure 11.- Thin section photo of AR1-9
with some organic-rich ooids, much more
mineral nucleation, and almost total
sparry dolomite growth. 4x plain-
polarized light.
Figure 12.- Thin section photo of AR1-
11 with some ooids, mineral nucleation,
some euhedral dolomite rhombs, and
some sparry dolomite. Overall, a mix
between AR1-8 and AR1-9. Blue spaces
are areas of pore space filled with epoxy.
4x plain-polarized light.

24
were subsequently filled either partially or fully by euhedral dolomite from secondary
mineralization. Areas of compaction are common in within AR1-9, creatingstyolites of mica and
clay rich silica formed by sedondary mineralization.
Although each of these samples record different environments within the evolution of the
shallow marine carbonate shelf during the Upper Cambrian, their diagenesis is somewhat the
same. Each of the dolomites within these samples formed from the dolomitization of an
ooidicmicritic limestone, and was cemented by the precipitation of silica, dolomite, and other
lesser minerals from a silica-rich fluid. AR1-9 records compaction, fracturing, and
dolomitization than the other samples. This accounts for the styolites, silt and clay mineralization
within wide fractures in hand sample, and complete sparring of the dolomite within the sample.
Figure 13.-A scanning electron microscope QEMSCAN image of an area of the AR1-5 thin section
showing mineral assemblage and association, as well as pore space. Pixel color indicates the mineral
present according to the key on the right. Dolomite (blue), Quartz (salmon), Pore Space (black), and K-
Feldspar (cyan) are the primary features pictured.

25
B. Porosity/Permeability
Petrographic differences of the four samples that comprise the dolomicrite facies of the
Copper Ridge Dolomite account for differences in porosity between the samples as well.
Connected porosity measurements from mercury porosimetry were: 8.9% for AR1-5, 3.25% for
AR1-8, 0.88% for AR1-9, and 1.86% for AR1-11. Average pore diameters: 0.6819 µm for AR1-
5, 0.5584 µm for AR1-8, 0.1757 µm for AR1-9, and 0.1311nm for AR1-11. Permeability
measurements were: 16.96 mDarcies for AR1-5, 11.08 mDarcies for AR1-8, 5.77 mDarcies for
AR1-9, and 10.84 mDarcies for AR1-11. These measurements were quite accurate compared to
hypothesized values of the four samples considering the type of mineral crystallization,
compaction, pore size, and distribution seen in thin section (Figures 9-11).
The only type of porosity within the four dolomicrite samples is intercrystalline and
angular to sub-angular, as most of the pore space occurs between euhedral-subhedral dolomite
crystals with quartz cement lining (Figure 13). There is a reasonable interconnectivity of pores
found in AR1-5, AR1-8, and AR1-11, which is consistent with the permeability measurements
listed. As seen in the Scanning Electon Microscope’s QEMSCAN (Figure 13), the porosity and
pore interconnectivity is largely diminished by silica cementation and overgrowth. The
differences in both porosity and permeability for each of the samples in the dolomicrite facies are
attributed to mineral nucleation of dolomite and sparry dolomite growth. Lack of both mineral
nucleation and sparry dolomite growth contribute to the high porosity and permeability observed
in AR1-5. As expected with large amounts of mineral nucleation and a sparry dolomite texture,
AR1-9 had the least amount of pore space and was the least permeable. According to the
differential intrusion vs. pore size graph (Figure 14), which shows the pore sizes that contribute
the most to porosity, this phenomena is also true quantitatively. AR1-5 has the widest variety and

26
largest pore sizes available for intrusion, followed by AR1-8, AR1-11, and AR1-9. Overall,
sparry dolomite growth and dolomite nucleation contribute almost exclusively to nanometer size
pores, and diminished pore space.

27
F
igure
14
.- D
iffe
ren
tial
Intr
usi
on v
s P
ore
Siz
e gra
ph o
f th
e fo
ur
sam
ple
s fr
om
the
Do
lom
icri
te F
acie
s o
f th
e C
op
per
Rid
ge
Do
lom
ite.
This
gra
ph r
efle
cts
the
am
oun
t o
f p
ore
sp
ace
for
a giv
en p
ore
siz
e d
iam
eter
. T
he
hig
her
sp
ikes
ind
icat
e th
e p
ore
siz
es t
hat
contr
ibute
the
mo
st t
o t
he
over
all
po
rosi
ty.
Thin
sect
ion p
ho
tos
at 4
x f
or
each
sam
ple
sho
w t
he
typ
e o
f p
oro
sity
ref
lect
ed b
y t
he
gra
ph.

28
C. Bulk Mineralology
Figure 15.- X-ray Diffraction graph for a pure sample of AR1-5, displaying diffraction angle position (°2
Theta) vs counts, or peak intensity. AR1-5 is representative of AR1-8 & AR1-11 as well. Dolomite and
quartz are the primary minerals, and there is a lack of “background noise” in the signal.
Figure 16.- X-ray Diffraction graph for a pure sample of AR1-9, displaying diffraction angle position (°2
Theta) vs counts, or peak intensity. Compared to Figure 15, this signal has many more small peaks and
“background noise” indicating a more complex mineral assemblage associated with silt and clay minerals
found in thick fractures within the sample.

29
Reinforcing petrographic observations, there is not much difference in bulk mineralogy in
samples AR1-5, AR1-8, and AR1-11 according to X-ray diffraction analysis; where the primary
minerals present are dolomite and quartz (Figure 15). This is not the case in AR1-9 however; as
there is a more complex mineral assemblage and much more “background noise” in the signal
along with many more small peaks than the AR1-5 signal (Figures 15 & 16). The higher
occurrence of smaller peaks indicates a more complex mineral assemblage and more clay and silt
minerals that are present as secondary mineralization within the fractures found in hand sample.
The peak identification process is often tedious and is limited by the mineral database, user
experience, and homogeneity of the sample. As such, this analysis will be used as a qualitative
supplement to petrographic observations for the rest of this study.

30
Copper Ridge Dolomite:
Intradolomicrite Facies
A.) Petrology
Occurring just below sample AR1-5, is the second facies within the Copper Ridge
Dolomite identified in this study, the intradolomicrite facies. Found between 4228.2 ft and
4237.7 ft, the intradolomicrite encompasses samples AR1-6 and AR1-7 (Figure 8). This interval
is distinctly different from the dolomicrite facies due to the occurrence of quartz sand particles
contained within a dolomicrite matrix (Figures 17 & 18). This type of facies can be associated
with the migration of a sandy lime mud into a pre-existing ooidic dolomite at the time of
deposition as the shallow marine carbonate shelf evolved (Figures 17 & 18).
Both quartz and dolomite are the major minerals found within the samples, but dolomite
makes up most of AR1-6 at 55%, and 40% dolomite AR1-7. The dolomite in both samples is the
Figure 17.- Thin section photo of sample
AR1-6 from 4228.2’-4228.6’ showing
pre-existing ooidic limestone, fractures,
and quartz sand grains in micritic
dolomite matrix. 4x, crossed-polarized
light.
Figure 18.- Thin section photo of sample
AR1-7 from 4237.4’-4237.7’ showing
pre-existing ooidic limestone, smaller
fractures, and quartz sand grains in
micritic dolomite matrix. 4x, plain-
polarized light.

31
organic-rich matrix of the rock, and is derived from dissolution of a pre-existing oodic dolomite,
then the dolomitzation of a limestone mud. AR1-6 has layers of dolomite with alternating
euhedral to subhedral crystals, indicating different mineral nucleation modes. Average size of
matrix dolomite crystals in AR1-6 is >20µm while some sparry dolomite crystals near fractures
average 40µm. The largest dolomite crystals are 0.5mm and secondarily fill of vug pore space.
The dolomite in AR1-7 exhibits little variation in crystal size with euhedral and subhedral matrix
crystals averaging >20µm. The only occurrence of sparry dolomite crystals is within the
remnants of the ooidic dolomite, with crystals ~50µm.
The sand quartz grains within these samples record the ever-changing environment of the
shallow marine carbonate shelf, with migrating sand shoals, lime mud deposition, and
transgression/regression cycles. These changes differentiate the intradolomicrite facies from the
dolomicrite facies within the Copper Ridge Dolomite. Within 35% of AR1-6 and 55% of AR1-7,
quartz occurs as well-rounded to sub-angular marine sand and quartz cement. The quartz sands
within AR1-6 occur in distinct well-sorted deposition layers alternating with the dolomite matrix,
but both are seen to churn and swell with each other indicating solution compaction. Average
quartz grain size in AR1-6 is 150µm, and the largest grain 0.8mm. In the AR1-7 sample, quartz
grains occur in alternating layers of well-sorted and compacted grains and moderately well-
sorted grains that are not compacted, where spaces between grains are filled with dolomite
matrix. Average grain size for the quartz sand in AR1-7 is 0.2mm, and the largest grain is
0.5mm.
Secondary minerals within both samples make up <5% of the total slide, and include in
descending order: organics, micas, k-feldspar, glauconite, orthoclase feldspar, and pyrite. Aside
from the feldspars, which occur as well-rounded sand particles in both samples, the other

32
minerals are secondary minerals that are found along fractures, and were precipitated from
solution.
In both intradolomicrite facies samples of the Copper Ridge Dolomite, the primary
structure present is deposition plains of quartz crystals and lime mud. Pre-existing ooidic
dolomite is preserved along these fractures as well, indicating its dedolomitization, and then
redolomitization of the dolomite rich silica solution cementing the quartz crystals in a dolomite
matrix (Figures 17 & 18). Flows and swells of the quartz crystals and the dedolomitized lime
mud before redolomitization further this observation. After dolomitization of the matrix,
secondary fracturing occurred, likely due to compaction, followed by solution fill and secondary
mineralization (Figures 19 & 20).
Figure 19.- Thin section photo of AR1-6
representative of the whole slide, with
quartz sands, dolomicrite matrix, and
secondary fractures/mineralization. 4x
crossed-polarized light.
Figure 20.- Thin section photo of AR1-7
representative of the whole slide, with
more quartz sands than AR1-6, a finer
dolomicrite matrix, and secondary
fractures. 4x crossed-polarized light.

33
B.) Porosity& Permeability
From petrography, the pore types within AR1-6 and AR1-7 are primarily intercrystalline
or are found along secondary fractures. Intercrystalline pores occur in between dolomite matrix
grains or along layers of dolomite matrix mixed with quartz grains. Pores found along secondary
fractures have been filled by secondary mineralization of organics, micas, clays and glauconites
and are somewhat interconnected. The greatest contribution of larger pores is along these
fractures in AR1-7, whereas AR1-6 has many more large intercrystalline pores that occur
primarily in mixed areas of dolomicrite matrix and quartz sediment grains (Figure 21).
Porosity and permeability measurements from the intradolomicrite facies of this section
of the Copper Ridge Dolomite were evaluated using mercury porosimetry. AR1-6 from the
interval 4228.2'-4228.5' has an overall porosity of 4.23%, an average pore diameter of 0.4µm,
and permeability of 25.11 mDarcies. AR1-7 from the interval 4237.4'-4237.7' has an overall of
3.85%, an average pore diameter of 0.095µm, and permeability of 19.76 mDarcies. The
difference in average pore size is very apparent in Figure 21. Many of the pores in AR1-7 that
were intruded by mercury were >.1µm yielding the very small average pore size of 0.095µm,
whereas the pores of AR1-6 covered a range of sizes and yielded an average pore diameter of
0.4µm (Figure 21). This discrepancy is directly tied to petrography, wherein the larger dolomite
crystals in the matrix of AR1-6 have more pore space within them compared to the finer
dolomite crystals in in AR1-7. Overall porosity and permeability differences between the two
samples are also attributed to this petrographic difference of pore size and distribution.
Secondary fractures in both AR1-6 and AR1-7 (Figures 19 and 20) contribute to the elevated
permeability measurements compared to the samples from the Copper Ridge dolomicrite facies.

34
Fig
ure
21
.- D
iffe
ren
tial
Intr
usi
on v
s P
ore
Siz
e gra
ph o
f th
e tw
o s
am
ple
s fr
om
the
intr
ado
lom
icri
te f
acie
s o
f th
e C
op
per
Rid
ge
Do
lom
ite.
This
gra
ph
refl
ects
the
am
ou
nt
of
po
re s
pac
e fo
r a
giv
en p
ore
siz
e d
iam
eter
. T
he
hig
her
sp
ikes
ind
icat
e th
e p
ore
siz
es t
hat
co
ntr
ibute
the
mo
st t
o t
he
over
all
po
rosi
ty.
Thin
sec
tio
n p
ho
tos
at 4
x f
or
dif
fere
nt
pea
ks
of
the s
ignal
sho
w t
he
typ
e o
f p
oro
sity
ref
lect
ed b
y t
he
gra
ph.

35
C.) Bulk Mineralology
Analysis of the mineral assemblage was completed by x-ray diffraction , and was
consistent with petrographic analysis, with the primary minerals being quartz and dolomite, and
minor glauconite, and feldspar signals. For the reasons stated in the dolomicrite facies section,
the x-ray diffraction method must be used as a supplement to petrographic analysis for a study
such as this.
Figure 22.- X-ray Diffraction graph for a pure sample of AR1-6, displaying diffraction angle position (°2
Theta) vs counts, or peak intensity. Dolomite and quartz are the primary minerals measured, with some
glauconite peaks.

36
Figure 23.- X-ray Diffraction graph for a pure sample of AR1-7, displaying diffraction angle position (°2
Theta) vs counts, or peak intensity. Dolomite and quartz are the primary minerals measured, with some
feldspar peaks.

37
Copper Ridge Dolomite: Brine Chemistry
Brine chemistry is a vital component of any formation that needs to be understood to
evaluate a reservoir’s overall viability for the sequestration of CO2. Rate of mineralization and
dissolution is controlled by brine composition, system pressure, temperature, salinity, rate of
reaction, and solubility of CO2 (Zerai, 2006).
The saline brine of the Copper Ridge Dolomite has been evaluated experimentally to be
primarily Na+ and Cl
-, including Ca
2+, Mg
2+, K
+, Sr
2+, and Ba
2+ (Fineour, 1994). Na
+/Cl
- was
found to decrease with depth, while Ca2+
/Cl- increased, indicating a mixture of brines that varied
with depth. Total dissolved solids within the Copper Ridge brine were found to be greater than
the brines of the formations lying above it, the Rose Run Sandstone, and the Beekmantown
Dolomite (Fineour, 1994). CO2/brine reaction of the Copper Ridge Dolomite was also modeled,
focusing on injection rates, storage capacity, and monitoring of increased pressure and dispersion
rates (Bacon, et al. 2010). These parameters were simulated as an introductory “Pilot Phase”, as
well as a full-scale “Production Phase” that focused on injection rates, and overall storage
capacity for the long-term (Bacon, et al. 2010). It was concluded that the Copper Ridge brine
was acceptable for high rate CO2 sequestration, with ideal modes of transport along as well as
reactionary dispersion/CO2 solubility rates (Bacon, et al. 2010).

38
Chapter V
Rose Run Sandstone
A.) Petrography
The Rose Run Sandstone in the Aristech Well in southern Ohio is approximately 22 feet
thick. Two samples were taken for this study to characterize the Rose Run as a sequestration
horizon, AR1-3 near the contact with the Beekmantown Dolomite at 4201.2 ft-4201.45ft, and
AR1-4 near the contact with the Copper Ridge Dolomite at 4213.6 ft-4213.9 ft. Typical of a
marine sand shoal environment, the Rose Run is approximately 83% quartz grains, 2%
secondary minerals, 9% silica cement/overgrowth, and 6% pore space for AR1-3. With75%
quartz clasts, 9% secondary minerals, 9% silica cement/overgrowth, and 7% porosity for deeper
sample, AR1-4.
The primary mineral in both samples is rounded to sub-rounded quartz grains from tidal
shores ranging in size from 1mm to 0.05mm in AR1-3, and .8mm to 0.04mm for AR1-4. AR1-3
contains larger on average, more well-rounded grains that are better sorted than AR1-4, whereas
AR1-4 contains a wider mix of grain sizes (Figures 24 & 25). Silica-rich cementation occurs
between the well-sorted grains of AR1-3, with very little overgrowth. Within AR1-4, alternating
grain layers of similar size and shape are found parallel to deposition and in marine deposition
structures such as cross-bedding and truncation (Figure 25). Clay and Fe-rich Silica cementation,
overgrowth, and secondary mineralization close gaps between sub-rounded grains; solution-
based quartz is more abundant in the finer grained layers of AR1-4 than coarser-grained layers
(Figure 25). Quartz grains found in AR1-3 are rarely sutured at the edges from
solution/dissolution, as compared to AR1-4, where higher pressure interaction dissolved and
sutured most grain boundaries during cementation (Figures 24-27).

39
Secondary minerals within both AR1-3 and AR1-4 include calcite, clay minerals, biotite,
muscovite, feldspars, and glauconite. Compared to quartz grains/cement at a relative abundance
of 89%, these secondary minerals make up a small fraction of the total mineral assemblage at
5%, and are even lower in AR1-3 at 3%. Calcite, clay minerals, micas, and glauconite are from
secondary phases formed during cementation and lithification. This explains the lower
occurrence of secondary minerals with in AR1-3, where cementation and cement overgrowth are
not as abundant, thus limiting the amount of other minerals. In AR1-4, these minerals occur
within cement between the dominate quartz grains, or were accumulated in pore space before
lithifaction. Within AR1-4, large mica and glauconite grains formed by precipitation within the
cement forming fluid (Figure 27). Feldspar abundance is similar between both AR1-3 and AR1-
4, and occurs as individual sand grains among quartz grains (Figure 24).
Figure 24.- Thin Section photo ofRose
Run Sandstone sample AR1-3 @ 4201.2’;
well-sorted quartz grains with large grains
and blue spots indicating porosity. Cross-
polarized light, 4x.
Figure 25.- Thin section photo of Rose Run
Sandstone sample AR1-4 @ 4213.6’; moderately
well-sorted quartz grains occurring in two distinct
grain size layers, one above with large grains and
blue spots indicating porosity; smaller grains
below filled by clay-rich silica cement and
secondary mineralization. Plain-polarized light,
4x.

40
Structures in the Rose Run Sandstone that are visible in thin section are common amongst
marine-derived sand-rich sediments. Deposition planes and cross-bedding of layers with like-
sized clasts, and truncation of cross-beds are common, and alternate vertically. Diagenetic
history of the Rose Run appears to be light compaction, and precipitation of secondary
minerals/silica cement from solution and dissolution (Figures 25-27). Impact of each of these
diagenetic processes is greater in the AR1-4 sample than AR1-3.
B.) Porosity and Permeability
Porosity measurements of the two samples of the ~20ft section Rose Run Sandstone
taken from the Aristech Well in Scioto County, Ohio are roughly similar, with the porosity of
sample AR1-3 at a depth of 4201.2 ft-4201.45 ft at 6%; whereas AR1-4 taken from 4213.6 ft-
4213.9 ft has a porosity measurement of 7%. Average pore diameter for AR1-3 was .45 µm and
AR1-4 was .53 µm, this difference in pore size is visible in both Figure 26 and Figure 27.
Permeability values of the two samples are both high, but differ considerably, with AR1-3 at
Figure 26. – Thin section photo of AR1-4
showing silica-clay cement/overgrowth
between dissolved and sutured grain
boundaries. 10x, Crossed-polarized light.
Figure 27. – Thin section photo of AR1-4
showing more silica-clay
cement/overgrowth between dissolved and
sutured grain boundaries. 10x, Cross-
polarized light

41
50.9 mDarcies and AR1-4 at 22.7 mDarcies. All measurements appear to be on the high end for
porosity and permeability compared to the measurements taken for the Copper Ridge Dolomite
and Beekmantown Dolomite. The small difference between porosity measurements and the large
difference between the permeability measurements can both be attributed to petrographic
differences visible in thin section.
In both samples, the only visible form of porosity is intercrystalline, or pore space
occurring between the boundaries between grains. In AR1-4, with more diverse grain sizes, there
are larger pore spaces available than in the more well-sorted AR1-3 sample (Figure 28). This
difference explains the small difference in overall porosity with 7% for AR1-4, and 6% for AR1-
3. The discrepancy between porosity measurements of the two samples would be greater if the
amounts of compaction, secondary mineralization, and cementation were similar; however the
AR1-4 sample shows greater amounts of each compared to the shallower AR1-3 sample,
yielding similar overall porosity measurements despite different grain sorting. Larger amounts of
diagenesis within AR1-4 have limited the degree to which pores are interconnected, reducing
permeability, the overall pore size, and reducing the porosity.
The cumulative pore area verses pore size graph for samples AR1-3 and AR1-4 of the
Rose Run Sandstone is another way to visualize pore size distribution (Figure 29). The roughly
consistent slope of the graph for AR1-4 reflects a uniformly decreasing pore size distribution
contributing to the overall porosity of the tested sample. Within the AR1-3 sample however,
there are “jumps” in slope as the pore size decreases, indicating more pore space of a certain size
contributing to the overall porosity than other pore sizes; this means pore size/porosity
distribution is not as consistent as AR1-4. The differences in final height of the two sample

42
graphs reflect the differences between porosity between AR1-3 at 6%, and AR1-4 at 7% (Figure
29).

43
Fig
ure
28
.- D
iffe
ren
tial
Intr
usi
on v
s P
ore
Siz
e gra
ph o
f th
e tw
o s
am
ple
s fr
om
the
Ro
se R
un S
and
sto
ne.
This
gra
ph r
efle
cts
the
am
ou
nt
of
po
re s
pac
e fo
r a
giv
en p
ore
siz
e d
iam
eter
. T
he
hig
her
sp
ikes
ind
icat
e th
e p
ore
siz
es t
hat
contr
ibute
the
mo
st t
o t
he
over
all
po
rosi
ty.

44
Fig
ure
29
.- C
um
ula
tive
Po
re A
rea
vs
Po
re S
ize
gra
ph f
or
the
two
sam
ple
s ta
ken
fro
m t
he
Ro
se R
un S
and
sto
ne.
Much l
ike
the
dif
fere
nti
al i
ntr
usi
on v
s
po
re s
ize
gra
ph,
this
sho
ws
the p
ore
siz
es t
hat
co
ntr
ibute
the
mo
st t
o t
he
cu
mu
lati
ve
po
rosi
ty.
“Ju
mp
s” i
n s
lop
e in
dic
ate
a g
reat
er c
ontr
ibuti
on t
o t
he
over
all
po
rosi
ty f
or
a giv
en p
ore
siz
e.

45
D.) Bulk Mineralology
Pure samples of AR1-3 and AR1-4 were prepared without mixing calibration standards,
for X-ray Diffraction analysis to measure the overall mineral assemblage. Due to the
overwhelming abundance of quartz in both sandstone samples, signal intensity from secondary
minerals from the XRD was very small, causing the quartz and feldspar signal to be the most
abundant peaks (Figures 30 & 31). Determining absolute mineral abundance of the sample is
difficult, and cannot be determined simply by signal peak intensity. The fact that the two X-ray
diffraction graphs are almost identical is encouraging (Figures 30 & 31), only reinforces the fact
that this analysis must be a qualitative supplement to thin section microscopy.
Figure 30.- X-ray Diffraction graph for a pure sample of AR1-3, displaying diffraction angle position
(°2 Theta) vs counts, or peak intensity. Quartz and feldspar appear dominate, but lack of overall
resolution limits the amount of secondary minerals measured.

46
E.) Brine Chemistry
From previous studies, the brine composition of the Rose Run Sandstone is primarily
composed of Na+, Cl
-, with lesser values of Ca
2+, Mg
2+, Br
-, K
+, Sr
2+, SO4
2-, Fe
2+, HCO3
+, H
+,
aqueous SiO2, and Al3+
(Zerai, 2006). Concentration of total dissolved solids was also range
from 278,000 mg/kg to as high as 320,000 mg/kg. (Zerai, 2006)
Extensive CO2 interaction models of the Rose Run Sandstone saline brine for CO2
sequestration have been completed and indicate the formation is suitable as a sequestration
reservoir (Zerai, 2006). Evaluations of fluid dynamics, reactivity, short/long-term effects based
on transport models, reactive transport models for mineral trapping, and mineral-brine-CO2
reaction rates based on input flow rates, demonstrated that the Rose Run would be able to store
Figure 31.- X-ray Diffraction graph for a pure sample of AR1-4, displaying diffraction angle position
(°2 Theta) vs counts, or peak intensity. Graph is almost identical to Figure E, meaning overall lack of
heterogeneity within this interval of Rose Run Sandstone.

47
“large quantities of CO2” in the future (Zerai, 2006). This would be possible by mineral trapping
over the long-term, and over the short-term, solubility trapping would be the primary mechanism
by which the Rose Run Sandstone would be able to store large amounts of CO2.

48
Chapter VI
Beekmantown Dolomite
A.) Petrography
One sample was taken from the Beekmantown Dolomite just above the contact with the
Rose Run Sandstone at a depth of 4186.2 ft-4186.45 ft within the Aristech Well. This sample of
the Beekmantown is similar to the dolosparite facies of the Copper Ridge compositionally, with
70% dolomite grains, 28% composed of quartz sediments, quartz cement, organic material,
micas, and pyrite, and the final 2% as porespace. The origin of this sample of the Beekmantown
is from a finemicritic limestone deposited on a shallow carbonate shelf in the IapetusSea, which
underwent dolomitization (Wickstrom et al. 2010).
The dolomite grains within the Early Ordovician Beekmantown Dolomite are much finer
grained than areas of Late Cambrian Copper Ridge, with an average size of 0.02mm subhedral to
anhedral grains within anorganic rich dolomite groundmass (Figure 34). Euhedral grains as large
Figure 32 .- Thin section photo, 20x
crossed-polarizers. Vug containing
pore space and the largest dolomite
crystals found within the section within
the very fine grained dolomite
groundmass.
Figure 33 .- Thin section photo, 20x, ppl.
Very fine-grained Dolomite groundmass,
with dark areas of organic matter.

49
as 0.05mm are seen as secondary mineralization within lining the perimeter of vugs (Figure 33).
Grains within this very fine grained groundmass are very compact due to nucleation, crystal
growth, and cementation, leaving little room for intercrystalline pore space.
Secondary minerals found within this sample are dominated by quartz, both from
sediments and cementation. The primary source of quartz in this sample is from silica
cementation and quartz overgrowth of dolomite crystals, filling pore space. Layers parallel to
deposition of the original micritic limestone contain clasts of well-rounded quartz grains that
range in size of 0.04mm to 0.2mm, derived from current-carried sands. Organics, micas, and
pyrite occur along with the quartz cement, and are found between dolomite crystals, and filling
old vugs.
The Beekmantown Dolomite exhibits textural features typical of classic dolomites.
Bedding planes of the original micritic limestone are inferred from layers of varying dolomite
crystal size (Figure 34). Vugs are tabular, with the narrow dimension ranging in size from 0.2 to
2mm at the thickest point, with few containing porespace (Figure 32). Remnants of smaller vugs
closed by secondary mineralization of dolomite and quartz overgrowth are sparsely found in thin
Figure 34.- Thin Section photo, 10x, ppl.
Quartz sediments found horizontal to
deposition as inferred by size difference
of dolomite crystals moving up the photo.
Figure 35.- Thin Section photo, 10x, ppl.
The largest quartz grains found in thin
section, with dark areas of quartz
cement, organics, micas, and pyrite.

50
section along layers parallel to deposition. Circular areas of organic rich dolomite groundmass
crystals indicate ooids within the original micritic limestone. As noted, quartz sands from the
shallow marine depositional environment are found along deposition planes (Figure 34). In hand
sample, the silica rich dolomite is ridged, but contains fine fractures increasing permeability
locally.
The diagenesis of the Beekmantown is one of solution of the original micritic limestone,
and dolomitization. Silica-rich cementation led to the compaction of the fine-grained dolomite
crystals, leaving very little pore space and a very impermeable rock.
B.) Porosity and Permeability Within the single sample of the Beekmantown Dolomite from the Aristech Well
examined in this project, porosity is quite low compared to the samples taken from the Copper
Ridge Dolomite, and Rose Run Sandstone. From thin section, the largest pores occur within
vugs, and are not widespread. It is difficult to infer intercrystalline pore space due to the tight
compaction and silica cementation associated with the sample’s diagenetic history. Of all the
samples, the Beekmantown seems to have the lowest permeability due to poor interconnectivity
of pore space, again because of pervasive silica cementation.
Two samples of the Beekmantown Dolomite, taken from the same area of the sample
AR1-1, were quantified by mercury porosimetry to determine the porosity and permeability. Two
samples were selected to limit the effect of fractures skewing the data, and to determine the
overall porosity and permeability of the sample. Porosity for the first sample, AR1-1.1, was
found to be 1.6% and 1.1% for AR1-1.2, with an average of 1.4% by volume. Permeability
values were 7.8 mDarcies for AR1-1.1 and 26.7 mDarcies for AR1-1.2.
51
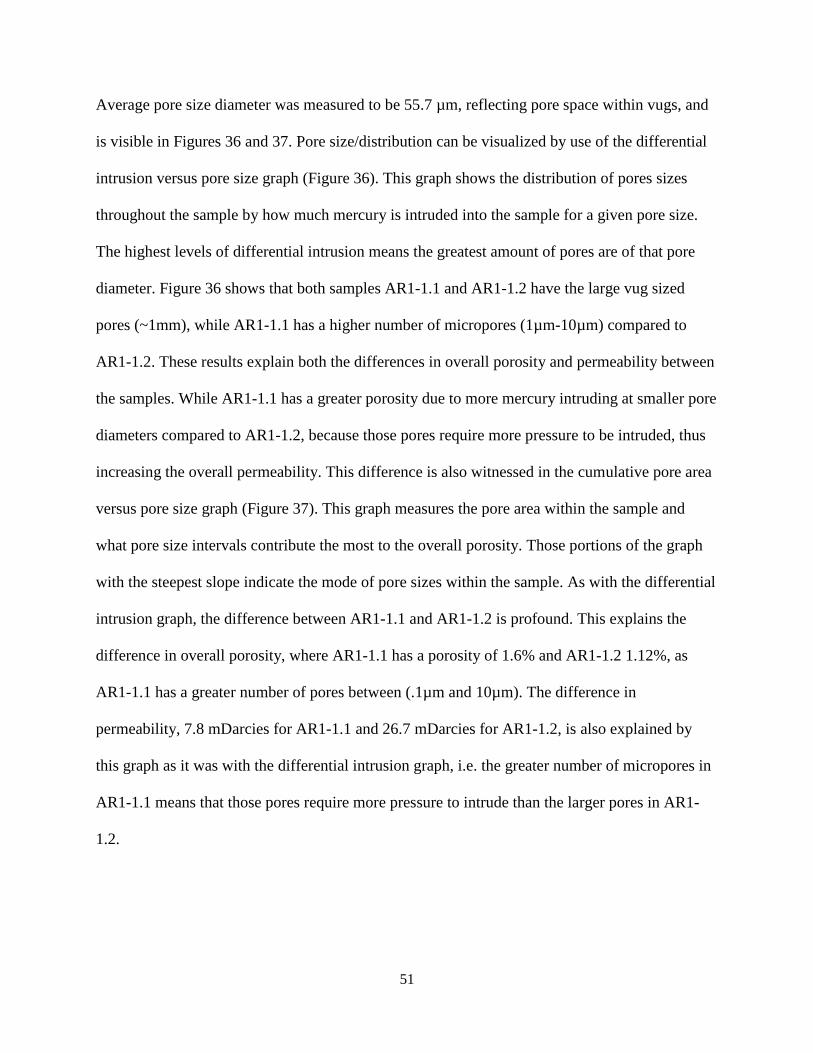
Average pore size diameter was measured to be 55.7 µm, reflecting pore space within vugs, and
is visible in Figures 36 and 37. Pore size/distribution can be visualized by use of the differential
intrusion versus pore size graph (Figure 36). This graph shows the distribution of pores sizes
throughout the sample by how much mercury is intruded into the sample for a given pore size.
The highest levels of differential intrusion means the greatest amount of pores are of that pore
diameter. Figure 36 shows that both samples AR1-1.1 and AR1-1.2 have the large vug sized
pores (~1mm), while AR1-1.1 has a higher number of micropores (1µm-10µm) compared to
AR1-1.2. These results explain both the differences in overall porosity and permeability between
the samples. While AR1-1.1 has a greater porosity due to more mercury intruding at smaller pore
diameters compared to AR1-1.2, because those pores require more pressure to be intruded, thus
increasing the overall permeability. This difference is also witnessed in the cumulative pore area
versus pore size graph (Figure 37). This graph measures the pore area within the sample and
what pore size intervals contribute the most to the overall porosity. Those portions of the graph
with the steepest slope indicate the mode of pore sizes within the sample. As with the differential
intrusion graph, the difference between AR1-1.1 and AR1-1.2 is profound. This explains the
difference in overall porosity, where AR1-1.1 has a porosity of 1.6% and AR1-1.2 1.12%, as
AR1-1.1 has a greater number of pores between (.1µm and 10µm). The difference in
permeability, 7.8 mDarcies for AR1-1.1 and 26.7 mDarcies for AR1-1.2, is also explained by
this graph as it was with the differential intrusion graph, i.e. the greater number of micropores in
AR1-1.1 means that those pores require more pressure to intrude than the larger pores in AR1-
1.2.

52
Fig
ure
36
.- G
rap
h o
f D
iffe
renti
al I
ntr
usi
on v
s. P
ore
Siz
e, i
nd
icat
ing t
he
am
ou
nt
of
mer
cury
pen
etra
tin
g t
he
sam
ple
co
mp
are
d t
o t
he
po
re
dia
met
er.
This
yie
lds
a se
nse
of
the
po
re s
ize
dis
trib
uti
on w
ithin
the
sam
ple
. T
he
two
thin
sec
tio
n p
ho
togra
phs
sho
w t
he
larg
ely b
imo
dal
po
re
size
of
the
Bee
km
anto
wn
Do
lom
ite,
vug
s an
d i
nte
rcry
stal
lin
em
icro
po
res.

53
Fig
ure
37
.- G
rap
h o
f C
um
ula
tive
Po
re A
rea
vs
Po
re S
ize,
ind
icat
ing t
he
am
ou
nt
of
po
re s
pac
e p
rese
nt
for
a giv
en
po
re s
ize,
and
the
over
all
po
re a
rea
per
gra
m.
Tw
o t
hin
sec
tio
n p
ho
tos
sho
w t
he
two
char
act
eris
tic
po
re s
izes
of
the
sam
ple
s: v
ug
s an
d i
nte
rcry
stal
linem
icro
po
res

54
Overall, the porosity and permeability for the one sample from the Beekmantown
dolomite are both quite low compared to the underlying Copper Ridge Dolomite and Rose Run
Sandstone. Such low numbers for both porosity and permeability reinforces the findings of both
Wickstrom et al, (2010) and Baronoski & Riley, (2010), which concluded that the Beekmantown
Dolomite has the possibility of being a suitable geologic seal for the sequestration of CO2 into
the Copper Ridge and/or Rose Run.
C.) Bulk Mineralogy A portion of the one sample of the Beekmantown taken from the Aristech well was
mixed with corundum standard at a proportion of 4 to 1, and analyzed by X-ray diffraction to
determine overall mineral assemblage. The results of the XRD analysis reinforced observations
Figure 38.- Graph of the X-ray diffraction signal from the Beekmantown Dolomite sample
mixed with corundum. The intensity of the signal spikes indicate the relative amounts of the
mineral listed.

55
frompetrographic analysis (Figure 38). Dolomite, quartz, and the iron-rich variation of dolomite,
ankerite, were the primary minerals identified by the XRD. Corundum spikes within the sample
signal are due to the addition of corundum standard to the sample.
D.) Brine Chemistry The brine chemistry of the Beekmantown Dolomite is very similar to that of the
underlying Rose Run and Copper Ridge, leading to observations of the mixing of the subsurface
brines (Fineour, 1994). The chemical composition of the brine was found to be predominately
Na+ and Cl
-, including Ca
2+, Mg
2+, K
+, Sr
2+, and Ba
2+(Fineour, 1994). Interaction of brines was
inferred by the decrease Na+/Cl
- moving further down the Beekmantown dolomite. Ca
2+/Cl
-
concentrations increased into the Rose Run and Copper Ridge, indicating a mixture of brines that
varied with depth (Fineour, 1994). Total dissolved solids within the Beekmantown Dolomite are
less than the other two formations as they increase with depth as well (Fineour, 1994).
Conclusions made from modeling the interaction/reaction of CO2 with the brines of both the
Rose Run Sandstone and the Copper Ridge Dolomite determined that individual brine
chemistries were suitable and even favorable for CO2 storage, dispersion, and reaction (Zerai,
2006, Bacon et al. 2010). With similar chemistry and concentration levels due to interaction and
mixing with the Rose Run and Copper Ridge, it can be interpolated that the Beekmantown
Dolomite brine would also be suitable for CO2 sequestration.

56
Chapter VII
Discussion
Three formations from the Upper Cambrian – Early Ordovician age Knox Dolomite
Supergroup have been characterized for their capabilities for CO2 sequestration: the Copper
Ridge, the Rose Run Sandstone and Beekmantown Dolomite. Nine samples have been
characterized in detail according to petrography in thin section, porosity percentage/type and
permeability by use of mercury porosimetry in conjunction with thin section observations, bulk
mineralogy according to x-ray diffraction analysis, and brine chemistry from previous literature.
Each of these parameters provide a better understanding of the rock characteristics present within
the interval of the Aristech Well in Scioto County, Ohio from 4186.2 ft to 4321.1 ft.
As stated, three primary criteria have to be satisfied for a formation, or series formations,
to be considered for CO2 sequestration: 1.) Identification of horizons that have sufficient porosity
and permeability as to accept and store supercritical CO2 within it. 2.) Presence of at least one
interval of rock with low porosity and permeability as to prevent the flow of supercritical CO2 to
outside the designated sequestration horizon and thereby serve as a geologic seal against the fluid
flow. 3.) Adjacency to a source of CO2 to be injected into the designated sequestration horizon.
Observations made in this study reflect favorably for each of these three parameters.
A.) Horizon for CO2 Sequestration
Porosity, pore characteristics, permeability, depth, and brine chemistry are the primary
criteria for an interval of rock to be considered as a sequestration horizon. Measurements of the
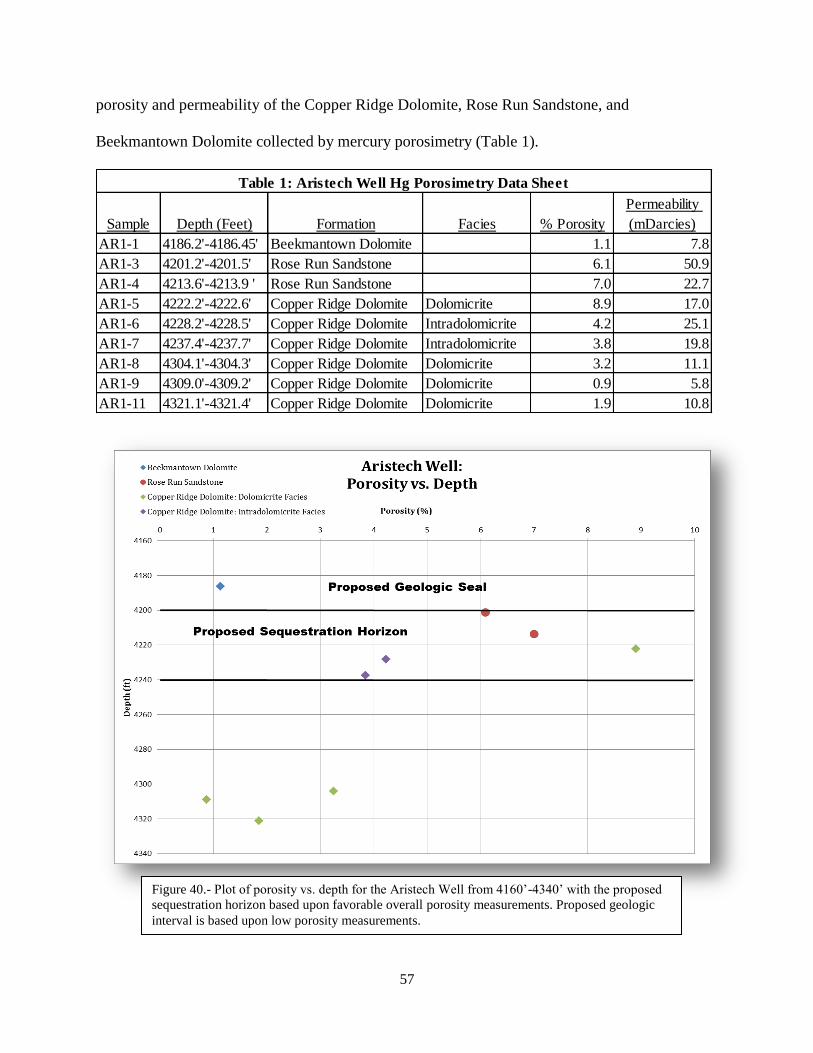
57
porosity and permeability of the Copper Ridge Dolomite, Rose Run Sandstone, and
Beekmantown Dolomite collected by mercury porosimetry (Table 1).
Sample Depth (Feet) Formation Facies % Porosity
Permeability
(mDarcies)
AR1-1 4186.2'-4186.45' Beekmantown Dolomite 1.1 7.8
AR1-3 4201.2'-4201.5' Rose Run Sandstone 6.1 50.9
AR1-4 4213.6'-4213.9 ' Rose Run Sandstone 7.0 22.7
AR1-5 4222.2'-4222.6' Copper Ridge Dolomite Dolomicrite 8.9 17.0
AR1-6 4228.2'-4228.5' Copper Ridge Dolomite Intradolomicrite 4.2 25.1
AR1-7 4237.4'-4237.7' Copper Ridge Dolomite Intradolomicrite 3.8 19.8
AR1-8 4304.1'-4304.3' Copper Ridge Dolomite Dolomicrite 3.2 11.1
AR1-9 4309.0'-4309.2' Copper Ridge Dolomite Dolomicrite 0.9 5.8
AR1-11 4321.1'-4321.4' Copper Ridge Dolomite Dolomicrite 1.9 10.8
Table 1: Aristech Well Hg Porosimetry Data Sheet
Figure 40.- Plot of porosity vs. depth for the Aristech Well from 4160’-4340’ with the proposed
sequestration horizon based upon favorable overall porosity measurements. Proposed geologic
interval is based upon low porosity measurements.

58
Given the data from mercury porosimetry (Table 1, Figure 40, & Figure 41), the
continuous interval within this section proposed as a sequestration horizon for supercritical CO2
is approximately 4200 ft-4240 ft. This interval is based upon favorable porosity and permeability
measurements for AR1-3 & AR1-4 from the Rose Run Sandstone, AR1-5 from the dolomicrite
Facies of the Copper Ridge Dolomite, and AR1-6 & AR1-7 from the intradolomicrite Facies of
the Copper Ridge Dolomite (Table 1). Thin section analysis of these samples showed the
primary porosity type was intercrystalline with some porosity occurring along fractures, resulting
from dissolution. Such porosity lends itself to the favorable permeability measurements of the
samples as well, providing a pathway for CO2 to migrate and permeate the proposed horizon.
Observations of brine chemistry made in previous works indicate both the Copper Ridge
Figure 41.- Plot of permeability vs. depth of the Aristech Well between 4160’-4340’. Proposed sequestration
horizon is based upon favorable (high) porosity and permeability measurements. Proposed geologic seal
intervalis based upon low porosity and permeability measurements.
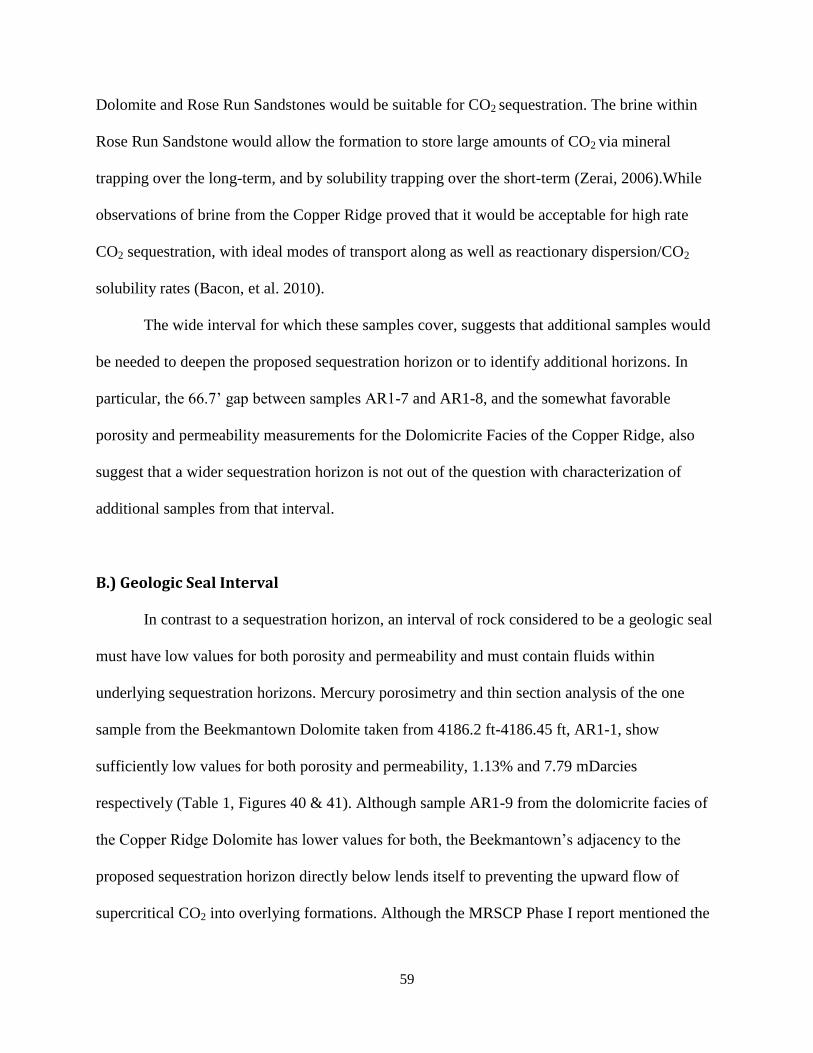
59
Dolomite and Rose Run Sandstones would be suitable for CO2 sequestration. The brine within
Rose Run Sandstone would allow the formation to store large amounts of CO2 via mineral
trapping over the long-term, and by solubility trapping over the short-term (Zerai, 2006).While
observations of brine from the Copper Ridge proved that it would be acceptable for high rate
CO2 sequestration, with ideal modes of transport along as well as reactionary dispersion/CO2
solubility rates (Bacon, et al. 2010).
The wide interval for which these samples cover, suggests that additional samples would
be needed to deepen the proposed sequestration horizon or to identify additional horizons. In
particular, the 66.7’ gap between samples AR1-7 and AR1-8, and the somewhat favorable
porosity and permeability measurements for the Dolomicrite Facies of the Copper Ridge, also
suggest that a wider sequestration horizon is not out of the question with characterization of
additional samples from that interval.
B.) Geologic Seal Interval
In contrast to a sequestration horizon, an interval of rock considered to be a geologic seal
must have low values for both porosity and permeability and must contain fluids within
underlying sequestration horizons. Mercury porosimetry and thin section analysis of the one
sample from the Beekmantown Dolomite taken from 4186.2 ft-4186.45 ft, AR1-1, show
sufficiently low values for both porosity and permeability, 1.13% and 7.79 mDarcies
respectively (Table 1, Figures 40 & 41). Although sample AR1-9 from the dolomicrite facies of
the Copper Ridge Dolomite has lower values for both, the Beekmantown’s adjacency to the
proposed sequestration horizon directly below lends itself to preventing the upward flow of
supercritical CO2 into overlying formations. Although the MRSCP Phase I report mentioned the

60
Beekmantown as tentatively being a good geologic seal for the Rose Run, and one small interval
of it had favorable porosity and permeability measurements, additional samples would be needed
to better characterize its geologic seal capabilities (Wickstrom et al. 2010).
C.) CO2 Sequestration Capabilities and Proximal CO2 Emissions
In order to calculate of the amount of supercritical CO2 that can be stored within the
selected 40 foot sequestration horizon encompassing the Rose Run Sandstone, and the
dolomicrite and intradolomicrite facies of the Copper Ridge Dolomite, many different
parameters must be accounted for. As with any substance, the density and pressure at which
gaseous CO2 turns supercritical are dependent on temperature. The temperature within the
sequestration horizon at 4200 ft is also dependent on the geothermal gradient, meaning that heat
increases with depth. In southern Ohio, away from many sources of heat such as rifting, the
geothermal gradient is 15˚C/1000m (Nathenson 1988). Taking into consideration the average
annual temperature for Scioto County, Ohio at 12.5˚C, and this average geothermal gradient, the
the temperature at 4200 ft depth would be 31.5˚C. In order to make gaseous CO2 go supercritical
it must be pressurized, and for the given the high and low temperature range, the pressures
required 76 bars, with the density of supercritical CO2 for 31.5˚ is 0.6077 g/cc for 31.5˚. For this
small sequestration horizon interval of forty feet with a radial distance of CO2 migration from the
well at 2000 meters, the calculated CO2 storage capacity is between 1.396 and 5.586 million
metric tons, depending on pore filling efficiency and assuming an average porosity of 6% over
the interval (Table 2).
The location of the Aristech Well in Scioto County, Ohio is adjacent to one of the largest
CO2 emissions producing areas from coal energy production in the United States (Benson &

61
Cole 2008). In fact, two large-scale coal burning energy plants are located less than 40 miles
from the Aristech Well, the Lawrence Energy Center/Hanging Rock in Hamilton, Ohio and
FutureGen in Point Pleasant, West Virginia. Each of these facilities emits more than 3.387
million tons of CO2 through electricity production from coal (Vulcan Project). CO2 can be
captured at either of these sites, transported, and be sequestered within the 4200’-4240’ range of
the Aristech Well, reducing a plant’s total annual emissions by up to 25% for five years
assuming total pore efficiency (Table 2). Although this amount may not seem like much, the
sequestration horizon characterized is very thin, and identification of such horizons spread
throughout the Ohio River Valley may ultimately lead to lower CO2 emissions into the
atmosphere.

62
Fo
rmati
on
Fo
rmati
on
R
ad
ial
dis
tan
ce
CO
2R
ad
ial
dis
tan
ce
CO
2V
olu
me
De
nsit
y C
O2
Po
rosit
yP
ore
fil
lin
gC
O2 s
tore
dC
O2 s
tore
dC
O2 s
tore
d
thic
kn
ess f
tth
ick
ne
ss c
mp
lum
e f
rom
we
llp
lum
e f
rom
we
llro
ck
in
cc
g/c
cv
ol.
fra
cti
on
eff
icie
ncy
gra
ms
me
tric
to
ns
mil
lio
n m
etr
ic t
on
s
mcm
(a)
(b)
( c )
(d)
( e
)(f
)
40
1219.2
2000
200000
1.5
3209E
+14
0.6
077
0.0
61
5.58
631E
+12
5586
308.
787
5.58
6308
787
40
1219.2
2000
200000
1.5
3209E
+14
0.6
077
0.0
60.7
54.
1897
3E+1
241
8973
1.59
4.18
9731
59
40
1219.2
2000
200000
1.5
3209E
+14
0.6
077
0.0
60.5
2.79
315E
+12
2793
154.
393
2.79
3154
393
40
1219.2
2000
200000
1.5
3209E
+14
0.6
077
0.0
60.2
51.
3965
8E+1
213
9657
7.19
71.
3965
7719
7
(a)
Sequest
ration h
ori
zon d
esc
ribed a
bove b
etw
een 4
200' and 4
240'
(b)
Ass
um
es
CO
2 p
lum
e s
pre
ads
out
2 k
m in a
ll dir
ections
from
the inje
ction w
ell;
dia
mete
r of
plu
me is
4 k
m
(c )
V
olu
me =
p x
unit t
hic
kness
x s
quare
of
the r
adia
l dis
tance
(d)
CO
2 d
ensi
ty c
alc
ula
ted f
rom
the N
IST
on-l
ine
therm
ophysi
cal calc
ula
tor;
ass
um
e 3
1.5
oC
and 7
6 b
ars
pre
ssure
(e )
Pore
fra
ction b
ase
d o
n a
vera
ges
for
these
port
ions
of
the o
f th
e f
orm
ation
(f)
Ass
um
es
four
dif
fere
nt
pore
fill
ing e
ffic
iencie
s -
com
ple
te, th
ree q
uart
ers
, half
, a
nd o
ne q
uart
er
filli
ng
Tab
le 2
. S
um
mary
of
the
CO
2 s
tora
ge
calc
ula
tio
n a
nd
esti
mate
d a
mo
un
ts o
f C
O2 s
tore
d f
or
se
ve
ral
dif
fere
nt
inje
cti
on
sce
nari
os

63
Chapter VIII
Conclusion
This study focused on nine samples of the Knox Dolomite Supergroupfrom the Aristech
Well in Scioto County, Ohio, six from the Copper Ridge Dolomite between 4222’ and 4321.4’,
two from the Rose Run Sandstone between 4201.2’ and 4213.9’, and one sample from the
Beekmantown Dolomite at 4186.2’. Analyses of stratigraphy, petrography, porosity,
permeability, bulk mineralogy, and brine chemistry were conducted to characterize each
formation for the identification of reservoirs for the sequestration of supercritical CO2 and a
geologic seal.
The optimal sequestration horizon determined from these samples was identified to be the
interval of 4200 ft to 4240 ft, encompassing the entirety of the Rose Run Sandstone, and parts of
the Dolomicrite Facies and Intradolomicrite Facies as well. This interval was identified for high
levels of porosity, between 3.8 and 8.9%, and high permeability, between 19.7 and 50.9
mDarcies. After factoring bore temperature, required pressure for the supercritical phase of CO2,
and the density of CO2 at that phase, it was calculated that the 40’ sequestration interval would
be able to store between 1.396 and 5.586 metric tons of CO2 depending on pore filling
efficiency. The overlying Beekmantown Dolomite formation was characterized as having a
favorably low porosity, 1.1%, and permeability, 7.8 mDarcies, to serve as an impermeable
geologic seal to prevent the migration of the sequestered CO2 into overlying formations. Judging
from such favorable results of potential CO2 sequestration capabilities of such a small interval of
rock, such a technique for the reduction of CO2 emissions appears to be a worthwhile endeavor.

64
Chapter IX
Suggestions for Future Work
In order to better characterize the Copper Ridge Dolomite, Rose Run Sandstone, and
Beekmantown Dolomite for CO2 sequestration horizons and geologic seals, it would be
necessary to gather more samples than the nine samples used for this study. Although nine
samples were enough to gain a rough sense of the stratigraphy, petrology, porosity, permeability,
and bulk mineralogy of the formations, more will be required to yield a robust and thorough
analysis. As the methodology by which these samples were chosen is not known, careful
observations of the whole core would be needed to understand the vertical heterogeneity,
lithologies, facies, and the nature of the contacts between each formation.
To characterize pore space within the samples, additional analyses would also be needed.
BET analysis of each sample in conjunction with additional mercury porosimetry measurements
would provide a better sense of the micro and nano pores that are present, especially in the
Dolomicrite Facies of the Copper Ridge. Scanning electron microscopy backscatter electron
imaging and ion milling would determine true porosity, pore distribution, and pore geometry.
QEMSCANs of all the samples used for this study and additional samples from the Aristech well
would provide a better sense of pore mineralogy, history, and diagenesis.

65
Chapter X
Bibliography
D. Bacon, N. Gupta, J. Sminchak. "Assessment of CO2 Injection Potential in the Copper Ridge
Formation at the Mountaineer Power Plant Site." Web.
http://www.netl.doe.gov/publications/proceedings/07/carbon-seq/data/papers/p1_141.pdf.
2010.
M. Baranoski, R. Riley. “Preliminary Assessment of Potential Injection Strata for Carbon
Dioxide Sequestration at New Haven, West Virginia” Web.
http://www.dnr.state.oh.us/LinkClick.aspx?fileticket=rpKiBywaBpM%3d&tabid=7212.
2010.
S. Benson, and D. Cole. "CO2 Sequestration in Deep Sedimentary Formations." Elements 4.5
(2008): 325-31.
R. Blakey.-“North America during the Upper Cambrian” and “North America during the Early
Ordovician” Paleogeographic maps. http://www2.nau.edu/rcb7/nam.html. Northern Arizona
University, 2007.
A. H. Coogan, M. U. Maki. "Trapping Configurations for Cambrian Rose Run Production in
Ohio.". Proceedings - Technology for the Economic Challenge: SPE Eastern Regional
Conference. Columbus, OH, USA. Richardson, TX, USA: Soc of Petroleum Engineers of
AIME, USA SPE 15922 , 1986. 71-78.

66
S. Goodarzi, A. Seltari, M. Zoback, D. Keith. "A Coupled Geomechanical Reservoir Simulation
Analysis of Carbon Dioxide Storage in a Saline Aquifer in the Ohio River Valley."
Environmental Geosciences 18.3 (2011): 189-207.
International Energy Agency (IEA). "CO2 Emissions from Fuel Combustion - 2011 Highlights."
Web. < www.iea.org/co2highlights/co2highlights.pdf>. 2011.
A. Lucier, M. Zoback, N. Gupta, and T.S. Ramakrishnan "Geomechanical Aspects of CO2
Sequestration in a Deep Saline Reservoir in the Ohio River Valley Region." Environmental
Geosciences 13.2 (2006): 85-103.
M. Nathenson, and M. Guffanti. "Geothermal Gradients in the Conterminous United States."
Journal of Geophysical Research 93.B6 (1988): 6437-50.
K. Petrie "Petrography and Diagenesis of the Upper Copper Ridge Dolomite in Morrow County,
Ohio." Unpublished B.S. Thesis, The Ohio State University, Columbus, Ohio, 1982.
R. Riley, J. Wicks, and J. Thomas. "Cambrian-Ordovician Knox Production in Ohio: Three Case
Studies of Structural-Stratigraphic Traps." AAPG Bulletin 86.4 (2002): 539-55.
"Vulcan Project."Web. <http://vulcan.project.asu.edu>. Date Published: 2010, Date Accessed: 7-
20-2012 Arizona State University, 2010.
L.Wickstrom, E. Venteris, J. Harper, J. McDonald, E. Slucher, and 25 others. "Characterization
of geologic sequestration opportunities in the MRCSP region." 2010.

67
B. Zerai. "CO2 Sequestration in Saline Aquifer: Geochemical Modeling, Reactive Transport
Simulation and Single-Phase Flow Experiment." Unpublished Ph.D. Dissertation, Case
Western Reserve University, Cleveland, Ohio. 2006.