Embed Size (px)
Citation preview

i
CHARACTERIZATION OF THE
PROPERTIES OF SOME BIOMASS
SPECIES AND ESTIMATION OF THEIR
POWER GENERATION POTENTIALS
A THESIS SUBMITTED IN PARTIAL FULFILLMENT OF THE REQUIREMENTS
FOR THE DEGREE OF
Master of Technology
in
Mechanical Engineering
by
RAMYARANJAN LENKA
Roll No: 214MM2500
Under the supervision of
Prof. M. Kumar
Dept. of Metallurgical and Materials Engineering
National Institute of Technology, Rourkela
2016
ii
CHARACTERIZATION OF THE
PROPERTIES OF SOME BIOMASS
SPECIES AND ESTIMATION OF THEIR
POWER GENERATION POTENTIALS
A THESIS SUBMITTED IN PARTIAL FULFILLMENT OF THE REQUIREMENTS
FOR THE DEGREE OF
Master of Technology
in
Mechanical Engineering
by
RAMYARANJAN LENKA
Roll No: 214MM2500
Under the supervision of
Prof. M. Kumar
Dept. of Metallurgical and Materials Engineering
National Institute of Technology, Rourkela
2016

iii
DEDICATED
ITOIMY
IPARENTS
iv
Declaration
Iiherebyideclare thatitheiworkiwhich isibeingipresentediinithisithesisientitled
“CharacterizationiofiSome Biomass SpeciesiandiEstimationiofitheiriPoweriGeneration
Potentials”iinipartialifulfilmentiofitheirequirementsifor the award of M.Tech. degree, submitted
toithe Department ofiMetallurgical andiMaterials Engineering, NationaliInstitute ofiTechnology,
Rourkela,iis aniauthentic recordiof myiown workiunder theisupervision ofiProf. Prof. M. Kumar.
Iihave notisubmitted theimatter embodiediin thisithesis forithe awardiof anyiother degreeito any
otheriuniversity oriInstitute.
iDate: 126-05-2016 RAMYARANJAN LENKA

v
National Institute of Technology
Rourkela
CERTIFICATE
Thisiis to certify that the thesis entitled, “CHARACTERIZATION OF THE
PROPERTIES OF SOMEiBIOMASS SPECIESiAND ESTIMATION OF THEIR POWER
GENERATION POTENTIALS” submitted by Mr. RAMYARANJAN LENKA, Roll no.
214MM2500 in-partial fulfillment of the requirements for the award of-Masteriof-Technology
Degree in Mechanical-Engineering withispecialization in Steel Technology-atithe National
Institute of Technology, Rourkela isian reliable work carried out byihim underimy supervision
andiguidance.
Toithe-bestiof-myiknowledge,ithe matteriembodied inithe thesisihas notibeen submittedito
any otheriUniversity/ Instituteifor theiaward ofiany-degree.
Prof. M.iKumar
Supervisor
Department of-Metallurgical and-Materials-Engineering
National-Institute of-Technology
Rourkelai– 769008
Email:[email protected]

vi
*ACKNOWLEDGEMENT*
Iiexpress myideep senseiof gratitudeiand indebtednessito my-projectiguides-and Prof. M.
Kumar-foriproviding-importantiguidance,-constanti encouragement,-and inspiring-advice
throughoutithe course-ofithis project-workiand-for propellingime furtheriin everyiaspect ofimy
academicilife. Hisipresence-andioptimism-has providedian invaluableiinfluence onimy career
andioutlook forithe future. I-consideriit-my good-fortune to-have an-opportunity to-work with
such a-wonderful-persons.
I amigrateful toiProf. S.C.-Mishra,iHead ofithe Departmentiof Metallurgicaliand
MaterialiEngineering foriproviding meithe necessaryifacilities forismooth conductiof thisiwork.
I amialso gratefulito Mr.Bhanja-Nayak,-Mr. Kishore Tanti-and Mr.UdaySahoo foritheir
assistance-iniexperimental-work. I-amialso-thankful to-allithe-staff membersiof departmentiof
Metallurgical &-Materials Engineering-andito-all my-well wishers-for theiriinspiration and
assistance.
I am-especiallyiindebted-toimy-parents,iMr.Rasananda Lenka and Mrs.Minati Lenka for
their-love,isacrifice,-and constant-support towards-my education. I-would like-to thank-the staff
of-NIT Rourkela-for his-friendly support-at various-stages of-the project-work.
iDate: 26.05.2016 RAMYARANJAN LENKA
Place: Rourkela

vii
CONTENTS
INTRODUCTIOi .............................................................................................................................................. 1
1. INTRODUCTIONi ........................................................................................................................................ 1
1.1 Over Viewi ........................................................................................................................................... 1
1.2 DifferentiSourcesiof RenewableiEnergyi ........................................................................................... 2
1.2.1 SolariEnergy ................................................................................................................................. 3
1.2.2 WindiEnergyi ................................................................................................................................ 3
1.2.3 OceaniEnergyi .............................................................................................................................. 3
1.2.4 GeothermaliEnergy ...................................................................................................................... 4
1.2.5 BiomassiEnergyi ........................................................................................................................... 4
1.3 Fossilifuel ReservesiIn theiWorldi ...................................................................................................... 5
1.4 PoweriGeneration Potential of DifferentiRenewable Energy Sourcesiin the Worldi.......................... 6
1.5 PoweriGenerationiPotential ofiDifferent RenewableiEnergy Sources in Indiai ................................. 8
1.6 Classificationiof Biomassi .................................................................................................................. 9
1.6.1 WoodyiBiomass ............................................................................................................................ 9
1.6.2 Non-woodyiBiomass .................................................................................................................... 9
1.7 ElectricityiGenerationiMethods fromiBiomass ................................................................................ 10
1.7.1 Thermoichemical Process .......................................................................................................... 10
1.7.2 Combustion-Processes ............................................................................................................... 11
1.8 Benefits andiLimitations ofiBiomass Useiin PoweriProduction ....................................................... 12
1.8.1iBenefits ...................................................................................................................................... 12
1.8.2iLimitations .................................................................................................................................. 13
2. LITERATUREiREVIEW ....................................................................................................................... 16
2.1 EnergyiCrisis andiRenewable EnergyiScenario in India .................................................................. 16
2.2 Biomassias a RenewableiEnergy Sourceiand itsiPotential ............................................................... 18
2.3 BiomassiConversion Processes ......................................................................................................... 19
2.4 Chemical Properties andiAsh FusioniTemperature Testiof Biomass ............................................... 20
2.5 DecentralizediPower GenerationiStructure in Rural Areas .............................................................. 21
2.6iSummary ........................................................................................................................................... 22

viii
2.7 Objectivesiof theiPresent ProjectiWork ............................................................................................ 22
3. EXPERIMENTALiWORK ..................................................................................................................... 25
3.1 MaterialsiSelection ........................................................................................................................... 25
3.2 ProximateiAnalysis ofiStudied BiomassiSamples ............................................................................ 25
3.2.1 MoistureiContentiDetermination .............................................................................................. 25
3.2.2 AshiContent Determination ....................................................................................................... 26
3.2.3 VolatileiMatter Determination .................................................................................................. 27
3.2.4 Calculationiof FixediCarbon Content ......................................................................................... 28
3.3 Calorific ValueiDetermination .......................................................................................................... 28
3.4 Bulk DensityiDetermination ............................................................................................................. 30
3.5 Ash Fusion TemperatureiDetermination ........................................................................................... 30
3.6 UltimateiAnalysis: Determinationiof ChemicaliComposition .......................................................... 31
4. RESULTSiAND-DISCUSSION ............................................................................................................. 33
4.1 Gross Calorific Values ofiStudied BiomassiComponents ................................................................ 36
4.2 Determinationiof BulkiDensities ...................................................................................................... 38
4.3 AshiFusion TemperatureiDeterminations ofiSelected Biomass-Components .................................. 39
4.4 UltimateiAnalyses ofiSelected BiomassiComponents ...................................................................... 40
4.5 Calculationiof Landiand BiomassiRequirement foriDecentralized PoweriGeneration iniRural Areas
................................................................................................................................................................ 41
5. CONCLUSIONSi ................................................................................................................................... 46
REFERANCESi ......................................................................................................................................... 48

ix
ABSTRACT
India is an energy needing country. India has most of the energy resources but limited. Now a
days, energy demand leads to use-oficonventionalienergyiresourcesi(i.e.ifossilifuels,isuchias
hard coal,ilignite,ioiliandinaturaligas) which cause criticalienvironmentaliproblems likeiglobal
warmingidueito increase in greenhouse gases which can bring drastic change in environment.
Renewable energy sources release less pollution to atmosphere. So If theicountryiwantsito meet
its energy demand and to be less dependent on importing energy and to minimize greenhouse gas
effect and to keep environment safe then it should use renewable energy sources. Rapidly
increase in energy demand and world pollution due to use of conventional fuel, scientists looked
for alternatives as renewable energy sources. Among all theirenewable-energyisources, biomass
consideredias aniimportant source ofipower production due to its wide availability, lower ash
content and low Cox, SOx and NOx emission to the atmosphere. In this article, five different
portion(leaf, new branch, main branch, bark and root) wereitaken fromiresidues of two-different
woodyibiomass speciesiand three fruit husk/peel of which don’t have any commercial use. These
species are Vachellia nilotica(localiname- Babool), Azadirachtaiindica(localiname- Neem),
Musa acuminata(localiname- Banana), Cocos nucifera (localiname- coconut) and Arachis
hypogaea(localiname- Groundnut). Proximateianalyses andigross calorificivalues (GCV) ofiall
the biomassisample were determined. Amongiall theibiomass speciesistudied, the fixedicarbon
content (FC) in Coconut husk was foundito beithe highest (i.e. 25wt.%) whileiNeem leafihas the
lowestivalue(i.e. 11wt%), the volatile matter content (VM) in main branches of Neem is the
highest(i.e. 74wt.%) While Groundnut husk has the lowest (i.e. 57wt.%) among all studied
biomass samples. The ash content (A) in Neem root is the highest (i.e. 17wt.%) while Babool
main branch has the lowest ash content (i.e. 1wt.%). Among all thirteen biomass species studied,
husk of Coconut and bark and new branches of Neem are found to be high in moisture content
(i.e. 11wt.%) while bark of Babool is found to be the lowest (i.e. 7wt.%).
Similarly, the Babool leaf isithe mostifavorable oneiwith theihighest-calorificivalue followediby
its root. Next in the order, the bark of Neem and Babool were alsoifound toihave considerably
highiamount ofienergyicontents suitableifor powerigeneration. Iniaddition, bulkidensities ofiall
the-biomassispecies-haveibeen-determined. Leaves of-Neem and Babool-biomass speciesihave

x
beenifound-toihave-lower bulk densitiesiwhile barkihas higher bulk-densities as-compared-to
their other components. It is worthy to note that among all the studied biomass species, bark of
babool has highest (i.e. 443 Kg/m3) bulk density followed by banana peel (i.e. 422 Kg/m3) while
husk of Coconut has lowest bulk density(i.e. 163 Kg/m3) followed by husk of Groundnut(i.e.
262 Kg/m3).
Ash fusion temperature plays a vital role in Ashirelated-problemsisuch as-slagging and-
fouling in-different kinds-oficombustion, corrosion problems, in bed-agglomeration and
potential problems they may cause in a boiler when the fuel is fired. Further,ithe-ashifusion
temperaturesiof someiselected biomass (Neem root, babool leaf and coconut husk) haveibeen
measured as these temperaturesiare the influentialifactors for the-determinationiof-bed
agglomerationiand otheriboiler foulingirelated problems.
It has been found that Initial Deformation Temperature (IDT) varies from 995 to 1178ºC,
softening temperature (ST) varies from 1132 ºC to 1218 ºC and hemispherical temperature (HT)
varies from 1161 ºC to 1253 ºC which is suitable for safe boiler operation. The-ultimate-analysis
has also been carried out on some selected biomass samples of Neem bark, Babool leaf and Husk
of coconut. It has been found that Carbon and Hydrogen present in babool leaf and neem bark
are higher compared to husk of coconut and have higher calorific value as compared to other
selected samples. It is observed that around 80.868 and 154.236 hectares of land area are
required for energy plantation considering Neem and Babool biomass species and respectively. It
is also found that the husk of Groundnut, Coconut, and Banana peel are needed approximately
58.795, 100.95 and 407.23 hectares of land to generate that much of electricity per year.
Approximately 7234.532, 6811.524, 7349.375, 7228.739, and 6732.355 tonnes of Neem, Babool,
Groundnut Husk, Banana peel and Coconut husk biomass respectively was calculated to provide
same amount of energy per year.
Key words: Volatile matter; Ash content; Calorific value;iAshifusionitemperature;-
Bulkidensity; decentralizedipower-generation.

xi
*NOMENCLATURE*
A -iAshicontent
AFT-Ashifusionitemperature
FC—Fixedicarbonicontent
GCV-- Grossicalorificivalue
H – Hydrogenicontent
HHV – Higheriheatingivalue
HT – Hemisphericalitemperature
IDT – Initialideformationitemperature
LHV – Loweriheatingivalue
M – Moistureicontent
N – Nitrogenicontent
NCV – Neticalorificivalue
O – Oxygenicontent
ST – Softening-temperature
VM - Volatile matter-content
W.E. – Wateriequivalent
wt.% - Weight-percentage
ΔT – Maximumirise initemperature ini0C

xii
LIST OF FIGURES
Fig. No. Figure description Page no. *11.11* Sourceiwise EstimatediPotential andiInstalled RenewableiPower in
India asion 31.03.2014 9
*13.11* MuffleiFurnace 26
*13.21* OxygeniBombiCalorimeter 29
13.31 LeitziHeatingiMicroscope 31
14.11 Comparison of Moisture Content in Neem and Babool Samples 34
4.2 Comparison of Ash Content in Neem and Babool Samples 34
4.3 Comparison of Fixed Carbon content in Neem and Babool Biomass
samples 35
4.4 Comparison of Volatile Matter Content in Neem and Babool
Biomass samples 36
4.5 Comparison of GCV of Neem and Babool Biomass samples 37

xiii
LIST OF TABLES
Table No.
Description Page no.
1.1 World fossil fuel reserves(Petroleum, Natural Gas and coal) and
projected depletion 5
1.2 GlobaliElectricityiCapacity fromiRenewable Energyiin theiyear 2012 7
4.1 ProximateiAnalyses andiGross CalorificiValues ofiDifferent
Componentsiof
StudiediBiomass Species
33
4.2 Bulk Densities of Different Components of Biomass 38
4.3 Ash Fusion Temperatures of Different Biomass Samples 39
4.4 UltimateiAnalyses andiCorresponding GrossiCalorific Valuesiof
Biomass Samples 40
4.5 TotaliEnergy Contentsiand PoweriGeneration Structureifrom Neem
BiomassiSpecies (TeniYears old approximately) 41
4.6 TotaliEnergy Contentsiand Power GenerationiStructure fromiBabool
Biomass Species (FifteeniYears old approximately) 42
4.7 TotaliEnergy Contentsiand PoweriGeneration Structureifrom
Groundnut Husk, Banana Peel and Coconut Husk Biomass Species
(Per Year Production approximately)
42
4.8 Land Area and Biomass Requirements for Production of 7300 MWh
Electricity per Year 44

CHAPTER 1
INTRODUCTIO

1 | P a g e
1. INTRODUCTION
1.1 Over View
Currently Increase in energy demand is a big problem. Fossil fuels can meet the energy
demand, but these are limited in reserve and costly. Fossil fuels emit a higher quantity of
pollutants to the environment which leads to increase in greenhouse gasses and considered as the
main cause of drastic change in climatic condition. The continuous decrease in reserve of world
fossil fuel has given a challenge to the scientists for the invention of a promising energy source
that can take the place of conventional fuel. Renewable energies became the most attractive
options for power generations because of theses are capable of meeting the world energy demand
and environment-friendly. Biomass becomes effective as it is cheap and widely available, carbon
neutral and emits very less amount of pollutant to the environment.
Over last few decades the Indian economy has shown continuous growth. Today,iIndia is
theininth largestieconomy inithe world,idriven byia realiGDP growthiof 8.7% inithe lastifive
years (7.5% over the past ten years).In 2010, India placed at 5th position in world GDP (gross
domestic product) growth. As of March 2012, theiper capitaitotal consumptioniin Indiaiwas
estimated toibe 879ikWh. As per the 2011 Census, 55.3%irural householdsihad accessito
electricity. However, NSSiresults showithat inithe yeari1993-94, 62%ihouseholds inirural India
wereiusing keroseneias theiprimary sourceiof energyifor lighting. After the US, China, and
Russia the fourth largest user of natural gas is India. [1].As conventional fuels are limited and
emit maximum amount of greenhouse gasses to the atmosphere, it should be minimized or
replaced by other energy sources for minimization of pollution. In India, moreithan 65% ofithe
electricityiis producedifrom coal-firedipower plants. Withilimited availabilityiof coal, the future
energy demand may suffer. So for the security of future energy supply, the alternate power
source is essential.
Biomass became a most attractive option for energy demand due to its advantages. It is
widely available and carbon neutral and releases very less pollutants. Fossil fuels release more
amounts of Cox, SOx and NOx to the atmosphere which is the main cause of global warming
lead to drastic climate change. Application in biomass in generating energy can solve the

2 | P a g e
problems related climatic condition, energy emergency and waste land development. Biomass
can be the most promising energy source due to its wide availability. The geographical area of
21.23% of the country covered by forest. Around three crore hectares of waste land can be
utilized by forestation in India which is a big advantage [2]. As per the 2011 Census, almosti85%
ofirural householdsiwere dependention traditionalibiomass fuelsifor theiricooking energy
requirements. As on 31.03.2013 and 30.03.2014 the total biomass power generated in India were
3601.03MW and 4013.55MW. The total energy production fromiconventional sourcesidecreased
fromi13409.47 Peta joulesiduring 2012-13 to 13400.15 Petaijoules duringi2013-14 [3].
Currently, biomass playing an important role to meet the world energy demand.
Continuous increase in energy demand and world pollution and limited status of conventional
fuel has shown a symbol of interest within scientists for research on biomass species. Different
biomass species have different properties which properties can be considered for the design of
the power plant and also influence its efficiency.
For getting maximum benefits at low cost, it is important to know the different properties
of the chemical composition, energy values,ibulk densities,iash fusionitemperatures,icombustion
reactivity, etc. The presentithesis describes the studies on some selected biomass species. The
study includes proximateianalysis,iultimateianalysis, and evaluation of calorificivalues, bulk
densities,iand ash fusion temperatures of different residual components of some biomass
samples. These species are Vachellia nilotica(local name- Babool), Azadirachtaindica(local
name- Neem), Musa acuminata(local name- banana), Cocosnucifera (local name- coconut) and
Arachishypogaea(local name- groundnut). Some experiments were conducted on these biomass
samples and their effect on power generation is discussed.
1.2 DifferentiSources ofiRenewableiEnergy
As the fossil fuels are limited and give rise to environmental pollutants, renewable energy
sources became an alternative for power generation.
The alternative renewable energy sources are as follows:
3 | P a g e
a. Solarienergy
b. Ocean energy
c. Windienergy
d. Geothermalienergy
e. Biomass energy
1.2.1 SolariEnergy
Theiheat andiradiation energyicoming from theisun is collected and convertediinto
electricityiby someitechnologies justias solariphotovoltaic, solariheating andisolar thermalipower
generatoriare calledias solarienergy. It does not produce smoke or any pollutant. But it is not
active at night time, cloudy climate like rainy season and costly. Those countries away from the
equator were not able to get adequate solar energy. Due to these disadvantages, solar power
cannot be productive everywhere [3].
1.2.2 WindiEnergy
Windienergy canibe produced by utilizing the wind force with the help of turbines and
then by converting into electric power. Pumping of water can be done by wind pumps and also
mechanical power can be achieved by windmills by utilizing the wind force. It is a clean source
of energy, don't produce pollution or greenhouse gasses. The significant disadvantage of wind
power is, is cannot be obtained throughout the year. When there is no wind, energy cannot be
obtained. If site selection is improper, then there will be a significant loss in wind energy
production. Also, the cost associated with the installation of wind power is very high [3].
1.2.3 Ocean Energy
There is two type of energyiderived fromitheiocean. One is mechanicalienergy derived
fromiwaves anditides, and another is thermal energy from the heat of the sun. With the help of
some mechanical equipment, electricity can be produced. The top surface of ocean water absorbs
4 | P a g e
the heat radiated by the sun which is used as ocean thermal energy. The tides and waves are the
result of the gravitational pull of Moon and blowing of the wind. But these are not continuous or
cannot be achieved every time we need. Also, the types of equipment and processes used for
ocean energy production are costly.
1.2.4 Geothermal Energy
Geothermalienergy isithermal energy generated and stored in the Earth crust.
Temperatures at the core–mantleiboundary mayireach overi4000 °Ci(7,200i°F). Some rock
present in earth's interior may melt due to high temperature and pressure, and solid mantle may
behave plastically which may cause the mantle convecting upward as it is lighter than the
surrounding rock. Rock and water are heated in earth's crust up to 370 °C, which can be used for
thermal energy. Drilling and exploration of geothermal wells for deep resources are very
expensive and can't be installed everywhere. When geothermal wells are drilled, it releases
greenhouse gasses trapped inside earth's crust, but the emission is lower than that of fossil fuel
[4].
1.2.5 Biomass Energy
Biomassiis definedias ainon-fossilized,ibiodegradable organicimaterial derivedifrom
plants,imicroorganisms, andianimals whichiinclude products,iby-products,iresidues andiwastes
fromiwoody, agriculturaliindustries includingithe biodegradable organiciwaste fromithe
industrial andimunicipal operation[5].
Biomass is a renewable energy source which has the advantage of re-growing over a short
period as compared to fossil fuels. It is Carbon Neutral. Chlorophyll in plants uses the sunlight
for producing carbohydrates by taking carbon dioxide from air and water from the ground. When
these are burnt, it emits very less quantity of carbon dioxide as compared to fossil fuels.
Biomass became the most attractive renewable energy source due to its wide availability and
environment-friendly nature. Currently, theiaggregate useiof bio-energyiis aroundi12 % ofithe
world's total energy consumption, and the advantages of bio-energy will be able to meet the
world energy demand in coming days. Large wastelands can be reutilized by forestation which

5 | P a g e
can be helpful in producing biomass. The bio-power installation in India as per March 2014 was
4013.55 MW, which was the second largest renewable energy source [6].
1.3 Fossil fuel Reserves In the World
Moreithan twoithird ofithe primaryifuels areiconsumed for the production of electricity in
the world [7]. The table 1.1 shown below gives the idea about some important assumption on
world fossil reserves and consumption. If the current estimated level of consumption of fossil
fuels will remain constant by assuming correct estimated reserves of fossil fuels, then the
existence of fossil fuel may vanish from the world. Technological advances, new discoveries,
and conservation may result in the use of fossil fuels last longer. The consumption of resources
as in Table 1.1 is due to population growth and developments. From several studies, it is
expected that the reserves of crude oil may vanish from the year 2050 to 2075 [8,9]. So effective
steps should be taken on the development of biomass power production.
Table 1.1 Worldifossil fuelireserves(Petroleum,iNatural Gasiand coal) and projectedidepletion
[10]
Reserves ofiglobal
fossilifuels
Petroleumi
(Billionibarrels)
NaturaliGas
(Trillionicubic feet)
Coali
(Billionishort tons)
Worldireserves
(Jan 1,2000)
7i1017i7i 1i5150i1 1i1089i1
Worldipotential
reserveigrowth
i730i i3660i --
Worldiundiscovered
potentiali
19391 151961 1--1i
Totalireserves i2686i i14006i i1089i
Annualiworld
consumption
i27.34i i84.196i i4.74i
Yearsiof reservesileft i98i i166i i230i

6 | P a g e
1.4 Power GenerationiPotential ofiDifferent RenewableiEnergy Sourcesiin the
World
Renewable energy demand is increasing continuously worldwide, provided global energy
of 22% approximately in 2013. In the year 2013 biomass provided around 10% (56.6EJ) of
global primary energy from which the share of the modern biomass was approximately 13EJ for
heat supply to buildings and industrial use and 5EJ of energy used to produce 116 billion litres of
biofuel, and another 5EJ of energy was used for 405TWh of world’s electricity. The United
States was estimated to be the top producer of electricity from biomass.
Geothermal resources have provided a total of estimated 600 PJ (167 TWh) in 2013 from which
76TWh was used for electricity generation and remaining 91TWh used for direct use. In 2013 at
least 76TWh/annum capacity of geothermal power came online. In 2013, hydropower estimated
capacity of 40GW was commissioned increasing global capacity to 1000GW by about 4%.About
39GW solar PV capacity was added which turns the total capacity of 139GW. For almost one-
third of global installation, China accounted to triple its capacity to 20GW.In 2013, the addition
of total wind power capacity was 35GW, which turns the global total above 318 GW [11]. Table
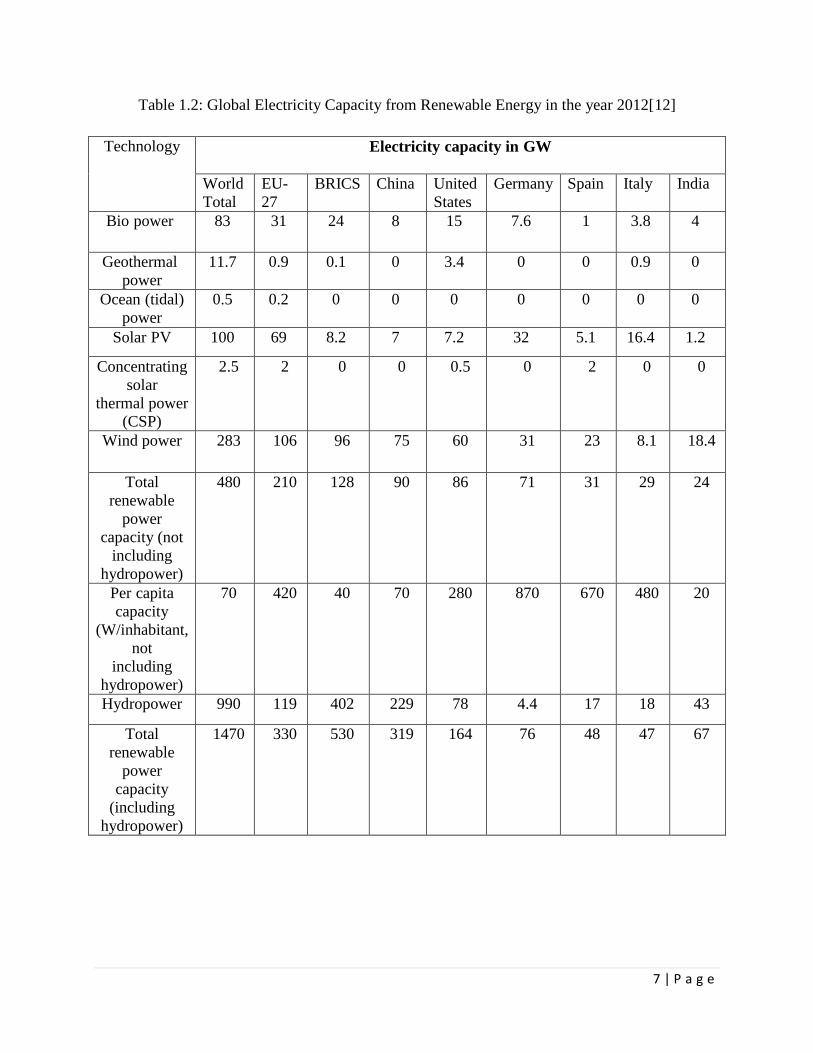
1.2 shows Global Electricity Capacity from Renewable Energy in the year 2012. In 2012, the
capacity of the total renewable energy increased 1470GW globally which is 8.5% more than that
of the previous year. Hydroelectric power increased by 3% to 990GW and different renewable
energy sources increased 21.5% to 480GW. In 2012, 39% of renewable power limit was
represented by wind force and solar PV and hydropower both represents approximately 26%. In
2012, roughly 50% of electric production was compensated by renewable sources as compared to
all other sources. The renewable energy sources contributed 26% of global generating power and
estimated for supply 21.7% of global power from which 16.5% of power was from hydropower
by the year's end [12].
EIA(Energy Information Administration) predicts that by 2020 biomass will able to
produce 0.3%(15.3 billion kWh) of the total anticipated power generation. It is forecasted that
the power generation from biomass should increase significantly in situations which explain the
use of a 20% RPS (renewable portfolio standard) and situations when greenhouse gasses based
on the Kyoto Protocol should be minimized [13].
7 | P a g e
Table 1.2: Global Electricity Capacity from Renewable Energy in the year 2012[12]
Technology Electricityicapacity iniGW
World
Total
EU-
27
BRICS China United
States
Germany Spain Italy India
Bioipoweri 83i 31i 24i 8i 15i 7.6i 1i 3.8i 4i
Geothermali
power
11.7i 0.9i 0.1i 0i 3.4i 0i 0i 0.9i 0i
Oceani(tidal)
power
0.5i 0.2i 0i 0i 0i 0i 0i 0i 0i
SolariPV 100i 69i 8.2i 7i 7.2i 32i 5.1i 16.4i 1.2i
Concentrating
solar
thermal power
(CSP)
92.5 92 90 90 90.5 90 92 90 90
Wind power 9283 9106 996 975 960 931 923 98.1 918.4
Total
renewable
power
capacity (not
including
hydropower)
9480 9210 9128 990 986 971 931 929 924
Pericapita
capacity
(W/inhabitant,
not
including
hydropower)
970 9420 940 970 9280 9870 9670 9480 920
Hydropower 9990 9119 9402 9229 978 94.4 917 918 943
Total
renewable
power
capacity
(including
hydropower)
91470 9330 9530 9319 9164 976 948 947 967

8 | P a g e
1.5 PoweriGeneration Potentialiof DifferentiRenewable EnergyiSources in
India
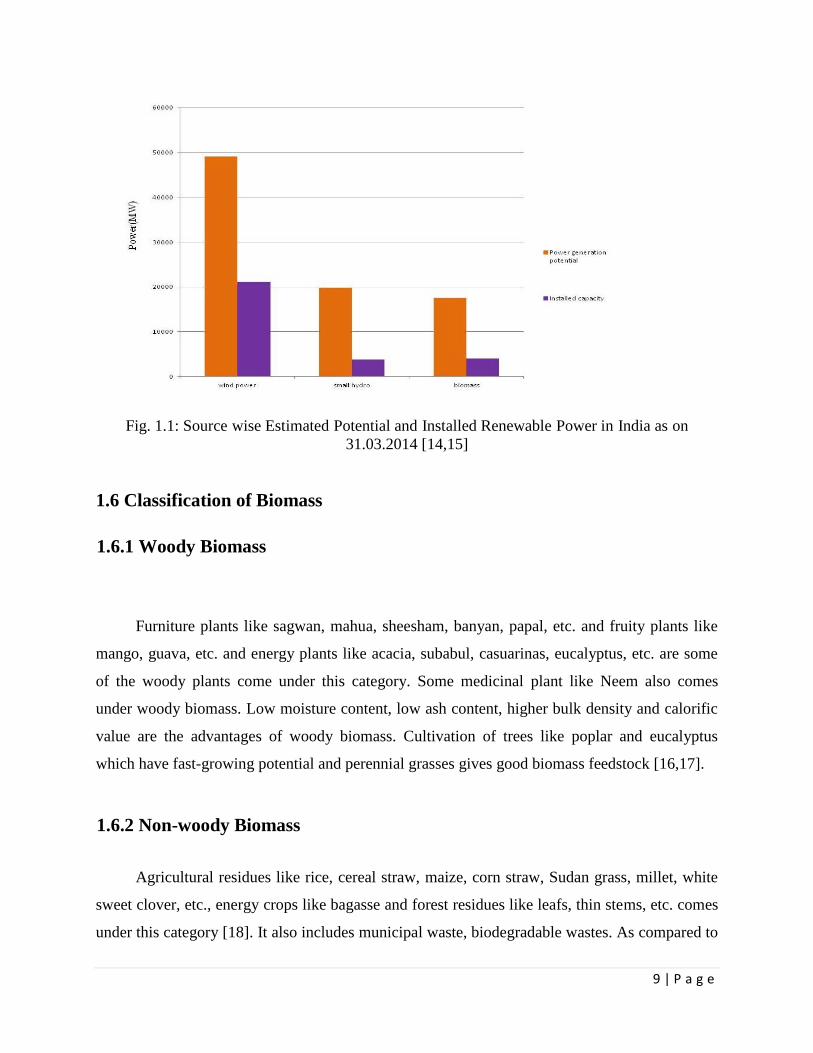
In India various sources like biomass, solar, wind and small hydro have high potential to
produce renewable energy. As on 31st March 2014, it was estimated that the potential for
production of renewable in India is approximately 94126 MW which includes 17538 MW of
biomass power potential, 49132 MW of wind energy potential and 19750 MW of small-hydro
power potential [14]. As compared to the available potential of energy production the installation
capacities are much less. Biomass power accounting 4013 MW and small hydro power of 3804
MW and solar power project of 2647 MW of installation capacity. Wind energy is dominating by
21132 MW of installation capacity. These installed projects are much less as compared to the
energy potential. Fig. 1.1 shows the potential and installation capacity of wind power, small
hydro power and biomass power [15].
Karnataka state has 14464 MW of renewable capacity and securing the highest share in
India followed by state Gujarat comprising the second highest share of 12494 MW of capacity
followed by Maharashtra of 9657 MW which are 15.37%, 13.27% and 10.26% of total
renewable energy capacity respectively in India as per report on 31st March,2014. In 21st
century biomass has become the most promising renewable energy source among all renewable
energy sources due to its easy use in power plants and less pollution emission. The use of
biomass can be in variety ways like thermo chemical conversion, biochemical conversion, by
direct combustion, the coal-biomass mixture in the co-firing process which is efficient. As coal
and traditional fuels are limited and mostly responsible for pollution emission, biomass is the
perfect replacement for these fuels because of its wide availability, low pollution emission and of
its recycling potential [14].
9 | P a g e
Fig. 1.1: Sourceiwise EstimatediPotential andiInstalled RenewableiPower iniIndia asion
31.03.2014 [14,15]
1.6 Classification of Biomass
1.6.1 Woody Biomass
Furniture plants like sagwan, mahua, sheesham, banyan, papal, etc. and fruity plants like
mango, guava, etc. and energy plants like acacia, subabul, casuarinas, eucalyptus, etc. are some
of the woody plants come under this category. Some medicinal plant like Neem also comes
under woody biomass. Low moisture content, low ash content, higher bulk density and calorific
value are the advantages of woody biomass. Cultivation of trees like poplar and eucalyptus
which have fast-growing potential and perennial grasses gives good biomass feedstock [16,17].
1.6.2 Non-woody Biomass
Agricultural residues like rice, cereal straw, maize, corn straw, Sudan grass, millet, white
sweet clover, etc., energy crops like bagasse and forest residues like leafs, thin stems, etc. comes
under this category [18]. It also includes municipal waste, biodegradable wastes. As compared to

10 | P a g e
woody biomass these have high moisture and ash content, high void space and low bulk density
and energy value.Around 64% of total biomass energy is derived from wood and its wastes and
municipal wastes gives around 24% of total biomass energy and agricultural waste contributes
around 5% of total biomass energy [17].
1.7 Electricity Generation Methods from Biomass
Itiis broadlyiclassified inito twoicategories:
a. Thermoichemicaliprocess
b. Combustioniprocess.
1.7.1 ThermoichemicaliProcess
1.7.1.1 Torrefaction
Torrefaction is the process of thermo-chemicalitreatment ofibiomass in the absence of
oxygeniat 200–320 ºC which is carried out under atmospheric conditions. Torrefaction improves
fuel quality of biomass largely for ignition and gasification purposes. During the process, the
cellulose, lignin, and hemicellulose present in biomass partially decompose to give different
volatile matters and remaining final product is called ‘‘torrefied biomass'' or ‘‘bio-coal''. Also
with densification, it can provide remarkable energy and minimum pollution emission [19].
1.7.1.2 Pyrolysis
It is the basic thermo-chemicalibiomass conversioniprocess. The thermal decomposition of
biomass in the absence of oxygen is called pyrolysis which gives a more functional fuel.
Pyrolysis is carried out in the temperature range 300-600ºC [20]. This process produces liquid
and gas and solid residue consisting higher percentage of carbon. Carbonization is the process of
extreme pyrolysis which produces carbon residue largely. Pyrolysisivaries fromiother high-
temperatureicombustion methodsias thereiis noiuse ofioxygen, water or any other agents [19].

11 | P a g e
1.7.1.3 Gasification
Biomass gasification is the thermo-chemical biomass conversion process which converts
all the raw materials into gas in an oxygen deficient environment. Gasification is carried out in
the temperature range of 600-800 ºC. Biomass gasifiers are the devices which can convert
biomass into high energy fuel to be used in gas turbines. This process consists of two stages.
Producer gas and charcoal is formed in the first stage by partial combustion of biomass.Then in
the next stage, the CO2 and H2O produced in the former phase are chemically lowered by the
charcoal, forming CO and H2. Theicomposition ofithe gasiis 18-20% CO, aniequal portioniof
H2, 2-3% CH4, 8-10% CO2 and the rest nitrogen [21].
1.7.2 Combustion Processes
1.7.2.1 Direct Firing
Direct firing is the process of direct combustion of solid fuels in the steam boiler. Due to
the generation of more amount of moisture, direct firing is not so efficient. During the heating
process, the flame temperature decreases due to the excess moisture. The moisture behaves as a
heat sink which takes away the thermal energy and may cause combustion trouble. The cellulose
containing fuel bound oxygen helps in reducing the theoretical requirement of air.[22]
1.7.2.2 Co-firing
The Diversification of fuels or concurrent ignition of two dissimilar fuels in a boiler is
called co-firing. It describes the replacement of fraction amount of conventional fuels by biomass
in the boiler [23]. In co-firing 5-15% of biomass can be used along with coal for power
production without affecting the efficiency of the power plant. Co-firing process decreases COX,
SOx and NOx emissions compared to fossil fuels [24]. There are Variety of co-firing processes
are as follows.
A) iDirect co-firing
B) iIndirect Co-firing
C) iParallel Co-firing
12 | P a g e
In the direct co-firing process two heterogeneous fuels are used. Up to 15% of biomass is milled
and directly added for better combustion. Some ash related problem arises in this technology due
to the variation of the property of biomass. In the indirect Co-firing process, the solid bio-fuel is
converted into flue gas with the help of a gasifier. The corrosion and the fouling problem of the
boiler are reduced by the certain extent in this process. In parallel co-firing both biomass and
coal combustion is done by separate processes. Biomass is burnt for generating steam, and then
the steam is used in the coal-fired plant which increases the temperature and pressure in boiler
[25].
1.8 Benefits and Limitations of Biomass Use in Power Production
1.8.1 Benefits
Effective use of biomass can provide several social and environmental benefits mentioned below
[26].
A) Biomassiuse in power plants provides clean energy. The use of fossil fuels in power
plants releases carbon dioxide and other pollutants which are the cause of global
warming. But biomass is carbon neutral as CO2 is absorbed by the plant through
photosynthesis and released when it is burnt which maintains the cycle of CO2 in the
atmosphere. Plantation of trees again results in absorption of CO2 from the atmosphere.
Effective use of biomass power can fulfill the world energy demand and can lower the
greenhouse gas concentration.
B) As compared to coal, biomass reacts with oxygen and carbon dioxide more easily. This
characteristic of biomass helps in saving energy by operating the boiler at low
temperature.
C) E and F grade coals, which are used in Indian power plant mostly, have comparatively
low Calorific value than biomass.

13 | P a g e
D) Generally, biomass has 2-15% of ash content, which is very less as compared to coal (30-
50%). Hence use of biomass gives rise to decrease in amount of suspended particulate
matters in the atmosphere.
E) Biomass gasifiers can be installed easily at any location. The installation near villages
reduces transmission losses by decentralized power generation technique and eliminates
the transportation cost as well.
F) Unlike intermittent solar, wind and tidal energy production, biomass energy can be
produced throughout the year. Biomass is more uniformly distributed over earth, use of
which provides security against fuel import from the Middle East.
G) The wide availability and uniform distribution of biomass energy make it the most
attractive renewable energy among all. Decentralized power generation near hilly areas
can be very useful due to availability of biomass resources and can give job opportunity
in rural areas.
H) Biomass can be helpful in preventing soil erosion and will prompt better usage of infertile
lands.
1.8.2 Limitations
Besides some importantibenefits of biomassicombustion, it also has some limitations as
listed below [26].
A. Aiparticular fueliis alwaysiassigned toia certain combustion unit. The
conventional boilers areidesigned for airange of volatileimass and ashicontent.
During biomass co-firing process, it is crucial to change some features of the
existing boiler.
B. Biomassiis relativelyiless efficient as compared to coal. The calorific value of the
biomass co-fired fuel is low as compared to only conventional coal fuel due to the
low calorific value of biomass.
C. There is a comparatively high chance of fouling problems due to large amounts of
alkalis content and presence chlorine in biomass.
D. Before mixing with pulverized coal, biomass needs to be milled and palletized to
be feed in the boiler, and also moisture content of biomass should beimaintained
regarding boiler specification.

14 | P a g e
E. The Large feedstock is needed for large plants throughout the year which requires
large forest area near the location of the plant.
F. Biomass occupies large space in the boiler which makes the combustion less
effective due to its low bulk density.

15 | P a g e
CHAPTER 2
LITERATURE
REVIEW

16 | P a g e
2. LITERATUREiREVIEW
2.1 EnergyiCrisis andiRenewable Energy Scenarioiin India
The net domestic energy generation will be 669.6 millionitons of oiliequivalents (MTOE)iby
2016-2017iand 844iMTOE by 2021-2022iaccording toithe report by Ministry of Statistics and
Programme Implementation and the energy consumption in those years satisfied to be 71% and
69% respectively. It has been projected by 2016-2017 and 2021-22, import of 267.82 MTOE
and 375.68 MTOE respectively. In most recent decades there is a continuous development in
Indian economy which results in higher energy demand can be practically fulfilled by renewable
energy sources [1].
Due to the remarkable economic growth rate of India, the energy requirement is expected
to be high which results in the emission of the higher greenhouse gas to the atmosphere. By
efficient utilization of energy or renewable energy can minimize the energy crisis. Parikh and
Parikh [24] evaluated that the CO2 emission reduction can be around 30% by 2030 by looking
over the fact and figure of energyineeds iniIndia andioptions regardingilow carbon. This can be
possible by implementing options of renewable energy sources like nuclear, biomass, solar and
wind power for energy production as alternative sources [27].
India is a developing country with more than 1.2 billion population. Electricity growth rate
is stable as compared to other forms of energy which are the biggest consumer of energy which
leads to increase in emission of the greenhouse gas like carbon dioxide. Dunn and Flavin
observed that CO2 is the important greenhouse gas that causes the ''anthropogenic climate
change''. Theiformation ofinew commercialienterprises, plants,ibusiness hubs and expanding
populace are the reasons for the riseiin electricityiconsumption in Indiaiand the CO2iemission
levels. Theionly wayito minimizeithe anthropogeniciclimate change by the implementation of
various renewable energy projects mainly biomass energy [28].
Due to the continuous rise in energy demand made India to think about other renewable
energy sources for future due to ongoing regional and political problems in the Middle East as
India imports around 71% of its oil requirement from which 66% from the Middle East
according to Rastogi, who studied the energy consumption pattern of India [29].

17 | P a g e
India is decided to the implementation of renewable energy share which can highly
contribute to electricity production. It was estimated that by the year of 2020 it will provide
about 15% of total electricity [30]. To minimize climatic issues, the government is also
launching new energy initiatives. Oneiof theimost importantienvironment-friendly energy
solution initiatives taken by both combination of Ministryiof Newiand RenewableiEnergy and
Ministryiof Poweriis JawaharlaliNehru NationaliSolar Mission. By 2022 National Solar Mission
concentrating on solar grid powers of capacity 20 GW, an off-grid capacity of 2 GW, solar
thermal collector area of 20 million square meters and solar lighting systems of 20 million. In the
last few years number of new initiatives has been taken for progress in renewable energy
production and it was found that Biomass energy and wind power have become successful
sectors in India. In the year 2013, efficient use of wind power of 2079 MW and biomass power
of 411 MW have shown a symbol of increased use of renewable energy in the country. Modern
biomass, bio-fuels,iand woodipellets haveibecome the source for international trade. Worldwide
production and transport of wood pellets increased 22imillion tonsiexcluding 8.2imillion tonsiof
pellets sold globally. Liquidibio-fuelsilike ethanoliand biodieselihas increasediand stoodiat 83.1
billioniliters and 22.5ibillion liters respectively.
For the minimization of CO2 emission to the atmosphere, India has taken so many
initiatives for the improvement and installation of renewable energy sources. According to
British Petroleum, renewable energy consumption hits 11.7 MTOE in India in the year 2013
which indicates 4.2% of the total renewable energy consumption which is increased from 2010.
The increase in renewable energy consumption shows a sign of minimization of CO2 and other
harmful emissions [31].
Among all the renewableienergy,ibio-energy has a significant portfolio which consists of
efficientibiomass stoves,ibiogas, biomassidirect combustion, co-firing and biomass gasification.
India has been concentrating on oneiof the largest renewableienergy programs on the planet by
knowing the potential of renewables. Ravindranath and Balachandra studied that the technical
and economic sustainability of bio-energy in India where coal and fossil fuel is dominating the
other source of energy leading to resource crisis. They concluded that India needs to implement
various innovative policies and projects to encourage quality bio-energy technologies [32]. The
success is very less compared to the potential available.

18 | P a g e
Conventional wood stoves without any suitable chimney and ventilation are used in rural
India, which is inefficient and causes severe pollution problems inside the house affecting health.
Innovation can replace traditional stove at rural areas by improved stoves with greater efficiency
and minimal greenhouse gas and pollution emission as per Ministry of New and Renewable
Energy [15]. Hence, modern biomass cooking stoves have the tendency to reduce the
consumption of conventional fuels with greater efficiency around 30-35%.
Municipal and industrial residues are beingiutilized for powerigeneration. Ravindranath et al.
studied the availability of rural biomass and discovered that wood, animal manure and residues
of the crop are the predominant biomass fuels but are used inefficiently. The energy from crop
residues, Municipal, and Industrial residues can be used for different efficient applications [33].
2.2 Biomass as a Renewable Energy Source and its Potential
Thermalipower plantsiuse coalifor combustioniwhich emits greenhouse gases mainly
carbon dioxide,ioxides ofinitrogen, oxidesiof sulphur, CFCs, and otheritrace gases. Carbon
dioxide released from combustion of coal have a greater effect on global warming among all
other greenhouse gases. Raghuvanshi et al. studied and suggested the use of renewable energy
sources for the coal-based power generation in India for minimization of CO2 emissions. They
discovered that combustion of coal resulting CO2 was the leading cause of global warming
presently contributing over 60% to the greenhouse effect. It is estimated that 750 kg of CO2 is
released into the atmosphere when 1 tonne of fossil fuel is burnt. Biomass consisting very less
percentage of sulphur and other pollutants can be used as fuel in power plants [34].
Though the substitution quantity of fossil fuels by biomass is fractional, it played a major
role regarding global warming as it is CO2 neutral. Werther et al. analyzed that the forest-related
residues of biomass such as wood chips, bark, leaf, etc. providing nearly 65% of the biomass
potential and rest provided by agricultural residues [35]. Developed countries like USA, Finland,
Sweden, and Austria obtain around 5%, 19%,17% and 14% respectively from biomass which is a
comparatively significant share of their principal energy. Presently in Western Europe, biomass
energy provides 2 EJ out of 54 EJ per year.

19 | P a g e
Chauhan studied on the biomass potential of two states Punjab and Haryana, which
describes the crop residue in these states. In Haryana per year aroundi40.142 MT andi24.697 MT
ofioverall cropiresidue is produced from various crops respectively and only 71% is utilized and
remaining 29% can produce approximately 1.5101 GW and 1.4641 GW of power respectively in
Punjab. The basic surplus is roughly 45.51%; the productive surplus is ofi37.48% andi34.10% as
a netisurplus of total biomass available in Haryana [36,37].
It was found that in India about 400 million people didn't have access to electricity as on
2011 and for cooking around 72% of the population depended on traditional biomass. So
maximum percentage of the population of the country need cleaner and existing form of energy
[38]. Hence, a step for productive biomass power production is needed in India.
2.3 Biomass Conversion Processes
Biomass conversion processes are of different types. Kucuk and Demirbas[39] studied
three biomass conversion processes named chemical, thermo-chemical, and biochemical
processes having different parameters.
The most efficient biomass conversion process is co-firing process among all other
processes. It is helpful in minimization of CO2 emission from combustion of fossil fuels in
power plants in a near term. Carbon loop combustion, oxy-firing, carbon dioxide sequestrations
are some long term practical technologies which can reduce CO2 emission. In all fossil fuelled
power plants CO2 emission can be decreased rapidly by quick usage of biomass co-firing with
minimum alterations and reasonable financing. The aggregate reduction in carbon dioxide
emissions could be remarkable if most of the conventional power plant in the world will adopt
the co-firing method. Co-firingiis discovered toibe the mostipromising technique for production
of electricity from biomass, and subsequently, carbon dioxide emission is very less. Basu et al.
[40] studied on some co-firing with externalifiring oriindirect firing utilizingicombustion. They
studied that in pulverizing mills direct firing of biomass gasification is more efficient and cost
advantageous than indirect firing option and efficiency of direct co-firing is more than the
indirect co-firing process.

20 | P a g e
Mukunda et al.imade a studyiabout such devices the design of which are played a
significant role in biomass conversion process and prioritize on the requirement for renewable
energy in developing countries [41]. They classified the biomass by woody and pulverized and
compared its energy with fossil fuel. For both woody and pulverized biomass some of the
technologies involved such as gasifier-combustor, combinations of the gasifier, engine, and
alternator. To get high-grade heat, more preference is given to the use of pulverized biomass in
cyclone combustors. In global scenario to show the feasibility of these mechanisms, the techno-
economic aspects have conversed.
2.4 Chemical Properties and Ash Fusion Temperature Test of Biomass
Beforeiselecting a fuelito beiused in poweriplant theistudy of itsichemical properties like
proximate analysis,iultimate analysis,icalorific value, ashifusion temperature,ietc are important.
Kumar et al.[42] studied the characteristics of four different non-woody plants species named
Eupatorium,iAnisomales,iSida, andiXanphium and calculated their power production potential.
They found good energy value of biomass as compared to locally available coal. Similar studies
were carried out by Kumar and Patel [43] on two non-woody biomass species named Ocimum
canumiand Tridaxiprocumbens. Later, in a similar way Kumar et al. [44] studied the power
production potentials of three forestry non-woody biomass species named SidaiRhombifolia,
VincaiRosea, andiCyperus. Also, they found higher fusion temperature of those biomass
specimen which can avoid problems associated with boilers.
Also, coal and biomass blends play an important role in minimizing CO2 emission.
Demirbasi[45] analyzed the blending characteristics of biomass with coal in the coal-fired boiler
and found that the co-firing process is more efficient and advantageous by comparing the co-
firing process with other conversion processes. Later, Demirbas [46] proposed the significant
change in properties of the fuel with respect to coal. He discovered that the ash content varies
betweeni1-16% while nitrogen percentage varies betweeni0.2-1%. Similarly, carbon percentage
varies betweeni35-43%. Variation of sulphur in biomass is very less and lies belowi0.1%. Other
properties as compared to coal areihigh moistureicontent, highichlorine content, lowibulk density
and lowiheating value are found. Biomass has less carbon content but, the oxygen content is

21 | P a g e
higher as compared to coal. He suggested biomass still as the most eligible renewable source to
replace fossil fuels irrespective of these variations.
To avoid bed agglomeration and some problem associated with the boiler the study of
ashes of biomass are important. Hiltunen et al. [47] analyzed various types of ashes of biomass
and categorized the biomass ashes into three groups according to their composition such as i)iCa,
K-richiand Siilean biomass ash, ii)iSi-rich andiK, Cailean biomass ash,iand iii) K,iCa andiP-rich
biomass ash. The first set belongs to woody biomass, and the rest belong toiagricultural biomass.
They also analyzed the effect of combustion and their effect on boilers which are very popular
for biomass combustion namely circulating fluidized bed boilers. Slagging and fouling are two
important ash-related problems associated with the boiler. When ash deposited on the furnace
surface which is exposed to high-temperature flame radiation, then it is called slagging, and the
deposition of ash in the convective section of the boiler is called fouling. Slagging and fouling
can cause excessive deposition of ash on the heat transfer surfaces of boilers which decrease the
effectiveness of boiler functioning and can shut down the power unit in extreme condition. These
problems can be avoided by complete knowledge about ash fusion temperature [48].
2.5 Decentralized Power Generation Structure in Rural Areas
As the name suggests, decentralized energy is produced close to the location where it
should be used rather than at a large plant elsewhere and sent through the national grid.
Transmission losses are reduced by this local generation and also lower carbon emissions.
Kumar and Gupta [49] made a broad statement on land and biomass calculation in rural areas for
decentralized power generation by considering a group ofi15-20 villages consisting of nearly
3000 families and accordingly one power plant can be planned which can provide per dayi20000
kWh of electricity ori7300 MWh/year. Kumar et al. [42] considered four biomass species such as
Eupatorium, Anisomales, Sida, and Xanphium. They calculated that from these biomass species,
around i118,i66,i90 andi114 hectares lands would be required for the continuous generation of
desired electricity respectively. Further, Kumar and Patel [43] studied on Ocimumicanum and
Tridaxiprocumbens plant species approximately ofi18 years old and calculated the land
requirements to be i650 andi1274 hectares respectively to produce the same amount of desired
electricity. Similarly, Kumar et al. [44] considered SidaiRhombifolia, VincaiRosea, and Cyperus
22 | P a g e
non-woody plants and calculated that aroundi44,i52 andi82 hectares of land area would be
required to produce the said amount of electricity.
In the similar way, Kumar and Patel [50] studied some blends of coal, cattle dung and rice
husk power generation potential considering decentralized power generation process and found
that there is a decrease in coal requirement for power generation with the increase in the
percentage of cattle dung and rice husk. Hence, total energy contents, land area and the
requirements of coal-biomass blends should be calculated for betterment for power generation by
the decentralized process.
2.6 Summary
Biomass energy constitutes a remarkable portion of renewable energy source, but there is a
deficiency of research on the study of power production potential of biomass species which can
be clearly understood from the literature review. The research on studies on chemicaliproperties
of biomass fuels which include the analyses of ashifusion temperature,iproximate, and ultimate
parameters and also on co-firing with limited local coal. It is also observed that there is a need to
study on decentralized power generation aspects of biomass.
2.7 Objectives of the Present Project Work
The aims and objectives of the present project work are as follows:
a. Selectioniand collectioniof someiwoody biomassispecies fromithe localiarea.
b. Experimentaliinvestigation ofiproximate analysisiof differenticomponents ofisome selected
woodyibiomass species.
c. Characterizationiof theseibiomass componentsifor theirienergy values.
d. Determinationiof bulkidensities ofithe selectedibiomass species.
e. Calculation ofiash fusionitemperatures ofiashes obtainedifrom someiof the selected biomass
species.
f. Determination of ultimateianalysis of someiselected biomass species.

23 | P a g e
g. Estimation of power generation potentials, requirements of land area for decentralized power
generation.

24 | P a g e
CHAPTER 3
EXPERIMENTAL
WORK

25 | P a g e
3. EXPERIMENTAL WORK
3.1 Materials Selection
For the present project work, five different components (leaf, new branch, main branch,
bark, and root) were taken from residues of two separate woody plant species and fruit husk/peel
of three biomass were taken from local areas which have no commercial use. These plant species
are Vachellia nilotica(localiname- Babool), Azadirachtaiindica(localiname- Neem), Musa
acuminata(localiname- banana), Cocos nucifera (localiname- coconut) and Arachis
hypogaea(local name- groundnut). Considering all the components of selected biomass samples
total of thirteen numbers of samples were taken for proximate analysis and calorific value
determination. By keeping these samples in a cross-ventilated room for 20-30 days, the
equilibrium in moisture contents of these components was attained. Before experimental work
air, dried samples were grinded into powder. Three selected woody biomass samples namely
Neem bark, Babool Leaf and Coconut husk were considered for ultimate analysis.
3.2 Proximate Analysis of Studied Biomass Samples
Proximate analysis is deemed for characterizing biomass and coal samples. The
quantitative analysis of the distribution of constituent products obtained when the sample is
heated under designated conditions is called proximate analysis. As per ASTM D121 [51],
proximate analysis separates the constituents into four categories: a) Moisture, b) Ash, c) volatile
matter and d) fixed carbon.
3.2.1 Moisture Content Determination
The quantity of water present in the sample expressed in weight percentage (Wt.%) of the
sample is moisture content of fuel. This is expressed regarding dry basis or wet basis. In the case
of dry basis, only ash and ash free matter is considered, but the aggregate water, ash, and ash free
matter content are considered in wet basis. It is crucial to mention the basis on which moisture is
determined because moisture plays a vital role in differentiating biomass fuel [52].

26 | P a g e
The selected biomass sample was grinded into powder and by using a –72 mesh sieve,
required –72 mesh size biomass materials were collected. A –72 mesh size sieve describes 72
holes per square inch, and the negative sign indicates passing of biomass powder particles
through the holes. As per BIS 1350 [53], one gram of –72 mesh size air dried biomass sample
powders were taken in borosil glass discs and heated for one hour in the furnace at a temperature
of 100 ºC. After the designated time, the borosil glass discs were taken out of the oven, and the
samples were weighed by electronic balance. By using the expression given below, the
percentage losses in weights were calculated.
Percentage moisture content (%) = (Weight of residue obtained × 100) / Initial wt. of
simple (3.1)
3.2.2 Ash Content Determination
Ash is the inorganic residue left after the complete burning of the biomass. It is a vital
constituent present in biomass which largely affects ash fusion characteristics. Ash contains
calcium, ferrous carbonate, magnesium and phosphorus, sand with clay, etc. which influence the
boiler properties at a high temperature of combustion and gasification. Ash content affect the
design of boiler. If the fuel comprises greater quantity of ash, then it can cause severe problems
like Slagging, fouling and clogged ash removal problem associated with boilers [54].
Fig. 3.1: Muffle Furnace

27 | P a g e
One gram of each –72 mesh size samples was air dried and then were taken in shallow
silica disc and put in a muffle furnace which is shown in Fig. 3.1. The temperature inside muffle
furnace was maintained at 775- 800 ºC. The muffle furnace used for this experiment have a
measuring range of temperature 0-1000 ºC with a resolution of 1 ºC and accuracy of ±5 ºC . The
biomass samples were kept in maintained temperature in the muffle furnace and heated till their
complete combustion usually half an hour. Then the residues obtained were measured with the
help of electronic balance for each sample and expressed in a percentage similar to moisture
content [53].
3.2.3 Volatile Matter Determination
The portion of the fuel that will volatilize rapidly when it is burnt at a high temperature
under a particular condition is called volatile matter. When the fuel has low volatile matter by
heating char formation occurs, but fuels have high volatile mass produce volatile gasses by
heating. Biomass has high volatile matter content that may up to 80%, unlike coal which has
very low percentage of volatile matter below 20%. Volatile matter consists of methane,
hydrogen, carbon monoxide, ammonia, tar, etc. excluding moisture as residual moisture has not
taken into account [51,52].
Cylindrical silica crucibles covered with the close-fitting silica lid were pre-weighted and
each biomass sample of one gram of –72 mesh size powder was taken in the crucible. Then the
crucibles were heated in a muffle furnace at temperature 925±10 ºC for exactly seven minutes.
Then the crucibles were taken out from the furnace and air cooled. Then the weight of samples
was measured with the help of electronic balance as soon as possible, and the percentage of
weight loss was determined [53]. The following formula is used for calculating the weight
percentage of volatile matter in dry basis.
Volatile Matter (wt.%) = % loss in weight(wt.%) – moisture content (wt.%) (3.2)

28 | P a g e
3.2.4 Calculation of Fixed Carbon Content
The value of fixed carbon content can be calculated by subtracting the aggregate
percentages of moisture, volatile matter and ash from 100. Fixed carbon content is the quantity
of solid carbon residue that remains after the combustion of the sample with the removal of
volatile matter. The value of fixed carbon content helps for evaluating the productivity of
biomass fuel. At lower combustion temperature it improves the reactivity of fuel [53].
Fixed Carbon Content (wt.%, dry basis) =100 – {Moisture + Volatile matter + Ash} (wt %,
drybasis) (3.3)
3.3 Calorific Value Determination
Calorific value or energy value of any fuel may be the quantity of heat energy obtained
by complete combustion of a specified quantity of fuel in the presence of oxygen. It is an
important property of any fuel and influences design and controlling of the power plant which is
expressed in terms ofikcal/kg oriMJ/kg. It is evaluated by the help of a calorimeter. Based on the
effect of water vapour on energy value, calorific value is classified into two types.
a) Grossicalorific valuei(GCV) oriHigher heatingivalue (HHV)
b) Neticalorific valuei(NCV) oriLower heatingivalue (LHV)
The GCV considers the latent heat of vaporization of water which is the quantity of heat
generated by combustion when the water vapour produced during combustion is allowed to
return to the liquid state under standard condition of temperature and pressure. When the water
vapour produced during combustion remains gaseous and doesn't return to liquid state, the
quantity of heat generated is called Net calorific value (NCV). Here, the condensation of water is
not taken into account. Calculation of energy value is calculated using an adiabatic calorimeter
[55].

29 | P a g e
Fig. 3.2 : Oxygen Bomb Calorimeter
In the present project, the gross calorific value or higher heating values of some biomass
species were determined with the help of Oxygen Bomb Calorimeter, which is capable of
calculating the GCV of any solid fuel [53]. This oxygen bomb calorimeter used in the present
have a temperature scale resolution of 0.01 ºC and an accuracy of ±0.02 ºC. The measuring range
is 0-10 ºC. First, briquetting device is used to produce briquettes of each biomass samples, and
briquettes were taken in a nichrome crucible. A cotton thread of 10-15 cm long was positioned
over the sample in the crucible for facilitating ignition. A fuse wire is connected between two
electrodes of the crucible, and the cotton wire is suspended by using the fuse wire as shown in
the Fig. 3.2. Before conducting the experiment Oxygen gas was poured into the oxygen bomb
calorimeter up to a pressure 25 to 30 atm and the bucket of calorimeter were filled with two liters
of water and were stirred continuously by the help of a motor and stirring mechanism maintain a
uniform temperature. Then after switching on the current, the ignition of the sample was started,
and the temperature of the water was recorded by thermometer attached to it. Then from the
reading, the rise in temperature was calculated. With the help of rising in temperature (ΔT),
water equivalent of apparatus (W.E) in cal/ºC, initial weight of the sample (w) in gram, the GCV
can be calculated by the following empirical formula [56].
Gross calorific value = {(W.E. × ΔT) / (w) ─ (heat released by cotton thread +heat released by
fusedwire)} (3.4)

30 | P a g e
3.4 Bulk Density Determination
The bulk density of fuel gives an idea about the weight of that fuel to be provided
sufficiently in a given volume of the boiler. It influences the transportation and storage costs
largely. The combustion devices also largely influenced by bulk density. Higher, the bulk density
lesser, will be the transportation cost. It is expressed as the weight per unit volume of material,
expressed in kg/cubic meter.
The bulk densities of the biomass samples were calculated according to the ASTM E873-
82 standard [57]. Each biomass sample of -72 mesh size powder was taken in a cubic container
of dimension 65mm × 65 mm × 65 mm made of mild steel. Each sample was fully packed in the
container and leveled at the top surface. The weight of the samples filled in the container was
measured with the help of electronic balance of sensitivity 0.01gm. Then bulk density was
calculated by the weight obtained from electronic balance and initially measured dimension of
the container.
Bulk Density = Wt. of the sample packed in container (kg)/Volume of the container (cubic
meter) (3.5)
3.5 Ash Fusion Temperature Determination
Ash fusion temperature plays a significant role in selection of fuel because at high-
temperature fuel ash creates slag better known as clinker. That can pose a mechanical problem in
combustion process associated with the boiler which largely influences boiler design and
efficiency. Deposition of ash at high-temperature region causes slagging and fouling problems in
the boiler. Hence, ash fusion temperature determination plays a crucial role in the selection of
fuel which includes i) initial deformation temperature (IDT), ii) softening temperature (ST), iii)
hemispherical temperature (HT) and iv) fluid temperature (FT). IDT is the temperature, at which
first change in shape occurs and the temperature at which the sample starts shrinking and the
corners of the sample melt is called ST and the temperature at which the cubical sample becomes
hemispherical in shape is called HT and the temperature at which the sample melts and lays flat
is called FT [44].

31 | P a g e
The ash fusion temperatures of biomass ashes were calculated according to DIN: 51730
[58]. Ashes of some selected biomass samples were taken and crushed and by mixing one drop
of distil water 3mm sizes of cubic shaped sample are prepared for ash fusion test. Then the
sample was put inside Leitz heating microscope which is shown in Fig.3.3. The rise in
temperature was maintained at 8ºC/min, and the current was maintained at 25Amp and heated up
to a maximum temperature of 1450 ºC with an accuracy of ±5 ºC and resolution of 1ºC. The
external shape of the cubes was observed, and the temperatures were noted during the
deformation, shrinkage of cubic samples.
Fig. 3.3: Leitz Heating Microscope
3.6 Ultimate Analysis: Determination of Chemical Composition
Ultimate analysis gives complete results as compared to proximate analysis. It is capable
of calculating some valuable ash free organic components like carbon, oxygen, hydrogen,
nitrogen, etc. and is carried out by an elemental analyzer. In general practice, 200 mg of each
sample were heated at 900 ºC in the presence of oxygen. Carbon has transformed into CO2,
hydrogen into H2O, sulphur into SO2 and nitrogen into N2 during the experiment. By using an
infra red detector the quantity of Carbon, hydrogen and sulphur were calculated and by using a
thermal conductivity detector quantity of N2 is determined [55]. In the present work, CHN
analysis was carried out for some of the selected biomass samples at Sophisticated Analytical
Instrumentation Facility, Punjab University, Chandigarh, India.

32 | P a g e
CHAPTER 4
RESULTS AND
DISCUSSION
33 | P a g e
4. RESULTS AND DISCUSSION
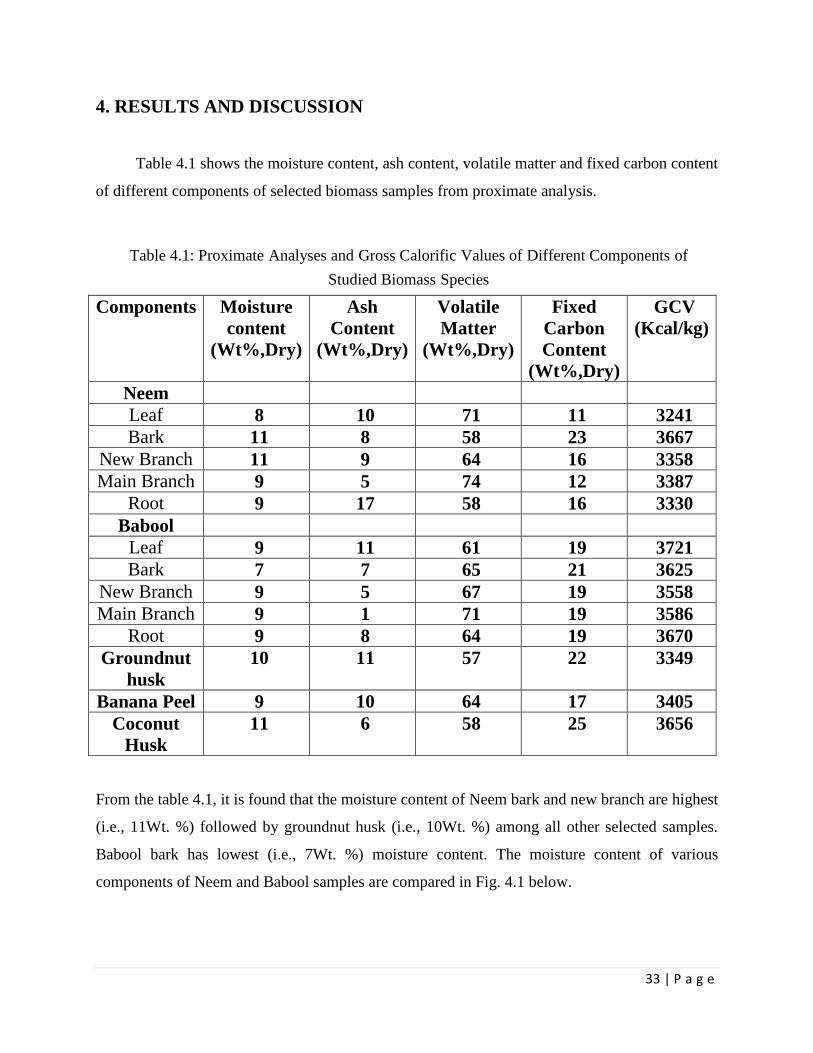
Table 4.1 shows the moisture content, ash content, volatile matter and fixed carbon content
of different components of selected biomass samples from proximate analysis.
Table 4.1: ProximateiAnalyses andiGross CalorificiValues ofiDifferent Componentsiof
Studied BiomassiSpecies
Components Moisture
content
(Wt%,Dry)
Ash
Content
(Wt%,Dry)
Volatile
Matter
(Wt%,Dry)
Fixed
Carbon
Content
(Wt%,Dry)
GCV
(Kcal/kg)
Neem
Leaf 8 10 71 11 3241
Bark 11 8 58 23 3667
New Branch 11 9 64 16 3358
Main Branch 9 5 74 12 3387
Root 9 17 58 16 3330
Babool
Leaf 9 11 61 19 3721
Bark 7 7 65 21 3625
New Branch 9 5 67 19 3558
Main Branch 9 1 71 19 3586
Root 9 8 64 19 3670
Groundnut
husk
10 11 57 22 3349
Banana Peel 9 10 64 17 3405
Coconut
Husk
11 6 58 25 3656
From the table 4.1, it is found that the moisture content of Neem bark and new branch are highest
(i.e., 11Wt. %) followed by groundnut husk (i.e., 10Wt. %) among all other selected samples.
Babool bark has lowest (i.e., 7Wt. %) moisture content. The moisture content of various
components of Neem and Babool samples are compared in Fig. 4.1 below.

34 | P a g e
Fig. 4.1: Comparison of Moisture Content in Neem and Babool Samples.
Very high ash content is obtained in the case of Neem root (i.e., 17 Wt. %) followed by
babool leaf (i.e., 11 Wt. %). The main branches of Babool are found to be lowest (i.e., 1 Wt. %).
The ash content in different Neem and Babool samples are compared in the chart given below.
Fig. 4.2: Comparison of Ash Content in Neem and Babool Samples.

35 | P a g e
From all components of selected biomass samples the fixed carbon content is found to be
highest in Coconut husk (i.e., 25 Wt. %) followed by Neem bark (i.e., 23 Wt. %). And fixed
carbon content found lowest in case of leaves of Neem (i.e., 11 Wt. %). The fixed carbon content
in Barks of Neem and Babool are found to be higher as compared to its other components. Also,
the outer covers of Coconut, Groundnut, and Banana fruit shows comparatively higher fixed
carbon content. Fixed carbon content in Neem and Biomass sample are compared in the chart in
fig. 4.3.
Fig. 4.3: Comparison of Fixed Carbon content in Neem and Babool Biomass samples
The table 4.1 shows that the branches have comparatively higher volatile matter than other
components. Also, bark contains comparatively low volatile matter. Volatile matter is found to
be highest in main branches of Neem (i.e., 74 Wt. %) followed by its leaves and the main branch
of Babool and the husk of Groundnut has the lowest value of volatile matter (i.e., 57 Wt. %). A
comparison of Volatile Matter Content in Neem and Biomass samples is shown in Fig. 4.4
below.

36 | P a g e
Fig. 4.4: Comparison of Volatile Matter Content in Neem and Babool Biomass samples
If the fuel consists of greater volatile matter and fixed carbon, then it helps in enhancing
the combustion process by facilitating easy ignition and high reactivity. High ash content gives
rise to slagging, and fouling problems prevent heat transfer and decreases combustion efficiency.
If the moisture content is high, then it decreases its effective bulk density which leads to increase
in cost associated with transportation and storage. The increase in ash and moisture content will
reduce the energy value of the fuel [59].
4.1 Gross Calorific Values of Studied Biomass Components
Calorific value is an important characteristic which gives an idea about power generation
potential of a specific fuel. It plays a vital role in the selection of fuel for power plants.
The leaf of Babool biomass species is considered for the calculation of GCV. Maximum
rise in temperature was found to be 0.55 °C. The initial weight was measured to be 0.29g. The
water equivalent of Oxygen Bomb Calorimeter is 1987 cal/0C and Heat released by cotton thread
and fused wire is specified as 48 kcal/kg.

37 | P a g e
GCV of Babool leaf = (1987 x 0.55)/0.29 = 3721 kcal/kg.
Similarly, GCV for all other biomass species were calculated and are presented in Table 4.1.
Fig. 4.5: Comparison of GCV of Neem and Babool Biomass samples.
The calorific values presented in Table 4.1 shows that the leaves of Neem have the lowest
calorific value, and its bark has the highest calorific value among other components of Neem
biomass samples. But in the case of the components of Babool biomass species, leaves has
highest calorific value, and its branches have comparatively lowest value. It is observed from
fig. 4.5 that, all the components of Babool biomass species have relatively higher GCV. It should
be noted that the leaves of Babool have highest calorific value while Neem leaves have the
lowest value among all the selected biomass samples. Also, Babool root, coconut husk, and bark
of both Neem and Babool are found to be good at calorific value.

38 | P a g e
4.2 Determination of Bulk Densities
Bulk density is an important property which decides the cost associated with transportation
and storage capacity.
The bulk density of all selected biomass samples was determined and is listed in Table 4.2.
Table 4.2: BulkiDensities ofiDifferent Componentsiof Biomass
Components BulkiDensity(Kg/m3)
Neem
Leaf 321
Bark 382
New Branch 346
Main Branch 342
Root 328
Babool
Leaf 316
Bark 443
New Branch 352
Main Branch 349
Root 372
Groundnut Husk 262
Banana Peel 422
Coconut Husk 163
Table 4.2 shows that leaves of biomass species have lower bulk density while barks have
high bulk density compared to other components. Also, it is observed that the outer cover or husk
have lower bulk density while only Banana peel have a higher bulk density (i.e. 443Kg/m3). It
should be noted that bark of Babool have highest bulk density followed by Banana peel (i.e.
422Kg/m3) while Coconut husk(i.e. 163Kg/m3) have the lowest bulk density followed by
Groundnut husk(i.e. 262Kg/m3).

39 | P a g e
4.3 Ash FusioniTemperature Determinationsiof Selected Biomass Components
Ash fusion temperatures of four selected biomass samples were measured, i.e., Neem root,
Neem leaf, Babool leaf and the husk of Coconut were considered for the test by using Leitz
Heating Microscope. The values of IDT, ST, and HT of different selected samples were
calculated and presented in Table 4.3 below.
Table 4.3: Ash Fusion Temperatures of Different Biomass Samples
Ash of Biomass
Samples
Ash fusionitemperatures,i0C
IDT
(Initial Deformation
Temperature)
ST
(Softening
Temperature)
HT
(Hemispherical
Temperature)
Neem Root 995 1132 1253
Babool Leaf 1131 1158 1189
Coconut Husk 1108 1134 1161
Neem Leaf 1178 1208 1232
It was found that Initial Deformation Temperature (IDT) varies from 995 to 1178ºC,
softening temperature (ST) ranges from 1132 ºC to 1218 ºC and hemispherical temperature (HT)
ranges from 1161 ºC to 1253 ºC. The IDT of Neem leaf was found to be the highest value as
shown in Table 4.3. For safe boiler operation, the IDT of the ash of the fuel should be at least
150 ºC more than the boiler operation temperature. The operating temperature of the boilers
based on biomass is around 800-900 ºC [47]. The value of IDT of all the selected sample is
found to be above the boiler operating temperature. Hence, these selected biomass ashes will not
create any problem associated with combustion in boilers. Due to the limitation of the
instrument, the picture of the sample inside furnace during IDT, ST and HT could not be
obtained.

40 | P a g e
4.4 Ultimate Analyses of Selected Biomass Components
Ultimate analyses give the data about the different constituent present in components of
various biomass species. These elements are carbon, hydrogen, nitrogen and oxygen. Carbon and
hydrogen positively contribute to gross calorific value, as those are oxidized to CO2 and H2O
exothermically. But the reduction of oxygen negatively contributes to the gross calorific value
while nitrogen has least effect on it. Nitrogen is almost totally converted to gaseous N2 and NOx
[60]. The calorific values of carbon and hydrogen are approximately 33.829 MJ/kg and 144.444
MJ/kg respectively [43]. So both of them can be assumed to be an important factor in deciding
the calorific value of the fuel.
Table 4.4: Ultimate Analysis and CorrespondingiGross CalorificiValues ofiBiomass Samples
Components Ultimateianalysis (wti%, dryibasis) Calorific
Value
(Kcal/kg)
Carbon Hydrogen Nitrogen Oxygen
Neem bark 45.4 5.62 1.028 41.731 3667
Babool leaf 46.891 4.928 1.223 43.864 3721
Coconut
husk
45.234 5.562 0.925 41.896 3656
The results found from ultimate analyses of three selected biomass samples (Neem bark,
Babool leaf, and Coconut husk) along with their gross calorific values have been shown in Table
4.4. Due to less availability of time and instrument, the ultimate analysis of only three selected
components was possible.
A similar type of results was obtained from the Table 4.4. It is observed that all three
selected biomass samples are good at hydrogen content and also the gross calorific value. Neem
bark has the highest hydrogen content (i.e., 5.62 wt%) while Babool leaf has the lowest value
(i.e., 4.928 wt%). The carbon content in Babool leaf is observed to be the highest while husk of
Coconut is the lowest value among the selected biomass samples. It is observed from the Table
4.4, that the gross calorific values have a direct relationship with hydrogen content. The leaves of

41 | P a g e
Babool have lower hydrogen content but have the highest calorific value. But the difference is
negligible. Hence, the higher concentration of carbon and hydrogen is the reason of higher gross
calorific values of the fuel and also plays an important role in the selection of fuel.
4.5 Calculation of Land and Biomass Requirement for Decentralized Power
Generation in Rural Areas
The necessity of decentralized power generation in rural areas is due to intermittent power
supply and damage of electrical equipment due to fluctuation in voltage and frequency. The
requirements of electricity can be estimated in rural areas by considering a group of 15-20
villages comprising of nearly 3000 families and accordingly one power plant can be designed.
Approximately 6000 kWh/day of electricity is considered to be required by 3000 families.
Considering the prerequisites from the watering system and small-scale commercial enterprises
near the cluster of the village, approximately an additional energy of 14000 kWh/day is also
considered [49]. A total electricity of 20000 kWh/day or 7300 MWh/year can be obtained by a
power plant in that location.
The approximate production quantity in tonnes per hectare of all the thirteen biomass
samples was calculated by field studies and presented in Tables 4.5-4.7. Also, the calorific values
in MJ/kg and energy values in MJ/ha were calculated on the dry basis and presented in the same
set of tables.
Table 4.5: TotaliEnergy Contentsiand PoweriGeneration Structureifrom Neem Biomass Species
(Ten Years old approximately)
Component Calorific value
(MJ/t, dry basis)
Biomass production
(t/ha)
Energy value (MJ/ha)
Leaf 13570 25.827 350472.39
Bark 15353 21.439 329152.967
New Branch 14059 12.216 171744.744
Main Branch 14181 21.226 301005.906
Root 13942 8.753 122034.326
Dataicollected fromifield studiesi(approximateivalues)

42 | P a g e
Table 4.6: TotaliEnergy Contentsiand PoweriGeneration Structureifrom Babool Biomass Species
(Fifteen Years old approximately)
Component Calorific value
(MJ/t, dry basis)
Biomass production
(t/ha)
Energy value (MJ/ha)
Leaf 15579 4.863 75760.677
Bark 15177 5.621 85309.917
New Branch 14897 8.128 121082.816
Main Branch 15014 18.685 280536.59
Root 15366 6.866 105502.956
Dataicollected fromifield studiesi(approximateivalues)
Table 4.7: TotaliEnergy Contentsiand PoweriGeneration Structureifrom Groundnut Husk,
Banana Peel and Coconut Husk Biomass Species (Per Year Production approximately)
Component Calorific value
(MJ/t, dry basis)
Biomass production
(t/ha)
Energy value (MJ/ha)
Groundnut Husk 14022 125 1752750
Banana Peel 14256 17.751 253058.256
Coconut Husk 15307 66.69 1020823.83
Dataicollected fromifield studiesi(approximateivalues)
In general practice, the thermal and overall efficiencies of a power plant are considered as
30% and 85% respectively [50]. The land requirement for Neem sample is calculated below.
Referring Table 4.5, the total energy production in MJ per hectare of land is found by adding the
energy values of all the components (leaf, bark, new branch, main branch and root) of Neem tree.
i.e.
350472.39 + 329152.967+ 171744.744 + 301005.906 +122034.326 = 1274410.333 MJ/ha.
The energy output by taking thermal efficiency of 30%, is
1274410.333 × 0.3 = 382323.1 MJ/ha.
43 | P a g e
Then the net energy output by considering overall efficiency of 85%, is
382323.1 × 0.85 = 324974.635 MJ/ha.
Then by multiplying a factor of 0.0002778, the above energy value can be converted in MWh/ha
as shown below,
324974.635 × 0.0002778 = 90.27 MWh/ha
Hence, land required for supplying electricity from Neem biomass species for the whole year
= 7300/90.27 = 80.868 ha.
Then the total biomass production in t/ha can be obtained by adding biomass production of each
component of Neem biomass sample.
i.e.
25.827 + 21.439 + 12.216 + 21.226 + 8.753 = 89.461 t/ha
Then the biomass requirement for supplying electricity from Neem biomass species for the
whole year can be found out by multiplying 89.461 t/ha with the total land required for Neem
biomass.
i.e.
89.461 × 80.868 = 7234.532 tonne
Likewise, the land requirement and biomass requirement for all studied biomass samples was
calculated and presented in Table 4.8.

44 | P a g e
Table 4.8: Land Area and Biomass Requirements for Production of i7300 MWhiElectricityiper
Year
Biomass species Land requirement (hectare) Biomass requirement (tonne)
Neem 80.868 7234.532
Babool 154.236 6811.524
Groundnut Husk 58.795 7349.375
Banana Peel 407.23 7228.739
Coconut Husk 100.95 6732.355
It is observed from the Table 4.8, the husk of Groundnut needs the lowest and Banana peel
needs the highest land area among all studied biomass species for the supply approximately
20000 kWh of electricity per day or 7300 MWh per year continuously. Also, it is observed that,
the Coconut husk biomass may provide the same amount of energy with least quantity (i.e.
6732.355 tonne).

45 | P a g e
CHAPTER 5
CONCLUSION
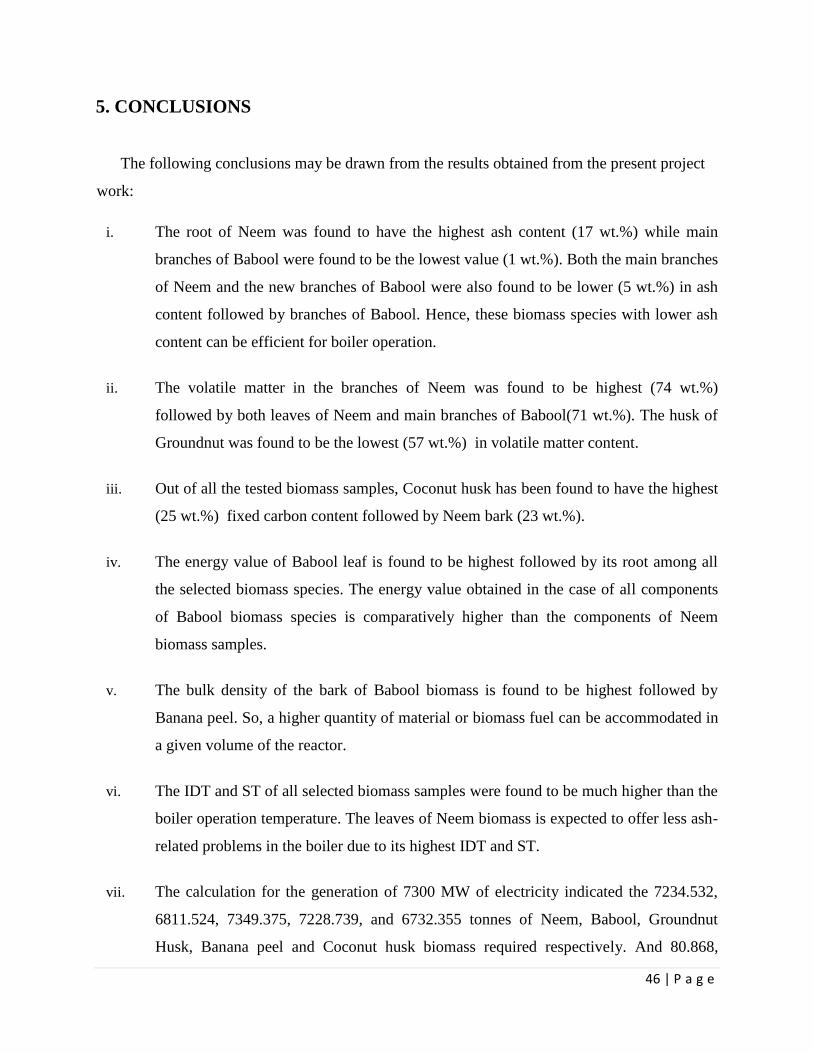
46 | P a g e
5. CONCLUSIONS
The following conclusions may be drawn from the results obtained from the present project
work:
i. The root of Neem was found to have the highest ash content (17 wt.%) while main
branches of Babool were found to be the lowest value (1 wt.%). Both the main branches
of Neem and the new branches of Babool were also found to be lower (5 wt.%) in ash
content followed by branches of Babool. Hence, these biomass species with lower ash
content can be efficient for boiler operation.
ii. The volatile matter in the branches of Neem was found to be highest (74 wt.%)
followed by both leaves of Neem and main branches of Babool(71 wt.%). The husk of
Groundnut was found to be the lowest (57 wt.%) in volatile matter content.
iii. Out of all the tested biomass samples, Coconut husk has been found to have the highest
(25 wt.%) fixed carbon content followed by Neem bark (23 wt.%).
iv. The energy value of Babool leaf is found to be highest followed by its root among all
the selected biomass species. The energy value obtained in the case of all components
of Babool biomass species is comparatively higher than the components of Neem
biomass samples.
v. The bulk density of the bark of Babool biomass is found to be highest followed by
Banana peel. So, a higher quantity of material or biomass fuel can be accommodated in
a given volume of the reactor.
vi. The IDT and ST of all selected biomass samples were found to be much higher than the
boiler operation temperature. The leaves of Neem biomass is expected to offer less ash-
related problems in the boiler due to its highest IDT and ST.
vii. The calculation for the generation of 7300 MW of electricity indicated the 7234.532,
6811.524, 7349.375, 7228.739, and 6732.355 tonnes of Neem, Babool, Groundnut
Husk, Banana peel and Coconut husk biomass required respectively. And 80.868,

47 | P a g e
154.236, 58.795, 407.23 and 100.95 hectare of land is required for Neem, Babool,
Groundnut Husk, Banana peel and Coconut husk biomass respectively for the
production of same 7300 MW of electricity. From the analysis of the present results,
Coconut husk appears to be the best biomass for utilization in power generation.
48 | P a g e
References
[1] Energy Statistics (2013)., Ministry of Statistics and Programme Implementation,
http://mospi.nic.in/mospi_new/upload/Energy_Statistics_2013.pdf.
[2] India State Forest Report (2013), Forest Survey of India,
http://fsi.nic.in/cover_2013/sfr_forest_cover.pdf.
[3] Executive Summary (2011), International Energy Agency,
http://www.iea.org/Textbase/npsum/solar2011SUM.pdf.
[4] Glassley, William E. (2010). Geothermal Energy: Renewable Energy and the Environment,
CRC Press, ISBN 9781420075700.
[5] Co-firing of Biomass Residues for Electricity Generation in Grid Connected Power
Plants (2009), CDM Executive Board, http://cdm.unfccc.int/EB/051/eb51_repan05.pdf.
[6] Key World Energy Statistics 2015 - International Energy Agency
https://www.iea.org/publications/freepublications/publication/KeyWorld_Statistics_2015.pdf
[7] Gluskoter, H., Increase in fossil fuel utilization in 21stCentury,USGS
[8] Walsh,J.H., resources and environment in the 21st Century: seeing past the phantoms:
world energy council journal,july 1998.
[9] Ivanhoe, L.F., future world oil supplies,there is a finite limit, from world oil,1995.
[10] world fossil fuel reservesand projected depletion
http://crc.nv.gov/docs/world%20fossil%20reserves.pdf
[11] Renewables 2014 Global Status Report - REN21
www.ren21.net/Portals/0/documents/.../2014/GSR2014_full%20report_low%20res.pdf
[12] Renewable 2013 - Global Status Report (2013), Renewable Energy Policy Network for
the 21st Century,
http://www.ren21.net/portals/0/documents/resources/gsr/2013/gsr2013_lowres.pdf.
[13] Annual Energy Outlook (2014), Energy Information Administration,
http://www.eia.gov/forecasts/aeo/pdf/0383(2014).pdf.
[14] Energy statistics (2014), Ministry of Statistics and Programme Implementation,
http://mospi.nic.in/mospi_new/upload/Energy_stats_2014.pdf.

49 | P a g e
[15] Annual Report (2014), Ministry of New and Renewable Energy, http://mnre.gov.in/file
manager/annual-report/2013-2014/EN/overview.html.
[16] What is Woody Biomass? - Forest Bioenergy
www.forestbioenergy.net/training.../fact.../fact-sheet-1-1-what-is-woody-biomass/
[17] Demirbas A. (2000), Biomass Resources for Energy and Chemical Industry, Energy
Education Science & Technology, 5: pp. 21-45.
[18] AraKirakosyan and Peter B. Kaufman (2009-08-15). Recent Advances in Plant Biotechnology.
p.169. ISBN 9781441901934. Retrieved 14 February 2013
[19] Kurchania A. K. (2014), Biomass Energy. In: Bashkar C., Bashkar S. and Dhillon R. S.,
Editors. Biomass Conversion, Berlin Heidelberg, Springer
[20] Demirbas A. (1998), Yields of Oil Products from Thermo-Chemical Biomass
Conversion Processes, Energy Conversion Management
[21] Development benefits of clean energy in India: Biomass gasification prospects in India,
(2007),. The William and Flora Hewlett Foundation,
http://www.whrc.org/policy/pdf./cop13/hewlett-Report-FINAL.pdf.
[22] EPA Combined Heat and Power Partnership (2002),. United States Environmental
Protection agency, .,http://www.epa.gov/chp/documents/biomass_chp_catalog_part5.pdf.
[23] Federal Technology Alert - A New Technology Demonstration Publication (2004),
National Renewable Energy Laboratory, http://www.nrel.gov/docs/fy04osti/33811.pdf.
[24] Kurchania A. K., Panwar N. L.,and Pagar S. D.,(2010), Design and Performance
Evaluation of Biogas Stove for Community Cooking Application, Sustainable Energy,
29(2):, pp. 116-123.,
[25] Biomass Co-firing (2013), IEA-ETSAP and IRENA Technology Brief E21,
http://www.irena.org/DocumentDownloads/Publications/IRENA
ETSAP%20Tech%20Brief%20E21%20Biomass%20Co-firing.pdf.
[26] World Energy Outlook (2011), International Energy Agency,
http://www.iea.org/publications/freepublications/publication/weo2011_web.pdf.
[27] Parikh J. and Parikh K. (2011), India's Energy Needs and Low Carbon Options, Energy,
36: pp. 3650-3658.
50 | P a g e
[28] Dunn S. and Flavin C. (2002), Moving the Climate Change Agenda Forward: In State of
the World 2002, Special World Summit Edition: pp. 25-50.
[26] Rastogi C. (2014), Changing Geo-Politics of Oil and the Impact on India, Social and
Behavioural Sciences, 133: pp. 93-105.
[30] India's Energy Scenario in 2013 - Challenges and Prospects (2013), AP Energy Business
Publications, http://www.hcasia.safan.com/mag/hcajanmar13/r06.pdf.
[31] BP Energy Outlook 2030 (2012), British Petroleum,
http://www.bp.com/content/dam/bp/pdf/Energy-economics/Energy
Outlook/BP_Energy_Outlook_Booklet-2012.pdf.
[32] Ravindranath N. H. and Balachandra P. (2009), Sustainable Bio-Energy for India:
Technical, Economic and Policy Analysis, Energy, 34: pp. 1003-1013.
[33] Ravindranath N. H., Somashekar H. I., Nagaraja M. S., Sudh P., and Bhattacharya S. C.,
(2005), Assessment of Sustainable Non-Plantation Biomass Resources Potential for
Energy in India, Biomass and Bio-energy,. 29: pp. 178-190.
[34] Raghuvanshi S. P., Chandra A. and Raghav A. K. (2006), Carbon Dioxide Emissions
from Coal Based Power Generation in India, Energy Conversion and Management, 47:
pp. 427-441.
[35] Werther J., Saenger M., Hartge E. U., Ogada T., and Siagi Z. (2000), Combustion of
Agricultural Residues,. Progress in Energy and Combustion Science., 26: pp. 1-27.
[36] Chauhan S. (2012), District Wise Agriculture Biomass Resource Assessment for Power
Generation: A Case Study from an Indian State., Punjab, Biomass and bio-energy,. 37:
pp. 205-212.
[37] Chauhan S. (2010), Biomass Resources Assessment for Power Generation: A Case
Study from Haryana State, India, Biomass and bio-energy, 34: pp.1300-1308.
[38] Energy outlook (2012), International Energy Agency,
http://www.iea.org/publications/freepublications/publication/WEO2012_free.pdf.
[39] Kucuk .M. M. and Demirbas A. (1997), Biomass Conversion Processes, Energy
Conversion Management, 38(2): pp. 151-165.
51 | P a g e
[40] Basu P., Butler J., Mathias A. and Leon. (2011), Biomass Co-firing Options on the
Emission Reduction and Electricity Generation Costs in Coal-Fired Power Plants,
Renewable Energy, 36(1): pp. 282-288.
[41] Mukunda H. S., Dasappa S., Paul P. J., Rajan N. K. S., and Shrinivasa U. (1994),
Gasifiers and Combustors for Biomass Technology, Field Studies, Energy for
Sustainable Development, 1: pp. 27-38.
[42] Kumar M., Patel S. K., and Mishra S. (2010), Studies on Characteristics of Some
Shrubaceous Non-woody Biomass Species and Their Electricity Generation Potentials,
Energy Sources, Part A, 32: pp. 786-795.
[43] Kumar M. and Patel S. K. (2008), Energy Values and Estimation of Power Generation
Potentials of Some Non-woody Biomass Species, Energy Sources, Part A, 30: pp. 765
773.
[44] Kumar M., Patel S. K., and Hamid P. F. (2011), Studies on Characteristics of Some
Forestry Non-woody Biomass Species and Estimation of Their Power Generation
Potentials, Energy Sources, Part A, 33: pp. 1616-1624.
[45] Demirbas A. (2004), Combustion Characteristics of Different Biomass Fuels, Progress
in Energy and Combustion Science, 30: pp. 219-230.
[46] Demirbas A., (2005), Potential Applications of Renewable Energy Sources., Biomass
Combustion Problems in Boiler Power Systems and Combustion Related Environmental
Issues, Progress in Energy and Combustion Science, 31: pp. 171-192.
[47] Hiltunen M., Barisic V. and Zabetta E. C. (2008), Combustion of different types of
biomass in CFB boilers, Proceedings of the 16th European biomass conference, Valencia,
Spain.
[48] Gupta S., Wall T. F., Creelman R. A. and Gupta R. (1998), Ash Fusion Temperatures
and the Transformations of Coal Ash Particles to Slag., Fuel Processing Technology,
56(1-2): pp. 33-43.
[49] Kumar M. and Gupta R. C. (1991), Power generation from biomass, Ecology, 6: pp. 914.
[50] Kumar M. and Patel S. K. (2014), The Characteristics and Power Generation Energetics
of Coal, Cattle Dung, Rice Husk, and Their Blends, Energy Sources, Part A, 36: pp. 700

52 | P a g e
708.
[51] ASTM D 121-09a (2009), Standard Terminology of Coal and Coke, Pennsylvania:
American Society for Testing and Materials.
[52] Energy from Biomass (1999), Washington D.C.: World Bank Technical Paper,
http://www.wds.worldbank.org/servlet/WDSContentServer/WDSP/IB/2000/07/08/000094946_9903
3105581764/Rendered/PDF/multi_page.pdf.
[53] BIS: 1350 (1969), Part I. Methods of tests for coal and coke, New Delhi: Bureau of
Indian Standards.
[54] Slagging and Fouling in Coal-fired Boilers (2009), IEA Clean Coal Center,
http://www.iea-coal.org/documents/82175/7154/Slagging-and-fouling-in-coal-fired
boilers.
[55] Librenti E., Ceotto E. and Candello M. (2010), Biomass Characteristics and Energy
Contents of Dedicated Lignocelluloses Crops, Proceedings of the Third International
Symposium on Energy from Biomass and Waste. Venice, Italy.
[56] Agrawal, B. C. and Jain S. P. (1980), A Text-Book of Metallurgical Analysis, New
Delhi, Khanna Publication.
[57] ASTM E 873-82 (2013), Standard Test Method for Bulk Density of Densified
Particulate Biomass, Pennsylvania: American Society for Testing and Materials.
[58] DIN: 51730 (1984), Testing of solid fuels-Determination of fusibility of fuel ash. Berlin:
German Institute for Standardization.
[59] García R., Pizarro C., Lavín A. G. and Bueno J. L. (2014), Spanish Bio-Fuels Heating
Value Estimation. Part II: Proximate Analysis Data, Fuel, 117: pp. 1139-1147.
[60] García R., Pizarro C., Lavín A. G. and Bueno J. L. (2014), Spanish Bio-fuels Heating
Value Estimation. Part I: Ultimate Analysis Data, Fuel, 117: pp. 1130-1138.

53 | P a g e

54 | P a g e