Embed Size (px)
Citation preview

1
Characterization of the image-derived carotid artery input function using independent component analysis for the quantitation of [18F] fluorodeoxyglucose positron emission tomography images Image-derived input function by ICA for FDG-PET
K Chen1,3,8, X Chen2, R Renaut3,5,8, G E Alexander4,8, D Bandy1,8, H Guo3,8, and E M Reiman1,6,7,8
1The Banner Alzheimer Institute and the Banner Good Samaritan Positron Emission Tomography (PET) Center, Phoenix, Arizona, USA; 2Div Computer Stud, Arizona State University, Mesa, Arizona, USA; 3The Department of Mathematics and Statistics, Arizona State University, Tempe, Arizona, USA; 4The Department of Psychology, Arizona State University, Tempe, Arizona, USA;
5Department of Biomedical Informatics, Arizona State University, Tempe, Arizona, USA; 6The Department of Psychiatry, University of Arizona, Tucson, Arizona, USA; 7The Translational Genomics Research Institute (TGen), Phoenix, Arizona, USA; and 8The Arizona Alzheimer's Consortium, Phoenix, Arizona, USA
Abstract. We previously developed a noninvasive technique for the quantification of fluorodeoxyglucose (FDG) positron emission tomography (PET) images using an image-derived input function obtained from a manually drawn carotid artery region. Here, we investigate the use of independent component analysis (ICA) for more objective identification of the carotid artery and surrounding tissue regions. Using FDG PET data from 22 subjects, the ICA was applied to an easily defined cubical region including the carotid artery and neighboring tissue. Carotid artery and tissue time-activity-curves and 3 venous samples were used to generate spillover and partial volume-corrected input functions and to calculate the parametric images of the cerebral metabolic rate for glucose (CMRgl). Different from a blood-sampling-free ICA approach, the results from our ICA approach are numerically well-matched to the ones based on the arterial blood sampled input function. In fact, the ICA-derived input functions and CMRgl measurements were not only highly correlated (correlation coefficients >0.99) to, but also highly comparable (regression slopes between 0.92 and 1.09) with those generated using arterial blood sampling. Moreover, the reliability of the ICA-derived input function remained high despite variations in the location and size of the cubical region. The ICA procedure makes it possible to quantify FDG PET images in an objective and reproducible manner. Keywords. Positron emission tomography, Independent component analysis, Image-derived input function, quantitative measures of cerebral metabolic rates for glucose

2
1. Introduction In order to transform [18F] 2-fluoro-2-deoxy-D-glucose (FDG) positron emission tomography (PET) images into quantitative measurements of the cerebral metabolic rate for glucose (CMRgl, in units of mg/min/100 g), it is necessary to provide information about radiotracer delivery to the brain (i.e., the FDG input function), often referred to as the plasma time activity curve (PTAC). While the PTAC may be generated using arterial/arterialized blood samples, the invasive blood sampling approach is frequently uncomfortable and associated with occasional risk, it jeopardizes the ability to enroll and retain persons in research studies (e.g., in longitudinal studies Reiman et al. 2001) or clinical trials), it is labor-intensive, and it is not practical in small animal-imaging studies (e.g., in the preclinical screening of investigational therapies (Huang et al. 2004)). We previously developed a non-invasive method using dynamically acquired FDG PET images, 3 venous plasma measurements, and manually drawn carotid artery region of interest (ROI) to generate the image-derived input function (Chen et al. 1998). In this article, we discuss the identification of the carotid artery and surrounding tissue ROI using independent component analysis, making it possible to quantify FDG PET human brain images with minimal manual, subjective efforts and in a very reproducible way.
The essential step in the generation of the image-derived input function is the localization of the blood vessel component(s) from which the dynamics of the tracer in the vascular space are to be extracted. Entirely or partly manual procedures have been proposed to define vascular ROIs, including our previously described method to manually define carotid artery ROI (Chen et al. 1998) and a previously described method to manually define venous sinus ROIs (Wahl et al. 1999) directly in dynamically acquired FDG PET images. Alternatively, a vascular ROI may be defined on a person’s co-registered high-resolution magnetic resonance image (MRI) (Litton 1997). The choice of the superior sagittal sinus via the simulation of the tomographic imaging process to generate images of different blood vessel and background geometries, and selecting the one that best fits the acquired PET image is yet another suggested approach for obtaining a relevant blood vessel ROI (Asselin et al. 2004) which avoids both manual drawing and the need for MRI data. A number of statistical procedures have also been proposed to identify vascular ROIs in dynamically acquired PET images using temporal tracer kinetic information; these methods include cluster analysis (Liptrot et al. 2004), dynamic factor analysis (Wu et al. 1996, Wu et al. 1995), and, of particular interest to the current study, the independent component analysis (ICA) (Lee et al. 2001, Naganawa et al. 2005, Su et al. 2005).
ICA was first introduced to human brain imaging researchers in functional MRI (fMRI) studies (McKeown et al. 1998). The ICA has also been applied to quantitative myocardial perfusion in dynamically acquired Oxygen-15 water cardiac PET data (Lee et al. 2001). In that O-15 water PET study, the ICA-generated input function was found to have a tail with reduced noise as compared to that obtained by arterial blood sampling, whereas the estimates of myocardial blood flow are comparable. Since the left ventricle is relatively large and clearly separated from the myocardial wall it did not appear to be necessary to consider potentially confounding partial-volume and spillover effects (Lee et al. 2001). In contrast, these effects cannot be safely ignored in human brain PET studies since a cerebral blood vessel is small relative to image resolution. With their special version of ICA, EPICA which incorporates specific properties of the human brain FDG-PET data, Naganawa et al used a single arterial blood sample to scale the ICA generated image-derived input function, and they accounted for the effects of spillover implicitly through the source signal mixing process (Naganawa et al. 2005). With the same consideration in mind and the objective to establish a CMRgl quantification procedure without any blood sampling (i.e., blood sampling free FDG-PET CMRgl quantification), Su et al. adopted the approach proposed in (Chen et al. 1998) but replacing the later venous blood samples with the extracted local frame-wise maximal activity from the ICA identified blood vessel region over the first 30 minute interval (Su et al. 2005). Below, we refer to this ICA based frame-wise maximal time activity curve as Imax-ica and their approach as MAX-ICA. Continuing these ICA efforts initiated by Naganawa et al. (2005) and Su et al. (2005) for the generation of the input function for dynamic FDG-PET human brain studies, the current study has several aims. 1), we carefully examine the effects of various settings associated with the ICA procedure. These

3
settings have been routinely determined by visual and subjective inspection of the images; 2), we investigate the robustness of the estimated CMRgl values to these settings attempting to minimize the effects of the subjective choices for these various settings; 3), for the generation of the image-derived input function for dynamic FDG-PET studies, we introduce the use of a general-purpose ICA computer package, FMRLAB (Duann et al. 2002, McKeown et al. 1998), with our own adaptation and our voxel-by-voxel CMRgl quantification computer program, fully streamlined; 4), we revisit the feasibility of CMRgl quantification without any blood sampling. We argue respectfully that an absolute blood-sampling free procedure is yet to be realized. Among the arterial blood input function and the two ICA based image-derived input functions constructed either via MAX-ICA or via using few venous blood samples (referred to as VEN-ICA below), we examined the numerical compatibility of the CMRgl quantified with each of them. This numerical compatibility is in contrast to only examining the closeness of correlation between the CMRgl quantified via one input function and the CMRgl via another (Su et al. 2005). We argue that close correlation alone, as performed for FDG-PET data from six subjects (Su, et el. 2005), would not address the existence of potential bias and the variability of the bias across study subjects/groups.
Though with different views on some important issues such as the one that the ICA approach can completely eliminate the need for blood sampling, our current study provides additional and more solid supporting evidences for the use of the ICA to generate the image-derived input function in dynamic FDG-PET human brain studies, consistent with the main conclusions from previous studies (Naganawa et al. 2005, Su et al. 2005). In doing so, we also validated the ready-to-use package, FMRLAB (http://www.sccn.ucsd.edu/fmrlab/) together with some needed adaptations, the optimized settings of FMRLAB and settings in our adaptation. In addition, we used data from more research subjects who had arterial blood sampling to empirically validate the accuracy of our virtually streamlined method for the quantification of CMRgl and to demonstrate the general applicability of the ICA procedure.
2. Method Data: This study used the PET images and arterial blood data previously acquired for the study in which we introduced our non-invasive method for quantifying FDG PET images using manually defined carotid-artery ROI (Chen et al.1998). Dynamic FDG PET scan was performed in 22 healthy research subjects using the 951/31 ECAT scanner (Siemens, Knoxville, TN). Following the performance of a transmission scan and the subsequent intravenous administration of 10 mCi FDG (Chen, et al. 1998, and Reiman et al. 2001), each subject had a 60-min dynamic sequence of emission scans, resulting in 1 12-sec, 8 2-sec, 2 10 sec, 1 12-sec, 1 30-sec, 2 1.0-min, 2 1.5-min, 1 3.5-min, 2 5-min, 1 10.0 min and 1 30 min reconstructed frames. PET images were reconstructed using a filtered back-projection method with a Hanning filter of 0.4 cycles per pixel cutoff frequency, and measured correction for radiation attenuation and scatter. For use in our non-invasive quantitation method, the subjects also had five venous blood samples drawn at the mid-time points of the last 5 frames. For the purpose of validating our non-invasive method by comparing it to the input functions derived from arterial blood samples, sequential arterial blood samples were drawn every 5 seconds for the first minute, every 10 seconds for the second minute, every 30 seconds for the next 2 minutes, and then at 5, 6, 8, 10, 12, 15, 20, 25, 30, 40, 50 and 60 minutes, yielding a discrete representation of the blood sampled function. Note that the arterial blood samples are only used here for the purpose of validating VEN-ICA. Its routine use only requires a few venous samples acquired toward the end of the scanning session, and assumes the previously established compatibility between venous and arterial blood samples (Chen et al.1998). For CMRgl quantification, the blood glucose levels were needed and measured via blood sampling at the first and the last of the 5 blood samples. The setup for measuring the blood glucose level was then simply used for other venous blood samples. Thus, there is actually no added extra-burden on the PET acquisition procedure or on the patient. To our knowledge, the most practical and adequate procedure for measuring the blood glucose level is still via blood sampling. This fact articulated more in the Discussion and the observed variability of the CMRgl estimated bias via the use of Imax-ica (the MAX-ICA approach), as presented in the Results section,

4
are the primary reasons questioning the feasibility of the CMRgl quantification without any blood sampling.
ICA procedure: Denote the dynamic series of PET data as ( 1, 2,.... )iF i n= where n is the number of time frames. Each iF corresponds to three-dimensional PET data over the brain volume acquired at time ti and consistently rearranged as a row vector with length N (number of voxels). The
entire dynamic PET dataset X is given by
1
2
. . .
n
FF
X
F
⎛ ⎞⎜ ⎟⎜ ⎟=⎜ ⎟⎜ ⎟⎜ ⎟⎝ ⎠
Note that it is usually the case that
the N n>> , a main reason cited in favor of spatial ICA (Duann, et al. 2002;McKeown et al. 1998). The spatial ICA is to construct a set of J ( min( , )n N≤ ) independent spatial components from n frames, for
which the jth of these components is a linear combination of these n frames: 1
nj
j i ii
y w F=
=∑ (j=1, 2, …, J),
and iy and ( )ky i k≠ are statistically independent. Note that component yj is associated with a temporal
weight vector, 1 2 ... j j jnw w w (one weight per frame) and a spatial pattern 1 2 ... N
j j jy y y , the realization of
the random variable jy . It is also worth noting that principal component analysis has been routinely performed, and was the case in our use of FMRLA, prior to the ICA procedure for reducing the dataset dimension and for de-correlating the data.
The ICA optimization procedure adopted in FMRLAB is infomax, which is based on maximization of network entropy for the construction of the independent components. As previously suggested (Duann et al. 2002, McKeown et al. 1998) for fMRI, we believe also that infomax is appropriate for the determination of the vascular ROI in dynamic PET studies because the independent components for the blood vessel should have relatively small regions of non-negligible weight values. Moreover, the results of our current study provide strong empirical support for the use of the infomax algorithm (see Results section below).
Though the ICA core of the FMRLAB was un-touched, some code modifications were made for our study. These modifications made to FMRLAB include a) data file input/output to directly read in ECAT6 or ECAT7 formatted PET data as well as Analyze or NIFTI file; b) pre-assignment of various settings, originally provided by the user via graphic user interface at the run-time, so the program can be run in batch mode for testing purpose; c) extraction of dynamic PET counts over the carotid region and its surrounding tissue region; and d) reformatting of image displays at the raw image-thresholding stage so the thresholded early summed image (for carotid artery identification) can be superimposed on the top of the last frame (for the identification of brain volume).
ICA procedure for image-derived input function and related FMRLAB settings: In contrast
to the use of ICA in fMRI studies, neither spatial normalization nor smoothing was applied to the dynamic PET data prior to the ICA procedure. Similar to other ICA studies for the generation of the image derived input function, we first determined the spatial component whose spatial weight vector, denoted as yb, has non-negligible weight only over the blood vessel regions (carotid artery especially for this study). There were two different approaches to construct the input function once the corresponding component is determined. One was the use of the corresponding time series, wb, proposed in (Naganawa et al. 2005), as the representation of the input function for which the spillover from surrounding tissue regions was considered in the context of the unmixing matrix. Alternatively, a blood vessel region may be defined as a collection of voxels whose yb value is higher than a given threshold (Lee et al. 2001, Su et al. 2005). From this blood vessel ROI, the frame-by-frame PET data can then be extracted. In this current

5
study, we adopted this latter approach to extract the dynamic data, but with extensive test for the robustness of thresholds and the existence of optimal subject-independent threshold. The extracted data, however, still subjected to the subsequent and separate partial volume and/or spillover correction via either MAX-ICA or VEN-ICA. The extracted and corrected data set yields the image-derived input function. Procedures related to the use of ICA together with venous blood samples or Imax-ica are described below and depicted as flowchart in Figure 1.
1) Define the volume containing the carotid artery. This is an easy and quick data preparation step priori to the FMRLAB ICA procedure. A cubical volume containing the carotid artery is defined first (otherwise, the whole image can be used). To define this cubical volume, early frames from time 0 up to 48 seconds are summed. The range of the slices over which the carotid arteries are present is determined visually (3 to 5 slices in the lower portion of the brain). A rectangle is then manually-defined over the middle slice by two mouse-clicks, one at the upper-left corner and another at the lower-right corner of the rectangle. This rectangle is then copied to the selected slices, thus generating a cubical region in the 3D space that contains the carotid artery and neighboring brain tissue regions. See the 3 boxes on the top of the flowchart in Figure 1. The effects of the size and location of this cubical volume on the ICA-generated input function will be examined.
2) Exclude the non-brain region. The brain tissue region within this cubical volume is visible over the last PET frame and so is the carotid artery over the summed image of the early frames. Both structures are displayed, one on top of the other, and inspected. Voxels whose intensities over the last frame are lower than a visually determined threshold, Inb, indicating non-brain voxels without meaningful FDG uptakes, were excluded from the subsequent ICA procedure. This exclusion further reduces the size of the data set for ICA processing. More importantly, it allows adequate definition of brain tissue ROIs surrounding the carotid artery which are required for extracting the tissue tracer dynamics used in correcting tissue-to-blood spillover. This threshold guaranteed that the tissue ROI would contain no voxels outside the brain volume. See the single box on row 2 of the flowchart in Figure 1. Note that, in contrast to the two additional thresholds defined below, this threshold is for the raw PET image data. We will examine the robustness of the image-derived input function to the variation of the Inb values.
3) Determine the threshold for definition of the carotid artery. Next, the ICA is applied to the pre-processed dynamic data resulting from steps 1 and 2. Each independent component is first converted to a z-score (using voxel-wise mean and standard deviation) and visually examined by superimposing on top of the image summed over the first 48-second time interval. The spatial component overlap with the carotid artery (having non-negligible weights over the carotid artery ROI) was visually determined. The time activity curves (TAC) of the blood vessel are then generated by averaging data over voxels whose corresponding z-scores are greater than a threshold Zb. We will evaluate a range of z-score threshold values, Zb, of this blood vessel component in terms of the spatial extent of the map overlapping with the blood vessel, and in terms of the consistency between the recovered image-derived input function and the blood sampled input function. As in (Su et al. 2005), we extracted Imax-ica, the TAC of the maximum pixel value within the ICA identified carotid artery and re-evaluated its use to approximate the true input function for the first 30 min so as to correct for the partial volume effect together with the effects of tissue-to-blood spillover.
4) Establish the threshold for the definition of the surrounding tissue region. To correct for the potential spillover from the surrounding tissue to the carotid artery ROI, the tissue TAC over a tissue ROI adjacent to the carotid artery ROI is needed. We attempt to streamline this procedure by including voxels within the region delineated in steps 1 and 2 that have a z-score threshold, Zt, that is lower than the carotid threshold Zb. For both steps 3 and 4, see the three boxes on row 3 of the flowchart in Figure 1. We will need to demonstrate the robustness of the choice of Zt.
5) Correct partial volume and tissue-to-blood spillover and CMRgl parametric image generation. Effects of partial volume and tissue to blood spillover are corrected using our previously

6
described method (Chen et al. 1998). The two correction procedures, MAX-ICA and VEN-ICA, were both performed and compared against each other. The VEN-ICA is via venous blood samples. As mentioned earlier, venous blood samples are collected at time points as close as possible to the mid-time points of the last 5 frames. Though 3 venous blood samples are sufficient, the extra 2 blood samples ensure that at least 3 high quality blood samples are available for the simultaneous estimation of two parameters: the recovery coefficient (for correcting partial volume effect) and the tissue-to-blood spillover coefficient. The working equation for this estimation is ( ) ( ) ( )ICA
p p tb tc t rc c t m c t= × + × where ( )ICApc t is the extracted
dynamic PET series from the internal carotid artery region obtained by ICA at time t, rc is the recovery coefficient, cp(t) is the venous blood sample interpolated to the mid-time point t of the closest frame, mtb is the tissue-to-blood spillover coefficient, and ct(t) is the tissue TAC from the surrounding tissue ROI. The method of non-negative linear least squares is employed to estimate rc and mtb. The second approach, MAX-ICA, is same as VEN-ICA but with the cp(t) replaced with Imax-ica over the first 30 min. The implementation of this correction procedure is for our re-evaluation of the proposed method in (Su et al. 2005). Finally, the CMRgl parametric images were generated using graphical Patlak approach, as in (Chen et al. 1998), and the input function (image derived or arterial blood sample based). See the two boxes in row 4 of the flowchart in Figure 1.
Figure 1. Flowchart of the ICA procedure for the generation of the image-derived input function and the generation of the CMRgl parametric images. See steps 1-5 detailed in the text.
Settings discussed above are specific to our use of ICA for image-derived input function generation of dynamic PET studies and some of them are additional to those associated with FMRLAB package (the

7
number of PCA components set to 5). Other FMRLAB settings are set at their default values, including the number of iterations. Validation Schemes: The sizes and locations of the cubical volumes containing the carotid artery were varied from the whole image-size to a one that contained only the carotid artery and its immediate non-vessel regions. Based on an initial testing using data from two subjects and to examine the effects of various thresholds, we varied Inb in the range of 5% to 50% of the maximum voxel intensity value (increment of 5%), Zb from 1.4 to 3.0 (increment of 0.2) and Zt from 1.0 to 2.0 (increment of 0.1), the latter two as z-scores. For each of all possible combinations of these threshold settings, FMRLAB was run (in batch mode) using the criteria discussed below to find the optimal setting combination over all subjects. With the effects of the cubical volume’s size, location and the robustness of the CMRgl to various threshold settings investigated and determined, the VEN-ICA procedure were re-run by two independent operators for all subjects to examine inter-rater variability. One of the two operators ran the procedure twice for 10 of the 22 subjects to examine the intra-rater variability. Validation Criteria: Several criteria were used to identify the optimal, subject-independent threshold combination to evaluate the robustness of the ICA for extracting the input function with respect to the thresholds and to examine the difference between VEN-ICA and MAX-ICA. First, we compared the image-derived input function generated using VEN-ICA or MAX-ICA to the arterial blood samples, from the same subjects in terms of the shape and magnitude of the resulting time-activity curves. Second, we separately compared, via voxel-by-voxel regression, the CMRgl parametric image estimated using the Patlak graphical method and one of the two image-derived input functions (via VEN-ICA or MAX-ICA) to the CMRgl parametric image estimated using Patlak graphical method and the arterial blood sample input function. The numerical compatibility of the CMRgl values by the ICA based image-derived input function to the CMRgl values by the blood-sampled input function was evaluated by the closeness of the regression slope to one (1.0), intercept to zero (0.0) and the highest possible squared correlation coefficients (closeness to 1.0). Below, we will simply refer the regression slope, regression intercept and squared correlation coefficient as C-slope, C-intercept, and C-R2 (C for Compatibility). 3. Results
Determination of subject-independent threshold: The ability to streamline the generation of the image-derived input function depends on the existence of subject-independent thresholds (which, however, may be scanner and/or acquisition protocol dependent). Our extensive examination of various setting combinations revealed very stable and satisfactorily accurate estimate of CMRgl via VEN-ICA over a relatively wide range of the thresholds.
As illustrated in the left panel in Figure 2, the C-slope varied little as the Inb values changed from 0.05 to 0.3. We discarded testing results for Inb values higher ≥45% as these high Inb values aborted the tissue-to-blood spillover and partial volume correction or generated erroneous estimation for three subjects. For these subjects, the corresponding brain tissue region defined with the cut-off threshold, when visually inspected, can be easily concluded. Thus, the common optimal setting search region for Inb is limited the range of 0.05 to 0.3. In addition C-slope results as shown in Figure 2, the C-intercept is in the neighborhood of zero (mean=0.015 and std=0.0026 over all threshold combinations), and C-correlation is very close to one (mean=0.9996 and std=0.00013 over all threshold combinations).
In addition to the C-slope robustness to a large range of Inb values depicted on the left panel of Figure 2, the right panel of Figure 2 shows that the C-slope numerical value changed only narrowly, from 1.018 to 1.023, for the tested ranges of Zb and Zt. The result displayed is for Inb=0.10. Similar results are observed for other Inb values. Note that, from the right panel of Figure 2, C-slope has value closest to 1 in the neighborhood of Zb=2 and Zt=1.5. In addition the C-intercept has mean of 0.0143 with std=0.0029, and C-correlation mean of 0.9995 with std= 0.000092.

8
Figure 2. Robustness of the C-slope to the variation of Inb (left panel) and the variation of Zt and Zb (right panel).
Examining the threshold testing results, robustness to a wide range of Inb, Zb and Zt, we
determined that Zb=2, Zt=1.5 and Inb=0.075×Mx (where Mx is the maximal voxel intensity values of the summed image) were appropriate for all subjects. In fact and as described above, the variation of the Inb values had in-significant impacts on the image-derived input function curves and the CMRgl parametric images. Thus, the only required manual involvement is the simple and straightforward definition of the cubical ROI, the variability of which has almost no effect on the quantification results, as seen below.
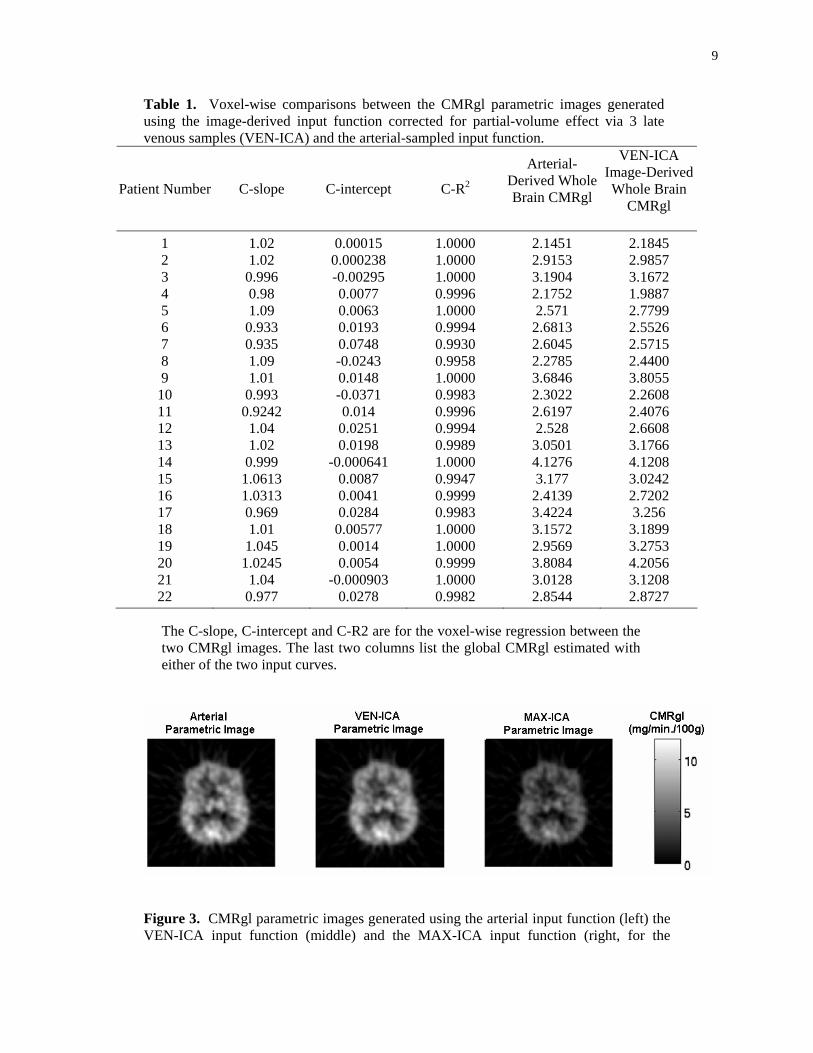
Quantitative CMRgl comparison under the common threshold settings with the use of VEN-ICA: As shown in the left and middle panels of figure 3 using one subject data as an example, the two CMRgl parametric images generated separately with the use of arterial blood samples (left panel) or the image-derived input functions corrected via VEN-ICA (middle panel) are visually indistinguishable. Moreover, as shown in the left panel of Figure 4, voxel-by-voxel comparison of this parametric image pair, via linear regression resulted in the C-slope=1.02, C-intercept=0.0002, and squared correlation coefficient C-R2=0.999993. This highly consistent pattern was observed in all 22 subjects comparing VEN-ICA to arterial input function (see table 1). We also compared the whole brain CMRgl obtained with the two different input functions, the arterial and VEN-ICA. For our method validation purpose, the whole brain CMRgl, a single measure for each subject and for each of the three input functions, was calculated using spm_global.m sub-routine in SPM package (http://www.fil.ion.ucl.ac.uk/spm/) from the CMRgl parametric images. This sub-routine computes the whole brain CMRgl as the mean over all voxels whose CMRgl values are greater than one-eighth of the image-wise mean. Linear regression of the whole brain CMRgl via the arterial input against the one via VEN-ICA among all 22 subjects was performed. The regression slope estimate was 1.040, intercept -0.0640 with R2 =0.918 (see the last two columns of table 1).
9
Table 1. Voxel-wise comparisons between the CMRgl parametric images generated using the image-derived input function corrected for partial-volume effect via 3 late venous samples (VEN-ICA) and the arterial-sampled input function.
Patient Number C-slope C-intercept C-R2
Arterial-Derived Whole Brain CMRgl
VEN-ICA Image-DerivedWhole Brain
CMRgl
1 1.02 0.00015 1.0000 2.1451 2.1845 2 1.02 0.000238 1.0000 2.9153 2.9857 3 0.996 -0.00295 1.0000 3.1904 3.1672 4 0.98 0.0077 0.9996 2.1752 1.9887 5 1.09 0.0063 1.0000 2.571 2.7799 6 0.933 0.0193 0.9994 2.6813 2.5526 7 0.935 0.0748 0.9930 2.6045 2.5715 8 1.09 -0.0243 0.9958 2.2785 2.4400 9 1.01 0.0148 1.0000 3.6846 3.8055
10 0.993 -0.0371 0.9983 2.3022 2.2608 11 0.9242 0.014 0.9996 2.6197 2.4076 12 1.04 0.0251 0.9994 2.528 2.6608 13 1.02 0.0198 0.9989 3.0501 3.1766 14 0.999 -0.000641 1.0000 4.1276 4.1208 15 1.0613 0.0087 0.9947 3.177 3.0242 16 1.0313 0.0041 0.9999 2.4139 2.7202 17 0.969 0.0284 0.9983 3.4224 3.256 18 1.01 0.00577 1.0000 3.1572 3.1899 19 1.045 0.0014 1.0000 2.9569 3.2753 20 1.0245 0.0054 0.9999 3.8084 4.2056 21 1.04 -0.000903 1.0000 3.0128 3.1208 22 0.977 0.0278 0.9982 2.8544 2.8727
The C-slope, C-intercept and C-R2 are for the voxel-wise regression between the two CMRgl images. The last two columns list the global CMRgl estimated with either of the two input curves.
Figure 3. CMRgl parametric images generated using the arterial input function (left) the VEN-ICA input function (middle) and the MAX-ICA input function (right, for the

10
discussion on MAX-ICA, see below the subsection ‘The feasibility of using of Imax-ica for the generation of the image-derived input function’). The images displayed are horizontal in the mid-level of the brain (slice 16).
Figure 4. Voxel-by-voxel Comparison with the CMRgl estimated via arterial input function. Left panel: the VEN-ICA CMRgl which is numerically compatible (C-slope=1.02, C-intercept=0.0002, C-R2=0.999993). Right panel: MAX-ICA CMRgl which is not (C-slope=0.63, C-intercept=0.0021, R2=0.9837). For more discussion on MAX-ICA, see below the subsection ‘The feasibility of using of Imax-ica for the generation of the image-derived input function’.
Comparison of the image-derived input function via VEN-ICA to the arterial blood
samples: Visual inspection of the image derived input function via VEN-ICA confirms its compatibility with the blood sample generated input function, as exemplified for a single patient in figure 5. The green curve is the VEN-ICA generated image-derived input function. The blue curve is the blood sample input function and agrees well over the time period starting at about 9 minutes post injection. The plot on the right displays the two curves with respect to a logarithmic time scale, illustrating that input initiation and peak times are different. These characteristics are consistently observed for all subjects. Note here that the three venous blood samples collected over the latter time period were used together with surrounding tissue TAC for the correction of partial volume and tissue-to-blood spillover effects and were not used to substitute the extracted image data from the carotid artery for the later portion of the image-derived input curve. Whereas discrepancies between the peak heights of the two curves can be observed for some subjects, the widths of the bell shaped portion of the input curve match well for all subjects. This is consistent with earlier observations, (Chen et al. 1998), and, as discussed there and as also shown again in Table 1, has little impact on the estimated CMRgl.

11
Figure 5. Close correspondence between the image-derived input function via VEN-ICA (green) and the arterial blood sample-derived input function in a typical subject. Accuracy of ICA-derived carotid-artery ROI: As illustrated in figure 6, in which the ICA-
derived carotid artery ROI is superimposed on the early summed FDG PET images (two adjacent horizontal sections corresponding to inferior brain regions in which the carotid artery can be observed), the carotid artery was accurately identified in all of the subjects.
Figure 6. The ICA-defined carotid artery ROI (in hot colors) is superimposed on the summed FDG-PET image acquired during the early 48 second time period. The gray scaled summed FDG-PET image is with unit of normalized ECAT counts per minute and ranged from 0.00002 to 0.06. The color gradation represents different values of z-score (see step 3 under ICA procedure for image-derived input function and related FMRLAB settings). The z-score is unitless and ranged from 2.0 to 5.3 for this subject.

12
Impact of the size and location of the manually defined cubical volume containing the carotid artery and inter-/intra-rater variability: There is a dramatic gain in computational efficiency/speed when running ICA over only a small cubical region containing the carotid artery. For example, in one case the time to run the FMRLAB ICA program dropped from about 3 minutes (when the whole brain volume is used) to less than 8 seconds for the cubical region (Figure 7) manually defined with only additional 10-15 seconds. Moreover, when using only the cubical region the carotid artery component identified by the FMRLAB package is always the first significant component (that with non-zero weight), which is not consistently the case when using the entire image volume for ICA. It thus remains to be verified that the subjective identification of the cubical volume, a cubical shaped sub-region containing the carotid artery and its immediate surrounding tissue region and defined in step 1 of the proposed procedure, has no significant impact on the generation of the input function and on the accuracy of the subsequent CMRgl quantification. The ICA and subsequent CMRgl quantification was repeated 20 times for one randomly chosen subject for which variously positioned and sized cubical regions were identified but all other settings were identical. For example, the left panel of Figure 7 shows a rectangle with a typical size but a location not carefully centered. This was over the mid-slice of several containing the carotid artery. Although the summed PET image over the early time period exhibits a rather poor signal to noise ratio, the brain boundary could be easily identified, when displayed on a computer screen, by an operator trained with just 1-2 cases. For only anatomical cross-reference purpose, the corresponding slice of the MRI coregistered to the PET image is displayed together with the detected carotid artery region superimposed (right panel of Figure 7). Note that the subject’s MRI was not used in our ICA procedure. In this testing, the x-directional length of the cubical ROI ranged from 26 pixels to 111 pixels, the y-direction length from 22 to 116 pixels, and in the z-direction the number of slices ranged from 3 to 6. The size 111 by 116 is essentially the whole image, while all others are in the neighborhood of the rectangle shown in Figure 7. The resulting 20 input curves are very similar and, more significantly, the 20 CMRgl parametric images via VEN-ICA or MAX-ICA are visually indistinguishable. One of these images was randomly chosen and compared to each of the remaining 19 parametric images using linear regression. The regression slope ranged from 0.977 to 1.003 with mean of 0.995, the intercept ranged from -0.0210 to 0.0058, with mean=-0.0068 and R2 ranged from 0.9994 to 0.9999.
Figure 7. Manually defined 2D rectangular region containing the carotid artery (left panel). This manual procedure requires the user to select the upper left and lower right corner points. The cubical 3D volume was then created by automatically copying the rectangular region to the neighboring slices. For anatomical cross-reference purpose, the corresponding slice of the MRI coregistered to the PET image is displayed together with the detected carotid artery region superimposed (right panel). Note that the subject’s MRI was not used in our ICA procedure.

13
To examine the inter-/intra-rater variability for VEN-ICA, we define the relative difference of global CMRgl estimated by the two operators separately as (CMRgl1-CMRgl2)/CMRgl1, where CMRgli is the one obtained by operator i (i=1,2). We found that the maximal relative difference is only 4.6%. In addition, the intraclass correlation coefficient is as high as 0.983. Moreover, when the regression between the CMRgl by the two operators was performed, the regression slope and the intercept were not significantly different from 1.0 and 0.0 (F-test p=0.3989). Similarly, we found that the maximal relative for the intra-rater test was less than 3.0%, the intraclass correlation coefficient as high as 0.99. For the same regression analysis, the slope and the intercept were not significantly different from 1.0 and 0.0 (F-test p=0.5075)
Setting individualization (its feasibility and impact on quantification): The results reported so
far are based on threshold settings that are common for all subjects. It thus remains to be determined whether improved quantification is possible if the settings are manually determined in each case, whether this is feasible and how robust the resultant CMRgl is. Visual adjustment of both Inb and Zb introduces an additional manual step taking from extra 20 seconds to a minute. The adjustment is solely based on the brain shape and the overlap of the ICA component with the carotid artery visible on the summed image but is absolutely blind to both the closeness of the ICA generated input curve to the blood samples, and to the resulting parametric images. As mentioned earlier, we found that the image-derived input curve (via VEN-ICA) and the CMRgl parametric images are very robust to a wide range of the Inb values corresponding to the visually determined brain tissue regions that are acceptable. This robustness of Inb actually is consistent with the in-significant impact of the sizes/locations of the manually defined cubical regions. Thus, the manual manipulations are primarily for Zb and Zt and improve the results only marginally. For example, using subject 5, up to 4% regression slope improvement (closer to one) can be achieved.
The feasibility of using of Imax-ica for the generation of the image-derived input function: We
first note that, just like the venous blood samples, Imax-ica did not change over different threshold settings examined. Underestimation of the tissue-to-blood spillover via the use of Imax-ica was observed for all subjects primarily due to the low tracer uptake by brain tissue and the high noise levels at the early part of the dynamic acquisition. Consequently, compared to the input function generated via VEN-ICA or the arterial blood curve, the later part of the MAX-ICA input curve is higher (elevated). On the other hand, reflective to the fact that the early part of Imax-ica is not free of partial volume effect, the input curve corrected by Imax-ica is with reduced peak height in the early part of the data acquisition period. Figure 8 showed such a typical but relatively mild case observed among all the subjects examined in this study. Primarily due to the elevated later portion of the input curve, the estimated CMRgl were underestimated with the use of input function via MAX-ICA for most, but not all, subjects. As shown in the right panel of Figure 3 for such a subject, the CMRgl parametric image generated with the use of the image-derived input functions corrected via MAX-ICA is visually darker. In fact, it is about 37% lower than the one generated using the arterial blood sample as the C-slope is 0.63 when voxel-by-voxel regressing the CMRgl using arterial sample against the one via MAX-ICA (right panel on Figure 4). In general, however, the C-slopes varied greatly and were not always less than 1 among all subjects. In fact, we found significant (20 to 50%) underestimates of CMRgl by MAX-ICA for 18 of the total 22 subjects (C-slopes were less than 1.0 and between 0.5 to 0.8), significant (20 to 70%) overestimates for 3 subjects (C-slopes were greater than 1.0 and between 1.2 to 1.7), and compatible estimate only for one subject (C-slope=0.98, in the neighborhood of 1.0). It is this unpredictable over- or under-estimation and the great variability of the C-slopes that make the bias correction in-practical for CMRgl estimated via MAX-ICA.

14
Figure 8. A typical but relative mild case of the input functions with elevated later portion and the reduced height for the early peak when the Imax-ica is used (blue curve) in comparison to the arterial blood curve (red) and the image-derived input function via VEN-ICA (black). Note the tails of the latter two coincide well.
We also compared the global numerical values of CMRgl estimated separately using VEN-ICA
and MAX-ICA. We found that, on average, CMRgl via MAX-ICA is 30% underestimated compared to the one by VEN-ICA (mean CMRgl is 2.20 by MAX-ICA and 3.14 by VEN-ICA) and statistically significantly different (p<0.00011, paired t-test). We also noticed that this average 30% underestimation is with great variation from subject to subject thus making subject-independent bias correction impossible For example, for one subject the MAX-ICA CMRgl=0.78 while the VEN-ICA CMRgl=2.66 (70% underestimation). For another subject, MAX-ICA CMRgl= 5.18 while the VEN-ICA CMRgl=3.17 (63% overestimation). 4. Discussion
In this study, we introduce the use of the VEN-ICA to identify carotid-artery and surrounding tissue ROIs, reducing the potential variability of the image-derived input function that is associated with subjective definition of carotid-artery region and surrounding brain tissue ROIs. We believe that the VEN-ICA based image-derived input function makes it possible to quantify CMRgl estimates routinely and objectively with subject-independent common thresholds, existence of which might be due to the temporal TAC signal difference between the carotid artery region and its surrounding tissue, relative stable cross multi-subjects as determined by the ICA procedure. We suggest that this technique may be especially relevant in research and clinical studies in which there are alterations in whole brain CMRgl,

15
potentially confounding non-quantitative FDG PET studies which typically normalize regional data for the variation in whole brain measurements. For instance, we have shown the FDG PET has greater power to track the brain changes associated with the course of Alzheimer’s dementia using absolute quantitative measurements of CMRgl than using non-quantitative FDG PET images which are normalized for the variation in whole brain measurements, since there are time-dependent reductions in whole brain CMRgl itself. Thus, quantitative FDG PET measurements may offer significantly greater power than non-quantitative FDG PET measurements in clinical trials which evaluate the efficacy of putative disease-slowing treatments to attenuate these declines (Alexander et al. 2002). In addition to the parameter CMRgl, the individual rate constants (K1, k2 and k3) in the FDG compartmental modeling are potentially more sensitive indices for tracking the disease progression and/or treatment effects. Additional studies are underway for evaluating the use of the image-derived input function for the estimation of these rate constants and will be reported separately.
Blood samples, especially arterial blood samples, have been considered the gold standard for measuring the input function in dynamic FDG-PET studies. In addition to the invasive nature of this procedure, blood sampling has several other potential disadvantages. The blood samples are characterized by a time-lag between radiotracer delivery to the brain and that to radial artery blood samples (see (Guo et al. 2007), however, for its insignificant effect), dispersion and non-avoidable measurement noise. Although an image-derived input may be contaminated by its own sources of error, such as the tissue-to-blood spillover and effects of partial volume, it is free of delay and dispersion artifacts, and presents a signal-to-noise ratio which is more comparable to that contaminating the tissue time activity curves. Because of the different sources of error in the blood samples and image derived input curves; it is unrealistic to judge the quantification for 100% consistency. While arterial blood sampling was used as the “gold standard” by which to evaluate our image-derived input function, it is possible that our non-invasive measurement provides a more accurate measurement.
Different from MAX-ICA (Su et al. 2005) in which Imax-ica was treated as the unobserved true input function for the correction of the partial volume and the tissue-to-blood spillover effects, VEN-ICA required the availability of the later three venous blood samples, making it is impossible to estimate CMRgl for retrospective PET studies which did not have the limited venous blood data. Our results obtained with the use of Imax-ica for our images reconstructed via filtered back projection reflected the need for further investigations for its representation of the true and un-observed input function in terms of its magnitude (free of partial volume effects) and its relative lower signal to noise ratio for early short frames. Among various possible causes, we believe the relatively low image resolution of our data prevented us from using this local maxima series in place of the few blood samples. It also reflected the need to systematically examine the use of the local maxima time series for images reconstructed by iterative algorithms. In addition, we noted and illustrated that the use of only the correlation coefficient without considering especially the variation of the regression slope from subject to subject, indication of the CMRgl bias variability over subjects, may be inconclusive in terms of the adequacy of ICA for the generation of the image-derived input function for CMRgl quantification.
In line with our suggested use of a few venous blood samples for the correction of the partial volume effect in generating the image-derived input function via ICA (VEN-ICA), we also noted that the CMRgl quantification actually requires the measurement of blood glucose levels which is currently best obtained via blood sampling. The procedure and equipment setup for the blood glucose sampling can be easily used for the additional few venous blood sampling required by this approach without added pain/discomfort to the patients. This line of thinking together with the results of our current study, the unpredictable CMRgl bias with the use of Imax-ica, speaks in favor of the practice of generation of the image-derived input function via VEN-ICA. However, the potential use of Imax-ica for data reconstructed by other algorithms, acquired from scanners with higher resolution, and with alternative settings is yet to be addressed with additional studies.
Although the use of ICA approach for the generation of the input function in dynamic PET studies was previously suggested for other applications, the current study demonstrates the feasibility of using the commonly available ICA computer package FMRLAB for the quantification of FDG PET

16
images (the version of FMRLAB package slightly revised by us is available upon request). We also believe a separate spillover and partial volume correction step is necessary for accurate and reliable construction of the input function using ICA. With such a need in mind, we have emphasized the role that the ICA can play in objective and relative straightforward identification of cerebrovascular and neighboring brain tissue ROI, making it possible to quantify FDG PET images in an objective and efficient way.
As numerical procedures, we noted that both MAX-ICA and VEN-ICA are potentially capable of identifying other blood vessels and constructing image-derived input function subsequently, which need some additional but relative straightforward validations. Our interest on the (carotid) arteries is primarily to contrast our current more objective approach, validated directly with the arterial sampled input function, to our previously proposed subjective carotid artery definition. The identification of only carotid-artery was the primary reason for the additional manually defined cubical ROI.
In summary, the ICA procedure in the widely available computer package FMRLAB can be used to accurately identify carotid-artery and neighboring brain-tissue ROIs, making it possible to quantify dynamically FDG PET images in a reliable way. Its applications to other PET radiotracer (together with a practical way to correct for the blood metabolite when needed, e.g. (Lopresti et al. 2005)), for the quantification of PET measurements in other human organs, and in small animal PET studies (with least possible blood samples) remain to be determined.
5. Acknowledgments
This study is supported by NIH grants AG024904, AG19610, MH157899, EB 2553301 and the State of Arizona. Mr. X Chen is currently at Parametric Technology Cooperation, Arden Hills, MN, USA. The authors wish to thank Mihai Vintilescu, Wendy Lee, Alisa Domb, Oded Smilovici, Cole Reschke, Debbie Intorcia, Sandy Goodwin, Les Mullen, Pat Aguilar, Vickie Lawrence, Hoai-Huong Tran, and Barbara Knight for their support and assistance, and Dr. Guoliang Zeng for his encouragement.

17
6. References
Alexander G E, Chen K, Pietrini P, Rapoport S I, and Reiman E M 2002 Longitudinal PET Evaluation of Cerebral Metabolic Decline in Dementia: A Potential Outcome Measure in Alzheimer's Disease Treatment Studies American Journal of Psychiatry 159 738-45
Asselin M C, Cunningham V J, Amano S, Gunn R N, and Nahmias C 2004 Parametrically defined cerebral blood vessels as non-invasive blood input functions for brain PET studies Phys. Med. Biol. 49 1033-54
Chen K, Bandy D, Reiman E, Huang S C, Lawson M, Feng D, Yun L, and Palant 1998 Non-invasive quantification of the cerebral metabolic rate for glucose using positron emission tomography, 18F-fluorodexyglucose, the Patlak method, and an image-derived input function J Cereb. Blood Flow Metab. 238 716-23
Duann J R, Jung T P, Kuo W J, Yeh T C, Makeig S, Hsieh J C, and Sejnowski T J 2002 Single-trial variability in event-related BOLD signals Neuroimage 15 823-35
Guo H, Renaut R, and Chen K 2007 An input function estimation method for FDG-PET human brain studies Nuclear Medicine and Biology 34 483–492
Huang S C, Wu H M, Shoghi-Jadid K, Stout D B, Chatziioannou A, Schelbert H R, and Barrio J R 2004 Investigation of a new input function validation approach for dynamic mouse microPET studies Mol. Imaging Biol. 6 34-46
Lee J S, Lee D S, Ahn J Y, Cheon G J, Kim S K, Yeo J S, Seo K, Park K S, Chung J K, and Lee M C 2001 Blind separation of cardiac components and extraction of input function from H(2)(15) O dynamic myocardial PET using independent component analysis J. Nucl. Med. 42 938-43
Liptrot M, Adams K H, Martiny L, Pinborg L H, Lonsdale M N, Olsen N V, Holm S, Svarer C, and Knudsen G M 2004 Cluster analysis in kinetic modeling of the brain: a noninvasive alternative to arterial sampling Neuroimage 21 483-93
Litton J E 1997 Input function in PET brain studies using MR-defined arteries J. Comput. Assist. Tomogr. 21 907-9
Lopresti B, Klunk WE, Mathis CA, Hoge JA, Ziolko SK, Lu X, Meltzer CC, Schimmel K, Tsopelas ND, DeKosky ST, and Price JC 2005 Simplified Quantification of Pittsburgh Compound B Amyloid Imaging PET Studies: A Comparative Analysis J Nucl Med 46 1959–1972
McKeown M J, Makeig S, Brown G G, Jung T P, Kindermann S S, Bell A J, and Sejnowski T J 1998 Analysis of fMRI data by blind separation into independent spatial components Hum. Brain Mapp. 6 160-88
McKeown M J and Sejnowski T J 1998 Independent component analysis of fMRI data: examining the assumptions Hum. Brain Mapp. 6 368-72
Naganawa M, Kimura Y, Ishii K, Oda K, Ishiwata K, and Matani A 2005 Extraction of a plasma time-activity curve from dynamic brain PET images based on independent component analysis IEEE Trans. Biomed. Eng. 52 201-10

18
Reiman E M, Caselli R J, Chen K, Alexander G E, Bandy D, and Frost J 2001 Declining brain activity in cognitively normal apolipoprotein E epsilon 4 heterozygotes: A foundation for using positron emission tomography to efficiently test treatments to prevent Alzheimer's disease Proc. Natl. Acad. Sci. U.S.A 98 3334-9
Su K H, Wu L C, Liu R S, Wang S J, and Chen J C 2005 Quantification method in [18F] fluorodeoxyglucose brain positron emission tomography using independent component analysis Nucl. Med. Commun. 26 995-1004
Wahl L M, Asselin M C, and Nahmias C 1999 Regions of interest in the venous sinuses as input functions for quantitative PET J. Nucl. Med. 40 1666-75
Wu H M, Hoh C K, Choi Y, Schelbert H R, Hawkins R A, Phelps M E, and Huang S C 1995 Factor analysis for extraction of blood time-activity curves in dynamic FDG-PET studies J. Nucl. Med. 36 1714-22
Wu H M, Huang S C, Allada V, Wolfenden P J, Schelbert H R, Phelps M E, and Hoh C K 1996 Derivation of input function from FDG-PET studies in small hearts J. Nucl. Med. 37 1717-22