Embed Size (px)
Citation preview
i
A Dissertation Submitted to the University of Fukui for the Degree of
Doctor of Engineering
(Graduate school of Engineering, Department of Applied Chemistry & Biotechnology)
福井大学審査 学位論文 [博士(工学]
2013, September
Gayatri Goswami
Characterization of the Histone Modification Protein Component,
Sgf73 for Boundary Formation and Analysis of High Erucic acid
Transgene in Double Haploid Rapeseed Population (サイレンシング領域境界形成に関与するヒストン修飾酵素複合体因子の Sgf73 の解
析、倍加半数体菜種集団における高エルガ酸産生遺伝子の解析)

ii
Acknowledgement
In my thesis, I have done research work related to eukaryotic gene regulation mechanism and
this was quite impossible without the kind assistance of some people to whom I would like to
express my gratitude. First and foremost, I thank the almighty for giving me the strength and
ability to complete this study.
I would like to express my sincere thanks to Professor Hiroyuki Uchida and Professor
Masaya Oki for accepting me as a Ph.D. student and give me opportunity to do my research in
the department of Applied Chemistry and Biotechnology. I owe to Professor Oki for his kind
help to run the experiment. It is difficult to overstate my gratitude to Professor Oki for
providing time during manuscript preparation and thesis writing with his patience and
knowledge.
My special thanks to all the members of my laboratory for their cordial cooperation. I wish
to say my warmest thanks especially Dr. Hatanaka and Kazuma Kamata who helped me to
overcome language barrier in our laboratory during conducting experiment with their helpful
suggestions and comments. I would like to say endless thanks my parents for providing
support and the occasional welcome distraction while I worked on this thesis. I am greatly
indebted to my husband Dr. Ujjal Kumar Nath and my son Arita Nath for their encouragement,
supports and sacrifices throughout my life.
I am grateful to the Japanese Government for the financial support. I received grant from
the Ministry of Education, Culture, Sports, Science and Technology (MEXT). I would like to
give thanks all of researcher in my field whose research and journal papers help me to
complete my research work. Thanks to all very much.
iii
TABLE OF CONTENT
Content Pages
Chapter 1 Introduction
1.1 Background and objectives of barrier functional protein analysis in yeast 1-5
1.2 Background and prospects of erucic acid content in rape seed 6-7
Reference 8-13
Chapter 2 Characterization of Sgf73 for heterochromatin boundary formation
2.1 Introduction 14-15
2.2 Materials and methods 15
2.2.1 Materials
Yeast Strains list 16-17
Plasmid list 18
Primer lists 19
2.2.2 Methods
2.2.2.1 Construction of Saccharomyces cerevisiae strains 20-21
2.2.2.2 Plasmids construction 21
2.2.2.3 Mating assays 21-22
2.2.2.4 a1 expression gene analysis 22
2.2.2.5 Affinity purification of protein complexes 23-24
2.2.2.6 Mass spectrometry 24
2.2.2.7 Western Blotting analysis and Immunoprecipitations 24
2.3 Results 24
2.3.1 Domain analysis of the boundary function of Sgf73 24-28
2.3.2 The minimum region of Sgf73 binds SAGA complex components 28-32
2.3.3 The HAT module facilitates the boundary function of Sgf73 32-33
2.3.4 The boundary function of Sgf73 is influenced by the HAT activity of Gcn5 34-35
2.3.5 SAGA and SLIK are both important 35-38
2.4 Discussion 38-40
References 41-43
Chapter 3 Phenotypic effect and regulation of high erucic acid transgene in DH
rape seed (Brassica napus) population
3.1 Introduction 44-45
3.2 Materials and methods 45
3.2.1 Plant materials 45
3.2.2 Tnkat 46
3.2.3 6575-1HELP (High Erucic and Low Polyunsaturated fatty acid 46
3.2.4 Methodology 46-47
3.2.5 Data collection 47-49
3.2.6 Statistical analysis 49
3.3 Result and discussion 49
3.3.1 Phenotypic variation among DH lines 49-52
3.3.2 Effect of Ld-LPAAT gene on erucic acid content 52-55
3.3.3 Effect of PUFA content on erucic acid content and other traits 56-58
3.3.4 Comparison of mean among parents and selected best DH lines 59-60
References 61-62
Chapter 4 Conclusion 63-66
iv
Appendices (protocol)
Purification of PCR product for ligation 67
Purification of DNA from gel for ligation 67-68
Ligation and E. coli transformation 68
Plasmid extraction (Alkaline method) 69-70
Restriction enzyme treatment 70
DNA sequencing 71
Genomic DNA extraction 72
Budding yeast transformation 73
RNA extraction from S. cerevisiae (Hot phenol) 74-76
ChIP assay for yeast cells 77-81
Immunoprecipitation assay 82
Silver staining 82-83
Immunobloting assay 83-86
1
Chapter 1
Introduction
1.1 Background and objectives of barrier functional protein analysis in yeast
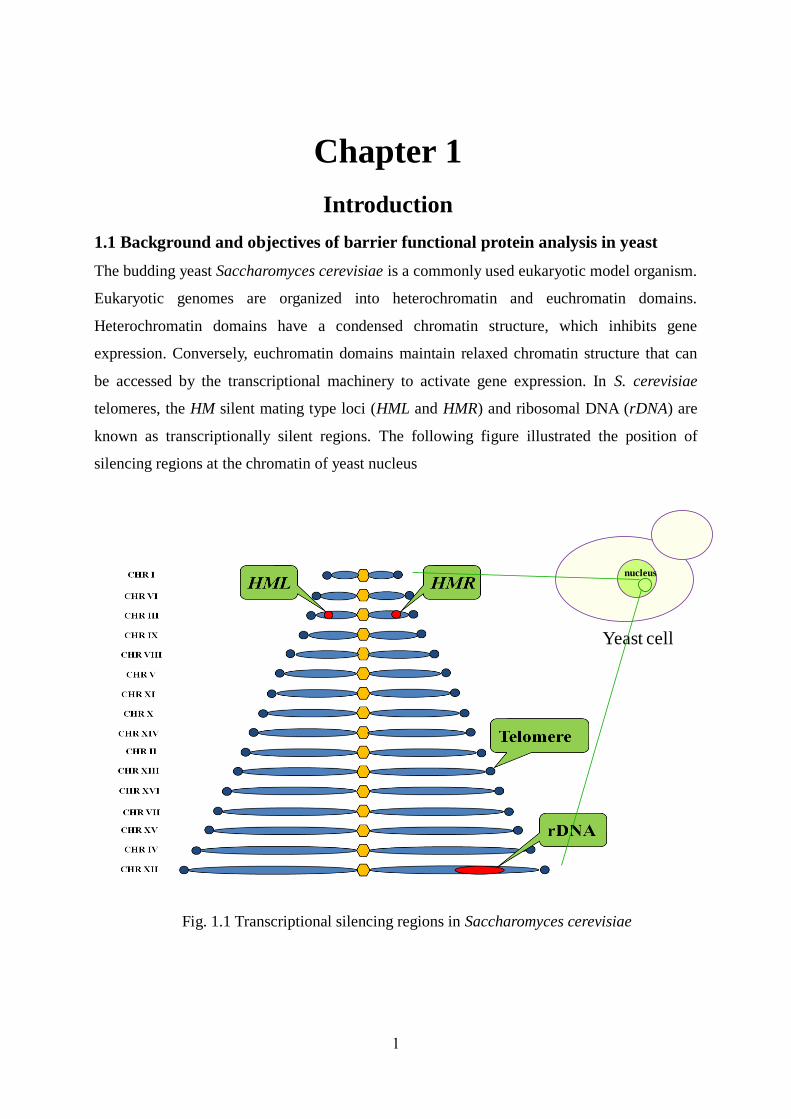
The budding yeast Saccharomyces cerevisiae is a commonly used eukaryotic model organism.
Eukaryotic genomes are organized into heterochromatin and euchromatin domains.
Heterochromatin domains have a condensed chromatin structure, which inhibits gene
expression. Conversely, euchromatin domains maintain relaxed chromatin structure that can
be accessed by the transcriptional machinery to activate gene expression. In S. cerevisiae
telomeres, the HM silent mating type loci (HML and HMR) and ribosomal DNA (rDNA) are
known as transcriptionally silent regions. The following figure illustrated the position of
silencing regions at the chromatin of yeast nucleus
Fig. 1.1 Transcriptional silencing regions in Saccharomyces cerevisiae
nucleus
Yeast cell
2
The Sir (Silent Information Regulator) protein complex, consisting of Sir2, Sir3 and Sir4,
plays a key role in transcriptional repression. The NAD+-dependent histone deacetylase Sir2
modifies the tails of histones H3 and H4 and creates binding sites for Sir3 and Sir4 (Rusche et
al. 2003). Gene silencing in the rDNA region requires only Sir2, but Sir2, Sir3 and Sir4 are all
required for silencing of the HMR region, the HML region and the telomeres (Rusche et al.
2003).
Boundary elements separate heterochromatin and euchromatin domains. Until recently, two
distinct models were proposed to explain the mechanism of boundary formation (Sun et al.
2011). According to the DNA sequence-dependent model, tDNA sequences at the right side of
the HMR domain (Donze et al. 1999; Donze & Kamakaka 2001, 2002; Oki & Kamakaka
2005; Dhillon et al. 2009) and STAR (Sub-Telomeric Anti-silencing Regions) sequences near
the telomeres (Fourel et al. 1999) control the extent of transcriptional silencing. The DNA
sequence-independent model depends on competition between the Sir2 histone deacetylase
and the histone acetyltransferase (HAT) complexes, SAS-I, SAGA and NuA4 (Kimura et al.
2002; Suka et al. 2002; Kimura & Horikoshi 2004). We developed a genome-wide screening
system to test the ability of Gal4p DNA-binding domain (GBD)-fused proteins to prevent the
spread of transcriptional silencing. By screening a genome-wide yeast library for proteins
with barrier function, we identified 55 genes able to restrict silenced chromatin domains from
spreading and concomitantly repression of neighboring gene (Oki et al. 2004). Here I
characterized one of these proteins, named Sgf73, which has previously been identified as a
subunit of the SAGA (Spt-Ada-Gcn5-acetyletransferase) and SLIK complex (Lee and
Workman, 2007).
3
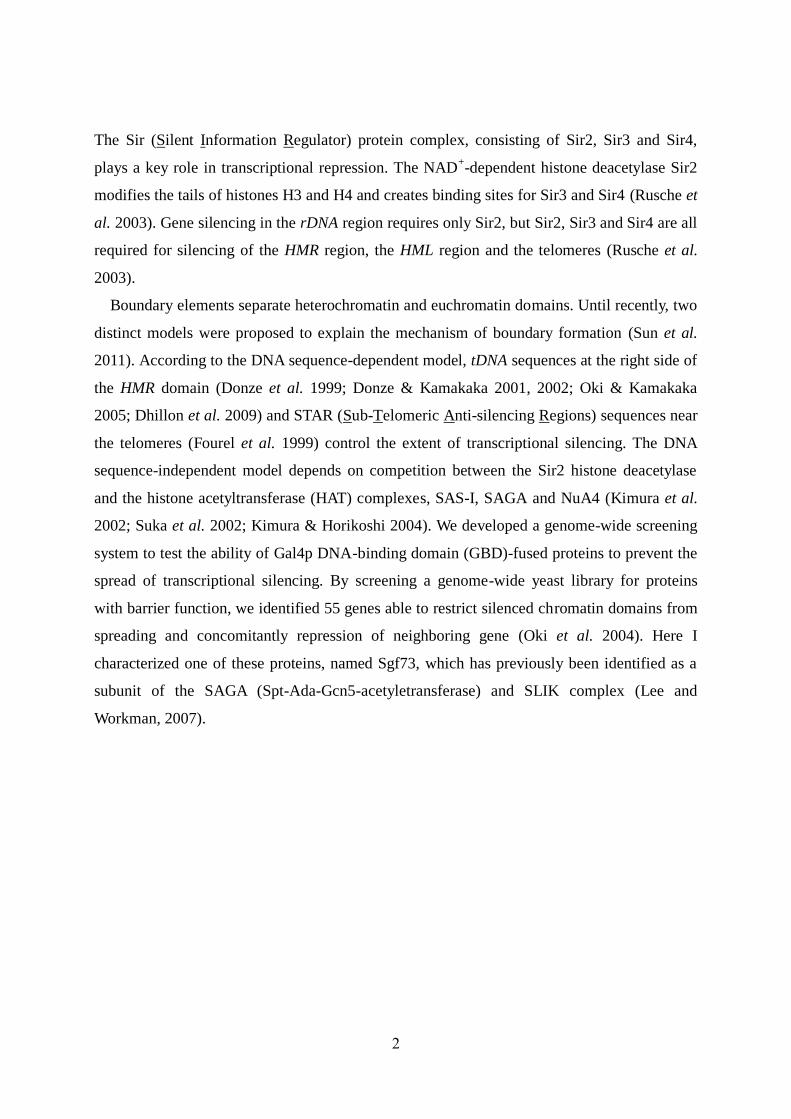
Table. 1.1 Isolated 55 Barrier Functional Proteins
Histone
modification
SWI/SNF Transcription
Related
genes
Cell cycle Other Unknown
SPT10
EPL1
YNG1
SAS2
SAS5
ADA2
ADA3
ADA5
HFI1
SGF73
SGF29
DOT1
LGE1
YCR082W
SNF5
SNF6
TBP1
TAF47
TAF17
TAF90
TAF60
TAF61
TAF30
GAL11
MED2
MED6
MED8
ROX3
ACE1
HSF1
LEU3
RGT1
FIO8
ACA1
SWI5
HMRA1
SPT21
TFA2
YBL081W
YDR223W
SIW14
CLB1
MND2
LYS5
ICY1
YAP1802
SEC35
SWA2
GDS1
SFP1
GIC1
MRS6
YDR031W
YBR271W
YCR076C
Misregulation of transcription results in the development of multiple types of cancers and
neurological diseases in humans. Packing of DNA into chromatin has a prefound impact on
gene expression. Changes in chromatin structure influence gene expression. Gene expression
is regulated by chromatin structure. Genes those are located in the euchromatin region are
transcriptionally active. Chromatin boundary can prevent transcriptionally repressed
heterochromatin domain from spreading into active euchromatin region. The following model
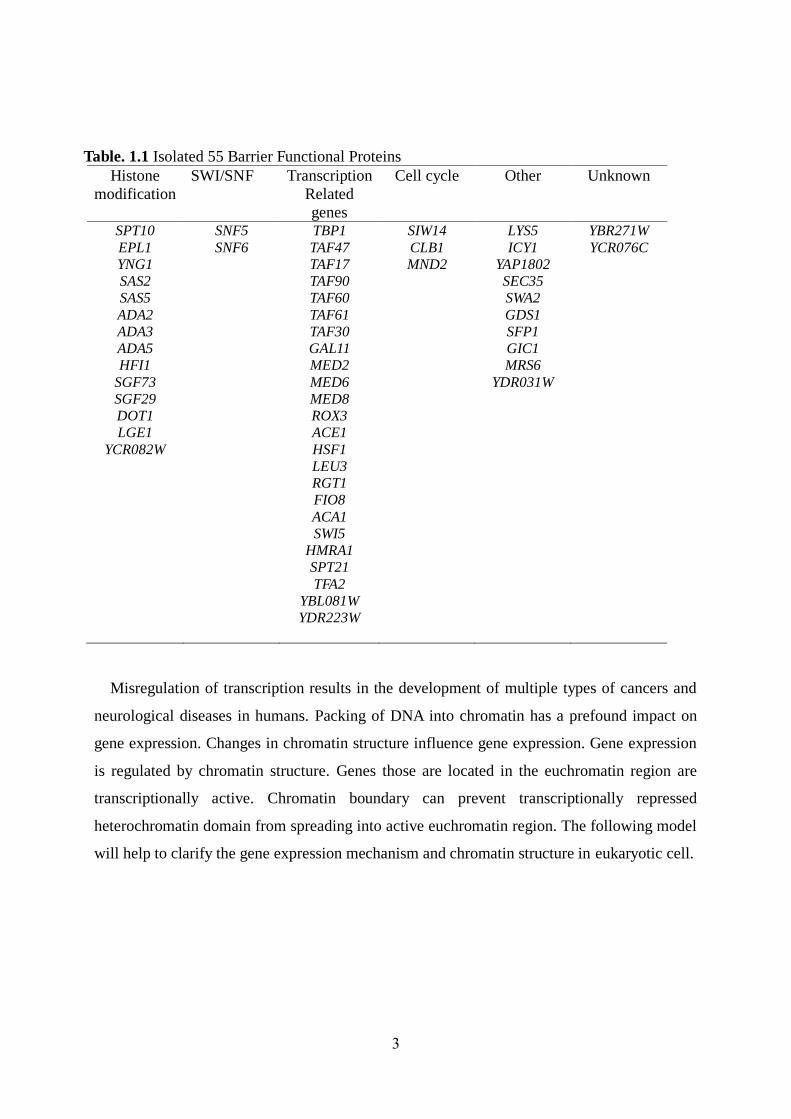
will help to clarify the gene expression mechanism and chromatin structure in eukaryotic cell.
4
Fig. 1.2 Gene expression regulation mechanism by chromatin structure
Nucleosomes are composed of 150 bp DNA which wraps around a core histone octamer .
The Histone core is subjected to various post-translational modifications including acetylation,
methylation, ubiquitination, phosphorylation, sumoylation. Acetylation and ubiquitination
play a key role in gene regulation. Acetylation of histones is associated with loose chromatin
structure that allows transcriptional machinery to access genomic loci for activation, whereas
histone ubiquitination is linked to both gene activation and repression (Brownell et al. 1996;
Weake & Workman 2008; Koutelou et al. 2010). SAGA is a multi-protein chromatin
modifying complex that is highly conserved from yeast to humans (Lee and workman, 2007).
The SAGA complex, which is composed of approximately 20 protein subunits with distinct
structural and functional modules, is involved in transcriptional activation (Brand et al. 1999;
Wu et al. 2004; Baker & Grant 2007). One of these SAGA modules contains the
acetyltransferase Gcn5 together with Ada2, Ada3 and Sgf29. This association activates Gcn5
to acetylate multiple lysine residues on nucleosomal histone H3 and plays an important role in
HAT activity in vivo (Grant et al. 1999; Balasubramanian et al. 2002; Bian et al. 2011; Weake
nucleus
Chromosome
CHROMATIN
Euchromatin Boundary
A
ONOFF
B
Heterochromatin
Euchromatin Boundary
A
ON
B
ON
Yeast cell
5
et al. 2011). Conversely, the yeast deubiquitinase Ubp8 is activated, together with the
protein subunits Sgf11, Sus1 and Sgf73, to catalyze histone H2B deubiquitination (Henry et al.
2003; Ingvarsdottir et al. 2005; Lee et al. 2005; Kohler et al. 2008; Zhang et al. 2008; Zhao et
al. 2008; Lee et al. 2009; Kohler et al. 2010; Samara et al. 2010; Lang et al. 2011; Weake et
al. 2011). SAGA-mediated deubiquitination of ubiquitinated H2B destabilizes promoter
nucleosomes. As a result, recruitment of RNA polymerase II to weak promoters is enhanced,
facilitating the binding of factors important for transcription elongation (Weake & Workman
2012).
In addition to these enzymatic modules, SAGA contains Tra1, a transcription
activator-binding protein, and several Spt proteins (Lee et al. 2011). Tra1 interacts with
transcription activators and recruits SAGA to promoters (Brown et al. 2001; Helmlinger et al.
2011; Weake et al. 2011), and Spt3 and Spt8 directly interact with components of the general
transcription machinery, such as TBP (Sterner et al. 1999; Larschan & Winston 2001;
Laprade et al. 2007; Mohibullah & Hahn 2008; Weake et al. 2011). Three core components,
Spt7, Spt20 and Ada1, are required for the structural integrity of the SAGA complex (Wu &
Winston 2002). Gcn5 and Ubp8 are the catalytic proteins of SAGA, while the rest of the
components are important facilitators of Upb8 or Gcn5 catalytic activity. The HAT Gcn5 and
its associated complexes regulate the transcription of a variety of genes in yeast (Zhang et al.
2008). Four Gcn5 complexes have been identified thus far: SAGA, SLIK (SALSA), ADA and
HAT-A2 (Lee & Workman 2007). The SAGA and SLIK complexes are comprised of
identical components with one exception: the SLIK complex contains a C-terminal truncated
form of Spt7 and Rtg2 instead of Spt8 (Pray-Grant et al. 2002; Spedale et al. 2010). Rtg2, a
unique component of SLIK, is important for the integrity and normal fractionation of the
SLIK complex (Pray-Grant et al. 2002). Sgf73 appears to play a crucial role in anchoring the
deubiquitination module to both SAGA and SLIK (Kohler et al. 2008; Lee et al. 2009; Lai et
al. 2010; Samara et al. 2010). Here, we explore a new function of Sgf73 in the establishment
of transcriptional silencing boundaries and determine the influence of the HAT activity of
Gcn5.
6
1.2 Background and prospects of erucic acid content in rape seed
Brassica oilseed have gained widespread acceptance worldwide largely because of major
improvements in the oil and meal quality. Brassica species are now the second largest oilseed
crop after soybean in the world oilseed production and became third in position on yield
during the last two decades (Wang 2004, Raymer 2002). World vegetable oil markets are
highly competitive requiring a steady improvement in oil quality to increase market prospects.
The objectives of modifying oil quality is to develop oils with enhanced nutritional and
functional properties and which require if possible no further processing for specific end-use
markets. Brassica oils represent a vast renewable resource of highly reduced carbon. The
market for rapeseed oil is primarily for human consumption, but also for a range of non-edible
applications, such as lubricants, plasticizers and detergent ingredients (Craig and Millan 1995).
In traditional Brassica oilseeds, the occurrence of the two components 22:1 and glucosinolates
are considered as anti-nutritional factors for both of the human and animals consumption,
therefore their contents were minimized by breeding and finally released Canola or ‘00’
(Przybylski and Mag 2002). In technical point of view, oil with higher amount of
polyunsaturated fatty acids has low oxidative stability, is not suitable for frying and deep
frying purposes. Therefore, Rakow (2004) has been attempted to breed oilseed rape cultivars
with low linolenic acid content by mutation. Chemically induced mutants have been
successfully obtained which raise oleic acid contents up to 80%. Crossing with other high
oleic acid genotypes and continued selection for a high oleic acid in the seed oil, known as
high oleic acid content led to the development of genotypes that had 86% oleic acid in the
seed oil, known as high oleic acid rapeseed; HOAR (Schierholt et al. 2001). Sasongko and
Möllers (2005) combined the genes for high erucic acid with those for high oleic acid in order
to increase the pool of oleoyl-CoA available for fatty acid elongation. In comparison to the
high erucic acid parental line, they found reduced contents of polyunsaturated and saturated
fatty acid and increased contents of oleic acid and eicosenoic acid. However, no significant
change in the erucic acid content was observed. This material was named as High Erucic and
Low Polyunsaturated fatty acid (HELP).
The development of seed oils bearing a high percentage of erucic acid for industrial
applications is a subject of research (Kott et al. 1996) because they are very excellent
renewable raw materials used in plastic film manufacture, in the synthesis of nylon 13 and in
the lubricant and emollient industries. Attempts are being made by conventional breeding to
7
increase the erucic acid content. This has so far resulted in breeding lines with up to 60%
erucic and eicosenoic acid. These fatty acids are found in the sn-1 and sn-3 position of the
triacylglycerols but are excluded from the sn-2 position. This sn-2 exclusion limits the erucic
acid together with the eicosenoic acid content to a total of 66% and prevents the synthesis of
trierucin (katavic et al. 2001). To overcome this theoretical limit, combined efforts in plant
breeding and genetic engineering have been undertaken. The gene of an erucoyl-CoA
preferring sn-2 acyltransferase (LPAAT) from meadowfoam (Limnanthes douglasii L.) has
been successfully cloned and over expressed in rapeseed (Brough et al. 1996, Friedt).
However, the overall proportions of 22:1 in the seed oil did not increase. In a next step
interest focussed on the fatty acid elongation mechanism from oleic acid to eicosenoic acid
and then to erucic acid. This elongation is the result of 2 cycles of a four-step mechansim, in
which 18:1-CoA are used as substrates. The first step, the initial condensation reaction of
these fatty acids with malonyl-CoA is catalysed by the β-ketoacyl-CoA-synthase (KCS). It is
believed that this initial condensation reaction of these fatty acids with malonyl-CoA is
catalysed by the B-ketoacyl-CoA-synthase (KCS). It is believed that this initial reaction the
rate limiting step (Cassagne et al. 1994). The fae-gene encoding the β-ketoacyl-CoA-synthase
has been cloned from a range of plant species and has been over-expressed under control
under control of a seed specific promoter in transgenic HEAR. The results of these
experiments showed that there was only a minor increase in erucic acid content (Han et al.
2001). Even in combination with the expression of the Limnanthes spp. LPAAT no substantial
increase in the erucic acid content has been found (Han et al. 2001). This indicates that there
are other bottlenecks in the pathway, such as the pool of oleic acid available for elongation to
eicosenoic and erucic acid, or the activities of the other three enzymes of the elongase
complex, that limit erucic acid synthesis. To observe the limitations of erucic acid synthesis in
seed oil, transgenic and nontransgenic approach are combined in this study and experiment
was performed with doubled haploid (DH) population which comes from the cross between
transgenic parent (1 transgene copy Ld-LPAAT-Bn/fae1) and non-transgenic parent (1 major
and 2-3 minor genes for low polyunsaturated fatty acid content). In the present study, 90 DH
lines come from F1 plant were analyzed and evaluate the variation, heritability for different
phenolgical traits such as days to flowering and maturity and quality traits like oil content,
protein content, different fatty acid content. Here I also study the inheritance of erucic acid
content in the segregating transgenic DH population.
8
Reference
Baker, S.P. & Grant, P.A. (2007) The SAGA continues: expanding the cellular role of a
transcriptional co-activator complex. Oncogene 26, 5329-5340.
Balasubramanian, R., Pray-Grant, M.G., Selleck, W., Grant, P.A. & Tan, S. (2002) Role of the
Ada2 and Ada3 transcriptional coactivators in histone acetylation. J Biol Chem 277,
7989-7995.
Bian, C., Xu, C., Ruan, J. et al. (2011) Sgf29 binds histone H3K4me2/3 and is required for
SAGA complex recruitment and histone H3 acetylation. EMBO J 30, 2829-2842.
Brand, M., Leurent, C., Mallouh, V., Tora, L. & Schultz, P. (1999) Three-dimensional
structures of the TAFII-containing complexes TFIID and TFTC. Science 286, 2151-2153.
Brough CL, Coventry JM, Christie WW, Kroon JTM, Brown AR, Barsby TL, Slabas AR
(1996) Towards the genetic engineering of triacylglycerols of defined fatty acid
composition: major changes in erucic acid content at the sn-2 position affected by the
introduction of a 1-acyl-sn-glycerol-3-phosphate acyltransferase from Limnanthes
douglasii into oil seed rape. Mol Breed 2:133–142
Brown, C.E., Howe, L., Sousa, K., Alley, S.C., Carrozza, M.J., Tan, S. & Workman, J.L.
(2001) Recruitment of HAT complexes by direct activator interactions with the
ATM-related Tra1 subunit. Science 292, 2333-2337.
Brownell, J.E., Zhou, J., Ranalli, T., Kobayashi, R., Edmondson, D.G., Roth, S.Y. & Allis,
C.D. (1996) Tetrahymena histone acetyltransferase A: a homolog to yeast Gcn5p linking
histone acetylation to gene activation. Cell 84, 843-851.
Cassagne C, Lessire R, Bessoule JJ, Moreau P, Creach A, Schneider F, Sturbois B (1994)
Biosynthesis of very long chain fatty acids in higher plants. Prog Lipid Res 33:55-69
Craig A, Millan S (1995) Modification of oilseed rape to produce oils for industrial use by
means of applied tissue culture methodology. Euphytica 85:323-327
Dhillon, N., Raab, J., Guzzo, J., Szyjka, S.J., Gangadharan, S., Aparicio, O.M., Andrews, B.
& Kamakaka, R.T. (2009) DNA polymerase epsilon, acetylases and remodellers
cooperate to form a specialized chromatin structure at a tRNA insulator. EMBO J 28,
2583-2600.
Donze, D. & Kamakaka, R.T. (2001) RNA polymerase III and RNA polymerase II promoter
complexes are heterochromatin barriers in Saccharomyces cerevisiae. EMBO J 20,
9
520-531.
Donze, D. & Kamakaka, R.T. (2002) Braking the silence: how heterochromatic gene
repression is stopped in its tracks. Bioessays 24, 344-349.
Donze, D., Adams, C.R., Rine, J. & Kamakaka, R.T. (1999) The boundaries of the silenced
HMR domain in Saccharomyces cerevisiae. Genes Dev 13, 698-708.
Fourel, G., Revardel, E., Koering, C.E. & Gilson, E. (1999) Cohabitation of insulators and
silencing elements in yeast subtelomeric regions. EMBO J 18, 2522-2537.
Friedt W, Lühs W (1998) Recent development and perspectives of industrial rapeseed
breeding. Fett/Lipid 100:219–226
Grant, P.A., Eberharter, A., John, S., Cook, R.G., Turner, B.M. & Workman, J.L. (1999)
Expanded lysine acetylation specificity of Gcn5 in native complexes. J Biol Chem 274,
5895-5900.
Han J, Lühs W, Sonntag K, Zahringer U, Borchardt DS, Wolter FP, Heinz E, Frentzen M
(2001) Functional characterization of β-ketoacyl-CoA synthase genes from Brassica
napus L. Plant Mol Biol 46:229–239
Helmlinger, D., Marguerat, S., Villen, J., Swaney, D.L., Gygi, S.P., Bahler, J. & Winston, F.
(2011) Tra1 has specific regulatory roles, rather than global functions, within the SAGA
co-activator complex. EMBO J 30, 2843-2852.
Henry, K.W., Wyce, A., Lo, W.S., Duggan, L.J., Emre, N.C., Kao, C.F., Pillus, L., Shilatifard,
A., Osley, M.A. & Berger, S.L. (2003) Transcriptional activation via sequential histone
H2B ubiquitylation and deubiquitylation, mediated by SAGA-associated Ubp8. Genes
Dev 17, 2648-2663.
Ingvarsdottir, K., Krogan, N.J., Emre, N.C., Wyce, A., Thompson, N.J., Emili, A., Hughes,
T.R., Greenblatt, J.F. & Berger, S.L. (2005) H2B ubiquitin protease Ubp8 and Sgf11
constitute a discrete functional module within the Saccharomyces cerevisiae SAGA
complex. Molecular and cellular biology 25, 1162-1172.
Katavic V, Friesen W, Barton DL, Gossen KK, Giblin EM, Luciw T, An J, Zou J, MacKenzie
SL, Keller WA, Males D, Taylor DC (2001) Improving erucic acid content in rapeseed
through biotechnology: What can the Arabidopsis FAE1 and the yeast SLC1–1 genes
contribute? Crop Sci 41:739–747
Kimura, A. & Horikoshi, M. (2004) Partition of distinct chromosomal regions: negotiable
border and fixed border. Genes Cells 9, 499-508.
10
Kimura, A., Umehara, T. & Horikoshi, M. (2002) Chromosomal gradient of histone
acetylation
Kohler, A., Schneider, M., Cabal, G.G., Nehrbass, U. & Hurt, E. (2008) Yeast Ataxin-7 links
histone deubiquitination with gene gating and mRNA export. Nat Cell Biol 10, 707-715.
Kohler, A., Zimmerman, E., Schneider, M., Hurt, E. & Zheng, N. (2010) Structural basis for
assembly and activation of the heterotetrameric SAGA histone H2B deubiquitinase
module. Cell 141, 606-617.
Kott L, Wong R, Swanson E, Chen J (1996) Mutation and selection for improved oil and meal
quality in Brassica napus utilizing microspore culture. In: Jain S M, Sopory SK, Veilleux
RE (ed), In vitro Haploid Production in Higher Plants. 2:151-167, Kluwer Academic Publ,
Dordrecht.
Koutelou, E., Hirsch, C.L. & Dent, S.Y. (2010) Multiple faces of the SAGA complex. Curr
Opin Cell Biol 22, 374-382.
Lai, C., Wu, M., Li, P., Shi, C., Tian, C. & Zang, J. (2010) Solution NMR characterization of
Sgf73(1-104) indicates that Zn ion is required to stabilize zinc finger motif. Biochemical
and biophysical research communications 397, 436-44
Lang, G., Bonnet, J., Umlauf, D., Karmodiya, K., Koffler, J., Stierle, M., Devys, D. & Tora, L.
(2011) The tightly controlled deubiquitination activity of the human SAGA complex
differentially modifies distinct gene regulatory elements. Molecular and cellular biology
31, 3734-3744.
Laprade, L., Rose, D. & Winston, F. (2007) Characterization of new Spt3 and TATA-binding
protein mutants of Saccharomyces cerevisiae: Spt3 TBP allele-specific interactions and
bypass of Spt8. Genetics 177, 2007-2017.
Larschan, E. & Winston, F. (2001) The S. cerevisiae SAGA complex functions in vivo as a
coactivator for transcriptional activation by Gal4. Genes Dev 15, 1946-1956.
Lee, K.K. & Workman, J.L. (2007) Histone acetyltransferase complexes: one size doesn't fit
all. Nat Rev Mol Cell Biol 8, 284-295
Lee, K.K., Florens, L., Swanson, S.K., Washburn, M.P. & Workman, J.L. (2005) The
deubiquitylation activity of Ubp8 is dependent upon Sgf11 and its association with the
SAGA complex. Molecular and cellular biology 25, 1173-1182.
Lee, K.K., Sardiu, M.E., Swanson, S.K., Gilmore, J.M., Torok, M., Grant, P.A., Florens, L.,
Workman, J.L. & Washburn, M.P. (2011) Combinatorial depletion analysis to assemble
11
the network architecture of the SAGA and ADA chromatin remodeling complexes. Mol
Syst Biol 7, 503.
Lee, K.K., Swanson, S.K., Florens, L., Washburn, M.P. & Workman, J.L. (2009) Yeast
Sgf73/Ataxin-7 serves to anchor the deubiquitination module into both SAGA and
Slik(SALSA) HAT complexes. Epigenetics Chromatin 2, 2.
Mohibullah, N. & Hahn, S. (2008) Site-specific cross-linking of TBP in vivo and in vitro
reveals a direct functional interaction with the SAGA subunit Spt3. Genes Dev 22,
2994-3006.
Oki, M. & Kamakaka, R.T. (2005) Barrier function at HMR. Mol Cell 19, 707-716.
Oki, M., Valenzuela, L., Chiba, T., Ito, T. & Kamakaka, R.T. (2004) Barrier proteins remodel
and modify chromatin to restrict silenced domains. Molecular and cellular biology 24,
1956-1967.
Pray-Grant, M.G., Schieltz, D., McMahon, S.J., Wood, J.M., Kennedy, E.L., Cook, R.G.,
Workman, J.L., Yates, J.R., 3rd & Grant, P.A. (2002) The novel SLIK histone
acetyltransferase complex functions in the yeast retrograde response pathway. Molecular
and cellular biology 22, 8774-8786.
Pryzybilski R, Mag T (2002) Canola/Rapeseed. In: Gunstone FD (ed) Vegetable oils in food
technology composition, properties and uses. Blackwell publishing, CRC press, Boca
Raton, FL, pp 98-127
Rakow G (2004) Species origin and economic importance of Brassica.pp 3-11. In: Pua EC,
Douglas CJ (ed) Biotechnology in Agriculture and Forestry, 54 Brassica. Springer-Verlag
Berlin Heidelberg, Newyork
Raymer PL (2002) Canola an emerging oilseed crop. pp 122-126. In: Janick J, Whipkey A
(ed) Trends in new crops and new uses. ASHS press, Alexandria VA
Rusche, L.N., Kirchmaier, A.L. & Rine, J. (2003) The establishment, inheritance, and
function of silenced chromatin in Saccharomyces cerevisiae. Annu Rev Biochem 72,
481-516.
Samara, N.L., Datta, A.B., Berndsen, C.E., Zhang, X., Yao, T., Cohen, R.E. & Wolberger, C.
(2010) Structural insights into the assembly and function of the SAGA deubiquitinating
module. Science 328, 1025-1029.
Sasongko ND, Möllers M (2005) Toward increasing erucic acid content in oilseed rape
(Brassica napus L.) through the combination with genes for high oleic acid. J Am Oil
12
Chem Soc 82:445-449
Schierholt A, Rücker B, Becker HC (2001) Inheritance of high oleic acid mutations in winter
oilseed rape (Brassica napus L.). Crop Sci 41:1444-1449
Spedale, G., Mischerikow, N., Heck, A.J., Timmers, H.T. & Pijnappel, W.W. (2010)
Identification of Pep4p as the protease responsible for formation of the SAGA-related
SLIK protein complex. J Biol Chem 285, 22793-22799.
Sterner, D.E., Grant, P.A., Roberts, S.M., Duggan, L.J., Belotserkovskaya, R., Pacella, L.A.,
Winston, F., Workman, J.L. & Berger, S.L. (1999) Functional organization of the yeast
SAGA complex: distinct components involved in structural integrity, nucleosome
acetylation, and TATA-binding protein interaction. Molecular and cellular biology 19,
86-98.
Suka, N., Luo, K. & Grunstein, M. (2002) Sir2p and Sas2p opposingly regulate acetylation of
yeast histone H4 lysine16 and spreading of heterochromatin. Nat Genet 32, 378-383.
Sun, J.Q., Hatanaka, A. & Oki, M. (2011) Boundaries of transcriptionally silent chromatin in
Saccharomyces cerevisiae. Genes Genet Syst 86, 73-81.
Wang HZ (2004) Medium-term and long-term developing stratagem of variety improvement
of China rape. Chinese Journal of Oil Crops Sciences. 26:98-101
Weake, V.M. & Workman, J.L. (2008) Histone ubiquitination: triggering gene activity. Mol
Cell 29, 653-663.
Weake, V.M. & Workman, J.L. (2012) SAGA function in tissue-specific gene expression.
Trends Cell Biol 22, 177-184.
Weake, V.M., Dyer, J.O., Seidel, C., Box, A., Swanson, S.K., Peak, A., Florens, L., Washburn,
M.P., Abmayr, S.M. & Workman, J.L. (2011) Post-transcription initiation function of the
ubiquitous SAGA complex in tissue-specific gene activation. Genes Dev 25, 1499-1509.
Weake, V.M., Dyer, J.O., Seidel, C., Box, A., Swanson, S.K., Peak, A., Florens, L., Washburn,
M.P., Abmayr, S.M. & Workman, J.L. (2011) Post-transcription initiation function of the
ubiquitous SAGA complex in tissue-specific gene activation. Genes Dev 25, 1499-1509.
Wu, P.Y. & Winston, F. (2002) Analysis of Spt7 function in the Saccharomyces cerevisiae
SAGA coactivator complex. Molecular and cellular biology 22, 5367-5379.
Wu, P.Y., Ruhlmann, C., Winston, F. & Schultz, P. (2004) Molecular architecture of the S.
cerevisiae SAGA complex. Mol Cell 15, 199-208.
Zhang, X.Y., Varthi, M., Sykes, S.M., Phillips, C., Warzecha, C., Zhu, W., Wyce, A., Thorne,
13
A.W., Berger, S.L. & McMahon, S.B. (2008) The putative cancer stem cell marker
USP22 is a subunit of the human SAGA complex required for activated transcription and
cell-cycle progression. Mol Cell 29, 102-111.
Zhao, Y., Lang, G., Ito, S. et al. (2008) A TFTC/STAGA module mediates histone H2A and
H2B deubiquitination, coactivates nuclear receptors, and counteracts heterochromatin
silencing. Mol Cell 29, 92-101.
14
Chapter 2
Characterization of Sgf73 for heterochromatin boundary
formation
2.1 Introduction
SAGA is a 1.8 MDa dynamic multi-protein complex that can acetylate and deubiquitinate
histones ( Grant et al, 1997; Daniel and Grant et al, 2007 and Bhaumik, 2011). Non-essential
components of yeast like Gcn5, Ada1, Ada2, Ada3, Spt3, Spt7, Spt8, Spt20, Sgf11, Sgf29,
Sgf73, Ubp8 and Sus1 present into SAGA complex, SAGA also contains Tra1, Taf5, Taf6,
Taf9, Taf10, and Taf12 which are essential for yeast (Lee et al, 2000). In yeast one of the most
well characterized process in regulating chromatin structure is the post-translational
modification of histones. The SAGA complex provides a paradigm for multi-subunit histone
modifying complex. Histone modifications, such as acetylation and ubiquitination, play vital
role in facilitating a number of cellular events, including gene expression. Our group
previously developed a genome-wide screening system to examine the boundary formation
ability of GAL4 DNA binding domain (GBD)-fused proteins from S. cerevisiae; this
technique was used to isolate 55 boundary proteins from approximately 6000 genes (Oki et al.
2004). Sgf73 is belongs to the 55 boundary related proteins. This study describes the
characterization of Sgf73, which has previously been identified as a component of the SAGA
(Spt-Ada-Gcn5-acetyltransferas) and SLIK (SAGA - like) complex and is conserved between
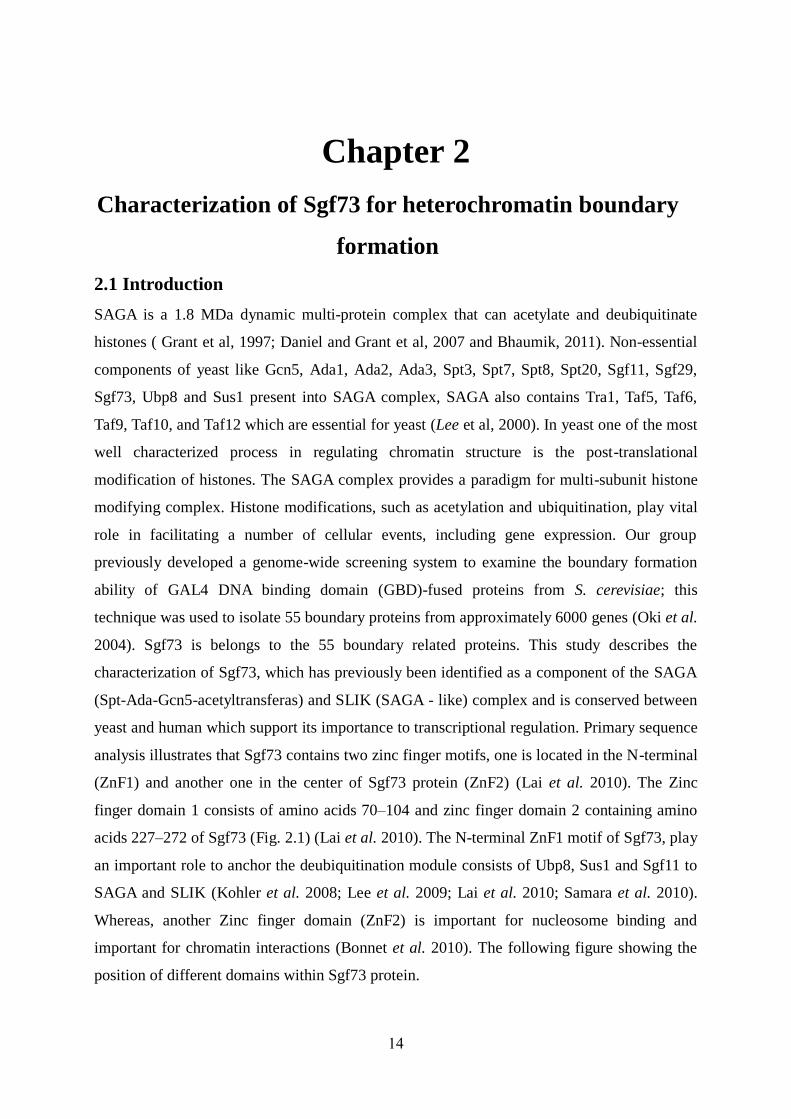
yeast and human which support its importance to transcriptional regulation. Primary sequence
analysis illustrates that Sgf73 contains two zinc finger motifs, one is located in the N-terminal
(ZnF1) and another one in the center of Sgf73 protein (ZnF2) (Lai et al. 2010). The Zinc
finger domain 1 consists of amino acids 70–104 and zinc finger domain 2 containing amino
acids 227–272 of Sgf73 (Fig. 2.1) (Lai et al. 2010). The N-terminal ZnF1 motif of Sgf73, play
an important role to anchor the deubiquitination module consists of Ubp8, Sus1 and Sgf11 to
SAGA and SLIK (Kohler et al. 2008; Lee et al. 2009; Lai et al. 2010; Samara et al. 2010).
Whereas, another Zinc finger domain (ZnF2) is important for nucleosome binding and
important for chromatin interactions (Bonnet et al. 2010). The following figure showing the
position of different domains within Sgf73 protein.
15
Fig. 2.1 Position of know domain within Sgf73
In this study, domain analysis of Sgf73 was performed to indentify the minimum region that
play crucial role to mediate barrier function. Here I determined relevant proteins those could
be associated with Sgf73 and are necessary for its boundary function. Furthermore, disruption
strain (different SAGA subunits were deleted) mating analysis was carried out to identify the
proteins those are necessary for Sgf73 boundary. I also evaluate boundary activity of the hat
mutant to determine whether GCN5 HAT activity is necessary or not. Finally this study
suggests that histone acetylation activity is necessary for Sgf73 boundary function and SAGA
and SLIK both complex can bind into our minimum region to mediate boundary activity
2.2 Materials and Methods
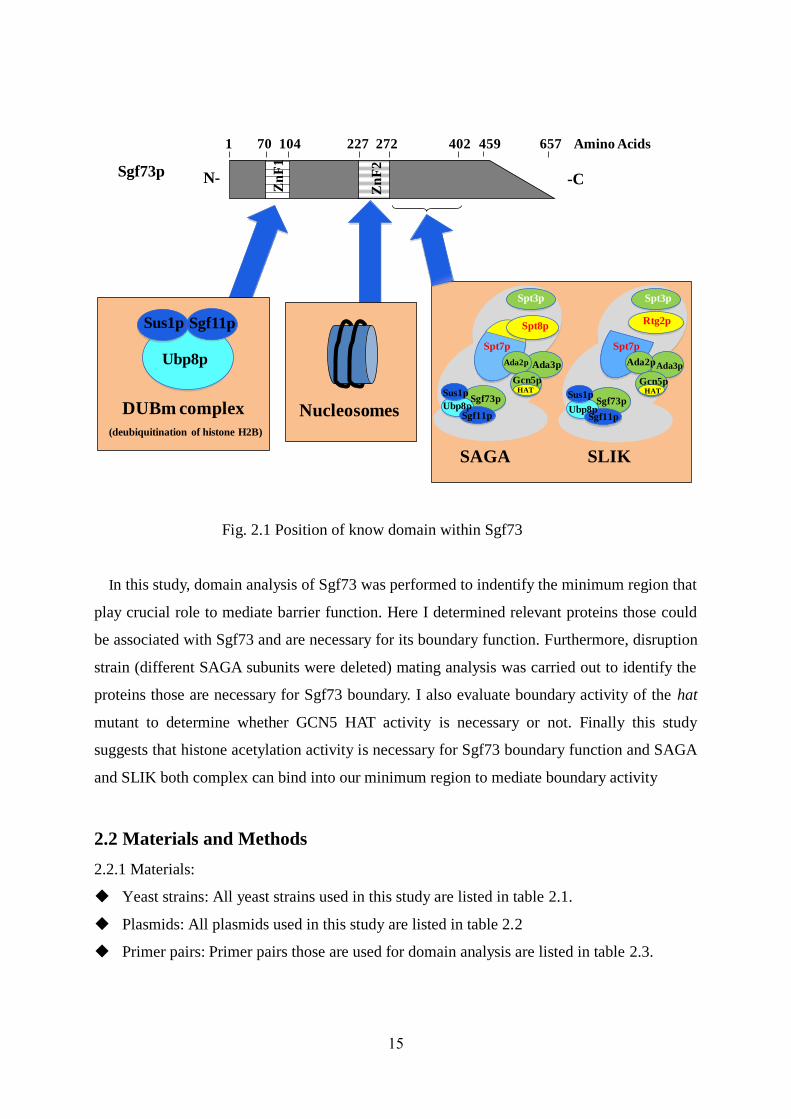
2.2.1 Materials:
Yeast strains: All yeast strains used in this study are listed in table 2.1.
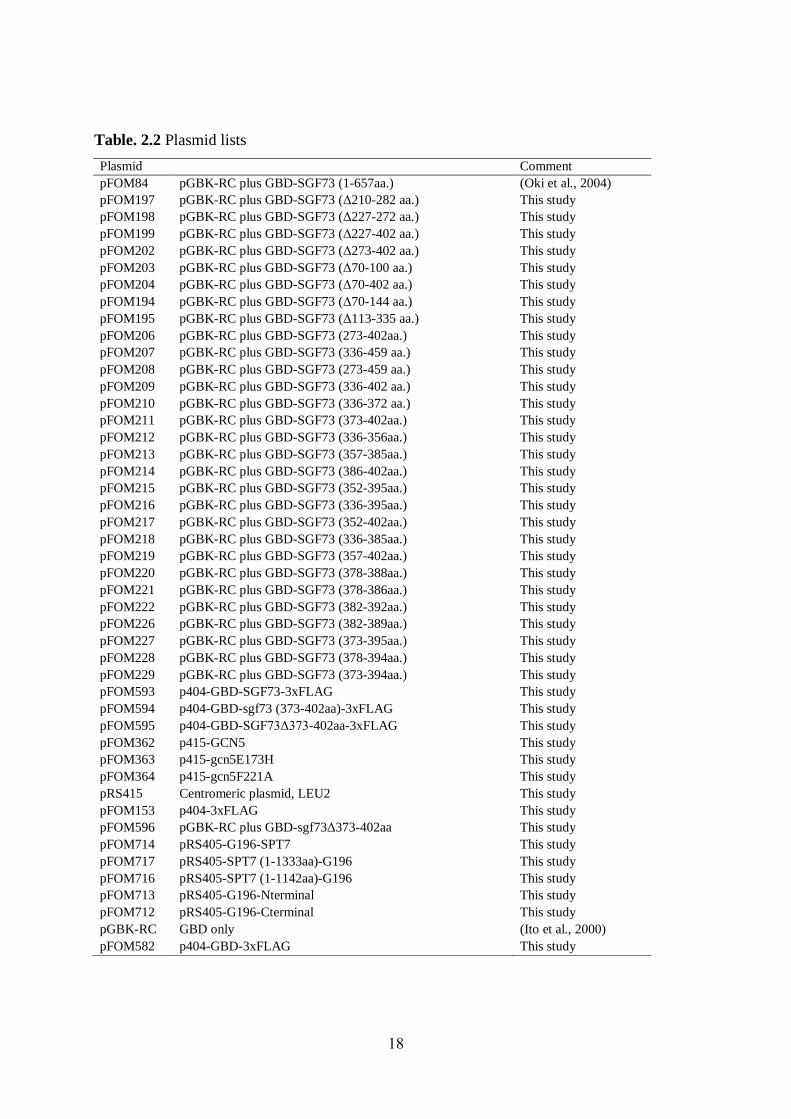
Plasmids: All plasmids used in this study are listed in table 2.2
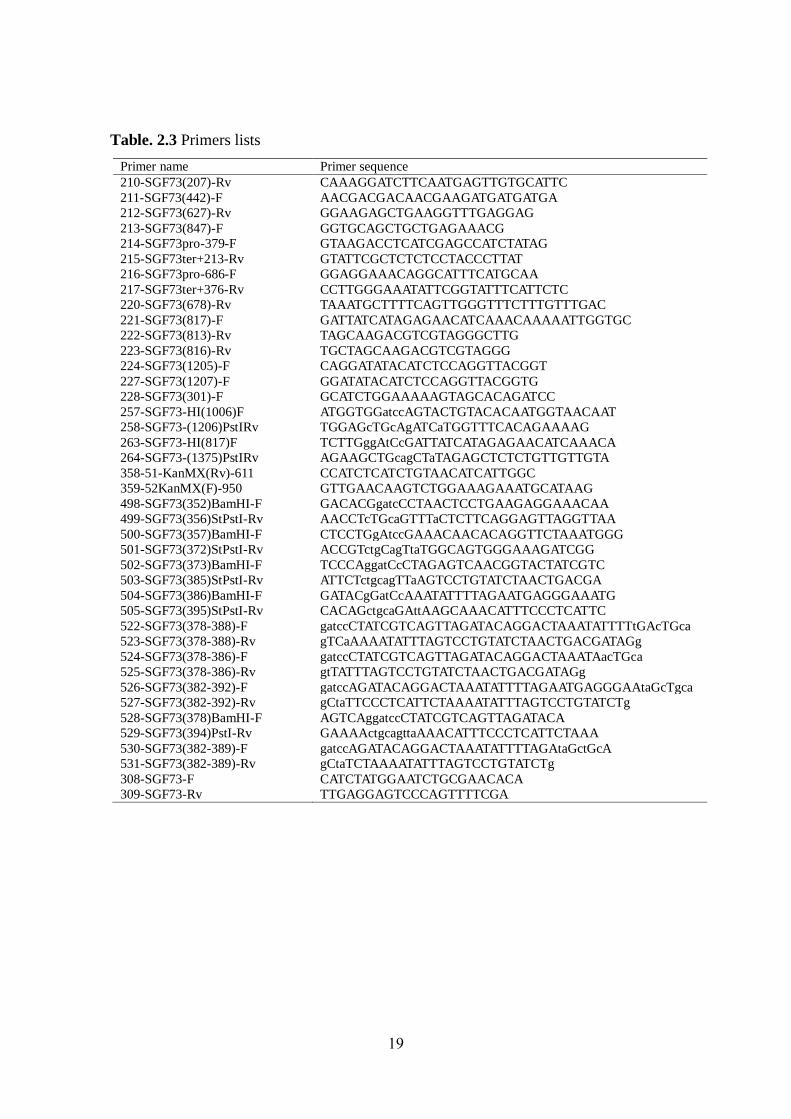
Primer pairs: Primer pairs those are used for domain analysis are listed in table 2.3.
N- -C
1 22710470 272 657 Amino Acids402
Zn
F1
Zn
F2
459
Sus1p Sgf11p
Ubp8p
DUBm complex
(deubiquitination of histone H2B)
Nucleosomes
Gcn5pHAT
Ada3pAda2p
Spt7p
Sus1p
Sgf11pUbp8p
Sgf73p
Spt3p
Rtg2p
Spt7p
Spt3p
Spt8p
Sus1p
Ubp8pSgf73p
HAT
Gcn5p
Ada2p
Sgf11p
Ada3p
SAGA SLIK
Sgf73p
16
Table. 2.1 Yeast strains
Strain Genotype Source
ROY2041 MAT @ ADE2 lys2Δ his3-11 leu2-5,112 trp1-1 hmrΔ::bgl-bclΔ ura3-1::HMRΔI::URA3 (Oki et al.,
2004)
ROY2042 MAT@ ADE2 lys2Δ his3-11 leu2-5,112 trp1-1 hmrΔ::bgl-bclΔ ura3-1::HMRΔI+4xGal4 bs at mat a2(ECONI)::URA3
(Oki et al., 2004)
JRY19a MATa ADE2 LYS2 his4-519 leu2-3,112 trp1 ura3-52 (Donze et al.,
1999)
FUY594 MAT@ ADE2 lys2Δ trp1-1 his3-11 hmrΔ::bgl-bclΔ ura3-1::HMRΔI+4×Gal4bs at mat a2(ECONI)::URA3 spt3Δ::KanMX4
This study
FUY596 MAT@ ADE2 lys2Δ trp1-1 his3-11 hmrΔ::bgl-bclΔ ura3-1::HMRΔI+4×Gal4bs at mat a2(ECONI)::URA3 spt8Δ::KanMX4
This study
ROY2120 MAT@ ADE2 lys2Δ trp1-1 his3-11 hmrΔ::bgl-bclΔ ura3-1::HMRΔI+4×Gal4bs at mat a2(ECONI)::URA3 gcn5Δ::kanMX
This study
ROY2220 MAT@ ADE2 lys2Δ trp1-1 his3-11 hmrΔ::bgl-bclΔ ura3-1::HMRΔI+4×Gal4bs at mat a2(ECONI)::URA3 ada2Δ::kanMX
This study
ROY2240 MAT@ ADE2 lys2Δ trp1-1 his3-11 hmrΔ::bgl-bclΔ ura3-1::HMRΔI+4×Gal4bs at mat a2(ECONI)::URA3 ada3Δ::kanMX
This study
FUY392 MAT@ ADE2 lys2Δ trp1-1 his3-11 hmrΔ::bgl-bclΔ ura3-1::HMRΔI+4×Gal4bs at mat a2(ECONI)::URA3 pep4Δ::kanMX
This study
FUY614 MATa ADE2 lys2Δ his3-11 leu2-5,112 hmrΔ::bgl-bclΔ ura3-1 sgf73Δ::hphMX trp1-1::GBD-3×flag::TRP1
This study
FUY615 MATa ADE2 lys2Δ his3-11 leu2-5,112 hmrΔ::bgl-bclΔ ura3-1 sgf73Δ::hphMX trp1-1::GBD-SGF73-3×flag::TRP1
This study
FUY616 MATa ADE2 lys2Δ his3-11 leu2-5,112 hmrΔ::bgl-bclΔ ura3-1 sgf73Δ::hphMX trp1-1::GBD-SGF73(Δ373-402 aa)-3×flag::TRP1
This study
FUY617 MATa ADE2 lys2Δ his3-11 leu2-5,112 hmrΔ::bgl-bclΔ ura3-1 sgf73Δ::hphMX trp1-1::GBD-SGF73(373-402 aa)-3×flag::TRP1
This study
FUY592 MAT@ ADE2 lys2Δ trp1-1 his3-11 hmrΔ::bgl-bclΔ ura3-1::HMRΔI+4×Gal4bs at mat a2(ECONI)::URA3 ahc1Δ::KanMX
This study
FUY586 MAT@ ADE2 lys2Δ trp1-1 his3-11 hmrΔ::bgl-bclΔ ura3-1::HMRΔI+4×Gal4bs at mat a2(ECONI)::URA3 ubp8Δ::kanMX
This study
FUY131 MAT@ ADE2 lys2Δ trp1-1 his3-11 hmrΔ::bgl-bclΔ ura3-1::HMRΔI+4×Gal4bs at mat a2(ECONI)::URA3 sgf73Δ::KanMX
This study
FUY364 MAT@ ADE2 lys2Δ trp1-1 his3-11 hmrΔ::bgl-bclΔ ura3-1::HMRΔI+4×Gal4bs at mat a2(ECONI)::URA3 sgf29Δ::kanMX
This study
FUY905 MATa ADE2 lys2Δ his3-11 ura3-1 sgf73Δ::hphMX trp1-1::GBD-3×flag::TRP1 leu2-5,112::G196-Spt7::LEU2
This study
FUY906 MATa ADE2 lys2Δ his3-11 ura3-1 sgf73Δ::hphMX trp1-1::GBD-SGF73-3×flag::TRP1 leu2-5,112::G196-Spt7::LEU2
This study
FUY907 MATa ADE2 lys2Δ his3-11 ura3-1 sgf73Δ::hphMX trp1-1::GBD-SgF73(D373-402 aa)-3×flag3::TRP1 leu2-5,112::G196-Spt7::LEU2
This study
FUY908 MATa ADE2 lys2Δ his3-11 ura3-1 sgf73Δ::hphMX trp1-1::GBD-SgF73(373-402 aa)-3×flag::TRP1 leu2-5,112::G196-Spt7::LEU2
This study
FUY927 MATa ADE2 lys2Δ his3-11 ura3-1 sgf73Δ::hphMX trp1-1Δ::GBD-3×flag::TRP1 leu2-5,112::SPT7(1-1142)-G196::LEU2
This study
FUY928 MATa ADE2 lys2Δ his3-11 ura3-1 sgf73Δ::hphMX trp1-1::GBD-SGF73-3×flag::TRP1 leu2-5,112::SPT7(1-1142)-G196::LEU2
This study
FUY929 MATa ADE2 lys2Δ his3-11 ura3-1 sgf73Δ::hphMX trp1-1::GBD-Sgf73(Δ373-402 aa)-3×flag3::TRP1 leu2-5,112::SPT7(1-1142)-G196::LEU2
This study
FUY930 MATa ADE2 lys2Δ his3-11 ura3-1 sgf73Δ::hphMX trp1-1::GBD-Sgf73(373-402 aa)-3×flag::TRP1 leu2-5,112::SPT7(1-1142)-G196::LEU2
This study
FUY944 MAT@ ADE2 lys2Δ trp1-1 his3-11 hmrΔ::bgl-bclΔ ura3-1::HMRΔ I +4×Gal4bs at mat a2(ECONI)::URA3 leu2-5,112::SPT7-G196::LEU2
This study
FUY931 MAT@ ADE2 lys2Δ trp1-1 his3-11 hmrΔ::bgl-bclΔ ura3-1::HMRΔ I +4×Gal4bs at mat a2(ECONI)::URA3 leu2-5,112::SPT7(1-1142)-G196::LEU2
This study
FUY1105 MATa ADE2 lys2Δ his3-11 leu2-5,112 trp1-1 ura3-1 sgf73Δ::hphMX trp1-1Δ::GBD-3×flag::TRP1 leu2-5,112::SPT20-G196::LEU2
This study
FUY1106 MATa ADE2 lys2Δ his3-11 leu2-5,112 trp1-1 ura3-1 sgf73Δ::hphMX trp1-1Δ::GBD-SGF73-3×flag::TRP1 leu2-5,112::SPT20-G196::LEU2
This study
FUY1107 MATa ADE2 lys2Δ his3-11 leu2-5,112 trp1-1 ura3-1 sgf73Δ::hphMX trp1-1::GBD-Sgf73(373-402 aa)-3×flag::TRP1 leu2-5,112::SPT20-G196::LEU2
This study
FUY1108 MATa ADE2 lys2Δ his3-11 leu2-5,112 trp1-1 ura3-1 sgf73Δ::hphMX trp1-1::GBD-Sgf73(Δ373-402 aa)-3×flag3::TRP1 leu2-5,112::SPT20-G196::LEU2
This study
FUY1109 MATa ADE2 lys2Δ his3-11 leu2-5,112 trp1-1 ura3-1 sgf73Δ::hphMX trp1-1Δ::GBD-3×flag::TRP1 leu2-5,112::RTG2-G196::LEU2
This study
FUY1110 MATa ADE2 lys2Δ his3-11 leu2-5,112 trp1-1 ura3-1 sgf73Δ::hphMX trp1-1Δ::GBD-SGF73-3×flag::TRP1 leu2-5,112::RTG2-G196::LEU2
This study
FUY1111 MATa ADE2 lys2Δ his3-11 leu2-5,112 trp1-1 ura3-1 sgf73Δ::hphMX trp1-1::GBD-Sgf73(373-402 aa)-3×flag::TRP1 leu2-5,112::RTG2-G196::LEU2
This study
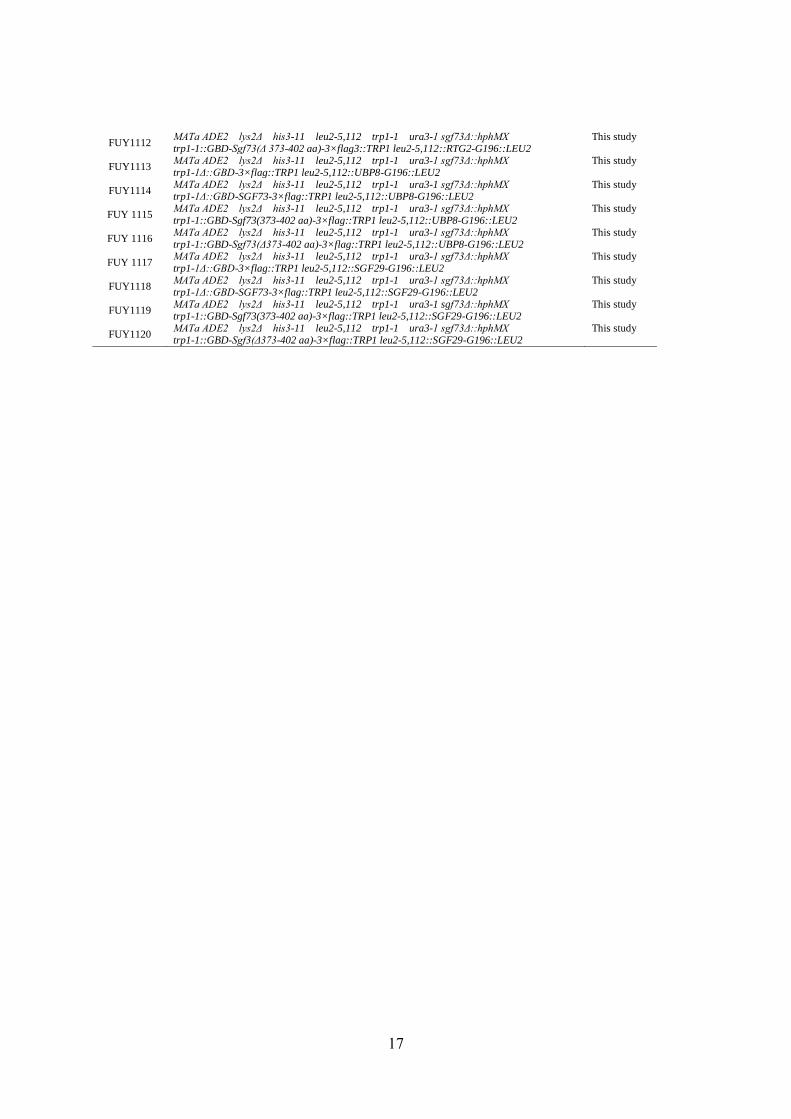
17
FUY1112 MATa ADE2 lys2Δ his3-11 leu2-5,112 trp1-1 ura3-1 sgf73Δ::hphMX trp1-1::GBD-Sgf73(Δ 373-402 aa)-3×flag3::TRP1 leu2-5,112::RTG2-G196::LEU2
This study
FUY1113 MATa ADE2 lys2Δ his3-11 leu2-5,112 trp1-1 ura3-1 sgf73Δ::hphMX trp1-1Δ::GBD-3×flag::TRP1 leu2-5,112::UBP8-G196::LEU2
This study
FUY1114 MATa ADE2 lys2Δ his3-11 leu2-5,112 trp1-1 ura3-1 sgf73Δ::hphMX trp1-1Δ::GBD-SGF73-3×flag::TRP1 leu2-5,112::UBP8-G196::LEU2
This study
FUY 1115 MATa ADE2 lys2Δ his3-11 leu2-5,112 trp1-1 ura3-1 sgf73Δ::hphMX trp1-1::GBD-Sgf73(373-402 aa)-3×flag::TRP1 leu2-5,112::UBP8-G196::LEU2
This study
FUY 1116 MATa ADE2 lys2Δ his3-11 leu2-5,112 trp1-1 ura3-1 sgf73Δ::hphMX trp1-1::GBD-Sgf73(Δ373-402 aa)-3×flag::TRP1 leu2-5,112::UBP8-G196::LEU2
This study
FUY 1117 MATa ADE2 lys2Δ his3-11 leu2-5,112 trp1-1 ura3-1 sgf73Δ::hphMX trp1-1Δ::GBD-3×flag::TRP1 leu2-5,112::SGF29-G196::LEU2
This study
FUY1118 MATa ADE2 lys2Δ his3-11 leu2-5,112 trp1-1 ura3-1 sgf73Δ::hphMX trp1-1Δ::GBD-SGF73-3×flag::TRP1 leu2-5,112::SGF29-G196::LEU2
This study
FUY1119 MATa ADE2 lys2Δ his3-11 leu2-5,112 trp1-1 ura3-1 sgf73Δ::hphMX trp1-1::GBD-Sgf73(373-402 aa)-3×flag::TRP1 leu2-5,112::SGF29-G196::LEU2
This study
FUY1120 MATa ADE2 lys2Δ his3-11 leu2-5,112 trp1-1 ura3-1 sgf73Δ::hphMX trp1-1::GBD-Sgf3(Δ373-402 aa)-3×flag::TRP1 leu2-5,112::SGF29-G196::LEU2
This study
18
Table. 2.2 Plasmid lists
Plasmid Comment
pFOM84 pGBK-RC plus GBD-SGF73 (1-657aa.) (Oki et al., 2004)
pFOM197 pGBK-RC plus GBD-SGF73 (Δ210-282 aa.) This study
pFOM198 pGBK-RC plus GBD-SGF73 (Δ227-272 aa.) This study
pFOM199 pGBK-RC plus GBD-SGF73 (Δ227-402 aa.) This study
pFOM202 pGBK-RC plus GBD-SGF73 (Δ273-402 aa.) This study
pFOM203 pGBK-RC plus GBD-SGF73 (Δ70-100 aa.) This study
pFOM204 pGBK-RC plus GBD-SGF73 (Δ70-402 aa.) This study
pFOM194 pGBK-RC plus GBD-SGF73 (Δ70-144 aa.) This study
pFOM195 pGBK-RC plus GBD-SGF73 (Δ113-335 aa.) This study
pFOM206 pGBK-RC plus GBD-SGF73 (273-402aa.) This study
pFOM207 pGBK-RC plus GBD-SGF73 (336-459 aa.) This study
pFOM208 pGBK-RC plus GBD-SGF73 (273-459 aa.) This study
pFOM209 pGBK-RC plus GBD-SGF73 (336-402 aa.) This study
pFOM210 pGBK-RC plus GBD-SGF73 (336-372 aa.) This study
pFOM211 pGBK-RC plus GBD-SGF73 (373-402aa.) This study
pFOM212 pGBK-RC plus GBD-SGF73 (336-356aa.) This study
pFOM213 pGBK-RC plus GBD-SGF73 (357-385aa.) This study
pFOM214 pGBK-RC plus GBD-SGF73 (386-402aa.) This study
pFOM215 pGBK-RC plus GBD-SGF73 (352-395aa.) This study
pFOM216 pGBK-RC plus GBD-SGF73 (336-395aa.) This study
pFOM217 pGBK-RC plus GBD-SGF73 (352-402aa.) This study
pFOM218 pGBK-RC plus GBD-SGF73 (336-385aa.) This study
pFOM219 pGBK-RC plus GBD-SGF73 (357-402aa.) This study
pFOM220 pGBK-RC plus GBD-SGF73 (378-388aa.) This study
pFOM221 pGBK-RC plus GBD-SGF73 (378-386aa.) This study
pFOM222 pGBK-RC plus GBD-SGF73 (382-392aa.) This study
pFOM226 pGBK-RC plus GBD-SGF73 (382-389aa.) This study
pFOM227 pGBK-RC plus GBD-SGF73 (373-395aa.) This study
pFOM228 pGBK-RC plus GBD-SGF73 (378-394aa.) This study
pFOM229 pGBK-RC plus GBD-SGF73 (373-394aa.) This study
pFOM593 p404-GBD-SGF73-3xFLAG This study
pFOM594 p404-GBD-sgf73 (373-402aa)-3xFLAG This study
pFOM595 p404-GBD-SGF73Δ373-402aa-3xFLAG This study
pFOM362 p415-GCN5 This study
pFOM363 p415-gcn5E173H This study
pFOM364 p415-gcn5F221A This study
pRS415 Centromeric plasmid, LEU2 This study
pFOM153 p404-3xFLAG This study
pFOM596 pGBK-RC plus GBD-sgf73Δ373-402aa This study
pFOM714 pRS405-G196-SPT7 This study
pFOM717 pRS405-SPT7 (1-1333aa)-G196 This study
pFOM716 pRS405-SPT7 (1-1142aa)-G196 This study
pFOM713 pRS405-G196-Nterminal This study
pFOM712 pRS405-G196-Cterminal This study
pGBK-RC GBD only (Ito et al., 2000)
pFOM582 p404-GBD-3xFLAG This study
19
Table. 2.3 Primers lists
Primer name Primer sequence
210-SGF73(207)-Rv CAAAGGATCTTCAATGAGTTGTGCATTC
211-SGF73(442)-F AACGACGACAACGAAGATGATGATGA
212-SGF73(627)-Rv GGAAGAGCTGAAGGTTTGAGGAG
213-SGF73(847)-F GGTGCAGCTGCTGAGAAACG
214-SGF73pro-379-F GTAAGACCTCATCGAGCCATCTATAG
215-SGF73ter+213-Rv GTATTCGCTCTCTCCTACCCTTAT
216-SGF73pro-686-F GGAGGAAACAGGCATTTCATGCAA
217-SGF73ter+376-Rv CCTTGGGAAATATTCGGTATTTCATTCTC
220-SGF73(678)-Rv TAAATGCTTTTCAGTTGGGTTTCTTTGTTTGAC
221-SGF73(817)-F GATTATCATAGAGAACATCAAACAAAAATTGGTGC
222-SGF73(813)-Rv TAGCAAGACGTCGTAGGGCTTG
223-SGF73(816)-Rv TGCTAGCAAGACGTCGTAGGG
224-SGF73(1205)-F CAGGATATACATCTCCAGGTTACGGT
227-SGF73(1207)-F GGATATACATCTCCAGGTTACGGTG
228-SGF73(301)-F GCATCTGGAAAAAGTAGCACAGATCC
257-SGF73-HI(1006)F ATGGTGGatccAGTACTGTACACAATGGTAACAAT
258-SGF73-(1206)PstIRv TGGAGcTGcAgATCaTGGTTTCACAGAAAAG
263-SGF73-HI(817)F TCTTGggAtCcGATTATCATAGAGAACATCAAACA
264-SGF73-(1375)PstIRv AGAAGCTGcagCTaTAGAGCTCTCTGTTGTTGTA
358-51-KanMX(Rv)-611 CCATCTCATCTGTAACATCATTGGC
359-52KanMX(F)-950 GTTGAACAAGTCTGGAAAGAAATGCATAAG
498-SGF73(352)BamHI-F GACACGgatcCCTAACTCCTGAAGAGGAAACAA
499-SGF73(356)StPstI-Rv AACCTcTGcaGTTTaCTCTTCAGGAGTTAGGTTAA
500-SGF73(357)BamHI-F CTCCTGgAtccGAAACAACACAGGTTCTAAATGGG
501-SGF73(372)StPstI-Rv ACCGTctgCagTtaTGGCAGTGGGAAAGATCGG
502-SGF73(373)BamHI-F TCCCAggatCcCTAGAGTCAACGGTACTATCGTC
503-SGF73(385)StPstI-Rv ATTCTctgcagTTaAGTCCTGTATCTAACTGACGA
504-SGF73(386)BamHI-F GATACgGatCcAAATATTTTAGAATGAGGGAAATG
505-SGF73(395)StPstI-Rv CACAGctgcaGAttAAGCAAACATTTCCCTCATTC
522-SGF73(378-388)-F gatccCTATCGTCAGTTAGATACAGGACTAAATATTTTtGAcTGca
523-SGF73(378-388)-Rv gTCaAAAATATTTAGTCCTGTATCTAACTGACGATAGg
524-SGF73(378-386)-F gatccCTATCGTCAGTTAGATACAGGACTAAATAacTGca
525-SGF73(378-386)-Rv gtTATTTAGTCCTGTATCTAACTGACGATAGg
526-SGF73(382-392)-F gatccAGATACAGGACTAAATATTTTAGAATGAGGGAAtaGcTgca
527-SGF73(382-392)-Rv gCtaTTCCCTCATTCTAAAATATTTAGTCCTGTATCTg
528-SGF73(378)BamHI-F AGTCAggatccCTATCGTCAGTTAGATACA
529-SGF73(394)PstI-Rv GAAAActgcagttaAAACATTTCCCTCATTCTAAA
530-SGF73(382-389)-F gatccAGATACAGGACTAAATATTTTAGAtaGctGcA
531-SGF73(382-389)-Rv gCtaTCTAAAATATTTAGTCCTGTATCTg
308-SGF73-F CATCTATGGAATCTGCGAACACA
309-SGF73-Rv TTGAGGAGTCCCAGTTTTCGA
20
2.2.2 Methods:
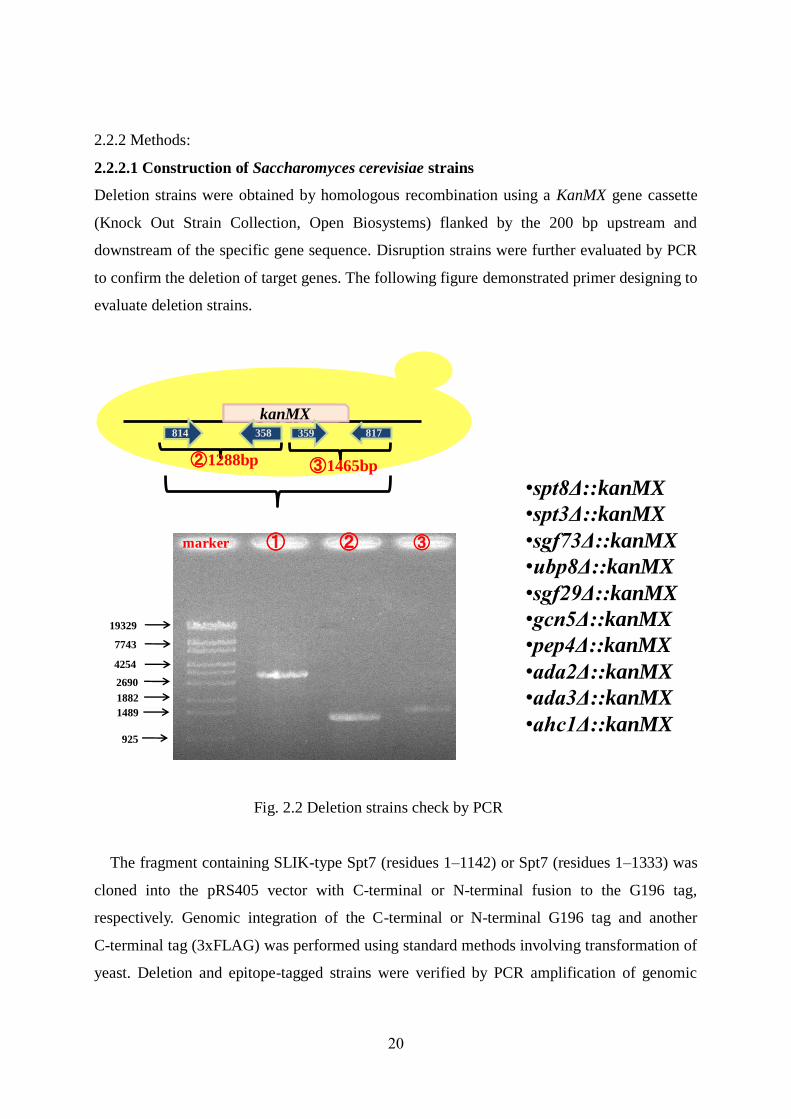
2.2.2.1 Construction of Saccharomyces cerevisiae strains
Deletion strains were obtained by homologous recombination using a KanMX gene cassette
(Knock Out Strain Collection, Open Biosystems) flanked by the 200 bp upstream and
downstream of the specific gene sequence. Disruption strains were further evaluated by PCR
to confirm the deletion of target genes. The following figure demonstrated primer designing to
evaluate deletion strains.
Fig. 2.2 Deletion strains check by PCR
The fragment containing SLIK-type Spt7 (residues 1–1142) or Spt7 (residues 1–1333) was
cloned into the pRS405 vector with C-terminal or N-terminal fusion to the G196 tag,
respectively. Genomic integration of the C-terminal or N-terminal G196 tag and another
C-terminal tag (3xFLAG) was performed using standard methods involving transformation of
yeast. Deletion and epitope-tagged strains were verified by PCR amplification of genomic
GENEkanMX358 817359814
③1465bp②1288bp
19329
7743
4254
2690
1882
1489
925
① ②marker ③
•spt8Δ::kanMX
•spt3Δ::kanMX
•sgf73Δ::kanMX
•ubp8Δ::kanMX
•sgf29Δ::kanMX
•gcn5Δ::kanMX
•pep4Δ::kanMX
•ada2Δ::kanMX
•ada3Δ::kanMX
•ahc1Δ::kanMX
21
DNA and Western blot analysis, respectively. The genotypes of the strains used in this study
are listed in Table 2.1
2.2.2.2 Plasmid construction
Conventional methods were used to construct plasmids from the pGBK-RC plasmid for
domain analysis. The coding sequences of SGF73 were amplified from yeast genomic DNA
using primers containing a 5’ BamHI site and a 3’ PstI site. For domain analysis, target amino
acid-inserted and -deleted fragments were obtained by PCR amplification. DNA fragments
were then separated using agarose gels and purified using a GFXTM
PCR DNA and Gel
Purification Kit (GE). The purified PCR product was cloned into the pGBK-RC plasmid (Ito
et al. 2000). Phosphorylated primer pairs against sequences just outside the target domain
were designed and the rest of the plasmid was amplified and ligated, effectively deleting the
target amino acids. TaKaRa EX Taq™ (TaKaRa) and KOD-FX (TOYOBO) DNA polymerase
were used to amplify DNA fragments from the template plasmid. The sequences of the
inserted and deleted fragments were verified by restriction endonuclease digestion and DNA
sequencing. The primers used for domain analysis are listed in Table 2.3 and the plasmids
used in this study are listed in Table 2.2.
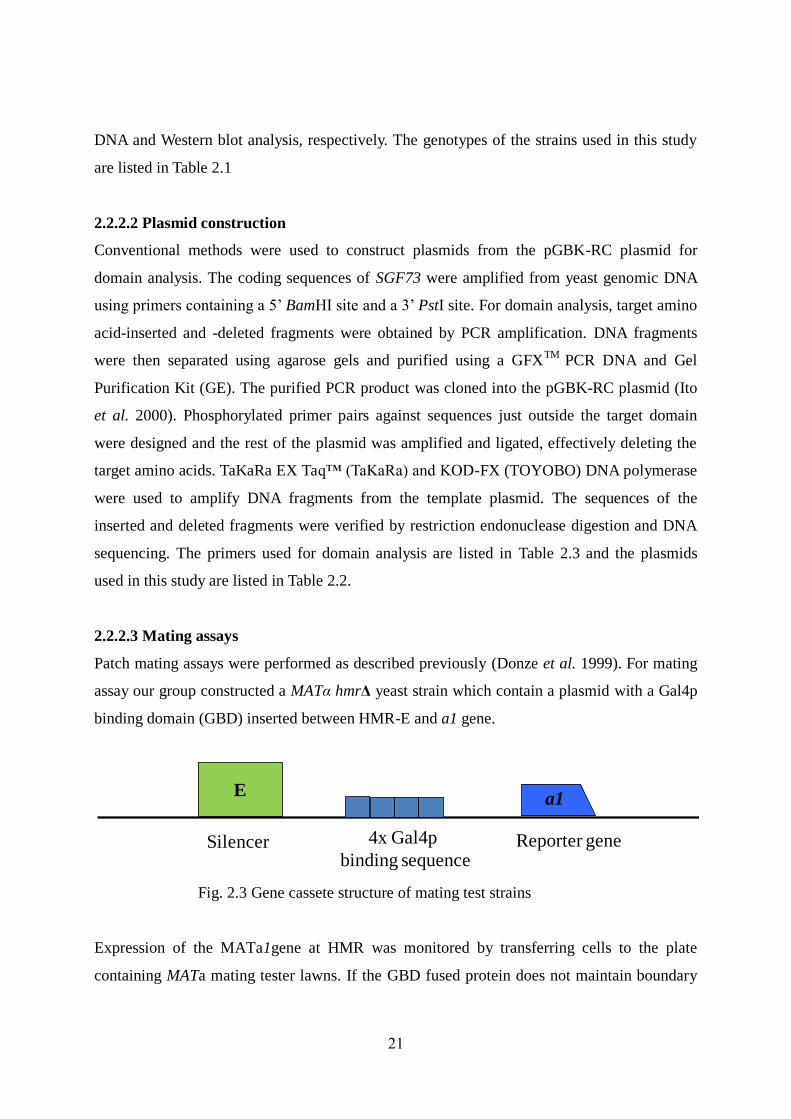
2.2.2.3 Mating assays
Patch mating assays were performed as described previously (Donze et al. 1999). For mating
assay our group constructed a MATα hmrΔ yeast strain which contain a plasmid with a Gal4p
binding domain (GBD) inserted between HMR-E and a1 gene.
Fig. 2.3 Gene cassete structure of mating test strains
Expression of the MATa1gene at HMR was monitored by transferring cells to the plate
containing MATa mating tester lawns. If the GBD fused protein does not maintain boundary
a1E
4x Gal4p
binding sequenceReporter geneSilencer
22
function, MATa1 gene at HMR is repressed resulting the MATα cell is capable of mating with
a MATa cell and form diploid colony on selective plates. In the presence of a barrier blocked
the spread of silencing. As a result the MATa1 gene at HMR is expressed and loss of mating
ability. Patches of the appropriate strains were grown on YMD plates (lacking tryptophan) for
2–3 days at 30°C. To monitor the mating ability of the cells, single colonies were transferred
to YMD plates with adenine- and leucine-containing mating tester lawns (JRY19a) and grown
to an OD600 of 2.0. For diploid colonies, the cells were allowed to grow at 30°C for 48 hours
prior to photography. To perform this analysis, GBD-Sgf73 was carried between the HMR-E
silencer and the a1 gene and monitor expression of a1 gene by the mating assay.
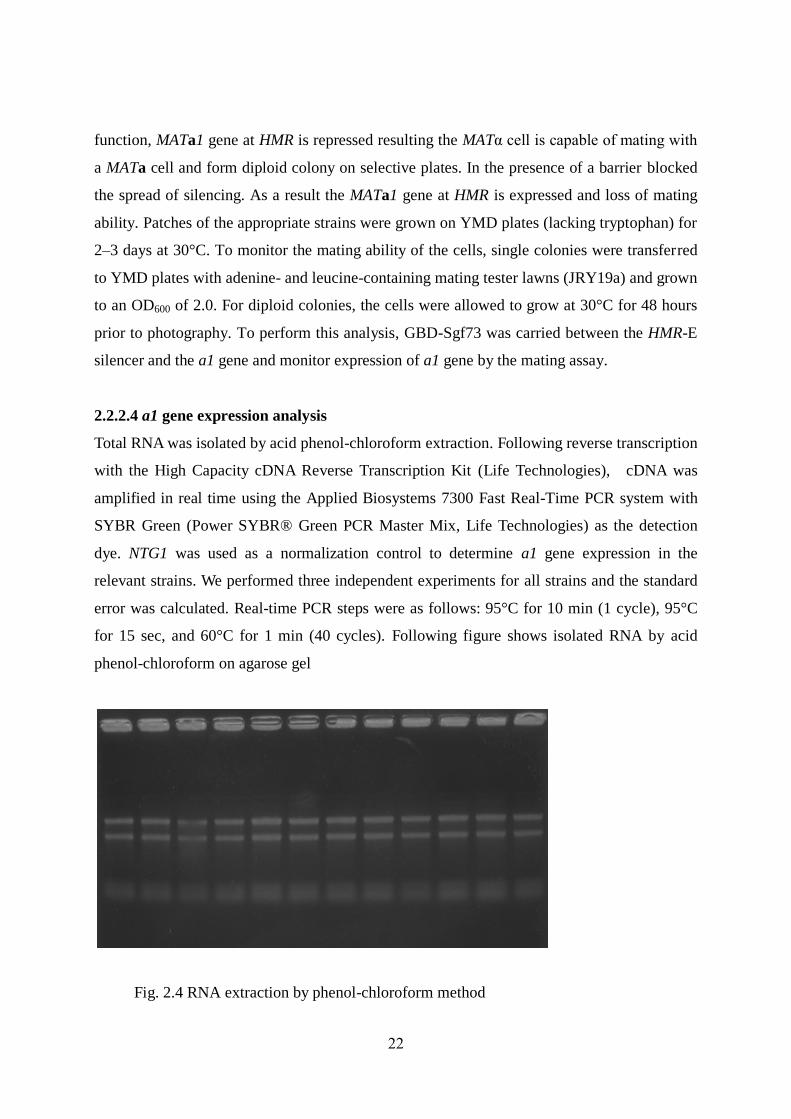
2.2.2.4 a1 gene expression analysis
Total RNA was isolated by acid phenol-chloroform extraction. Following reverse transcription
with the High Capacity cDNA Reverse Transcription Kit (Life Technologies), cDNA was
amplified in real time using the Applied Biosystems 7300 Fast Real-Time PCR system with
SYBR Green (Power SYBR® Green PCR Master Mix, Life Technologies) as the detection
dye. NTG1 was used as a normalization control to determine a1 gene expression in the
relevant strains. We performed three independent experiments for all strains and the standard
error was calculated. Real-time PCR steps were as follows: 95°C for 10 min (1 cycle), 95°C
for 15 sec, and 60°C for 1 min (40 cycles). Following figure shows isolated RNA by acid
phenol-chloroform on agarose gel
Fig. 2.4 RNA extraction by phenol-chloroform method
23
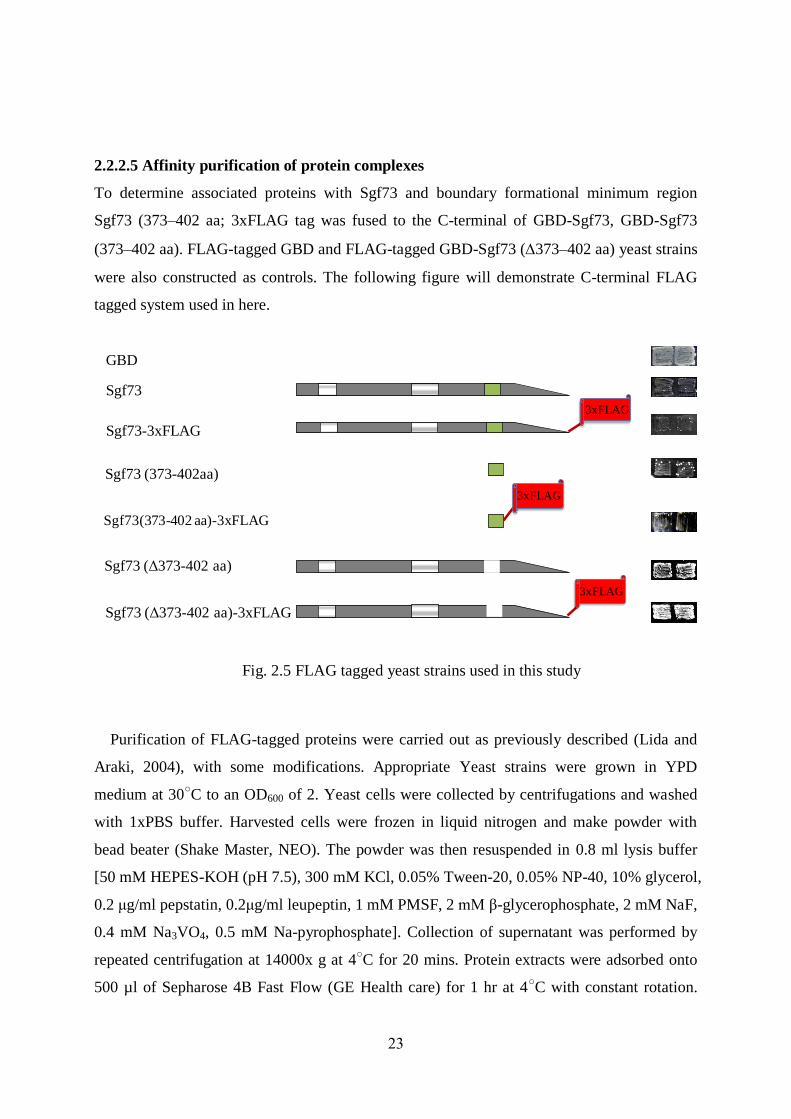
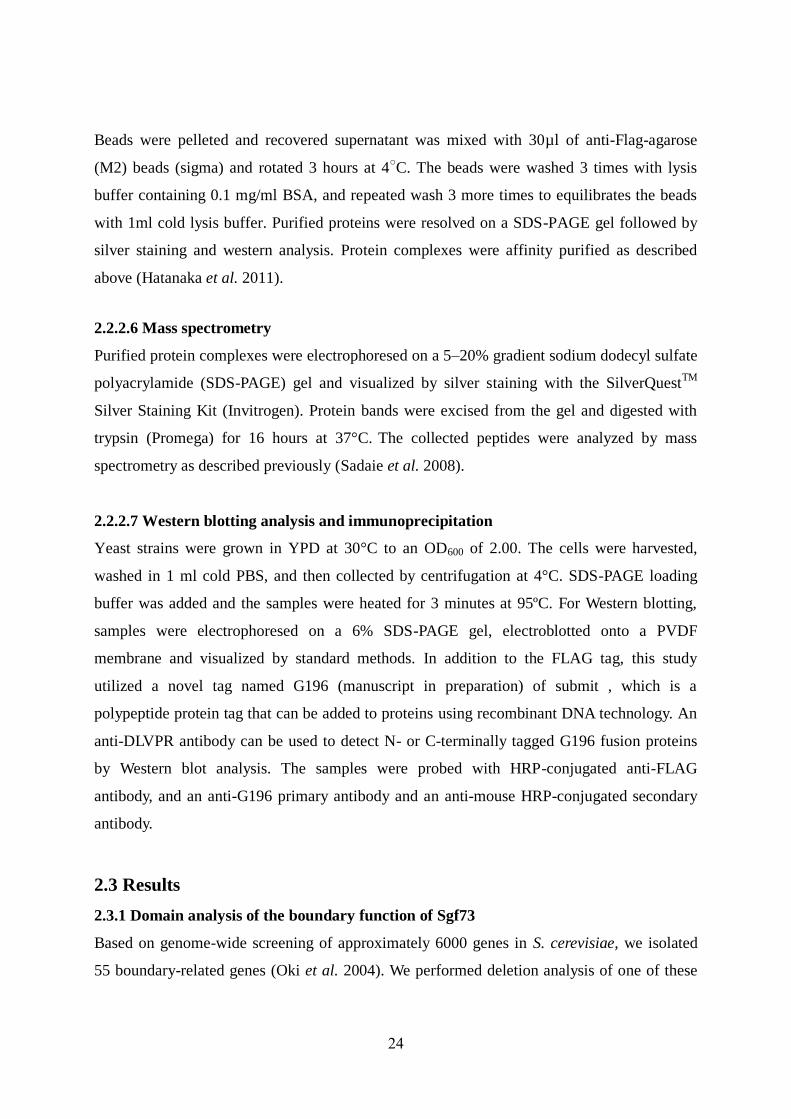
2.2.2.5 Affinity purification of protein complexes
To determine associated proteins with Sgf73 and boundary formational minimum region
Sgf73 (373–402 aa; 3xFLAG tag was fused to the C-terminal of GBD-Sgf73, GBD-Sgf73
(373–402 aa). FLAG-tagged GBD and FLAG-tagged GBD-Sgf73 (373–402 aa) yeast strains
were also constructed as controls. The following figure will demonstrate C-terminal FLAG
tagged system used in here.
Fig. 2.5 FLAG tagged yeast strains used in this study
Purification of FLAG-tagged proteins were carried out as previously described (Lida and
Araki, 2004), with some modifications. Appropriate Yeast strains were grown in YPD
medium at 30○C to an OD600 of 2. Yeast cells were collected by centrifugations and washed
with 1xPBS buffer. Harvested cells were frozen in liquid nitrogen and make powder with
bead beater (Shake Master, NEO). The powder was then resuspended in 0.8 ml lysis buffer
[50 mM HEPES-KOH (pH 7.5), 300 mM KCl, 0.05% Tween-20, 0.05% NP-40, 10% glycerol,
0.2 μg/ml pepstatin, 0.2μg/ml leupeptin, 1 mM PMSF, 2 mM β-glycerophosphate, 2 mM NaF,
0.4 mM Na3VO4, 0.5 mM Na-pyrophosphate]. Collection of supernatant was performed by
repeated centrifugation at 14000x g at 4○C for 20 mins. Protein extracts were adsorbed onto
500 µl of Sepharose 4B Fast Flow (GE Health care) for 1 hr at 4○C with constant rotation.
3xFLAG
Sgf73-3xFLAG
Sgf73
Sgf73 (373-402aa)
Sgf73(373-402 aa)-3xFLAG
Sgf73 (Δ373-402 aa)-3xFLAG
3xFLAG
3xFLAG
Sgf73 (Δ373-402 aa)
GBD
24
Beads were pelleted and recovered supernatant was mixed with 30µl of anti-Flag-agarose
(M2) beads (sigma) and rotated 3 hours at 4○C. The beads were washed 3 times with lysis
buffer containing 0.1 mg/ml BSA, and repeated wash 3 more times to equilibrates the beads
with 1ml cold lysis buffer. Purified proteins were resolved on a SDS-PAGE gel followed by
silver staining and western analysis. Protein complexes were affinity purified as described
above (Hatanaka et al. 2011).
2.2.2.6 Mass spectrometry
Purified protein complexes were electrophoresed on a 5–20% gradient sodium dodecyl sulfate
polyacrylamide (SDS-PAGE) gel and visualized by silver staining with the SilverQuestTM
Silver Staining Kit (Invitrogen). Protein bands were excised from the gel and digested with
trypsin (Promega) for 16 hours at 37°C. The collected peptides were analyzed by mass
spectrometry as described previously (Sadaie et al. 2008).
2.2.2.7 Western blotting analysis and immunoprecipitation
Yeast strains were grown in YPD at 30°C to an OD600 of 2.00. The cells were harvested,
washed in 1 ml cold PBS, and then collected by centrifugation at 4°C. SDS-PAGE loading
buffer was added and the samples were heated for 3 minutes at 95ºC. For Western blotting,
samples were electrophoresed on a 6% SDS-PAGE gel, electroblotted onto a PVDF
membrane and visualized by standard methods. In addition to the FLAG tag, this study
utilized a novel tag named G196 (manuscript in preparation) of submit , which is a
polypeptide protein tag that can be added to proteins using recombinant DNA technology. An
anti-DLVPR antibody can be used to detect N- or C-terminally tagged G196 fusion proteins
by Western blot analysis. The samples were probed with HRP-conjugated anti-FLAG
antibody, and an anti-G196 primary antibody and an anti-mouse HRP-conjugated secondary
antibody.
2.3 Results
2.3.1 Domain analysis of the boundary function of Sgf73
Based on genome-wide screening of approximately 6000 genes in S. cerevisiae, we isolated
55 boundary-related genes (Oki et al. 2004). We performed deletion analysis of one of these
25
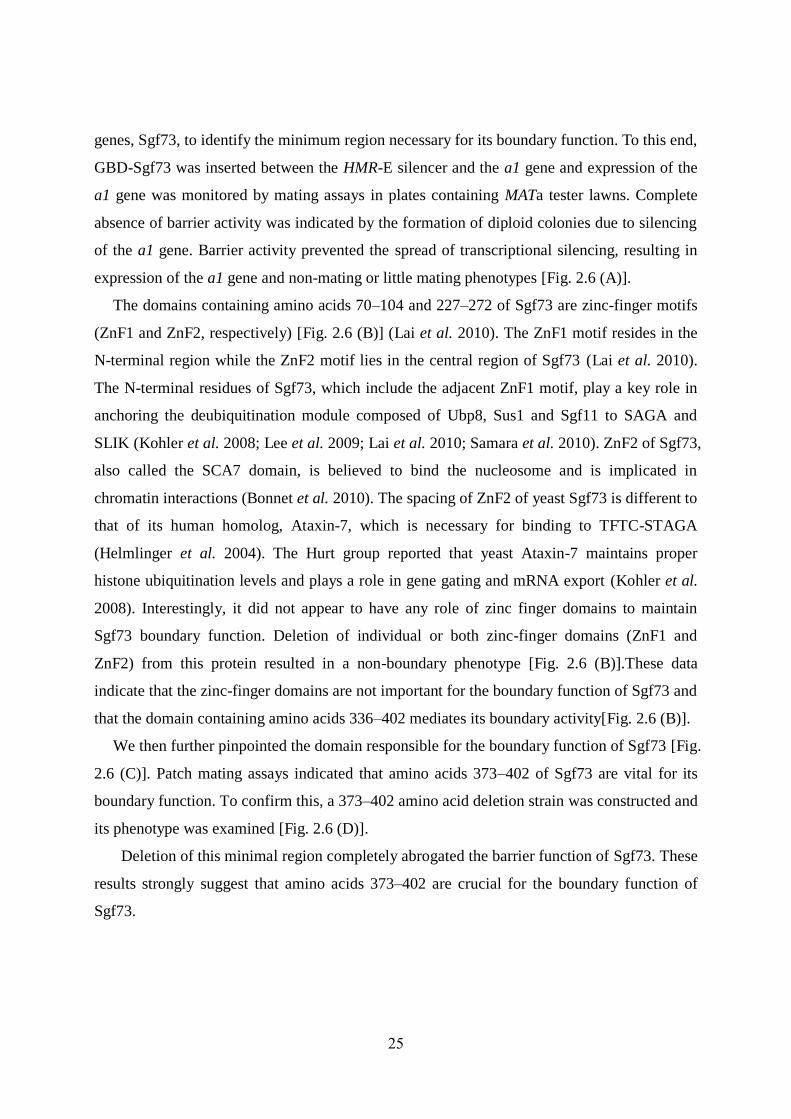
genes, Sgf73, to identify the minimum region necessary for its boundary function. To this end,
GBD-Sgf73 was inserted between the HMR-E silencer and the a1 gene and expression of the
a1 gene was monitored by mating assays in plates containing MATa tester lawns. Complete
absence of barrier activity was indicated by the formation of diploid colonies due to silencing
of the a1 gene. Barrier activity prevented the spread of transcriptional silencing, resulting in
expression of the a1 gene and non-mating or little mating phenotypes [Fig. 2.6 (A)].
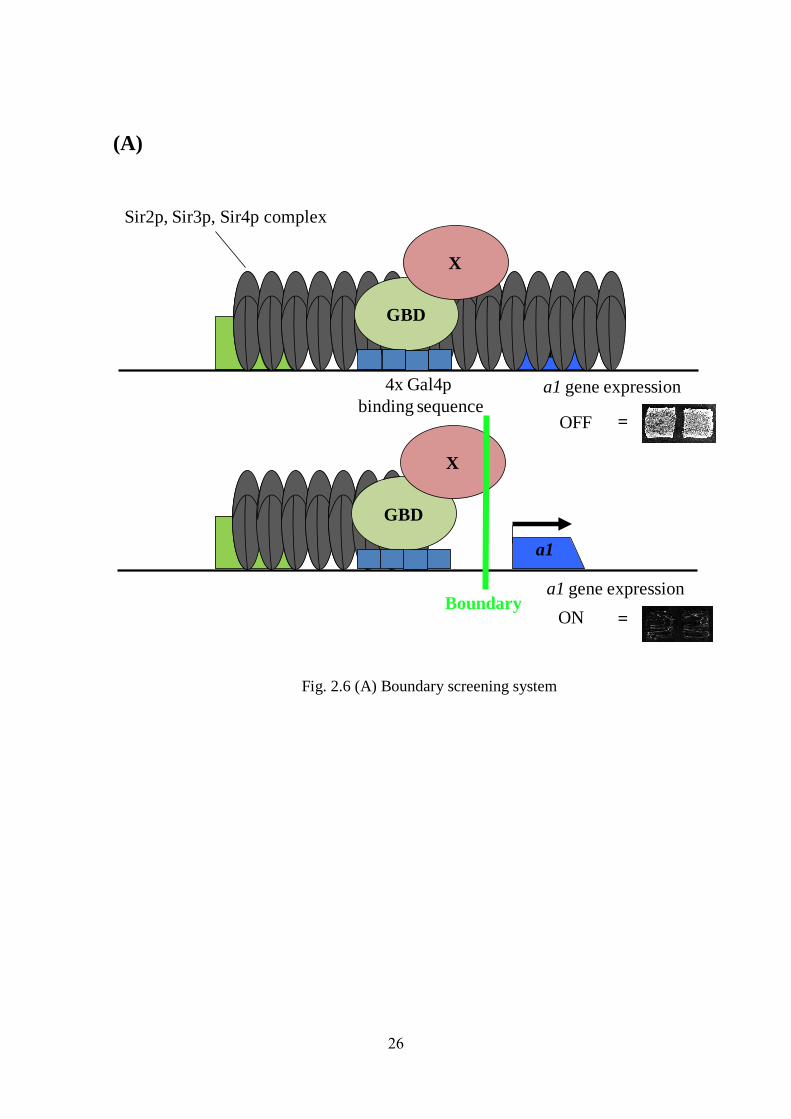
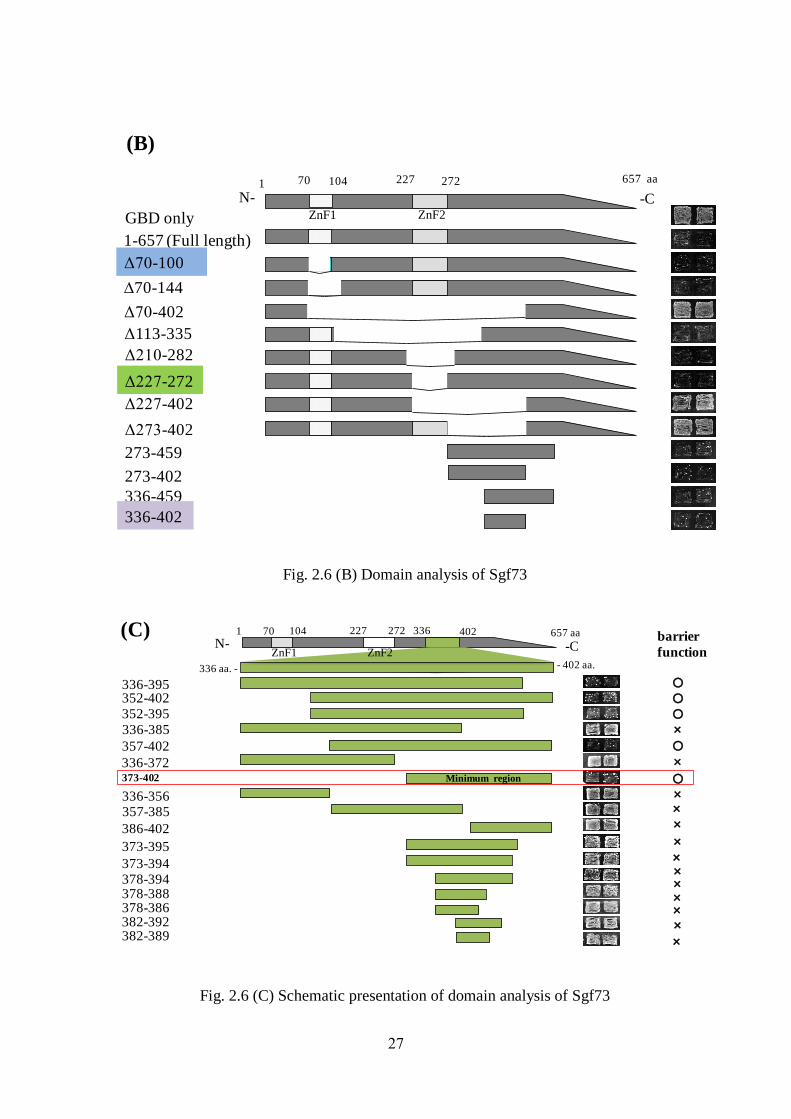
The domains containing amino acids 70–104 and 227–272 of Sgf73 are zinc-finger motifs
(ZnF1 and ZnF2, respectively) [Fig. 2.6 (B)] (Lai et al. 2010). The ZnF1 motif resides in the
N-terminal region while the ZnF2 motif lies in the central region of Sgf73 (Lai et al. 2010).
The N-terminal residues of Sgf73, which include the adjacent ZnF1 motif, play a key role in
anchoring the deubiquitination module composed of Ubp8, Sus1 and Sgf11 to SAGA and
SLIK (Kohler et al. 2008; Lee et al. 2009; Lai et al. 2010; Samara et al. 2010). ZnF2 of Sgf73,
also called the SCA7 domain, is believed to bind the nucleosome and is implicated in
chromatin interactions (Bonnet et al. 2010). The spacing of ZnF2 of yeast Sgf73 is different to
that of its human homolog, Ataxin-7, which is necessary for binding to TFTC-STAGA
(Helmlinger et al. 2004). The Hurt group reported that yeast Ataxin-7 maintains proper
histone ubiquitination levels and plays a role in gene gating and mRNA export (Kohler et al.
2008). Interestingly, it did not appear to have any role of zinc finger domains to maintain
Sgf73 boundary function. Deletion of individual or both zinc-finger domains (ZnF1 and
ZnF2) from this protein resulted in a non-boundary phenotype [Fig. 2.6 (B)].These data
indicate that the zinc-finger domains are not important for the boundary function of Sgf73 and
that the domain containing amino acids 336–402 mediates its boundary activity[Fig. 2.6 (B)].
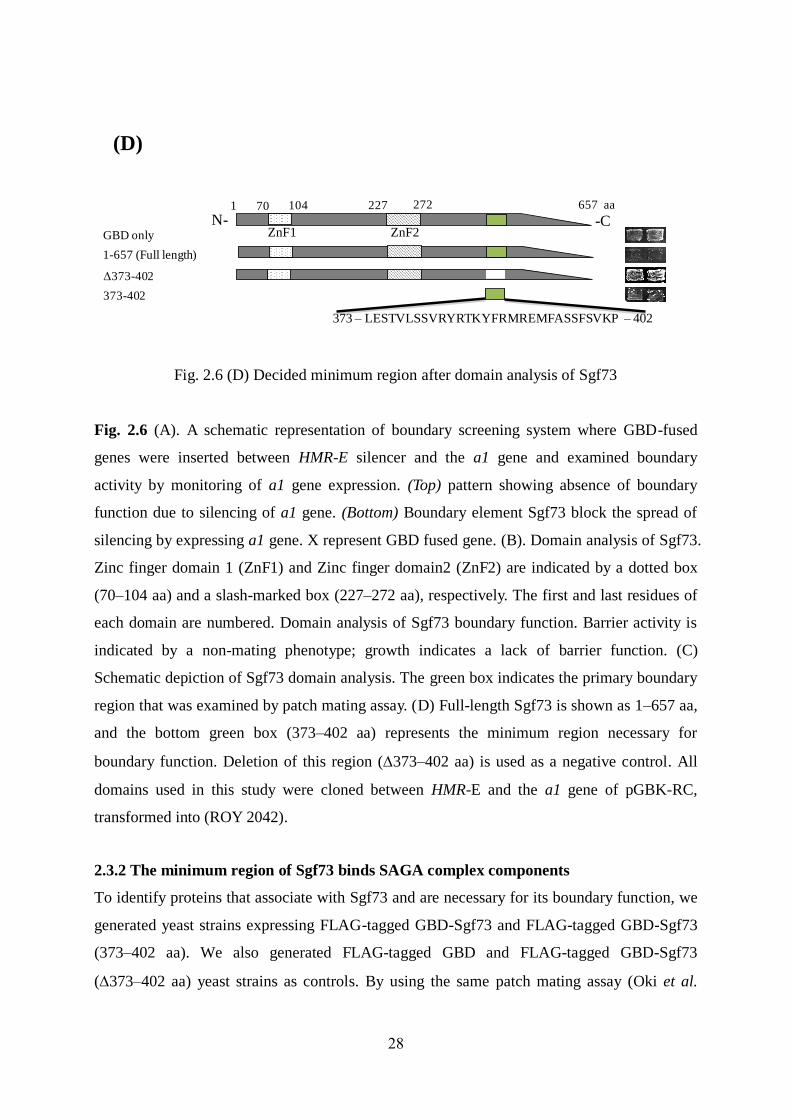
We then further pinpointed the domain responsible for the boundary function of Sgf73 [Fig.
2.6 (C)]. Patch mating assays indicated that amino acids 373–402 of Sgf73 are vital for its
boundary function. To confirm this, a 373–402 amino acid deletion strain was constructed and
its phenotype was examined [Fig. 2.6 (D)].
Deletion of this minimal region completely abrogated the barrier function of Sgf73. These
results strongly suggest that amino acids 373–402 are crucial for the boundary function of
Sgf73.
26
(A)
Fig. 2.6 (A) Boundary screening system
a1
4x Gal4p
binding sequence
E
Sir2p, Sir3p, Sir4p complex
OFF
GBD
X
E
ON
GBD
X
Boundary
a1
=
=
a1 gene expression
a1 gene expression
27
(B)
Fig. 2.6 (B) Domain analysis of Sgf73
Fig. 2.6 (C) Schematic presentation of domain analysis of Sgf73
Δ210-282
Δ227-272
Δ273-402
Δ70-402
336-459
GBD only
1-657 (Full length)
70-144
Δ70-100
Δ113-335
Δ227-402
273-459
273-402
336-402
N- -C1 227 272 657 aa70 104
ZnF1 ZnF2
336-395352-402
352-395
336-385
357-402
336-372373-402
336-356357-385
386-402
373-395
378-388378-386382-392382-389
373-394
378-394
336 aa. - - 402 aa.
1
N- -C
227 272 657 aa336 40270 104barrier
function
○
○
○
○
○
×
×
××
×
×
×
×
×
××××
ZnF1 ZnF2
Minimum region
(C)
28
(D)
Fig. 2.6 (D) Decided minimum region after domain analysis of Sgf73
Fig. 2.6 (A). A schematic representation of boundary screening system where GBD-fused
genes were inserted between HMR-E silencer and the a1 gene and examined boundary
activity by monitoring of a1 gene expression. (Top) pattern showing absence of boundary
function due to silencing of a1 gene. (Bottom) Boundary element Sgf73 block the spread of
silencing by expressing a1 gene. X represent GBD fused gene. (B). Domain analysis of Sgf73.
Zinc finger domain 1 (ZnF1) and Zinc finger domain2 (ZnF2) are indicated by a dotted box
(70–104 aa) and a slash-marked box (227–272 aa), respectively. The first and last residues of
each domain are numbered. Domain analysis of Sgf73 boundary function. Barrier activity is
indicated by a non-mating phenotype; growth indicates a lack of barrier function. (C)
Schematic depiction of Sgf73 domain analysis. The green box indicates the primary boundary
region that was examined by patch mating assay. (D) Full-length Sgf73 is shown as 1–657 aa,
and the bottom green box (373–402 aa) represents the minimum region necessary for
boundary function. Deletion of this region (373–402 aa) is used as a negative control. All
domains used in this study were cloned between HMR-E and the a1 gene of pGBK-RC,
transformed into (ROY 2042).
2.3.2 The minimum region of Sgf73 binds SAGA complex components
To identify proteins that associate with Sgf73 and are necessary for its boundary function, we
generated yeast strains expressing FLAG-tagged GBD-Sgf73 and FLAG-tagged GBD-Sgf73
(373–402 aa). We also generated FLAG-tagged GBD and FLAG-tagged GBD-Sgf73
(373–402 aa) yeast strains as controls. By using the same patch mating assay (Oki et al.
1-657 (Full length)
GBD only
Δ373-402
373-402
373 – LESTVLSSVRYRTKYFRMREMFASSFSVKP – 402
N- -C1 227 272 657 aa70 104
ZnF1 ZnF2
29
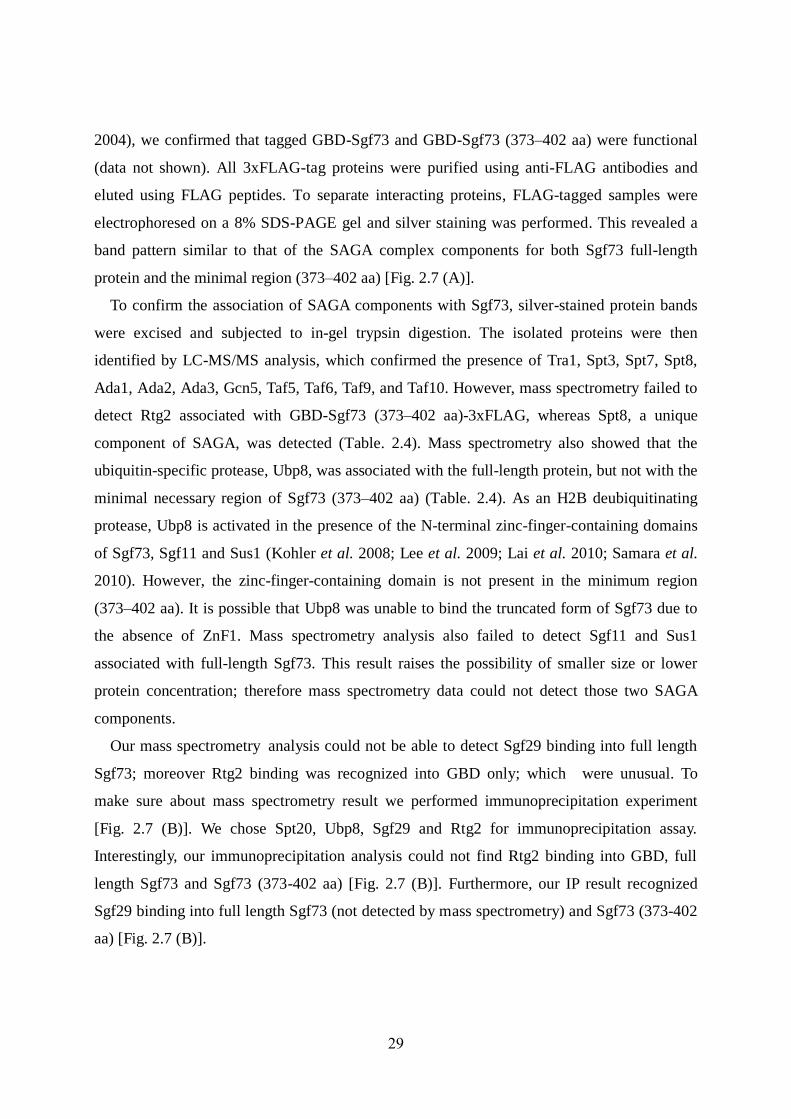
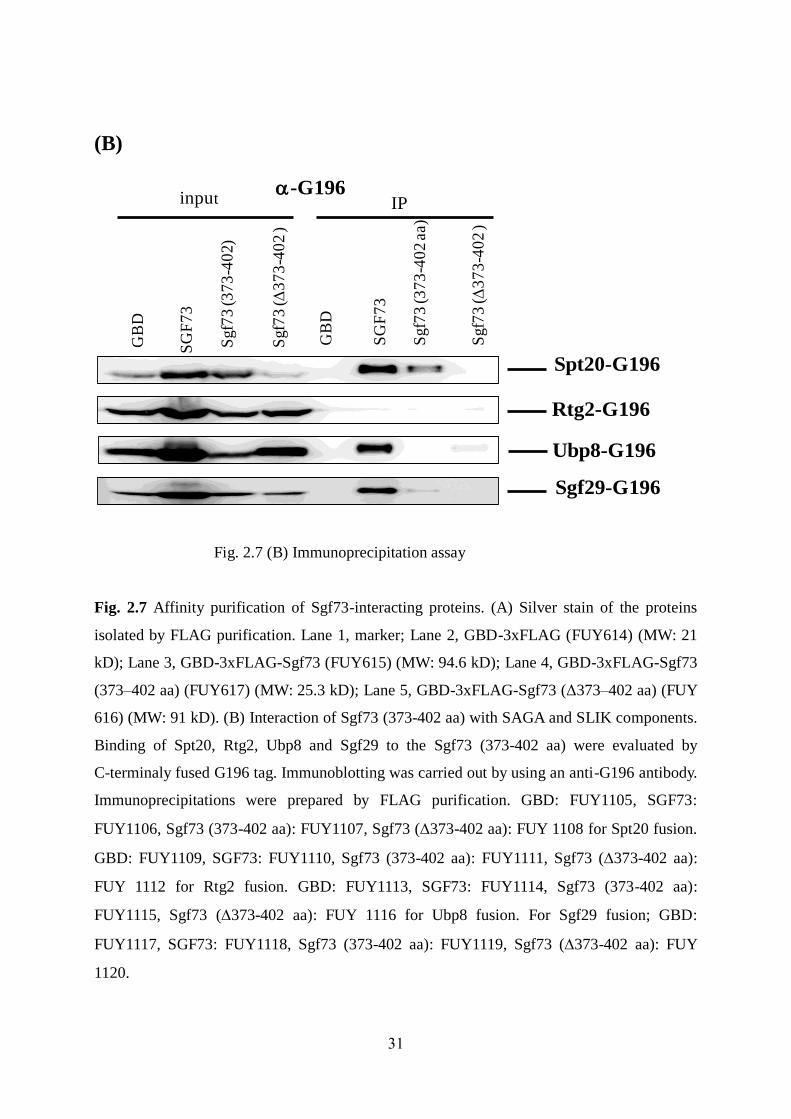
2004), we confirmed that tagged GBD-Sgf73 and GBD-Sgf73 (373–402 aa) were functional
(data not shown). All 3xFLAG-tag proteins were purified using anti-FLAG antibodies and
eluted using FLAG peptides. To separate interacting proteins, FLAG-tagged samples were
electrophoresed on a 8% SDS-PAGE gel and silver staining was performed. This revealed a
band pattern similar to that of the SAGA complex components for both Sgf73 full-length
protein and the minimal region (373–402 aa) [Fig. 2.7 (A)].
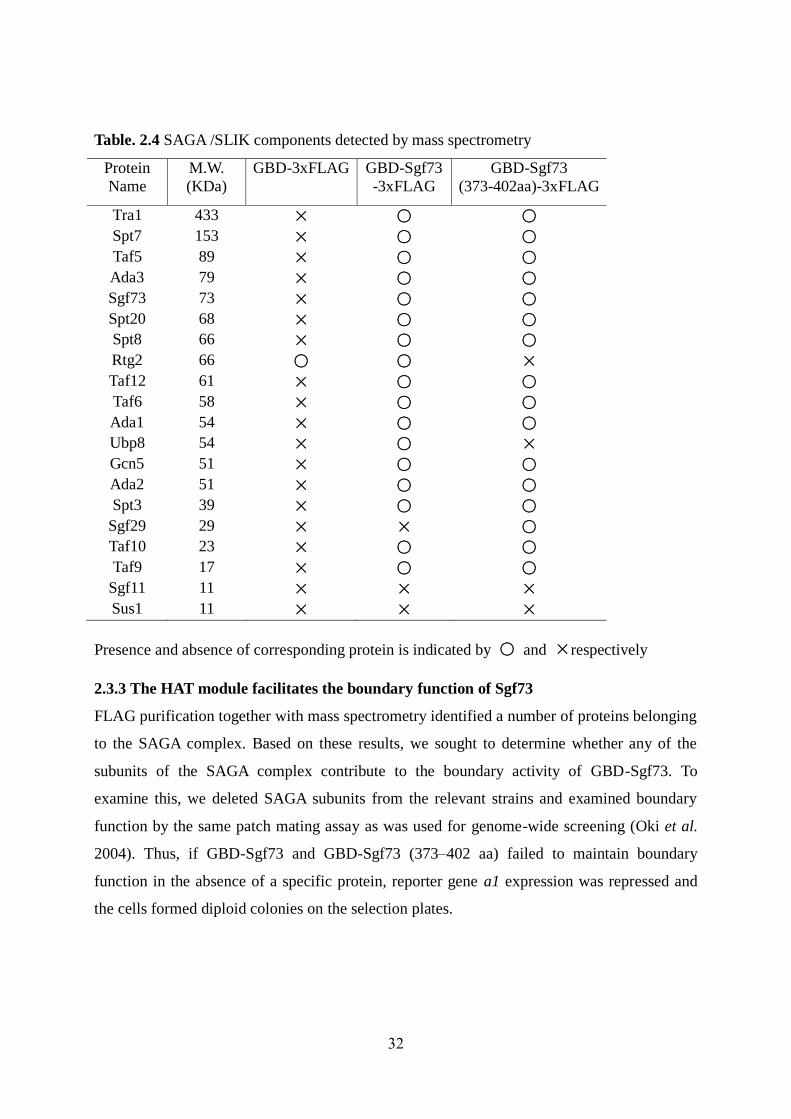
To confirm the association of SAGA components with Sgf73, silver-stained protein bands
were excised and subjected to in-gel trypsin digestion. The isolated proteins were then
identified by LC-MS/MS analysis, which confirmed the presence of Tra1, Spt3, Spt7, Spt8,
Ada1, Ada2, Ada3, Gcn5, Taf5, Taf6, Taf9, and Taf10. However, mass spectrometry failed to
detect Rtg2 associated with GBD-Sgf73 (373–402 aa)-3xFLAG, whereas Spt8, a unique
component of SAGA, was detected (Table. 2.4). Mass spectrometry also showed that the
ubiquitin-specific protease, Ubp8, was associated with the full-length protein, but not with the
minimal necessary region of Sgf73 (373–402 aa) (Table. 2.4). As an H2B deubiquitinating
protease, Ubp8 is activated in the presence of the N-terminal zinc-finger-containing domains
of Sgf73, Sgf11 and Sus1 (Kohler et al. 2008; Lee et al. 2009; Lai et al. 2010; Samara et al.
2010). However, the zinc-finger-containing domain is not present in the minimum region
(373–402 aa). It is possible that Ubp8 was unable to bind the truncated form of Sgf73 due to
the absence of ZnF1. Mass spectrometry analysis also failed to detect Sgf11 and Sus1
associated with full-length Sgf73. This result raises the possibility of smaller size or lower
protein concentration; therefore mass spectrometry data could not detect those two SAGA
components.
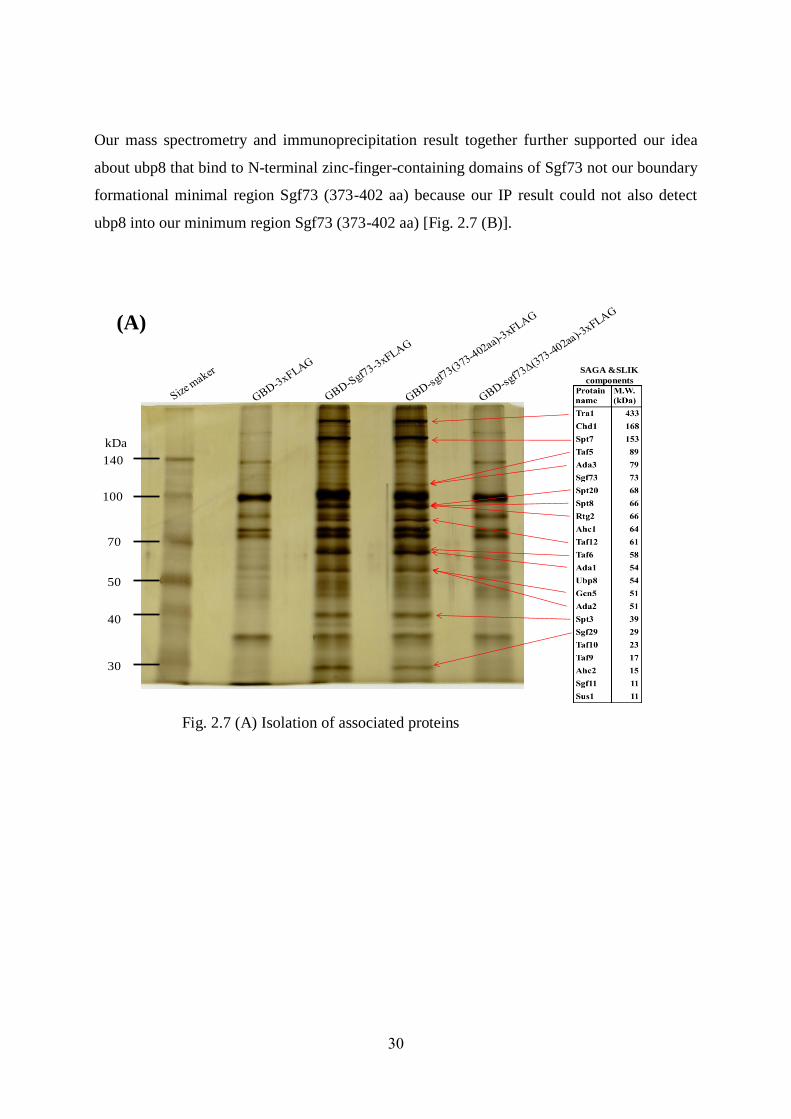
Our mass spectrometry analysis could not be able to detect Sgf29 binding into full length
Sgf73; moreover Rtg2 binding was recognized into GBD only; which were unusual. To
make sure about mass spectrometry result we performed immunoprecipitation experiment
[Fig. 2.7 (B)]. We chose Spt20, Ubp8, Sgf29 and Rtg2 for immunoprecipitation assay.
Interestingly, our immunoprecipitation analysis could not find Rtg2 binding into GBD, full
length Sgf73 and Sgf73 (373-402 aa) [Fig. 2.7 (B)]. Furthermore, our IP result recognized
Sgf29 binding into full length Sgf73 (not detected by mass spectrometry) and Sgf73 (373-402
aa) [Fig. 2.7 (B)].
30
Our mass spectrometry and immunoprecipitation result together further supported our idea
about ubp8 that bind to N-terminal zinc-finger-containing domains of Sgf73 not our boundary
formational minimal region Sgf73 (373-402 aa) because our IP result could not also detect
ubp8 into our minimum region Sgf73 (373-402 aa) [Fig. 2.7 (B)].
Fig. 2.7 (A) Isolation of associated proteins
140
kDa
100
70
50
40
30
SAGA &SLIK
components
(A)
31
(B)
Fig. 2.7 (B) Immunoprecipitation assay
Fig. 2.7 Affinity purification of Sgf73-interacting proteins. (A) Silver stain of the proteins
isolated by FLAG purification. Lane 1, marker; Lane 2, GBD-3xFLAG (FUY614) (MW: 21
kD); Lane 3, GBD-3xFLAG-Sgf73 (FUY615) (MW: 94.6 kD); Lane 4, GBD-3xFLAG-Sgf73
(373–402 aa) (FUY617) (MW: 25.3 kD); Lane 5, GBD-3xFLAG-Sgf73 (Δ373–402 aa) (FUY
616) (MW: 91 kD). (B) Interaction of Sgf73 (373-402 aa) with SAGA and SLIK components.
Binding of Spt20, Rtg2, Ubp8 and Sgf29 to the Sgf73 (373-402 aa) were evaluated by
C-terminaly fused G196 tag. Immunoblotting was carried out by using an anti-G196 antibody.
Immunoprecipitations were prepared by FLAG purification. GBD: FUY1105, SGF73:
FUY1106, Sgf73 (373-402 aa): FUY1107, Sgf73 (373-402 aa): FUY 1108 for Spt20 fusion.
GBD: FUY1109, SGF73: FUY1110, Sgf73 (373-402 aa): FUY1111, Sgf73 (373-402 aa):
FUY 1112 for Rtg2 fusion. GBD: FUY1113, SGF73: FUY1114, Sgf73 (373-402 aa):
FUY1115, Sgf73 (373-402 aa): FUY 1116 for Ubp8 fusion. For Sgf29 fusion; GBD:
FUY1117, SGF73: FUY1118, Sgf73 (373-402 aa): FUY1119, Sgf73 (373-402 aa): FUY
1120.
Rtg2-G196
Ubp8-G196
Sgf29-G196
Spt20-G196
SG
F7
3input
GB
D
SG
F7
3
IP
GB
D
Sgf7
3 (3
73
-40
2)
Sgf7
3 (
37
3-4
02 )
Sgf7
3 (3
73
-40
2 a
a)
Sgf7
3 (
37
3-4
02 )
a-G196
32
Table. 2.4 SAGA /SLIK components detected by mass spectrometry
Protein
Name
M.W.
(KDa)
GBD-3xFLAG GBD-Sgf73
-3xFLAG
GBD-Sgf73
(373-402aa)-3xFLAG
Tra1 433 × ○ ○
Spt7 153 × ○ ○
Taf5 89 × ○ ○
Ada3 79 × ○ ○
Sgf73 73 × ○ ○
Spt20 68 × ○ ○
Spt8 66 × ○ ○
Rtg2 66 ○ ○ ×
Taf12 61 × ○ ○
Taf6 58 × ○ ○
Ada1 54 × ○ ○
Ubp8 54 × ○ ×
Gcn5 51 × ○ ○
Ada2 51 × ○ ○
Spt3 39 × ○ ○
Sgf29 29 × × ○
Taf10 23 × ○ ○
Taf9 17 × ○ ○
Sgf11 11 × × ×
Sus1 11 × × ×
Presence and absence of corresponding protein is indicated by ○ and ×respectively
2.3.3 The HAT module facilitates the boundary function of Sgf73
FLAG purification together with mass spectrometry identified a number of proteins belonging
to the SAGA complex. Based on these results, we sought to determine whether any of the
subunits of the SAGA complex contribute to the boundary activity of GBD-Sgf73. To
examine this, we deleted SAGA subunits from the relevant strains and examined boundary
function by the same patch mating assay as was used for genome-wide screening (Oki et al.
2004). Thus, if GBD-Sgf73 and GBD-Sgf73 (373–402 aa) failed to maintain boundary
function in the absence of a specific protein, reporter gene a1 expression was repressed and
the cells formed diploid colonies on the selection plates.
33
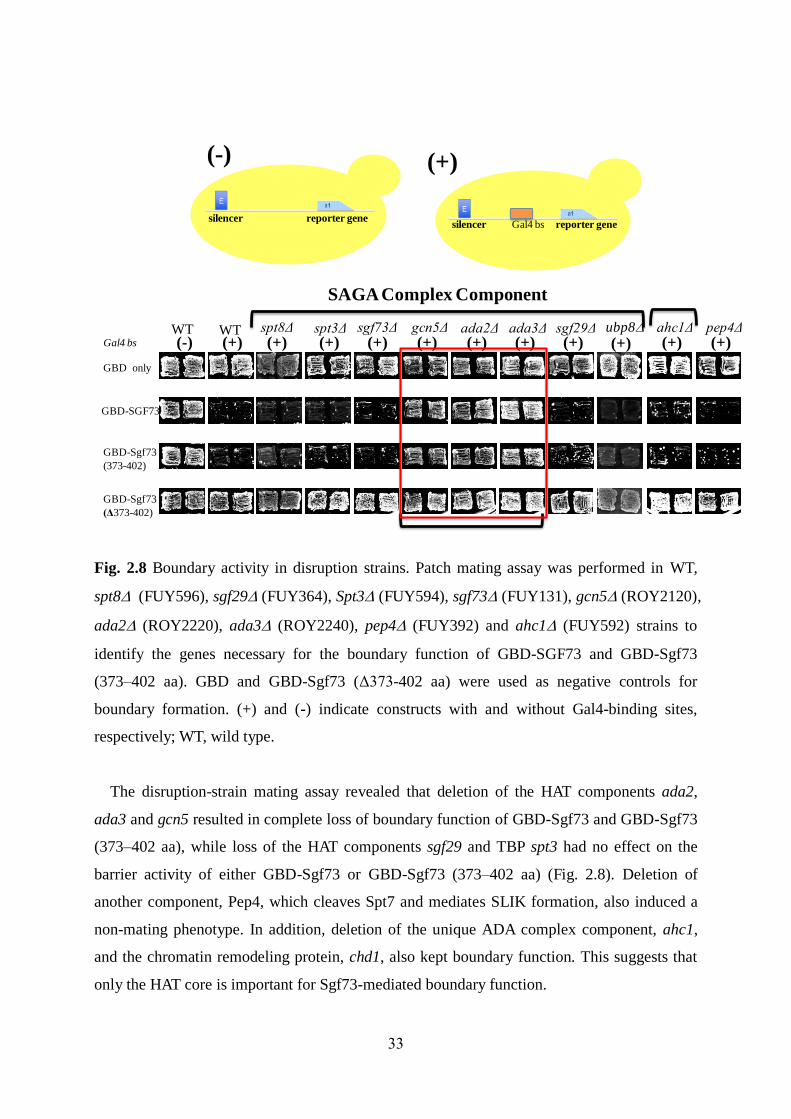
Fig. 2.8 Boundary activity in disruption strains. Patch mating assay was performed in WT,
spt8(FUY596), sgf29(FUY364), Spt3 (FUY594), sgf73 (FUY131), gcn5(ROY2120),
ada2 (ROY2220), ada3 (ROY2240), pep4 (FUY392) and ahc1 (FUY592) strains to
identify the genes necessary for the boundary function of GBD-SGF73 and GBD-Sgf73
(373–402 aa). GBD and GBD-Sgf73 (Δ373-402 aa) were used as negative controls for
boundary formation. (+) and (-) indicate constructs with and without Gal4-binding sites,
respectively; WT, wild type.
The disruption-strain mating assay revealed that deletion of the HAT components ada2,
ada3 and gcn5 resulted in complete loss of boundary function of GBD-Sgf73 and GBD-Sgf73
(373–402 aa), while loss of the HAT components sgf29 and TBP spt3 had no effect on the
barrier activity of either GBD-Sgf73 or GBD-Sgf73 (373–402 aa) (Fig. 2.8). Deletion of
another component, Pep4, which cleaves Spt7 and mediates SLIK formation, also induced a
non-mating phenotype. In addition, deletion of the unique ADA complex component, ahc1,
and the chromatin remodeling protein, chd1, also kept boundary function. This suggests that
only the HAT core is important for Sgf73-mediated boundary function.
(+)(-)
silencer reporter genesilencer reporter geneGal4 bs
GBD-SGF73
GBD-Sgf73
(373-402)
GBD-Sgf73
(Δ373-402)
spt8Δ spt3Δ sgf73ΔWT WT(-) (+) (+)
GBD only
Gal4 bs (+) (+)sgf29Δgcn5Δ ada2Δ ada3Δ(+)(+) (+) (+)
pep4Δ(+)
ahc1Δ(+)(+)
ubp8
SAGA Complex Component
34
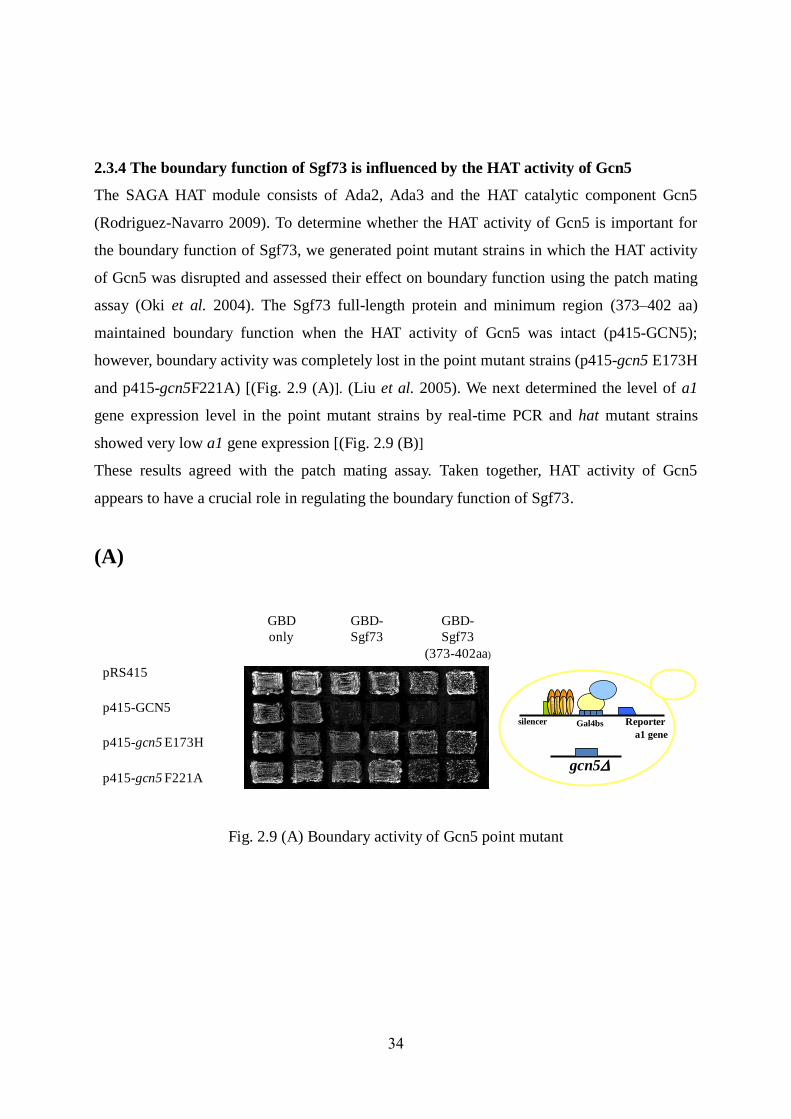
2.3.4 The boundary function of Sgf73 is influenced by the HAT activity of Gcn5
The SAGA HAT module consists of Ada2, Ada3 and the HAT catalytic component Gcn5
(Rodriguez-Navarro 2009). To determine whether the HAT activity of Gcn5 is important for
the boundary function of Sgf73, we generated point mutant strains in which the HAT activity
of Gcn5 was disrupted and assessed their effect on boundary function using the patch mating
assay (Oki et al. 2004). The Sgf73 full-length protein and minimum region (373–402 aa)
maintained boundary function when the HAT activity of Gcn5 was intact (p415-GCN5);
however, boundary activity was completely lost in the point mutant strains (p415-gcn5 E173H
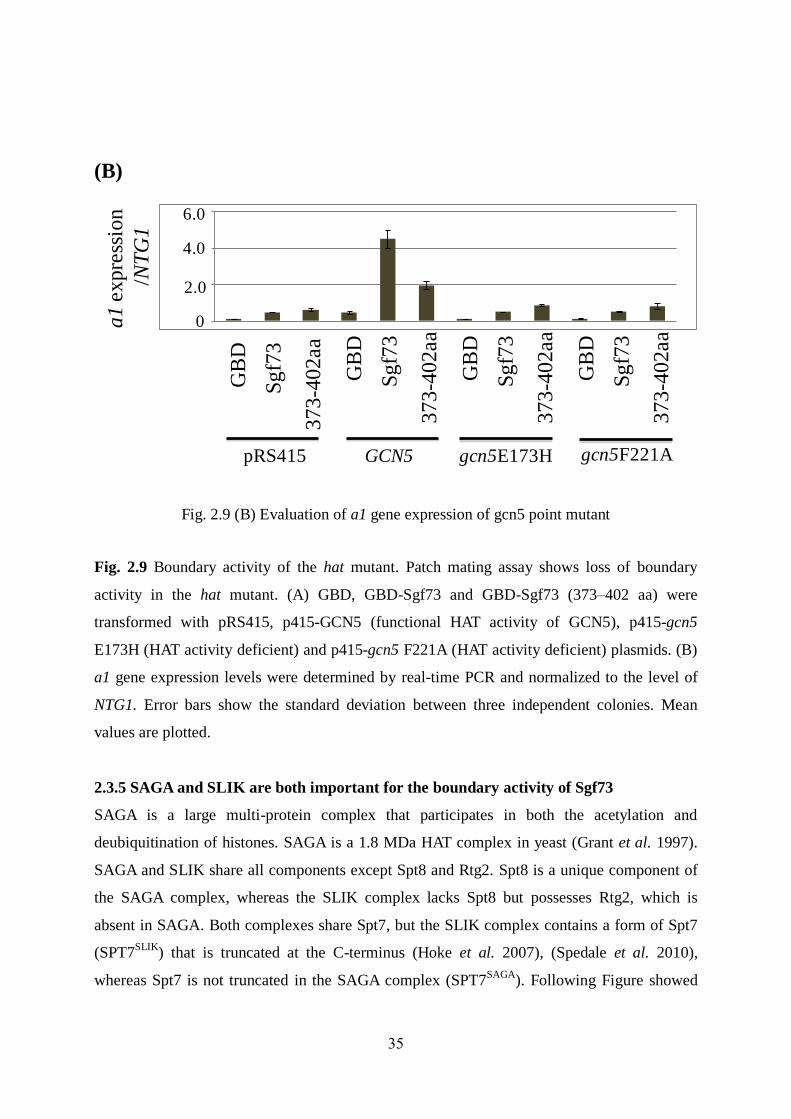
and p415-gcn5F221A) [(Fig. 2.9 (A)]. (Liu et al. 2005). We next determined the level of a1
gene expression level in the point mutant strains by real-time PCR and hat mutant strains
showed very low a1 gene expression [(Fig. 2.9 (B)]
These results agreed with the patch mating assay. Taken together, HAT activity of Gcn5
appears to have a crucial role in regulating the boundary function of Sgf73.
(A)
Fig. 2.9 (A) Boundary activity of Gcn5 point mutant
pRS415
p415-GCN5
p415-gcn5 E173H
p415-gcn5 F221A
GBD
only
GBD-
Sgf73
GBD-
Sgf73
(373-402aa)
Gal4bs Reporter
a1 gene
silencer
E
gcn5
35
(B)
Fig. 2.9 (B) Evaluation of a1 gene expression of gcn5 point mutant
Fig. 2.9 Boundary activity of the hat mutant. Patch mating assay shows loss of boundary
activity in the hat mutant. (A) GBD, GBD-Sgf73 and GBD-Sgf73 (373–402 aa) were
transformed with pRS415, p415-GCN5 (functional HAT activity of GCN5), p415-gcn5
E173H (HAT activity deficient) and p415-gcn5 F221A (HAT activity deficient) plasmids. (B)
a1 gene expression levels were determined by real-time PCR and normalized to the level of
NTG1. Error bars show the standard deviation between three independent colonies. Mean
values are plotted.
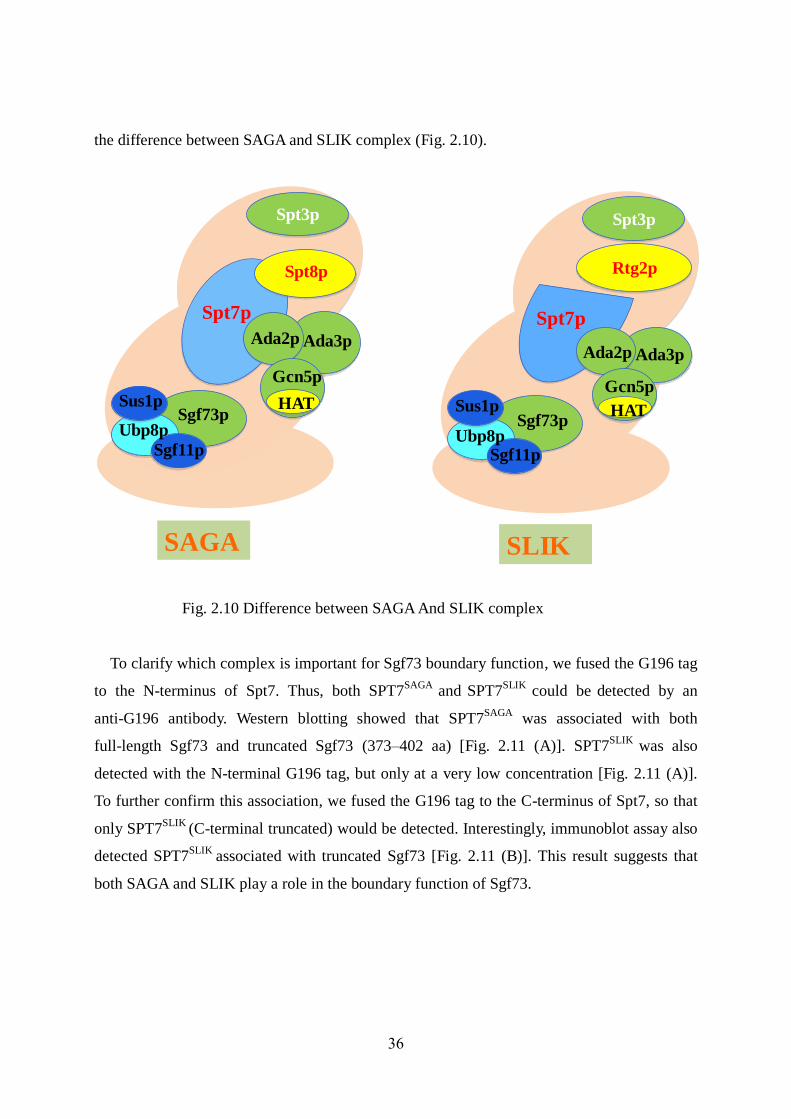
2.3.5 SAGA and SLIK are both important for the boundary activity of Sgf73
SAGA is a large multi-protein complex that participates in both the acetylation and
deubiquitination of histones. SAGA is a 1.8 MDa HAT complex in yeast (Grant et al. 1997).
SAGA and SLIK share all components except Spt8 and Rtg2. Spt8 is a unique component of
the SAGA complex, whereas the SLIK complex lacks Spt8 but possesses Rtg2, which is
absent in SAGA. Both complexes share Spt7, but the SLIK complex contains a form of Spt7
(SPT7SLIK
) that is truncated at the C-terminus (Hoke et al. 2007), (Spedale et al. 2010),
whereas Spt7 is not truncated in the SAGA complex (SPT7SAGA
). Following Figure showed
0.0000
2.0000
4.0000
6.0000
GB
D
Sg
f73
37
3-4
02
aa
GB
D
Sg
f73
37
3-4
02
aa
GB
D
Sg
f73
37
3-4
02
aa
GB
D
Sg
f73
37
3-4
02
aa
pRS415 GCN5 gcn5E173H gcn5F221A
a1
ex
pre
ssio
n
/NT
G1
2.0
0
4.0
6.0
36
the difference between SAGA and SLIK complex (Fig. 2.10).
Fig. 2.10 Difference between SAGA And SLIK complex
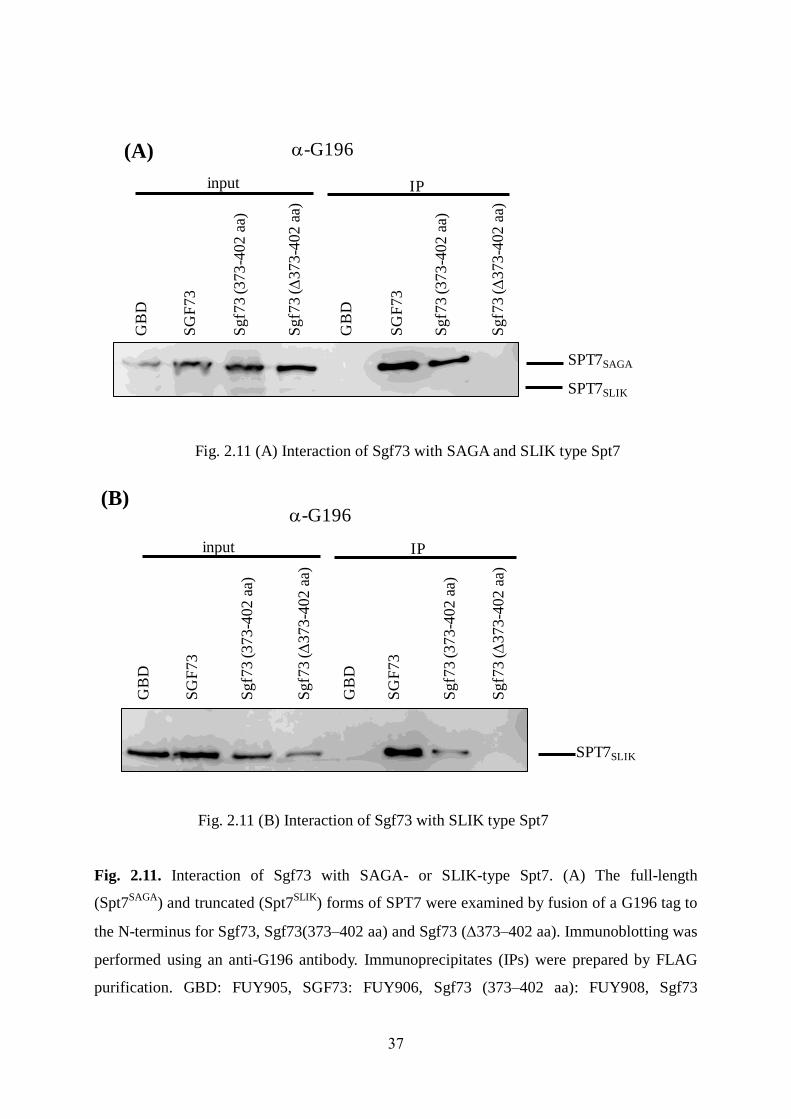
To clarify which complex is important for Sgf73 boundary function, we fused the G196 tag
to the N-terminus of Spt7. Thus, both SPT7SAGA
and SPT7SLIK
could be detected by an
anti-G196 antibody. Western blotting showed that SPT7SAGA
was associated with both
full-length Sgf73 and truncated Sgf73 (373–402 aa) [Fig. 2.11 (A)]. SPT7SLIK
was also
detected with the N-terminal G196 tag, but only at a very low concentration [Fig. 2.11 (A)].
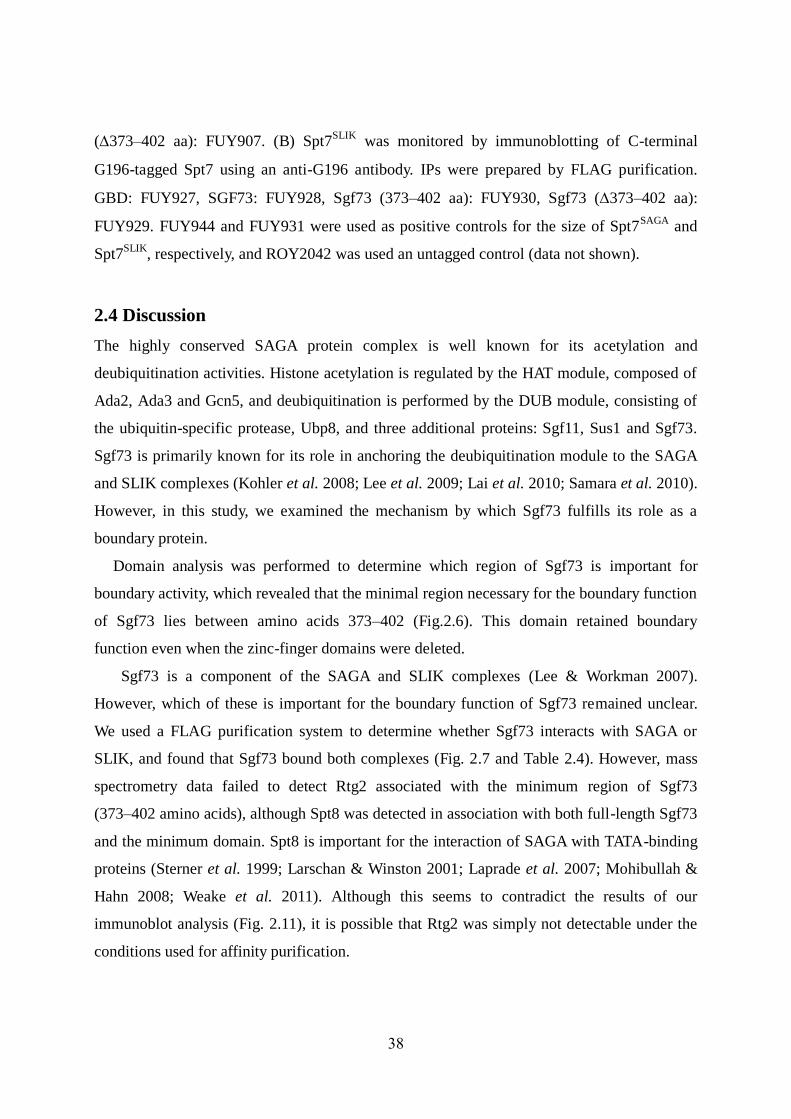
To further confirm this association, we fused the G196 tag to the C-terminus of Spt7, so that
only SPT7SLIK
(C-terminal truncated) would be detected. Interestingly, immunoblot assay also
detected SPT7SLIK
associated with truncated Sgf73 [Fig. 2.11 (B)]. This result suggests that
both SAGA and SLIK play a role in the boundary function of Sgf73.
SAGA
Spt3p
Gcn5p
HAT
Ada3pAda2p
Rtg2p
Spt7p
Sus1p
Sgf11pUbp8p
Sgf73p
Spt3p
Spt7p
Sus1p
Sgf11p
Ubp8pSgf73p
Spt8p
SLIK
Gcn5p
HAT
Ada3pAda2p
37
Fig. 2.11 (A) Interaction of Sgf73 with SAGA and SLIK type Spt7
Fig. 2.11 (B) Interaction of Sgf73 with SLIK type Spt7
Fig. 2.11. Interaction of Sgf73 with SAGA- or SLIK-type Spt7. (A) The full-length
(Spt7SAGA
) and truncated (Spt7SLIK
) forms of SPT7 were examined by fusion of a G196 tag to
the N-terminus for Sgf73, Sgf73(373–402 aa) and Sgf73 (373–402 aa). Immunoblotting was
performed using an anti-G196 antibody. Immunoprecipitates (IPs) were prepared by FLAG
purification. GBD: FUY905, SGF73: FUY906, Sgf73 (373–402 aa): FUY908, Sgf73
SPT7SAGA
SPT7SLIK
IPS
GF
73
input
Sg
f73
(3
73
-40
2 a
a)
SG
F73
GB
D
GB
D
a-G196
Sgf7
3 (
373
-402 a
a)
Sgf7
3 (373
-402 a
a)
Sgf7
3 (
373
-402 a
a)
IP
SG
F73
input
SG
F73
SPT7SLIK
GB
D
GB
D
a-G196
Sgf7
3 (
373
-40
2 a
a)
Sgf7
3 (
37
3-4
02
aa)
Sgf7
3 (
373
-40
2 a
a)
Sg
f73
(
37
3-4
02
aa)
(B)
(A)
38
(373–402 aa): FUY907. (B) Spt7SLIK
was monitored by immunoblotting of C-terminal
G196-tagged Spt7 using an anti-G196 antibody. IPs were prepared by FLAG purification.
GBD: FUY927, SGF73: FUY928, Sgf73 (373–402 aa): FUY930, Sgf73 (373–402 aa):
FUY929. FUY944 and FUY931 were used as positive controls for the size of Spt7SAGA
and
Spt7SLIK
, respectively, and ROY2042 was used an untagged control (data not shown).
2.4 Discussion
The highly conserved SAGA protein complex is well known for its acetylation and
deubiquitination activities. Histone acetylation is regulated by the HAT module, composed of
Ada2, Ada3 and Gcn5, and deubiquitination is performed by the DUB module, consisting of
the ubiquitin-specific protease, Ubp8, and three additional proteins: Sgf11, Sus1 and Sgf73.
Sgf73 is primarily known for its role in anchoring the deubiquitination module to the SAGA
and SLIK complexes (Kohler et al. 2008; Lee et al. 2009; Lai et al. 2010; Samara et al. 2010).
However, in this study, we examined the mechanism by which Sgf73 fulfills its role as a
boundary protein.
Domain analysis was performed to determine which region of Sgf73 is important for
boundary activity, which revealed that the minimal region necessary for the boundary function
of Sgf73 lies between amino acids 373–402 (Fig.2.6). This domain retained boundary
function even when the zinc-finger domains were deleted.
Sgf73 is a component of the SAGA and SLIK complexes (Lee & Workman 2007).
However, which of these is important for the boundary function of Sgf73 remained unclear.
We used a FLAG purification system to determine whether Sgf73 interacts with SAGA or
SLIK, and found that Sgf73 bound both complexes (Fig. 2.7 and Table 2.4). However, mass
spectrometry data failed to detect Rtg2 associated with the minimum region of Sgf73
(373–402 amino acids), although Spt8 was detected in association with both full-length Sgf73
and the minimum domain. Spt8 is important for the interaction of SAGA with TATA-binding
proteins (Sterner et al. 1999; Larschan & Winston 2001; Laprade et al. 2007; Mohibullah &
Hahn 2008; Weake et al. 2011). Although this seems to contradict the results of our
immunoblot analysis (Fig. 2.11), it is possible that Rtg2 was simply not detectable under the
conditions used for affinity purification.
39
According to mass spectrometry results, the SAGA component Ubp8 was unable to bind to
the minimum region of Sgf73 (373–402 aa), but did bind the full-length protein (Table 2.4). In
previous studies, we observed that Ubp8, together with Sgf11 and Sus1, can bind to the
N-terminus (1–104 aa) of Sgf73 (Kohler et al. 2008; Lee et al. 2009; Lai et al. 2010; Samara
et al. 2010). We hypothesize that Ubp8 could not bind the minimum region due to the absence
of the N-terminal domain. Furthermore, we were also unable to detect Sgf11 and Sus1 by
mass spectrometry due to their small size or lower protein concentration (Table 2.4).
We next performed a disruption-strain mating experiment to determine the specific SAGA
subunits necessary for the boundary function of Sgf73. We deleted various subunits of
SAGA/SLIK/ADA complexes from the wild-type strains. Boundary function was completely
lost when ada2, ada3 or gcn5 were deleted (Fig.2.8). However, the deletion of other
components showed no effect on Sgf73-mediated boundary function. Thus, it appears that the
HAT module is important for controlling the spread of transcriptional silencing by Sgf73.
The catalytic component, Gcn5, together with Ada2 and Ada3, catalyzes acetylation by
creating an open chromatin structure for the binding of transcription factors and the
pre-initiation complex (Grant et al. 1999; Balasubramanian et al. 2002; Rodriguez-Navarro
2009; Bian et al. 2011). Deletion of another important SAGA component, Sgf29, did not show
any effect on the barrier activity of Sgf73. Thus, although Sgf29 is important for the
recognition of methylated H3K4 by SAGA (Bian et al. 2011), it does not appear to be
important for the boundary function of Sgf73. To validate our initial findings of the role of the
HAT core on boundary function, we next examined Sgf73-mediated boundary function in
mutant strains in which Gcn5 activity was inhibited. gcn5 mutant strains lost boundary
function when HAT activity was disrupted [Fig. 2.9 (A)]. A similar result was obtained by
real-time PCR, which revealed decreased levels of a1 gene expression in the gcn5 point
mutant strains and increased a1 gene expression levels in the non-mutant strains [Fig. 2.9 (B)].
Together, the results of disruption-strain mating assays and gcn5 point mutation analysis
indicate that the HAT activity of Gcn5 is crucial to Sgf73-mediated boundary activity.
Previous biochemical study demonstrated that the SAGA complex contains the longer form
of Spt7, while the C-terminal truncated form of Spt7 is present in the SLIK complex (Hoke et
al. 2007; Spedale et al. 2010). Spt8 binds the C-terminus of Spt7 in the SAGA complex
(Pray-Grant et al. 2002) (Fig. 2.10). Thus, we sought to clarify the role(s) of SAGA and
SLIK in the boundary formation function of Sgf73. To this end, we fused the truncated form
40
of yeast Spt7 (SPT7SLIK
) and full-length Spt7 (SPT7SAGA
) to a C-terminal and N-terminal
G196 tag, respectively. After interacting proteins were purified using a FLAG-tag purification
system, immunoblotting with a G196 antibody detected SPT7SAGA
associated with both the
full-length and truncated Sgf73 proteins [Fig. 2.11(A)]. SPT7SLIK
was also associated with
both the full-length and truncated forms of Sgf73 [Fig. 2.11(B)]. Thus, both the SAGA and
SLIK complexes appear to be important for the boundary activity of Sgf73 because both bind
the minimum region. However, the question of whether SAGA and SLIK work together or
independently remains unresolved. It is difficult to speculate that when SAGA comes to
facilitate boundary activity of Sgf73, SLIK also come or not or only SLIK complex alone can
do perform this boundary activity. It is possible that boundary formation is influenced by both
complexes. However, the mechanism(s) by which SAGA and SLIK contribute to native
boundary formation remain unknown.
41
References
Balasubramanian, R., Pray-Grant, M.G., Selleck, W., Grant, P.A. & Tan, S. (2002) Role of
the Ada2 and Ada3 transcriptional coactivators in histone acetylation. J Biol Chem 277,
7989-7995.
Bian, C., Xu, C., Ruan, J. et al. (2011) Sgf29 binds histone H3K4me2/3 and is required for
SAGA complex recruitment and histone H3 acetylation. EMBO J 30, 2829-2842.
Bhaumik, S.R. (2011) Distinct regulatory mechanisms of eukaryotic transcriptional
activation by SAGA and TFIID. Biochim Biophys Acta. 1809, 97-108
Bonnet, J., Wang, Y.H., Spedale, G., Atkinson, R.A., Romier, C., Hamiche, A., Pijnappel,
W.W., Timmers, H.T., Tora, L., Devys, D. & Kieffer, B. (2010) The structural plasticity
of SCA7 domains defines their differential nucleosome-binding properties. EMBO Rep
11, 612-618.
Daniel, J.A., and Grant, P.A. (2007) Multi-tasking on chromatin with the SAGA coactivator
complexes. Mutat Res. 618, 135-148
Donze, D., Adams, C.R., Rine, J. & Kamakaka, R.T. (1999) The boundaries of the silenced
HMR domain in Saccharomyces cerevisiae. Genes Dev 13, 698-708.
Grant, P.A., Duggan, L., Cote, J., Roberts, S.M., Brownell, J.E., Candau, R., Ohba, R.,
Owen-Hughes, T., Allis, C.D., Winston, F., Berger, S.L. & Workman, J.L. (1997) Yeast
Gcn5 functions in two multisubunit complexes to acetylate nucleosomal histones:
characterization of an Ada complex and the SAGA (Spt/Ada) complex. Genes Dev 11,
1640-1650.
Grant, P.A., Eberharter, A., John, S., Cook, R.G., Turner, B.M. & Workman, J.L. (1999)
Expanded lysine acetylation specificity of Gcn5 in native complexes. J Biol Chem 274,
5895-5900.
Hatanaka, A., Chen, B., Sun, J.Q., Mano, Y., Funakoshi, M., Kobayashi, H., Ju, Y., Mizutani,
T., Shinmyozu, K., Nakayama, J., Miyamoto, K., Uchida, H. & Oki, M. (2011) Fub1p,
a novel protein isolated by boundary screening, binds the proteasome complex. Genes
Genet Syst 86, 305-314.
Helmlinger, D., Marguerat, S., Villen, J., Swaney, D.L., Gygi, S.P., Bahler, J. & Winston, F.
(2011) Tra1 has specific regulatory roles, rather than global functions, within the SAGA
co-activator complex. EMBO J 30, 2843-2852.
Hoke, S.M., Liang, G., Mutiu, A.I., Genereaux, J. & Brandl, C.J. (2007) C-terminal
processing of yeast Spt7 occurs in the absence of functional SAGA complex. BMC
42
Biochem 8, 16.
Ito, T., Tashiro, K., Muta, S., Ozawa, R., Chiba, T., Nishizawa, M., Yamamoto, K., Kuhara,
S. & Sakaki, Y. (2000) Toward a protein-protein interaction map of the budding yeast:
A comprehensive system to examine two-hybrid interactions in all possible
combinations between the yeast proteins. Proceedings of the National Academy of
Sciences of the United States of America 97, 1143-1147.
Kohler, A., Schneider, M., Cabal, G.G., Nehrbass, U. & Hurt, E. (2008) Yeast Ataxin-7 links
histone deubiquitination with gene gating and mRNA export. Nat Cell Biol 10,
707-715.
Lai, C., Wu, M., Li, P., Shi, C., Tian, C. & Zang, J. (2010) Solution NMR characterization
of Sgf73(1-104) indicates that Zn ion is required to stabilize zinc finger motif.
Biochemical and biophysical research communications 397, 436-440.
Laprade, L., Rose, D. & Winston, F. (2007) Characterization of new Spt3 and
TATA-binding protein mutants of Saccharomyces cerevisiae: Spt3 TBP allele-specific
interactions and bypass of Spt8. Genetics 177, 2007-2017.
Larschan, E. & Winston, F. (2001) The S. cerevisiae SAGA complex functions in vivo as a
coactivator for transcriptional activation by Gal4. Genes Dev 15, 1946-1956.
Lee, K.K., Swanson, S.K., Florens, L., Washburn, M.P. & Workman, J.L. (2009) Yeast
Sgf73/Ataxin-7 serves to anchor the deubiquitination module into both SAGA and
Slik(SALSA) HAT complexes. Epigenetics Chromatin 2, 2.
Lee, K.K. & Workman, J.L. (2007) Histone acetyltransferase complexes: one size doesn't fit
all. Nat Rev Mol Cell Biol 8, 284-295.
Lee, T.I., Causton, H.C., Holstege, F.C., Shen, W.C., Hannett, N., Jennings, E.G., Winston,
F., Green, M.R., and Young, R.A. (2000) Redundant roles for the TFIID and SAGA
complexes in global transcription. Nature. 405, 701-704
Liu, Y., Xu, X., Singh-Rodriguez, S., Zhao, Y. & Kuo, M.H. (2005) Histone H3 Ser10
phosphorylation-independent function of Snf1 and Reg1 proteins rescues a gcn5-
mutant in HIS3 expression. Molecular and cellular biology 25, 10566-10579.
Mohibullah, N. & Hahn, S. (2008) Site-specific cross-linking of TBP in vivo and in vitro
reveals a direct functional interaction with the SAGA subunit Spt3. Genes Dev 22,
2994-3006.
Oki, M., Valenzuela, L., Chiba, T., Ito, T. & Kamakaka, R.T. (2004) Barrier proteins
remodel and modify chromatin to restrict silenced domains. Molecular and cellular
biology 24, 1956-1967.
43
Pray-Grant, M.G., Schieltz, D., McMahon, S.J., Wood, J.M., Kennedy, E.L., Cook, R.G.,
Workman, J.L., Yates, J.R., 3rd & Grant, P.A. (2002) The novel SLIK histone
acetyltransferase complex functions in the yeast retrograde response pathway.
Molecular and cellular biology 22, 8774-8786.
Rodriguez-Navarro, S. (2009) Insights into SAGA function during gene expression. EMBO
Rep 10, 843-850.
Sadaie, M., Shinmyozu, K. & Nakayama, J. (2008) A conserved SET domain
methyltransferase, Set11, modifies ribosomal protein Rpl12 in fission yeast. J Biol
Chem 283, 7185-7195.
Samara, N.L., Datta, A.B., Berndsen, C.E., Zhang, X., Yao, T., Cohen, R.E. & Wolberger, C.
(2010) Structural insights into the assembly and function of the SAGA deubiquitinating
module. Science 328, 1025-1029.
Spedale, G., Mischerikow, N., Heck, A.J., Timmers, H.T. & Pijnappel, W.W. (2010)
Identification of Pep4p as the protease responsible for formation of the SAGA-related
SLIK protein complex. J Biol Chem 285, 22793-22799.
Sterner, D.E., Grant, P.A., Roberts, S.M., Duggan, L.J., Belotserkovskaya, R., Pacella, L.A.,
Winston, F., Workman, J.L. & Berger, S.L. (1999) Functional organization of the yeast
SAGA complex: distinct components involved in structural integrity, nucleosome
acetylation, and TATA-binding protein interaction. Molecular and cellular biology 19,
86-98.
Weake, V.M., Dyer, J.O., Seidel, C., Box, A., Swanson, S.K., Peak, A., Florens, L.,
Washburn, M.P., Abmayr, S.M. & Workman, J.L. (2011) Post-transcription initiation
function of the ubiquitous SAGA complex in tissue-specific gene activation. Genes Dev
25, 1499-1509.
Lee, T.I., Causton, H.C., Holstege, F.C., Shen, W.C., Hannett, N., Jennings, E.G., Winston,
F., Green, M.R., and Young, R.A. (2000) Redundant roles for the TFIID and SAGA
complexes in global transcription. Nature. 405, 701-704
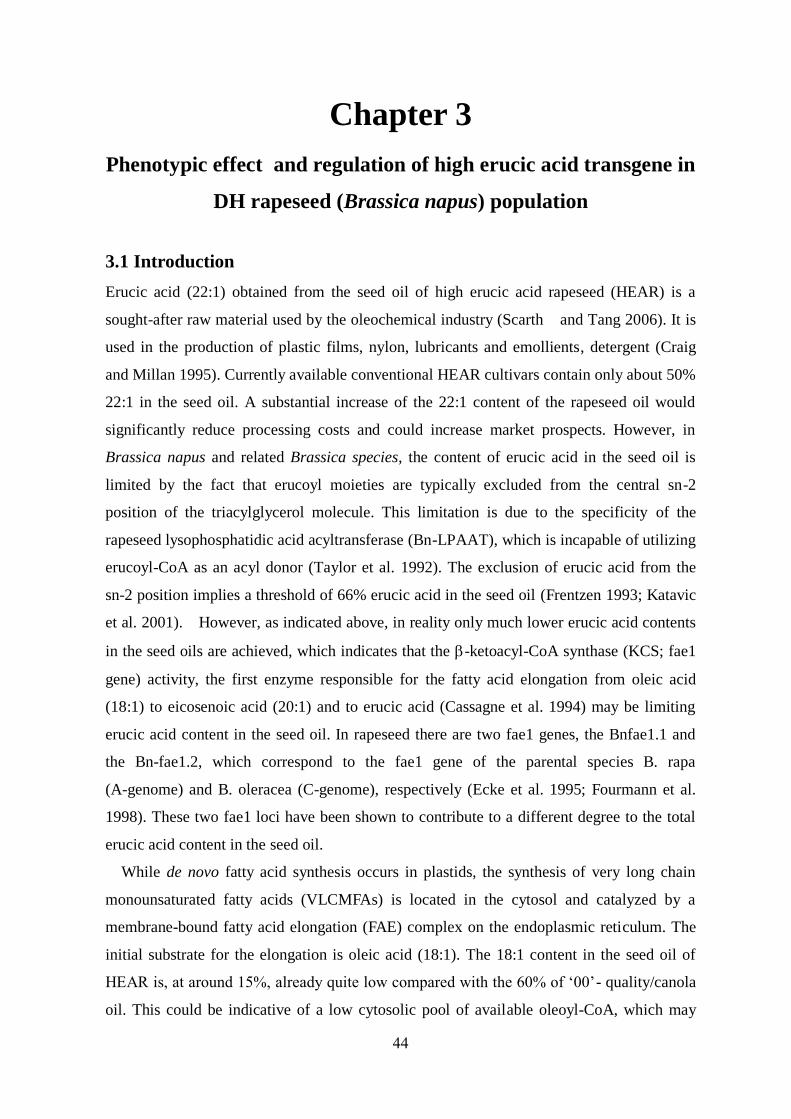
44
Chapter 3
Phenotypic effect and regulation of high erucic acid transgene in
DH rapeseed (Brassica napus) population
3.1 Introduction
Erucic acid (22:1) obtained from the seed oil of high erucic acid rapeseed (HEAR) is a
sought-after raw material used by the oleochemical industry (Scarth and Tang 2006). It is
used in the production of plastic films, nylon, lubricants and emollients, detergent (Craig
and Millan 1995). Currently available conventional HEAR cultivars contain only about 50%
22:1 in the seed oil. A substantial increase of the 22:1 content of the rapeseed oil would
significantly reduce processing costs and could increase market prospects. However, in
Brassica napus and related Brassica species, the content of erucic acid in the seed oil is
limited by the fact that erucoyl moieties are typically excluded from the central sn-2
position of the triacylglycerol molecule. This limitation is due to the specificity of the
rapeseed lysophosphatidic acid acyltransferase (Bn-LPAAT), which is incapable of utilizing
erucoyl-CoA as an acyl donor (Taylor et al. 1992). The exclusion of erucic acid from the
sn-2 position implies a threshold of 66% erucic acid in the seed oil (Frentzen 1993; Katavic
et al. 2001). However, as indicated above, in reality only much lower erucic acid contents
in the seed oils are achieved, which indicates that the -ketoacyl-CoA synthase (KCS; fae1
gene) activity, the first enzyme responsible for the fatty acid elongation from oleic acid
(18:1) to eicosenoic acid (20:1) and to erucic acid (Cassagne et al. 1994) may be limiting
erucic acid content in the seed oil. In rapeseed there are two fae1 genes, the Bnfae1.1 and
the Bn-fae1.2, which correspond to the fae1 gene of the parental species B. rapa
(A-genome) and B. oleracea (C-genome), respectively (Ecke et al. 1995; Fourmann et al.
1998). These two fae1 loci have been shown to contribute to a different degree to the total
erucic acid content in the seed oil.
While de novo fatty acid synthesis occurs in plastids, the synthesis of very long chain
monounsaturated fatty acids (VLCMFAs) is located in the cytosol and catalyzed by a
membrane-bound fatty acid elongation (FAE) complex on the endoplasmic reticulum. The
initial substrate for the elongation is oleic acid (18:1). The 18:1 content in the seed oil of
HEAR is, at around 15%, already quite low compared with the 60% of ‘00’- quality/canola
oil. This could be indicative of a low cytosolic pool of available oleoyl-CoA, which may
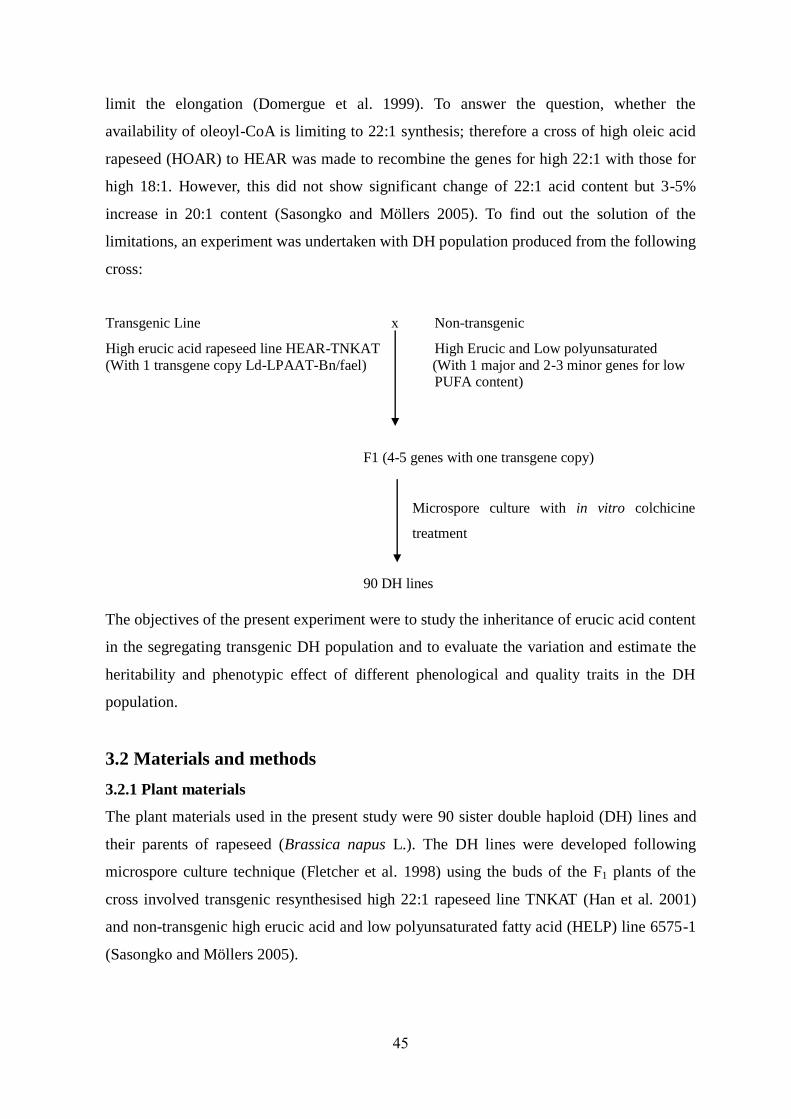
45
limit the elongation (Domergue et al. 1999). To answer the question, whether the
availability of oleoyl-CoA is limiting to 22:1 synthesis; therefore a cross of high oleic acid
rapeseed (HOAR) to HEAR was made to recombine the genes for high 22:1 with those for
high 18:1. However, this did not show significant change of 22:1 acid content but 3-5%
increase in 20:1 content (Sasongko and Möllers 2005). To find out the solution of the
limitations, an experiment was undertaken with DH population produced from the following
cross:
Transgenic Line x Non-transgenic
High erucic acid rapeseed line HEAR-TNKAT High Erucic and Low polyunsaturated
(With 1 transgene copy Ld-LPAAT-Bn/fael) (With 1 major and 2-3 minor genes for low PUFA content)
F1 (4-5 genes with one transgene copy)
Microspore culture with in vitro colchicine
treatment
90 DH lines
The objectives of the present experiment were to study the inheritance of erucic acid content
in the segregating transgenic DH population and to evaluate the variation and estimate the
heritability and phenotypic effect of different phenological and quality traits in the DH
population.
3.2 Materials and methods
3.2.1 Plant materials
The plant materials used in the present study were 90 sister double haploid (DH) lines and
their parents of rapeseed (Brassica napus L.). The DH lines were developed following
microspore culture technique (Fletcher et al. 1998) using the buds of the F1 plants of the
cross involved transgenic resynthesised high 22:1 rapeseed line TNKAT (Han et al. 2001)
and non-transgenic high erucic acid and low polyunsaturated fatty acid (HELP) line 6575-1
(Sasongko and Möllers 2005).
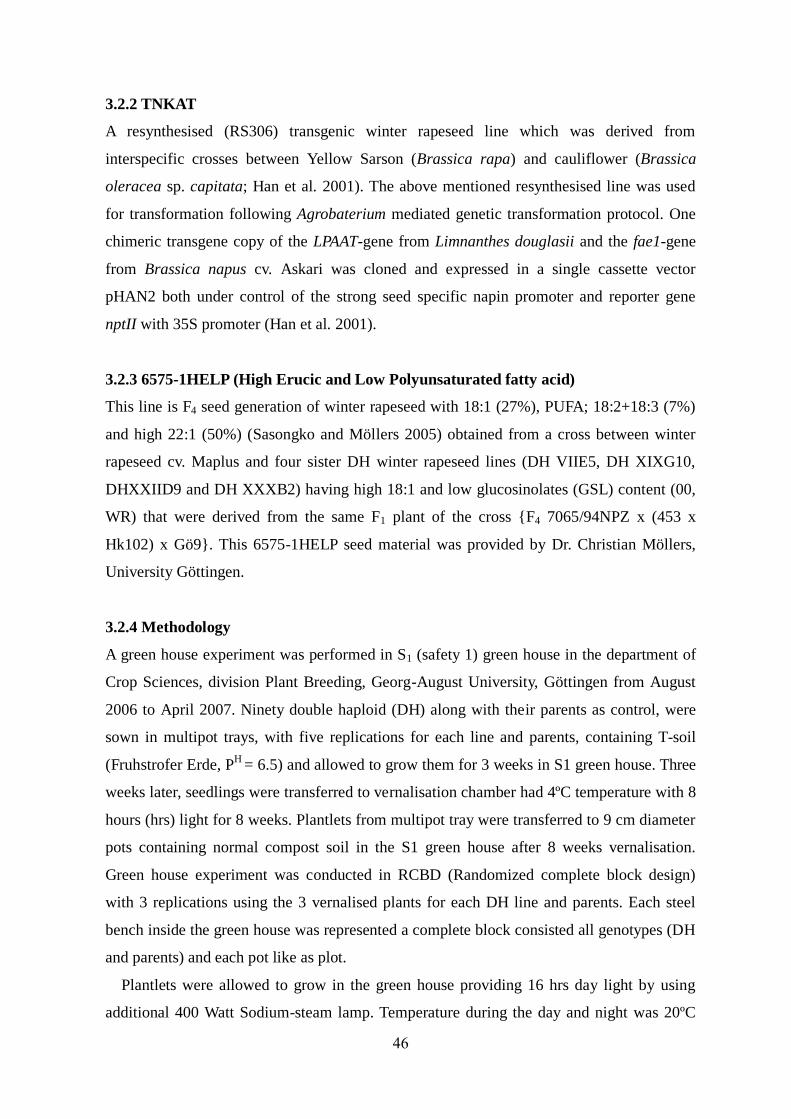
46
3.2.2 TNKAT
A resynthesised (RS306) transgenic winter rapeseed line which was derived from
interspecific crosses between Yellow Sarson (Brassica rapa) and cauliflower (Brassica
oleracea sp. capitata; Han et al. 2001). The above mentioned resynthesised line was used
for transformation following Agrobaterium mediated genetic transformation protocol. One
chimeric transgene copy of the LPAAT-gene from Limnanthes douglasii and the fae1-gene
from Brassica napus cv. Askari was cloned and expressed in a single cassette vector
pHAN2 both under control of the strong seed specific napin promoter and reporter gene
nptII with 35S promoter (Han et al. 2001).
3.2.3 6575-1HELP (High Erucic and Low Polyunsaturated fatty acid)
This line is F4 seed generation of winter rapeseed with 18:1 (27%), PUFA; 18:2+18:3 (7%)
and high 22:1 (50%) (Sasongko and Möllers 2005) obtained from a cross between winter
rapeseed cv. Maplus and four sister DH winter rapeseed lines (DH VIIE5, DH XIXG10,
DHXXIID9 and DH XXXB2) having high 18:1 and low glucosinolates (GSL) content (00,
WR) that were derived from the same F1 plant of the cross {F4 7065/94NPZ x (453 x
Hk102) x Gö9}. This 6575-1HELP seed material was provided by Dr. Christian Möllers,
University Göttingen.
3.2.4 Methodology
A green house experiment was performed in S1 (safety 1) green house in the department of
Crop Sciences, division Plant Breeding, Georg-August University, Göttingen from August
2006 to April 2007. Ninety double haploid (DH) along with their parents as control, were
sown in multipot trays, with five replications for each line and parents, containing T-soil
(Fruhstrofer Erde, PH
= 6.5) and allowed to grow them for 3 weeks in S1 green house. Three
weeks later, seedlings were transferred to vernalisation chamber had 4ºC temperature with 8
hours (hrs) light for 8 weeks. Plantlets from multipot tray were transferred to 9 cm diameter
pots containing normal compost soil in the S1 green house after 8 weeks vernalisation.
Green house experiment was conducted in RCBD (Randomized complete block design)
with 3 replications using the 3 vernalised plants for each DH line and parents. Each steel
bench inside the green house was represented a complete block consisted all genotypes (DH
and parents) and each pot like as plot.
Plantlets were allowed to grow in the green house providing 16 hrs day light by using
additional 400 Watt Sodium-steam lamp. Temperature during the day and night was 20ºC
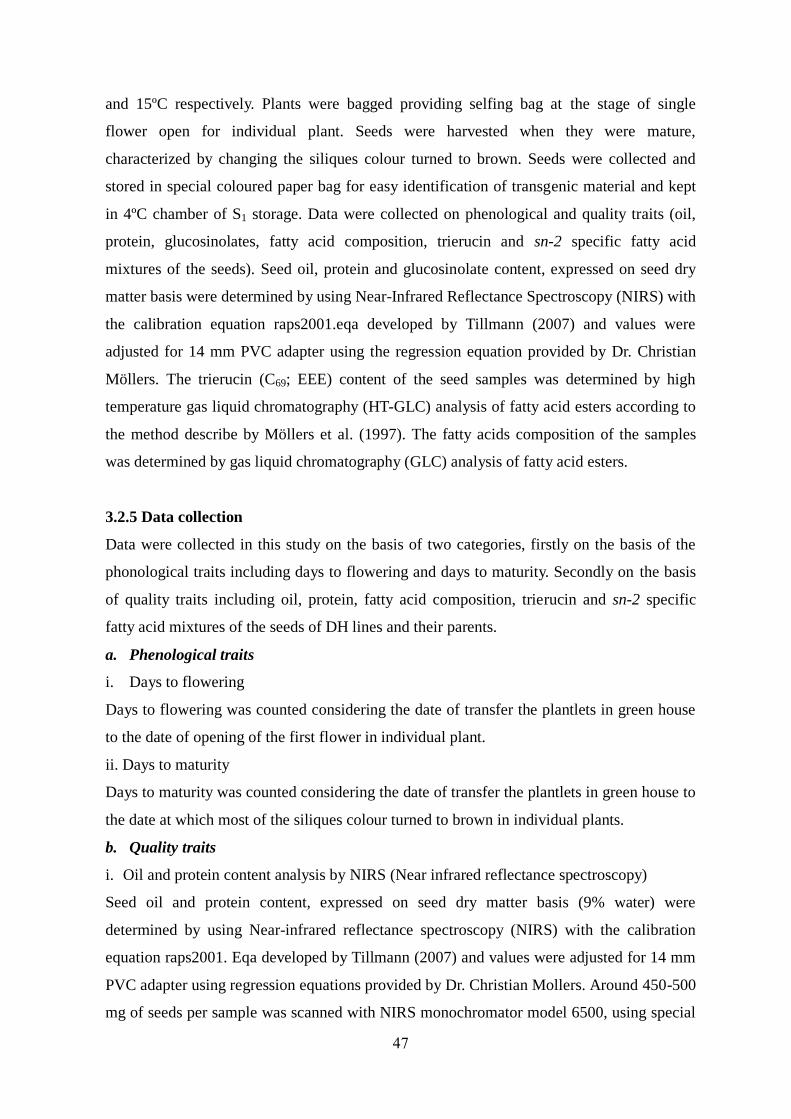
47
and 15ºC respectively. Plants were bagged providing selfing bag at the stage of single
flower open for individual plant. Seeds were harvested when they were mature,
characterized by changing the siliques colour turned to brown. Seeds were collected and
stored in special coloured paper bag for easy identification of transgenic material and kept
in 4ºC chamber of S1 storage. Data were collected on phenological and quality traits (oil,
protein, glucosinolates, fatty acid composition, trierucin and sn-2 specific fatty acid
mixtures of the seeds). Seed oil, protein and glucosinolate content, expressed on seed dry
matter basis were determined by using Near-Infrared Reflectance Spectroscopy (NIRS) with
the calibration equation raps2001.eqa developed by Tillmann (2007) and values were
adjusted for 14 mm PVC adapter using the regression equation provided by Dr. Christian
Möllers. The trierucin (C69; EEE) content of the seed samples was determined by high
temperature gas liquid chromatography (HT-GLC) analysis of fatty acid esters according to
the method describe by Möllers et al. (1997). The fatty acids composition of the samples
was determined by gas liquid chromatography (GLC) analysis of fatty acid esters.
3.2.5 Data collection
Data were collected in this study on the basis of two categories, firstly on the basis of the
phonological traits including days to flowering and days to maturity. Secondly on the basis
of quality traits including oil, protein, fatty acid composition, trierucin and sn-2 specific
fatty acid mixtures of the seeds of DH lines and their parents.
a. Phenological traits
i. Days to flowering
Days to flowering was counted considering the date of transfer the plantlets in green house
to the date of opening of the first flower in individual plant.
ii. Days to maturity
Days to maturity was counted considering the date of transfer the plantlets in green house to
the date at which most of the siliques colour turned to brown in individual plants.
b. Quality traits
i. Oil and protein content analysis by NIRS (Near infrared reflectance spectroscopy)
Seed oil and protein content, expressed on seed dry matter basis (9% water) were
determined by using Near-infrared reflectance spectroscopy (NIRS) with the calibration
equation raps2001. Eqa developed by Tillmann (2007) and values were adjusted for 14 mm
PVC adapter using regression equations provided by Dr. Christian Mollers. Around 450-500
mg of seeds per sample was scanned with NIRS monochromator model 6500, using special
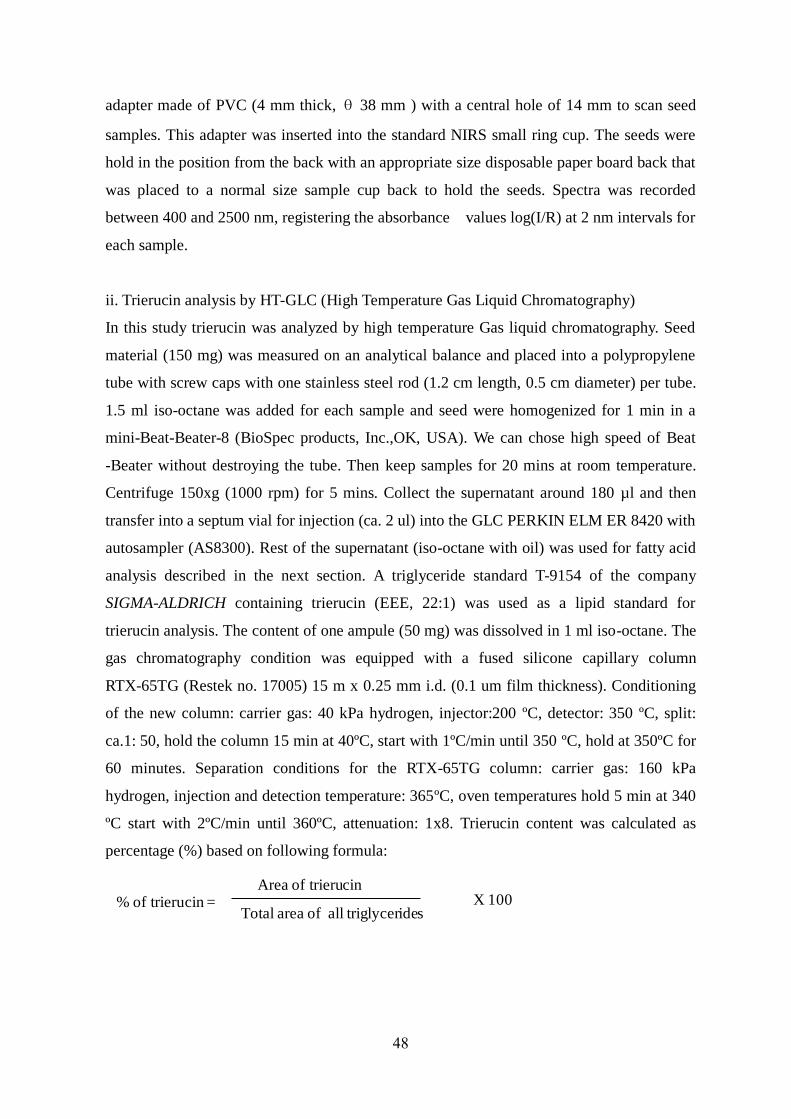
48
adapter made of PVC (4 mm thick, Ө 38 mm ) with a central hole of 14 mm to scan seed
samples. This adapter was inserted into the standard NIRS small ring cup. The seeds were
hold in the position from the back with an appropriate size disposable paper board back that
was placed to a normal size sample cup back to hold the seeds. Spectra was recorded
between 400 and 2500 nm, registering the absorbance values log(I/R) at 2 nm intervals for
each sample.
ii. Trierucin analysis by HT-GLC (High Temperature Gas Liquid Chromatography)
In this study trierucin was analyzed by high temperature Gas liquid chromatography. Seed
material (150 mg) was measured on an analytical balance and placed into a polypropylene
tube with screw caps with one stainless steel rod (1.2 cm length, 0.5 cm diameter) per tube.
1.5 ml iso-octane was added for each sample and seed were homogenized for 1 min in a
mini-Beat-Beater-8 (BioSpec products, Inc.,OK, USA). We can chose high speed of Beat
-Beater without destroying the tube. Then keep samples for 20 mins at room temperature.
Centrifuge 150xg (1000 rpm) for 5 mins. Collect the supernatant around 180 µl and then
transfer into a septum vial for injection (ca. 2 ul) into the GLC PERKIN ELM ER 8420 with
autosampler (AS8300). Rest of the supernatant (iso-octane with oil) was used for fatty acid
analysis described in the next section. A triglyceride standard T-9154 of the company
SIGMA-ALDRICH containing trierucin (EEE, 22:1) was used as a lipid standard for
trierucin analysis. The content of one ampule (50 mg) was dissolved in 1 ml iso-octane. The
gas chromatography condition was equipped with a fused silicone capillary column
RTX-65TG (Restek no. 17005) 15 m x 0.25 mm i.d. (0.1 um film thickness). Conditioning
of the new column: carrier gas: 40 kPa hydrogen, injector:200 ºC, detector: 350 ºC, split:
ca.1: 50, hold the column 15 min at 40ºC, start with 1ºC/min until 350 ºC, hold at 350ºC for
60 minutes. Separation conditions for the RTX-65TG column: carrier gas: 160 kPa
hydrogen, injection and detection temperature: 365ºC, oven temperatures hold 5 min at 340
ºC start with 2ºC/min until 360ºC, attenuation: 1x8. Trierucin content was calculated as
percentage (%) based on following formula:
% of trierucin =Area of trierucin
Total area of all triglyceridesX 100
49
iii. Fatty acid analysis by GLC (Gas liquid chromatography)
The fatty acid composition of the samples was determined by Gas liquid chromatography
(GLC) analysis of fatty acid esters. Remaining supernatant (iso-octane with oil) after taking
for trierucin analysis, was transferred to a new tube and left on a hot plate at 37.5 ºC for
overnight to evaporate and then added 500 ul of Na-methylate in methanol (0.5 mol/1) [9 ml
5.56 mol sodium methylate in 1 l methanol+ 10 ml isoctane add 100 ml with methanol p.a.
+100 ul 1% bromocresol green in methanol]. Shaking and vortex until the solution was
clear and then incubates 20 minutes for complete transmethylation of the fatty acid from oil.
Add 200 ul of 5% NaHSO4 solution and 300 ul iso-octane to the sample, and vortex.
Collect the 180 ul upper phase following centrifugation at 150xg (1000 rpm) and then
transfer to the septum vial and inject (ca. 2 ul) into the GLC (PERKIN ELMER 8420, San
Jose, CA, USA). The gas chromatography was equipped with a fused silicon capillary
column FFAP 25 m x 0.25 mm i.d. (0.1 um film thickness). The column temperature was
210 ºC and the carrier gas was 150 kPa H2 at the split rate of 1:70, and injection/detector
temperature was 230 ºC. Individual fatty acids, such as palmitic, stearic, oleic, linoleic,
linolenic, eicosenoic, erucic acid were determined by GLC and expressed as % of total fatty
acids.
3.2.6 Statistical analysis
Analysis of variance was performed with PLABSTAT software version 2F (Utz 2007) using
the following model: ijjiij rgY
where: Yij was observation of genotype i in replicate j;
gi and rj were the effects of genotype i in the replicate j, respectively and ij was the residual
error of genotype i in replicate j. Multiple mean comparisons were made with StatGraphics
Plus for Windows 3.0 (Statistical Graphics Corp., Rockville, USA). The number of transgene
copy segregated among the DH lines were calculated using χ2- test for a fixed ratio hypothesis
described by Gomez and Gomez (1976). Simple correlation coefficients were calculated
using PLABSTAT software version 2F (Utz 2001). Direct and indirect path coefficients of
the path coefficient analysis were calculated as described in Lynch and Walsh (1998).
3.3 Results and Discussion
3.3.1 Phenotypic variation among DH lines
The DH population showed highly significant variations for all phenological and quality
traits; days to flowering and maturity, oil, protein and different fatty acids content in seed oil
50
(Table. 3.1). Erucic acid was the most prominent fatty acid, accounting for 47.1% of the
total fatty acid content followed by oleic acid (19.7%), PUFA (15.9%), eicosenoic acid
(9.9%) and SFA (4%). A considerable quantitative variation was found for erucic acid, oleic
acid, PUFA and eicosenoic acid content ranging from 34.6 - 59.1%, 9.1-36.5, 5.6-27.9 and
3.9-18.9, respectively. This variation may be explained by differently effective alleles
responsible for oleic acid elongation to erucic acid (Jönsson 1977) and the factors
modifying the erucic acid content. Erucic acid showed medium heritability. High
heritabilities were found for days to flowering and PUFA content. Frequency distribution of
erucic acid content showed four classes with 1:3:3:1 segregation (Fig. 3.1) indicating that
this trait was controlled by alleles of 3 loci in this DH population rather than only two genes
in additive manner, found by Kirk and Hurlstone (1983) and Getinet et al. (1997). This
could be expected due to the genetic make-up of the parents, that produced F1 used for
microspore culture. F1 contained at least two major genes and other alleles of the
endogenous erucic acid loci segregating for erucic acid content in DH population. Presence
of such alleles could be confirmed by DNA sequencing of all fatty acid elongation (fae1)
and desaturase (fad2) genes were combined in F1 used for DH production.
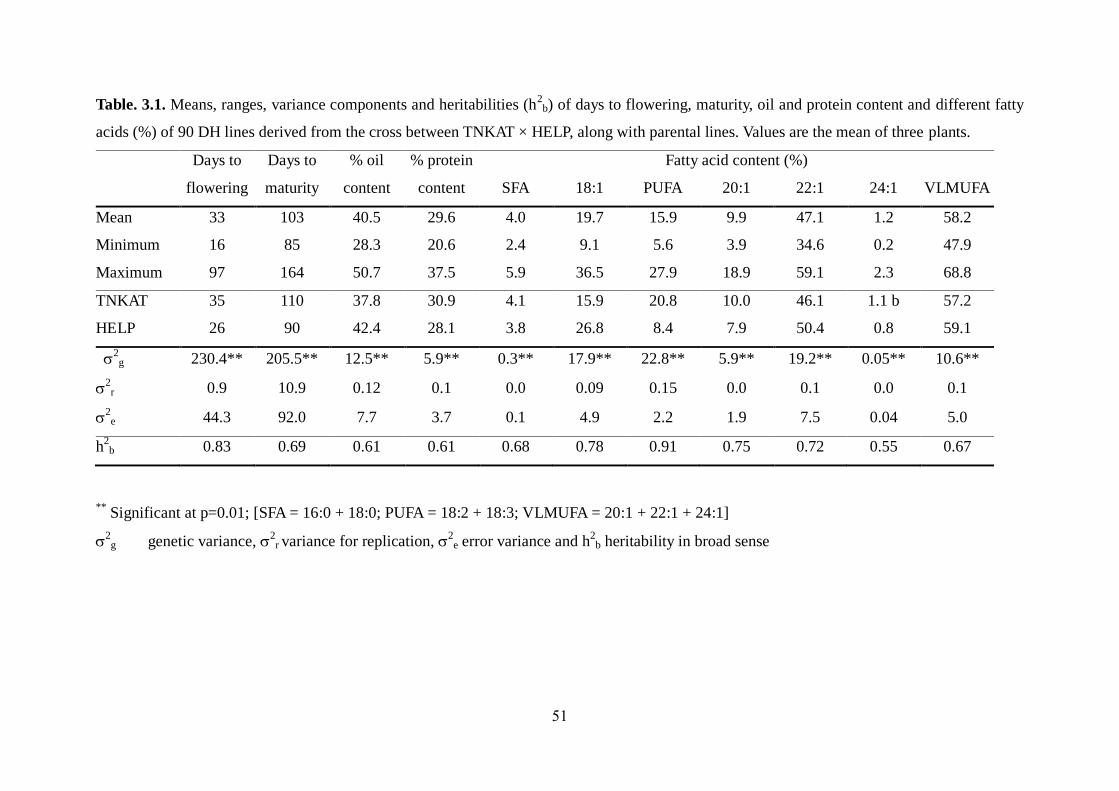
51
Table. 3.1. Means, ranges, variance components and heritabilities (h2b) of days to flowering, maturity, oil and protein content and different fatty
acids (%) of 90 DH lines derived from the cross between TNKAT × HELP, along with parental lines. Values are the mean of three plants.
Days to
flowering
Days to
maturity
% oil
content
% protein
content
Fatty acid content (%)
SFA 18:1 PUFA 20:1 22:1 24:1 VLMUFA
Mean 33 103 40.5 29.6 4.0 19.7 15.9 9.9 47.1 1.2 58.2
Minimum 16 85 28.3 20.6 2.4 9.1 5.6 3.9 34.6 0.2 47.9
Maximum 97 164 50.7 37.5 5.9 36.5 27.9 18.9 59.1 2.3 68.8
TNKAT 35 110 37.8 30.9 4.1 15.9 20.8 10.0 46.1 1.1 b 57.2
HELP 26 90 42.4 28.1 3.8 26.8 8.4 7.9 50.4 0.8 59.1
2g 230.4** 205.5** 12.5** 5.9** 0.3** 17.9** 22.8** 5.9** 19.2** 0.05** 10.6**
2r 0.9 10.9 0.12 0.1 0.0 0.09 0.15 0.0 0.1 0.0 0.1
2e 44.3 92.0 7.7 3.7 0.1 4.9 2.2 1.9 7.5 0.04 5.0
h2b 0.83 0.69 0.61 0.61 0.68 0.78 0.91 0.75 0.72 0.55 0.67
** Significant at p=0.01; [SFA = 16:0 + 18:0; PUFA = 18:2 + 18:3; VLMUFA = 20:1 + 22:1 + 24:1]
2g genetic variance,
2r variance for replication,
2e error variance and h
2b heritability in broad sense
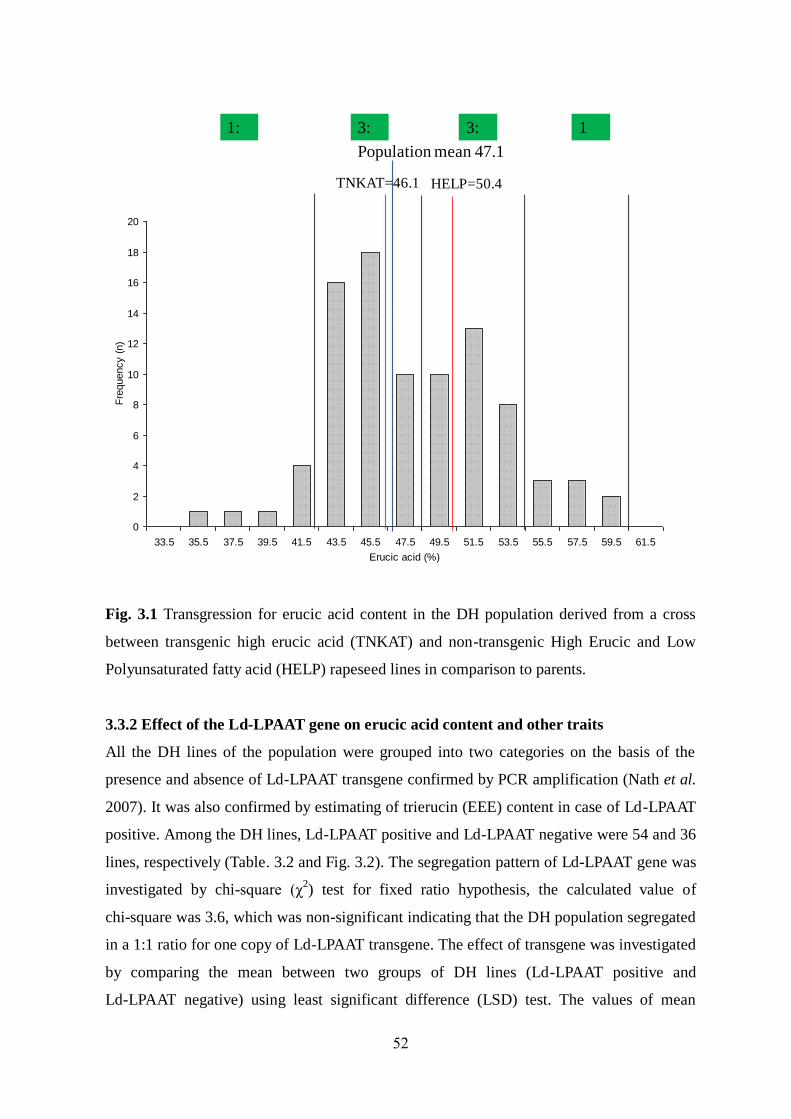
52
Fig. 3.1 Transgression for erucic acid content in the DH population derived from a cross
between transgenic high erucic acid (TNKAT) and non-transgenic High Erucic and Low
Polyunsaturated fatty acid (HELP) rapeseed lines in comparison to parents.
3.3.2 Effect of the Ld-LPAAT gene on erucic acid content and other traits
All the DH lines of the population were grouped into two categories on the basis of the
presence and absence of Ld-LPAAT transgene confirmed by PCR amplification (Nath et al.
2007). It was also confirmed by estimating of trierucin (EEE) content in case of Ld-LPAAT
positive. Among the DH lines, Ld-LPAAT positive and Ld-LPAAT negative were 54 and 36
lines, respectively (Table. 3.2 and Fig. 3.2). The segregation pattern of Ld-LPAAT gene was
investigated by chi-square (χ2) test for fixed ratio hypothesis, the calculated value of
chi-square was 3.6, which was non-significant indicating that the DH population segregated
in a 1:1 ratio for one copy of Ld-LPAAT transgene. The effect of transgene was investigated
by comparing the mean between two groups of DH lines (Ld-LPAAT positive and
Ld-LPAAT negative) using least significant difference (LSD) test. The values of mean
0
2
4
6
8
10
12
14
16
18
20
33.5 35.5 37.5 39.5 41.5 43.5 45.5 47.5 49.5 51.5 53.5 55.5 57.5 59.5 61.5
Erucic acid (%)
Fre
quency (
n)
1: 3: 3: 1
Population mean 47.1
TNKAT=46.1 HELP=50.4
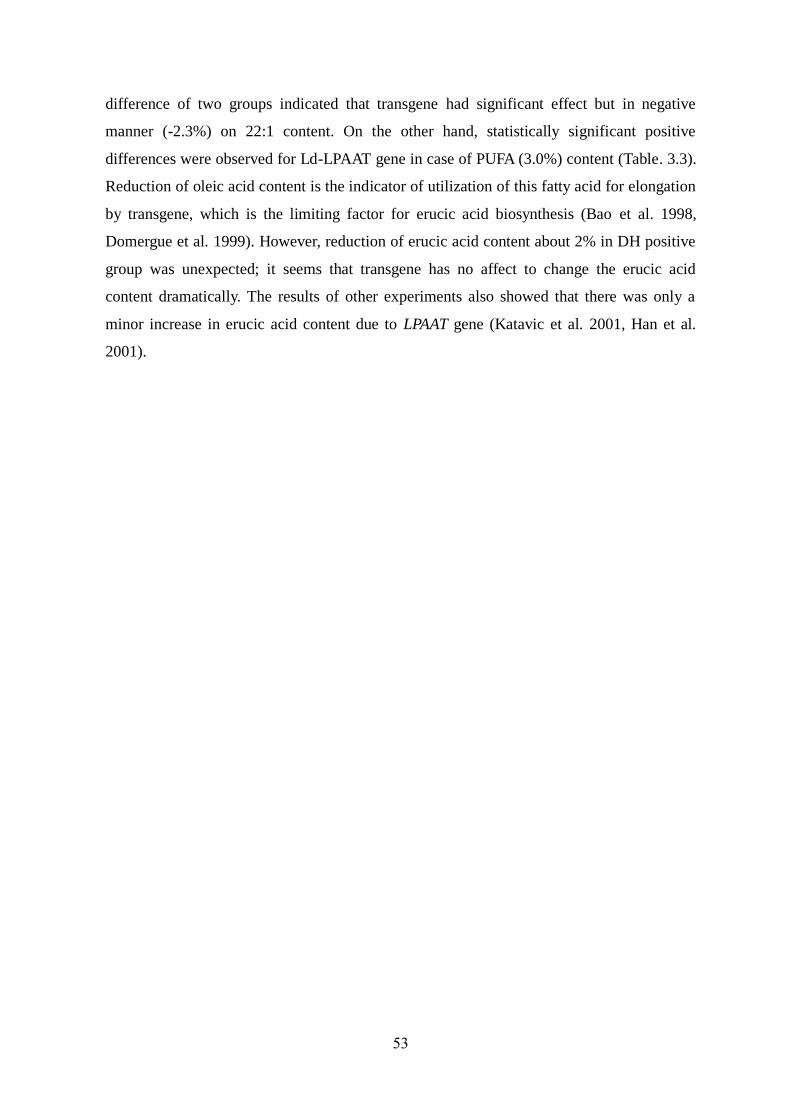
53
difference of two groups indicated that transgene had significant effect but in negative
manner (-2.3%) on 22:1 content. On the other hand, statistically significant positive
differences were observed for Ld-LPAAT gene in case of PUFA (3.0%) content (Table. 3.3).
Reduction of oleic acid content is the indicator of utilization of this fatty acid for elongation
by transgene, which is the limiting factor for erucic acid biosynthesis (Bao et al. 1998,
Domergue et al. 1999). However, reduction of erucic acid content about 2% in DH positive
group was unexpected; it seems that transgene has no affect to change the erucic acid
content dramatically. The results of other experiments also showed that there was only a
minor increase in erucic acid content due to LPAAT gene (Katavic et al. 2001, Han et al.
2001).
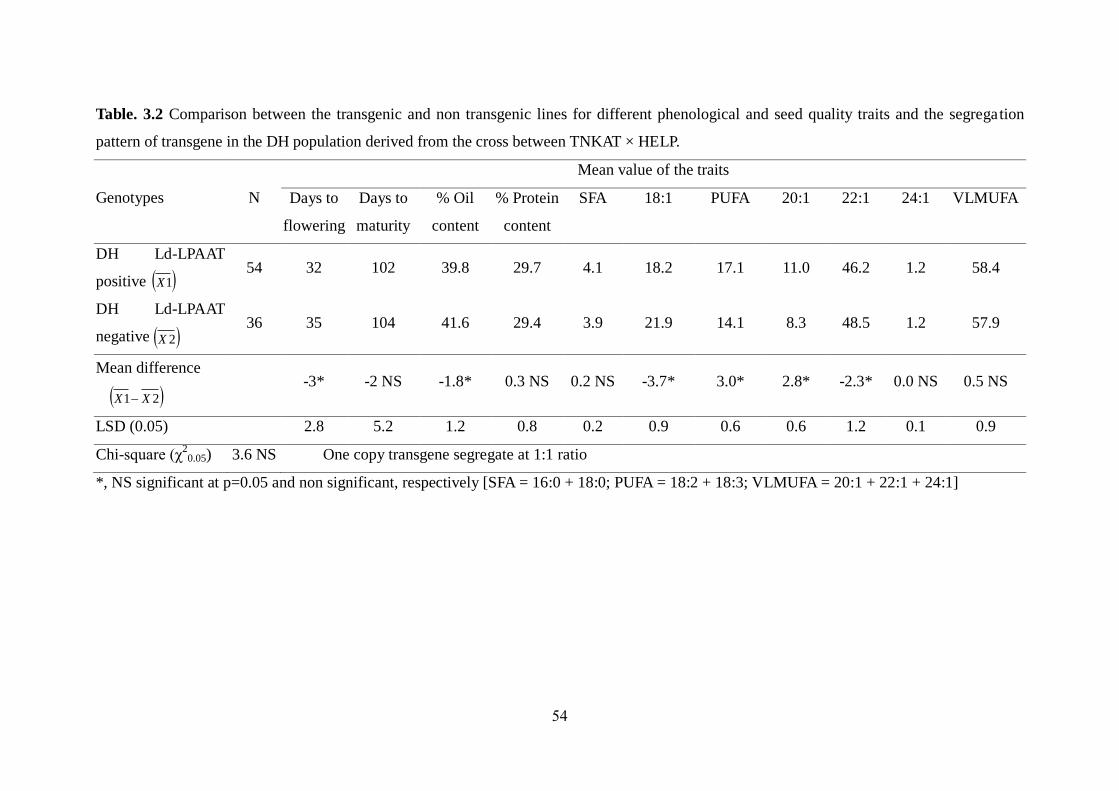
54
Table. 3.2 Comparison between the transgenic and non transgenic lines for different phenological and seed quality traits and the segregation
pattern of transgene in the DH population derived from the cross between TNKAT × HELP.
Genotypes N
Mean value of the traits
Days to
flowering
Days to
maturity
% Oil
content
% Protein
content
SFA 18:1 PUFA 20:1 22:1 24:1 VLMUFA
DH Ld-LPAAT
positive 54 32 102 39.8 29.7 4.1 18.2 17.1 11.0 46.2 1.2 58.4
DH Ld-LPAAT
negative 36 35 104 41.6 29.4 3.9 21.9 14.1 8.3 48.5 1.2 57.9
Mean difference
-3* -2 NS -1.8* 0.3 NS 0.2 NS -3.7* 3.0* 2.8* -2.3* 0.0 NS 0.5 NS
LSD (0.05) 2.8 5.2 1.2 0.8 0.2 0.9 0.6 0.6 1.2 0.1 0.9
Chi-square (χ20.05) 3.6 NS One copy transgene segregate at 1:1 ratio
*, NS significant at p=0.05 and non significant, respectively [SFA = 16:0 + 18:0; PUFA = 18:2 + 18:3; VLMUFA = 20:1 + 22:1 + 24:1]
1X
2X
21 XX
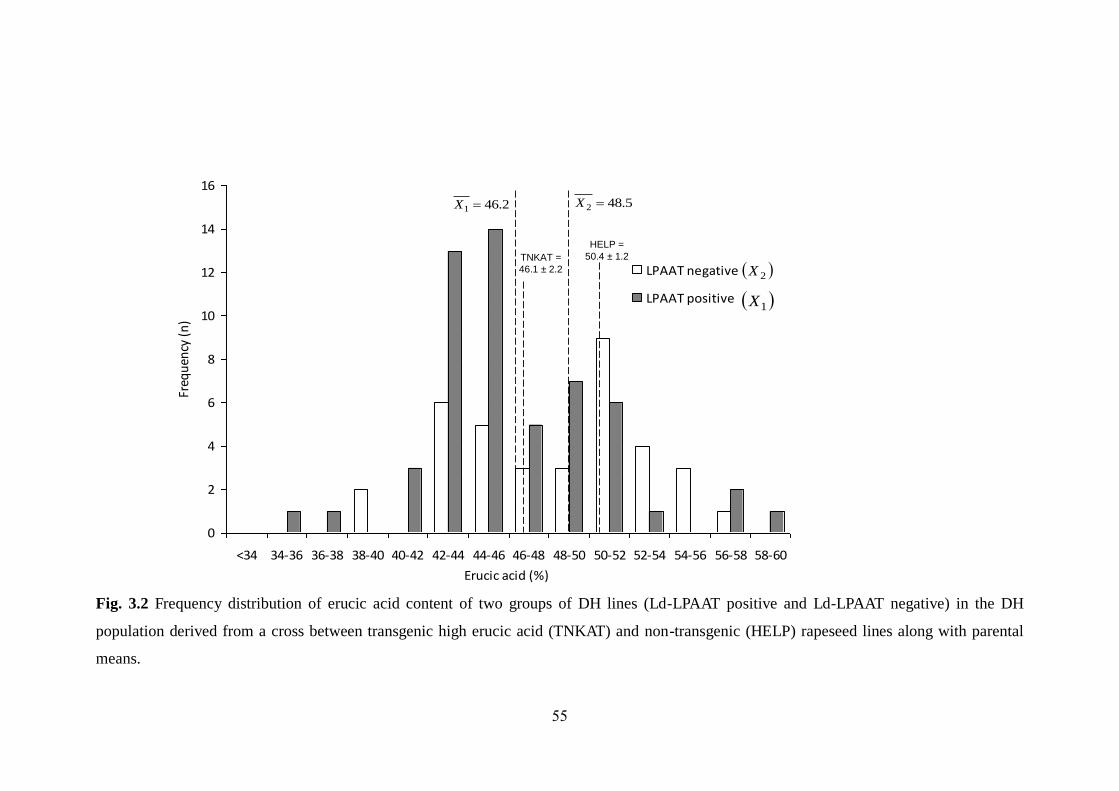
55
0
2
4
6
8
10
12
14
16
<34 34-36 36-38 38-40 40-42 42-44 44-46 46-48 48-50 50-52 52-54 54-56 56-58 58-60
Erucic acid (%)
Freq
uen
cy (
n)
LPAAT negative
LPAAT positive
2X
1X
5.482 X2.461 X
TNKAT =
46.1 ± 2.2
HELP =
50.4 ± 1.2
Fig. 3.2 Frequency distribution of erucic acid content of two groups of DH lines (Ld-LPAAT positive and Ld-LPAAT negative) in the DH
population derived from a cross between transgenic high erucic acid (TNKAT) and non-transgenic (HELP) rapeseed lines along with parental
means.
56
3.3.3 Effect of PUFA content on erucic acid content and other traits
Since, Ld-LPAAT transgene did not show any considerable effect on erucic acid content, in
a next step it was investigated the effect of PUFA content on erucic content and other traits.
The effect of PUFA content was investigated by comparing the mean between two groups of
DH lines (low PUFA and high PUFA content) using least significant difference (LSD) test.
Mean PUFA content of the low and high PUFA class indicated that PUFA alleles had
significant effect (3.7%) to increase 22:1 content (Table. 3.3 ). The mean difference of two
groups indicated that low PUFA alleles also have positive effect on days to flowering (3
days), oil content (1.8%) and oleic acid content (5.6%). On the other hand, statistically
significant negative differences were observed for low PUFA alleles in case of protein
(-1.6%), SFA (-0.7%) and PUFA (-8.1%) content. There were no statistical differences for
days to maturity, 20:1, 24:1 and VLMUFA content (Table. 3. 3).
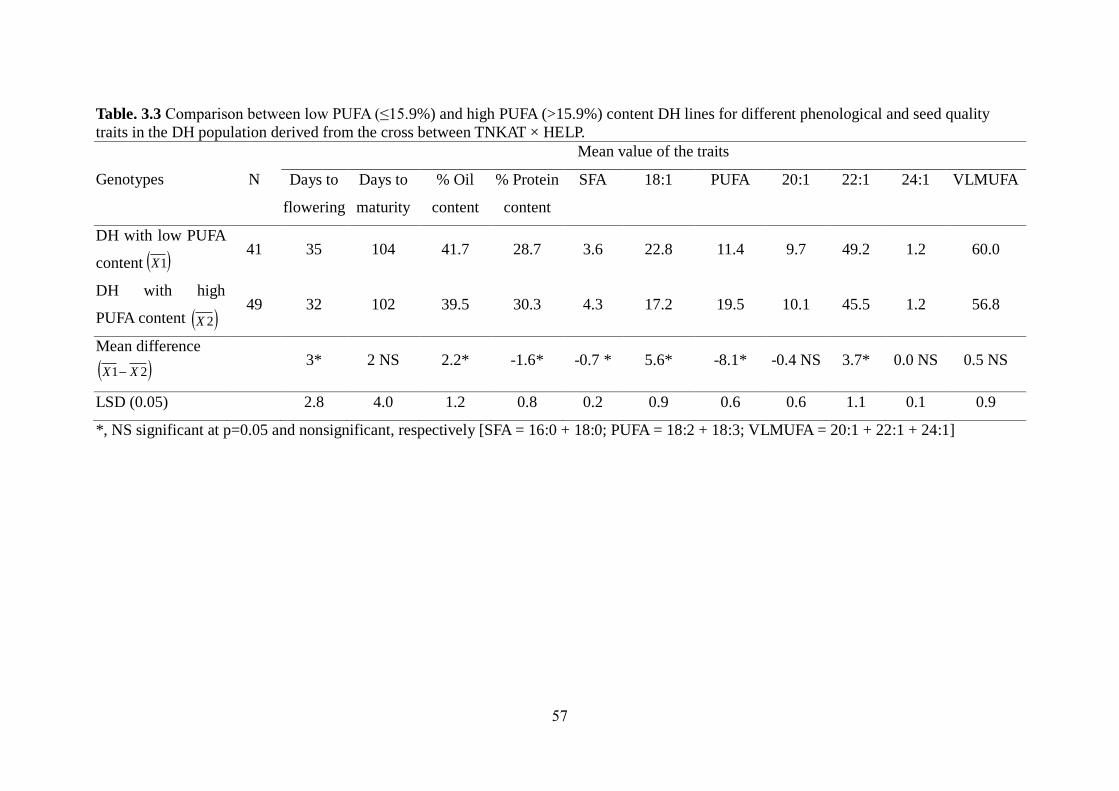
57
Table. 3.3 Comparison between low PUFA (≤15.9%) and high PUFA (>15.9%) content DH lines for different phenological and seed quality
traits in the DH population derived from the cross between TNKAT × HELP.
Genotypes N
Mean value of the traits
Days to
flowering
Days to
maturity
% Oil
content
% Protein
content
SFA 18:1 PUFA 20:1 22:1 24:1 VLMUFA
DH with low PUFA
content 41 35 104 41.7 28.7 3.6 22.8 11.4 9.7 49.2 1.2 60.0
DH with high
PUFA content 49 32 102 39.5 30.3 4.3 17.2 19.5 10.1 45.5 1.2 56.8
Mean difference
3* 2 NS 2.2* -1.6* -0.7 * 5.6* -8.1* -0.4 NS 3.7* 0.0 NS 0.5 NS
LSD (0.05) 2.8 4.0 1.2 0.8 0.2 0.9 0.6 0.6 1.1 0.1 0.9
*, NS significant at p=0.05 and nonsignificant, respectively [SFA = 16:0 + 18:0; PUFA = 18:2 + 18:3; VLMUFA = 20:1 + 22:1 + 24:1]
1X
2X
21 XX
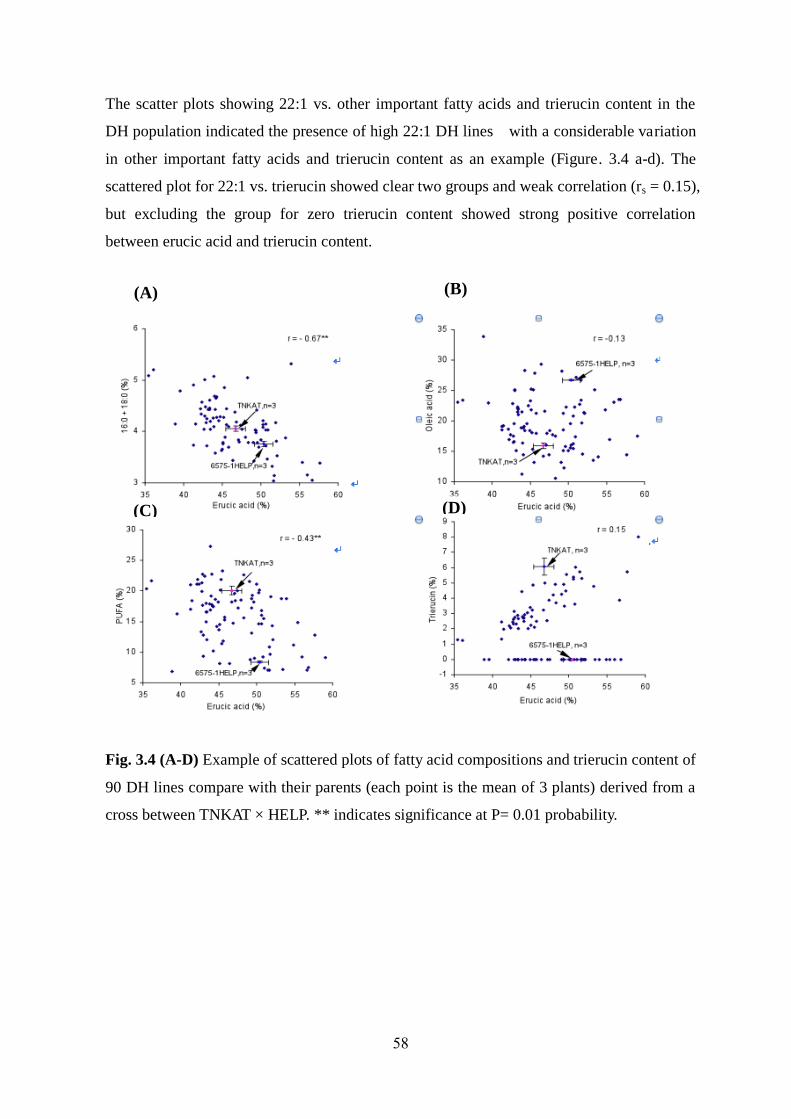
58
The scatter plots showing 22:1 vs. other important fatty acids and trierucin content in the
DH population indicated the presence of high 22:1 DH lines with a considerable variation
in other important fatty acids and trierucin content as an example (Figure. 3.4 a-d). The
scattered plot for 22:1 vs. trierucin showed clear two groups and weak correlation (rs = 0.15),
but excluding the group for zero trierucin content showed strong positive correlation
between erucic acid and trierucin content.
Fig. 3.4 (A-D) Example of scattered plots of fatty acid compositions and trierucin content of
90 DH lines compare with their parents (each point is the mean of 3 plants) derived from a
cross between TNKAT × HELP. ** indicates significance at P= 0.01 probability.
(A) (B)
(C) (D)
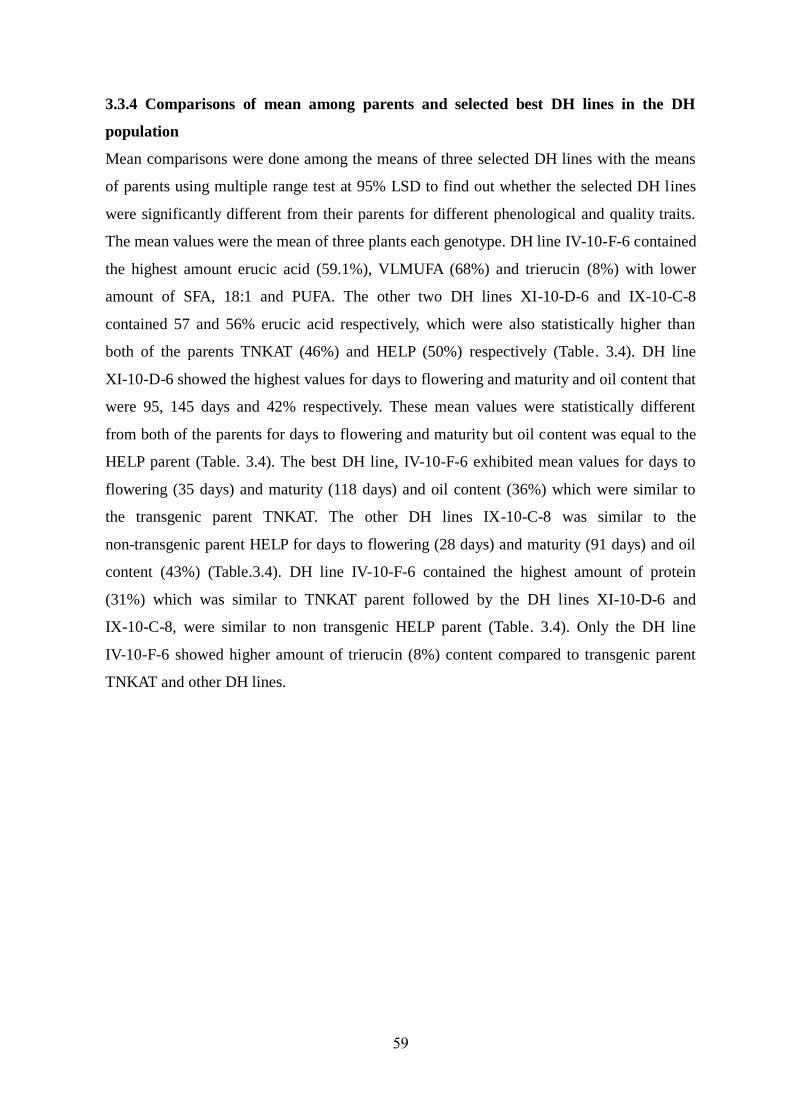
59
3.3.4 Comparisons of mean among parents and selected best DH lines in the DH
population
Mean comparisons were done among the means of three selected DH lines with the means
of parents using multiple range test at 95% LSD to find out whether the selected DH lines
were significantly different from their parents for different phenological and quality traits.
The mean values were the mean of three plants each genotype. DH line IV-10-F-6 contained
the highest amount erucic acid (59.1%), VLMUFA (68%) and trierucin (8%) with lower
amount of SFA, 18:1 and PUFA. The other two DH lines XI-10-D-6 and IX-10-C-8
contained 57 and 56% erucic acid respectively, which were also statistically higher than
both of the parents TNKAT (46%) and HELP (50%) respectively (Table. 3.4). DH line
XI-10-D-6 showed the highest values for days to flowering and maturity and oil content that
were 95, 145 days and 42% respectively. These mean values were statistically different
from both of the parents for days to flowering and maturity but oil content was equal to the
HELP parent (Table. 3.4). The best DH line, IV-10-F-6 exhibited mean values for days to
flowering (35 days) and maturity (118 days) and oil content (36%) which were similar to
the transgenic parent TNKAT. The other DH lines IX-10-C-8 was similar to the
non-transgenic parent HELP for days to flowering (28 days) and maturity (91 days) and oil
content (43%) (Table.3.4). DH line IV-10-F-6 contained the highest amount of protein
(31%) which was similar to TNKAT parent followed by the DH lines XI-10-D-6 and
IX-10-C-8, were similar to non transgenic HELP parent (Table. 3.4). Only the DH line
IV-10-F-6 showed higher amount of trierucin (8%) content compared to transgenic parent
TNKAT and other DH lines.
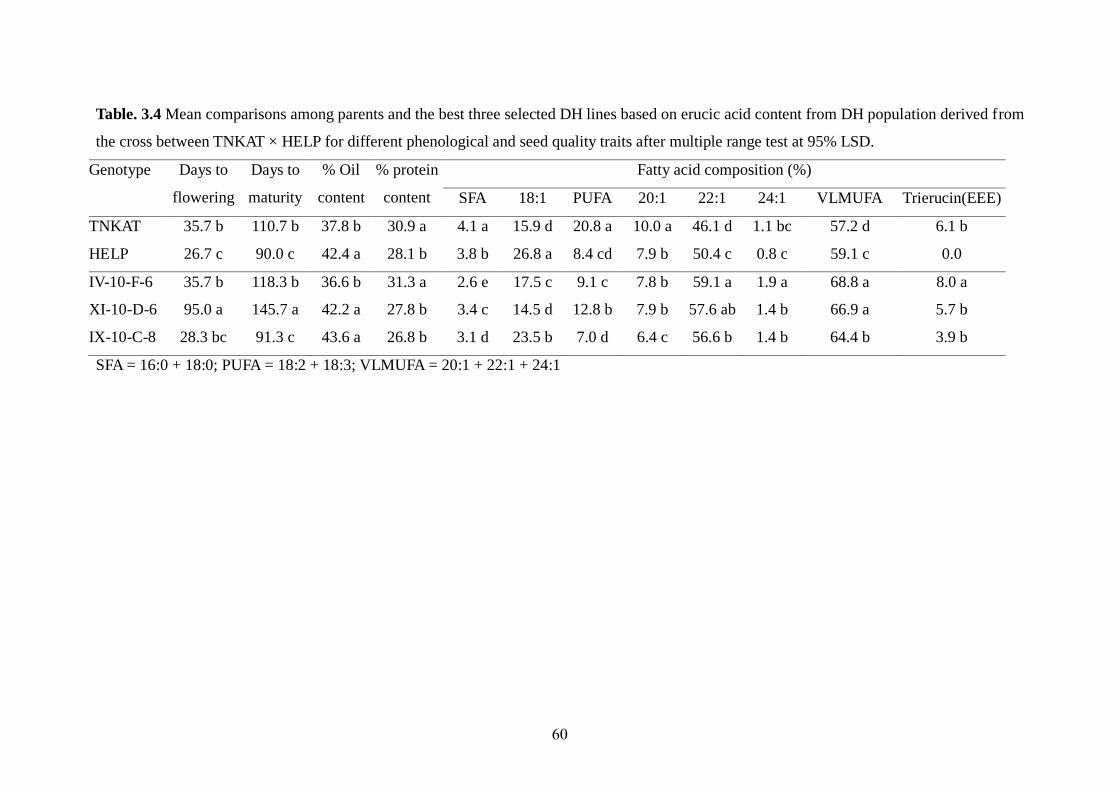
60
Table. 3.4 Mean comparisons among parents and the best three selected DH lines based on erucic acid content from DH population derived from
the cross between TNKAT × HELP for different phenological and seed quality traits after multiple range test at 95% LSD.
Genotype Days to
flowering
Days to
maturity
% Oil
content
% protein
content
Fatty acid composition (%)
SFA 18:1 PUFA 20:1 22:1 24:1 VLMUFA Trierucin(EEE)
TNKAT 35.7 b 110.7 b 37.8 b 30.9 a 4.1 a 15.9 d 20.8 a 10.0 a 46.1 d 1.1 bc 57.2 d 6.1 b
HELP 26.7 c 90.0 c 42.4 a 28.1 b 3.8 b 26.8 a 8.4 cd 7.9 b 50.4 c 0.8 c 59.1 c 0.0
IV-10-F-6 35.7 b 118.3 b 36.6 b 31.3 a 2.6 e 17.5 c 9.1 c 7.8 b 59.1 a 1.9 a 68.8 a 8.0 a
XI-10-D-6 95.0 a 145.7 a 42.2 a 27.8 b 3.4 c 14.5 d 12.8 b 7.9 b 57.6 ab 1.4 b 66.9 a 5.7 b
IX-10-C-8 28.3 bc 91.3 c 43.6 a 26.8 b 3.1 d 23.5 b 7.0 d 6.4 c 56.6 b 1.4 b 64.4 b 3.9 b
SFA = 16:0 + 18:0; PUFA = 18:2 + 18:3; VLMUFA = 20:1 + 22:1 + 24:1
61
Reference
Bao X, Pollard M, Ohlrogge J (1998) The biosynthesis of erucic acid in developing
embryos of Brassica rapa. Plant Physiol 118:183–190
Cassagne C, Lessire R, Bessoule JJ, Moreau P, Creach A, Schneider F, Sturbois B
(1994) Biosynthesis of very long chain fatty acids in higher plants. Prog Lipid Res
33:55-69
Craig A, Millan S (1995) Modification of oilseed rape to produce oils for industrial use
by means of applied tissue culture methodology. Euphytica 85:323-327
Domergue F, Chevalier S, Santarelli X, Cassagne C, Lessire R (1999) Evidence that
oleoyl-CoA and ATP-dependent elongations coexist in rapeseed (Brassica napus
L.). Eur J Biochem 263:464–470
Ecke W, Uzunova M, Weissleder K(1995) Mapping the genome of rapeseed (Brassica
napus L.) II. Localization of genes controlling erucic acid synthesis and seed oil
content. TheorAppl Genet 91:972–977
Fletcher R, Conventry J, Kott LS (1998) Double haploid technology for spring and
winter Brassica napus. Department of Plant Agriculture, Technical Bulletin, OAC
publication, University of Guelph, Canada
Fourmann M, Barret P, Renard M, Pelletier G, Delourme R, Brunel D (1998) The two
genes homologous to Arabidopsis FAE1 co-segregate with the two loci governing
erucic acid content in Brassica napus. Theor Appl Genet 96:852–858
Frentzen M (1993) Acyltransferases and triacylglycerols. In: Moore TS Jr (ed) Lipid
metabolism in plants. CRC, Boca Raton, pp 195–220
Friedt W, Lühs W (1998) Recent development and perspectives of industrial rapeseed
breeding. Fett/Lipid 100:219–226
Getinet A, Rakow G, Raney JP, Downey RK (1997) The inheritance of erucic acid
content in Ethiopian mustard. Can J Plant Sci 77:33-41
Gomez KA, Gomez AA (1976) Statistical procedures for agricultural research with
emphasis on rice. IRRI, Los Banos
Han J, Lühs W, Sonntag K, Zahringer U, Borchardt DS, Wolter FP, Heinz E, Frentzen M
(2001) Functional characterization of β-ketoacyl-CoA synthase genes from
Brassica napus L. Plant Mol Biol 46:229–239
62
Jönsson R (1977) Erucic acid heredity in rapeseed (Brassica napus L. and Brassica
campestris L). Hereditas 86:159-170
Katavic V, Friesen W, Barton DL, Gossen KK, Giblin EM, Luciw T, An J, Zou J,
MacKenzie SL, Keller WA, Males D, Taylor DC (2001) Improving erucic acid
content in rapeseed through biotechnology: What can the Arabidopsis FAE1 and the
yeast SLC1–1 genes contribute? Crop Sci 41:739–747
Kirk JTO, Hurlstone CG (1983) Variation and inheritance of erucic acid content in
Brassica juncea. Zeitschrift für Pflanzenzüchtung. Plant Breed 90:331-338
Lynch M, Walsh B (1998) Genetics and analysis of quantitative traits. Sinauer
Associates Inc. Sunderland, Massachusetts, pp 823-831
Möllers C, Lühs W, Schaffert E, Thies W (1997) High-temperature gas chromatography
for the detection of trierucoylglycerol in the seed oil of transgenic rapeseed
(Brassica napus L.). Fett/Lipid 99:362-356
Sasongko ND, Möllers M (2005) Toward increasing erucic acid content in oilseed rape
(Brassica napus L.) through the combination with genes for high oleic acid. J Am
Oil Chem Soc 82:445-449
Scarth R, Tang J (2006) Modification of Brassica oil using conventional and
transgenic approaches. Crop Sci 46:1225–1236
Taylor DC, Magus JR, Bhella R, Zou JT, MacKenzie SL, Giblin EM et al (1992)
Biosynthesis of triacylglycerols in Brassica napus L. cv Reston; Target: trierucin.
In: Mac-Kenzie SL, Taylor DC (eds) Seed oils for the future. Am Oil Chem Soc,
Champaign, IL, pp 77–102
Tillmann P (2007) http://www.vdlufa.de/nirs. (Site visited 12 June 2012).
Utz HF (2007) PLABSTAT (Version 2N) A computer program for the computation of
variances and covariances. Institute of Plant Breeding, Seed Science, and
Population Genetics, University of Hohenheim, Stuttgart, Germany
(http://www.uni-hohenheim.de/ipspwww/soft.html cited 25 August 2012)
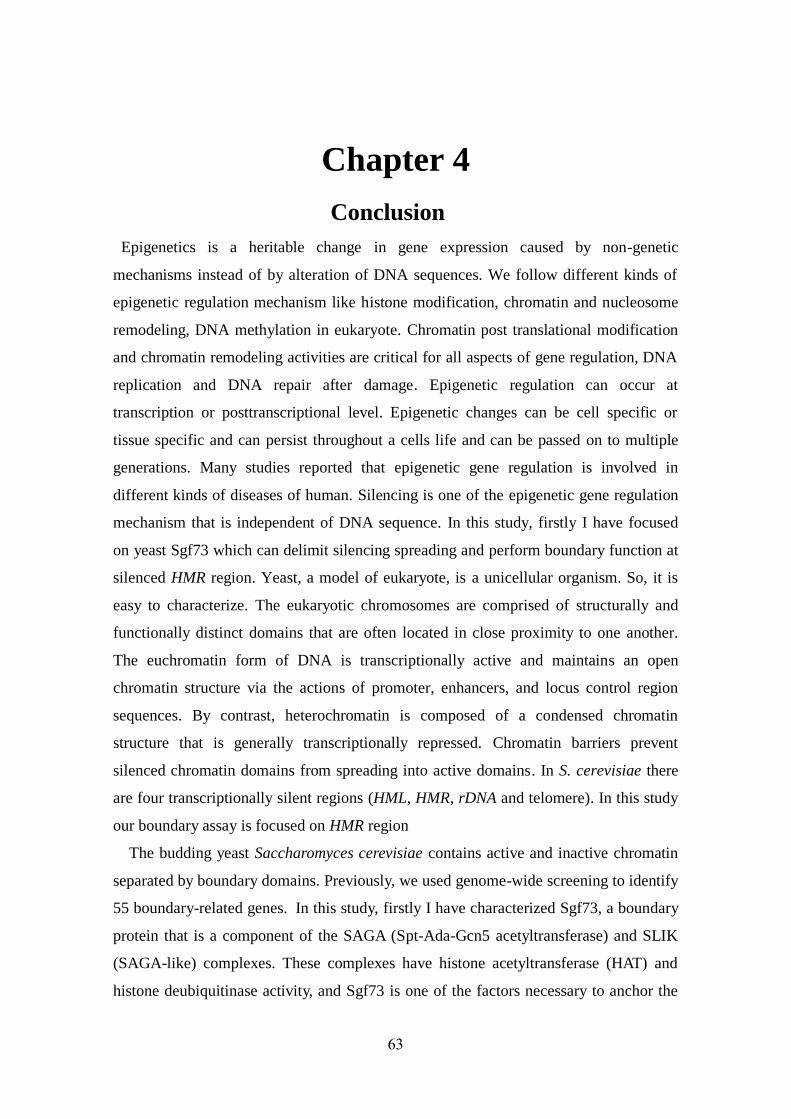
63
Chapter 4
Conclusion
Epigenetics is a heritable change in gene expression caused by non-genetic
mechanisms instead of by alteration of DNA sequences. We follow different kinds of
epigenetic regulation mechanism like histone modification, chromatin and nucleosome
remodeling, DNA methylation in eukaryote. Chromatin post translational modification
and chromatin remodeling activities are critical for all aspects of gene regulation, DNA
replication and DNA repair after damage. Epigenetic regulation can occur at
transcription or posttranscriptional level. Epigenetic changes can be cell specific or
tissue specific and can persist throughout a cells life and can be passed on to multiple
generations. Many studies reported that epigenetic gene regulation is involved in
different kinds of diseases of human. Silencing is one of the epigenetic gene regulation
mechanism that is independent of DNA sequence. In this study, firstly I have focused
on yeast Sgf73 which can delimit silencing spreading and perform boundary function at
silenced HMR region. Yeast, a model of eukaryote, is a unicellular organism. So, it is
easy to characterize. The eukaryotic chromosomes are comprised of structurally and
functionally distinct domains that are often located in close proximity to one another.
The euchromatin form of DNA is transcriptionally active and maintains an open
chromatin structure via the actions of promoter, enhancers, and locus control region
sequences. By contrast, heterochromatin is composed of a condensed chromatin
structure that is generally transcriptionally repressed. Chromatin barriers prevent
silenced chromatin domains from spreading into active domains. In S. cerevisiae there
are four transcriptionally silent regions (HML, HMR, rDNA and telomere). In this study
our boundary assay is focused on HMR region
The budding yeast Saccharomyces cerevisiae contains active and inactive chromatin
separated by boundary domains. Previously, we used genome-wide screening to identify
55 boundary-related genes. In this study, firstly I have characterized Sgf73, a boundary
protein that is a component of the SAGA (Spt-Ada-Gcn5 acetyltransferase) and SLIK
(SAGA-like) complexes. These complexes have histone acetyltransferase (HAT) and
histone deubiquitinase activity, and Sgf73 is one of the factors necessary to anchor the
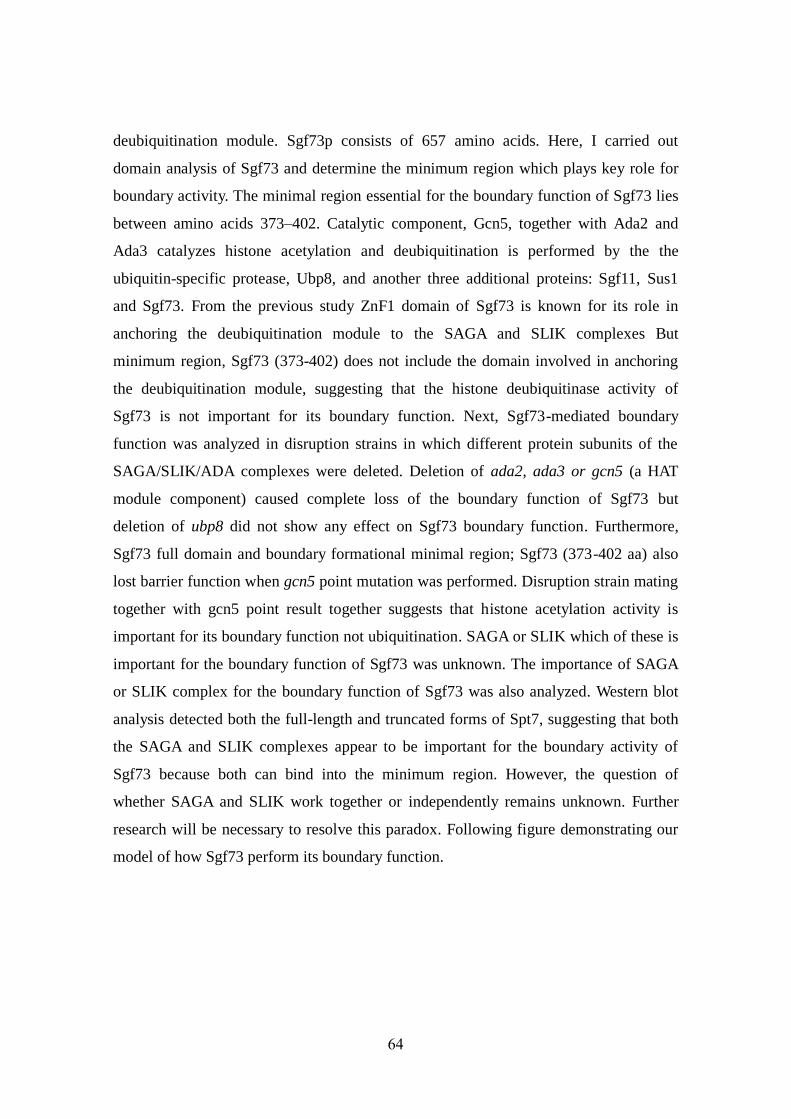
64
deubiquitination module. Sgf73p consists of 657 amino acids. Here, I carried out
domain analysis of Sgf73 and determine the minimum region which plays key role for
boundary activity. The minimal region essential for the boundary function of Sgf73 lies
between amino acids 373–402. Catalytic component, Gcn5, together with Ada2 and
Ada3 catalyzes histone acetylation and deubiquitination is performed by the the
ubiquitin-specific protease, Ubp8, and another three additional proteins: Sgf11, Sus1
and Sgf73. From the previous study ZnF1 domain of Sgf73 is known for its role in
anchoring the deubiquitination module to the SAGA and SLIK complexes But
minimum region, Sgf73 (373-402) does not include the domain involved in anchoring
the deubiquitination module, suggesting that the histone deubiquitinase activity of
Sgf73 is not important for its boundary function. Next, Sgf73-mediated boundary
function was analyzed in disruption strains in which different protein subunits of the
SAGA/SLIK/ADA complexes were deleted. Deletion of ada2, ada3 or gcn5 (a HAT
module component) caused complete loss of the boundary function of Sgf73 but
deletion of ubp8 did not show any effect on Sgf73 boundary function. Furthermore,
Sgf73 full domain and boundary formational minimal region; Sgf73 (373-402 aa) also
lost barrier function when gcn5 point mutation was performed. Disruption strain mating
together with gcn5 point result together suggests that histone acetylation activity is
important for its boundary function not ubiquitination. SAGA or SLIK which of these is
important for the boundary function of Sgf73 was unknown. The importance of SAGA
or SLIK complex for the boundary function of Sgf73 was also analyzed. Western blot
analysis detected both the full-length and truncated forms of Spt7, suggesting that both
the SAGA and SLIK complexes appear to be important for the boundary activity of
Sgf73 because both can bind into the minimum region. However, the question of
whether SAGA and SLIK work together or independently remains unknown. Further
research will be necessary to resolve this paradox. Following figure demonstrating our
model of how Sgf73 perform its boundary function.
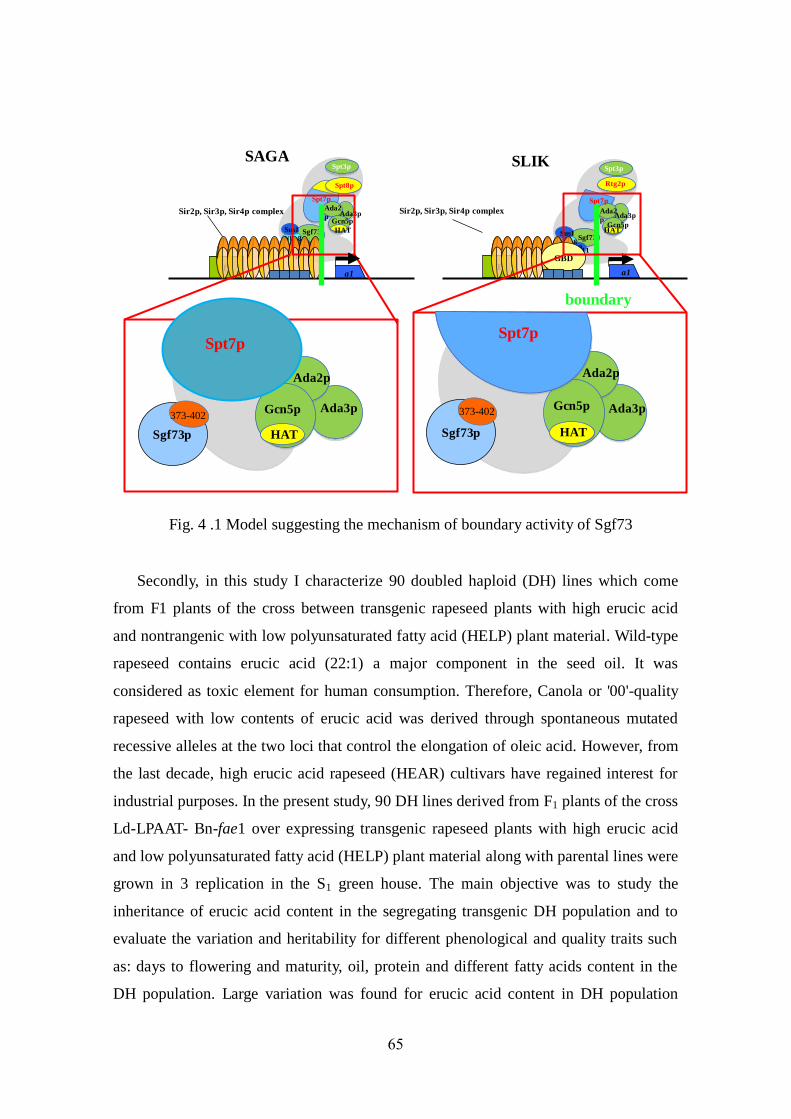
65
Fig. 4 .1 Model suggesting the mechanism of boundary activity of Sgf73
Secondly, in this study I characterize 90 doubled haploid (DH) lines which come
from F1 plants of the cross between transgenic rapeseed plants with high erucic acid
and nontrangenic with low polyunsaturated fatty acid (HELP) plant material. Wild-type
rapeseed contains erucic acid (22:1) a major component in the seed oil. It was
considered as toxic element for human consumption. Therefore, Canola or '00'-quality
rapeseed with low contents of erucic acid was derived through spontaneous mutated
recessive alleles at the two loci that control the elongation of oleic acid. However, from
the last decade, high erucic acid rapeseed (HEAR) cultivars have regained interest for
industrial purposes. In the present study, 90 DH lines derived from F1 plants of the cross
Ld-LPAAT- Bn-fae1 over expressing transgenic rapeseed plants with high erucic acid
and low polyunsaturated fatty acid (HELP) plant material along with parental lines were
grown in 3 replication in the S1 green house. The main objective was to study the
inheritance of erucic acid content in the segregating transgenic DH population and to
evaluate the variation and heritability for different phenological and quality traits such
as: days to flowering and maturity, oil, protein and different fatty acids content in the
DH population. Large variation was found for erucic acid content in DH population
Spt7p
Spt3p
Spt8p
Sus1
pUbp8
p
Sgf73
p
HAT
Gcn5p
Ada2
p
Sgf11
p
Ada3p
a1E
Sir2p, Sir3p, Sir4p complex
SAGA
Gcn5p
HAT
Ada3p
Ada2p
Sgf73p
373-402
Gcn5pHAT
Ada3pAda2
p
Spt7p
Sus1
p
Sgf11
p
Ubp8
p
Sgf73
p
Spt3p
Rtg2p
EGBD
boundary
a1
SLIK
Gcn5p
HAT
Ada3p
Ada2p
Sgf73p
373-402
Spt7pSpt7p
Sir2p, Sir3p, Sir4p complex
66
varied from 34.6% to 59.1%. Genetic variance components were large and significant
for all traits. The segregation pattern of erucic acid content showed 1:3:3:1 separation
suggesting erucic acid content was controlled by the alleles of three loci in the DH
population. Transgene Ld-LPAAT-Bn-fae1 showed negative effect (-2.7%) to change
the erucic acid content in the DH population. This result suggesting that there was no
effect of Bn-fae1 for increasing the erucic acid content or the absence of
β-ketoacyl-CoA synthase (KCS) activities required for initiating fatty acid elongation
from 18:1 to 22:1. On the other hand PUFA (Poly Unsaturated Fatty Acid) had effect to
increase the erucic acid content up to 3.7%. In presence of transgene Ld-LPAAT showed
limited activities to produce trierucin (8% instead of probable 20%) in the selected best
DH line. The selected DH lines showed increase in erucic acid content (59.1%)
compared to parental lines TNKAT (46.1%) and HELP (50.4%). Highest amount of
erucic acid might be achieved due to introgression of PUFA alleles with those of the
strong alleles of the indigenous erucic acid loci, because transgene showed negative
effect on erucic acid. There was no adverse effect of the high erucic content on other
phenological traits in the selected best DH line. In conclusion the result of this study
showed that erucic acid is inherited by alleles of three loci. The variation of erucic acid
has been achieved due to the combination of alleles of two indigenous erucic acid loci
with alleles of PUFA. Low in PUFA content could contribute markedly to increase
erucic acid than the transgene construct present in DH lines. The selected DH line
having 59% erucic acid could be source material for crossing to other high erucic acid
transgenic line to increase the erucic acid content.
67
Appendices
Protocol
Purification of PCR product for Ligation
1) Add an equal volume of PCR product membrane binding Solution.
2) Place Mini-column on the Collection Tube.
3) Move PCR product and membrane binding Solution into Mini-column, 1min
incubates.
4) Centrifuged at 14,000 rpm for 1min and then discard the liquid in the Collection
tube.
5) Add 500μl of Membrane Wash solution.
6) Centrifuge at 14,000 rpm, room temperature, 1min. Discard the liquid in the
Collection tube.
7) Add 500μl of Membrane Wash solution.
8) Centrifuge at 4,000 rpm, room temperature, 5min. Discard the liquid in the
Collection Tube.
9) Centrifuge at 14,000 rpm, room temperature, 1min.
10) Move Mini column to the blank and clean eppen.
11) Add a reasonable amount of TE Buffer.
12) Incubate 1min.
13) Centrifuge at 14,000 rpm, room temperature, 1min.
14) Electrophoresis check.
Purification of DNA from gel for ligation
1) Carry out gel electrophoresis with samples.
2) Cut the desired band from gel and transfer to an eppen-tube.
3) According to the weight of gel add Membrane Binding Solution and vortex (10 mg
gel equal with 10 ul Membrane Binding Solution).
4) Kept at 60 ° C until gel completely dissolved.
5) Place a Minicolumn onto Collection Tube.
6) Move all liquid to Minicolumn, 1min incubate.
7) Centrifuge at 14,000 rpm, room temperature, 1min. Discard the liquid in the
68
Collection tube.
8) Add 500 ul of Membrane Wash solution.
9) Centrifuge1 at 4,000 rpm, room temperature, 1min. Discard the liquid in the
Collection tube.
10) Add 500 ul of Membrane Wash solution.
11) Centrifuge1 at 14,000 rpm, room temperature, 5min. Discard the liquid in the
Collection tube.
12) Centrifuge at 14,000 rpm, room temperature, 1min
13) Transfer mini-column to the DNase free Eppen tube.
14 Add a reasonable amount of TE Buffer and incubate 1min.
15) Centrifuge at 14,000 rpm for 1 min
16) Electrophoresis check
Ligation and E.coli transformation
1) Mix the followings into eppentube
Vector proper quantity
Insert proper quantity
2x ligation mix 5 ul
Total 10 ul
2) 16°C 30 min.
3) Then add 100ul competent cell to the eppentube.
4) On ice, 20min.
5) 42°C, 45sec.
6) On ice, 5min.
7) Room temperature, 2min.
8) Add 200ul SOC and mix.
9) Keep at 37°C for 30min.
10) Spread on LB plate (including antibiotics such as ampicillin or Kanamycin).
11) 37°C, overnight.
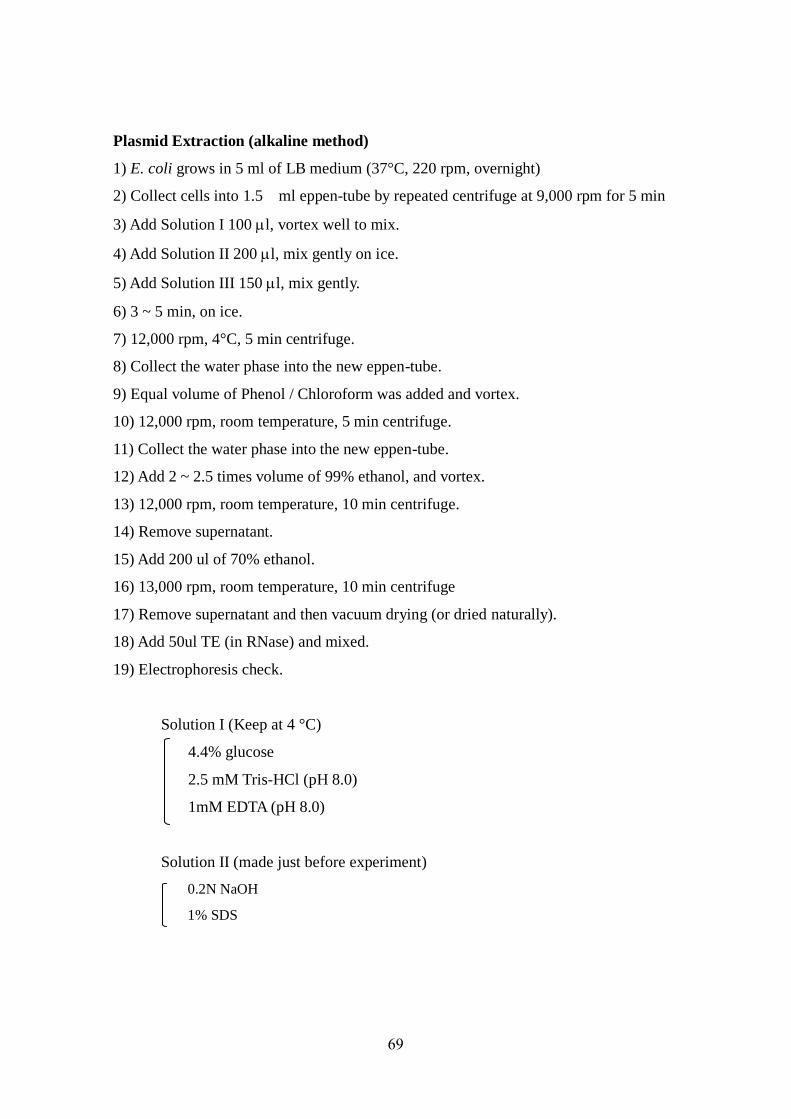
69
Plasmid Extraction (alkaline method)
1) E. coli grows in 5 ml of LB medium (37°C, 220 rpm, overnight)
2) Collect cells into 1.5 ml eppen-tube by repeated centrifuge at 9,000 rpm for 5 min
3) Add Solution I 100 l, vortex well to mix.
4) Add Solution II 200 l, mix gently on ice.
5) Add Solution III 150 l, mix gently.
6) 3 ~ 5 min, on ice.
7) 12,000 rpm, 4°C, 5 min centrifuge.
8) Collect the water phase into the new eppen-tube.
9) Equal volume of Phenol / Chloroform was added and vortex.
10) 12,000 rpm, room temperature, 5 min centrifuge.
11) Collect the water phase into the new eppen-tube.
12) Add 2 ~ 2.5 times volume of 99% ethanol, and vortex.
13) 12,000 rpm, room temperature, 10 min centrifuge.
14) Remove supernatant.
15) Add 200 ul of 70% ethanol.
16) 13,000 rpm, room temperature, 10 min centrifuge
17) Remove supernatant and then vacuum drying (or dried naturally).
18) Add 50ul TE (in RNase) and mixed.
19) Electrophoresis check.
Solution I (Keep at 4 °C)
4.4% glucose
2.5 mM Tris-HCl (pH 8.0)
1mM EDTA (pH 8.0)
Solution II (made just before experiment)
0.2N NaOH
1% SDS
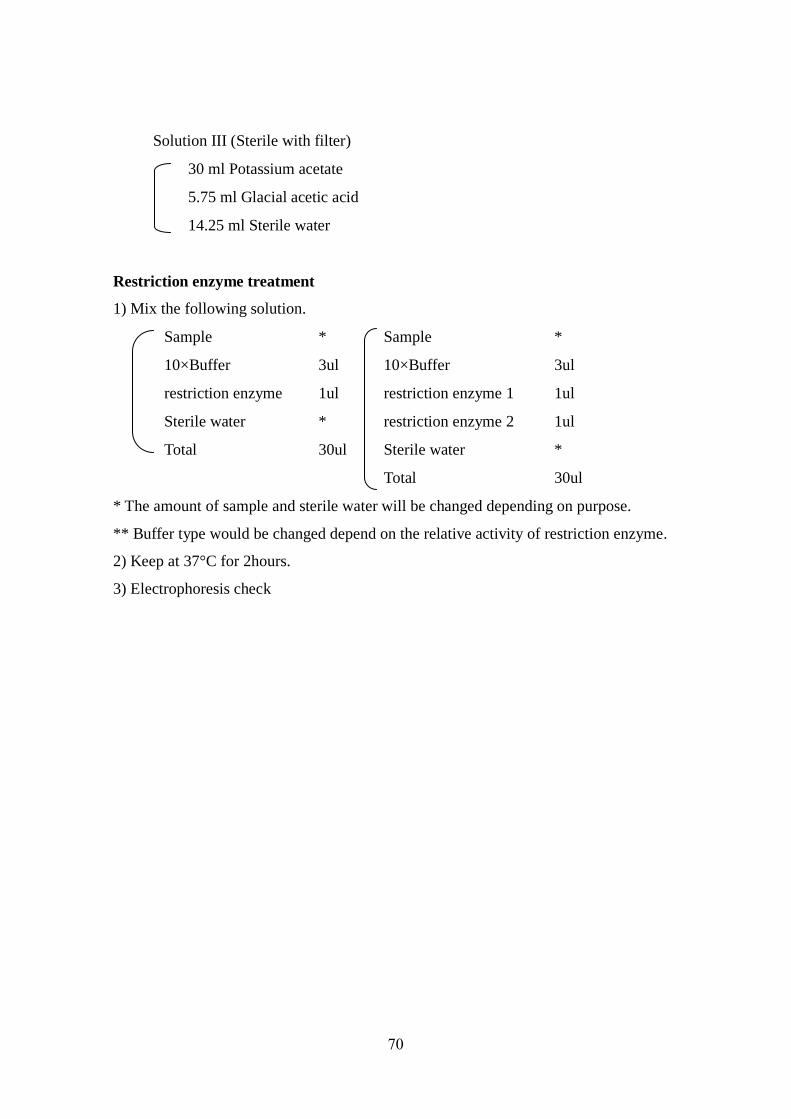
70
Solution III (Sterile with filter)
30 ml Potassium acetate
5.75 ml Glacial acetic acid
14.25 ml Sterile water
Restriction enzyme treatment
1) Mix the following solution.
Sample * Sample *
10×Buffer 3ul 10×Buffer 3ul
restriction enzyme 1ul restriction enzyme 1 1ul
Sterile water * restriction enzyme 2 1ul
Total 30ul Sterile water *
Total 30ul
* The amount of sample and sterile water will be changed depending on purpose.
** Buffer type would be changed depend on the relative activity of restriction enzyme.
2) Keep at 37°C for 2hours.
3) Electrophoresis check
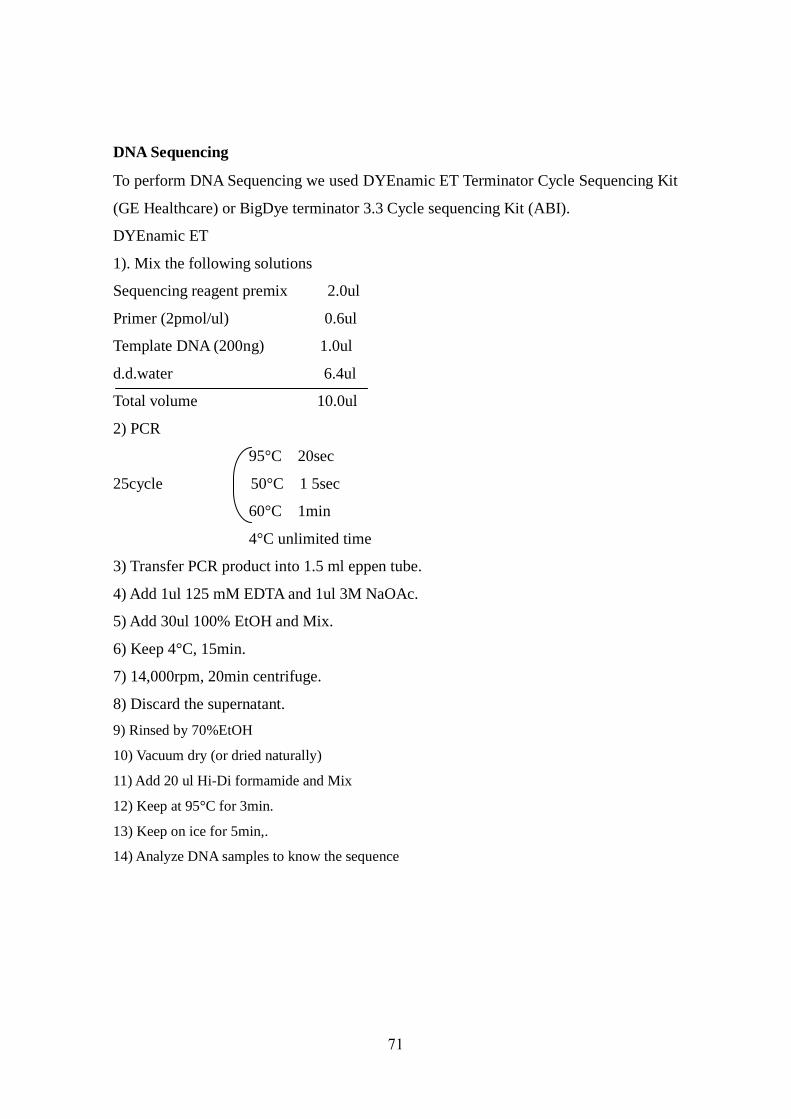
71
DNA Sequencing
To perform DNA Sequencing we used DYEnamic ET Terminator Cycle Sequencing Kit
(GE Healthcare) or BigDye terminator 3.3 Cycle sequencing Kit (ABI).
DYEnamic ET
1). Mix the following solutions
Sequencing reagent premix 2.0ul
Primer (2pmol/ul) 0.6ul
Template DNA (200ng) 1.0ul
d.d.water 6.4ul
Total volume 10.0ul
2) PCR
95°C 20sec
25cycle 50°C 1 5sec
60°C 1min
4°C unlimited time
3) Transfer PCR product into 1.5 ml eppen tube.
4) Add 1ul 125 mM EDTA and 1ul 3M NaOAc.
5) Add 30ul 100% EtOH and Mix.
6) Keep 4°C, 15min.
7) 14,000rpm, 20min centrifuge.
8) Discard the supernatant.
9) Rinsed by 70%EtOH
10) Vacuum dry (or dried naturally)
11) Add 20 ul Hi-Di formamide and Mix
12) Keep at 95°C for 3min.
13) Keep on ice for 5min,.
14) Analyze DNA samples to know the sequence
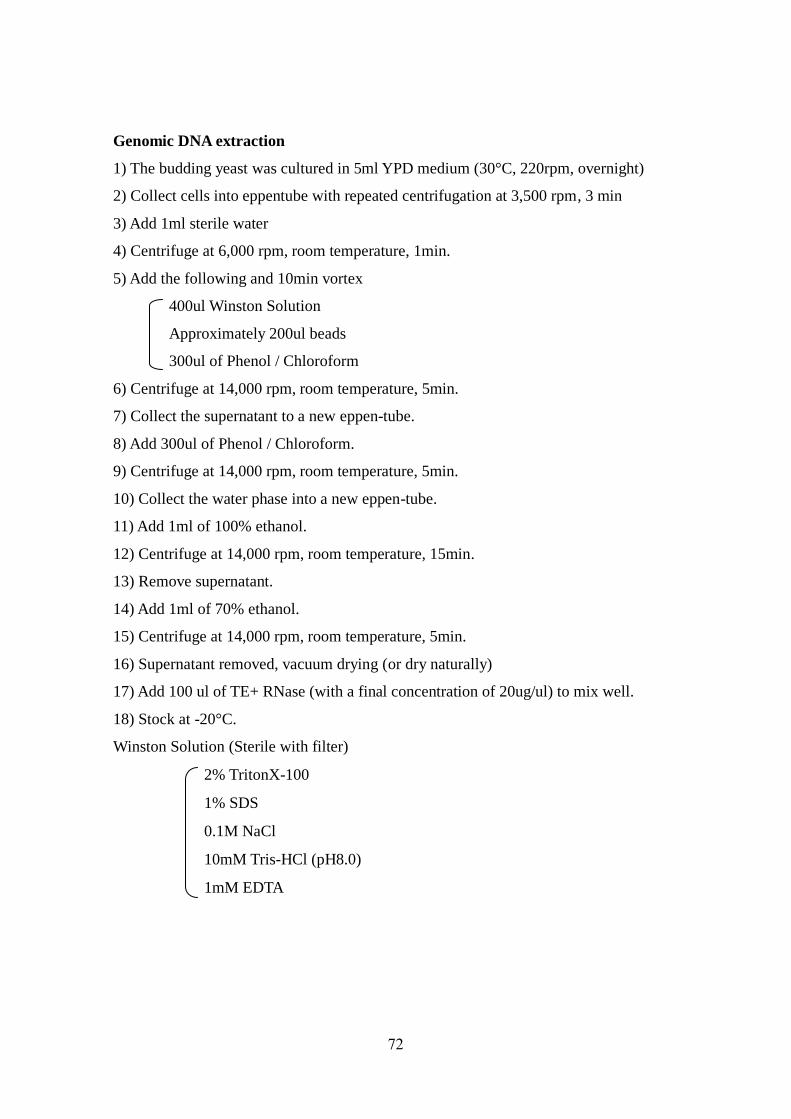
72
Genomic DNA extraction
1) The budding yeast was cultured in 5ml YPD medium (30°C, 220rpm, overnight)
2) Collect cells into eppentube with repeated centrifugation at 3,500 rpm, 3 min
3) Add 1ml sterile water
4) Centrifuge at 6,000 rpm, room temperature, 1min.
5) Add the following and 10min vortex
400ul Winston Solution
Approximately 200ul beads
300ul of Phenol / Chloroform
6) Centrifuge at 14,000 rpm, room temperature, 5min.
7) Collect the supernatant to a new eppen-tube.
8) Add 300ul of Phenol / Chloroform.
9) Centrifuge at 14,000 rpm, room temperature, 5min.
10) Collect the water phase into a new eppen-tube.
11) Add 1ml of 100% ethanol.
12) Centrifuge at 14,000 rpm, room temperature, 15min.
13) Remove supernatant.
14) Add 1ml of 70% ethanol.
15) Centrifuge at 14,000 rpm, room temperature, 5min.
16) Supernatant removed, vacuum drying (or dry naturally)
17) Add 100 ul of TE+ RNase (with a final concentration of 20ug/ul) to mix well.
18) Stock at -20°C.
Winston Solution (Sterile with filter)
2% TritonX-100
1% SDS
0.1M NaCl
10mM Tris-HCl (pH8.0)
1mM EDTA
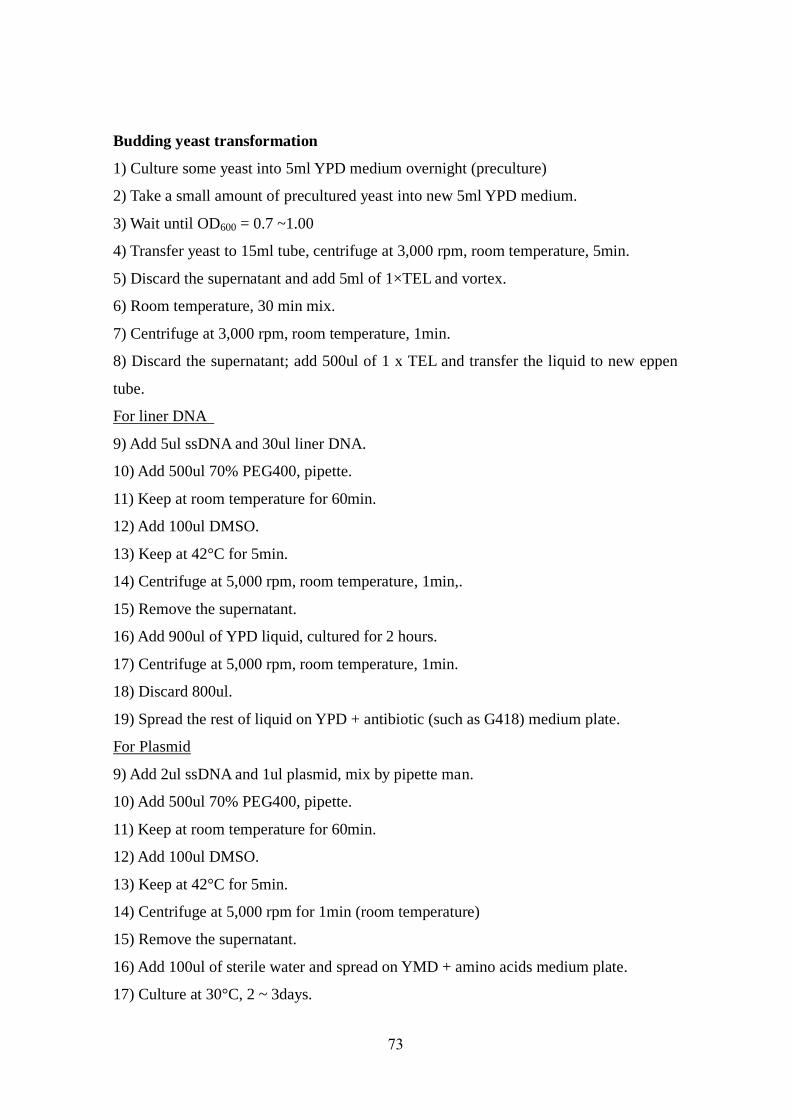
73
Budding yeast transformation
1) Culture some yeast into 5ml YPD medium overnight (preculture)
2) Take a small amount of precultured yeast into new 5ml YPD medium.
3) Wait until OD600 = 0.7 ~1.00
4) Transfer yeast to 15ml tube, centrifuge at 3,000 rpm, room temperature, 5min.
5) Discard the supernatant and add 5ml of 1×TEL and vortex.
6) Room temperature, 30 min mix.
7) Centrifuge at 3,000 rpm, room temperature, 1min.
8) Discard the supernatant; add 500ul of 1 x TEL and transfer the liquid to new eppen
tube.
For liner DNA
9) Add 5ul ssDNA and 30ul liner DNA.
10) Add 500ul 70% PEG400, pipette.
11) Keep at room temperature for 60min.
12) Add 100ul DMSO.
13) Keep at 42°C for 5min.
14) Centrifuge at 5,000 rpm, room temperature, 1min,.
15) Remove the supernatant.
16) Add 900ul of YPD liquid, cultured for 2 hours.
17) Centrifuge at 5,000 rpm, room temperature, 1min.
18) Discard 800ul.
19) Spread the rest of liquid on YPD + antibiotic (such as G418) medium plate.
For Plasmid
9) Add 2ul ssDNA and 1ul plasmid, mix by pipette man.
10) Add 500ul 70% PEG400, pipette.
11) Keep at room temperature for 60min.
12) Add 100ul DMSO.
13) Keep at 42°C for 5min.
14) Centrifuge at 5,000 rpm for 1min (room temperature)
15) Remove the supernatant.
16) Add 100ul of sterile water and spread on YMD + amino acids medium plate.
17) Culture at 30°C, 2 ~ 3days.
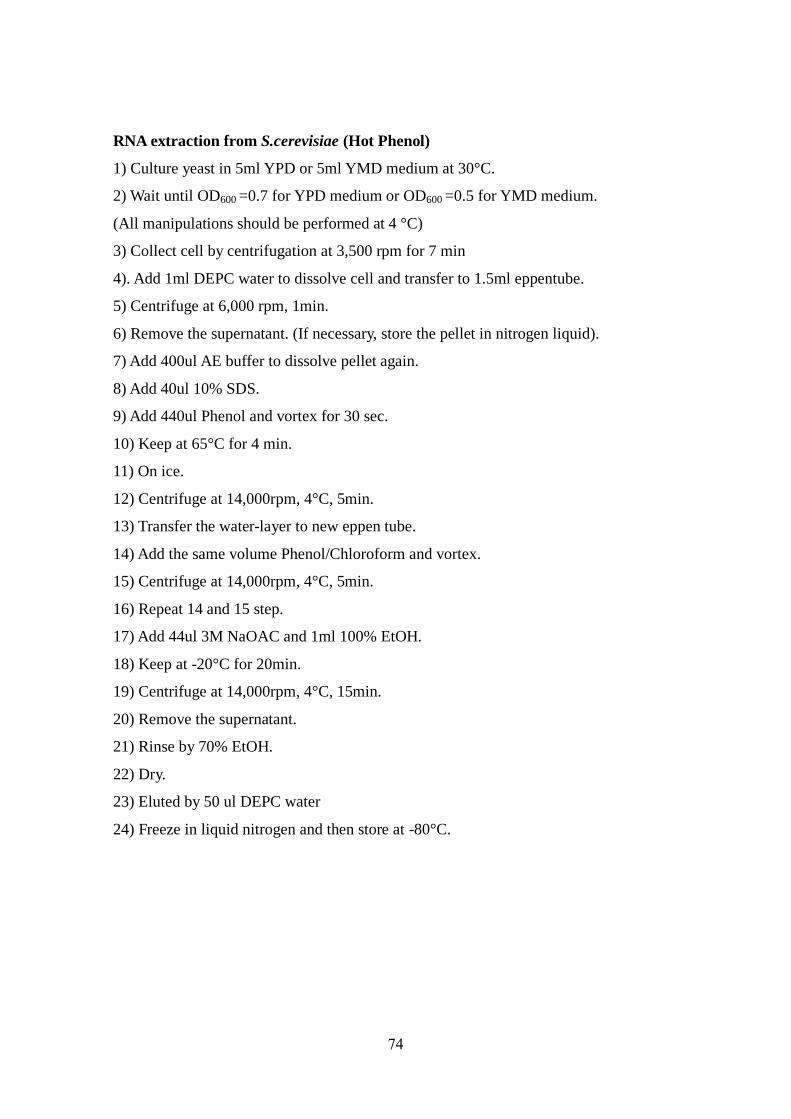
74
RNA extraction from S.cerevisiae (Hot Phenol)
1) Culture yeast in 5ml YPD or 5ml YMD medium at 30°C.
2) Wait until OD600 =0.7 for YPD medium or OD600 =0.5 for YMD medium.
(All manipulations should be performed at 4 °C)
3) Collect cell by centrifugation at 3,500 rpm for 7 min
4). Add 1ml DEPC water to dissolve cell and transfer to 1.5ml eppentube.
5) Centrifuge at 6,000 rpm, 1min.
6) Remove the supernatant. (If necessary, store the pellet in nitrogen liquid).
7) Add 400ul AE buffer to dissolve pellet again.
8) Add 40ul 10% SDS.
9) Add 440ul Phenol and vortex for 30 sec.
10) Keep at 65°C for 4 min.
11) On ice.
12) Centrifuge at 14,000rpm, 4°C, 5min.
13) Transfer the water-layer to new eppen tube.
14) Add the same volume Phenol/Chloroform and vortex.
15) Centrifuge at 14,000rpm, 4°C, 5min.
16) Repeat 14 and 15 step.
17) Add 44ul 3M NaOAC and 1ml 100% EtOH.
18) Keep at -20°C for 20min.
19) Centrifuge at 14,000rpm, 4°C, 15min.
20) Remove the supernatant.
21) Rinse by 70% EtOH.
22) Dry.
23) Eluted by 50 ul DEPC water
24) Freeze in liquid nitrogen and then store at -80°C.
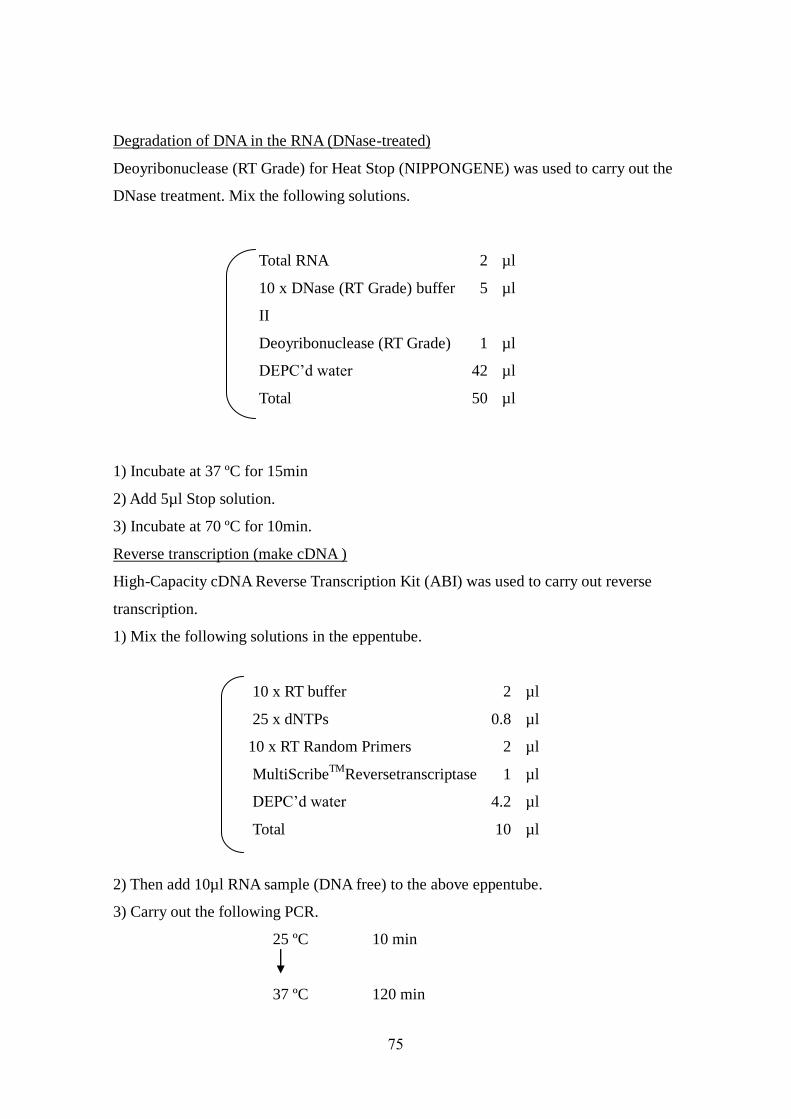
75
Degradation of DNA in the RNA (DNase-treated)
Deoyribonuclease (RT Grade) for Heat Stop (NIPPONGENE) was used to carry out the
DNase treatment. Mix the following solutions.
1) Incubate at 37 ºC for 15min
2) Add 5µl Stop solution.
3) Incubate at 70 ºC for 10min.
Reverse transcription (make cDNA )
High-Capacity cDNA Reverse Transcription Kit (ABI) was used to carry out reverse
transcription.
1) Mix the following solutions in the eppentube.
10 x RT buffer 2 µl
25 x dNTPs 0.8 µl
10 x RT Random Primers 2 µl
MultiScribeTM
Reversetranscriptase 1 µl
DEPC’d water 4.2 µl
Total 10 µl
2) Then add 10µl RNA sample (DNA free) to the above eppentube.
3) Carry out the following PCR.
25 ºC 10 min
37 ºC 120 min
Total RNA 2 µl
10 x DNase (RT Grade) buffer
II
5 µl
Deoyribonuclease (RT Grade) 1 µl
DEPC’d water 42 µl
Total 50 µl
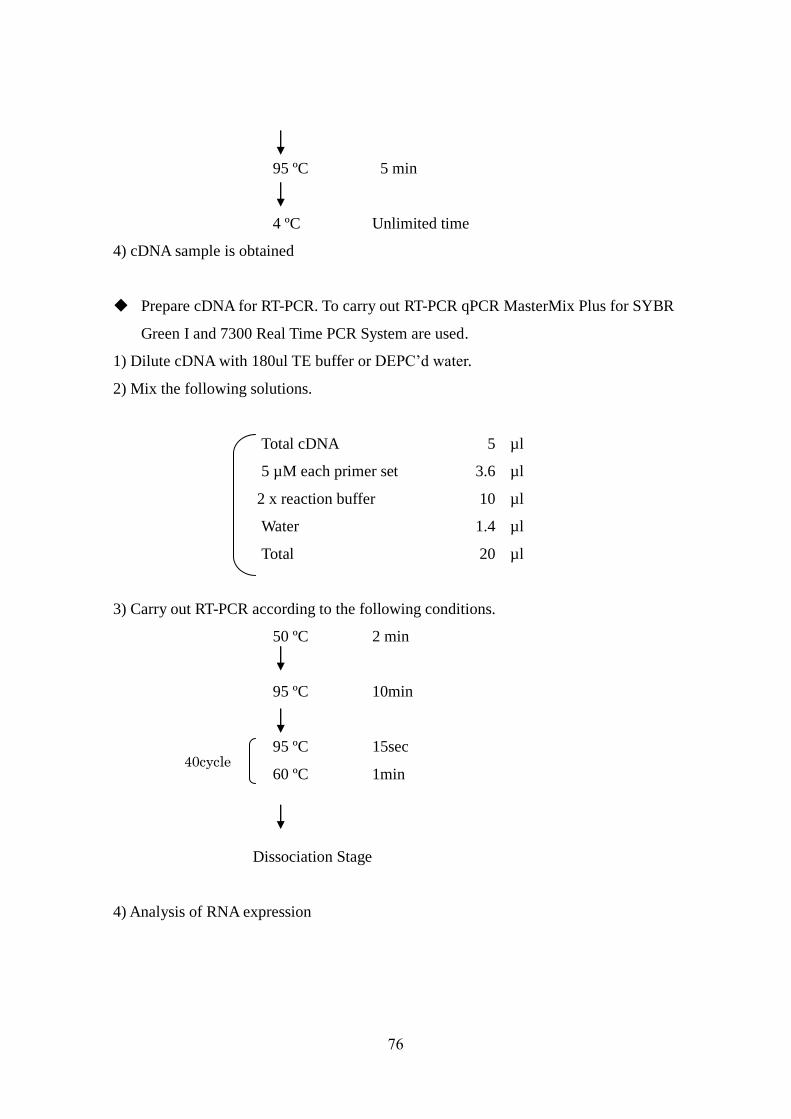
76
95 ºC 5 min
4 ºC Unlimited time
4) cDNA sample is obtained
Prepare cDNA for RT-PCR. To carry out RT-PCR qPCR MasterMix Plus for SYBR
Green I and 7300 Real Time PCR System are used.
1) Dilute cDNA with 180ul TE buffer or DEPC’d water.
2) Mix the following solutions.
Total cDNA 5 µl
5 µM each primer set 3.6 µl
2 x reaction buffer 10 µl
Water 1.4 µl
Total 20 µl
3) Carry out RT-PCR according to the following conditions.
50 ºC 2 min
95 ºC 10min
95 ºC 15sec
60 ºC 1min
Dissociation Stage
4) Analysis of RNA expression
40cycle
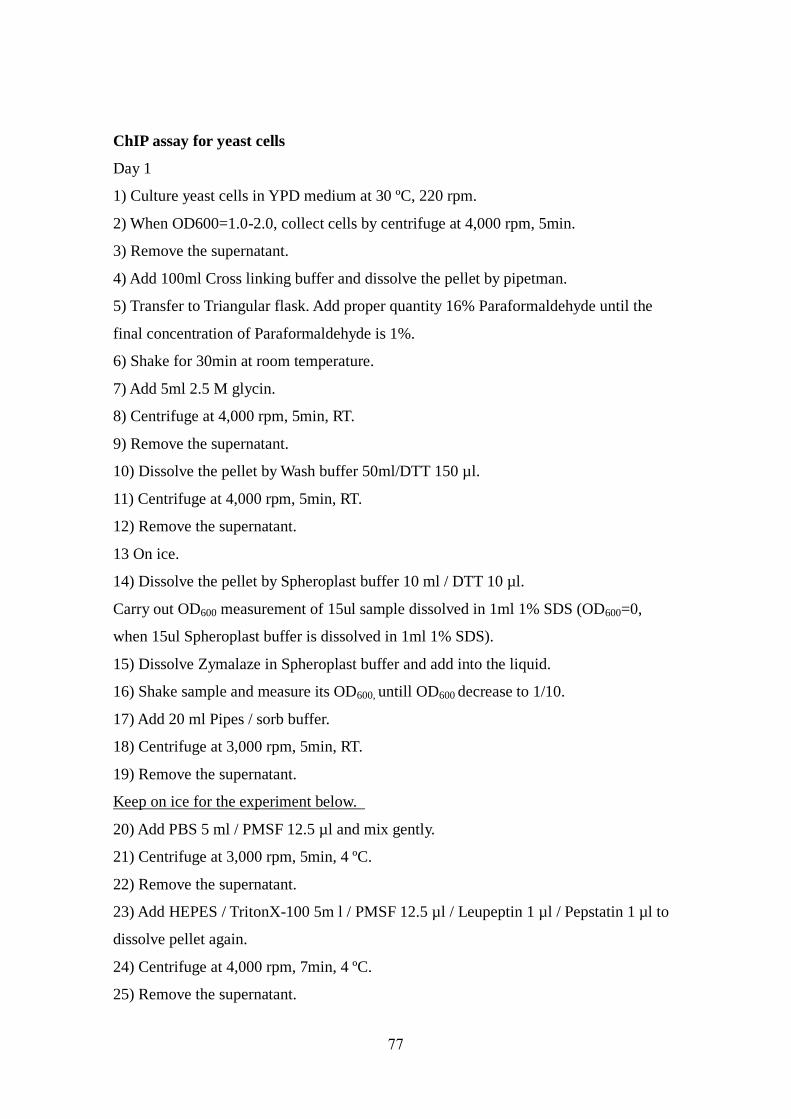
77
ChIP assay for yeast cells
Day 1
1) Culture yeast cells in YPD medium at 30 ºC, 220 rpm.
2) When OD600=1.0-2.0, collect cells by centrifuge at 4,000 rpm, 5min.
3) Remove the supernatant.
4) Add 100ml Cross linking buffer and dissolve the pellet by pipetman.
5) Transfer to Triangular flask. Add proper quantity 16% Paraformaldehyde until the
final concentration of Paraformaldehyde is 1%.
6) Shake for 30min at room temperature.
7) Add 5ml 2.5 M glycin.
8) Centrifuge at 4,000 rpm, 5min, RT.
9) Remove the supernatant.
10) Dissolve the pellet by Wash buffer 50ml/DTT 150 µl.
11) Centrifuge at 4,000 rpm, 5min, RT.
12) Remove the supernatant.
13 On ice.
14) Dissolve the pellet by Spheroplast buffer 10 ml / DTT 10 µl.
Carry out OD600 measurement of 15ul sample dissolved in 1ml 1% SDS (OD600=0,
when 15ul Spheroplast buffer is dissolved in 1ml 1% SDS).
15) Dissolve Zymalaze in Spheroplast buffer and add into the liquid.
16) Shake sample and measure its OD600, untill OD600 decrease to 1/10.
17) Add 20 ml Pipes / sorb buffer.
18) Centrifuge at 3,000 rpm, 5min, RT.
19) Remove the supernatant.
Keep on ice for the experiment below.
20) Add PBS 5 ml / PMSF 12.5 µl and mix gently.
21) Centrifuge at 3,000 rpm, 5min, 4 ºC.
22) Remove the supernatant.
23) Add HEPES / TritonX-100 5m l / PMSF 12.5 µl / Leupeptin 1 µl / Pepstatin 1 µl to
dissolve pellet again.
24) Centrifuge at 4,000 rpm, 7min, 4 ºC.
25) Remove the supernatant.
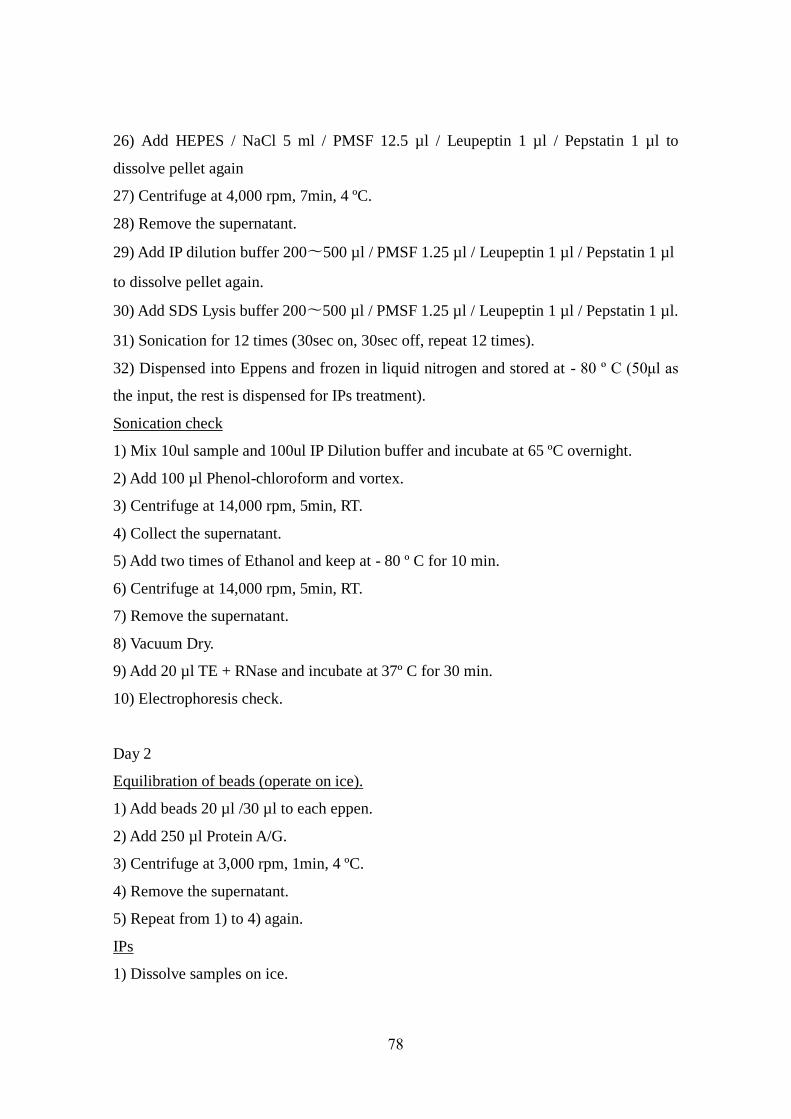
78
26) Add HEPES / NaCl 5 ml / PMSF 12.5 µl / Leupeptin 1 µl / Pepstatin 1 µl to
dissolve pellet again
27) Centrifuge at 4,000 rpm, 7min, 4 ºC.
28) Remove the supernatant.
29) Add IP dilution buffer 200〜500 µl / PMSF 1.25 µl / Leupeptin 1 µl / Pepstatin 1 µl
to dissolve pellet again.
30) Add SDS Lysis buffer 200〜500 µl / PMSF 1.25 µl / Leupeptin 1 µl / Pepstatin 1 µl.
31) Sonication for 12 times (30sec on, 30sec off, repeat 12 times).
32) Dispensed into Eppens and frozen in liquid nitrogen and stored at - 80 º C (50μl as
the input, the rest is dispensed for IPs treatment).
Sonication check
1) Mix 10ul sample and 100ul IP Dilution buffer and incubate at 65 ºC overnight.
2) Add 100 µl Phenol-chloroform and vortex.
3) Centrifuge at 14,000 rpm, 5min, RT.
4) Collect the supernatant.
5) Add two times of Ethanol and keep at - 80 º C for 10 min.
6) Centrifuge at 14,000 rpm, 5min, RT.
7) Remove the supernatant.
8) Vacuum Dry.
9) Add 20 µl TE + RNase and incubate at 37º C for 30 min.
10) Electrophoresis check.
Day 2
Equilibration of beads (operate on ice).
1) Add beads 20 µl /30 µl to each eppen.
2) Add 250 µl Protein A/G.
3) Centrifuge at 3,000 rpm, 1min, 4 ºC.
4) Remove the supernatant.
5) Repeat from 1) to 4) again.
IPs
1) Dissolve samples on ice.
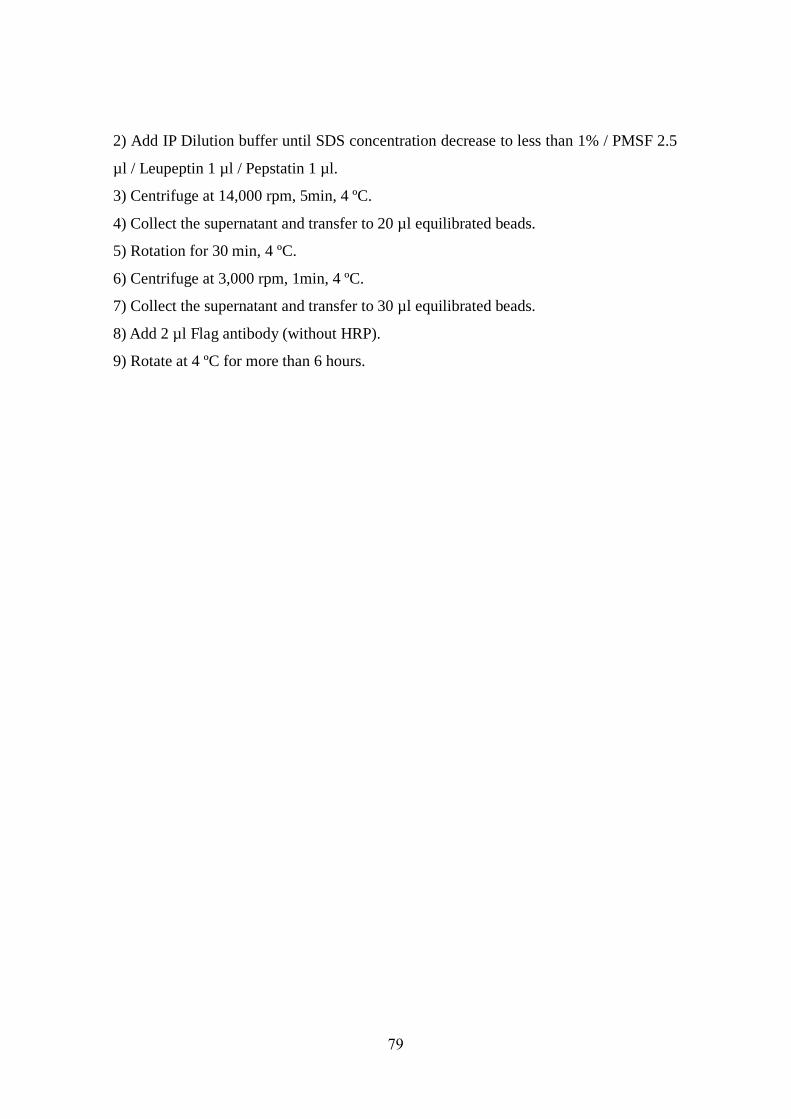
79
2) Add IP Dilution buffer until SDS concentration decrease to less than 1% / PMSF 2.5
µl / Leupeptin 1 µl / Pepstatin 1 µl.
3) Centrifuge at 14,000 rpm, 5min, 4 ºC.
4) Collect the supernatant and transfer to 20 µl equilibrated beads.
5) Rotation for 30 min, 4 ºC.
6) Centrifuge at 3,000 rpm, 1min, 4 ºC.
7) Collect the supernatant and transfer to 30 µl equilibrated beads.
8) Add 2 µl Flag antibody (without HRP).
9) Rotate at 4 ºC for more than 6 hours.
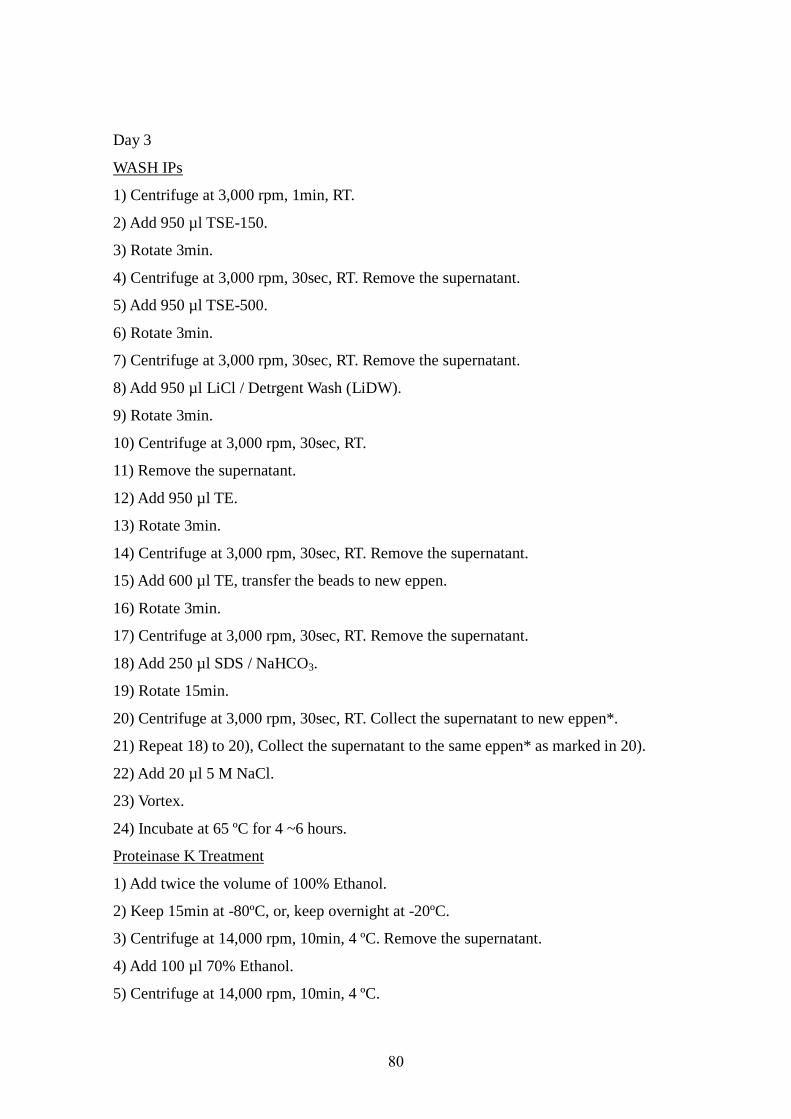
80
Day 3
WASH IPs
1) Centrifuge at 3,000 rpm, 1min, RT.
2) Add 950 µl TSE-150.
3) Rotate 3min.
4) Centrifuge at 3,000 rpm, 30sec, RT. Remove the supernatant.
5) Add 950 µl TSE-500.
6) Rotate 3min.
7) Centrifuge at 3,000 rpm, 30sec, RT. Remove the supernatant.
8) Add 950 µl LiCl / Detrgent Wash (LiDW).
9) Rotate 3min.
10) Centrifuge at 3,000 rpm, 30sec, RT.
11) Remove the supernatant.
12) Add 950 µl TE.
13) Rotate 3min.
14) Centrifuge at 3,000 rpm, 30sec, RT. Remove the supernatant.
15) Add 600 µl TE, transfer the beads to new eppen.
16) Rotate 3min.
17) Centrifuge at 3,000 rpm, 30sec, RT. Remove the supernatant.
18) Add 250 µl SDS / NaHCO3.
19) Rotate 15min.
20) Centrifuge at 3,000 rpm, 30sec, RT. Collect the supernatant to new eppen*.
21) Repeat 18) to 20), Collect the supernatant to the same eppen* as marked in 20).
22) Add 20 µl 5 M NaCl.
23) Vortex.
24) Incubate at 65 ºC for 4 ~6 hours.
Proteinase K Treatment
1) Add twice the volume of 100% Ethanol.
2) Keep 15min at -80ºC, or, keep overnight at -20ºC.
3) Centrifuge at 14,000 rpm, 10min, 4 ºC. Remove the supernatant.
4) Add 100 µl 70% Ethanol.
5) Centrifuge at 14,000 rpm, 10min, 4 ºC.
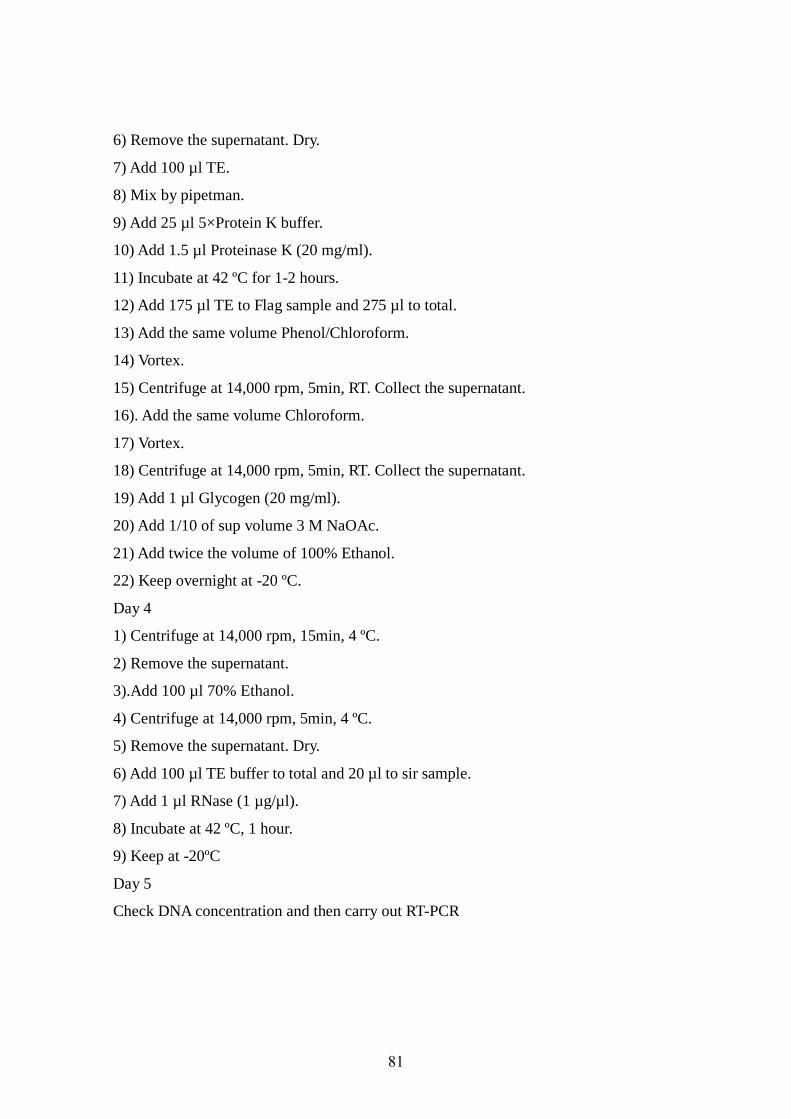
81
6) Remove the supernatant. Dry.
7) Add 100 µl TE.
8) Mix by pipetman.
9) Add 25 µl 5×Protein K buffer.
10) Add 1.5 µl Proteinase K (20 mg/ml).
11) Incubate at 42 ºC for 1-2 hours.
12) Add 175 µl TE to Flag sample and 275 µl to total.
13) Add the same volume Phenol/Chloroform.
14) Vortex.
15) Centrifuge at 14,000 rpm, 5min, RT. Collect the supernatant.
16). Add the same volume Chloroform.
17) Vortex.
18) Centrifuge at 14,000 rpm, 5min, RT. Collect the supernatant.
19) Add 1 µl Glycogen (20 mg/ml).
20) Add 1/10 of sup volume 3 M NaOAc.
21) Add twice the volume of 100% Ethanol.
22) Keep overnight at -20 ºC.
Day 4
1) Centrifuge at 14,000 rpm, 15min, 4 ºC.
2) Remove the supernatant.
3).Add 100 µl 70% Ethanol.
4) Centrifuge at 14,000 rpm, 5min, 4 ºC.
5) Remove the supernatant. Dry.
6) Add 100 µl TE buffer to total and 20 µl to sir sample.
7) Add 1 µl RNase (1 µg/µl).
8) Incubate at 42 ºC, 1 hour.
9) Keep at -20ºC
Day 5
Check DNA concentration and then carry out RT-PCR
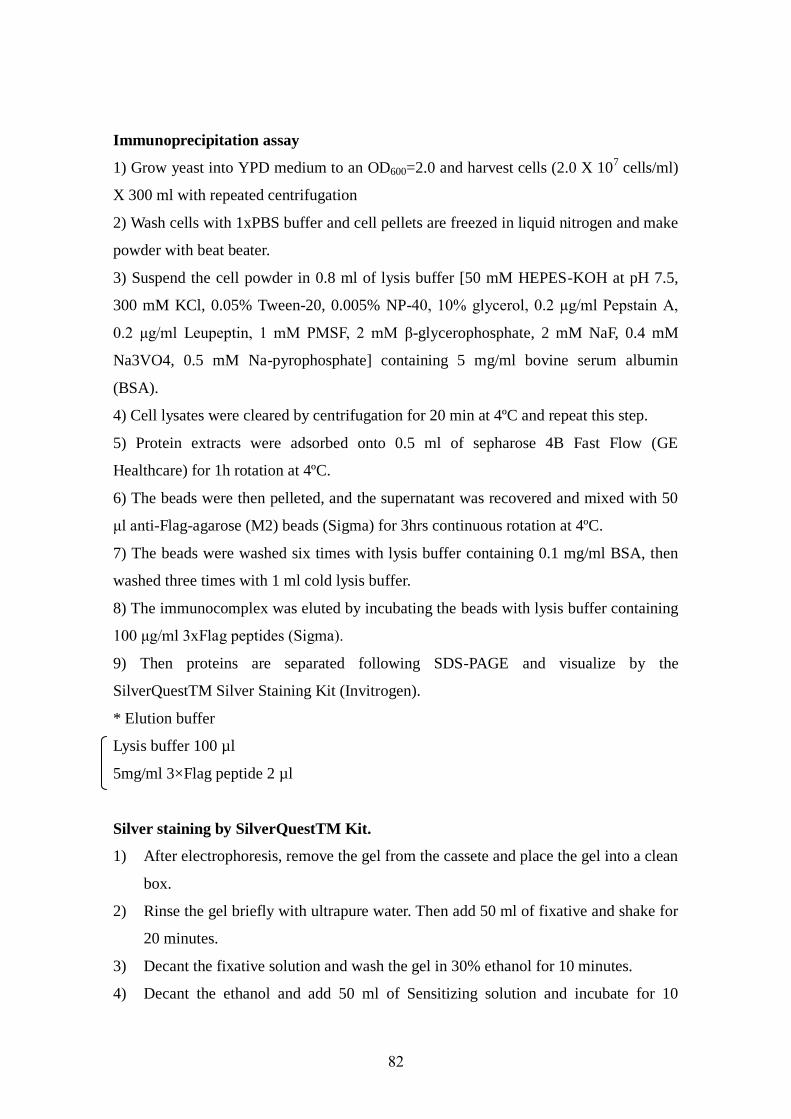
82
Immunoprecipitation assay
1) Grow yeast into YPD medium to an OD600=2.0 and harvest cells (2.0 X 10⁷ cells/ml)
X 300 ml with repeated centrifugation
2) Wash cells with 1xPBS buffer and cell pellets are freezed in liquid nitrogen and make
powder with beat beater.
3) Suspend the cell powder in 0.8 ml of lysis buffer [50 mM HEPES-KOH at pH 7.5,
300 mM KCl, 0.05% Tween-20, 0.005% NP-40, 10% glycerol, 0.2 μg/ml Pepstain A,
0.2 μg/ml Leupeptin, 1 mM PMSF, 2 mM β-glycerophosphate, 2 mM NaF, 0.4 mM
Na3VO4, 0.5 mM Na-pyrophosphate] containing 5 mg/ml bovine serum albumin
(BSA).
4) Cell lysates were cleared by centrifugation for 20 min at 4ºC and repeat this step.
5) Protein extracts were adsorbed onto 0.5 ml of sepharose 4B Fast Flow (GE
Healthcare) for 1h rotation at 4ºC.
6) The beads were then pelleted, and the supernatant was recovered and mixed with 50
μl anti-Flag-agarose (M2) beads (Sigma) for 3hrs continuous rotation at 4ºC.
7) The beads were washed six times with lysis buffer containing 0.1 mg/ml BSA, then
washed three times with 1 ml cold lysis buffer.
8) The immunocomplex was eluted by incubating the beads with lysis buffer containing
100 μg/ml 3xFlag peptides (Sigma).
9) Then proteins are separated following SDS-PAGE and visualize by the
SilverQuestTM Silver Staining Kit (Invitrogen).
* Elution buffer
Lysis buffer 100 µl
5mg/ml 3×Flag peptide 2 µl
Silver staining by SilverQuestTM Kit.
1) After electrophoresis, remove the gel from the cassete and place the gel into a clean
box.
2) Rinse the gel briefly with ultrapure water. Then add 50 ml of fixative and shake for
20 minutes.
3) Decant the fixative solution and wash the gel in 30% ethanol for 10 minutes.
4) Decant the ethanol and add 50 ml of Sensitizing solution and incubate for 10
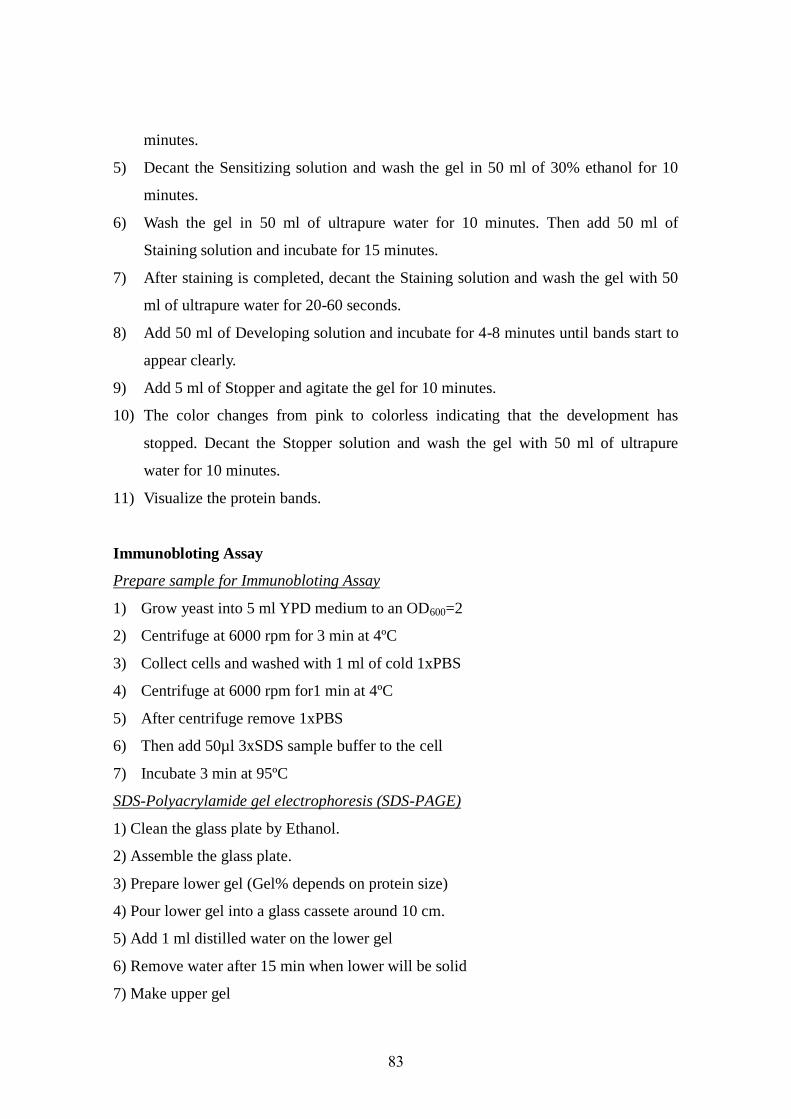
83
minutes.
5) Decant the Sensitizing solution and wash the gel in 50 ml of 30% ethanol for 10
minutes.
6) Wash the gel in 50 ml of ultrapure water for 10 minutes. Then add 50 ml of
Staining solution and incubate for 15 minutes.
7) After staining is completed, decant the Staining solution and wash the gel with 50
ml of ultrapure water for 20-60 seconds.
8) Add 50 ml of Developing solution and incubate for 4-8 minutes until bands start to
appear clearly.
9) Add 5 ml of Stopper and agitate the gel for 10 minutes.
10) The color changes from pink to colorless indicating that the development has
stopped. Decant the Stopper solution and wash the gel with 50 ml of ultrapure
water for 10 minutes.
11) Visualize the protein bands.
Immunobloting Assay
Prepare sample for Immunobloting Assay
1) Grow yeast into 5 ml YPD medium to an OD600=2
2) Centrifuge at 6000 rpm for 3 min at 4ºC
3) Collect cells and washed with 1 ml of cold 1xPBS
4) Centrifuge at 6000 rpm for1 min at 4ºC
5) After centrifuge remove 1xPBS
6) Then add 50µl 3xSDS sample buffer to the cell
7) Incubate 3 min at 95ºC
SDS-Polyacrylamide gel electrophoresis (SDS-PAGE)
1) Clean the glass plate by Ethanol.
2) Assemble the glass plate.
3) Prepare lower gel (Gel% depends on protein size)
4) Pour lower gel into a glass cassete around 10 cm.
5) Add 1 ml distilled water on the lower gel
6) Remove water after 15 min when lower will be solid
7) Make upper gel
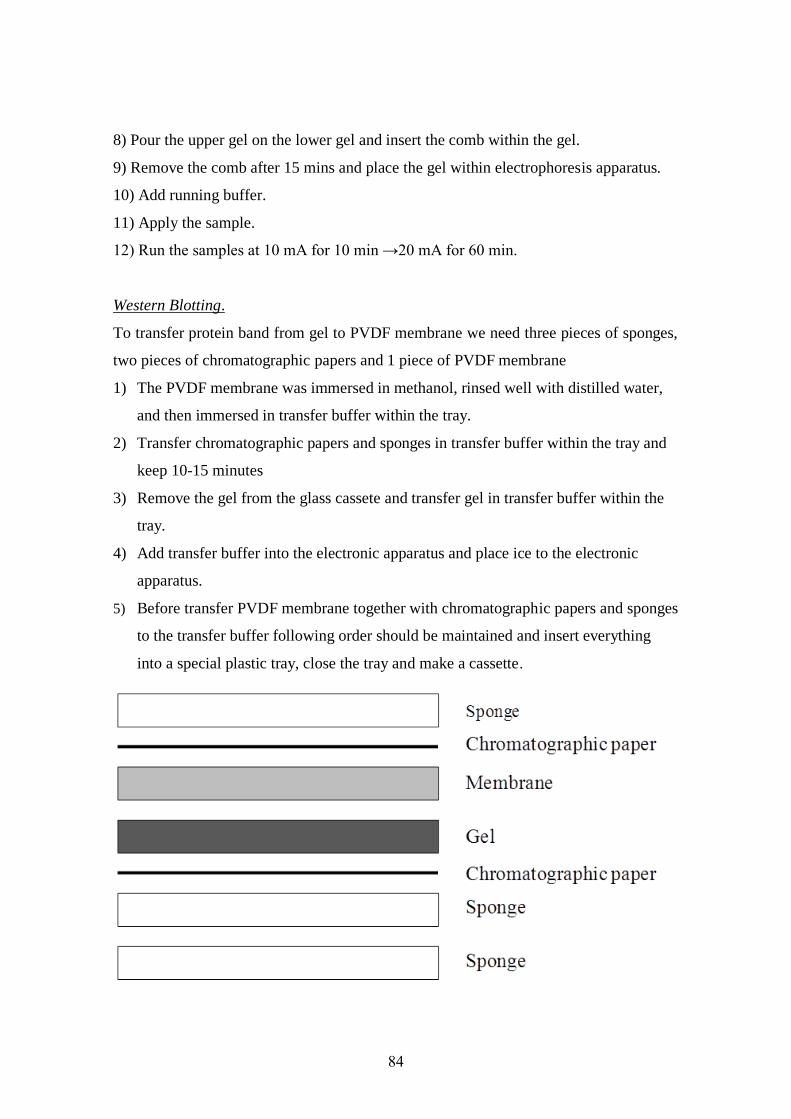
84
8) Pour the upper gel on the lower gel and insert the comb within the gel.
9) Remove the comb after 15 mins and place the gel within electrophoresis apparatus.
10) Add running buffer.
11) Apply the sample.
12) Run the samples at 10 mA for 10 min →20 mA for 60 min.
Western Blotting.
To transfer protein band from gel to PVDF membrane we need three pieces of sponges,
two pieces of chromatographic papers and 1 piece of PVDF membrane
1) The PVDF membrane was immersed in methanol, rinsed well with distilled water,
and then immersed in transfer buffer within the tray.
2) Transfer chromatographic papers and sponges in transfer buffer within the tray and
keep 10-15 minutes
3) Remove the gel from the glass cassete and transfer gel in transfer buffer within the
tray.
4) Add transfer buffer into the electronic apparatus and place ice to the electronic
apparatus.
5) Before transfer PVDF membrane together with chromatographic papers and sponges
to the transfer buffer following order should be maintained and insert everything
into a special plastic tray, close the tray and make a cassette.
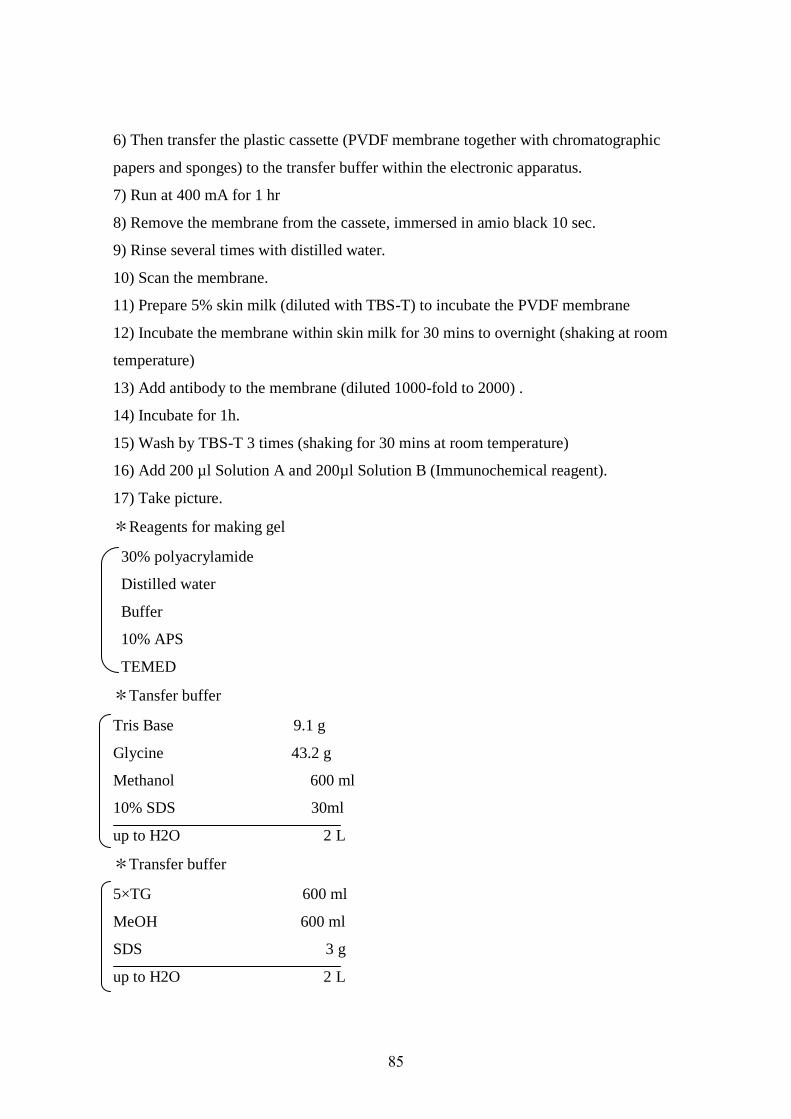
85
6) Then transfer the plastic cassette (PVDF membrane together with chromatographic
papers and sponges) to the transfer buffer within the electronic apparatus.
7) Run at 400 mA for 1 hr
8) Remove the membrane from the cassete, immersed in amio black 10 sec.
9) Rinse several times with distilled water.
10) Scan the membrane.
11) Prepare 5% skin milk (diluted with TBS-T) to incubate the PVDF membrane
12) Incubate the membrane within skin milk for 30 mins to overnight (shaking at room
temperature)
13) Add antibody to the membrane (diluted 1000-fold to 2000) .
14) Incubate for 1h.
15) Wash by TBS-T 3 times (shaking for 30 mins at room temperature)
16) Add 200 µl Solution A and 200µl Solution B (Immunochemical reagent).
17) Take picture.
*Reagents for making gel
30% polyacrylamide
Distilled water
Buffer
10% APS
TEMED
*Tansfer buffer
Tris Base 9.1 g
Glycine 43.2 g
Methanol 600 ml
10% SDS 30ml
up to H2O 2 L
*Transfer buffer
5×TG 600 ml
MeOH 600 ml
SDS 3 g
up to H2O 2 L
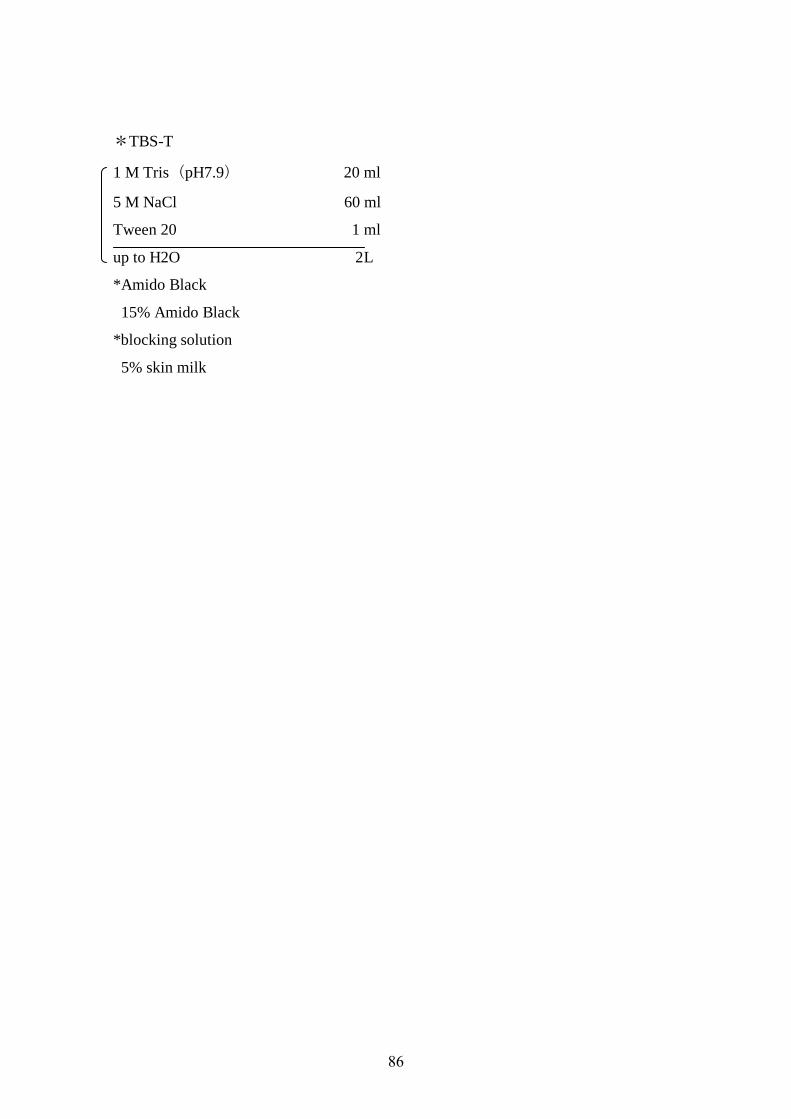
86
*TBS-T
1 M Tris(pH7.9) 20 ml
5 M NaCl 60 ml
Tween 20 1 ml
up to H2O 2L
*Amido Black
15% Amido Black
*blocking solution
5% skin milk
87
ACADEMIC JOURNALS WITH REFEREE SYSTEMS
[1] Gayatri Goswami, Ujjal Kumar Nath, Shamina Hasan and Christian Mollers,
Phenotypic effect and regulation of high erucic acid transgene in double haploid
rapeseed (Brassica napus) population, International Journal of Bio-Research, vol. 1,
no. 6, pp. 5-12 (2013)
[2] Kazuma Kamata, Akira Hatanaka, Gayatri Goswami, Kaori Shinmyozu, Jun-ichi
Nakayama, Takeshi Urano, Masanori Hatashita, Hiroyuki Uchida and Masaya Oki,
C-terminus of the Sgf73 subunit of SAGA and SLIK is important for retention in the
larger complex and for heterochromatin boundary function, Genes to Cells, vol. 18
no. 9, pp. 823-37 (2013).
[3] Ujjal K. Nath, Gayatri Goswami, Rosemarie Clemens, Heiko C. Becker, Christian
Möllers, Inheritance and variation of erucic acid content in a transgenic rapeseed
(Brassica napus L.) doubled haploid population, Mol Breeding, vol. 23, no.1, pp.
125-138 (2009).
[4] Gayatri Goswami, Kazuma Kamata, Sayaka Kashio, Hiroyuki Uchida, and Masaya
Oki, Characterization of Sgf29 for Boundary Function, Int. conf. Message from yeast
to Epigenetics ~Yeast clarifies the frontiers of life science 2013, Japan.
[5] Kazuma Kamata†, Gayatri Goswami†, Sayaka Kashio, Takeshi Urano, Hiroyuki
Uchida, and Masaya Oki, The N-terminus and Tudor domains of Sgf29 are important
for its heterochromatin boundary formation function, Journal of Biochemistry (2013)
(Submitted for publication).
†These two authors contributed equally to this work.