Embed Size (px)
Citation preview
1
Characterization of the Corrosion Scenarios on the Trans-Canada Pipeline (Alberta System)
(Interim Report: Dec. 20, 2005 -
Feb. 28, 2006)
P. Q. Wu, Z. Qin, and D. W. Shoesmith
The University of Western Ontario, London, Ontario, N6A 5B7
&
F. King
NOVA Research and Technology Center
Calgary, Alberta, Canada T2P 5H1

2
Six corrosion scenarios have been defined for
transmission pipelines based on TCPL/NRTC field
investigations:
1) Primary anaerobic corrosion (29%); 2) Primary aerobic corrosion (4%);3) Anaerobic corrosion turning aerobic (21%);4)
Primary anaerobic corrosion with sulfate-reducing
bacteria (SRB) (26%);
5)
Anaerobic corrosion with SRB turning aerobic (17%);
6)
Aerobic corrosion turning anaerobic with SRB (3%);
Background
T. R. Jack, et al, Materials Performance Nov. 1995; idid, March 1996.
3
These scenarios are useful in assessing the likely corrosion conditions and rates at various locations. However, since the corrosion product deposits and their influence on corrosion of pipeline steel are very complex, understanding of the corrosion mechanism of pipeline steel is not yet complete. Nova is developing a Permeable Coatings Model to predict the effect of cathodic protection on pipeline corrosion. A more complete understanding of the corrosion mechanism is needed.
Background

4
To investigate the electrochemical and chemical
processes involved in the film formation and
transformation processes (scenarios 1 to 3);
To provide a firmer mechanistic basis for the
Permeable Coatings Model developed by Nova to
predict the effect of cathodic protection on pipeline
corrosion.
Objectives
5
Working electrode: A516 Grade 70 carbon steel, Φ1 cm2, polished with silicon carbide paper to grit No.1200;
Reference electrode: SCE;
Counter electrode: Pt mesh (2x2 cm2) ;
Electrolytes: Sol-A: 0.0075 M NaHCO3+0.001 M NaCl + 0.001 M Na2SO4 + 0.1 M NaClO4 (pH about 7.0 after purging Ar+5% CO2 or O2+ 5% CO2
at 23ºC for 1 h);Sol-B: 0.15 M NaHCO3 +0.001 M NaCl + 0.001 M Na2SO4 + 0.1 M NaClO4 (pH about 7.0 after purging 100% CO2 at 23ºC for 1 h).
Instruments: Solartron 1480 Multistat, 1287 Potentiostat, 1255B FRA, PINE AFASR Rotator, Raman spectroscopy, and scanning electron microscopy.
Experimental
6
Experimental
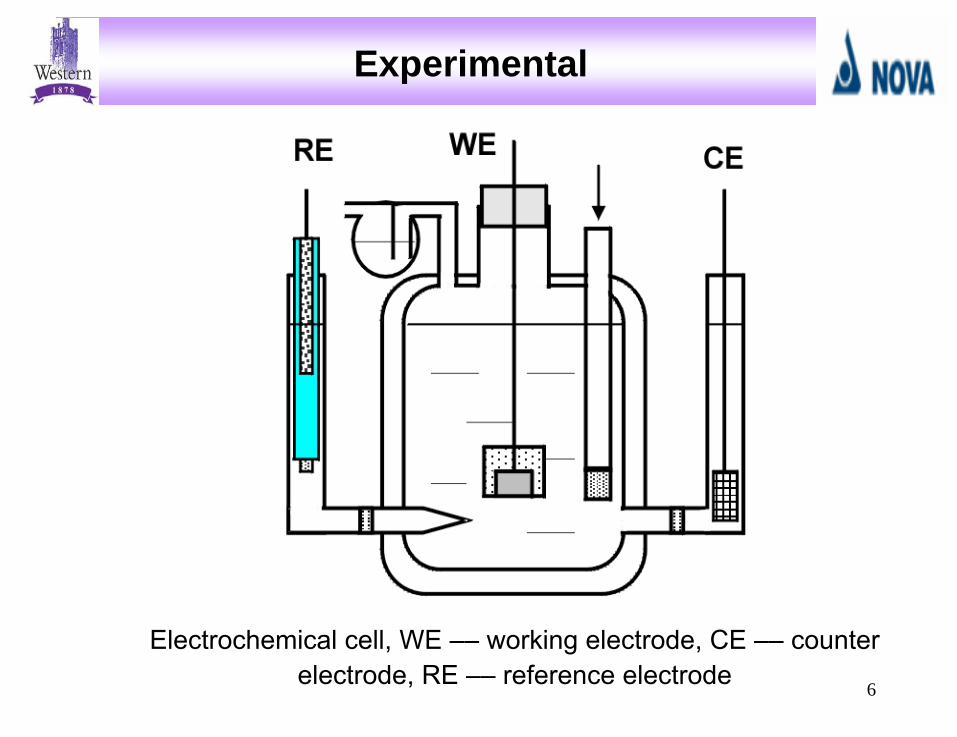
Electrochemical cell, WE ––
working electrode, CE ––
counter electrode, RE ––
reference electrode

7
Research Approaches
Cyclic voltammetry (CV) with rotating disk electrode (RDE) technique;
Open-circuit potential technique;
Electrochemical Impedance Spectroscopy (EIS);
In-situ and ex-situ Raman spectroscopy;
Scanning electron microscopy (SEM).
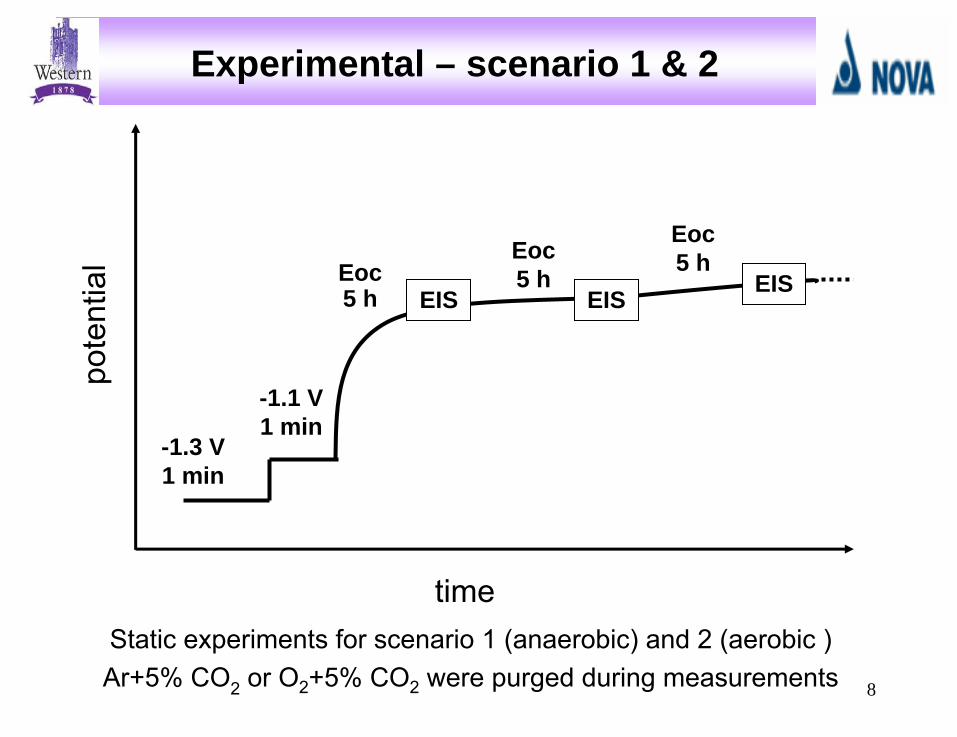
8
-1.3 V 1 min
-1.1 V1 min
Eoc5 h
time
pote
ntia
l
Static experiments for scenario 1 (anaerobic) and 2 (aerobic )Ar+5% CO2
or O2
+5% CO2
were purged during measurements
Experimental – scenario 1 & 2
EIS
Eoc5 h
EIS
Eoc5 h
EIS
9
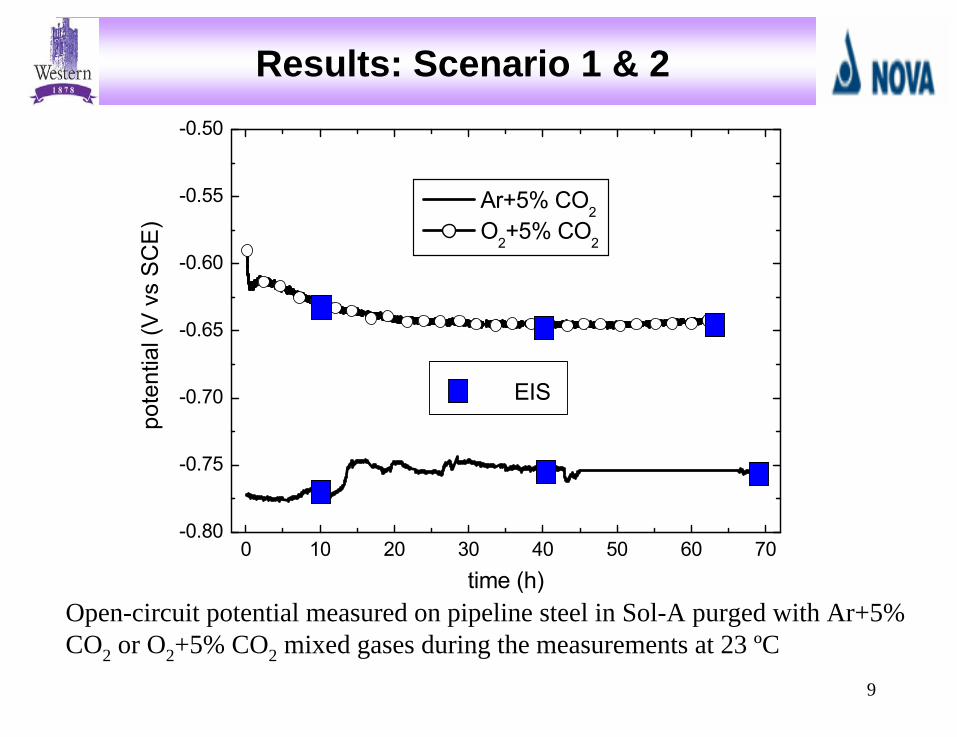
Results: Scenario 1 & 2
0 10 20 30 40 50 60 70-0.80
-0.75
-0.70
-0.65
-0.60
-0.55
-0.50
Ar+5% CO2 O2+5% CO2
EIS
pote
ntia
l (V
vs
SC
E)
time (h)Open-circuit potential measured on pipeline steel in Sol-A purged with Ar+5% CO2 or O2 +5% CO2 mixed gases during the measurements at 23 ºC
10
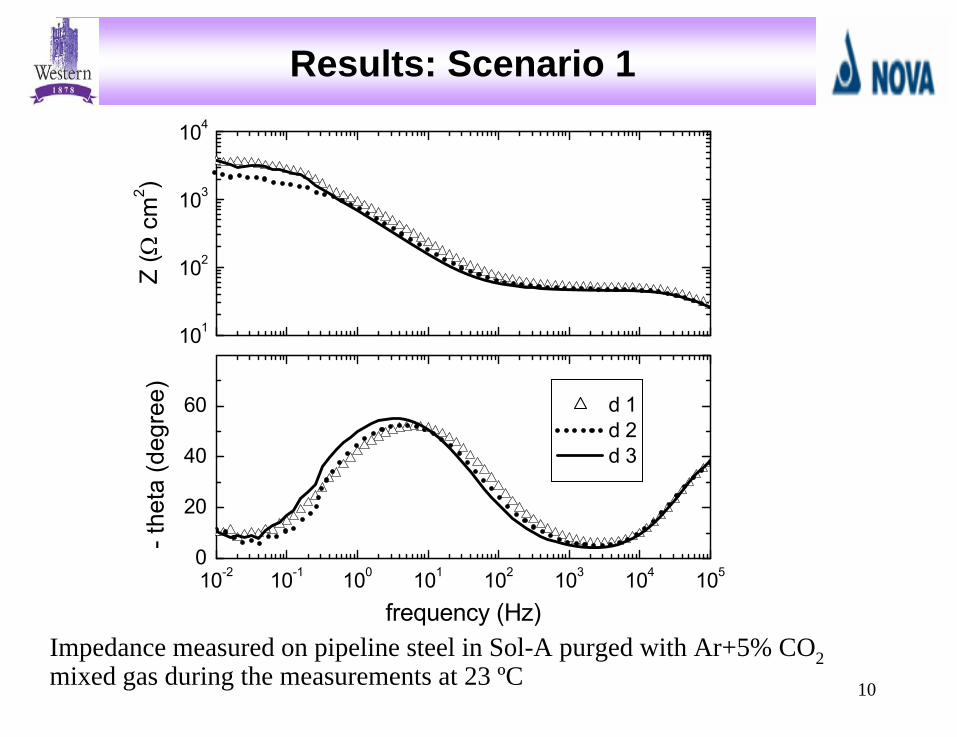
Results: Scenario 1
101
102
103
104
10-2 10-1 100 101 102 103 104 1050
20
40
60 d 1 d 2 d 3
Z (Ω
cm
2 )
- the
ta (d
egre
e)
frequency (Hz)Impedance measured on pipeline steel in Sol-A purged with Ar+5% CO2 mixed gas during the measurements at 23 ºC
11
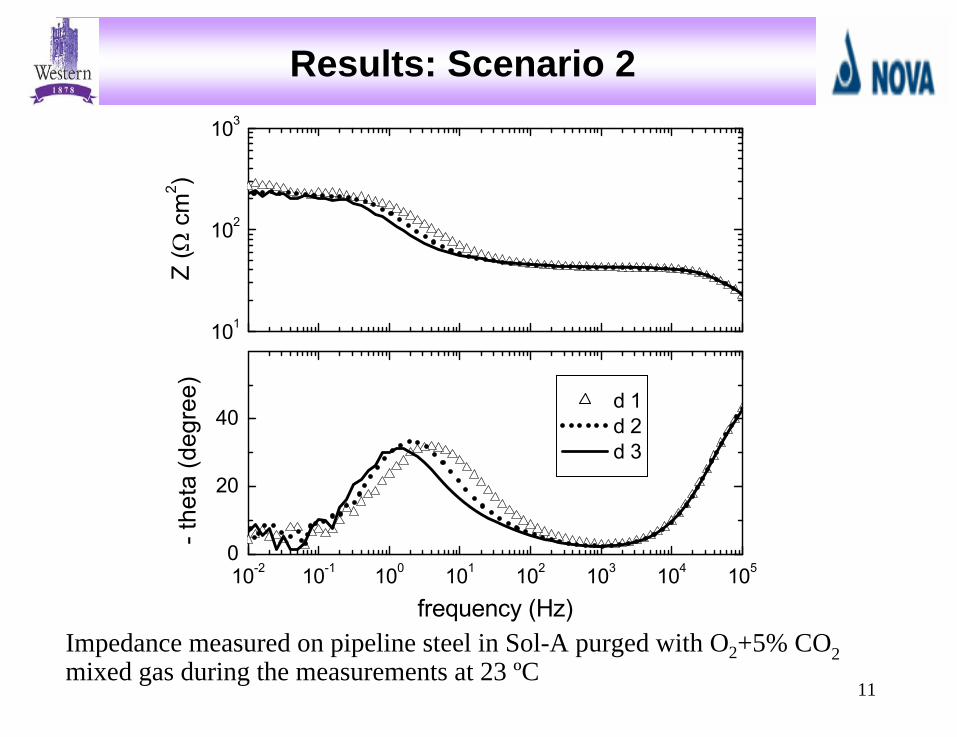
Results: Scenario 2
Impedance measured on pipeline steel in Sol-A purged with O2 +5% CO2 mixed gas during the measurements at 23 ºC
101
102
103
10-2 10-1 100 101 102 103 104 1050
20
40 d 1 d 2 d 3
Z (Ω
cm
2 )
- the
ta (d
egre
e)
frequency (Hz)

12
Electrochemical experiments using RDE for scenario 1 and 2Ar+5% CO2
or O2
+5% CO2
was purged during measurements
-1.3 V 1 min
-1.1 V1 min
-1.2 V
-0.4 V (scenario 1)0.1 V (scenario 2)
-1.2 V
time
pote
ntia
lExperimental – scenario 1 & 2 (RDE)

13
Results: Cyclic voltammograms
Cyclic
voltammograms
measured on pipeline steel in Sol-A purged with Ar+5% CO2
or O2
+5% CO2
mixed gases during measurements at 23 ºC
-1.2 -1.0 -0.8 -0.6 -0.4 -0.2 0.0-2
0
2
4
6
8
curre
nt (m
A)
potential (V vs SCE)
Ar+5% CO2 O2+5% CO2
14
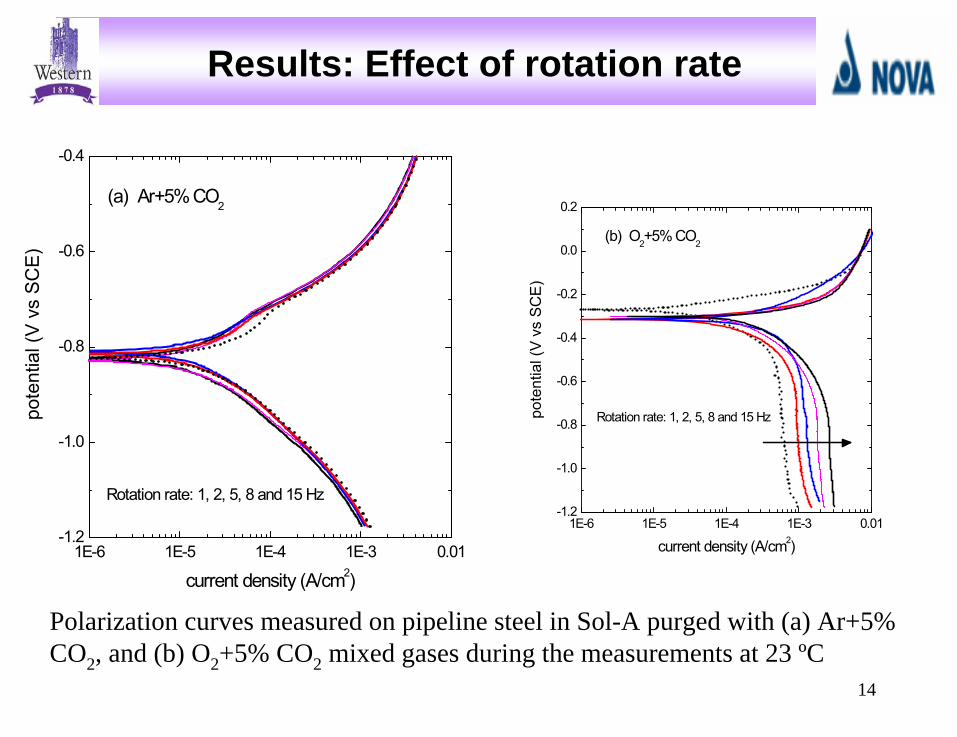
Results: Effect of rotation rate
-1.2
-1.0
-0.8
-0.6
-0.4
1E-6 1E-5 1E-4 1E-3 0.01
(a) Ar+5% CO2
Rotation rate: 1, 2, 5, 8 and 15 Hz
current density (A/cm2)
pote
ntia
l (V
vs S
CE)
-1.2
-1.0
-0.8
-0.6
-0.4
-0.2
0.0
0.2
1E-6 1E-5 1E-4 1E-3 0.01
(b) O2+5% CO2
Rotation rate: 1, 2, 5, 8 and 15 Hz
current density (A/cm2)po
tent
ial (
V vs
SC
E)
Polarization curves measured on pipeline steel in Sol-A purged with (a) Ar+5% CO2 , and (b) O2 +5% CO2 mixed gases during the measurements at 23 ºC

15
Koutecky-Levich plots for pipeline steel in Sol-A purged with Ar+5% CO2
mixed gas during the measurements at 23 ºC
0.2 0.4 0.6 0.8 1.00
20
40
60
80
(a) -0.72 V -0.74 V -0.76 V -0.78 V -0.80 V
1/j (
mA-1
)
f -1/2 (s0.5)0.2 0.4 0.6 0.8 1.0
-40
-30
-20
-10
0
(b)
-0.90 V -0.92 V -0.94 V -0.96 V -0.98 V
1/j (
mA-1
)
f -1/2 (s0.5)
(a) anodic current (b) cathodic current
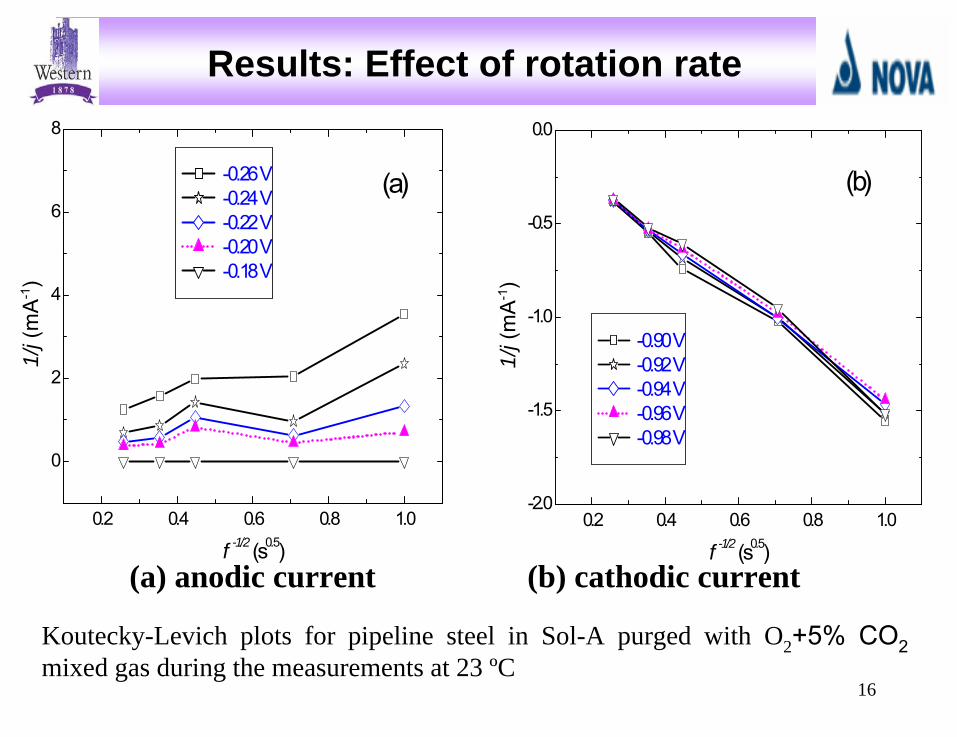
Results: Effect of rotation rate
16
Koutecky-Levich plots for pipeline steel in Sol-A purged with O2 +5% CO2
mixed gas during the measurements at 23 ºC
(a) anodic current (b) cathodic current
0.2 0.4 0.6 0.8 1.0
0
2
4
6
8
(a) -0.26 V -0.24 V -0.22 V -0.20 V -0.18 V
1/j (
mA-1
)
f -1/2 (s0.5)0.2 0.4 0.6 0.8 1.0
-2.0
-1.5
-1.0
-0.5
0.0
(b)
-0.90 V -0.92 V -0.94 V -0.96 V -0.98 V
1/j (
mA-1
)
f -1/2 (s0.5)
Results: Effect of rotation rate
17
-1.3 V1 min -1.1 V
1 min
Eoc1 h
time
pote
ntia
l
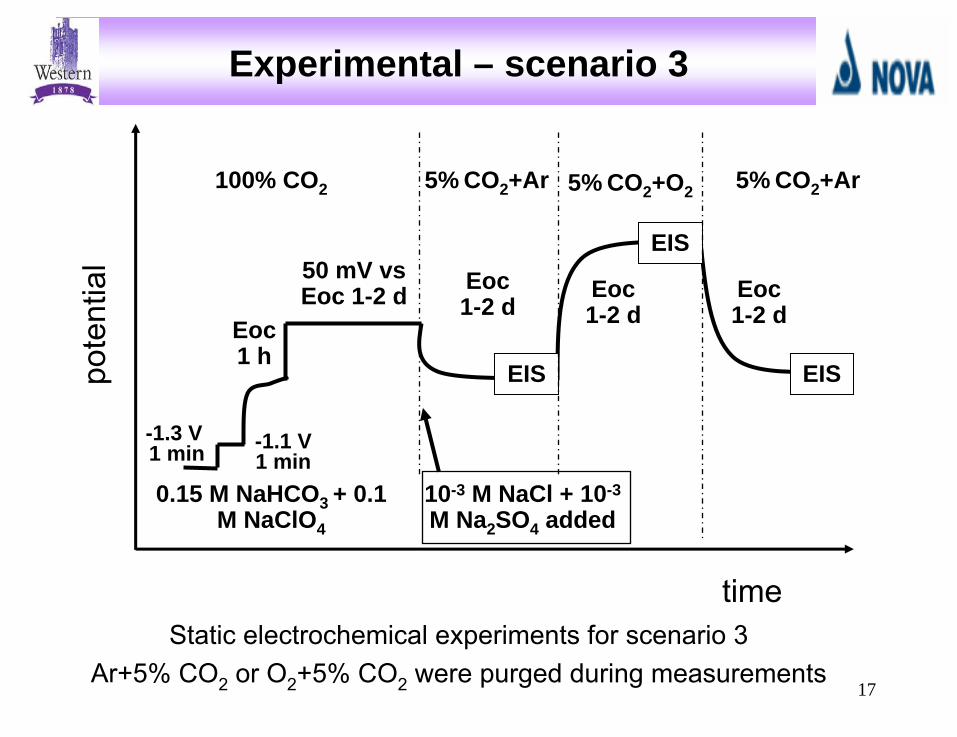
Static electrochemical experiments for scenario 3Ar+5% CO2
or O2
+5% CO2
were purged during measurements
Eoc1-2 d
50 mV vs Eoc 1-2 d
EIS
Eoc1-2 d
EIS
Eoc1-2 d
EIS
5% CO2 +Ar100% CO2 5% CO2 +Ar 5% CO2 +O2
Experimental – scenario 3
0.15 M NaHCO3 + 0.1 M NaClO4
10-3 M NaCl + 10-3
M Na2 SO4 added

18
Potential measured at 23ºC on pipeline steel in Sol-B purged with different gases during the measurements.
Results: Scenario 3
0 24 48 72 96 120 144-1.0
-0.8
-0.6
-0.4
-0.2
0.0
0.15M NaHCO3+0.1 M NaClO4
10-3 M NaCl+10-3 M Na2SO4
O2+5% CO2Ar+5% CO2100% CO2
EIS
EIS
EIS
pote
ntia
l (V
vs
SC
E)
time (h)

19
Impedance measured at 23ºC on pipeline steel in Sol-B purged with different gases during the measurements.
Results: Scenario 3
100
101
102
103
104
105
10-2 10-1 100 101 102 103 104 1050
20
40
60
80
2.5 d 3.5 d 4.5 d
Z (Ω
cm
2 )
- the
ta (d
egre
e)
frequency (Hz)
20
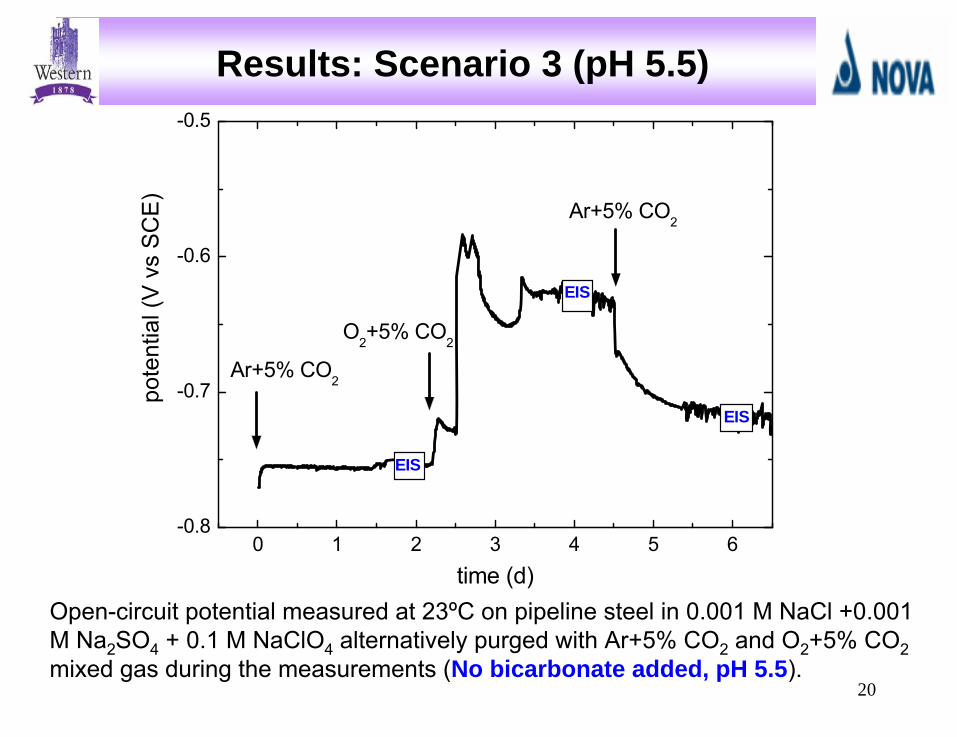
Open-circuit potential measured at 23ºC on pipeline steel in 0.001 M NaCl +0.001 M Na2
SO4
+ 0.1 M NaClO4
alternatively purged with Ar+5% CO2
and O2
+5% CO2
mixed gas during the measurements (No bicarbonate added, pH 5.5).
0 1 2 3 4 5 6-0.8
-0.7
-0.6
-0.5
EIS
EIS
EIS
Ar+5% CO2
O2+5% CO2
Ar+5% CO2
pote
ntia
l (V
vs
SC
E)
time (d)
Results: Scenario 3 (pH 5.5)

21
EIS measured at 23 ºC on pipeline steel in 0.001 M NaCl +0.001 M Na2 SO4 + 0.1 M NaClO4 alternatively purged with Ar+5% CO2 and O2 +5% CO2 mixed gases during the measurements (No bicarbonate added, pH 5.5).
Results: Scenario 3 (pH 5.5)
101
102
103
104
10-2 10-1 100 101 102 103 104 1050
20
40
60
2 d 4 d 6 d
Z (Ω
cm
2 )
- the
ta (d
egre
e)
frequency (Hz)

22
Results: Formation of Siderite
0 10 20 30 40 50-0.1
0.0
0.1
0.2
0.3
0.15 M NaHCO3+0.1 M NaClO4 at -0.682 V 0.15 M NaHCO3+0.1 M NaClO4 at -0.730 V 0.375 M NaHCO3+0.1 M NaClO4 at -0.730 V
curre
nt (m
A)
time (h)
Current measured on pipeline steel under potentiostatic control in x M NaHCO3 + 0.1 M NaClO4 purged with 100% CO2 gas during the measurements at 23 ºC
Raman

23
Positions taken for ex-situ Raman analysis on pipeline steel after test for 16 h in 0.375 M NaHCO3
+ 0.1 M NaClO4
purged with 100% CO2
gas (pH 8.0)
Results: Formation of Siderite

24
Raman spectra acquired on pipeline steel after test for 16 h in 0.375 M NaHCO3
+ 0.1 M NaClO4
purged with 100% CO2
gas
Results: Formation of Siderite
800 900 1000 1100 1200 13000
500
1000
1500
2000
Point 1 Point 2
1083
Inte
nsity
(a.u
.)
Raman shift (cm-1)

25In-situ Raman and electrochemical measurements
Experimental – scenario 3 (in-situ Raman)

26
-1.3 V1 min
-1.1 V1 min
Eoc1 h
time
pote
ntia
l
In-situ Raman and electrochemical measurements
Eoc1 d
Eoc1 d
Open to air
Raman
Raman
Raman
100% CO2 Sealed
Experimental – scenario 3 (in-situ Raman)
50 mV vs Eoc 1 d

27
Experimental – scenario 3 (in-situ Raman)
Positions taken for in-situ Raman analysis

28
Experimental – scenario 3 (in-situ Raman)
In-situ Raman spectra acquired at spot 1 on pipeline steel immersed
in Sol- B for various times (2d –
sealed --
3d –
open –
4d)
0 400 800 1200 1600 20001000
2000
3000
4000
5000
6000
4 d3 d2 d
1083935
390298
Inte
nsity
(a.u
.)
Raman shift (cm-1)
FeOOH
ClO4-
CO2=
29
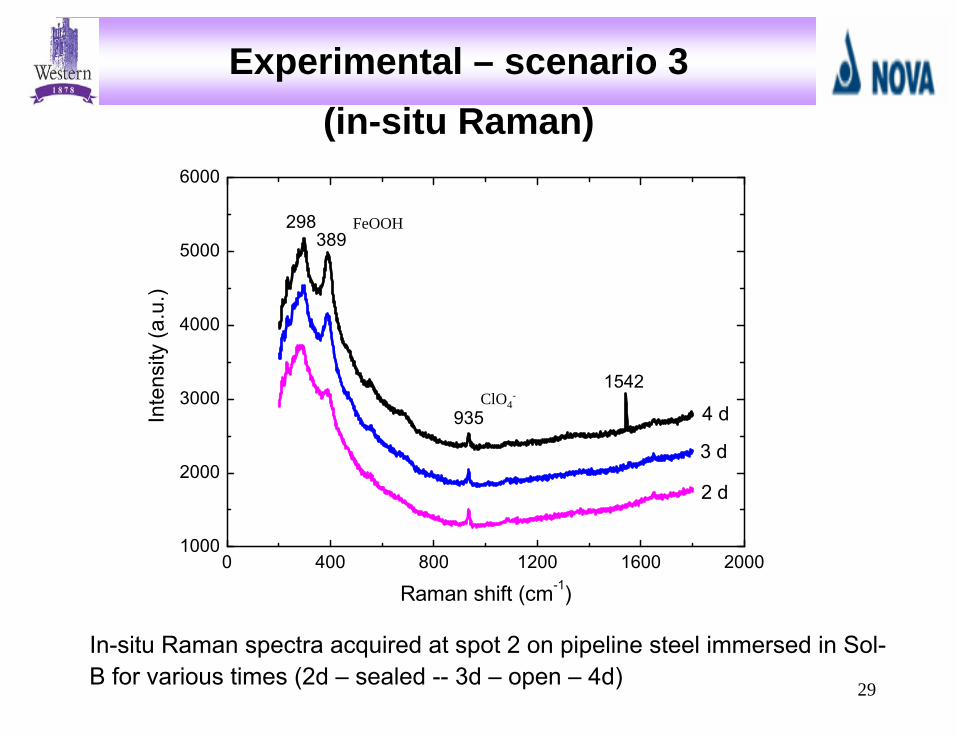
Experimental – scenario 3 (in-situ Raman)
In-situ Raman spectra acquired at spot 2 on pipeline steel immersed
in Sol- B for various times (2d –
sealed --
3d –
open –
4d)
0 400 800 1200 1600 20001000
2000
3000
4000
5000
6000
4 d
3 d
2 d
1542
935
389298
Inte
nsity
(a.u
.)
Raman shift (cm-1)
FeOOH
ClO4-

30
Experimental – scenario 3 (in-situ Raman)
In-situ Raman spectra acquired at spot 3 on pipeline steel immersed
in Sol- B for various times (2d –
sealed --
3d –
open –
4d)
0 400 800 1200 1600 20001000
2000
3000
4000
5000
6000
4 d
3 d
2 d
1083
1316
935
784
276
Inte
nsity
(a.u
.)
Raman shift (cm-1)
ClO4-
CO3=

31
Experimental – scenario 3 (ex-situ Raman)
Position taken for ex-situ Raman analysis after 4 d test in Sol-B

32
Experimental – scenario 3 (ex-situ Raman)
Ex-situ Raman spectrum acquired after 4 d test in Sol-B
200 400 600 800 1000 1200 1400 1600 1800 20000
1000
2000
3000
4000
5000
pt 1pt 2pt 3
386
1083
1650
664
281
Inte
nsity
(a.u
.)
Raman shift (cm-1)
FeOOH+FeCO3
FeOOH
Fe3 O4
FeCO3

33
Summary
Effect of mass transport seems insignificant under anaerobic conditions, but the effect of oxygen diffusion on the corrosion of the steel is quite significant under aerobic conditions.The corrosion potentials of the pipeline steel are –0.75 V and –0.65 V respectively in anaerobic and aerobic conditions. The corrosion rate in aerobic conditions could be 10 times higher than that inanaerobic conditions.Different from scenario (2), when the conditions change from anaerobic to aerobic, the impedance does not change much, while the corrosion potential of pipeline steel shifts from –0.75 V to –0.22 V. These results may suggest that a film may be formed on the surface prior to the condition change.

34
Investigation of scenarios (1) – (3) using a cell with
small solution volume and/or sacrificing Fe
Procedures to form siderite relatively quickly
Film characterization by in-situ + ex-situ Raman on
samples with and without pre-formed siderite
Corrosion rate measurements
EIS interpretations by equivalent circuits
Future Work

35
Research in progress …

36
Acknowledgements
NOVA Research and Technology Center for financial support;
Marek Odziemkowski, University of Waterloo, for
Raman spectroscopy analysis;
Surface Science Western for SEM and Raman spectroscopy analysis;
Members of Professor Shoesmith Group for friendship and assistance.