Embed Size (px)
Citation preview

TATIANE FERNANDES
CHARACTERIZATION OF REHYDRATED SORGHUM AND
CORN GRAIN SILAGES WITH ENZYMES AND A MODEL OF
STARCH RUMINAL DEGRADABILITY IN FEEDSTUFFS
LAVRAS – MG
2018

TATIANE FERNANDES
CHARACTERIZATION OF REHYDRATED SORGHUM AND CORN GRAIN
SILAGES WITH ENZYMES AND A MODEL OF STARCH RUMINAL
DEGRADABILITY IN FEEDSTUFFS
Tese apresentada à Universidade Federal de
Lavras, como parte das exigências do
Programa de Pós Graduação em Zootecnia,
área de concentração em Produção e Nutrição
de Ruminantes, para obtenção do título de
Doutora.
Prof.ª Carla Luiza da Silva Ávila
Orientadora
LAVRAS - MG
2018

Ficha catalográfica elaborada pelo Sistema de Geração de Ficha Catalográfica da Biblioteca
Universitária da UFLA, com dados informados pelo(a) próprio(a) autor(a).
Fernandes, Tatiane .
Characterizationof rehydrated sorghum and corn grain silages
with enzymes and a model of starchruminal degradability in
feedstuffs / Tatiane Fernandes. - 2018.
140 p.
Orientador(a): Carla Luiza da Silva Ávila.
Coorientador(a): Marcos Neves Pereira, Rosane Freitas
Schwan, Luiz Felipe Ferraretto.
Tese (doutorado) - Universidade Federal de Lavras, 2018.
Bibliografia.
1. Bacillus. 2. ruminal degradability. 3. reconstituted corn. I.
Ávila, Carla Luiza da Silva. II. Pereira, Marcos Neves. III. Schwan,
Rosane Freitas. IV. Ferraretto, Luiz Felipe. V. Título.
O conteúdo desta obra é de responsabilidade do(a) autor(a) e de seu orientador(a).

TATIANE FERNANDES
CHARACTERIZATION OF REHYDRATED SORGHUM AND CORN GRAIN
SILAGES WITH ENZYMES AND A MODEL OF STARCH RUMINAL
DEGRADABILITY IN FEEDSTUFFS
CARACTERIZAÇÃO DAS SILAGENS DE GRÃOS DE SORGO E MIILHO
REIDRATADOS COM ADIÇÃO DE ENZIMAS E MODELO DE DEGRADAÇÃO
RUMINAL DO AMIDO EM ALIMENTOS
Tese apresentada à Universidade Federal de
Lavras, como parte das exigências do
Programa de Pós-Graduação em Zootecnia,
área de concentração em Produção e Nutrição
de Ruminantes, para obtenção do título de
Doutora.
Aprovada em 05 de março de 2018.
Dr. Marcos Neves Pereira - UFLA/DZO/Professor Titular
Dr. Luiz Felipe Ferraretto - University of Florida
Drª. Rosane Freitas Schwan – UFLA/DBI/Professora Titular
Drª. Renata Apocalypse Nogueira Pereira - EPAMIG SUL/Bolsa PIB-Fapemig
Prof.ª Carla Luiza da Silva Ávila
Orientadora
LAVRAS - MG
2018

Aos meus pais, Vanderlei e Neusa, pelo maior amor do mundo
Dedico

AGRADECIMENTOS
Ao “SENHOR” que me conduz pelos caminhos da vida.
Aos meus pais Vanderlei e Neusa Fernandes, que amo incondicionalmente, pelo amor,
ensinamentos, dedicação, educação, paciência e todas as oportunidades que eu tive em minha vida.
Às minhas irmãs Anne e Deise Fernandes, pela paciência, amizade e amor durante toda a
minha vida.
À minha pequena e linda sobrinha Júlia, por alegrar as nossas vidas.
A minha família pela paciência e compreensão que tiveram durante os momentos ausentes
e difíceis em que deixei de compartilhar alegria e carinho.
À Universidade Federal de Lavras, em especial aos Programas de Pós-Graduação em
Zootecnia e Microbiologia Agrícola, por fornecer o aporte necessário para o desenvolvimento
deste trabalho.
À University of Florida por me receber como aluna no programa sanduiche, e dar suporte
à realização deste trabalho.
Ao Conselho Nacional de Pesquisa – CNPq, pela concessão da bolsa de estudos, apoiando
financeiramente a realização desta pós-graduação.
À Coordenação de Aperfeiçoamento de Pessoal de Nível Superior (CAPES), pela
concessão de bolsa no programa de doutorado sanduiche.
À Professora Carla Luiza da Silva Ávila, pela orientação, ensinamentos, paciência,
compreensão e principalmente exemplo de pessoa e profissionalismo.
Aos meus coorientadores Marcos Neves Pereira, Luiz Felipe Ferraretto e Rosane Shwan,
pelo apoio e dedicação.
À Renata Apocalypse Nogueira Pereira, pela disponibilidade, apoio e auxilio.
À Beatriz Carvalho por todas as broncas e puxões de orelha, mas principalmente pelo apoio
e dedicação durante a condução dos trabalhos e sem dúvida pelo exemplo de pessoa forte e
batalhadora.
Aos colegas dos grupos de estudo Grupo do Leite, NEFOR e NEFER, obrigado por
compartilharem conhecimentos, dividirem os trabalhos e somarem os bons momentos.
Aos meus mais que colegas, amigos com quem partilhei muitos momentos Paola Spasiani,
Fernanda Cavalari, Felipe Amaro, Fernanda Gomes, Josiane Santos, Karina Toledo, Fabiana
Cardoso, Júlia Dias, Eveline Alves, Leilane Oliveira, Jessica Gusmão, Cátia Feranandes, Daviane
Costa, Maria Helena, Douglas Duarte, Eugenio Barbosa.
Aquelas com quem dividi muito mais do que o aluguel, dividi os melhores momentos e
também as piores frustrações, por todo apoio, companheirismo e amizade Stéfanny Martins,
Patrícia Rodriguez, Viviane Reis, Mariana Vianna, Agatha Neves, Victoria Rocha, Jessica, Ana.
A todos aqueles que de alguma forma colaboraram para que este trabalho se tornasse uma
realidade.

Só levo a certeza que muito pouco eu sei.
Ou nada sei.
Almir Sater

RESUMO GERAL
Artigo 1. Os objetivos deste estudo foram avaliar o efeito de dois amyloglicosidases e duração de
armazenamento de grãos de sorgo ou milho reidratado e ensilados. Os grãos foram reidratados
(65% de MS) antes de ensilar. Dosagens de amiloglicosidase AMG (AMG, Novozymes) e GAM
(Sanferm rendimento, Novozymes) foram de 0,35 mL/kg de grão. Tratamentos foram um fatorial
de 2 x 3 x 2, sendo grão (sorgo vs. milho), enzima (CTL vs AMG vs GAM), e duração (30 d vs
180 d) com 6 repetições. A degradação in situ de MS foi avaliada com tempos de incubação de 0
(lavagem), 3, 6, 12, 18 e 48 h em 3 vacas canuladas no rúmen. Reidratação e ensilagem de sorgo
ou milho com adição de amiloglicosidase resultaram em fermentação adequada, como evidenciado
pelo pH e concentração ácido láctico. Aumento da perda de MS, da hidrolise de amido e a
proporção de MS como fração A, sem alteração no kd ou degradabilidade efetiva a 6.5% de taxa
de passagem. Sendo necessário maior tempo de fermentação para melhorar a digestibilidade da
MS.
Artigo 2. O objetivo deste estudo foi identificar a diversidade de microrganismos e a relação entre
esses microrganismos com características de sorgo e milho reidratado e ensilados com adição de
amiloglicosidase. Para silagem foi utilizado o mesmo procedimento do artigo 1. Matrix-assisted
laser desorption/ ionization time-of-flight mass spectrometry foi utilizado para identificação. Sete
espécies de bactérias do ácido láctico (BAL) foram isoladas com uma população média de 3,84 e
5.74 ufc/g aos 30 e 180 dias de fermentação, respectivamente. A diversidade de bactérias
formadoras de esporos aeróbias (SAB) foi de 20 espécies, com uma população média de 3,18 e
2.72 ufc/g aos 30 e 180 dias de fermentação, respectivamente. A população de BAL e maior parte
do SAB foram correlacionadas com ácidos e perdas de nutrientes e negativamente correlacionadas
com teor de pH, DM e amido. Três SAB foram correlacionadas com conteúdo prolamina. A

fermentação do grão reidratado é dominada por BAL, com alta população, mas SAB possuem
maior diversidade. A maior parte dos microrganismos envolveram-se em perdas de MS e produção
de ácidos.
Artigo 3. Os objetivos deste estudo foram determinar: 1) o método mais adequado para estimar a
fração rapidamente degradável (A); 2) um ponto de tempo para medir a fração de indigestível (C);
e 3) a viabilidade de utilizar menos tempo-pontos para estimar a taxa de desaparecimento
fracionária de amido (kd) de grãos de milho maduro moídos através de 4 tamanhos (1, 2, 4 e 6
mm) de peneira. Fração A foi determinada por seis procedimentos diferentes. Incubação ruminal
in-situ foi realizada nos tempos 48, 72, 96 e 120 h para determinar a fração C e nos tempos 0
(máquina de lavar), 3, 6, 12, 18, 24 e 48 h para determinar a cinética do desaparecimento do amido.
Modelos foram usados com 2 ou 3-pools e kd foi determinada pela inclinação do logaritmo linear
'ln' do resíduo de cada tempo de incubação como proporção da amostra incubada. Fração A foi
afetada pela moagem tamanho; mas não pelo método de lavagem. Amostras moídas em 6mm tinha
maior fração C do que outros tamanhos de moagem com 48, 72 ou 96 h; mas não em 120 h. O
modelo afetou valores de fração B unicamente. Como maior tamanho de moagem, observou-se
maior fracções B e C, mas menor kd e ERD. Com base na análise de correlação, o modelo 2-pools,
e os tempos de incubação de 48 h, 3 e 0 foram adequados para avaliar a cinética de degradação
ruminal do amido nos alimentos para animais. Incubação ruminal in situ a 120h evidenciou a falta
de uma fração C de amido (0,13% de amido). Determinação da fração A enxaguando em uma
máquina de lavar e incubação ruminal in situ por 0, 3 e 48 h para a cinética de degradação de
amido usando um modelo de 2-pools são sugeridos para alimentos ricos em amido. Tamanho de
moagem afetou a cinética de degradação de amido.
Palavras chave: Bacillus, degradabilidade ruminal, Lactobacillus, milho reconstituído.

GENERAL ABSTRACT
Paper 1. The objectives of this study were to evaluate the effect of two amyloglucosidases and
duration of storage of sorghum or corn kernel rehydrated and ensiled. Kernels were rehydrated
(65% of DM) before ensiled. Dosages of amyloglucosidase AMG (AMG, Novozymes) and GAM
(Sanferm Yield, Novozymes) were 0.35 mL/kg of kernel. Treatments were a 2 x 3 x 2 factorial
combination of G (Sorghum vs. Corn), A (CTL vs. AMG vs. GAM), and duration (30 d vs. 180 d)
with 6 replicates. The in situ DM degradation was evaluated with incubation times of 0 (bag wash),
3, 6, 12, 18, and 48 h in 3 rumen cannulated cows. Rehydration and ensiling of sorghum or corn
with addition of amyloglucosidase resulted in adequate fermentation, as evidenced by pH and
lactic acid concentration. Increased DM loss, hydrolyze of starch, and the proportion of DM as
fraction A, without alteration on kd or ERD 6.5. Is necessary long time of fermentation to improve
DM digestibility.
Paper 2. The objective of this study was to identify microorganism diversity and relationship
between those microorganisms with characteristics of rehydrated sorghum or corn silages with
addition of amyloglucosidase. For silage were used the same procedure of paper 1. Matrix-assisted
laser desorption/ ionization time-of-flight mass spectrometry and PCR-based to identification.
Seven species of lactic acid bacteria (LAB) were isolated with an average population of 5.74 and
3.84 ufc/g at 30 and 180 days of fermentation, respectively. The spore forming aerobic bacteria
(SAB) diversity was 20 species, with an average population of of 3.18 and 2.72 ufc/g at 30 and
180 days of fermentation, respectively. The population of LAB and most part of SAB were
corelated with acids and nutrient losses and negatively correlation with pH, DM and starch content.
Three SAB were corelated with prolamin content. The fermentation of rehydrated kernel was
dominating by LAB, with highly population, but had greater diversity of SAB. The most part of
microorganisms were involved in acids production, DM and starch losses.
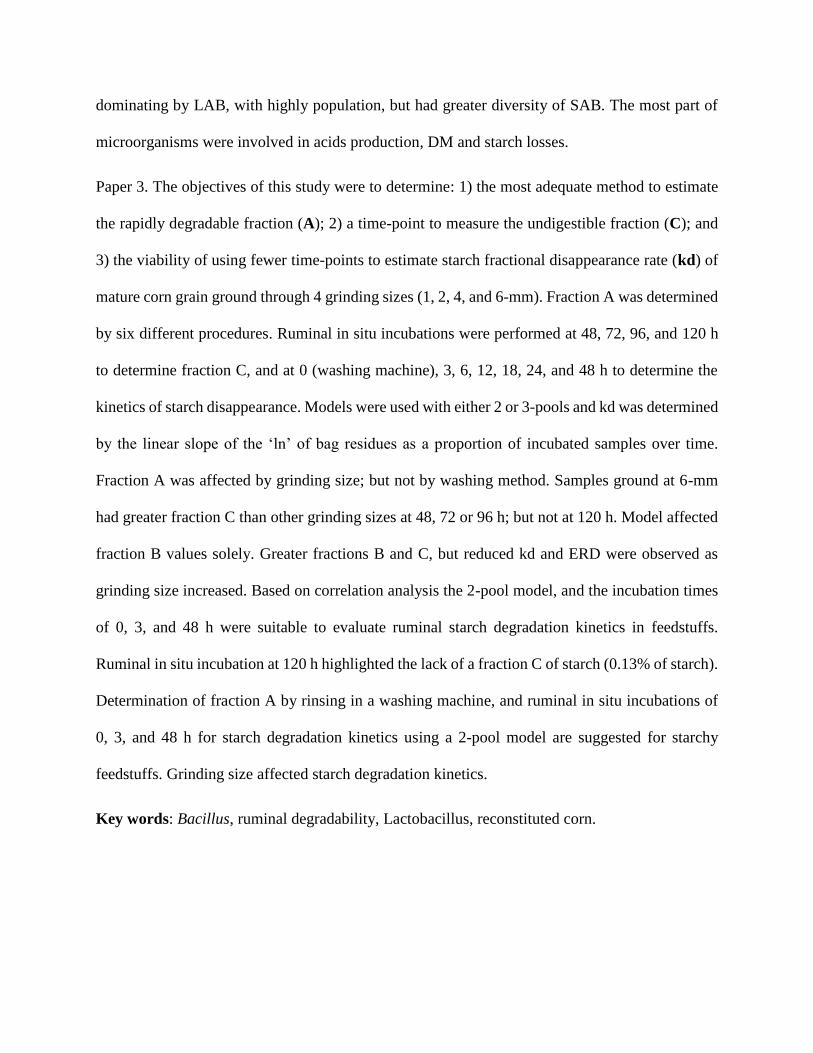
Paper 3. The objectives of this study were to determine: 1) the most adequate method to estimate
the rapidly degradable fraction (A); 2) a time-point to measure the undigestible fraction (C); and
3) the viability of using fewer time-points to estimate starch fractional disappearance rate (kd) of
mature corn grain ground through 4 grinding sizes (1, 2, 4, and 6-mm). Fraction A was determined
by six different procedures. Ruminal in situ incubations were performed at 48, 72, 96, and 120 h
to determine fraction C, and at 0 (washing machine), 3, 6, 12, 18, 24, and 48 h to determine the
kinetics of starch disappearance. Models were used with either 2 or 3-pools and kd was determined
by the linear slope of the ‘ln’ of bag residues as a proportion of incubated samples over time.
Fraction A was affected by grinding size; but not by washing method. Samples ground at 6-mm
had greater fraction C than other grinding sizes at 48, 72 or 96 h; but not at 120 h. Model affected
fraction B values solely. Greater fractions B and C, but reduced kd and ERD were observed as
grinding size increased. Based on correlation analysis the 2-pool model, and the incubation times
of 0, 3, and 48 h were suitable to evaluate ruminal starch degradation kinetics in feedstuffs.
Ruminal in situ incubation at 120 h highlighted the lack of a fraction C of starch (0.13% of starch).
Determination of fraction A by rinsing in a washing machine, and ruminal in situ incubations of
0, 3, and 48 h for starch degradation kinetics using a 2-pool model are suggested for starchy
feedstuffs. Grinding size affected starch degradation kinetics.
Key words: Bacillus, ruminal degradability, Lactobacillus, reconstituted corn.
LISTA DE FIGURAS
ARTIGO 1
Figure 1. Interaction between amyloglucosidase addition, and duration of storage length on DM
(panel A; P < 0.01; SEM = 0.942) in rehydrated sorghum or corn kernel silage. Interaction between
amyloglucosidase addition, and duration of storage length on DM loss (panel B; P < 0.01; SEM =
1.983) in rehydrated sorghum or corn kernel silage. Treatments were rehydrated sorghum or corn
kernel ensiled with amyloglucosidase (AMG or GAM) or without (C), and duration of storage
length (30 or 180 days)……………………………………………………………..…………….72
Figure 2. Interaction between kernel, amyloglucosidase addition, and duration of storage length
on free glucose (P < 0.01; SEM = 0.594) in rehydrated sorghum or corn kernel silage. Treatments
were rehydrated sorghum (Sor) or corn (Cor) kernel ensiled with amyloglucosidase (AMG or
GAM) or without (C), and duration of storage length (30 or 180 days)………………………….73
Figure 3. Interaction between kernel and amyloglucosidase addition length on pH (panel A; P =
0.02; SEM = 0.249) in rehydrated sorghum or corn kernel silage. Interaction between kernel and
and duration of storage length on pH (panel B; P = 0.02; SEM = 2.463) in rehydrated sorghum or
corn kernel silage. Treatments were rehydrated sorghum (Sor) or corn (Cor) kernel ensiled with
amyloglucosidase (AMG or GAM) or without (C), and duration of storage length (30 or 180
days)…………………………………………………………………………………..………….74
Figure 4. Interaction between kernel, amyloglucosidase addition, and duration of storage length
on propionic acid (panel A; P = 0.02; SEM = 0.3878), and butyric acid (panel B; P < 0.01; SEM
= 0.0684) in rehydrated sorghum or corn kernel silage. Treatments were rehydrated sorghum (Sor)
or corn (Cor) kernel ensiled with amyloglucosidase (AMG or GAM) or without (C), and duration
of storage length (30 or 180 days)………………………………………………………………...75
Figure 5. Interaction between kernel, amloglucosidase addition, and duration of storage length on
ethanol (P = 0.04; SEM = 0.1263), and butyric acid (panel B; P < 0.01; SEM = 0.0684) in
rehydrated sorghum or corn kernel silage. Treatments were rehydrated sorghum (Sor) or corn (Cor)
kernel ensiled with amyloglucosidase (AMG or GAM) or without (C), and duration of storage
length (30 or 180 days)…………………………………………………………………………...76

ARTIGO 2
Figure 1. Dendrogram derived from a protein cluster analysis of lactic acid bacteria isolated of
rehydrated sorghum kernel silage with 30 or 180 d, and addition of amyloglucosidase AMG or
GAM, and control, in MRS agar. Numbers in brackets are the strain identification. …………….98
Figure 2. Dendrogram derived from a protein cluster analysis of lactic acid bacteria isolated of
rehydrated corn kernel silage with 30 or 180 d, and addition of amyloglucosidase AMG or GAM,
and control, in MRS agar. Numbers in brackets are the strain identification…………………....99
Figure 3. Dendrogram derived from a protein cluster analysis of aerobic spore forming bacteria
isolated of rehydrated sorghum kernel silage with 30 or 180 d, and addition of amyloglucosidase
AMG or GAM, and control, in MRS agar. Numbers in brackets are the strain identification.....100
Figure 4. Dendrogram derived from a protein cluster analysis of aerobic spore forming bacteria
isolated of rehydrated corn kernel silage with 30 or 180 d, and addition of amyloglucosidase AMG
or GAM, and control, in MRS agar. Numbers in brackets are the strain identification.101
Figure 5. Principal component analysis (PCA) treatments kernel (sorghum and corn), enzyme
(CON, AMG, and GAM) and duration of fermentation (30 and 180 days), grouped based on
nutrient values, fermentation end products, and population of bacteria. The factor 1 and factor 2 of
principal components explained 51.60 and 22.09%, respectively, of the total variance. The
numbers represent kernel, enzyme, and duration of fermentation: 1- Sorghum, CON, 30 d; 2-
Sorghum, AMG, 30 d; 3- Sorghum, GAM, 30 d; 4- Sorghum, CON, 180 d; 5- Sorghum, AMG,
180 d; 6- Sorghum, GAM, 180 d; 7- Corn, CON, 30 d; 8- Corn, AMG, 30 d; 9- Corn, GAM, 30 d;
10- Corn, CON, 180 d; 11- Corn, AMG, 180 d; 12- Corn, GAM, 180 d.…………………..…..104
Figure 6. Principal component analysis (PCA) of nutrient values, fermentation end products, and
population of acid lactic bacteria (L) and aerobic spore forming bacteria (S). The factor 1 and
factor 2 of principal components explained 51.60 and 22.09%, respectively, of the total variance.
The numbers represent the variables: 1- % of DM; 2- DM loss; 3- Starch; 4- Starch loss; 5- Free
Glucose; 6- Prolamin; 7- NH3; 8- Fraction A; 9- Kd; 10- pH; 11- Lactic; 12- Acetic; 13- Propionic;
14- Butyric; 15- 1,2 propanodiol; 16- Ethanol; and the microorganisms: L1- Lactobacillus brevis;
L2- Lactobacillus buchneri; L3- Lactobacillus parabuchneri; L4- Lactobacillus plantarum; L5-
Pediococcus acidilactici; L6- Pediococcus pentosaceus; L7- LAB not identificated; S1- Bacillus

atrophaeus; S2- Bacillus cereus group; S3- Bacillus circulans; S4- Bacillus clausii; S5- Bacillus
horneckiae; S6- Bacillus licheniformis; S7- Bacillus megaterium; S8- Bacillus oleronius; S9-
Bacillus pumilus; S10- Bacillus vallismortis; S11- Brevibacillus brevis; S12- Brevibacillus
invocatus; S13- Lysinobacillus boronitolerans; S14- Lysinobacillus sphaericus; S15-
Paenibacillus glucanolyticus; S16- Paenibacillus lautus; S17- Paenibacillus macerans; S18-
Paenibacillus rhizosphaerae; S19- SAB not identificated 1; S20- SAB not identificated
2.………………………………………………………………………………………………...105
ARTIGO 3
Figure 1. Fraction A of DM (Panels A and B) and starch (Panels C and D) of dry corn ground at
different grinding sizes (1-mm, ; 2-mm, ; 4-mm, ; and 6-mm, ) and determined by different
washing procedures [rinsing in a bucket (B) , rinsing in a washing machine (W) , inserting in
the rumen and rinsing in a bucket (RB) , inserting in the rumen and rinsing in the washing
machine (RW) , immersing in warm water during 30 min and rinsing in a bucket (IB) , and
immersing in warm water during 30 min and rinsing in the washing machine (IW) ■]. For fraction
A of dry matter: effects of grinding size (P = 0.001), washing method (P = 0.001), and interaction
between grinding size and washing method (P = 0.77), SEM = 0.480. For fraction A of starch: P
effects of grinding size (P = 0.001), washing method (P = 0.82), and interaction between grinding
size and washing method (P = 0.94), SEM = 2.140. Means with different letters differ at P ≤ 0.05
by pairwise t-test.……………………………………………………………………….……...129
Figure 2. Relationship of the instantaneously degradable Fraction A of DM and starch of dry corn
ground at different grinding sizes (1-mm ●, 2-mm ▲, 4-mm ◆, and 6-mm ) and determined by
different washing procedures. Prediction equation: Y = - 12.647 + 1.098 X; n = 144, root mean
square error = 15.63, R2 = 0.75, P < 0.001………………..…………………………………….130
Figure 3. Fraction C of DM (% of DM; Panel A) and starch (% of starch; Panel B) of dry corn
ground at different grinding sizes (1-mm , 2-mm , 4-mm , and 6-mm ) and incubated for
different time-points of ruminal in situ disappearance (48, 72, 96, and 120-h). For Panel A: effects
of grinding size (P = 0.001), incubation time (P = 0.001), and interaction between grinding size
and incubation time (P = 0.01), SEM = 1.893. For Panel B: effects of grinding size (P = 0.001),
incubation time (P = 0.001), and interaction between grinding size and incubation time (P = 0.001),
SEM = 1.960. Means with different letters differ at P ≤ 0.05 by pairwise t-
test………………………………………………………………………………………………131
Figure 4. Relationship of the Fraction C of DM and starch (residue of the 120-h ruminal in situ
incubation) of dry corn ground at different grinding sizes (1-mm ●, 2-mm ▲, 4-mm ◆, 6-mm ).
Prediction equation: Y = - 0.3532 + 0.2889 X; n = 24, root mean square error = 0.27, R2 = 0.66, P
< 0.001………………………………………………………………………………………….132
Figure 5. Effect of grinding size (1-mm ●, 2-mm ▲, 4-mm ◆, and 6-mm ) on ruminal in situ
DM (% of DM; Panel A) and starch (% of starch; Panel B) disappearance at 0, 3, 6, 12, 18, 24, 48,
and 120-h of incubation of dry ground corn. Time 0 degradation was the disappearance measured
using the washing machine procedure. For Panel A: Effects of grinding size (P = 0.001), incubation
time (P = 0.001), and interaction between grinding size and incubation time (P = 0.40), SEM =
4.285. For Panel B: Effects of particle size (P = 0.001), incubation time (P = 0.001), and interaction
between particle size and incubation time (P = 0.05), SEM = 4.264. Means for incubation times
with different letters differ at P ≤ 0.05 by pairwise t-test. Means for mesh diameter with different
symbols differ at P ≤ 0.05 by pairwise t-test (1-mm vs. 6-mm *, 1-mm vs. 4-mm †, 1-mm vs. 2-
mm ‡, 2-mm vs. 6-mm +, 2-mm vs. 4-mm ×, 4-mm vs. 6-mm ∆).……………………………..133
Figure 6. Relationship of ruminal disappearance of DM and starch of dry corn ground at different
grinding sizes (1, 2, 4, and 6-mm) and incubated in situ for 3-h (+), 6-h (◇), 12-h (□), 18-h (△),
24-h (○), and 48-h (×). Prediction equation: Y = - 14.394 + 1.2245 X; n = 144, root mean square
error = 59.89, R2 = 0.97, P < 0.001…………………………………………………….……….134
Figure 7. Relationship between the fractional disappearance rate of Fraction B (kd) estimated with
a 2-pool model (Fractions A and B) of DM and starch of dry corn ground at different grinding
sizes (1-mm ●, 2-mm ▲, 4-mm ◆, and 6-mm ). Prediction equation: Y = - 5.2317 + 3.0882 X; n
= 24, root mean square error = 8.15, R2 = 0.88, P < 0.001……………….…………………….136

LISTA DE TABELAS
ARTIGO 1
Table 1. Nutrient composition and particle size of ground sorghum and corn kernel before ensiling
………..…………………………………………………………………………………………..69
Table 2. Dry matter (DM), starch, glucose, prolamin, and ammonia-N content, DM loss and starch
during ensiling, and kinetics of ruminal DM degradation of rehydrated corn or sorghum kernel
silage with 30 or 180 d, and addition of amyloglucosidase (AMG), amyloglucosidase (GAM), and
Control (CON)………………………………………………………………………………...…70
Table 3. Silage pH, lactic acid bacteria (LAB), organic acids and alcohol content of rehydrated
corn or sorghum kernel silage with 30 or 180 d, and addition of amyloglucosidase (AMG),
amyloglucosidase (GAM), and Control (CON)…………………………………………………71
ARTIGO 2
Table 1. Silage characterization, average of nutrient composition, degradation and fermentative
parameters of rehydrated sorghum and corn kernel silages with 30 and 180 days of storage and
with or without addition of amyloglucosidades…………………………………………………..95
Table 2. Characteristics of lactic acid bacteria isolated of rehydrated sorghum or corn kernel
silages with 30 or 180 d, and addition of amyloglucosidase (AMG), amyloglucosidase (GAM),
and Control (CON)……………………………………………………………………………….96
Table 3. Characteristics of aerobic spore forming bacteria isolated of rehydrated sorghum or corn
kernel silage with 30 or 180 d, and addition of amyloglucosidase (AMG), amyloglucosidase
(GAM), and Control (CON)……………………………………………………………………...97

Table 4. Population (Log) and identification of lactic acid bacteria isolated of rehydrated sorghum
or corn kernel silage with 30 or 180 d, and addition of amyloglucosidase (AMG),
amyloglucosidase (GAM), and Control (CON)………………………………………………..102
Table 5. Population (Log) and identification of aerobic spore forming bacteria isolated of
rehydrated sorghum or corn kernel silage with 30 or 180 d, and addition of amyloglucosidase
(AMG), amyloglucosidase (GAM), and Control (CON)………………………………………..103
ARTIGO 3
Table 1. Dry matter and starch concentrations, particle size distribution, geometric mean particle
size (GMPS), and surface area of dry corn ground at varying grinding sizes………………….128
Table 2. Fractions A, B, and C1, fractional disappearance rate of Fraction B (kd), effective ruminal
disappearance (ERD2) estimated with differing ruminal fractional passage rates (kp) of dry corn
ground at different grinding sizes (GS; 1, 2, 4, and 6-mm) and subjected to ruminal in situ
incubations for 0, 3, 6, 12, 18, 24, and 48-h. Two (Fractions A and B) or 3-pool models (Fractions
A, B, and C) were used to estimate the ruminal disappearance parameters……….....................135
Table 3. The linear correlation coefficients between the fractional disappearance rate (kd) of starch
estimated with all ruminal incubation time-points (Times. 0, 3, 6, 12, 18, 24, and 48-h) and the kd
estimated with 3 or 2 incubation time-points using a 2-pool model (Fractions A and
B)1…..………………………………………………………………………….……………….137
Table 4. Feed starch concentration, fractions A, B, and C1, fractional disappearance rate of
Fraction B (kd), effective ruminal disappearance (ERD2) estimated with differing ruminal
fractional passage rates (kp). All samples were ground at 2-mm………………………………138

SUMÁRIO
PRIMEIRA PARTE ................................................................................................................................. 19
1 INTRODUÇÃO ...................................................................................................................................... 19
2 REFERENCIAL TEÓRICO ................................................................................................................. 22
2.1 Disponibilidade de amido nos alimentos ....................................................................................... 22
2.1.1 Milho e sorgo ............................................................................................................................ 22
2.1.2 Textura do endosperma ........................................................................................................... 23
2.1.3 Matriz proteica e prolaminas .................................................................................................. 25
2.1.4 Processamento e tamanho de partícula .................................................................................. 27
2.2 Ensilagem de grãos reidratados ..................................................................................................... 28
2.2.1 Perfil fermentativo ................................................................................................................... 29
2.2.2 Microbiologia da silagem ......................................................................................................... 31
2.2.2.1 Bactérias do ácido lático ................................................................................................... 33
2.2.2.2 Bactérias formadoras de esporos ..................................................................................... 34
2.2.3 Degradação ruminal do amido e matéria seca ...................................................................... 35
2.2.4 Utilização de enzimas ............................................................................................................... 36
2.2.4.1 Amiloglicosidase ................................................................................................................ 37
2.3 Degradação ruminal do amido....................................................................................................... 38
2.3.1 Método de avaliação in situ ..................................................................................................... 39
2.3.2 Estimativa da taxa de degradação e tempos de incubação ................................................... 40
2.4 REFERÊNCIAS .............................................................................................................................. 42
SEGUNDA PARTE .................................................................................................................................. 54
3 ARTIGO 1: Silage of sorghum or corn kernels rehydrated with enzymes additives ...................... 54
Acknowledgments ................................................................................................................................. 55
Abstract .................................................................................................................................................. 55
Introduction ........................................................................................................................................... 56
Materials and methods ......................................................................................................................... 57
Results and Discussion .......................................................................................................................... 61
References .............................................................................................................................................. 66
4 ARTIGO 2: Lactic acid bacteria and spore forming aerobic bacteria in corn and sorghum kernels
rehydrated and ensiled with amyloglucosidase addition ....................................................................... 77
ABSTRACT ........................................................................................................................................... 78
INTRODUCTION ................................................................................................................................. 80
MATERIALS AND METHODS ......................................................................................................... 81
RESULTS .............................................................................................................................................. 84
DISCUSSION ........................................................................................................................................ 87
CONCLUSIONS ................................................................................................................................... 89
ACKNOWLEDGMENTS .................................................................................................................... 90
REFERENCES ...................................................................................................................................... 90
5 ARTIGO 3: Effect of washing method, grinding size, and the determination of an undegraded
fraction on in situ effective ruminal disappearance and disappearance rate of starch in mature corn
grain ......................................................................................................................................................... 106
ABSTRACT ......................................................................................................................................... 108
INTRODUCTION ............................................................................................................................... 109
MATERIALS AND METHODS ....................................................................................................... 111
RESULTS AND DISCUSSION ......................................................................................................... 116
CONCLUSIONS ................................................................................................................................. 121
ACKNOWLEDGMENTS .................................................................................................................. 122
REFERENCES .................................................................................................................................... 122

19
PRIMEIRA PARTE
1 INTRODUÇÃO
O milho (Zea mays) e o sorgo (Sorghum bicolor (L.) Moench) estão entre os principais
cereais utilizados na alimentação animal como fonte de amido (CRUZ; NUCIO, 2002). Os grãos
de milho e sorgo são compostos por aproximadamente 72% de amido (PAES, 2006), mas híbridos
de sorgo apresentam maior variação na digestibilidade e fermentação ruminal do amido que os
híbridos de milho (STOCK, 1999). A digestibilidade do amido é influenciada por vários fatores
tais como o tamanho das partículas, processamento de cereais, método de armazenamento (Firkins
et al., 2001; Ferraretto et al., 2013), maturidade na colheita, teor de umidade, duração do
armazenamento no silo (Hoffman et al., 2011; Ferraretto e Shaver, 2012) e tipo de endosperma de
milho (Correa et al., 2002).
As principais diferenças entre sorgo e milho se referem ao tipo e distribuição de proteínas
que circundam o amido no endosperma (CRUZ; NUCIO, 2002). Os grãos de milho e sorgo
apresentam em média 7-15% de proteína, sendo que 70-90% são consideradas como proteínas de
reserva, as prolaminas, chamadas de zeínas no milho e kafirinas no sorgo (BOYER; HANNAH,
2001; LANRY et al., 2005; NUNES et al., 2005; WANISKA; ROONEY, 2000). As prolaminas
estão localizadas principalmente no endosperma e possuem grande quantidade de prolina e aminas
(HERMAN; LARKINS, 1999). A prolina é a responsável pela característica hidrofóbica das
prolaminas, tornando-a não solúvel em água e formando uma barreira hidrofóbica que envolve os
grânulos de amido (MCALLISTER et al., 1990) e que impede a ação das enzimas que degradam
o amido, reduzindo a degradação.
A silagem de grão reidratado consiste, basicamente, na hidratação do grão maduro moído,
o que propicia sua fermentação e armazenamento como silagem (PEREIRA et al., 2013). A
moagem, reidratação e ensilagem são formas de processamento, que associadas podem aumentar
a digestibilidade do amido (CASTRO, 2017). A silagem de milho reidratado é uma forma de
contrapor o efeito negativo da textura dura do endosperma sobre a digestibilidade do amido em
grãos no estágio maduro de maturação. Durante a ensilagem ocorre proteólise por enzimas
microbianas das prolaminas que envolvem os grânulos de amido (HOFFMAN et al., 2011), o que
é capaz de aumentar a proporção da degradação que ocorre no rúmen (BITENCOURT, 2012).
20
O processo de fermentação da silagem é considerado como uma metabiose, envolvendo o
desenvolvimento de microrganismos de diversos gêneros e espécies que são influenciados pelo
pH, pelo potencial de oxirredução e pelos substratos presentes no material ensilado (PEREIRA;
SANTOS, 2006). Caracterizar a microbiota da silagem pode auxiliar na compreensão da
fermentação da silagem, possibilitando a intervenção do processo de fermentação e da melhora da
qualidade da silagem (CARVALHO et al., 2016). Há indícios que o tipo de microrganismo
presente na silagem pode modificar a intensidade da proteólise e influenciar a degradação ruminal
(SILVA et al., 2018).
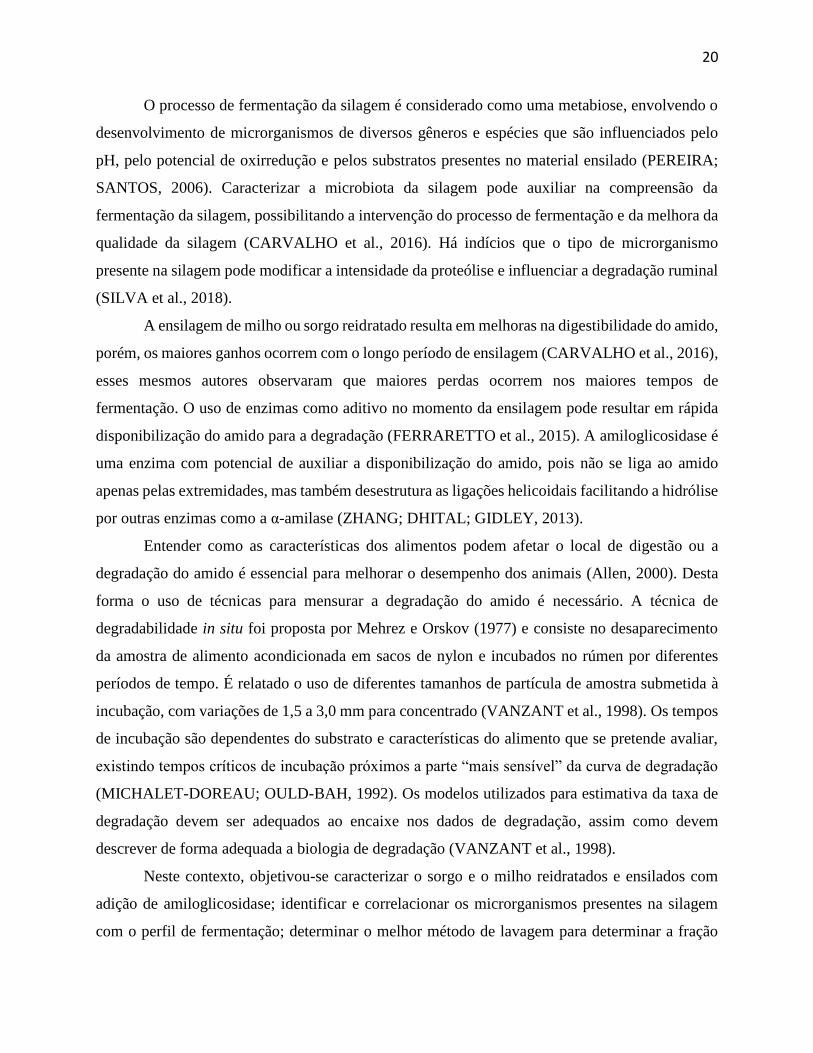
A ensilagem de milho ou sorgo reidratado resulta em melhoras na digestibilidade do amido,
porém, os maiores ganhos ocorrem com o longo período de ensilagem (CARVALHO et al., 2016),
esses mesmos autores observaram que maiores perdas ocorrem nos maiores tempos de
fermentação. O uso de enzimas como aditivo no momento da ensilagem pode resultar em rápida
disponibilização do amido para a degradação (FERRARETTO et al., 2015). A amiloglicosidase é
uma enzima com potencial de auxiliar a disponibilização do amido, pois não se liga ao amido
apenas pelas extremidades, mas também desestrutura as ligações helicoidais facilitando a hidrólise
por outras enzimas como a α-amilase (ZHANG; DHITAL; GIDLEY, 2013).
Entender como as características dos alimentos podem afetar o local de digestão ou a
degradação do amido é essencial para melhorar o desempenho dos animais (Allen, 2000). Desta
forma o uso de técnicas para mensurar a degradação do amido é necessário. A técnica de
degradabilidade in situ foi proposta por Mehrez e Orskov (1977) e consiste no desaparecimento
da amostra de alimento acondicionada em sacos de nylon e incubados no rúmen por diferentes
períodos de tempo. É relatado o uso de diferentes tamanhos de partícula de amostra submetida à
incubação, com variações de 1,5 a 3,0 mm para concentrado (VANZANT et al., 1998). Os tempos
de incubação são dependentes do substrato e características do alimento que se pretende avaliar,
existindo tempos críticos de incubação próximos a parte “mais sensível” da curva de degradação
(MICHALET-DOREAU; OULD-BAH, 1992). Os modelos utilizados para estimativa da taxa de
degradação devem ser adequados ao encaixe nos dados de degradação, assim como devem
descrever de forma adequada a biologia de degradação (VANZANT et al., 1998).
Neste contexto, objetivou-se caracterizar o sorgo e o milho reidratados e ensilados com
adição de amiloglicosidase; identificar e correlacionar os microrganismos presentes na silagem
com o perfil de fermentação; determinar o melhor método de lavagem para determinar a fração
21
solúvel; determinar o tempo de incubação para estimar o amido indigestível; determinar os
melhores tempos de incubação para estimar a taxa de degradação do amido; gerar um banco de
dados com as taxas de degradação de alimentos concentrados.

22
2 REFERENCIAL TEÓRICO
2.1 Disponibilidade de amido nos cereais: sorgo e milho
Os cereais constituem a principal fonte de alimentos no mundo. O milho é o principal cereal
cultivado nas regiões tropicais e é consumido, basicamente, como fonte energética (PEREIRA,
2006). O amido é a principal forma de armazenamento de energia para a germinação da semente,
onde o endosperma (tecido de armazenamento) é constituído, basicamente, de proteínas e grânulos
de amidos. O aproveitamento do amido é afetado por sua composição, interações entre amido e
proteína, integridade celular do grânulo de amido, presença de fatores antinutricionais como o
tanino e a forma física do alimento fornecido (ROONEY; PFLUGFELDER, 1986).
2.1.1 Milho e sorgo
O milho (Zea mays) e o sorgo (Sorghum bicolor (L.) Moench) estão entre os principais
cereais utilizados na alimentação animal, como fonte de amido (CRUZ; NUCIO, 2002). Os grãos
de milho e sorgo são compostos por aproximadamente 72 % de amido (PAES, 2006), porém
apresentam diferenças quanto à digestibilidade e à taxa de degradação do amido, sendo inferior
para o sorgo em relação o milho (CRUZ; NUCIO, 2002).
Aproximadamente 70 % do milho produzido no mundo é destinado à alimentação animal,
podendo chegar à 85% nos países mais desenvolvidos (PAES, 2006). A utilização do sorgo como
substituto ao milho é vantajosa principalmente em regiões regiões áridas e semi-áridas. O sorgo
apresenta maior resistência ao estresse hídrico, em função do seu sistema radicular bem
desenvolvido o que permite absorção de água nas camadas mais profundas do solo, além da menor
superfície foliar comparada ao milho, resultando em menor perda de água por transpiração
(SERRANO, 1971).
O milho, que tem como provavel local de origem o México, possui grãos, geralmente,
amarelos ou brancos, com variações de cor entre vermelho e preto (FERNANDES, 2014). De
acordo com Paes (2006) o grão de milho possui quatro principais estruturas físicas. Endosperma é
a estrutura de armazenamento de energia, que corresponde por 83% do grão, sendo constituído
principalmente de amido (88%) e proteína de reserva (8%). Gérmen é a estrutura reprodutiva, que
representa 11% do grão, sendo rico em lipídeos, minerais, proteínas e açúcares. Pericarpo que

23
possui a função de proteção fisica do grão, representando 5% do peso do grão, constituído
basicamente de hemicelulose e celulose. Ponta é o local de inserção do grão no sabugo, representa
2% da estrutura física do grão, sendo composta por material lignocelulósico (PAES, 2006).
O sorgo é originário de regiões de clima tropical, provavelmente da África, mas há
evidências indicam que teve dispersão independente em duas regiões, na Índia, além da África
(RIBAS, 2008). Não suporta temperaturas baixas, necessitando de temperaturas acima de 20°C
para um bom desenvolvimento (RODRIGUES FILHO et al., 2006). Entretanto, adapta-se às
situações de déficit hídrico e baixa fertilidade dos solos (RIBAS, 2010). O grão de sorgo é
composto por pericarpo, endosperma e gérmen. O pericarpo é o revestimento fibroso, com função
de proteção física, correspondendo a 5% do grão. O endosperma onde está estocado o amido,
correspondendo a 84%. O gérmen, que é a estrutura germinativa, rica em lipídeos, proteínas de
reserva, enzimas e minerais, representando 10% do grão (ROONEY; SERNA-SALDIVAR, 1991).
Os híbridos de sorgo apresentam maior variação na digestibilidade e fermentação do
amido, que os híbridos de milho. Sendo que essa variação é resultante das condições de cultivo
deste grão, pois os híbridos de sorgo, muitas vezes são cultivados em regiões mais quentes e com
baixa disponibilidade de água (STOCK, 1999). Além de fatores climáticos e do tipo de hibrido, a
composição e a forma física, as interações entre proteína e amido, a integridade celular do grânulo
de amido e os fatores antinutricionais, como a presença de taninos, que afetam a digestibilidade
do amido. O sorgo apresenta maior proporção de endosperma periférico, região mais densa do
endosperma e resistente à penetração de água, com maior proporção de proteína, tornando-o mais
resistente à degradação enzimática (ROONEY; PFLUGFELDER, 1986).
2.1.2 Textura do endosperma
Há uma variedade de genótipos de milho com o intuito de atender as exigências de
diferentes regiões quanto aos fatores ambientais, à produtividade, resistência à pragas e doenças,
ciclo vegetativo e o tipo do endosperma do grão (ZOPOLLATTO, 2007). Da mesma forma,
buscando aumentar a produtividade e a qualidade do grão de sorgo, tem sido realizado
melhoramento de variedades, principalmente à partir da introdução de características do
endosperma amarelo, que garantem resistência à seca e aumento da qualidade do grão (MILLER,
1995).
24
Como relatado anteriormente, o endosperma corresponde à aproximadamente 83% do peso
seco do grão de milho ou sorgo (PAES, 2006; ROONEY; SERNA-SALDIVAR, 1991), sendo
constituído principalmente de amido organizado na forma de grânulos (ECKHOFF; PAULSEN,
1996). O grânulo de amido possui função de reserva e é constituído por dois tipos de cadeias
helicoidais de glicose, amilose e amilopectina. A amilose constitui 20 a 30 % do amido do granulo,
é um polímero linear, formado por aproximadamente 600 unidades de α-D glicose, com ligações
α-1,4 entre as unidades (BULÉON et al., 1998). A amilopectina constitui 70 a 80% do amido do
grânulo, formado por cadeias grandes e ramificadas em conformação alfa-hélice, com ligações α-
1,4 entre as unidades acrescidas de ligações α-1,6 a cada 20 a 25 moléculas de glicose, formando
as ramificações (BULÉON et al., 1998). Grânulos de amido são formados por moléculas de
amilose e amilopectina, unidas por pontes de hidrogênio, resultando em uma estrutura organizada
(VAN SOEST, 1994), formados pela deposição de anéis de crescimento, que contém regiões
amorfas, compostas principalmente por amilose, e regiões cristalinas compostas principalmente
por amilopectina (NOCEK; TAMINGA, 1991). A organização dos grânulos de amido é muito
complicada e muito dependente da origem botânica da planta (BULÉON et al., 1998). A
digestibilidade do amido é, em geral, inversamente proporcional ao seu conteúdo de amilose
(ROONEY; PFLUGFELDER, 1986).
No Brasil, há predominância por produção de semente de milho com endosperma do tipo
flint, ou seja, endosperma duro, que permite maior resistência à pragas e à doenças. São resistentes
à quebra mecânica durante a colheita, secagem, transporte e armazenamento e também são menos
susceptíveis à colonização por fungos e ao ataque de insetos durante o armazenamento (KAMRA,
2005). O milho de textura macia ou farinácea, predominantes na América do Norte, tem maior
propensão à quebra mecânica, o que é desejável no processo de produção de silagem ou durante a
moagem na indústria (CORREA et al., 2002; GIUBERTI et al., 2013).
A textura do grão é determinada pelo cultivar, sendo uma avaliação visual da proporção
das regiões (vítria ou farinácea) do endosperma (RIBAS et al., 2007). A vitreosidade é uma forma
objetiva de mensurar a textura do endosperma, sendo uma medida que determina a proporção entre
o endosperma duro (vítreo) em relação ao endosperma total. A vitreosidade no estágio maduro de
maturação foi em média 72,3% para híbridos duro e em média 48,1% para híbridos de textura
macia, em trabalho realizado com grãos de diferentes híbridos de milho (PHILIPPEAU;
MICHALET-DOREAU, 1997). Já no que diz respeito ao sorgo, segundo Rooney; Pflugfelder,

25
(1986) este grão apresenta, de maneira geral, maior proporção do chamado endosperma periférico
(vítreo), região densa e resistente à penetração de água. Porém, em estudo mais recente, realizado
com 33 cultivares produzidos por empresas melhoradoras no Brasil, 81.8 % dos cultivares
apresentaram endosperma de textura média à média-macia, ou seja com 50% ou menos de
vitreosidade, obtido por avaliação visual (ANTUNES, 2007).
A vitreosidade do endosperma do grão pode ser obtida indiretamente pela mensuração da
densidade (CORREA et al., 2002), e por mensuração do teor de prolamina na semente
(HOLDING, 2014). Essas avaliações são vantajosas, pois permitem mensurar a vitreosidade em
grãos processados ou ensilados, pela prolamina (LOPES, 2016). Ou a densidade para o grão
inteiro, sendo uma forma vantajosa de obtenção indireta da vitreosidade pois demanda menos
tempo de trabalho manual (CORREA et al., 2002; DOMBRINK-KURTZMAN; BIETZ, 1993).
No endosperma vítreo, os grânulos de amido estão fortemente incrustados no arcabouço
protéico formado pela matriz protéica espessa e contínua, e pelos corpos protéicos (SULLINS;
ROONEY, 1975). No endosperma farináceo, a matriz protéica encontra-se presente na forma de
lâminas delgadas, é descontínua e está fracamente incrustada aos grânulos de amido, o que torna
o amido mais disponível ao ataque enzimático (SULLINS; ROONEY, 1975; SHULL et al., 1990).
Ao se considerar aspectos relacionados à nutrição animal, quanto menor a porção do
endosperma vítreo, maior é a digestibilidade do amido presente no grão, em contrapartida, quanto
maior a vitreosidade do grão, maior é a resposta ao processamento do grão (CORREA et al., 2002;
PHILIPPEAU; MICHALET-DOREAU, 1997).
2.1.3 Matriz proteica e prolaminas
Os grãos de milho apresentam em média 9-14% de proteína, sendo que 70-90% são
consideradas como proteínas de reserva. As proteínas do milho podem ser classificadas em
albuminas, que representam 3-5% da proteína total; globulinas, com 10-20% da proteína total;
glutelinas, representando aproximadamente 25% da proteína total; e as prolaminas, chamadas de
zeínas no milho, que representam aproximadamente 52% do conteúdo de proteína total no milho
(BOYER; HANNAH, 2001; LANRY et al., 2005).
As proteínas do grão de sorgo variam entre 7% a 15% no grão inteiro, sendo considerado
aproximadamente 82 % de proteína de reserva (WANISKA; ROONEY, 2000). Podem ser
26
divididas em globulinas, representando cerca de 10% das proteínas; as albuminas com cerca de
8% do total de proteínas; as glutelinas compõem cerca de 25% do da proteína; e as prolaminas,
chamadas de kafirinas no sorgo, compõem 57% do total de proteínas (NUNES et al., 2005;
WANISKA; ROONEY, 2000).
A matriz protéica é constituída por glutelinas, que são proteínas solúveis somente em
soluções alcalinas, já os corpos protéicos, os quais são constituídos por prolaminas, são solúveis
apenas em substâncias alcoólicas (butanol mais mercaptoetanol) (CHANDRASHEKAR;
MAZHART, 1999). Com relação às proteínas localizadas no gérmen, as albuminas são solúveis
em água e as globulinas em soluções salinas (BOYER; HANNAH, 2001).
Além das diferenças de tamanho e forma do grão, as principais diferenças entre sorgo e
milho se referem ao tipo e distribuição de proteínas que circundam o amido no endosperma
(CRUZ; NUCIO, 2002). As zeínas do milho compreendem quatro grupos estruturalmente
distintos: alfa, beta, gama e delta-zeínas, que podem ser separadas com base no padrão
eletroforético e no peso molecular (SHEWRY; HALFORD, 2002). A nomenclatura proposta para
as kafirinas do sorgo é baseada nos padrões protéicos de polipeptídeos com peso molecular
semelhante ao grupo das zeínas em milho, em alfa, beta, gama-kafirinas (SILVA, 2015).
No milho, as alfas-zeínas começam a se acumular, como lóculos discretos, dentro de uma
matriz de gama e beta-zeínas, nos corpos protéicos. Ocasionalmente, os lóculos de alfa-zeínas
fundem-se e preenchem o centro do corpo protéico (LENDING; LARKINS, 1989). Beta e gama-
zeínas formam uma camada mais ou menos contínua na periferia, mas, manchas pequenas de beta
e gama-zeínas permanecem no interior. As delta-zeínas são encontradas, principalmente, no centro
dos corpos protéicos, junto com as alfa-zeínas (ESEN; STELLER, 1992). Os polipeptídeos das
diferentes classes de zeínas variam, em tamanho, de 10 kDa a 27 kDa. As alfa-zeínas possuem
pesos moleculares de 19 e 22 kDa, correspondendo à aproximadamente 70% da fração total de
zeínas (LOPES, 1993; SHOTWELL; LARKINS, 1989). As beta-zeínas são proteínas de 14kDa e
correspondem à aproximadamente 15% da fração de zeína (PEDERSEN et al., 1986). As gama-
zeínas apresentam peso molecular de 16 e 27 kDa, correspondendo à 20% das zeínas totais,
podendo chegar até a 50% (KIRIHARA ET AL., 1988; ORTEGA; BATES, 1983). A delta-zeína,
possui 10 kDa e é uma proteína pequena que apresenta 130 aminoácidos de comprimento
(KIRIHARA et al, 1988).
27
No sorgo as alfas-kafirina tem uma localização central no corpo da proteína e é envolvida
por beta e gama-kafirina, encontrado ao redor da proteína. Esse arranjo estrutural da kafirina afeta
a sua digestibilidade (WONG et al., 2010). As kafirinas podem formar polímeros que se ligam à
pontes de dissulfeto, componentes estruturais de proteínas, fortalecendo e diminuindo a
digestibilidade das proteínas (DUODU et al., 2002). Apesar de solúvel em água, a gama-kafirina
não se solubiliza em estado nativo (no grão), exatamente pela polimerização entre as cadeias
polipeptídicas (BELTON et al., 2006). As alfas-kafirinas, compõe cerca de 65-85% do total
kafirinas e possuem peso molecular de 23 KDa (WATTERSON et al.,1993; WONG et al., 2010).
A beta-kafirina possui peso molecular de 20 KDa e corresponde de 7 a 8 % do total de kafirina
(RODRIGUES et al., 2009; WATTERSON et al.,1993). A gama-kafirina possui peso molecular
de 28 KDa e corresponde de 9 a 12% das kafirinas (RODRIGUES et al., 2009; WATTERSON et
al.,1993).
As prolaminas estão localizadas principalmente no endosperma, possuem grande
quantidade de prolina e aminas, tendo como principal função fornecer nitrogênio durante o
desenvolvimento inicial da planta (HERMAN; LARKINS, 1999). A prolina é a responsável pela
característica hidrofóbica das prolaminas, tornando-a não solúvel em água e formando uma
barreira hidrofóbica que envolve os grânulos de amido. A adesão microbiana aos grânulos de
amido ocorre com maior facilidade no endosperma farináceo, que possui menos prolamina
(MCALLISTER et al., 1990). O teor de prolamina na semente aumenta com a maturidade da planta
e é maior em híbridos com endosperma de alta vitreosidade (HOLDING, 2014). Simpson (2001)
sugere que a acidificação do endosperma torna as prolaminas mais susceptíveis à clivagem, pois
as prolaminas são solúveis em ácido lático e acético (LAWTON, 2002). Essa clivagem pode ser
facilitada e estimulada pela ensilagem.
2.1.4 Processamento e tamanho de partícula
O termo processamento de grãos se refere à métodos de preparação destes para serem
utilizados na alimentação animal. A moagem grosseira, a quebra ou a laminação do grão são
formas menos intensas de processamento; enquanto que a floculação, a extrusão e a reconstituição
são métodos mais intensos (CRUZ; NUCIO, 2002). A moagem é mundialmente usada visando

28
aumentar a digestibilidade do amido, por ser relativamente barata, comparado com outros
processos, podendo ser realizada na própria fazenda (LOPES, 2016).
Considera-se o milho moído mais fino possível, como tamanho ótimo de partícula para
maior digestibilidade (HOFFMAN; SHAVER, 2011). A redução do tamanho de partícula resulta
em aumento da área de superfície, aumentando assim a área disponível para a adesão dos
microrganismos ruminais nos grânulos de amido e para a digestão enzimática (McALLISTER et
al., 1993). O pericarpo é a camada externa com função de proteção do grão de milho, e a adesão
de microrganismos ruminais ao pericarpo é mínima comparada ao endosperma (MCALLISTER
et al., 1990). Com o processo de moagem o pericarpo é quebrado, tornando o endosperma acessível
aos microrganismos.
Um dos efeitos do processamento de grãos é a mudança no sítio de digestão de amido do
intestino delgado para o rúmen, com concomitante aumento nas porcentagens degradadas em
ambos compartimentos. A digestão do amido ocorrendo preferencialmente no rúmen resulta em
em maior produção de ácidos graxos voláteis e proteína microbiana para o animal, além do amido
que chega ao intestino ter maior digestibilidade quando o grão é processado. O resultado final é
maior suprimento de energia e proteína metabolizável para o animal e portanto, melhor
desempenho (Huntington, 1997). Devido à sua menor digestibilidade, o sorgo é o grão mais
responsivo aos métodos de processamento, fazendo com que ocorram aumentos significativos em
seu valor alimentar e resposta em desempenho animal (CRUZ; NUCIO, 2002). A moagem,
reidratação e ensilagem são formas de processamento, que associadas podem aumentar a
digestibilidade do amido (CASTRO, 2017).
2.2 Ensilagem de grãos reidratados
A ensilagem é uma prática de conservação de alimentos que consiste na fermentação dos
açúcares solúveis por bactérias do ácido lático (BAL) (MUCK et al., 2010), levando à rápida
redução do pH (McDONALD, 1991) e consequentemente, a inibição do desenvolvimento de
microrganismos indesejados (HENDERSON, 1993). A ensilagem de grãos como milho e sorgo,
tornou-se uma prática comum em diversas propriedades brasileiras, em busca da melhoria da
digestibilidade do amido e facilidade da estocagem (GOBETTI et al., 2013), possibilitando melhor

29
utilização do milho brasileiro, que possui endosperma duro de alta vitreosidade e baixa
digestibilidade para bovinos (CORREA et al., 2002).
A silagem de grão reidratado consiste, basicamente, na hidratação do grão maduro moído,
o que propicia sua fermentação e armazenamento como silagem (PEREIRA et al., 2013). O grão
é colhido em estágio de maturação maduro (10-14% de umidade), é reidratado simultaneamente à
moagem, com água para que atinja umidade entre 30 e 40% da matéria natural, ideal para a
fermentação de grãos (GOBETTI et al., 2013), e a ensilagem é realizada. Esse processamento
permite colher o grão com uma janela de colheita maior que a silagem de grão úmido, mais
comumente utilizado. O grão não precisa ser cultivado na propriedade, podendo ser adquirido em
época de safra, quando o valor do grão no mercado é baixo (LOPES, 2016). Dispensa a necessidade
de grandes investimentos em silos para secagem e armazenamento de grãos secos e o milho pode
ser armazenado na propriedade (FERNANDES, 2014). Possui como principal vantagem o ganho
em digestibilidade do amido, pois durante a ensilagem ocorre a quebra das prolaminas por ação
das enzimas microbianas (HOFFMAN et al., 2011), o que é capaz de aumentar a proporção da
degradação que ocorre no rúmen (BITENCOURT, 2012).
A silagem de milho reidratado é uma forma de contrapor o efeito negativo da textura dura
do endosperma sobre a digestibilidade do amido em grãos no estágio maduro de maturação. Os
processamentos usados nos grãos ricos em amido normalmente visam aumentar a degradação
ruminal desse nutriente (HALE, 1973). A magnitude da alteração promovida pelo processamento
é inversamente proporcional à digestibilidade do grão não processado. Sendo assim, o efeito da
ensilagem do milho maduro reidratado é mais pronunciado no milho com endosperma duro quando
comparado ao milho com endosperma farináceo (ANDRADE FILHO et al., 2010), assim como o
grão que mais responde ao processamento é o de sorgo, seguido pelo de milho e demais cereais,
que tem alta degradação na forma não processada (THEURER, 1986).
2.2.1 Perfil fermentativo
O processo de fermentação da silagem é complexo, sendo considerado como uma
metabiose, ou seja, envolve o desenvolvimento simultâneo e sucessivo de microrganismos de
diversos gêneros e espécies que dependem principalmente do pH, do potencial de oxirredução e
do tipo e quantidade de substratos presentes no material ensilado (PEREIRA; SANTOS, 2006). O

30
processo de ensilagem está baseado em princípios básicos de conservação, são eles: baixo pH e
anaerobiose (JOBIM; NUSSIO, 2013). A velocidade com que esses princípios são alcançados é
determinante para garantir o bom armazenamento dos grãos.
A condição de anaerobiose é dependente de diferentes processos. Sendo otimizada a partir
de estratégias tecnológicas no momento do abastecimento, compactação e vedação do silo. Os
processos metabólicos, tanto da forragem que está sendo armazenada, por meio da respiração e
atuação de enzimas da própria planta, assim como de microrganismos presentes no material
ensilado, que consomem o oxigênio retido entre as partículas na fase inicial de ensilagem também
irão contribuir na anaerobiose da silagem (BERNARDES; WEINBERG, 2013; JOBIM; NUSSIO,
2013).
A rápida redução do pH é dependente de características da planta, como capacidade tampão
e carboidratos solúveis disponíveis. Além disso, a população de microrganismos presentes no
material no momento da ensilagem, sejam eles epifíticos ou introduzidos com o uso de inoculantes,
irá consumir os carboidratos solúveis, produzindo ácidos orgânicos, responsáveis pela redução do
pH (JOBIM; NUSSIO, 2013). Na silagem de milho maduro reidratado sem o uso de inoculante o
tempo de consumo dos carboidratos solúveis pode variar, sendo de 5 dias para milho moído em
crivo de 3 mm (CARVALHO et al., 2016) e 21 dias para milho moído em crivo 12 mm
(FERNANDES, 2014). Já a redução no pH ocorreu de forma mais lenta atingindo pH 4,68 entre
15 e 30 dias e pH próximo a 4,2 após 210 dias de ensilagem, para milho moído a 3 mm,
(CARVALHO et al., 2016), e pH próximo a 5, com 21 dias de ensilagem, em milho moído em
crivo 12 mm, permanecendo com pH acima de 4,5 até 120 dias (FERNANDES, 2014).
Em silagens inoculadas com bactérias do ácido lático a redução do pH foi mais
significativa, reduzindo para pH próximo a 3.7 em 247 dias, para milho moído em crivo de 3 e 9
mm (CASTRO, 2017). Em silagens inoculadas com Lactobacillus plantarum e Pediococcus
acidilactici o pH ficou próximo a 4, para silagens inoculadas com L. buchneri o pH ficou próximo
a 4,5, com 124 dias de ensilagem (Silva et al., 2018).
Os principais ácidos produzidos durante o processo de ensilagem são lático, acético,
propiônico e butírico (KUNG; SHAVER, 2001). Além destes, existem vários ácidos que são
produzidos durante o processo de fermentação, como isobutírico, valérico, isovalérico, succínico
e fórmico málico (McDONALD et al., 1991). Na silagem de milho reidratado o aumento do ácido
lático ocorreu à partir do dia 15 até dia 90 de ensilagem e o aumento no ácido propiônico ocorreu
31
após 60 dias de ensilagem, enquanto que alterações nos ácidos málico e succínico foram
observadas após 90 dias de ensilagem, e os ácidos isobutírico, butírico e isovalérico ficaram abaixo
dos níveis detectáveis (CARVALHO et al., 2016). Dentre os ácidos orgânicos formados durante a
fermentação no processo de ensilagem, o ácido lático pode gerar menor perda de matéria seca
(MS), pois sua produção é energeticamente mais eficiente e tem maior potencial em reduzir o pH
(ROOKE; HATFIELD, 2003). Desta forma o uso de inoculantes à base de bactérias
homofermentativas para a silagem de milho reidratado pode ser mais interessante.
A quebra das prolaminas durante o processo de ensilagem, resulta em aumento na
concentração de amônia ao longo da ensilagem. Esse processo foi observado por Carvalho et al.,
(2016) com aumento de 2,2 unidades percentuais em silagens com 280 dias e por Fernandes (2014)
com aumento de 2,5 unidades percentuais com 120 dias de ensilagem. Quando a silagem de milho
reidratado foi avaliada em períodos curtos esse aumento no teor de amônia não foi tão evidenciado
Ferraretto et al. (2018) observaram aumento de 0,09 % no teor de amônia, de silagens ensiladas
por 28 dias. Silva et al. (2018) observaram aumento na concentração de NH3 e degradação ruminal
de silagem de milho reidratado e inoculado com L. buchneri, mas não observaram esta variação
em silagens inoculadas com uma combinação de L. plantarum e P. acidilactici, indicando que o
tipo de microrganismo adicionado na silagem pode modificar a intensidade da proteólise.
2.2.2 Microbiologia da silagem
Diferentes microrganismos estão presentes no processo de ensilagem, sendo que alguns são
considerados benéficos ao processamento, como as bactérias ácido láticas (BAL) que são os
principais responsáveis pela rápida queda no pH. Mas outros microrganismos considerados
indesejados estão presentes no material ensilado, como bactérias da família Enterobactericea e
gênero Clostridium, e também fungos filamentosos e leveduras, os quais se não forem controlados
durante a fermentação, podem trazer consequências negativas para a qualidade da silagem
(PAHLOW et al., 2003). Caracterizar a microbiota da silagem pode auxiliar na compreensão da
fermentação da silagem, possibilitando a intervenção do processo de fermentação e melhora da
qualidade da silagem (CARVALHO et al., 2016).
Há poucos relatos da população de microrganismos presentes na silagem de grãos
reidratados. Carvalho et al. (2016) estudaram a microbiologia da silagem de grão de milho
32
reidratado do 0 aos 280 dias de ensilagem. As espécies de bactérias do ácido lático, Enterococcus
casseliflavus e Pediococcus pentosaceus foram as únicas bactérias láticas identificadas antes da
ensilagem e apenas o P. pentosaceus manteve-se na silagem até os 30 dias de fermentação.
Enterococcus casseliflavus, Enterococcus faecium, Enterococcus gilvus, Lactococcus lactis,
Leuconostoc mesenteroides e Leuconostoc pseudomesenteroides estavam presentes na silagem
entre 5 e 15 dias de ensilagem. Lactobacillus plantarum foi detectado esporadicamente nos dias 5,
15, 60 e 280 de ensilagem, com população máxima de 6.48 log de UFC por g, aos 60 dias.
Weissella cibaria e Weissella paramesenteroides foram identificadas com 5 e 15 dias de
fermentação. Lactobacillus paracasei estava presente entre 30 e 150 dias de fermentação,
apresentando redução na população (7,71 para 5,70 log de UFC), neste período. Lactobacillus
rhamnosus e Lactobacillus buchneri foram identificados aos 60 dias de fermentação. Ainda esses
autores identificaram as seguintes leveduras Issatchenkia orientalis (sinônimo de Pichia
kudriavzevii e Candida krusei), Meyerozyma guilliermondii (previamente identificada como
Pichia guilliermondii), Wickerhamomyces anomalus (sinônimo de Pichia anomala e Hansenula
anomala) e Hyphopichia burtonii (sinônimo de C. chodatii).
A identificação de microrganismos provenientes da silagem tem evoluído ao longo do tempo,
passado por técnicas de identificação por características morfológicas e bioquímicas, nas quais era
necessária a utilização de chaves de identificação (ROGOSA, 1970) Posteriormente, com o
desenvolvimento de técnicas de extração, amplificação e sequenciamento do ácido
desoxirribonucleico (DNA), foi possível a identificação pela sequência gênica dos
microrganismos. A maioria destas técnicas utiliza a reação da cadeia polimerase (PCR) para fazer
muitas cópias de uma porção do DNA dos microrganismos (MUCK, 2013). O primer de
amplificação é desenvolvido para uma fração altamente conservada da região 16S do RNA
ribossomal, que é a base para a identificação das bactérias, já outras porções da região 16S são
variáveis entre as espécies, permitindo a classificação (MUCK, 2013). O uso da espectrometria de
massa por tempo de dispersão / ionização assistida por matriz (MALDI-TOF MS) é um novo
método de identificação de microrganismos baseado no perfil de proteínas da célula, utilizado por
Carvalho et al. (2016), para identificação de microrganismos presentes na silagem. Quando
compara o método MALDI-TOF ao método fenotípico e ao sequenciamento do DNA, constata-se
o MALDI-TOF como uma técnica mais rápida, requerendo menor volume de amostra e menor
custo de reagentes (DEC et al., 2014).
33
2.2.2.1 Bactérias do ácido lático
As bactérias do ácido lático (BAL) são assim classificadas em função do seu metabolismo,
em razão da capacidade de produzir ácido lático como principal produto do seu metabolismo. Seis
gêneros deste grupo de bactérias estão normalmente presentes no processo de ensilagem, sendo
eles: Latobacillus, Pediococcus, Leuconostoc, Enterococcus, Lactoccocus e Streptococcus
(KUNG JUNIOR, 2009). Ainda em função do metabolismo, as BAL podem ser classificadas em
três grupos: as homofermentativas, que produzem somente ácido lático à partir da fermentação de
hexoses, pela via glicolítica e não são capazes de utilizar pentoses via pentose fosfato;
heterofermentativas facultativas que são normalmente classificadas como homofermentativas pois
usam a mesma via glicolítica para a fermentação de glicose, mas fermentam pentoses em
determinadas condições, produzindo etanol para manter o balanço redox via pentose fosfato e há
ainda as heterofermentativas obrigatórias, que não utilizam a via glicolítica para metabolizar
hexoses e sim a via fosfoquetolase, fermentam diferentes açucares e produzem principalmente
lactato, etanol, CO2, adenosina trifosfato (ATP) e água a partir da glicose, e lactato, acetato, 2-
manitol, CO2, ATP e água a partir da frutose pela via das pentoses fosfato (MADIGAN et al.,
2014; PAHLOW et al., 2003). O uso de BAL no processo de silagem tem efetividade para acelerar
a fermentação, com produção elevada de ácido láctico e redução do pH, reduzindo o metabolismo
de microrganismos indesejados e melhorando o desempenho dos animais (BARNES et al., 2007).
Como visto anteriormente, o sequenciamento da região 16S é comumente utilizado para
identificação de BAL (MUCK, 2013). Porém algumas espécies de BAL apresentam a sequência
de genes da região 16S semelhante, resultando em identificação com mais de 99% de similaridade
para mais de uma espécie. Desta forma, a associação de mais de uma técnica de identificação pode
ser necessária para correta identificação de algumas espécies. Por exemplo, P. pentosaceus e P.
acidilactici são proximamente relacionados quanto à base genética, mas as bactérias P.
pentosaceus não crescem à 50°C, enquanto que P. acidilactici tem habilidade de crescer à 50°C
(TANASUPAWAT; KOZAKI; KOMAGATA, 1993). Outras BAL que não são diferenciadas em
função do sequenciamento de genes são Lactobacillus pentosus, L. paraplantarum e L. plantarum.
Porém, L. pentosus pode ser diferenciado pela inabilidade em produzir ácido à partir da melezitose
(CURKE; HUBERT; BRINGEL, 1996), enquanto que o L. plantarum pode ser distinto pela

34
habilidade de produzir ácido à partir do dulcitol (BRINGEL; QUENEE; TAILLIEZ, 2001). L.
buchneri e L. brevis são geneticamente relacionados, porém L. buchneri tem a habilidade de
fermentar melezitose (ROGOSA et al., 1970).
2.2.2.2 Bactérias formadoras de esporos
As bactérias formadoras de esporos envolvem diferentes gêneros de microrganismos e em
geral são considerados indesejáveis para o processo de ensilagem (ADESOGAN; QUEIROZ,
2009).
São bactérias Gram positivas, anaeróbicas facultativas, formadoras de esporos, que são
resistentes à altas temperaturas, podendo sobreviver ao processo de pasteurização do leite
(PAHLOW et al., 2003). Logo, a presença destes microrganismos na silagem de vacas leiteiras,
por exemplo, torna-se um entrave para a sanidade da produção de leite, já que em condições de
contaminação deste produto, estes microrganismos, em especial o Bacillus cereus, podem produzir
toxinas que são prejudiciais para a saúde humana, além de reduzir o tempo de prateleira de
derivados lácteos (PAHLOW et al., 2003).
No processo de ensilagem Pahlow et al. (2003) sugerem que os Bacillus sejam os primeiros
a se desenvolver após as leveduras consumirem o lactato, iniciando o processo de degradação. As
principais espécies já registradas em silagens são B. cereus, B. lentus, B. firmus, B. sphaericus, B.
licheniformis e B. polymyxa (GIFFEL et al., 2002). Paenibacillus macerans e Bacillus megaterium
são espécies de formadores de esporos recentemente identificadas em silagens (MUCK, 2013).
Assim como ocorre com as BAL, os Bacillus também apresentam grupos que não podem ser
distintos pelo sequenciamento da região 16S. Desta forma a utilização de testes bioquímicos pode
auxiliar na correta identificação. Bacillus atrophaeus, B. mojavensis, B. subtilis e B. vallismortis
não podem ser diferenciados pela região do 16S (ROBERTS et al., 1996), mas podem ser
diferenciados pelo teste de produção de ácido à partir do sorbitol, melibiose e amido (RUIZ-
GARCIA et al., 2005). B. sonorensis e B. licheniformis são proximamente relacionados com base
na região 16S, porém podem ser diferenciados pela incapacidade que o B. sonorensis apresenta
em crescer no meio contendo 5, 7 ou 10% de NaCl (PALMISANO et al., 2001). B. safensis, B.
pumilus, B. aerophilus, B. altitudinis e B. stratosphericus são geneticamente próximos, mas podem
ser diferenciados pelos testes de utilização de citrato, utilização de D-sorbitol e melibiose como

35
fonte de carbono (SATOMI at al., 2006; SHIVAJI et al., 2006). Para a diferenciação do grupo
Bacillus cereus é necessário avaliação da composição de ácidos graxos da bactéria (NAKAMURA,
1998).
Os formadores de esporos do gênero Lysinobacillus também necessitam da combinação de
testes fenotípicos para a identificação. Lysinobacillus boronitolerans, L. fusiformis e L. sphaericus
necessitam dos testes de crescimento em NaCl a 7% e hidrolise da ureia para serem diferenciados
(AHMED et al., 2007).
2.2.3 Aumento da degradação ruminal do amido e matéria seca
A digestão de carboidratos fibrosos e não fibrosos no rúmen e a digestão de carboidratos
não fibrosos nos intestinos é a principal fonte de energia em dietas para ruminantes. Um dos
principais nutrientes em dietas de vacas leiteiras de alta produção é o amido proveniente do milho,
e o seu processamento tem grande impacto sobre a degradação ruminal, por reduzir a interação
entre a matriz proteica e os grânulos de amido (FERRARETTO; CRUMP; SHAVER, 2013;
FIRKINS et al, 2001). Durante a ensilagem ocorre a quebra das prolaminas por ação das enzimas
microbianas possibilitando maior degradação ruminal do amido (HOFFMAN et al., 2011). No
processo de ensilagem do grão úmido, ocorre hidratação da matriz protéica, perda de organização
e rompimento de células do endosperma, promovendo rompimento parcial da matriz protéica
(SULLINS; ROONEY, 1971).
Carvalho et al. (2016) observaram aumento na digestibilidade in vitro da MS do milho
reidratado, com 7 h de incubação, a partir de 30 até 180 dias de ensilagem, e com 3 h de incubação
após 90 dias de ensilagem. Lopes (2016) observou aumento na digestibilidade in vitro da MS do
milho reidratado, dos 30 para 90 dias de fermentação, sem diferença entre 90 e 120 dias, quando
as amostras foram incubadas por 7 e 18 h. Castro (2017) observou maior degradação da MS em
amostras de milho reidratado e ensilado por 247 dias em comparação ao milho seco moído,
aumentando 39,6 unidades percentuais na fração A, e aumento de 60,5; 57,7; 44,2; 19,5 unidades
percentuais nos tempos 3, 6, 18 e 48 h de incubação, para o milho ensilado em comparação ao
milho seco. Esses resultados demonstraram que o efeito da ensilagem do grão reidratado é mais
pronunciado nas primeiras horas de incubação ruminal e é necessária a fermentação da silagem
por longos períodos para alterar a degradabilidade ruminal.
36
Fernandes (2014) avaliando a degradabilidade ruminal do amido com 12 e 24 h de
incubação observou que com o aumento dos dias de ensilagem houve aumento na degradação do
amido, sendo que as maiores alterações na degradação do amido ocorreram entre 0 e 21 dias de
ensilagem. Arcari et al. (2016) demostraram aumento constante na fração A e na degradação
efetiva do amido ao longo do tempo de fermentação (3 a 330 dias).
Em trabalho avaliando a ensilagem de sorgo reidratado, Huck; Kreikemeier; Bolsen, (1999)
observaram aumento da NH3 ao longo da fermentação, indicando que ocorreu hidrólise da
proteína, e um possível aumento na digestibilidade deste material. Estes autores recomendam a
reidratação do sorgo para que atinja pelo menos 35% de umidade. Silva et al., (2014) observaram
aumento de 4 unidades percentuais na degradabilidade efetiva para o sorgo reidratado (40% de
umidade) e ensilado por 30 dias, em relação ao sorgo seco. Igarasi et al. (2008) obtiveram
resultados de desempenho de bovinos jovens, em confinamento, semelhantes entre o sorgo e o
milho reidratado, indicando que a ensilagem do sorgo reidratado pode equiparar à degradação do
amido do sorgo ao milho, quando ambos são reidratados ensilados.
Tem sido demonstrado que as ensilagens de milho ou sorgo reidratado resultam em
melhoras na digestibilidade do amido, porém os maiores ganhos ocorrem com longos períodos de
ensilagem (CARVALHO et al., 2016), o que nem sempre é possível nas propriedades. Entretanto,
o uso de enzimas como aditivo no momento da ensilagem pode resultar em rápida disponibilização
do amido para a degradação (FERRARETTO et al., 2015) auxiliando na melhora da
digestibilidade, sem aumentar o período de ensilagem.
2.2.4 Utilização de enzimas
As enzimas são catalizadores biológicos altamente específicos. São proteínas produzidas
pelos organismos vivos que aceleram reações químicas de forma seletiva, reduzindo o gasto de
energia de ativação e o tempo da reação. Possuem especificidade e seletividade com relação às
substâncias com que interagem, sendo que a capacidade de reação é regulada pela quantidade de
substrato disponível, concentração de produto formado, além da interação com outros metabólitos
do meio (Ray; Rosell, 2017).
O sítio ativo é a fração da enzima onde o composto será conectado, antes de ser quebrado,
neste local há grupos químicos ionizáveis. Desta forma, o pH e a temperatura do meio podem
37
interferir na conformação do sítio de ligação, aumentando ou reduzindo a atividade catalítica.
Geralmente a máxima atividade catalítica é alcançada nas mesmas condições de ótimo crescimento
do microrganismo que produz a enzima. Em função disto uma mesma α-amilase pode degradar
com mais eficiência o amido proveniente de um tipo de grão, quando comparado a outra fonte de
amido (PLANCHOT et al., 1995).
A hidrólise do amido é uma reação heterogênea, envolvendo o substrato sólido (amido) e
a enzima em meio líquido. As enzimas iniciam a degradação do amido penetrando em poros do
grânulo e o processo de hidrólise ocorre no sentido radial, da periferia para o centro do grânulo,
formando novos canais, que resultam em aumento da área de superfície (ZHANG; DHITAL;
GIDLEY, 2013). Durante o processo de degradação do amido, as amilases (α 1-4 glicano
hidrolases) são as enzimas responsáveis pela digestão do amido. No processo digestivo, as ligações
α 1-4 glicosídicas são hidrolisadas pela α-amilase, dentro da molécula do amido, gerando maltoses
e dextrinas ramificadas e lineares. A β-amilase e glicoamilase atacam os resíduos de glicose
terminais, produzindo maltose e glicose, respectivamente. As amiloglicosidases hidrolisam as
dextrinas, produzindo glicose como processo final da digestão (MOREIRA, 1993).
A conformação do grânulo de amido nos cereais é uma barreira para a atividade enzimática
(ZHANG; DHITAL; GIDLEY, 2013), o processo de ensilagem pode facilitar a quebra das pontes
de hidrogênio entre amido e prolaminas, acelerando o processo de degradação por ação enzimática
e ou pela disponibilização do amido para ataque dos microrganismos ruminais. As amilases podem
disponibilizar substrato para o desenvolvimento de BAL por meio da hidrólise parcial do amido
(KUNG, 2014).
2.2.4.1 Amiloglicosidase
Amiloglicosidase tem nome sistemático de 4-α-D-glicano-glicohidrolase, e o nome
comum, de glicano-1,4-alfaglicohidrolase, mas também é conhecida como glicoamilase, γ-
amilase, lisossomal-α-glicosidase, maltase ácida, exo-1,4-α-glicosidase, glicose amilase. Na
comissão internacional IUBMB (International Union of Biochemistry and Molecular Biology)
recebe o código EC 3.2.1.3. É uma exo-enzima que libera unidades de glicose a partir da
extremidade não redutora da amilose, amilopectina e glicogênio (MANERA; MEINHARDT;
KALIL, 2011) e sua reação é de hidrólise das ligações (1-4) e (1-6) α-D-glicose, com liberação de
38
β-D-glicose. É a única enzima amilolítica com capacidade de hidrolisar ao mesmo tempo as
ligações α-1,4 e α-1,6 (PANDEY et al., 2000).
Os gêneros Aspergillus, Rhizopus e Endomyces são destacados como os principais gêneros
produtores de amiloglicosidase (SOCCOL et al., 2005). Aspergillus niger, A. fumigatus, A. saitri,
A. terreus, A. foetidus; Rhizopus foetidus e R. delemar, são espécies de fungos utilizados para a
produção de amiloglicosidase (PANDEY et al., 2005), destacando os fungos filamentosos
Aspergillus niger e Rhizopus sp. como principais produtores (SILVEIRA et al., 2006). A
amiloglicosidase obtida do cultivo de Aspergillus niger, tem temperatura ótima de ação de 40 à
50ºC e em solução com pH entre 4,8 a 5 (BRENDA, 2016). Mas de acordo com Gates (2010) a
amiloglicosidase produzida à partir de Aspergillus niger, tem temperatura ótima de ação de 60ºC
em solução com pH 4,8; enquanto que a a amiloglicosidase produzida à partir de Rhizopus sp. tem
temperatura ótima de ação de 55ºC em solução com pH 4,5.
Recentes estudos indicam que a amiloglicosidase não só se liga ao amido pelas
extremidades, mas também desestrutura as ligações helicoidais facilitando a hidrólise por outras
enzimas como a amilase (ZHANG; DHITAL; GIDLEY, 2013). Além disso, estes mesmos autores
relataram que em sistemas in vitro, α-amilase é inibida por oligossacarídeos e a amiloglicosidase
degrada esses compostos em glicose, reduzindo a inibição. Gutiérrez et al. (2005) avaliaram o
efeito da amiloglicosidase sobre a digestibilidade da MS do milho e do sorgo. A digestibilidade da
MS foi maior com adição da enzima na concentração 90 μl, com valores de 53,21% sem enzima e
76,33% da MS no milho com enzima, e 58,52% sem enzima e 81,11% da MS no sorgo com
enzima.
2.3 Degradação ruminal do amido
O interesse em melhorar a digestibilidade do amido consumido por vacas leiteiras foi
estimulado pelo elevado custo dos grãos de cereais. O aumento na digestibilidade do amido resulta
em maior rendimento de leite e de proteína, e melhora a eficiência alimentar (Firkins et al., 2001).
A digestibilidade do amido em todo trato digestivo de vacas leiteiras varia de 70 a 100% (Firkins
et al., 2001; Ferraretto et al., 2013) e é influenciado por vários fatores tais como o tamanho das
partículas, tratamento de cereais, método de armazenamento (Firkins et al., 2001; Ferraretto et al.,
2013), maturidade do milho à colheita, teor de umidade, duração da fermentação no silo (Hoffman

39
et al., 2011; Ferraretto e Shaver, 2012) e o tipo de endosperma do milho (Taylor e Allen., 2005;
Lopes et al., 2009). Entender como características dos alimentos podem afetar o local de digestão
ou a degradação do amido é essencial para a produção leiteira comercial, pois a manipulação da
degradação do amido pode alterar o consumo dos animais (Allen, 2000), e consequentemente a
produção de leite.
Já a degradação ruminal do amido pode variar de 50 a 90 % entre híbridos de milho
(MOHARRERY; LARSEN; WEISBJERG, 2014). Metabolizar o amido no rúmen é mais eficiente
para o ruminante, pois o amido que escapa do rúmen é digerido no intestino delgado e absorvido
como glicose, ou metabolizado anaerobicamente no intestino grosso à ácidos graxos voláteis
(AGV), ou perdido nas fezes. Os ruminantes apresentam inibição da secreção de amilase
pancreática quando um fluxo grande de amido passa para o intestino delgado, reduzindo a
capacidade de digestão do amido neste local (HARMON; YAMKA; ELAM, 2004). Quando
aumenta a quantidade de amido que escapa da digestão intestinal, ocorre fermentação de amido no
intestino grosso e a proteína microbiana produzida é perdida nas fezes. Entretanto o aumento da
degradação de amido no rúmen pode resultar em acúmulo de AGV no fluído ruminal, induzindo
baixo pH (acidose ruminal). Desta forma, torna-se importante otimizar a degradação ruminal de
amido, e através do conhecimento da cinética de degradação pode-se evitar distúrbios metabólicos
como a acidose. Diferentes técnicas têm sido propostas com o objetivo de avaliar a digestibilidade
ou degradabilidade dos alimentos: digestibilidade in vivo, in situ e in vitro.
2.3.1 Método de avaliação in situ
A técnica de degradabilidade in situ foi proposta por Mehrez e Orskov (1977) e consiste
no desaparecimento da amostra de alimento acondicionada em sacos (nylon ou material sintético),
incubados no rúmen por diferentes períodos de tempo, estimando de forma rápida e simples, a
degradabilidade ruminal. A precisão dos parâmetros obtidos por meio dessa técnica, está associada
às condições ótimas de temperatura, pH, tamponamento e substratos que a mesma oferece (ASSIS
et al., 1999).
O nylon tem sido utilizado como material padrão para confecção dos sacos utilizados na
técnica in situ (NOCEK, 1988). Esses devem ser resistentes a temperaturas elevadas, com
porosidade que permita o contato dos microrganismos no interior dos sacos propiciando a

40
degradação do alimento, remoção dos produtos finais da degradação, mas também devem
proporcionar redução das perdas de amostras não degradadas (VAN HELLEN; ELLIS, 1977),
simulando o que acontece no rúmen. De acordo com Vanzant et al. (1998) a variação na porosidade
de 40 a 60 µm é adequada para a avaliação in situ.
Estabelecer o tamanho de partícula do alimento a ser incubado é importante, mas
complicado, pois, a partícula deve ser similar àquela obtida pela mastigação do animal, sem
favorecer perdas de material não degradado. Diferentes tamanhos são recomendados na literatura,
sendo possível observar variações de 1,5 a 3,0 mm para concentrado e 1,5 a 5,0 mm para forragem
(CASALI et al., 2008; FORTALEZA et al., 2009; SILVA et al., 2007; VANZANT et al., 1998).
A moagem tem diferentes efeitos sobre a distribuição do tamanho de partícula de diferentes
alimentos, o que pode resultar em alterações na estimativa da degradabilidade (MICHALET-
DOREAU; CERNEAU, 1991). Já a quantidade de amostra incubada, deve fornecer resíduo
suficiente para que, após a degradação, seja possível a execução das análises químicas desejadas.
Sem desrespeitar a relação entre a quantidade de amostra e área útil do saco. A recomendação é
que esta relação seja inferior à 10mg/cm2, podendo ser aumentado o número ou tamanho de sacos,
caso o resíduo seja pequeno (VANZANT et al., 1998).
Existem dois métodos para estimar a incubação de sacos de nylon no rúmen. No primeiro,
os sacos de nylon são colocados no rúmen simultaneamente e recuperados em diferentes tempos.
Esse método é amplamente empregado nas pesquisas (EDMUNDS et al., 2012; PEYRAT et al.,
2014). No segundo, os sacos de nylon são inseridos no rúmen em diferentes tempos e retira-se
simultaneamente (JONKER et al., 2011; CAO et al., 2009). A aplicação de um ou outro método é
dependente de alguns fatores como: identificação adequada dos sacos que serão retirados a cada
tempo, para que esse processo ocorra da forma mais rápida possível; padronização dos métodos
de lavagem, para que não tenha variação entre um e outro horário de retirada dos sacos. Caso não
seja possível o controle destes fatores, recomenda-se a inserção em diferentes tempos e retirada
simultânea dos sacos (VANZANT et al., 1998).
2.3.2 Estimativa da taxa de degradação e tempos de incubação
A variável de maior influência nos procedimentos da técnica in situ é o tempo de incubação
ruminal. Com base nisso, tem-se discutido sobre o tempo de incubação que permita representar
41
melhor as frações degradáveis das amostras. Casali et al. (2008) sugeriram 240 horas de incubação
para obtenção de estimativas das frações indigestíveis e 264 horas para avaliação de FDAi.
Azevedo et al. (2012), em estudos com subprodutos, recomendam 72 horas de incubação para
predição de frações digestíveis de fibra em detergente neutro in vitro e in situ. Para a estimativa
das frações degradáveis da MS há muita variação entre os autores, Haese et al. (2017) utilizaram
cinco tempos de incubação variando de 2 a 24 horas de incubação, enquanto Lee et al. (2016)
utilizaram nove tempos de incubação variando de 0 a 48 horas. Entretanto, tempos mais longos
também foram utilizados por outros autores, tais como sete tempos de incubação ao longo de 3 a
336 horas (VISSER et al., 1996).
Os tempos de incubação são dependentes do substrato e características do alimento que se
pretende avaliar, existindo tempos críticos de incubação próximos a parte “mais sensível” da curva
de degradação (MICHALET-DOREAU; OULD-BAH, 1992). Para nutrientes de degradação mais
rápida, como por exemplo amido, tempos menores de incubação são requeridos. Dieho et al.
(2017) utilizaram seis tempos de incubação, variando de zero até 72 horas. Já Hristov et al. (2007)
utilizaram seis tempos de incubação variando de zero a 24 horas de incubação. Porém, a maioria
dos estudos que avaliou a degradação do amido utilizou como tempo máximo de degradação 48
horas de incubação ruminal, com seis tempos de degradação variando entre zero e 48 h (CORREA
et al., 2002; MALAN; RAFFRENATO, 2016; PHILIPEAU; MICHALET, 1998).
Os modelos utilizados para estimativa da taxa de degradação devem ser adequados ao
encaixe nos dados de degradação para descrever de forma adequada a biologia de degradação
(VANZANT et al., 1998). Cuidados com a adequação do modelo são necessários, pois pode-se
obter diferentes tamanhos de pool e/ou taxas de degradação diferentes para mesma curva de
degradação ao se aplicar diferentes modelos (VANZANT et al., 1998). Por exemplo, o uso do
‘‘Lag time’’ (tempo considerado entre a entrada do alimento no rúmen e início da degradação ou
passagem para o omaso) é necessário para a estimativa da degradação de forragens que possuem
um tempo de retenção no rúmen. Para alimentos concentrados, que estão aptos a passar para o
omaso, não há a necessidade de utilizar o ‘‘Lag time’’ no modelo (KLOPFENSTEIN et al., 2001).
Estratégias de modelagem simples podem oferecer alguns benefícios em relação à facilidade de
aplicação sem grandes prejuízos na exatidão ou precisão das estimativas (VANZANT et al., 1998).
O uso de um ou mais pools no modelo de degradação deve-se às características dos
nutrientes e alimentos, devendo-se adotar o modelo que descreva biologicamente o que acontece

42
na degradação. Para a degradação do amido alguns autores consideram apenas a presença de dois
pools, fração solúvel e potencialmente degradável, desconsiderando a existência da fração
indigestível (HERRERA-SALDANA; HUBER; POORE, 1990; HRISTOV et al., 2007).
2.4 REFERÊNCIAS
ADESOGAN, A.T.; QUEIROZ, O.C.M. Silage pathogenicity and implications for the
ruminant production chain. In: International Simposium on forage quality and conservation,
2009, São Pedro, Procedings…p.225-241, 2009.
AHMED, I.; YOKOTA, A.; YAMAZOE, A.; FUJIWARA, T. Proposal of Lysinibacillus
boronitolerans gen. nov. sp. nov., and transfer of Bacillus fusiformis to Lysinibacillus fusiformis
comb. nov. and Bacillus sphaericus to Lysinibacillus sphaericus comb. nov. International
Journal of Systematic and Evolutionary Microbiology. v.57, p.1117–1125, 2007.
ALLEN, M. S. Effects of diet on short-term regulation of feed intake by lactating dairy cattle.
Journal of Dairy Science, v. 83, p. 1598–1624, 2000.
ANDRADE FILHO, R. et al. Degradabilidade ruminal in situ de grãos de milho maduros do tipo
flint ou dentado, secos ou reconstituídos e ensilados. In: REUNIÃO ANUAL DA SOCIEDADE
BRASILEIRA DE ZOOTECNIA, 47, 2010, Salvador, BA. Anais..., 2010.
ANTUNES, R. C.; RODRIGUEZ, N. M.; GONÇALVES, L. C.; RODRIGUES, J. A. S.;
BORGES, I.; BORGES, A. L. C. C.; SALIBA, E. O. S. Composição bromatológica e parâmetros
físicos de grãos de sorgo com diferentes texturas do endosperma. Arq. Bras. Med. Vet. Zootec.,
v.59, n.5, p.1351-1354, 2007.
ARCARI, M. A.; MARTINS, C. M. M. R.; TOMAZI, T.; SANTOS, M. V. Effect of the ensiling
time of hydrated ground corn on silage composition and in situ starch degradability. Braz. J. Vet.
Res. Anim. Sci., São Paulo, v. 53, n. 1, p. 60-71, 2016.
ASSIS, M.A.; SANTOS, G.T.; CECATO, U. et al. Degradabilidade in situ de gramíneas do gênero
Cynodon submetidas ou não a adubação nitrogenada. Acta Scientiarum, v.21, n.3, p.657- 663,
1999.
BARNES, R.F.; NELSON, J.C.; MOORE K.J.; COLLIN., M. Forages: The Science of Grassland
Agriculture. 6th Edn., Wiley, p.791, 2007.
BELTON, P. S.; DELGADILLO, I.; HALFORD, N. G.; SHEWRY, P. R.; Kafirin structure and
functionality. J. Cereal Sci. v. 44, pp. 272-286, 2006.

43
BERNANRDES, T. F.; WEINBERG, Z. Aspectos associados ao manejo da ensilagem. In. REIS,
R. A.; BERNARDES, T. F.; SIQUEIRA, G. R. Forragicultura: ciência, tecnologia e gestão de
recursos forrageiros. Jaboticabal: Maria de Lourdes Brandel – ME, 671-680, 2013.
BITENCOURT, L.L. Respostas de vacas leiteiras à substituição de milho moído por milho
rehidratado e ensilado ou melaço de soja. Lavras: Federal University of Lavras. 2012.
BOYER, C. D.; HANNAH, L. C. Kernel mutants of corn. In: HALLAUER, A. (Ed.). Specialty
corns. 2. ed. Boca Raton, FL: CRC, 2001. p. 1-32.
BRENDA. The comprehensive Enzyme Informatio System, 2016. Disponível em:
<http://www.brenda-enzymes.org>
BRINGEL, F.; QUÉNÉE, P.; TAILLIEZ, P. Polyphasic Investigation of the Diversity within
Lactobacillus plantarum Related Strains Revealed Two L. plantarum subgroups. System. Appl.
Microbiol. v.24, p.561–571, 2001.
BULÉON, A.; COLONNA, P.; PLANCHOT, V.; BALL, S. Starch granules: structure and
biosynthesis. International Journal of Biological Macromolecules, v.23, p.85-112, 1998.
CAO, Z.J.; ANDERSON, J.L.; KALSCHEUR, K.F. Ruminal degradation and intestinal
digestibility of dried or wet distillers grains with increasing concentrations of condensed distillers
solubles. J. Ani. Sci., v. 87, p. 3013–3019, 2009.
CARVALHO, B. F., C. L. S. AVILA, T. F. BERNARDES, M. N. PEREIRA, C. SANTOS, AND
R. F. SCHWAN. Fermentation profile and identification of lactic acid bacteria and yeasts of
rehydrated corn kernel silage. J. Appl. Microbiol. 122: 589-600. 2016.
CASTRO, L. P. Lactation performance of dairy cows fed rehydrated and ensiled corn grain
differing in particle size and inclusion in the diet. Dissertação (Mestrado), Universidade Federal
de Lavras, 2017, 71p.
CASALI, A.O.; DETMANN, E.; VALADARES FILHO, S.C. et al. Influência do tempo de
incubação e do tamanho de partículas sobre os teores de compostos indigestíveis em alimentos e
fezes bovinas obtidos por procedimentos in situ. R. Bras. Zootec., v.37, n.2, p.335-342, 2008.
CHANDRASHEKAR, A.; MAZHAR, H. The biochemical basis and implications of grain
strength in sorghum and maize. J. Cereal Sci., v.30, p.193-207, 1999.
CORREA, C. E. S.; SHAVER, R. D.; Pereira, M.N.; Lauer, J.G.; Kohn, K. Relationship between
corn vitreousness and ruminal in situ starch degradability. Journal of Dairy Science, v. 85, p.
3008– 3012, 2002.
CRUZ, G. M.; NUCCIO, C. M. B. Sorgo na alimentação de bovinos. II Simpósio sobre
Ingredientes na Alimentação Animal CBNA - Uberlândia, MG. 2002.

44
CURK, M. C.; HUBERT, J. C.; BRINGEL, F. Lactobacillus paraplantarum sp. nov., a New
Species Related to Lactobacillus plantarum. International Journal of Systematic Bacteriology.
v.46, n.2, p.595-598, 1996.
DEC, M.; URBAN-CHMIEL, R.; GNAT, S.; PUCHALSKI, A.; WERNICKI, A. Identification of
Lactobacillus strains of goose origin using MALDI-TOF mass spectrometry and 16S-23S rDNA
intergenic spacer PCR analysis. Res Microbiol. v.165, p.190–201, 2014.
DIEHO, K.; VAN DEN BOGERT, B.; HENDERSON, G.; BANNINK, A.; RAMIRO-GARCIA,
J.; SMIDT, H.; DIJKSTRA, J. Changes in rumen microbiota composition and in situ degradation
kinetics during the dry period and early lactation as affected by rate of increase of concentrate
allowance. Journal of Dairy Science. v.100 n.4, p. 2695–2710, 2017.
DOMBRINK-KURTZMAN, M. A.; BIETZ, J. A. Zein composition in hard and soft endosperm
of maize. Cereal Chemistry, v. 70, p. 105–108, 1993.
DUODU, K. G.; NUNES, A.; DELGADILLO, I.; PARKER, M. L.; MILLS, E. N. C.; BELTON,
P. S.; TAYLOR, J. R. N. Effect of grain structure and cooking on sorghum and maize in vitro
protein digestibility. Journal of Cereal Science, v. 35, p. 161–174, 2002.
ECKHOFF, S. R.; PAULSEN, M. R. Maize. In HENRY, R. J. KETTLEWELL, P. S. (Ed.). Cereal
grain quality. London:Chapman & Hall, v.3, p. 77-89, 1996.
EDMUNDS, B.; SÜDEKUM, K.H.; SPIEKERS, H. et al. Estimating ruminal crude protein
degradation of forages using in situ and in vitro techniques. Ani. Feed Sci. Tech., n. 175, p. 95–
105, 2012.
ESEN, A.; STETLER, D. A. Immunocytochemical localization if delta-zein in the protein bodies
of maize endosperm cells. American Journal of Botany, Columbus, v. 79, n. 3, p. 243-248, Mar.
1992.
FERNANDES, J. Influência de genótipo, maturidade e tempo de armazenamento na
qualidade de silagens de grão de milho com alta umidade. Dissertação(Mestrado), Escola
Superior de Agricutura “Luiz de Queiroz”. Piracicaba, 97p, 2014.
FERRARETTO, L.F., CRUMP, P.M.; SHAVER, R.D. Effect of cereal grain type and corn grain
harvesting and processing methods on intake, digestion, and milk production by dairy cows
through a meta-analysis. Journal of Dairy Science, v. 96, p. 533-540. 2013.
FERRARETTO, L. F.; FREDIN, S. M.; SHAVER, R. D. Influence of ensiling, exogenous protease
addition and bacterial inoculation on fermentation profile, nitrogen fractions and ruminal in vitro
starch digestibility in rehydrated and high-moisture corn. Journal of Dairy Science. v.98, p.7318-
7327, 2015.
FERRARETTO, L. F.; SILVA FILHO, W. I.; FERNANDES, T.; KIM, D. H.; SULTANA, H.
Effect of ensiling time on fermentation profile and ruminal in vitro starch digestibility in

45
rehydrated corn without or with varied concentrations of wet brewer’s grains. Journal of Dairy
Science, 2018.
FERRARETTO, L.F.; TAYSOM, k.; TAYSOM, D.M.; SHAVER, R.D.; HOFFMAN, P.C.
Relationships between dry matter content, ensiling, ammonia-nitrogen, and ruminal in vitro starch
digestibility in high-moisture corn samples. Journal of Dairy Science, v. 97, p. 3221-3227. 2014.
FERRARETTO, L. F.; SHAVER, R. D. Meta-analysis: Impact of corn silage harvest practices on
intake, digestion and milk production by dairy cows. Prof. Animal Science, v. 28, p. 141–149.
2012.
FIRKINS, J.L., EASTRIDGE, M.L.; ST-PIERRE, N.R.; NOFTSGER, S.M. Effects of grain
variability and processing on starch utilization by lactating dairy cattle. Journal of Animal
Science, v. 79, p. E218-E238. 2001.
FORTALEZA, A.P.S.; SILVA, L.D.F.; RIBEIRO, E.L.A. et al. Degradabilidade ruminal in situ
dos componentes nutritivos de alguns suplementos concentrados usados na alimentação de
bovinos. Semina: Ciências Agrárias, v. 30, n. 2, p. 481-496, 2009.
FREDIN, S.M., FERRARETTO, L.F.; AKINS, M.S.; HOFFMAN, P.C.; SHAVER, R.D. Fecal
starch as an indicator of total-tract starch digestibility by lactating dairy cows. Journal of Dairy
Science, v. 97, p. 1862-1871, 2014.
GATES, R. Enzymes and Reagents for Ethanol Research. In Technical content: Enzymes and
Reagents for Alternative Energy. v.5, n.5, 2010.
GIUBERTI, G.; GALLO, G.; MOSCHINI, M.; CERIOLI, C.; MASOERO F. Evaluation of the
impact of maize endosperm vitreousness on in vitro starch digestion, dry matter digestibility and
fermentation characteristics for pigs. Animal Feed Science and Technology, v. 186, n. 1–2, p.
71–80, 2013.
GIFFEL, M. C. T. et al. Bacterial spores in silage and raw milk. Antonie van Leeuwenhoek,
Amsterdam, v. 81, n. 1-4, p. 625-630, Dec. 2002.
GOBETTI, S.T.C.; NEUMANN, M.; OLIBONI, R.; OLIVEIRA, M.R. Utilização de silagem de
grão úmido na dieta de animais ruminantes. Ambiência, 9 225-239. 2013.
GONZALES, C.; DELGADO, O.; BAIGORI, M.; ABATE, C.; DE FAGUEROA, L. I. C.;
CALLIERI, D. A. Ethanol production from native cassava starch by a mixed culture of
Endomycopsis fibuligera and Zymomonas mobilis. Acta Biotechnology, v.18, n.2, p.149-155,
1998.
GUTIÉRREZ, C. et al. Effect of exogenous amylase or glucoamylase dose on in situ ruminal
digestion of corn and sorghum. Journal of Applied Animal Research, v. 27, n. 1, p. 7–10, 2005.
46
HAESE, E.; MÖHRING, J.; STEINGASS, H.; SCHOLLENBERGER, M.; RODEHUTSCORD,
M. Effect of dietary mineral phosphorus and phytate on in situ ruminal phytate disappearance from
different concentrates in dairy cows. Journal of Dairy Science. v.100, n.5, p. 3672–3684, 2017.
HALE, W. H. Influence of processing on the utilization of grains (starch) by ruminants. Journal
of Animal Science, 37, 1075-1984. 1973.
HARMON, D. L.; YAMKA, R. M.; ELAM, N. A. Factors affecting intestinal starch digestion in
ruminants: A review. Can. J. Anim. Sci., v. 84, p. 309–318, 2004.
HENDERSON, N. Silage additives. Animal Feed Science and Technology, 45, 35-56. 1993.
HERMAN, E. M.; LARKINS, B. A. Protein storage bodies and vacuoles. The plant cell.
Rockville, v.11, n.4, p.601-614, 1999.
HERRERA-SALDANA, R. E.; HUBER, J. T.; POORE, M. H. Dry Matter, Crude Protein, and
Starch Degradability of Five Cereal Grains. Journal of Dairy Science. v.73, n.9, p.2386-2393,
1990.
HOFFMAN, P. C. et al. Influence of ensiling time and inoculation on alteration of the starch-
protein matrix in high-moisture corn. Journal of Dairy Science, v. 94, n. 5, p. 2465–2474, 2011.
HOLDING, D. R. Recent advances in the study of prolamin storage protein organization and
function. Frontiers in plant science, v. 5, n. June, p. 276, 2014.
HRISTOV, A. N.; ZAMAN, S.; VANDERPOL, M.; SZASZ, P.; HUBER, K.; GREER, D. Effect
of a saponin-based surfactant and aging time on ruminal degradability of flaked corn grain dry
matter and starch. J. Anim. Sci. v.85, p.1459–1466, 2007.
HUCK, G. L.; KREIKEMEIER, K. K.; BOLSEN, K. K. Effect of Reconstituting Field-Dried and
Early-Harvested Sorghum Grain on the Ensiling Characteristics of the Grain and on Growth
Performance and Carcass Merit of Feedlot Heifers. J. Anim. Sci. v.77, p.1074–1081, 1999.
HUNTINGTON, G. B.; HARMON, D. L.; RICHARDS, C. J. Sites, rates, and limits of starch
digestion and glucose metabolism in growing cattle. Journal of Animal Science, v. 84 Suppl, p.
14–24, 2006.
IGARASI, M. S.; ARRIGONI, M. B.; SOUZA, A. A.; SILVEIRA, A. C.; MARTINS, C. L.;
OLIVEIRA, H. N. Desempenho de bovinos jovens alimentados com dietas contendo grão úmido
de milho ou sorgo. R. Bras. Zootec., v.37, n.3, p.513-519, 2008.
JOBIM, C. C.; NUSSIO, L. G. Princípios básicos da fermentação na silagem. In. REIS, R. A.;
BERNARDES, T. F.; SIQUEIRA, G. R. Forragicultura: ciência, tecnologia e gestão de
recursos forrageiros. Jaboticabal: Maria de Lourdes Brandel – ME, 649-660, 2013.

47
JONKER, A.; GRUBER, M.Y.; WANG, Y. Modeling degradation ratios and nutrient availability
of anthocyanidin accumulating Lc-alfalfa populations in dairy cows. J. Dairy Sci., v. 94, p. 1430–
1444, 2011.
KIRIHARA, J. A.; HUNSPERGER, J. P.; MAHONY, W. C.; MESSING, J. W. Differential
expression of a gene for a methionine-rich storage protein in maize. Molecular General Genetics,
New York, v. 211, n. 3, p. 477-487, Mar. 1988.
KLOPFENSTEIN, T. J.; MASS, R. A.; CREIGHTON, K. W.; PATTERSON, H. H. Estimating
forage protein degradation in the rumen. J. Anim. Sci. v.79(E. Suppl.), p.E208–E217, 2001.
KUNG JUNIOR., L.; SHAVER, R. Interpretation and use of silage fermentation analysis reports.
Focus on Forage, v.3, n.13, p.1-5, 2001.
KUNG JNIOR, L. Effects of microbial additives in silages: facts and perspectives, In: NUSSIO,
L.G.; ZAPOLLATTO, M. International symposium on forage quality and quality, Proceedings…
Piracicaba, 280p, 2009.
KUNG, L.; WINDLE, M. C.; WALKER, N. The effect of an exogenous protease on the
fermentation and nutritive value of high-moisture corn. Journal of Dairy Science, v. 97, n. 3, p.
1707–1712, mar. 2014.
LANDRY, J.; DAMERVAL, C.; AZEVEDO, R.A.; DELHAYE, S. Effect of the opaque and
floury mutation on the accumulation of dry matter and protein fractions in maize endosperm. Plant
Physiology and Biochemistry, Paris, v.43, n.6, p549-556, 2005.
LAWTON, J. W. Zein: A history of processing and use. Cereal Chem. v.79, p.1–18, 2002.
LEE, Y. H.; AHMADI, F.; CHOI, D. Y.; KWAK, W. S. In situ ruminal degradation characteristics
of dry matter and crude protein from dried corn, high-protein corn, and wheat distillers grains.
Journal of Animal Science and Technology. v.58, n.33, p.2-7, 2016.
LENDING, C. R.; LARKINS, B. A. Changes in the zein composition of protein bodies during of
maize development. The plant cell, Rockiville, v. 1, n. 10, p. 1011-1023, Oct. 1989.
LOPES, J. C., SHAVER, R. D.; HOFFMAN, P. C.; AKINS, M. S.; BERTICS, S. J.; GENCOGLU,
H.; COORS, J. G. Type of corn endosperm influences nutrient digestibility in lactating dairy cows.
Journal of Dairy Science, v. 92, p. 4541–4548. 2009.
LOPES, M. A. LARKINS, B. Endosperm Origin, development, and function. The plant cell,
Rockville, v. 5, n. 10, p. 1383-1399, Oct. 1993.
LOPES, N. M. Efeito de enzimas sobre a digestibilidade ruminal da silagem do grão de milho
reidratado. Tese (Doutorado), Universidade Federal de Lavras, 2016.

48
MADINGAN, M. T.; MARTINKO, J.; BENDER, K.; BUCKLEY, D; STAHL, D. Brock Biology
of Microoganisms. 14. ed. Porto AlegreÇ Artmed, 2010.
MALAN, E.; RAFFRENATO E. Effects of corn particle size and neutral detergent fiber:starch
ratio on in vitro neutral detergent fiber degradability. J. Anim. Sci. v.94, E-Suppl. 5/J. Dairy Sci.
v. 99, E-Suppl. 1. 2016.
MANERA, A. P.; MEINHARDT, S.; KALIL, S. J. Purificação de amiloglicosidase de Aspergillus
niger. Semina: Ciências Agrárias. v.32, n.2, p.651-658, 2011.
McALLISTER, T. A.; RODE, L. M.; MAJOR, D. J.; CHENG, K.-J.; BUCHANAN-SMITH, J. G.
Effect of ruminal microbial colonization on cereal grain digestion. Canadian Journal of Animal
Science, v. 70, p. 571-579, 1990.
McALLISTER, T. A. PHILLIPPE, C. R.; RODE, L. M.; CHENG, K. J. Effect of the Protein
Matrix on the Digestion of Cereal Grains by Ruminal Microorganisms’. Journal of Animal
Science, v. 71, p. 205–212, 1993.
McDONALD, P.; HENDERSON, A.R. and HERON, S.J.E. The biochemistry of silage. Marlow,
Chalcomb Publication. 1991.
MEHREZ, A.Z.; ORSKOV, E.R. A study of the artificial fiber bag technique for determination
the digestibility of feeds in the rumen. J. Agric. Sci., v.88, n.1, p.645, 1977.
MICHALET-DOREAU, B.; CERNEAU, P. Influence of foodstuff particle size on in situ
degradation of nitrogen in the rumen. Anim. Feed Sci. Technol. v.35, p.69−81, 1991.
MICHALET-DOREAU, B.; OULD-BAH. M. Y. In vitro and in sacco methods for the estimation
of dietary nitrogen degradability in the rumen: a review. Anim. Feed Sci. Technol. v.40, p.57−86,
1992.
MILLER, F. Alternative marketing opportunities for sorghum. In: 19TH Biennial grain sorghum
research & utilization conference, Lubbock, Texas, 1995. Proceedings. Lubbock: NATIONAL
GRAIN SORGHUM PRODUCERS, 1995. p. 120.
MOREIRA, I. Valor nutritivo e utilização do milho e soja integral processados a calor na
alimentação de leitões. Viçosa, MG: Universidade Federal de Viçosa. Tese (Doutorado em
Zootecnia) - Universidade Federal de Viçosa, 1993. 145p.
MOHARRERY, A.; LARSEN, M.; WEISBJERG, M. R. Starch digestion in the rumen, small
intestine , and hind gut of dairy cows – A meta-analysis. Animal Feed Science and Technology,
v. 192, p. 1–14, 2014.
MUCK, R.E. Recent advances in silage microbiology. Agricultural and Food Science. v.22, p.3-
15, 2013.
49
MUCK, R.E. Silage microbiology and its control through additives. Revista Brasileira de
Zootecnia, 39, 183-191. 2010.
NAKAMURA, L. K. Bacillus pseudomycoides sp. nov. International Journal of Systematic
Bacteriology. v.48, p.103 1-1 035, 1998.
NOCEK, J. E.; KOHN, R. A. In situ particle size reduction of alfalfa and timothy hay as influenced
by form and particle size. J. Dairy Sci. v.71, p.932−945, 1988.
NOCEK, J. E.; TAMMIMGA, S. Site of digestion of starch in the grastrointestinal tract of dairy
cows and its effect on milk yield and composition. Journal of Dairy Science, Lancaster, v.74, n.8,
p. 3598-3629, 1991.
NUNES, A.; CORREIA, I.; BARROS, A.; DELGADILLO, I. Characterization of kafirin and zein
oligomers by preparative sodium dodecyl sulfate − Polyacrylamide gel electrophoresis.
Agricultural and Food Chemistry, v. 53, p. 639–643, 2005.
ORTEGA, E. I.; BATES, L. S. Biochemical and agronomic studies of two modified hard
endosperm opaque-2 maize (Zea mays) populations. Cereal Chemistry, St. Paul, v. 60, n. 2, p.
107-111, Mar./Apr. 1983.
PAES, M. C. D. Aspectos Físicos, Químicos e Tecnológicos do Grão de Milho. Circular Tecnica
Embrapa. 75, p. 16, 2006.
PAHLOW, G.; MUCK, R. E.; DRIEHUIS, F.; OUDE ELFERINK, S. J. W. H.; SPOELSTRA,
S.F. Microbiology of ensiling. In BUXTON, D. R.; MUCK, R. E.; HARRISON, J. H. Silage
science and technology. Madison: American Society of Agronomy; Crop Science Society of
America; Soil Science Society of America, chap 2, p. 31-93, 2003.
PALMISANO, M. M.; NAKAMURA, L. K.; DUNCAN, K. E.; ISTOCK, C. A.; COHAN, F. M.
Bacillus sonorensis sp. nov., a close relative of Bacillus licheniformis, isolated from soil in the
Sonoran Desert, Arizona. International Journal of Systematic and Evolutionary Microbiology
v.51, p.1671–1679, 2001.
PANDEY, A.; POONAM, N.; SOCCOL, C. R.; SOCCOL, V. T.; SINGH, D.; MOHAN, R.
Advances in microbial amylases. Biotechnology and Applied Biochemistry, v.31, n.2, p.135-
152, 2000.
PEDERSEN, K.; ARGOS, P.; NARAYANA, S. L. V.; LARKINS, B. A. Sequence analysis and
characterization of a maize gene encoding a high sulphur zein protein of Mr 15,000. The Journal
of Biological Chemistry, Baltimore, v. 261, n. 14, p. 62779-6284, 1986.
PEYRAT, J.; NOZIÈRE, P.; LE MORVAN, A. et al. Effects of ensiling maize and sample
conditioning on in situ rumen degradation of dry matter, starch and fibre. Ani. Feed Sci. Tech., n.
196, p. 12–21, 2014.
50
PEREIRA, M.N; PEREIRA, R.A.N.; BITENCOURT, L.L.; DIAS JÚNIOR, G.S.; LOPES, N.M.;
ZACARONI, O.F. Silagem de milho reidratado na alimentação do gado leiteiro. Informe
Agropecuário, 34, 27-33. 2013.
PEREIRA, R.C. Relação entre características estruturais e bioquímicas e a textura do grão
de milho. Tese (Doutorado em Genética e Melhoramento de plantas) Universidade Federal de
Lavras, Lavras, MG, 2006. 54 p.
PEREIRA, O.G.; SANTOS, E.M. Microbiologia e o processo de fermentação em silagens. In:
SIMPÓSIO SOBRE MANEJO ESTRATÉGICO DA PASTAGEM. 3., Viçosa: UFV, 2006.
Anais... Viçosa: UFV, p. 393-430, 2006.
PHILIPPEAU, C.; MICHALET-DOREAU, B. Influence of genotype and stage of maturity of
maize on rate of ruminal starch degradation. Animal Feed Science and Technology, v. 68, n. 1–
2, p. 25–35, 1997.
PLANCHOT, V. et al. Extensive degradation of native starch granules by alpha-amylase from
aspergillus fumigatus. Journal of Cereal Science, v.21, p.163–171, 1995.
REZENDE, A. V., C. H. S. RABELO, R. M. VEIGA, L. P. ANDRADE, C. J. HARTER, F. H. S.
RABELO, F. C. BASSO, D. A. NOGUEIRA, AND R. A. REIS. 2014. Rehydratation of corn grain
with acid whey improves the silage quality. Anim. Feed Sci. Technol. 197: 213-221.
REY, R.C.; ROSELL, C.M. Microbial Enzyme Technology in Food Applications. P.520, 2017.
RIBAS, M.N. Avaliação agronômica e nutricional de híbridos de sorgo com capimsudão,
normais e mutantes bmr - portadores de nervura marrom. Tese (Doutorado em zootecnia).
Universidade Federal de Minas Gerais, Escola de Veterinária, Belo Horizonte. 140 f. 2010.
RIBAS, M. N.; GONÇALVES, L. C.; HIBRAHIM, G. H. F.; RODRIGUEZ, N. M.; BORGES, A.
L. C. C.; BORGES, I. Consumo voluntário e digestibilidade aparente de silagem de milho com
diferentes vitreosidades. Revista Brasileira de Milho e Sorgo, Sete Lagoas, v.6 p. 104-115, 2007.
RIBAS, P.M. Cultivo do sorgo. 2008. Disponível em:
http://www.cnpms.embrapa.br/publicacoes/sorgo_4_ed/plantio-plantio.html Acesso em: 03 de
fevereiro de 2018.
ROBERTS, M. S.; NAKAMURA, L. K.; COHAN, F. M. Bacillus vallismortis sp. nov., a Close
Relative of Bacillus subtilis, Isolated from Soil in Death Valley, California. International Journal
of Systematbica Cteriology, v.46, n.2, p.470-475, 1996.
RODRIGUES FILHO, O., FRANÇA, A.F.S., OLIVEIRA, R.P., OLIVEIRA, E.R., ROSA, B.;
SOARES, T.V.; MELLO, S.Q.S. Produção e composição de quatro híbridos de sorgo forrageiro
(Sorghum bicolor L. Moench) submetidos a três doses de nitrogênio. Ciência Animal Brasileira,
Goiânia, v.7, n.1, p.37-48, 2006.
51
RODRIGUES, W. A.; MAGALHÃES, P. C.; PAIVA, E.; DOS SANTOS, F. G. Padrões
eletroforéticos das proteínas de reserva em grãos de sorgo com presença e ausência de tanino.
Ciência e Agrotecnologia, v. 33, p. 1972–1977, 2009.
ROGOSA, M. Characters used in the classification of Lactobacilli. International Journal of
Systematic Bacteriology. v.20, n.4, p.519-533, 1970.
ROOKE, J. A.; HATFIELD, R. D. Biochemistry of ensiling. In BUXTON, D. R.; MUCK, R. E.;
HARRISON, J. H. Silage science and technology. Madison: American Society of Agronomy;
Crop Science Society of America; Soil Science Society of America. p. 251-304, 2003.
ROONEY, L. W.; PFLUGFELDER, R. L. Factors affecting starch digestibility with special
emphasis on sorghum and corn. Journal of Animal Science, Champaing, v.63 p. 1607-1623,
1986.
ROONEY, L. W.; SERNA-SALDIVAR, S. O. Sorghum, in Handbook of Cereal Sciece
Thechnology (eds K.J. LORENZ; K. KULP), Marcel Dekker, New York, NY, p 233-270, 1991.
RUIZ-GARCIA, C.; QUESADA, E.; MARTINEZ-CHECA, F.; LLAMAS, I.; URDACI, M. C.;
BEJAR V. Bacillus axarquiensis sp. nov. and Bacillus malacitensis sp. nov., isolated from river-
mouth sediments in southern Spain. International Journal of Systematic and Evolutionary
Microbiology. v.55, p.1279–1285, 2005.
SATOMI, M.; LA-DUC, M. T.; VENKATESWARAN, K. Bacillus safensis sp. nov., isolated from
spacecraft and assembly-facility surfaces. International Journal of Systematic and
Evolutionary Microbiology. v.56, p.1735–1740, 2006.
SERRANO, J.M.R. El sorgo híbrida despierta interés en las Américas. La Hacienda,
Kissimmée, v.66, n.5, p. 36-37, 1971.
SHEWRY, P. R.; HALFORD, N. G. Cereal seed storage proteins: structures, properties and role
in grain utilization. Journal of Experimental Botany, v. 53, p. 947–958, 2002.
SHIVAJI, S.; CHATURVEDI, P.; SURESH, K.; REDDY, G. S. N.; DUTT, C. B. S.;
WAINWRIGHT, M.; NARLIKAR, J. V.; BHARGAVA, P. B. Bacillus aerius sp. nov., Bacillus
aerophilus sp. nov., Bacillus stratosphericus sp. nov. and Bacillus altitudinis sp. nov., isolated
from cryogenic tubes used for collecting air samples from high altitudes. International Journal
of Systematic and Evolutionary Microbiology. v.56, p.1465–1473, 2006.
SHOTWELL, M. A.; LARKINS, B. A. The biochemistry and molecular biology of seed storage
proteins. In: MARCUS, A. (Ed.). The biochemistry of plant: a comprehensive treatise. San
Diego: Academic, v. 15, p. 296-345. 1989.

52
SHULL, J.M.; CHANDRASHEKAR, A.; KIRLEIS, A.W.; EJETA, G. Development of sorghum
[Sorghum bicolor (L.) Moench] endosperm in varieties of varying hardness. Food Struct., v.9,
p.253-267, 1990.
SILVA, J.F.; LEÃO, M.I. Fundamentos de nutrição dos ruminantes. Piracicaba: Livroceres,
1979. 380p.
SILVA, P.A.; VALADARES FILHO, S.C.; VALADARES, R.F.D. et al. Valor energético do
capim-elefante em diferentes idades de rebrota e estimativa da digestibilidade in vivo da fibra em
detergente neutro. Arq. Bras. Med. Vet. Zootec., v.59, n.3, p.711-718, 2007.
SILVEIRA, S. T.; OLIVEIRA, M. S.; COSTA, J. A. V.; KALIL, S. J. Optimization of
glucoamylase production by Aspergillus niger in solid-state fermentation. Applied Biochemistry
and Biotechnology, v.128, n.2, p.131-139, 2006.
SILVA, N. Quantificação de amido e proteínas totais em grãos de sorgo [Sorghum bicolor
(L.) Moench - Família: Poaceae] visando à alimentação humana. Dissertação (Mestrado),
Universidade de Brasília, 2015, 72p.
SILVA, J. S.; BORGES, A. L. C. C.; LOPES, F. C. F.; SILVA, R. R.; VIEIRA, A. R.; DUQUE,
A. C. A.; BORGES, I.; RODRIGUES, J. A. S.; GONÇALVES, L. C. Degradabilidade ruminal in
situ do sorgo grão em diferentes formas de reconstituição. Arq. Bras. Med. Vet. Zootec., v.66,
n.6, p.1822-1830, 2014.
SILVA, N. C.; NASCIMENTO, C. F.; NASCIMENTO, F. A.; DE RESENDE, F. D.; DANIEL, J.
L. P.; SIQUEIRA, G. R. Fermentation and aerobic stability of rehydrated corn grain silage treated
with different doses of Lactobacillus buchneri or a combination of Lactobacillus plantarum and
Pediococcus acidilactici. Journal of Dairy Science. Vol. 101 No. 5, 2018.
SIMPSON, D. J. Proteolytic degradation of cereal prolamins—the problem with proline. Plant
Science, v. 161, n. 5, p. 825–838, 2001.
SOCCOL, C. R. et al. Glucoamylase. In: Enzyme Technology. New Delhi: Asiatec Publishers
Inc., p. 221-230.
2005.
STOCK, R.A. Nutritional benefits of specialty grain hybrids in beef feedlot diets. Journal of
Animal Science, v. 77, Suppl. 2, p. 208-212, 1999.
SULLINS, R.D.; ROONEY, L.W. Light and scanning electron microscopy studies of waxy and
nonwaxy endosperm sorghum varieties. Cereal Chem., v.52, p.361366, 1975.
SULLINS, R.D.; ROONEY, L.W.; RIGGS, J.K. Physical changes in the kernel during
reconstitution of sorghum grain. Cereal Chem., v.48, p.567-575, 1971.

53
TANASUPAWAT, S.; OKADA, S.; KOZAQ, M.; KOMAGATA, K. Characterization of
Pediococcus pentosaceus and Pediococcus acidilactici Strains and Replacement of the Type Strain
of P. acidilactici with the Proposed Neotype DSM 20284. International Journal of Systematic
Bacteriology, v.43, n.2, p.860-863, 1993.
TAYLOR, C. C.; M. S. ALLEN. Corn Grain Endosperm Type and Brown Midrib 3 Corn Silage:
Site of Digestion and Ruminal Digestion Kinetics in Lactating Cows. Journal of Dairy Science,
v. 88, p. 1425–1433, 2005.
THEURER, C.B. Grain processing effects on starch utilization by ruminants. Journal of Animal
Science, 63, 1649-1662. 1986.
VAN HELLEN, R.W.; ELLIS, W.C. Samples container porosities for rumen in situ studies. J.
Ani. Sci., v.44, p.141-146, 1977.
VAN SOEST, P. J. Nutritional ecology of the ruminant. 2nd ed. Ithaca: Cornell University Press,
1994. 476p.
VANZANT, E. S.; COCHRAN, R.C.; TITGEMEYER, E. C. Standardization of In situ Techniques
for Ruminant Feedstuff Evaluation. J. Anim. Sci. v.76, p.2717–2729, 1998.
VISSER, H.; KLOP, A.; VAN DER KOELEN, C. J.; VAN VUUREN, A. M. Starch
Supplementation of Grass Harvested at Two Stages of Maturity Prior to Ensiling: Intake,
Digestion, and Degradability by Dairy Cows. Journal of Dairy Science. v.81, n.8, p.2221-2227,
1998.
WANISKA, R. D.; ROONEY, L. W. Chapter 4.1 Structure and chemistry of the sorghum
caryopsis. Sorghum: Origin, History, Technology, and Production, p.649–688 2000.
WATTERSON, J. J.; SHULL, J. M.; KIRLEIS, A. W. Quantification of α-, β- e ɣ-Kafirina in
vitreous and opaque endosperm of sorghum bicolor. Cereal Chemistry, v. 70, p. 452–457, 1993.
WONG, J. H.; MARX, D. B.; WILSON, J. D.; BUCHANAN, B. B.; LEMAUX, P. G.;
PEDERSEN, J. F. Principal component analysis and biochemical characterization of protein and
starch reveal primary targets for improving sorghum grain. Plant Science, v. 179, p. 598–611,
2010.
ZOPOLLATTO, M. Avaliação do efeito da maturidade de cultivares de milho (Zea mays L.)
para silagem sobre a produtividade, composição morfológica e valor nutritivo da planta e
seus componentes. Tese (Doutorado em Agronomia) - Escola Superior de Agricultura “Luiz de
Queiroz”, Piracicaba, 2007. 210f.
ZHANG, B.; DHITAL, S.; GIDLEY, M. J. Synergistic and Antagonistic Effects of α ‑ Amylase
and Amyloglucosidase on Starch Digestion. Biomacromolecules, v.14, p.1945–1954, 2013.

54
SEGUNDA PARTE
3 ARTIGO 1: Addition of exogenous amyloglucosidases to rehydrated corn and sorghum
kernel silage at two durations of storage
Artigo formatado de acordo com normas da revista Grass and Forage Science
Disponível em: http://onlinelibrary.wiley.com/journal/10.1111/(ISSN)1365-
2494/homepage/ForAuthors.html

55
Addition of exogenous amyloglucosidases to rehydrated corn and sorghum
kernel silage at two durations of storage
Amyloglucosidase in rehydrated kernel silage
Acknowledgments
Appreciation is extended to Drs. Schwan (Department of Biology, Federal University of
Lavras, Lavras, MG) for the opportunity to use their laboratory equipment during this
experiment; and MCs Gomide (EPAMIG, Agricultural Research Corporation of Minas Gerais
State, TrêsPontas, MG) for provide the animals to this experiment. The authors are also grateful
to the National Research Council (CNPq; Brasilia, DF, Brazil) and Foundation for Research
Support of the State of Minas Gerais (FAPEMIG; MG, Brazil) for the grants to the authors.
Abstract
The objectives of this study were to evaluate the effect of two amyloglucosidases and duration of
storage of sorghum or corn kernel rehydrated and ensiled. Kernels were rehydrated (65% of DM)
before ensiled. Dosages of amyloglucosidase AMG (AMG, Novozymes) and GAM (Sanferm
Yield, Novozymes) were 0.35 mL/kg of kernel. Treatments were a 2 x 3 x 2 factorial
combination of G (Sorghum vs. Corn), A (CTL vs. AMG vs. GAM), and duration (30 d vs. 180
d) with 6 replicates. The in situ DM degradation was evaluated with incubation times of 0 (bag
wash), 3, 6, 12, 18, and 48 h in 3 rumen cannulated cows. The fractional rate of degradable
56
Fraction B (kd) was determined by the slope of linear regression of the natural logarithm of bag
residue as a proportion of the initial incubated mass over time. The effective ruminal degradation
(ERD6) was calculated based on soluble fraction (A), degradable fraction (B), kd, and passage
rate (kp) defined as 6.5% h-1: A + B [kd / (kd + kp)]. Rehydration and ensiling of sorghum or
corn with addition of amyloglucosidase resulted in adequate fermentation, as evidenced by pH
and lactic acid concentration. Increased DM loss, hydrolyze of starch, and the proportion of DM
as fraction A, without alteration on kd or ERD 6.5. Is necessary long time of fermentation to
improve DM digestibility. The ensilage of sorghum improved the quality of kernel making it like
corn.
Key words: amyloglucosidase, degradation rate, enzymes, fermentation profile, kernel, silage
Introduction
Rehydrated kernel silage consists of milled mature kernel rehydration, which provides
adequate conditions for storage and fermentation as silage (Andrade et al., 2010; Carvalho et al.,
2016). Digestibility of starch is impaired by hydrophobic starch-protein matrix surrounding starch
granules which reduced microbial attachment and fermentation in the rumen (Giuberti et al., 2014).
During the ensiling process, proteolysis of the prolamins involving the starch granules occurs by
the action of microbial proteases (Hoffman et al., 2011), and thus, an increase of the extent of
degradation that occurs in the rumen for starch of corn and sorghum (Ferraretto et al., 2015;
Aguerre et al., 2015).
Improvements in starch digestibility occurs with a prolonged storage period, but at the
expense of increased DM loss (Carvalho et al., 2016). The use of exogenous enzymes at ensiling

57
were previously reported to increase the availability of starch after a short period of storage
(Ferraretto et al., 2015). Enzymes such as amylases and amyloglucosidase breakdown the starch
chain to monosaccharaides and disaccharides, increasing the rate of starch digestion in the rumen
(Zhang et al., 2013). However, the optimal temperature and pH for enzymatic activity may change
depending on the growing conditions of the microorganism that produces it (Gates, 2010). For
sorghum, those enzymes had more expressive results as the starch-protein matrix is more resistant
than the corn matrix (Theurer, 1986). However, the action of these enzymes may be affected by
pH and temperature conditions of the silage (Motta, 2011).
Therefore, experimental objectives were to evaluate the effect of two amyloglucosidases
produced under different condition, and storage length on fermentation profile, and in situ
degradability of sorghum or corn kernels rehydrated and ensiled. We hypothesized that the
addition of exogenous amyloglucosidases would improve the degradability of starch after a short
term length of storage.
Materials and methods
Kernel and ensiling conditions
Mature sorghum (Dow 1G220, 84.9% DM on as fed) and corn (Dow 2B707, 87.3% DM
on as fed) kernels were ground through a 1 mm mesh diameter screen using a stationary mill
Nogueira TN-8 (Nogueira Máquinas Agrícolas, São João da Boa Vista, SP). Ground kernels were
rehydrated to a targeted DM concentration of 65%. Approximately 4 kg of rehydrated kernel was
ensiled in experimental polyvinyl chloride mini-silos (10 cm in diameter and 60 cm in length).
Experimental silos were sealed with tight lids containing Bunsen type valves for gas release.

58
One amyloglucosidase unit (AGU) is defined as the amount of enzyme that cleaves 1 µmol
of maltose per minute under standard assay conditions (JECFA, 2002). Enzymes used were: 1)
amyloglucosidase from Aspergillus niger with high activity at 40 to 50 oC and pH 4.8 to 5, with
300 AGU mL-1 (AMG; Novozymes Latin America Ltda, Araucária, PR, Brasil), or 2)
amyloglucosidase from Aspergillus niger with adequate activity at 55oC and pH 4.5, with 138
AGU mL-1 (GAM; Sanferm Yield, Novozymes Latin America Ltda, Araucária, PR, Brasil).
Treatments were cereal kernel type (Sorghum vs. Corn), enzyme (control [CON] vs. AMG vs.
GAM), and duration of silage storage (30 vs. 180 d). Experiment was conducted as randomized
blocks, each block corresponded to a day of ensiling, with three replicates in each block. The
factorial arrangement consisted of 2 cereal kernel types x 3 enzymes x 2 storage length. The silage
was treated with a dosage of 0.35 mL of enzyme kg-1 of kernel, according to the recommendation
of the manufacturer.
Each silo was packed to achieve a packing density of 950 kg m-3 of fresh matter, and the
weight of empty and full silos was recorded. The silos were stored at room temperature (25 ± 1.5
°C) and protected from sunlight and rain. After 30 and 180 days of ensiling, the full silos were
weighed and opened. The total loss of DM was calculated using weights of the DM contents of
fresh forage and silage.
Analytical procedures
After the opening, samples were frozen at -20°C for 5 days for inactivation of enzymes.
The DM contents of each sample were determined according AOAC (1990). NDF by filtration in
porous crucibles with heat stable alpha-amylase and sodium sulfite (Van Soest et al., 1991), and
the ether extract (EE) as in AOAC International (2012). The starch content was measured by
ground samples in a boll mill (SPlabor, Presidente Prudente, SP, Brazil) and analyzed for starch
by an enzymatic method with thermostable α-amylase (Termamyl, Novozymes Latin America

59
Ltda, Araucária, PR, Brasil) and amyloglucosidase (AMG; Novozymes Latin America Ltda,
Araucária, PR, Brasil) enzymes, with free and enzymatically released glucose measured. Values
from a separate determination of free glucose were subtracted to give values for enzymatically
released glucose. Starch concentration was calculated as enzymatically released glucose multiplied
by 0.9, as described by Hall (2015). The prolamine content was quantified according to method of
Nellis et al. (2013), with use of zein as standard.
Samples (100g) were dry-sieved for 10 min with a Bertel shaker (Bertel Indústria
Metalúrgica Ltda., Caieiras, Brazil) with sieves of square diagonals of 4,750, 4,000, 2,000, 1,200,
600, 300, and 150 µm and pan. The proportion of particles retained on each sieve was determined.
The geometrical mean particle size (GMPS, µm) and surface area (cm2/g) were calculated as in
Baker and Herrman (2002).
To obtain the aqueous extract, a 25-g sample of silage was blended in 225 mL of sterile
water and homogenized in a shaker for 1 min. The pH of each sample was then determined using
a pH meter (DIGIMED® DM 20 Potentiometer, Digicrom Instrumentos, SP, Brazil). Aqueous
extracts (50 mL) were acidified with 250 μL of 50% (vol/vol) H2SO4 and frozen prior to analysis
of fermentation end products. The acidified aqueous extracts were analyzed for ethanol, acetic,
butyric, propionic, and lactic acids, and 1,2-propanediol by high-performance liquid
chromatography according to the method described by Carvalho et al. (2012) using an ion-
exclusion column from Shimadzu (Shim-pack SCR-101H; 7.9 mm x 30 cm) operating at 50°C and
the mobile phase 100 mM perchloric acid solution with a flow rate of 0.6 mL min-1. Aliquots of
50 ml of aqueous extracts were utilized for reading determined the ammonia concentration, using
an ion selective electrode coupled to a multiparameter (High Performance Ammonia Ion Selective;
Thermo Fisher Scientific Inc., Waltham, MA) as described by Carvalho et al. (2016).

60
Measurement of in situ ruminal DM disappearance were performed with six incubation
time-points 0, 3, 6, 12, 18, and 48 h. Two empty bags were put together to correct for DM adhesion
at each incubation time. Dry samples without ground, were weighted (0.5045 ± 0.0026 g) in 5 x 5
cm polyester cloth bags (bags were made by a single piece of 5 x 10 cm, which were folded, and
heat sealed) tied by a plastic clamp on its last opening. Three rumen cannulated crossbred Holstein
x Gyr cows in mid lactation (26.3 ± 3.6 kg of milk) were used (Ethics Committee of Federal
University of Lavras, code 072/2015). Cows were fed with corn silage ad libitum and 10 kg of
DM from a concentrate composite of (DM basis): Crude protein 24%, Crude fiber 8%, Ash 14%,
Ether extract 2%, Fiber insoluble in detergent acid 13%. After removal, bags were immersed in
cold water for 15 min to stop fermentation. The 0 h and the incubated bags were washed with cold
tap water until rinse water was clear.
The model to estimate the fractional degradation rate (kd) was a two-pool model comprised
of a fast degrading fraction (A) and a slow degrading fraction (B). An indigestible residue was not
included in the model. Fraction A was the bags at 0 h, and a fractional degradation rate was
determined using the other incubation times. The kd was obtained by the slope of the natural
logarithm of each time point residue as a percentage of the incubated, which resulted in a linear
regression. Effective rumen degradability (ERD) was calculated as: A + B [kd/(kd + kp)], where:
A = fraction A, B = fraction B (100 – fraction A), kd = fractional degradation rate, kp = fractional
passage rate. The fractional passage rate (kp) used was calculated using the average experimental
cow being fed experimental diet and using the CNCPS formula (Tylutki et al., 2008). The kp
obtained was equal to 6.5 %/h.
Microbiological analyses

61
Enumeration of microorganisms was performed on the aqueous extract. To obtain the
aqueous extract, a 25-g sample of silage was blended in 225 mL of peptone water (0.1%) and
homogenized in a shaker for 10 min. A sequential 10-fold dilution was prepared. For enumeration
of lactic acid bacteria (LAB), pour plating on the Man Rogosa Sharpe – Difco (MRS) agar plus
nystatin (4 mL L-1) was used. The plates were incubated at 30°C for 72 h. Colonies were counted
on plates containing a minimum of 30 and a maximum of 300 colony-forming units (CFU).
Statistical analysis
Data were analyzed in a completely randomized block design using the PROC MIXED
procedure of SAS 9.1; each block corresponded to day of ensilage, using the model Yijklm = µ + Bi
+ Kj + Ek +(KE)jk+ Dl +(KD)jl + (ED)kl + (KED)jkl+ eijklm. Where, µ is the overall mean; Bi is the
block effect (i = 2); Kj is the effect of kernel (j = corn, sorghum); Ek is the effect of enzyme(k =
control, AMG, GAM); (KE) is the interaction effect of kernel × enzyme;Dl is the effect of day of
ensiled (l = 30, 180 d); (KD) is the interaction effect of kernel × day; (ED) is the interaction effect
of enzyme × day; (KED) is the triple interaction effect of kernel × enzyme × day, and eijklm is the
experimental error. Statistical significance was considered at P ≤ 0.05.
Results and Discussion
Unensiled sorghum and corn had similar chemical composition, with expressive
differences observed for starch and prolamin content, with 11.07 and 2.05 percentage-units greater
values for corn than sorghum, respectively (Table 1). Even though the same mesh diameter was
used throughout the grinding process of kernels, the sorghum had smaller GMPS (129 vs. 211 µm)
and greater surface area (77 vs. 60 cm2 g-1) than corn. There was interaction of enzyme and
duration of storage on DM concentration (P < 0.01; Table 2). At 30 d of storage length the addition

62
of GAM decreases from 67.24 to 66.24% of DM, at 180 d both enzymes, AMG and GAM, decrease
the DM concentration from 65.05 to 62.80 and 62.83% of DM, respectively. A reduction in DM
content during the fermentation period is a result of nutrient hydrolysis and the corresponding
release of CO2 and free water (Pahlow et al., 2003); the use of enzymes may have improved this
process. Also, the DM content reduction can be related to the methodology used, oven-drying,
which excludes the volatile components (Woolford, 1984), resulting in loss of dry matter during
oven-drying silages (Wilson et al., 1964). The DM loss was greater in corn than sorghum. There
was an interaction between enzyme addition and days of storage length for DM loss (P < 0.01);
lessened DM loss was observed for CON at 30 d and increase during the ensiling period, reaching
a maximum of 5.61%, 11.43 and 9.64% of DM CON and ensiled with enzyme AMG and GAM,
respectively, by day 180. According to Rezende et al. (2014), substantial losses of DM during
fermentation are arising from the low soluble carbohydrates (WSC) and low amount of acids
produced. The DM loss of CON is similar to results of Carvalho et al. (2016) but increased with
the addition of amyloglucosidase. The enzyme α-amylase is inhibited by oligosaccharides whereas
amyloglucosidase degrades these compounds (Zhang et al., 2013), and hence increases starch
degradation, followed by increase starch and DM losses. Increased DM and starch losses were
observed for corn compared with sorghum. Sorghum had greater proportion of the vitreous
endosperm, a dense region and resistant to water penetration (Rooney and Pflugfelder, 1986),
which likely compromises starch availability.
Starch concentration decreased from 67.38% of DM at 30 d to 59.63% of DM at 180 d (P
< 0.01; Table 2). Corn had increased starch loss than sorghum. Starch loss increased along with
storage length. Addition of AMG and GAM increased starch loss (10.64%, 20.34% and 25.26%,
respectively for CON, AMG and GAM). For free glucose, there was an interaction between kernel,
63
enzyme, and duration of ensiling (P < 0.01; Figure 1). Addition of AMG, increased free glucose
at 180 d for sorghum; corn had more free glucose than sorghum at 180 d. Both enzymes (AMG
and GAM) increase free glucose at 180 d in rehydrated corn kernel silage. The starch loss is a
result of hydrolyses of starch to glucose, and was not a real loss of DM content, because when the
starch content reduced the content of glucose increase.
The longer duration of ensiling reduced 36.21% the amount of prolamin and increased
37.81% the ammonia concentration (P < 0.01). Neither kernel type nor the addition of
amyloglucosidase affected prolamin degradation. Rehydrated sorghum kernel silage had greater
concentration of ammonia than rehydrated corn kernel silage. The increase of ammonia
concentrations coincided with reduced prolamin concentrations (Hoffman at al., 2011). According
to Junges et al. (2017), besides proteolytic activity of microorganisms, kernel enzymes may
contribute on proteolysis in rehydrated corn kernel silage.
Amyloglucosidase increased Fraction A on Deg 0 (P = 0.02; 33.7, 38.2, and 36.6 for CON,
AMG and GAM, respectively), but had no effect on DM degradation at other incubation times and
ERD 6.5%. Corn had greater kd than sorghum (P < 0.01), but lower DM degradation up to 6 h of
ruminal incubation and ERD 6.5%. The smaller particle size of kernel sorghum (Table 1) may
explain this response. Longer storage increased kd in 0.13%-unit from day 30 to day 180, ruminal
degradation at all incubation times, with increase of up to 11% on degradation (6h), being the
smallest increase occurred with 48 hours (2,9%). Ferraretto et al. (2015) observed a 13.2%-units
increase in in vitro starch digestibility for rehydrated and ensiled corn compared with unensiled
corn. Also, Carvalho et al. (2016) observed increase on in vitro DM digestibility at 7 h for rehydrate
and ensiled corn, with long storage length. The reduction of prolamin subunits that cross-link

64
starch granules during the ensiling process may explain the increase in degradation (Hoffman et
al., 2011).
The addition of amyloglucosidase (GAM) altered the pH reduction (P = 0.03), the pH at
30 d remained high in rehydrated sorghum kernel silage with GAM. Total acid concentration was
increased with longer duration of storage length (P < 0.01), with consequent reduction in pH to
less than 3.80. Rehydrated corn kernel silage had lower pH than sorghum. There was an interaction
between kernel type and enzyme addition (P = 0.02), since the use of the enzyme GAM resulted
in higher pH (4.38) in sorghum, without difference for corn. Therefore, pH value suggested an
adequate fermentation, as enterobacteria and bacilli will be inhibited once pH drops below 4.5 to
5.0 (Muck, 2010).
There was an interaction between kernel and duration of silage for total acids (P = 0.02);
sorghum at 180 d of storage length had greater concentration of total acids, but not at other storage
length (Table 3). For propionic and butyric acid there was an interaction among kernel type,
enzyme addition and duration of fermentation (P < 0.01); a tendency for acetic acid was also
observed. The same behavior was observed for both propionic and butyric acids. At 180 d sorghum
CON had increased in this acids concentration compared with other treatments. Propionic and
butyric acid concentration was increased with the addition of GAM compared with AMG in
sorghum, at 180d (Figure 2B). For corn at 180 d there were no differences between enzymes, and
for CON there were no increased in this acids between 30 and 180 days of storage. Carvalho et al.
(2016) also observed increased the concentration of propionic acid with long fermentation, but the
concentration of acids was greater than observed in this study. Concentration of butyric acid may
indicate the activity of Clostridium, because this acid is part of primary products of Clostridium

65
metabolism (Muck, 2010). Besides Clostridium, other microorganisms as yeasts or Bacillus can
produced butyric acid in low quantities (McDonald et al., 1991).
There was interaction between kernel and enzyme to 1,2 propanediol (P < 0.01; Table 3).
In sorghum the addition of GAM increased the concentration, but no difference between AMG
and CON. Corn was unaffected by the addition of enzymes. There was also an interaction between
kernel and duration of storage length (P = 0.03). The concentration of 1,2 propanediol was
increased only in sorghum at 180 d. The degradation of lactic acid by L. buchneri occurs in
anaerobic conditions and resulting in the production of acetic acid and 1,2-propanediol (Oude
Elferink et al., 2001; Heinl et al., 2012). The concentration of acetic acid tends (P = 0.08) to same
behavior of propionic acid. A kernel by enzyme by duration interaction was observed for ethanol
concentration (Table 3), with increased concentration at 180 d when GAM was added in sorghum
and corn, or when AMG was added in corn.
The population of lactic acid bacteria (LAB) was greater (P < 0.01) in corn (6.49 log per
g) than sorghum (5.07 log per g) at 30 d of storage length but reduced at 180 d for both kernel
types. The duration of fermentation reduced the count of LAB, and the use of the enzyme GAM
in sorghum and of both enzymes in corn resulted in reduction of the population to undetectable
levels at 180 d of storage length. The population of LAB is higher than undesirable micro-
organisms but is slow than compared with population related by Carvalho et al. (2016).
Rehydration and ensiling of sorghum or corn kernel with addition of exogenous
amyloglucosidase resulted in adequate fermentation, as evidenced by pH and lactic acid
concentration. Increase DM loss, hydrolyze of starch, and fraction A, without alteration on kd or
DM degradability. These results suggest that longer storage length is warranted to improve DM
66
degradability of rehydrated kernel silage. The ensilage of sorghum improved the quality of kernel
making it similar to corn.
References Aguerre, M., Cajarville, C., & Repetto, J.L. (2015). Impact of water addition, germination ensiling
and their association on sorghum grain nutritive value. Animal Feed Science and
Technology. 205, 75-81.
Andrade Filho, R., R. B. Reis, M. N. Pereira, and M. Antenor. (2010). Degradabilidade ruminal in
situ de grãos de milho maduros do tipo flint ou dentado, secos ou reconstituídos e ensilados.
Anais da 47a reunião anual da sociedade brasileira de zootecnia. Anais...Salvador, BA.
AOAC International. (2012). Official Methods of Analysis. 19th ed. AOAC International,
Arlington, VA.
Baker, S., and T. Herrman. (2002). Evaluating particle size. MF-2051. Kansas State Univ.,
Manhattan.
Carvalho, B.F., Ávila, C.L.S., Pinto, J.C., Pereira, M.N., & Schwan, R.F. (2012) Effects of
propionic acid and Lactobacillus buchneri (UFLA SIL 72) addition on fermentative and
microbiological characteristics of sugar cane silage treated with or without calcium oxide.
Grass Forage Science, 67, 462–471.
Carvalho, B.F., Ávila, C.L.S., Bernardes, T.F., Pereira, M.N., Santos, C., & Schwan, R.F. (2016).
Fermentation profile and identification of lactic acid bacteria and yeasts of rehydrated corn
kernel silage. Journal of Applied Microbiology. 122, 589-600.
JECFA. (2002). Joint FAO/WHO Expert Committee on Food Additives. Compendium of food
additive specifications, addendum 9. FAO Food and Nutrition Paper, No. 52, Add. 9, 2002,
p 193.
Gates, R. (2010). Enzymes and Reagents for Ethanol Research. In Technical content: Enzymes
and Reagents for Alternative Energy. 5,1-10.
Giuberti, G., Gallo, A., Masoero, F., Ferraretto, L. F., Hoffman, P. C., & Shaver, R. D. (2014).
Factors affecting starch utilization in large animal food production system: A review.
Starke. 66, 72–90.

67
Ferraretto, L. F., Fredin, S. M., & Shaver, R. D. (2015). Influence of ensiling, exogenous protease
addition and bacterial inoculation on fermentation profile, nitrogen fractions and ruminal
in vitro starch digestibility in rehydrated and high-moisture corn. Journal of Dairy
Science.98, 7318-7327.
Hall, M. B. (2015). Determination of dietary starch in animal feeds and pet food by an enzymatic-
colorimetric method: Collaborative study. Journal ofAssociation of Official Analytical
Chemists. 98, 397-409.
Heinl S., Wibberg D., Eikmeyer F., Szczepanowski R., Blom J., Linke B., Goesmann A., Grabherr
R., Schwab H., Puhler A. and Schluter A. (2012) Insights into the completely annotated
genome of Lactobacillus buchneri CD034, a strain isolated from stable grass silage.
Journal of Biotechnology, 161, 153– 166.
Hoffman, P.C., Esser, N.M., Shaver, R.D., Coblentz, W.K., Scott, M.P., Bodnar, A.L., Schmidt,
R.J., & Charley, R.C. (2011) Influence of ensiling time and inoculation on alteration of the
starch-protein matrix in high-moisture corn. Journal of Dairy Science, 94, 2465-2474.
Junges, D., G. Morais, M. H. F. Spoto, P. S. Santos, A. T. Adesogan, L. G. Nussio, and J. L. P.
Daniel. (2017). Short communication: Influence of various proteolytic sources during
fermentation of reconstituted corn grain silages. J. Dairy Sci. 100:9048-9051.
Mcdonald, P., Henderson, A.R., & Heron, S.J.E. (1991) The biochemistry of silage. Marlow,
Chalcomb Publication.
Motta, V. T. (2011). Bioquímica Básica. 2. ed. Rio de Janeiro, RJ: Medbook.
Muck, R.E. (2010) Silage microbiology and its control through additives. Revista Brasileira de
Zootecnia, 39, 183-191.
Nellis, S.E., Hoffman, P.C., & Shaver, R. D. (2013) A modified method to quantify prolamin
proteins in dry and high-moisture corn. Journal of Dairy Science, 96, 4647-4652.
Novozymes (2015). Healthier fermentation and healthier profits with NovozymesSanferm® Yield,
2015, from http://www.novozymes.com/en/solutions/food-and-beverages/casestudies-on-
Food-Beverages/Pages/Healthier-fermentation-and-healthier-profits-with-Novozymes-
Sanferm®-Yield.aspx.
Oude Elferink S.J.W.H., Krooneman J., Gottschal J.A., Spoelstra S.F. and Faber F. (2001)
Anaerobic conversion of lactic acid to acetic acid and 1,2propanediol by Lactobacillus
buchneri. Applied and Environmental Microbiology, 67, 125–132.
68
Pahlow, G., Muck, R. E., Driehuis, F., Oude Elferink, S. J. W. H., & Spoelstra, S. F. (2003).
Microbiology of ensiling. Pages 31–93 in Silage Science and Technology. D. R. Buxton,
R. E. Muck, and J. H Harrison, ed. American Society of Agronomy, Madison, WI.
Rezende, A. V., Rabelo, C. H. S., Veiga, R. M., Andrade, L. P., Harter, C. J., Rabelo, F. H. S.,
Basso, F. C., Nogueira, D. A., & Reis, R. A. (2014). Reydratation of corn grain with acid
whey improves the silage quality. Animal Feed Science and Technology. 197, 213-221.
Rooney, L. W.; Pflgfelder, R. L. (1986). Factors affecting starch digestibility with special
emphasis on sorghum and corn. Journal of Animal Science, Champaing, v.63 p. 1607-
1623,
Theurer, C.B. (1986) Grain processing effects on starch utilization by ruminants. Journal of
Animal Science, 63, 1649-1662.
Tylutki, T. P., Fox, D. G., Durbal, V. M., Tedeschi, L. O., Russell, J. B., Van Amburgh, M. E.,
Overton, T. R., Chase, L. E., & Pell, A. N. (2007). Cornell Net Carbohydrate and Protein
System: A model for precision feeding of dairy cattle. Animal Feed Science and
Technology. 143, 174-202.
Van Soest, P. J., J. B. Robertson, and B. A. Lewis. (1991). Methods for dietary fiber, neutral
detergent fiber, and nonstarch polysaccharides in relation to animal nutrition. J. Dairy Sci.
74:3583-3597.
Wilson, R. F., J. M. A. Tilley, and A. Mar1a. (1964) Comparison of oven drying and toluene
distillation in the determination of the dry-matter content of silage. J. Sci. Fd Agric. 15:197-
200.
Woolford, M. K. (1984) The silage fermentation. New York: Marcel Dekker, 2 ed. 350 p.
Zhang, B., Dhital, S., & Gidley, M. J. (2013). Synergistic and Antagonistic Effects of α ‑ Amylase
and Amyloglucosidase on Starch Digestion. Biomacromolecules. 14, 1945–1954.

69
Table 1. Nutrient composition and particle size of ground sorghum and corn kernel before ensiling
Sorghum Corn
DM, % of as fed 90.2 ± 0.1 89.6 ± 0.2
NDF, % of DM 17.5 ± 1.1 18.3 ± 0.9
ADF, % of DM 5.5 ± 1.8 4.5 ± 0.6
Starch, % of DM 57.5 ± 2.5 68.6 ± 1.1
Free Glucose, % of DM 3.2 ± 1.8 4.0 ± 2.3
EE, % of DM 1.8 ± 0.2 4.0 ± 0.6
Ash, % of DM 1.3 ± 0.2 1.0 ± 0.2
Prolamin, % of starch 7.4 ± 1.2 9.4 ± 2.5
Ruminal fractional disappearance rate of Fraction B, % h-1 3.1 ± 0.4 3.3 ± 0.6
Effective ruminal disappearance ERD 6.52, % of DM 51.4 ± 3.7 48.6 ± 3.6
Geometrical mean particle size,1 µm 129.0 ± 1.4 210.6 ± 45.7
% retained on sieve
4000 µm 0.0 ± 0.0 0.1 ± 0.1
2000 µm 1.6 ± 2.3 0.1 ± 0.2
1200 µm 2.8 ± 4.7 9.0 ± 13.3
600 µm 33.2 ± 7.4 30.2 ± 8.5
300 µm 31.5 ± 6.1 41.8 ± 13.5
150 µm 19.0 ± 7.1 14.0 ± 11.5
Bottom pan 12.0 ± 0.6 4.9 ± 2.9
Surface area, cm2/g 76.7 ± 0.4 59.5 ± 3.8 1Kansas State University: MF-2051. Baker & Herman (2002) 2ERD = Fraction A + Fraction B × [kd / (kd + kp), kp estimated by the Cornel Net Carbohydrate
and Protein System, 7.47 % h-1 (Tylutki et al., 2008)

70
Table 2. Dry matter (DM), starch, glucose, prolamin, and ammonia-N content, DM loss and starch during ensiling, and kinetics of
ruminal DM degradation of rehydrated corn or sorghum kernel silage with 30 or 180 d, and addition of amyloglucosidase (AMG),
amyloglucosidase (GAM), and Control (CON)
Kernel (K) Sorghum Corn P
Enzyme (E) CON AMG GAM CON AMG GAM SEM K E D
Duration (D) 30 180 30 180 30 180 30 180 30 180 30 180
DM, % of fresh 66.96 64.91 66.50 62.68 66.34 62.79 67.51 65.18 66.74 62.91 66.14 62.86 0.838 0.34 <0.01 <0.01
DM loss, % of DM 0.64 4.28 3.85 10.51 3.04 9.21 3.24 6.94 4.26 12.36 3.76 10.07 1.756 <0.01 <0.01 <0.01
Starch, % of DM 62.92 51.28 58.90 48.79 56.96 48.02 64.07 61.16 57.14 49.33 55.81 50.73 3.741 0.23 <0.01 <0.01
Starch loss, % of starch 2.04 12.15 4.27 22.08 12.36 28.48 10.77 17.58 19.35 35.65 25.35 34.45 4.43 <0.01 <0.01 <0.01
Glucose free, % of DM 0.653 1.821 2.254 4.295 2.804 2.569 2.190 0.547 3.495 6.115 2.428 2.985 0.6441 0.02 <0.01 <0.01
Prolamin, % Starch 8.21 7.21 8.83 6.19 8.04 7.33 9.01 7.01 7.76 5.96 8.68 5.39 1.091 0.42 0.37 <0.01
Ammonia-N, % of DM 0.058 0.122 0.050 0.088 0.061 0.118 0.046 0.093 0.046 0.079 0.041 0.070 0.0130 <0.01 0.10 <0.01
Deg 0, % of DM 35.03 39.97 37.63 45.33 38.74 41.89 25.05 34.67 30.83 38.90 30.24 35.42 2.207 <0.01 0.02 <0.01
Deg 3, % of DM 43.26 51.28 44.30 50.69 45.30 51.32 32.82 47.44 36.20 47.63 37.29 45.67 2.717 <0.01 0.80 <0.01
Deg 6, % of DM 47.01 57.43 47.02 55.18 48.10 54.46 39.08 57.51 40.04 51.73 41.57 52.69 3.393 0.03 0.76 <0.01
Deg 12, % of DM 52.62 59.04 53.29 58.92 56.46 60.61 47.48 61.83 51.14 60.29 52.77 58.87 3.040 0.42 0.66 <0.01
Deg 18, % of DM 57.86 65.28 59.40 62.78 61.41 65.83 53.71 68.33 56.72 65.77 56.67 62.25 2.434 0.28 0.98 <0.01
Deg 48, % of DM 85.14 88.19 85.78 87.52 86.22 87.91 84.40 89.37 84.78 88.05 84.04 87.23 1.274 0.51 0.89 <0.01
kd, % h-1 3.05 3.23 3.10 3.11 3.12 3.23 3.32 3.61 3.23 3.35 3.22 3.27 0.161 <0.01 0.42 0.06
ERD 6.5%1, % of DM 55.69 59.98 57.65 62.82 58.56 61.03 50.18 57.95 53.67 59.68 53.03 56.99 1.782 <0.01 0.17 <0.01 1 Effective degradation of DM assuming kp of 6.5%/h. ERD 6.5% = A + B * [kd / ( kd + kp)].
Significantly interaction was shown in figure.

71
Table 3. Silage pH, lactic acid bacteria (LAB), organic acids and alcohol content of rehydrated corn or sorghum kernel silage with 30
or 180 d, and addition of amyloglucosidase (AMG), amyloglucosidase (GAM), and Control (CON)
Kernel (K) Sorghum Corn P
Enzyme (E) CON AMG GAM CON AMG GAM SEM K E D
Duration (D) 30 180 30 180 30 180 30 180 30 180 30 180
pH 4.18 3.74 4.12 3.72 4.38 3.80 4.05 3.71 4.15 3.76 4.14 3.71 0.119 0.02 0.03 <0.01
Lactic, % of DM 4.18 12.99 6.08 9.52 5.03 15.04 8.46 7.06 3.00 7.80 3.73 6.37 4.075 0.05 0.64 < 0.01 Propionic, % of DM 0.11 3.56 0.07 0.89 0.09 1.49 0.08 0.98 0.04 0.70 0.03 0.56 0.475 < 0.01 < 0.01 < 0.01 Acetic, % of DM 0.10 0.11 0.02 0.07 0.03 0.15 0.03 0.06 0.01 0.05 0.01 0.04 0.028 < 0.01 0.02 < 0.01 Butyric, % of DM 0.00 0.72 0.00 0.24 0.00 0.46 0.00 0.06 0.02 0.19 0.05 0.17 0.084 < 0.01 0.07 < 0.01 Total acids, % of DM 4.40 17.38 6.18 10.73 5.16 17.14 8.57 8.16 3.07 8.74 3.83 7.13 2.511 0.02 0.40 < 0.01
1,2 propanodiol 2.00 3.66 1.54 2.95 1.88 5.19 1.64 2.05 1.06 2.14 0.62 1.28 0.911 < 0.01 0.51 < 0.01
Ethanol 0.53 0.67 0.70 1.20 0.61 0.87 0.71 0.73 0.65 1.43 0.81 1.59 0.155 < 0.01 <0.01 < 0.01
LAB, log CFU/g 5.07 3.52 5.22 2.32 4.92 <2.0 6.83 3.53 6.62 <2.0 6.02 <2.0 0.458 <0.01 <0.01 <0.01
Significantly interaction was shown in figure.

72
Figure 1. Interaction between amyloglucosidase addition, and duration of storage length on DM
(panel A; P < 0.01; SEM = 0.942) in rehydrated sorghum or corn kernel silage. Interaction between
amyloglucosidase addition, and duration of storage length on DM loss (panel B; P < 0.01; SEM =
1.983) in rehydrated sorghum or corn kernel silage. Treatments were rehydrated sorghum or corn
kernel ensiled with amyloglucosidase (AMG or GAM) or without (C), and duration of storage
length (30 or 180 days).
67.24
a
65.04
c
66.62
ab
62.79
d
66.24
b
62.83
d
62
64
66
68
70
CON
30
CON
180
AMG
30
AMG
180
GAM
30
GAM
180
DM
, %
of
fres
h
A
1.94
e
5.62
c 4.06
d
11.43
a
3.40
d
9.64
b
0
4
8
12
16
CON
30
CON
180
AMG
30
AMG
180
GAM
30
GAM
180
DM
loss
, %
of
DM
B

73
Figure 2. Interaction between kernel, amyloglucosidase addition, and duration of storage length
on free glucose (P < 0.01; SEM = 0.594) in rehydrated sorghum or corn kernel silage. Treatments
were rehydrated sorghum (Sor) or corn (Cor) kernel ensiled with amyloglucosidase (AMG or
GAM) or without (C), and duration of storage length (30 or 180 days).
0.65
e
1.82
de
2.25
d
4.30
b2.80
cd2.57
d2.19
d
0.55
ef
3.50
bc
6.11
a
2.43
cd
2.99
cd
0
2
4
6
8
Sor
CON
30
Sor
CON
180
Sor
AMG
30
Sor
AMG
180
Sor
GAM
30
Sor
GAM
180
Cor
CON
30
Cor
CON
180
Cor
AMG
30
Cor
AMG
180
Cor
GAM
30
Cor
GAM
180
Glu
cose
fre
e, %
of
DM
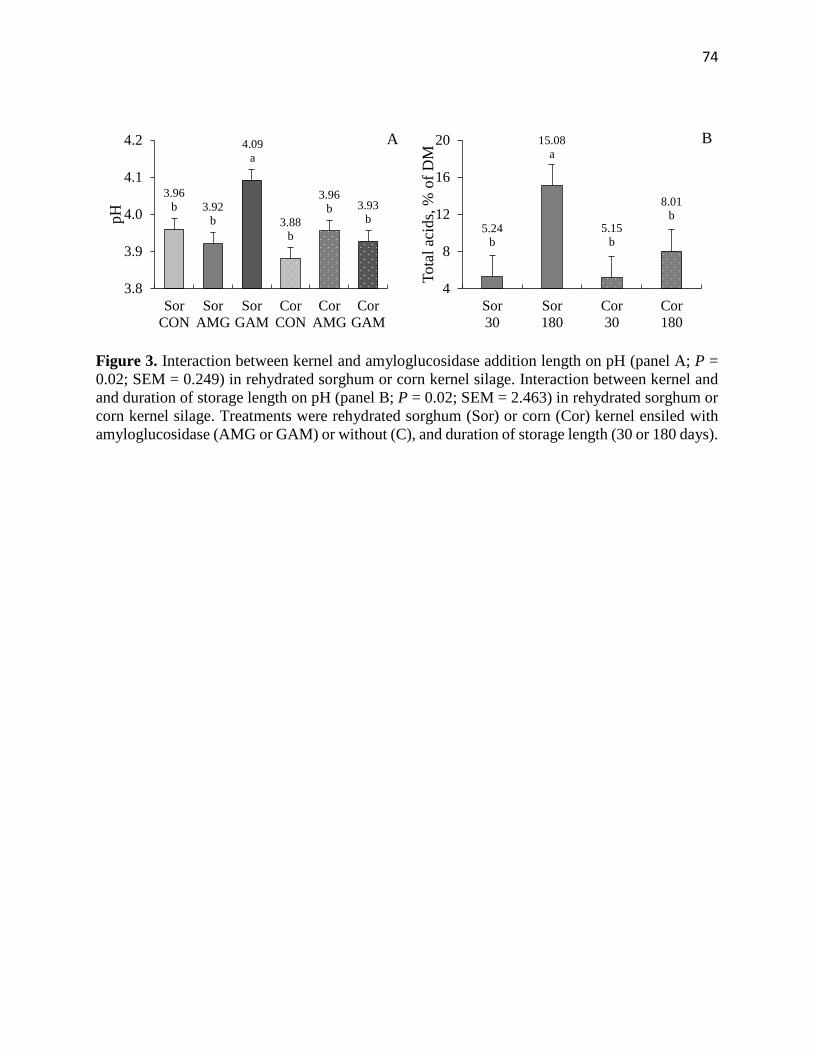
74
Figure 3. Interaction between kernel and amyloglucosidase addition length on pH (panel A; P =
0.02; SEM = 0.249) in rehydrated sorghum or corn kernel silage. Interaction between kernel and
and duration of storage length on pH (panel B; P = 0.02; SEM = 2.463) in rehydrated sorghum or
corn kernel silage. Treatments were rehydrated sorghum (Sor) or corn (Cor) kernel ensiled with
amyloglucosidase (AMG or GAM) or without (C), and duration of storage length (30 or 180 days).
3.96
b 3.92
b
4.09
a
3.88
b
3.96
b 3.93
b
3.8
3.9
4.0
4.1
4.2
Sor
CON
Sor
AMG
Sor
GAM
Cor
CON
Cor
AMG
Cor
GAM
pH
A
5.24
b
15.08
a
5.15
b
8.01
b
4
8
12
16
20
Sor
30
Sor
180
Cor
30
Cor
180
Tota
l ac
ids,
% o
f D
M
B

75
Figure 4. Interaction between kernel, amyloglucosidase addition, and duration of storage length
on propionic acid (panel A; P = 0.02; SEM = 0.3878), and butyric acid (panel B; P < 0.01; SEM
= 0.0684) in rehydrated sorghum or corn kernel silage. Treatments were rehydrated sorghum (Sor)
or corn (Cor) kernel ensiled with amyloglucosidase (AMG or GAM) or without (C), and duration
of storage length (30 or 180 days).
0.12
de
3.56
a
0.07
e
0.89
bcd0.09
e
1.49
b
0.08
e
0.98
bc0.04
e
0.70
bcde 0.03
e
0.56
cde
0.0
1.0
2.0
3.0
4.0
5.0
Sor
CON
30
Sor
CON
180
Sor
AMG
30
Sor
AMG
180
Sor
GAM
30
Sor
GAM
180
Cor
CON
30
Cor
CON
180
Cor
AMG
30
Cor
AMG
180
Cor
GAM
30
Cor
GAM
180
Pro
pio
nic
aci
d, %
of
DM
A
0.00
e
0.72
a
0.00
e
0.24
c
0.00
e
0.46
b
0.00
e
0.06
de0.02
e
0.19
cd0.05
de
0.17
cd
0.0
0.2
0.4
0.6
0.8
1.0
Sor
CON
30
Sor
CON
180
Sor
AMG
30
Sor
AMG
180
Sor
GAM
30
Sor
GAM
180
Cor
CON
30
Cor
CON
180
Cor
AMG
30
Cor
AMG
180
Cor
GAM
30
Cor
GAM
180
Buty
ric
acid
, %
of
DM
B
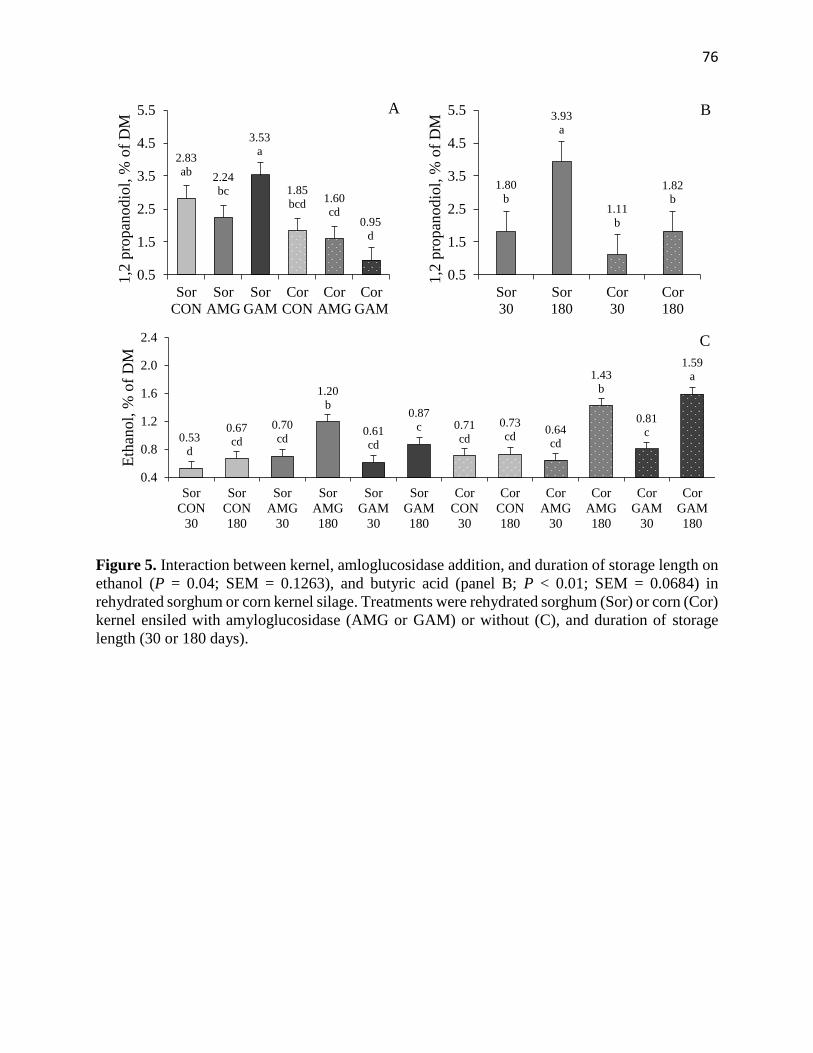
76
Figure 5. Interaction between kernel, amloglucosidase addition, and duration of storage length on
ethanol (P = 0.04; SEM = 0.1263), and butyric acid (panel B; P < 0.01; SEM = 0.0684) in
rehydrated sorghum or corn kernel silage. Treatments were rehydrated sorghum (Sor) or corn (Cor)
kernel ensiled with amyloglucosidase (AMG or GAM) or without (C), and duration of storage
length (30 or 180 days).
2.83
ab2.24
bc
3.53
a
1.85
bcd1.60
cd0.95
d
0.5
1.5
2.5
3.5
4.5
5.5
Sor
CON
Sor
AMG
Sor
GAM
Cor
CON
Cor
AMG
Cor
GAM
1,2
pro
pan
odio
l, %
of
DM
A
1.80
b
3.93
a
1.11
b
1.82
b
0.5
1.5
2.5
3.5
4.5
5.5
Sor
30
Sor
180
Cor
30
Cor
180
1,2
pro
pan
odio
l, %
of
DM
B
0.53
d
0.67
cd
0.70
cd
1.20
b
0.61
cd
0.87
c 0.71
cd
0.73
cd0.64
cd
1.43
b
0.81
c
1.59
a
0.4
0.8
1.2
1.6
2.0
2.4
Sor
CON
30
Sor
CON
180
Sor
AMG
30
Sor
AMG
180
Sor
GAM
30
Sor
GAM
180
Cor
CON
30
Cor
CON
180
Cor
AMG
30
Cor
AMG
180
Cor
GAM
30
Cor
GAM
180
Eth
anol,
% o
f D
M
C
77
4 ARTIGO 2: Microbiota in corn and sorghum kernels rehydrated and ensiled with
amyloglucosidase addition
Artigo formatado de acordo com normas da revista Journal of Dairy Science
Disponível em:
http://www.journalofdairyscience.org/pb/assets/raw/Health%20Advance/journals/jods/2016_SF.
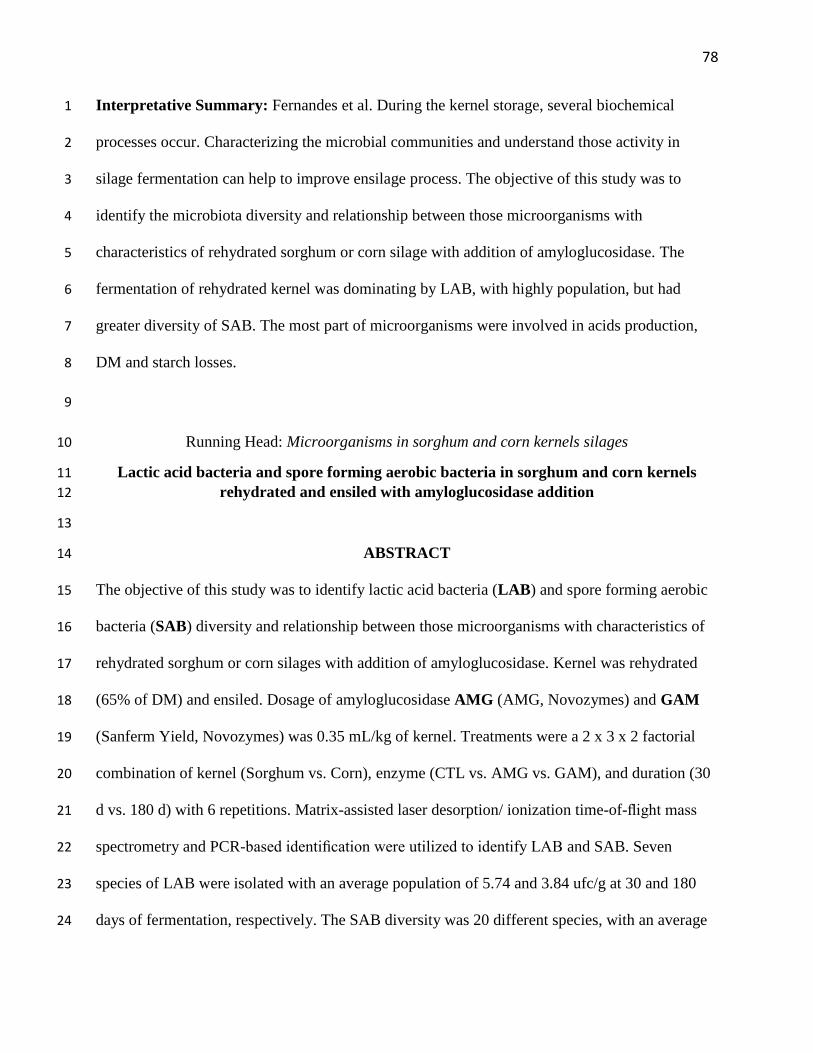
78
Interpretative Summary: Fernandes et al. During the kernel storage, several biochemical 1
processes occur. Characterizing the microbial communities and understand those activity in 2
silage fermentation can help to improve ensilage process. The objective of this study was to 3
identify the microbiota diversity and relationship between those microorganisms with 4
characteristics of rehydrated sorghum or corn silage with addition of amyloglucosidase. The 5
fermentation of rehydrated kernel was dominating by LAB, with highly population, but had 6
greater diversity of SAB. The most part of microorganisms were involved in acids production, 7
DM and starch losses. 8
9
Running Head: Microorganisms in sorghum and corn kernels silages 10
Lactic acid bacteria and spore forming aerobic bacteria in sorghum and corn kernels 11
rehydrated and ensiled with amyloglucosidase addition 12
13
ABSTRACT 14
The objective of this study was to identify lactic acid bacteria (LAB) and spore forming aerobic 15
bacteria (SAB) diversity and relationship between those microorganisms with characteristics of 16
rehydrated sorghum or corn silages with addition of amyloglucosidase. Kernel was rehydrated 17
(65% of DM) and ensiled. Dosage of amyloglucosidase AMG (AMG, Novozymes) and GAM 18
(Sanferm Yield, Novozymes) was 0.35 mL/kg of kernel. Treatments were a 2 x 3 x 2 factorial 19
combination of kernel (Sorghum vs. Corn), enzyme (CTL vs. AMG vs. GAM), and duration (30 20
d vs. 180 d) with 6 repetitions. Matrix-assisted laser desorption/ ionization time-of-flight mass 21
spectrometry and PCR-based identification were utilized to identify LAB and SAB. Seven 22
species of LAB were isolated with an average population of 5.74 and 3.84 ufc/g at 30 and 180 23
days of fermentation, respectively. The SAB diversity was 20 different species, with an average 24

79
population of of 3.18 and 2.72 ufc/g at 30 and 180 days of fermentation, respectively. The 25
greatest diversity of micro-organisms was present with 30 days of fermentation. The population 26
of LAB and most part of SAB were corelated with acids and nutrient losses and negatively 27
correlation with pH, DM and starch content. Three SAB were corelated with prolamin content. 28
The fermentation of rehydrated kernel was dominating by LAB, with highly population, but had 29
greater diversity of SAB. The most part of microorganisms were involved in acids production, 30
DM and starch losses. 31
Palavras chave: fermentation, kernel silage, microorganisms 32
33
80
INTRODUCTION 34
The rehydration and ensilage of corn and sorghum kernels, are practices that pursuit 35
improving the digestibility of starch (Gobetti et al., 2013), making better use of the Brazilian 36
corn, which has hard endosperm of high vitreousness, with lower digestibility for cattle (Correa 37
et al., 2002) and improve the quality of sorghum starch. A way to counteract the negative effect 38
of hard texture of the endosperm on the digestibility of starch kernels in the mature stage. The 39
processing of kernels, which are a source of starch, usually aim to improve ruminal degradation 40
of starch (Hale, 1973). 41
During the kernel storage several biochemical processes occur, causing modifications in 42
the material, and thus in the nutritional, chemical and microbiological quality of these silages. 43
The prolamins involving the starch granules are hydrolyzed, by microbial enzymes (Hoffman et 44
al., 2011). The proteolysis from microbial enzymes corresponds to 60.4% of proteolysis which 45
occurs during the fermentation process of silage (Junges et al., 2017). However, we do not know 46
which species of micro-organisms are involved in this process, since LAB has low proteolytic 47
activity (McDonald et al., 1991). Addition of inoculant (L. buchneri) can altered the hydrolysis 48
of prolamin and improve digestibility of starch, but when inoculant based on L.plantarum and P. 49
pentosaceus were added, did not change digestibility of starch (Silva et al., 2018). The use of 50
exogenous enzymes as additive at ensilage can reduce the fermentation duration for improve 51
digestibility (Ferraretto et al., 2015). The amyloglucosidase hydrolyses starch molecule to 52
monosaccharaides and disaccharides, and disrupts the helical links facilitating the hydrolysis by 53
other enzymes (Zhang et al., 2013). The availability of glucose can change the microorganisms 54
diversity during silage fermentation. 55
81
In this way, characterizing the microbial communities present in silage may help to 56
understand silage fermentation, to enables improve the quality of silages by intervene in the 57
fermentation process (Carvalho et al., 2016). The fermentation microbiota of reiterated corn 58
silage was already characterized by Carvalho et al., (2016), but there are no studies detailing the 59
microbiota involved during ensiling of rehydrated sorghum kernel or evaluate the relationship 60
between microbiota and starch degradation. The aim of this study was to identify microbiota 61
diversity and to evaluate the relationship between microorganisms and improvement dry matter 62
degradation during storage length of rehydrated sorghum or corn with addition of 63
amyloglucosidase. 64
MATERIALS AND METHODS 65
Kernel and ensilage conditions 66
The samples for microorganism evaluation, and data (Table 1), used in this study were 67
derived from previous experiment conducted by Fernandes et al., (Artigo 1). The enzyme used in 68
the ensilage was AMG - Amyloglucosidase from Aspergillus niger had high activity at 40 to 69
50oC and pH 4.8 to 5, with 300 AGU mL-1 (Novozymes Latin America Ltda, Araucária, PR, 70
Brasil) or GAM -amyloglucosidase from Aspergillus niger had good activity at 55oC and pH 4.5, 71
with 138 AGU mL-1 (Sanferm Yield, Novozymes Latin America Ltda,Araucária, PR, Brasil). 72
Treatments were kernel type (Sorghum vs. Corn), enzyme (control-CON vs. amyloglucosidase-73
AMG vs. amyloglucosidase-GAM), and duration of silage storage (30 vs. 180 d), was carried out 74
in randomized blocks, each block corresponded to a day of ensilage, with three replicates in each 75
block. 76
Microbiological analyses 77
82
Enumeration of micro-organisms was obtained from the aliquot of the aqueous extract. 78
To obtain the aqueous extract, a 25-g sample of kernel silage was blended in 225 mL of peptone 79
water (0.1%) and homogenized in a shaker for 10 min. Sequential 10-fold dilution was prepared. 80
Yeasts and filamentous fungi were enumerated on Dichloran Rose Bengal 81
Chloramphenicol Medium (DRBC, Difco, Becton Dickinson, Sparks, MD, USA), were 82
incubated at 28 °C for 72 h. For enumeration of lactic acid bacteria (LAB), pour plating on the 83
Man Rogosa Sharpe – Difco (MRS) agar plus nystatin (4 mL L-1) was used. For enumeration of 84
spore forming aerobic bacteria (SAB), a sample of aqueous extracts was maintained at 80°C for 85
10 min, and further decimal dilutions were plated onto Nutrient Agar medium (HiMedia 86
Laboratories, Mumbai, India). The plates were incubated at 30°C for 72 h. Colonies were 87
counted on plates containing a minimum of 30 and a maximum of 300 colony-forming units 88
(CFU). 89
After counting the bacteria grown in MRS medium and Nutrient Agar medium, the 90
square root of each morphotype were isolated and subjected to the tests of Gram stain, cellular 91
shape, catalase production, oxidase production and motility. Subsequently subjected to gas 92
production from MRS (Drosinos et al., 2006). 93
Matrix-assisted laser desorption/ionization time-of-flight mass spectrometry (MALDI-94
TOF MS) analysis was used to group and identify the bacteria according to their protein profile. 95
Measurements were performed with an ultrafleXtreme (Bruker Daltonics; Bremen, Germany) 96
following the procedure prescribed by Carvalho et al. (2016). 97
The 258 strains isolated from MRS medium and 108 SAB strains were analyzed using 98
MALDI-TOF MS. Following the cluster analysis of the MALDI-TOF MS spectrum. 99

83
For identification of Pediococcus pentosaceus and Ped. acidilactici the growing test at 100
50°C was accomplished (Tanasupawat et al., 1993). The Lactobacillus pentosus, Lac. 101
paraplantarum and Lac. plantarum, were separated by acid production from melezitose and 102
dulcitol test (Bringel et al., 2001; Curke et al., 1996). For Lac. buchneri and Lac. brevis the test 103
of melezitose fermentation was accomplished (Rogosa et al., 1970). 104
For SAB other test were used to identification. Acids from sorbitol, melibiose and starch 105
were used for separate Bacillus atrophaeus, Bac. mojavensis, Bac. subtilis and Bac. vallismortis 106
(Ruiz-Garcia et al., 2005). Growth at medium with concentration of 5, 7, and 10% of NaCl for 107
identification of Bac. sonorensis and Bac. licheniformis (Palmisano et al., 2001). Citrate 108
utilization, and D-sorbitol and melibiose as carbon source were used for characterization of Bac. 109
pumilus, Bac. safensis, Bac. aerophilus, Bac altitudinis, and Bac stratosphericus (Satomi at al., 110
2006; Shivaji et al., 2006). Growth at medium with concentration of 7% of NaCl also used for 111
Lysinobacillus boronitolerans, Lys. fusiformis and Lys. sphaericus (Ahmed et al., 2007). 112
Statistical analysis 113
The principal component analyses (PCA) were performed using STATISTICA 8.2 (Cary, 114
CN, USA, 2002) for grouping the data of silage characteristics, fermentation end products, and 115
BAL and SAB community. For analyses the PCA silage characteristics and fermentation end 116
products were used as active data, and population of bacteria was used as supplementary data, to 117
identify the comportment of bacteria related with silage characteristic (Vicini, 2005). Average of 118
data obtained in different treatments from Fernandes et al. (Artigo 1) in silages of sorghum or 119
corn, with addition of two kinds of amiloglucosidase and ensiled for 30 and 180 days. 120
121

84
RESULTS 122
A total of 258 isolates were selected from MRS media and were characterized in terms of 123
cell morphology and biochemical features (Table 2) and them, a total of 108 isolates were 124
selected from AN media using the same characteristics (Table 3). The population of yeast and 125
filamentous fungi remained below the detection level. After purification, the isolates were 126
analyzed and grouped according to their protein expression profile by MALDI-TOF MS, for each 127
rehydrated kernel (sorghum or corn) silage and each isolation media (Figure 1, 2, 3, and 4), each 128
group corresponding a one specie, or more than one specie closely related. Seven different LAB 129
species were identified from the MRS medium (Table 2). Twenty different SAB species were 130
identified from AN medium (Table 3). 131
Lactobacillus plantarum was present at 30 days of silage, in all treatments (CON, AMG, 132
and GAM) and in both kernel silages, but greater population in corn kernel silage 5.07 log 133
UFC/g than sorghum kernel silage 4.13 log UFC/g. At 180 days of fermentation the population 134
of Lac. plantarum remained below 2 log UFC/g (Table 4). The identification of Lac. plantarum 135
was made by acid production from melezitose and none production from dulcitol (Table 2). 136
Some strains of Pediococcus acidilactici and Ped. pentosaceus were grouped near Lac. 137
plantarum and Lac. brevis, most of the strains identified as Ped. acidilactici was grouped 138
separately in the sorghum silage (Figure 1), but in the corn silage Ped. acidilactici and Ped. 139
pentosaceus were grouped together (Figure 2). For correct identification between Ped. 140
acidilactici and Ped. pentosaceus the growth at 50°C was used, because the Ped. acidilactici can 141
growth in this temperature and Ped. pentosaceus not. The population of Ped. acidilactici and 142
Ped. pentosaceus were greater in corn than in sorghum, and Ped. acidilactici was present at 180 143
days of CON corn silage but reduce below detectable in other treatments. 144

85
The Lac. brevis and Lac. buchneri isolates from silages with 30 days of fermentation 145
were grouped together by protein expression profile evaluated in MALDI-TOF MS, the acid 146
production from melezytose was used for differentiation between this strain, Lac. brevis from 147
silages with 180 days of fermentation were grouped separated, tow group for sorghum and one 148
group for corn. One distinct group of MALDI TOF was not identify by processed with the 149
MALDI Biotyper 3.0. This group was present only in sorghum silage at 180 days of 150
fermentation, with low population 1.3 log UFC/g (Table 4). The Lac. parabuchneri was only 151
identified from CON corn silage at 180 days of fermentation, with low population 0.82 log UFC 152
per g. 153
Three groups of SAB (Bac. kochii, Bac. velezensis, Pae. lautus), present only in sorghum 154
silage were not identified by MALDI Biotyper 3.0 (Figure 3), for identification of this strains the 155
sequence of 16S RNA gene was necessary. The other group in sorghum dendogram was formed 156
by Lysinobacillus boronitolerans and Lys. sphaericus (Figure 3), for the corn silage the MALDI 157
Biotyper 3.0 was grouped both species of Lysinobacillus in the same group (Figure 4). 158
Lysinobacillus boronitolerans cannot hydrolyzes the urea and growth in NaCl 7%, and Lys. 159
sphaericus cannot hydrolyzes the urea and cannot growth in NaCl 7%, these tests were used for 160
identification of this species (Table 3). From species of Bacillus megaterium, Bac. circulan, 161
Paenibacillus macerans, Pae. rhizosphaerae, Bac. claussi, Bac. oleronius, only one strain was 162
identified in sorghum silage. Only one strain of Pae. lautus, Bac. circulans, Brevibacillus 163
invocatus (Previous named as Bacillus invocatus), and Bac. vallismortis were identified in corn 164
silage. 165
The Bac. atrophaeus and Bac. vallismortis were grouped together in more than one group 166
of sorghum and corn silage dendogram (Figures 3 and 4), for correct identification tests of acid 167

86
production from sorbitol, melibiose and starch (Table 3). Most part of isolated of Bac. 168
atrophaeus specie, 68% (strains 46, 47, 54, 58, 60, 75-78), were from corn silage at 30 days of 169
fermentation (Table 5). 170
One group was identified as Bac. horneckiae present only in sorghum silage CON and 171
treated with AMG enzyme, at 30 days of fermentation (Table 5). The Bac. cereus group were 172
present in sorghum silage CON and in sorghum and corn treated with AMG enzyme, at 30 days 173
of fermentation (Table 5). Bac. licheniformis, were present in sorghum silage at 30 days of 174
fermentation on treatment with AMG enzyme, and at 30 and 180 days of fermentation on 175
treatment with GAM enzyme. Only one strain of Bac. licheniformis, was present in CON corn 176
silage at 30 days (Table 5). The growth at medium with concentration of 5, 7, and 10% of NaCl 177
was used to confirm the identification of Bac. licheniformis (Table 3). 178
Bac. pumilus were divided in tow groups in sorghum silage (Figure 3) and one group in 179
corn silage (Figure 4), this is the only specie present in all treatments and fermentation days for 180
both silages. For correct identification of Bac. pumilus the test of citrate utilization, and D-181
sorbitol and melibiose as carbon source were used. The Brevibacillus brevis (Previous named as 182
Bacillus brevis) were only identified in sorghum silage treated with AMG, at 180 days of 183
fermentation, and in the corn silage this specie was present in all treatments and days, except at 184
180 days of CON. 185
The factor 1 and factor 2 of principal components explained 51.60 and 22.09%, 186
respectively, of the total variance (Figure 5). The PCA of treatments based on variables show 187
that corn and sorghum with 30 days of fermentation are grouped more closely than with 180 days 188
of fermentation (Figure 5). The principal characteristics that grouped sorghum silages with 30 189
days of fermentation (Figure 5) were the pH, DM and starch content of silage (Figure 6). The 190
87
sorghum silage CON and with addition of GAM at 180 days of fermentation, were more 191
correlated with acids, and 1,2-propanodiol (Figure 5 and 6). The silages of corn with addition of 192
amyloglucosidase (AMG and GAM) were more correlated with DM loss, starch loss, free 193
glucose and ethanol content. 194
The species of SAB Brevibacillus invocatus, Paenibacillus glucanolyticus (Previous 195
named as Bac. glucanolyticus), and Bre. brevis had positive correlation with prolamin content 196
and content of prolamin had negatively correlation with starch loss, free glucose, kd and ethanol 197
(Figure 6). 198
The group 1 of not identified SAB and Bacillus horneckiae were closely related with 199
DM loss. The Bac. pumilus was the specie of SAB with biggest population but did not shown 200
correlation with characteristic of rehydrated kernel silage. The Bac. licheniphormis were closely 201
related with starch loss, glucose and ethanol content. The soluble fraction (fraction A) of DM 202
was correlates with microorganisms and acids accumulation (Figure 6). 203
204
DISCUSSION 205
There are few studies evaluating the microorganism species in rehydrated kernel, 206
Carvalho et al. (2016) identified the LAB and yeasts diversity of rehydrated corn kernel silage, 207
and Carvalho (2014) evaluate the bacterial community by Denaturing Gradient Gel 208
Eletrophoresis technique, and PCR products sequence, by Ilumina MiseqTMSystem. To our 209
knowledge, this study is the first identification of microorganisms of rehydrated sorghum silage, 210
and the first study to identify the SAB in the rehydrated corn and sorghum kernel silage. 211
In sorghum and corn silages the species Lac. plantarum and Ped. acidilactici are present 212
in all treatments at first days of fermentation, but not on the long fermentation. These species had 213
88
a negative correlation with pH, DM and starch contents that is beneficial for silage quality, since 214
we want low pH value in silage and the lowest concentration of starch indicates that most of the 215
starch was made available to the ruminal degradation, by hydrolyses to glucose. Those 216
microorganisms are used as inoculant in the different silages for reducing the pH and increasing 217
the preservation of DM (EFSA, 2012; 2014). The Ped. pentosaceus shown low population in 218
comparation of Lac. plantarum and Ped. acidilactici, however were reported as responsible for 219
the start of lactic fermentation in rehydrated corn kernel silage (Carvalho et al., 2016). Strains of 220
Lac. buchneri shown low correlation with acetic acid or 1,2 propanediol. Although, some studies 221
report the inoculation of this microorganism can improve the stability of corn silages, by 222
production of acetic acid (Kleinschmit; Kung, 2006) and 1,2 propanediol (Oude Elferink et al., 223
2001). At 180 days of fermentation the Lac. brevis dominated the fermentation; this specie was 224
studied to improve the stability of aerobic exposure EFSA (2016). 225
The microorganisms Bre. brevis, Bre. invocatus and Pae. glucanoliticus are positive 226
related to prolamin content, and had negative correlation to glucose, starch loss, ethanol, and kd. 227
Pae. glucanoliticus hydrolyzed starch and produced acids from glucose (Alexander; Priest, 228
1989), but Bre. brevis and Bre. Invocatus do not ferment glucose or hydrolyze starch (Logan et 229
al., 2002; Nakamura, 1991). According Panda et al. (2014) the genus Brevibacillus shown 230
negligible amount of extracellular protease. This result indicated that Bre. brevis and Bre. 231
invocatus were not involved in broke of prolamin content and making the starch lass susceptible 232
to degradation by other microrganisms, as well Pae. glucanoliticus can consuming part of free 233
glucose. 234
The Bac. licheniformis had correlation with starch loss and free glucose and had 235
negatively correlation with prolamin. For Bac. licheniformis the protease enzyme is highly active 236

89
between pH 7.0 to 12.0, optimum around pH 10.0, but approximated 70% of these proteases 237
remanding activity at pH 4.0, the amylase enzyme is highly active between pH 5.0 and 10.0 with 238
optimum pH around 6.5, and 95% of these proteases remanding activity at pH 4.0 to 9.0 239
(HMIDET et al., 2009). Probably Bac. licheniformis favored the prolamine and starch breakage 240
during the fermentation. 241
In silages with 180 days of fermentation the differences of treatments were more evident, 242
and the silages cannot be grouped together. Silages with more acid production, sorghum CON 243
and GAM (17.38 and 17. 14 % of DM of total acids), were grouped together and silages with 244
more starch and DM loss, corn AMG and GAM (DM loss: 12.36 and 10.07 % DM; starch loss: 245
23.97 and 23.94 % of DM). The most of microorganisms of silage were involved in conversion 246
of carbohydrates to acid, consequently generates losses during the metabolism of this and other 247
compounds (McDonald et al., 1991), because this, most part of microorganism had relationship 248
with acids and nutrient losses resulting in a formation of a microorganism group between acids 249
group and starch and DM loss. 250
The correlation with fraction A and microorganisms and acids accumulation can be 251
explained by Junges et al. (2017) by evaluating of proteolysis during fermentation of silage, the 252
bacterial activity represents 60% and end-products, had lower contributions, approximately 5%. 253
254
CONCLUSIONS 255
The fermentation of rehydrated kernel was dominating by LAB, with highly population, 256
but had greater diversity of SAB. The most part of microorganisms were involved in acids 257
production, DM and starch losses. 258
259

90
ACKNOWLEDGMENTS 260
The authors are also grateful to the National Consul to Scientific and Technologic 261
Development (CNPq; Brasilia, DF, Brazil) and Foundation for Research Support of the State of 262
Minas Gerais (FAPEMIG; MG, Brazil) for the scholarship financial support. 263
264
REFERENCES 265
266 Ahmed, I.; A. Yokota, A. Yamazoe, and T. Fujiwara. 2007. Proposal of Lysinibacillus 267
boronitolerans gen. nov. sp. nov., and transfer of Bacillus fusiformis to Lysinibacillus 268
fusiformis comb. nov. and Bacillus sphaericus to Lysinibacillus sphaericus comb. nov. Int. J. 269
Syst. Evol. Microbiol. 57:1117–1125. 270
Alexander B. and F. G. Priest. 1989. Bacillus glucanolyticus, a New Species That Degrades a 271
Variety of p-Glucans. Int. J. Syst. Evol. Microbiol. 8:112-115. 272
Bringel, F.; P. Quénée, and P. Tailliez. 2001. Polyphasic Investigation of the Diversity within 273
Lactobacillus plantarum Related Strains Revealed Two L. plantarum subgroups. System. 274
Appl. Microbiol. 24:561–571. 275
Carvalho, B. F., C. L. S. Avila, T. F. Bernardes, M. N. Pereira, C. Santos, and R. F. Schwan. 276
2016. Fermentation profile and identification of lactic acid bacteria and yeasts of rehydrated 277
corn kernel silage. J. Appl. Microbiol. 122:589-600. 278
Carvalho, B.F.; C.L.S. Ávila, J.C. Pinto, M.N. Pereira, and R.F. Schwan. 2012. Effects of 279
propionic acid and Lactobacillus buchneri (UFLA SIL 72) addition on fermentative and 280
microbiological characteristics of sugar cane silage treated with or without calcium oxide. 281
Grass For. Sci. 67:462–471. 282
91
Carvalho, P. A. 2014. Influência do genótipo e maturidade na diversidade microbiológica em 283
milho grão para silagem. Dissertation (Mestre Animal Science and Pasture) Escola Superior 284
de Agricultura ‘Luiz de Queiroz’, Universidade de São Paulo, Piracicaba 95p. 285
Correa, C. E. S.; R. D. Shaver, M. N. Pereira, J. G. Lauer, and K. Kohn. 2002. Relationship 286
between corn vitreousness and ruminal in situ starch degradability. J. Dairy Sci., 85:3008–287
3012. 288
Curk, M. C.; J. C. Hubert and F. Bringel. 1996. Lactobacillus paraplantarum sp. nov., a New 289
Species Related to Lactobacillus plantarum. Int. J. Syst. Evol. Microbiol. 46:595-598. 290
Gobetti, S.T.C.; M. Neumann, R. Oliboni, and M. R. Oliveira. 2013. Utilização de silagem de 291
grão úmido na dieta de animais ruminantes. Ambiência, 9:225-239. 292
Drosinos, E. H.; S. Paramithiotis, G. Kolovos, I. Tsikouras, And I. Metaxopoulos. 2006. 293
Phenotypic and technological diversity of lactic acid bacteria and staphylococci isolated 294
from traditionally fermented sausages in Southern Greece. Food Microbiol. 24:260-270. 295
EFSA Panel on Additives and Products or Substances used in Animal Feed (FEEDAP), G. 296
Rychen, G. Aquilina, G. Azimonti, V. Bampidis, M. L. Bastos, G. Bories, A. Chesson, P. 297
Sandro Cocconcelli, G. Flachowsky, J. Gropp, B. Kolar, M. Kouba, S. L. Puente, M. Lopez-298
Alonso, A. Mantovani, B. Mayo, F. Ramos, R. E. Villa, R. J. Wallace, P. Wester, R. Brozzi 299
and M. Saarela. 2016. Safety and efficacy of Lactobacillus brevis NCIMB 42149 as a silage 300
additive for all animal species. EFSA Journal. 14:4616. 301
EFSA Panel on Additives and Products or Substances used in Animal Feed (FEEDAP). 2012. 302
Scientific Opinion on the safety and efficacy of Lactobacillus plantarum (NCIMB 41028) 303
and Lactobacillus plantarum (NCIMB 30148) as silage additives for all animal species. 304
EFSA Journal. 10:2529. 305

92
EFSA Panel on Additives and Products or Substances used in Animal Feed (FEEDAP). 2014. 306
Scientific Opinion on the safety and efficacy of Pediococcus acidilactici (NCIMB 30005) as 307
a silage additive for all animal species. EFSA Journal. 12:3613. 308
Ferraretto, L. F.; S. M. Fredin, and R. D. Shaver. 2015. Influence of ensiling, exogenous protease 309
addition and bacterial inoculation on fermentation profile, nitrogen fractions and ruminal in 310
vitro starch digestibility in rehydrated and high-moisture corn. J. Dairy Sci. 98:7318-7327. 311
HALE, W. H. 1973. Influence of processing on the utilization of grains (starch) by ruminants. J. 312
Anim. Sci. 37:1075-1984. 313
Hoffman, P.C.; N.M. Esser, R.D. Shaver, W.K. Coblentz, M.P. Scott, A.L. Bodnar, R.J. Schmidt, 314
and R.C. Charley. 2011. Influence of ensiling time and inoculation on alteration of the 315
starch-protein matrix in high-moisture corn. J. Dairy Sci. 94:2465-2474. 316
Junges, D.; G. Morais, M. H. F. Spoto, P. S. Santos, A. T. Adesogan, L. G. Nussio, and J. L. P. 317
Daniel. 2017. Short communication: Influence of various proteolytic sources during 318
fermentation of reconstituted corn grain silages. J. Dairy Sci. 100. 319
Kleinshmitt, C.; G. Morais, L. Custódio, J. Fernandes, M. C. Santos, J. L. P. Daniel, and L. G. 320
Nussio. 2013. Performance of lactating dairy cows fed maize silage with increased dosages 321
of L. buchneri. In: Proceedings of the 15th International Conference on Forage 322
Conservation, High Tatras, Slovakia. p.141-142. 323
Logan, N. A.; G. Forsyth, L. Lebbe, J. Goris, M. Heyndrickx, A. Balcaen, A. Verhelst, E. Falsen, 324
A. I. Ljungh, H. B. Hansson, and P. De Vos. 2002. Polyphasic identification of Bacillus and 325
Brevibacillus strains from clinical, dairy and industrial specimens and proposal of 326
Brevibacillus invocatus sp. nov. Int. J. Syst. Evol. Microbiol. 52:953–966. 327

93
McDonald, P.; A.R. Henderson, and S.J.E. Heron. 1991. The biochemistry of silage. Marlow, 328
Chalcomb Publication. 329
Nakamura, L. K. 1998. Bacillus pseudomycoides sp. nov. Int. J. Syst. Evol. Microbiol. 48:1031-330
1035. 331
Novozymes 2015. Healthier fermentation and healthier profits with Novozymes Sanferm® 332
Yield, 2015, from http://www.novozymes.com/en/solutions/food-and-333
beverages/casestudies-on-Food-Beverages/Pages/Healthier-fermentation-and-healthier-334
profits-with-Novozymes-Sanferm®-Yield.aspx. 335
Oude Elferink, S. J. W. H.; J. Krooneman, J. C. Gottschal, S. F. Spoelstra, F. Faber, and F. 336
Driehuis. 2001. Anaerobic conversion of lactic acid to acetic acid and 1,2 propanediol 337
by Lactobacillus buchneri. Appl. Env. Microbiol. 67:125-132. 338
Palmisano, M. M.; L. K. Nakamura, K. E. Duncan, C. A. Istock, F. M. Cohan. 2001. Bacillus 339
sonorensis sp. nov., a close relative of Bacillus licheniformis, isolated from soil in the 340
Sonoran Desert, Arizona. Int. J. Syst. Evol. Microbiol. 51:1671–1679. 341
Rogosa, M. 1970. Characters used in the classification of Lactobacilli. Int. J. Syst. Bact. 20:519-342
533. 343
Ruiz-Garcia, C.; E. Quesada, F. Martinez-Checa, I. Llamas, M. C. Urdaci, V. Bejar 2005. 344
Bacillus axarquiensis sp. nov. and Bacillus malacitensis sp. nov., isolated from river-mouth 345
sediments in southern Spain. Int. J. Syst. Evol. Microbiol. 55:1279–1285. 346
Satomi, M.; M. T. La-Duc, K. Venkateswaran. 2006. Bacillus safensis sp. nov., isolated from 347
spacecraft and assembly-facility surfaces. Int. J. Syst. Evol. Microbiol. 56:1735–1740. 348
Shivaji, S.; P. Chaturvedi, K. Suresh, G. S. N. Reddy, C. B. S. Dutt, M. Wainwright, J. V. 349
Narlikar, P. B. Bhargava. 2006. Bacillus aerius sp. nov., Bacillus aerophilus sp. nov., 350

94
Bacillus stratosphericus sp. nov. and Bacillus altitudinis sp. nov., isolated from cryogenic 351
tubes used for collecting air samples from high altitudes. Int. J. Syst. Evol. Microbiol. 352
56:1465–1473. 353
Silva, N. C.; C. F. Nascimento, F. A. Nascimento, F. D. De Resende, J. L. P. Daniel, G. R. 354
Siqueira. 2018. Fermentation and aerobic stability of rehydrated corn grain silage treated 355
with different doses of Lactobacillus buchneri or a combination of Lactobacillus plantarum 356
and Pediococcus acidilactici. J. Dairy Sci. 101:1-10. 357
Statistical Analysis System Institute. SAS user’s guide. Version 8.2. Cary, 2002. 1 CD-ROM. 358
Tanasupawat, S.; S. Okada, M. Kozaq, K. Komagata. 1993. Characterization of Pediococcus 359
pentosaceus and Pediococcus acidilactici Strains and Replacement of the Type Strain of P. 360
acidilactici with the Proposed Neotype DSM 20284. Int. J. Syst. Bact. 43:860-863. 361
Zhang, B.; S. Dhital, and M. J. Gidley. 2013. Synergistic and Antagonistic Effects of α ‑ 362
Amylase and Amyloglucosidase on Starch Digestion. Biomacromolecules.14:1945–1954. 363
364

95
Table 1. Silage characterization, average of nutrient composition, degradation and fermentative 365
parameters of rehydrated sorghum and corn kernel silages with 30 and 180 days of storage and 366
with or without addition of amyloglucosidades 367
Sorghum Corn
DM, % of as fed 65.03 ± 1.74 65.22 ± 1.79
DM loss, % of DM 5.26 ± 3.47 6.77 ± 3.41
Starch, % of DM 54.48 ± 5.50 56.37 ± 5.24
Starch loss, % of DM 7.92 ± 5.56 16.35 ± 6.13
Free Glucose, % of DM 2.40 ± 1.09 2.96 ± 1.68
Prolamin, % of DM 14.22 ± 1.03 12.85 ± 1.64
NH3, % of DM 0.08 ± 0.03 0.06 ± 0.02
Deg 0, %of DM 39.77 ± 3.25 32.52 ± 4.43
Kd, % of DM h-1 3.14 ± 0.07 3.33 ± 0.13
pH 3.99 ± 0.25 3.92 ± 0.20
Lactic, % of DM 8.81 ± 4.08 6.07 ± 2.03
Acetic, % of DM 0.08 ± 0.04 0.03 ±0.02
Propionic, % of DM 1.04 ± 1.24 0.40 ± 0.37
Butyric, % of DM 0.24 ± 0.27 0.08 ± 0.07
1,2 propanodiol, % of DM 2.87 ± 1.26 1.46 ± 0.54
Ethanol, % of DM 0.76 ± 0.22 0.98 ± 0.38 368

96
Table 2. Characteristics of lactic acid bacteria isolated of rehydrated sorghum or corn kernel silages with 30 or 180 d, and addition of 369 amyloglucosidase (AMG), amyloglucosidase (GAM), and Control (CON) 370
Identification N Gram Shape CA OX MO GA 50 Melezitose Dulcitol Xilose
Lactobacillus brevis 102 - Short and medium rod - - - 29 (+) ND + ND ND
Lactobacillus buchneri 43 - Short and medium rod - - 4 (+) 25 (+) ND - ND ND
Lactobacillus parabuchneri 2 - Short and medium rod - - - - ND + ND +
Lactobacillus plantarum 25 - Short and medium rod - - - - ND + - ND
Pediococcus acidilactici 76 3 (+) Short and medium rod - - 1 (+) 10 (+) + ND ND ND
Pediococcus pentosaceus 7 - Short and medium rod - - 1 (+) 1 (+) - ND ND ND
Not identificated 3 - Medium rod - - - - ND ND ND ND
Gram: Gram strain; Shape: cellular shape; CA: catalase production; OX: oxidase production; MO: motility; GA: gas production from MRS; NI: total number of 371 isolates. Positive (+); Negative (-). 372 373
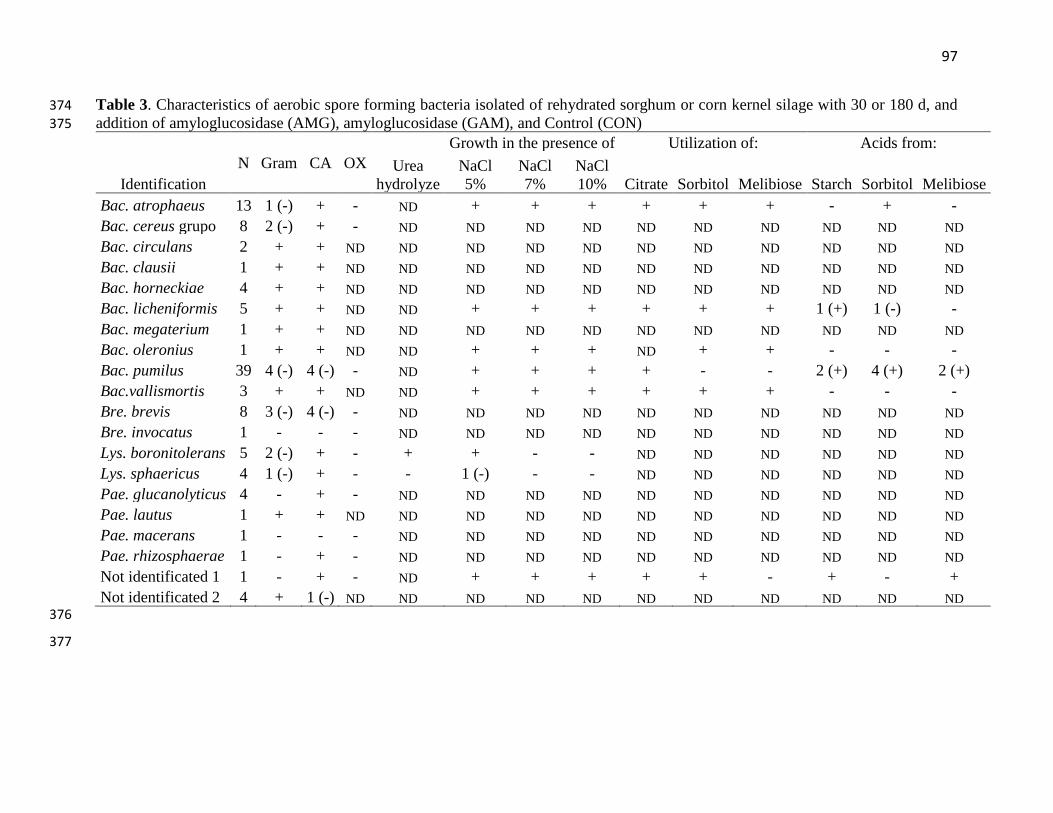
97
Table 3. Characteristics of aerobic spore forming bacteria isolated of rehydrated sorghum or corn kernel silage with 30 or 180 d, and 374 addition of amyloglucosidase (AMG), amyloglucosidase (GAM), and Control (CON) 375
Identification
N Gram CA OX Urea
hydrolyze
Growth in the presence of Utilization of: Acids from:
NaCl
5%
NaCl
7%
NaCl
10% Citrate Sorbitol Melibiose Starch Sorbitol Melibiose
Bac. atrophaeus 13 1 (-) + - ND + + + + + + - + -
Bac. cereus grupo 8 2 (-) + - ND ND ND ND ND ND ND ND ND ND
Bac. circulans 2 + + ND ND ND ND ND ND ND ND ND ND ND
Bac. clausii 1 + + ND ND ND ND ND ND ND ND ND ND ND
Bac. horneckiae 4 + + ND ND ND ND ND ND ND ND ND ND ND
Bac. licheniformis 5 + + ND ND + + + + + + 1 (+) 1 (-) -
Bac. megaterium 1 + + ND ND ND ND ND ND ND ND ND ND ND
Bac. oleronius 1 + + ND ND + + + ND + + - - -
Bac. pumilus 39 4 (-) 4 (-) - ND + + + + - - 2 (+) 4 (+) 2 (+)
Bac.vallismortis 3 + + ND ND + + + + + + - - -
Bre. brevis 8 3 (-) 4 (-) - ND ND ND ND ND ND ND ND ND ND
Bre. invocatus 1 - - - ND ND ND ND ND ND ND ND ND ND
Lys. boronitolerans 5 2 (-) + - + + - - ND ND ND ND ND ND
Lys. sphaericus 4 1 (-) + - - 1 (-) - - ND ND ND ND ND ND
Pae. glucanolyticus 4 - + - ND ND ND ND ND ND ND ND ND ND
Pae. lautus 1 + + ND ND ND ND ND ND ND ND ND ND ND
Pae. macerans 1 - - - ND ND ND ND ND ND ND ND ND ND
Pae. rhizosphaerae 1 - + - ND ND ND ND ND ND ND ND ND ND
Not identificated 1 1 - + - ND + + + + + - + - +
Not identificated 2 4 + 1 (-) ND ND ND ND ND ND ND ND ND ND ND
376
377

98
378
Figure 1. Dendrogram derived from a protein cluster analysis of lactic acid bacteria isolated of 379
rehydrated sorghum kernel silage with 30 or 180 d, and addition of amyloglucosidase AMG or 380
GAM, and control, in MRS agar. Numbers in brackets are the strain identification. 381

99
382
Figure 2. Dendrogram derived from a protein cluster analysis of lactic acid bacteria isolated of 383
rehydrated corn kernel silage with 30 or 180 d, and addition of amyloglucosidase AMG or GAM, 384
and control, in MRS agar. Numbers in brackets are the strain identification 385

100
386
Figure 3. Dendrogram derived from a protein cluster analysis of aerobic spore forming bacteria 387
isolated of rehydrated sorghum kernel silage with 30 or 180 d, and addition of amyloglucosidase 388
AMG or GAM, and control, in MRS agar. Numbers in brackets are the strain identification. 389
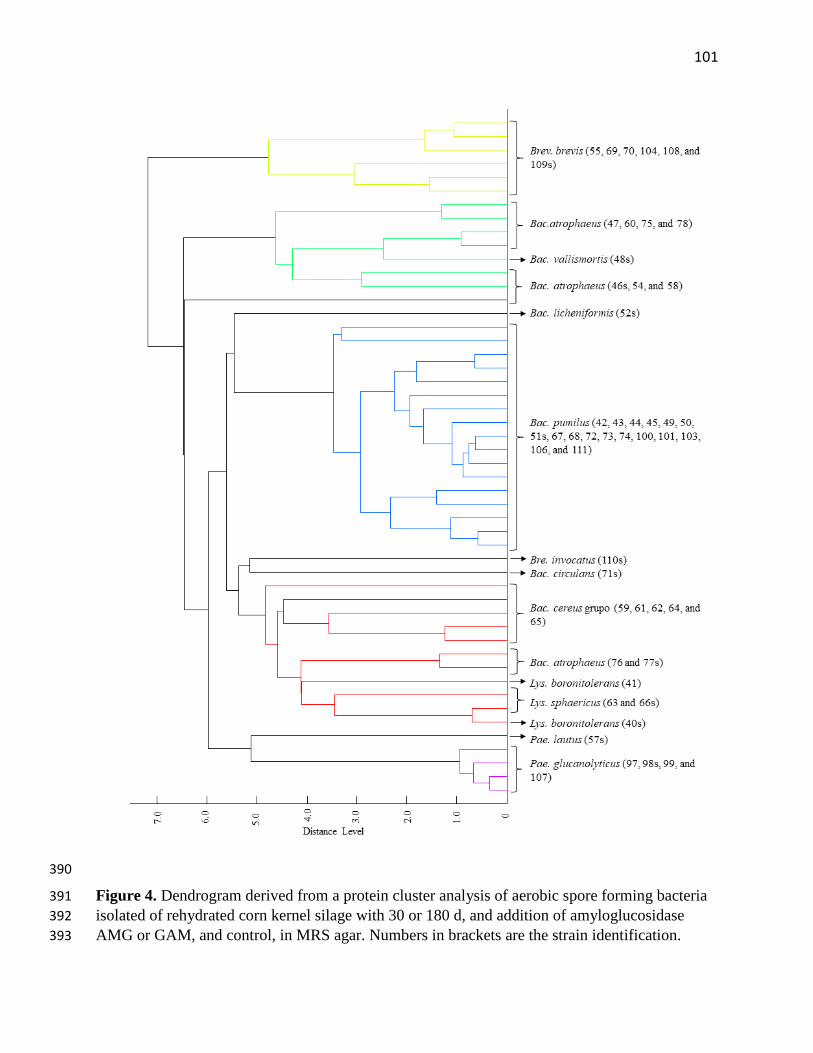
101
390
Figure 4. Dendrogram derived from a protein cluster analysis of aerobic spore forming bacteria 391
isolated of rehydrated corn kernel silage with 30 or 180 d, and addition of amyloglucosidase 392
AMG or GAM, and control, in MRS agar. Numbers in brackets are the strain identification. 393

102
Table 4. Population (Log) and identification of lactic acid bacteria isolated of rehydrated sorghum or corn kernel silage with 30 or 180 394
d, and addition of amyloglucosidase (AMG), amyloglucosidase (GAM), and Control (CON) 395
Grain Sorghum Corn
Enzyme CON AMG GAM CON AMG GAM
Duration 30 180 30 180 30 180 30 180 30 180 30 180
Lactobacillus brevis < 2 3.57 4.00 < 2 4.14 < 2 6.31 4.11 6.03 < 2 5.25 < 2
Lactobacillus buchneri 4.60 < 2 < 2 < 2 3.98 < 2 6.41 < 2 6.12 < 2 4.92 < 2
Lactobacillus parabuchneri < 2 < 2 < 2 < 2 < 2 < 2 < 2 0.82 < 2 < 2 < 2 < 2
Lactobacillus plantarum 3.82 < 2 4.74 < 2 3.82 < 2 5.96 < 2 5.12 < 2 4.12 < 2
Pediococcus acidilactici 4.91 < 2 4.98 < 2 4.81 < 2 5.77 < 2 6.44 < 2 5.02 < 2
Pediococcus pentosaceus 3.92 < 2 < 2 < 2 3.38 < 2 5.12 1.82 5.78 < 2 < 2 < 2
Not identificated 1 < 2 1.30 < 2 < 2 < 2 < 2 < 2 < 2 < 2 < 2 < 2 < 2
Total 5.14 3.57 5.20 < 2 4.99 < 2 6.79 4.11 6.77 < 2 5.58 < 2 396

103
Table 5. Population (Log) and identification of aerobic spore forming bacteria isolated of rehydrated sorghum or corn kernel silage with 397 30 or 180 d, and addition of amyloglucosidase (AMG), amyloglucosidase (GAM), and Control (CON) 398
Kernel Sorghum Corn
Enzyme CON AMG GAM CON AMG GAM
Duratin 30 180 30 180 30 180 30 180 30 180 30 180
Bacillus atrophaeus < 2 2.00 2.30 < 2 < 2 < 2 2.82 < 2 2.30 < 2 2.85 < 2
Bacillus cereus group 2.54 < 2 2.00 < 2 < 2 < 2 < 2 < 2 2.74 < 2 < 2 < 2
Bacillus circulans 2.00 < 2 < 2 < 2 < 2 < 2 < 2 < 2 < 2 < 2 2.00 < 2
Bacillus clausii < 2 < 2 2.00 < 2 < 2 < 2 < 2 < 2 < 2 < 2 < 2 < 2
Bacillus horneckiae 2.00 < 2 2.48 < 2 < 2 < 2 < 2 < 2 < 2 < 2 < 2 < 2
Bacillus licheniformis < 2 < 2 2.00 < 2 2.30 2.00 2.00 < 2 < 2 < 2 < 2 < 2
Bacillus megaterium < 2 < 2 2.00 < 2 < 2 < 2 < 2 < 2 < 2 < 2 < 2 < 2
Bacillus oleronius < 2 2.00 < 2 < 2 < 2 < 2 < 2 < 2 < 2 < 2 < 2 < 2
Bacillus pumilus 2.18 2.60 2.00 2.60 2.90 2.60 3.08 2.30 2.30 2.48 2.70 2.00
Bacillus vallismortis < 2 < 2 2.00 < 2 2.00 < 2 2.23 < 2 < 2 < 2 < 2 < 2
Brevibacillus brevis < 2 < 2 < 2 2.00 < 2 < 2 2.30 < 2 2.00 2.00 2.00 2.40
Brevibacillus invocatus < 2 < 2 < 2 < 2 < 2 < 2 < 2 < 2 < 2 < 2 < 2 2.18
Lysinobacillus boronitolerans 2.18 < 2 2.00 < 2 < 2 < 2 2.48 < 2 < 2 < 2 < 2 < 2
Lysinobacillus sphaericus < 2 < 2 2.00 < 2 2.00 < 2 < 2 < 2 2.40 < 2 < 2 < 2
Paenibacillus glucanolyticus < 2 < 2 < 2 < 2 < 2 < 2 < 2 2.48 < 2 2.00 < 2 < 2
Paenibacillus lautus < 2 < 2 < 2 < 2 < 2 < 2 < 2 < 2 2.00 < 2 < 2 < 2
Paenibacillus macerans 2.18 < 2 < 2 < 2 < 2 < 2 < 2 < 2 < 2 < 2 < 2 < 2
Paenibacillus rhizosphaerae < 2 < 2 2.00 < 2 < 2 < 2 < 2 < 2 < 2 < 2 < 2 < 2
Not reliable identification 1 2.40 < 2 2.30 < 2 < 2 < 2 < 2 < 2 < 2 < 2 < 2 < 2
Not reliable identification 2 < 2 2.00 < 2 < 2 < 2 < 2 < 2 < 2 < 2 < 2 < 2 < 2
Total 3.10 2.85 3.20 2.70 3.08 2.70 3.42 2.70 3.15 2.70 3.15 2.70 399
400

104
401
402
Figure 5. Principal component analysis (PCA) treatments kernel (sorghum and corn), enzyme 403
(CON, AMG, and GAM) and duration of fermentation (30 and 180 days), grouped based on 404
nutrient values, fermentation end products, and population of bacteria. The factor 1 and factor 2 of 405
principal components explained 51.60 and 22.09%, respectively, of the total variance. The 406
numbers represent kernel, enzyme, and duration of fermentation: 1- Sorghum, CON, 30 d; 2- 407
Sorghum, AMG, 30 d; 3- Sorghum, GAM, 30 d; 4- Sorghum, CON, 180 d; 5- Sorghum, AMG, 408
180 d; 6- Sorghum, GAM, 180 d; 7- Corn, CON, 30 d; 8- Corn, AMG, 30 d; 9- Corn, GAM, 30 d; 409
10- Corn, CON, 180 d; 11- Corn, AMG, 180 d; 12- Corn, GAM, 180 d. 410
411
Projection of the cases on the factor-plane (1 x 2)
C30S
AMG30S
GAM30S
C180S
AMG180S
GAM180S
C30C
AMG30C
GAM30C
C180C
AMG180CGAM180C
-5 -4 -3 -2 -1 0 1 2 3 4 5
Factor 1 (49.26 %)
-5
-4
-3
-2
-1
0
1
2
3
4
5
Fac
tor
2 (
24
.62
%)
C30S
AMG30S
GAM30S
C180S
AMG180S
GAM180S
C30C
AMG30C
GAM30C
C180C
AMG180CGAM180C

105
412
Figure 6. Principal component analysis (PCA) of nutrient values, fermentation end products, and 413
population of acid lactic bacteria (L) and aerobic spore forming bacteria (S). The factor 1 and 414 factor 2 of principal components explained 51.60 and 22.09%, respectively, of the total variance. 415
The numbers represent the variables: 1- % of DM; 2- DM loss; 3- Starch; 4- Starch loss; 5- Free 416 Glucose; 6- Prolamin; 7- NH3; 8- Fraction A; 9- Kd; 10- pH; 11- Lactic; 12- Acetic; 13- Propionic; 417
14- Butyric; 15- 1,2 propanodiol; 16- Ethanol; and the microorganisms: L1- Lactobacillus brevis; 418 L2- Lactobacillus buchneri; L3- Lactobacillus parabuchneri; L4- Lactobacillus plantarum; L5- 419 Pediococcus acidilactici; L6- Pediococcus pentosaceus; L7- LAB not identificated; S1- Bacillus 420 atrophaeus; S2- Bacillus cereus group; S3- Bacillus circulans; S4- Bacillus clausii; S5- Bacillus 421 horneckiae; S6- Bacillus licheniformis; S7- Bacillus megaterium; S8- Bacillus oleronius; S9- 422
Bacillus pumilus; S10- Bacillus vallismortis; S11- Brevibacillus brevis; S12- Brevibacillus 423 invocatus; S13- Lysinobacillus boronitolerans; S14- Lysinobacillus sphaericus; S15- 424
Paenibacillus glucanolyticus; S16- Paenibacillus lautus; S17- Paenibacillus macerans; S18- 425 Paenibacillus rhizosphaerae; S19- SAB not identificated 1; S20- SAB not identificated 2. 426
427
Projection of the variables on the factor-plane (1 x 2)
1
2
3
4
5
6
7
8
9
10
11
12
13
14
15
16
L5
L2
L6L4L1
L7
L3
S13
S2
S17 S19
S9
S3
S5
S1S10
S6
S14
S7S18S4
S8
S11
S20
S12
S15
S16
-1.0 -0.5 0.0 0.5 1.0
Factor 1 (49.26 %)
-1.0
-0.5
0.0
0.5
1.0
Fac
tor
2 (
24
.62
%)
1
2
3
4
5
6
7
8
9
10
11
12
13
14
15
16
L5
L2
L6L4L1
L7
L3
S13
S2
S17 S19
S9
S3
S5
S1S10
S6
S14
S7S18S4
S8
S11
S20
S12
S15
S16
106
5 ARTIGO 3: Effect of washing method, grinding size, and the determination of an
undegraded fraction on in situ effective ruminal disappearance and disappearance rate of
starch in mature corn grain
Artigo formatado de acordo com normas do periódico Journal of Dairy Science.
Disponível em:
http://www.journalofdairyscience.org/pb/assets/raw/Health%20Advance/journals/jods/2016_SF.

107
Interpretative Summary: Fernandes et al. Starch is the most important source of fermentable 1
energy for dairy cows; thus, an accurate prediction of ruminal starch degradation is necessary to 2
improve lactation performance and health. The objective of this study was to evaluate the 3
methodology used for ruminal in situ determination of fractions A, B, and C, and the models 4
used to estimate ruminal fractional degradation rate of fraction B. Determination of fraction A by 5
rinsing in a washing machine, and ruminal in situ incubations of 0, 3, and 48 h for starch 6
disappearance kinetics using a 2-pool model (Fractions A and B) are suggested for starchy 7
feedstuffs. Grinding size affects starch disappearance kinetics. 8
9
Running Head: Model to estimate the starch ruminal disappearance 10
Effect of washing method, grinding size, and the determination of an undigestible fraction 11
on in situ degradation of starch in mature corn grain 12
13
T. Fernandes*†, C. L. S. Ávila*, M. N. Pereira*, and L. F. Ferraretto†1 14
* Department of Animal Sciences, University of Lavras, Lavras, MG 37200-000, Brazil 15
† Department of Animal Sciences, University of Florida, Gainesville, FL 32611 16
17
Corresponding author: 18
Luiz F. Ferraretto 19
Department of Animal Sciences 20
Room 202 B Animal Sciences Building 21
2250 Shealy Drive 22
1Corresponding author: [email protected]

108
Gainesville, FL 32611 23
Phone: (352) 294 1005 24
Email: [email protected] 25
26
ABSTRACT 27
The objectives of this study were to determine: 1) the most adequate method to estimate 28
the rapidly degradable fraction (A); 2) a time-point to measure the undigestible fraction (C); and 29
3) the viability of using fewer time-points to estimate starch fractional disappearance rate (kd) of 30
mature corn grain ground through 4 grinding sizes (1, 2, 4, and 6-mm). Fraction A was 31
determined by rinsing in a bucket or washing machine, rumen immersion followed by bucket or 32
washing machine, and water immersion for 30-min followed by bucket or washing machine. 33
Ruminal in situ incubations were performed at 48, 72, 96, and 120 h to determine fraction C, and 34
at 0 (washing machine), 3, 6, 12, 18, 24, and 48 h to determine the kinetics of starch 35
disappearance. Models were used with either 2 or 3-pools and kd was determined by the linear 36
slope of the ‘ln’ of bag residues as a proportion of incubated samples over time. The effective 37
ruminal disappearance (ERD) was calculated as: A + B [kd / (kd + kp)], kp = 7.47 % h-1. Data 38
were analyzed using PROC MIXED of SAS with the fixed effect of method (either washing or 39
model), grinding size, and their interaction and the random effect of run or cow. Correlation 40
between estimates calculated using all time-points or combinations of 2 and 3 time-points were 41
determined using PROC CORR. Fraction A was affected by grinding size; but not by washing 42
method. Samples ground at 6-mm had greater fraction C than other grinding sizes at 48, 72 or 96 43
h; but not at 120 h. Model affected fraction B values solely. Greater fractions B and C, but 44
reduced kd and ERD were observed as grinding size increased. Based on correlation analysis the 45

109
2-pool model, and the incubation times of 0, 3, and 48 h were suitable to evaluate ruminal starch 46
degradation kinetics in mature corn. Ruminal in situ incubation at 120 h highlighted the lack of a 47
fraction C of starch (0.13% of starch). Determination of fraction A by rinsing in a washing 48
machine, and ruminal in situ incubations of 0, 3, and 48 h for starch degradation kinetics using a 49
2-pool model are suggested for starchy feedstuffs. Grinding size affected starch degradation 50
kinetics. 51
Key Words: soluble fraction, effective ruminal degradation, fractional degradation rate, starch 52
sources 53
54
INTRODUCTION 55
Starch is a major energy source for both ruminant animals and ruminal microorganisms 56
(Moharrery et al., 2014). However, ruminal in vivo starch digestibility varies from 25 to 95% of 57
intake, which in turn may alter lactation performance and feed efficiency by dairy cows (Firkins 58
et al., 2001; Ferraretto et al., 2013). This variance in ruminal starch digestibility could be 59
explained by a myriad of factors, including intake level, starch source, endosperm texture, 60
particle size, grain processing, storage method, harvesting maturity, enzyme supplementation, 61
and duration of storage in the silo (Firkins et al., 2001; Ferraretto et al., 2013; Moharrery et al., 62
2014; Gallo et al., 2016; Andreazzi et al., 2018). However, it is difficult to account for this 63
variation in nutritional models, since a standard method established to evaluate the ruminal 64
disappearance of starch has not been defined (Peyrat et al., 2014). Considering that predicting 65
total tract starch digestibility from fecal starch concentration is highly reliable (Fredin et al., 66
2014; Owens et al., 2016), an accurate estimation of ruminal starch digestibility would allow for 67
the estimation of the proportion of starch intake digested in the intestines. Estimating the 68

110
partition in starch digestibility between rumen and intestines may be useful for ration 69
formulation, since it is associated to the efficiency of energy usage, ruminal microbial synthesis, 70
and the occurrence of ruminal acidosis. 71
The ruminal in situ digestibility method is one of the standard procedures used for 72
determination of ruminal starch digestibility (Seifried et al., 2016). This procedure measures the 73
disappearance of DM and nutrients from bags containing feed samples and incubated in the 74
rumen across various time-points (Seifried et al., 2016). With the use of several time-points we 75
could determine the soluble or rapidly degradable fraction (fraction A), the slowly degradable 76
raction (fraction B), and the indigestible fraction (fraction C). However, this procedure is not 77
standardized. Time-points of incubation have ranged from five (Dias Junior et al., 2016) to nine 78
(Saifried et al., 2016), whereas the final time-point ranges from 24 h (Hristov et al., 2007; Dias 79
Junior et al., 2016) to 336 h (Dieho et al., 2017). According to Hall and Mertens (2017), the NFC 80
fraction of feedstuffs commonly fed to dairy cows have either minimal or no indigestible 81
fraction. Moreover, the majority of starch models do not consider soluble and indigestible 82
fractions (Lanzas et al., 2007; Volden and Larsen, 2011) nor do they separate starch from other 83
carbohydrates (NRC, 2001). 84
The ruminal in situ technique may also be affected by other factors. For example, the 85
sample particle size may interfere with the estimation of ruminal degradation (Benton et al., 86
2005) due to the potential loss of small particles through the pores of incubation bags (Dulphy 87
1999; Philippeau and Michalet-Doreau 1997). Furthermore, different methodologies applied 88
during bag washing can affect the estimation of fraction A; some commonly used methods 89
include rinsing in water (Herrera-Saldan et al., 1990; Lee et al., 2016), using a washing machine 90
111
(Dieho et al., 2017), and soaking in water for a specific amount of time (Batajoo and Shaver, 91
1997; Keim et al., 2013). 92
These differences during the estimation of the fractional degradation rate (kd) and 93
thereby, the effective ruminal degradation (ERD) may yield different values for the same 94
feedstuff. The lack of a standardized method makes the comparison among feeds analyzed by 95
different research laboratories unfeasible and hinders the establishment of more precise 96
prediction models. Therefore, experimental objectives were: (1) to evaluate washing methods to 97
estimate fraction A of starch, (2) to determine a time-point to measure fraction C, (3) to 98
determine the feasibility of using less time-points to estimate starch kd, and (4) to measure starch 99
ERD and kd of various starch sources using the methodology defined by objectives 1, 2 and 3. 100
We hypothesized that the use of a methodology with few incubation time-points to calculate 101
starch ruminal degradation kinetics would yield the same ERD as the prediction performed with 102
all time-points. 103
MATERIALS AND METHODS 104
A batch of 4 kg of dried mature dent corn was homogenized and allocated into 4 samples 105
using a quartering technique: homogeneous samples were divided into 4 equal subsamples. Two 106
subsamples were saved for later treatment, whereas the 2 other subsamples were re-homogenized 107
and re-divided. The process was repeated until 4 subsamples of 500 g were prepared. Each 108
subsample was assigned to a grinding size and ground to pass 1, 2, 4 or 6-mm sieves in a Wiley 109
mill (A. H. Thomas Scientific, Philadelphia, PA). Each sample (82.4 ± 14.5 g; mean ± SD) was 110
dry-sieved using a Tyler Ro-Tap Shaker (model RX-29, W.S. Tyler, Mentor, OH) using a set of 111
9 sieves (W.S. Tyler) with nominal square apertures of 6.70, 4.75, 3.35, 2.36, 1.70, 1.18, 0.59, 112
0.20, 0.15-mm and a pan (ASABE, 2007) to determine particle size distribution; GMPS (µm) 113

112
and surface area (cm2 /g) were calculated using a log normal distribution (Baker and Herrman 114
2002). 115
Ruminal in situ procedures were conducted at the University of Florida Dairy Research 116
Unit (Gainesville, FL) under a protocol approved by the University of Florida, Institute of Food 117
and Agricultural Sciences, Animal Care Research Committee. Dacron polyester cloth bags 118
(R1020, 10 × 20 cm and 50 ± 10 micro porosity; Ankom Technology, Macedon, NY) containing 119
5.04 ± 0.02 g of DM, yielding a ratio of sample mass per bag area of 16.6 mg/cm2, were used to 120
compare fraction A methods, to determine a time-point to measure fraction C, and to estimate kd 121
of fraction B and ERD. 122
A comparison of 6 methodologies used to determine fraction A of DM and starch was 123
performed. Three independent runs were conducted per method, and samples from each grinding 124
size were used in duplicate within each run. Each run and method contained a blank bag to allow 125
correction for infiltration of DM into sample bags. Methods were: 1) to rinse (6 ± 2 wash/bag) in 126
a bucket with water (B); 2) to rinse in a washing machine using the rinse and spin cycle set with 127
cold water for a 30-min cycle (W; Roper RTW4516F*, Whirlpool Corp., Benton Harbor, MI); 3) 128
to insert bags in the rumen, remove immediately after moistened, soak in cold water for 15 min, 129
and rinse in a bucket (RB); 4) to insert bags in the rumen, remove immediately after moistened, 130
soak in cold water for 15 min, and rinse using a washing machine set as described for treatment 2 131
(RW); 5) to submerge bags in water (approximated 25°C; 1000 mL-1 bag) for 30 min, and rinse 132
it in a bucket (IB); and 6) to submerge bags in water for 30 min, and rinse it using a washing 133
machine set as described for treatment 2 (IW). All six methods were performed simultaneously 134
for each run and all bags were dried together in a forced-air oven set at 60°C for 48 h. The mean 135
DM degradation value of the 2 bags of each grinding size for each washing method was 136

113
calculated for each run. Residues from duplicates within each grinding size treatment for each 137
fraction A method within run were composited and ground to pass the 1-mm sieve in a cyclone 138
mill (UDY Corporation, Fort Collins CO) and analyzed for starch by an enzymatic method with 139
thermostable α-amylase (Ankom Tchnology, Macedon, NY) and amyloglucosidase (Megazyme 140
E-AMGDF, Bray, Co. Wicklow, Ireland) enzymes, with free and enzymatically released glucose 141
measured. Values from a separate determination of free glucose were subtracted to give values 142
for enzymatically released glucose. Starch concentration was calculated as enzymatically 143
released glucose multiplied by 0.9, as described by Hall (2015). 144
To define the incubation time for fraction C determination, measurements of ruminal in 145
situ DM degradation were performed for each grinding size using 3 ruminally-cannulated, 146
midlactation, multiparous Holstein cows fed a TMR containing (DM basis) corn silage (38.2%), 147
alfalfa hay (4.0%), dry ground shelled corn (27.3%), soybean meal (14.5%), citrus pulp (9.1%), 148
minerals and supplements (6.8%). The in situ bags for each grinding size treatment for each 149
time-point (48, 72, 96, and 120 h) were placed in a nylon laundry bag (30 × 40-cm) and then 150
positioned in the ventral rumen of each cow. Each laundry bag was attached to the inside of the 151
rumen cannula with a 50-cm long nylon rope and contained a rubber weight to ensure they 152
remained submerged in the ruminal contents. Each laundry bag contained a blank bag to allow 153
correction for infiltration of DM into sample bags. Bags were introduced into the rumen in 154
reverse chronological order so that the removal of all bags occurred at the same time. After 155
removal, samples were soaked in ice water for 15 min. The bags were then rinsed with cold tap 156
water to remove adhering feed particles and washed in a commercial washing machine (Roper 157
RTW4516F*, Whirlpool Corp., Benton Harbor, MI) using the rinse and spin cycle setting with 158
cold water for 30-min cycle (7 min to fill water, 13 min for agitation, and 10 min to drain and 159

114
spin). Bags were dried together in a forced-air oven set at 60°C for 48 h. The mean DM 160
disappearance value of the 2 bags within grinding size treatment and incubation time was 161
calculated for each cow. Residues from each duplicate within grinding size, incubation time-162
point, and cow were composited, ground, and analyzed for starch as described previously. 163
Subsequently, the same cows and procedure described for fraction C determination were 164
used to determine the kinetics of DM disappearance, but using different incubation time-points 165
(3, 6, 12, 18, 24, and 48 h). Residues from each duplicate within grinding size, incubation time-166
point, and cow were composited, ground, and analyzed for starch as described previously. Two 167
models were used to determine fraction B. The first model consisted of three fractions (A, B and 168
C); a rapidly degrading fraction (A) estimated by washing bags in a washing machine, an 169
undigested fraction (C) estimated from a ruminal in situ incubation at 120 h, and a slowly 170
degrading fraction (B) estimated by the equation: B = 100 – A – C. The second model consisted 171
of two fractions (A and B); fraction A was estimated as described for the first model, and 172
fraction B was estimated by the equation: B = 100 – A. The second model assumed that there is 173
no indigestible fraction (fraction C) in starch. Fractional disappearance rate (kd) was determined 174
by the linear slope over time of the natural logarithm of each time-point residue as a percentage 175
of the incubated material. This calculation was performed for each time-point of each sample in 176
each cow, which resulted in a linear regression of fraction B for each model. The ERD was 177
calculated as: A + B [kd / (kd + kp)], where: A = fraction A, B = fraction B, kd = fractional 178
degradation rate of fraction B, kp = fractional passage rate. The kp rates used were estimated 179
from the average experimental cow fed and TMR: 1) using the CNCPS equation, and was equal 180
to 7.47% h-1 (Tylutki et al., 2008; ERD 1); 2) using the equation (7.3) from NorFor, which was 181

115
equal to 6.85% h-1 (Volden and Larsen, 2011; ERD 2); or 3) using the 16% h-1 as used by the 182
Feed Grain V2 model (Hoffman et al., 2012; ERD 3). 183
Based on these data, the most suitable time-points (0, 3, 48, and 120 h) of ruminal in situ 184
incubation were defined to measure fractions A, B, and C, as well as kd of fraction B and ERD 185
from various starch sources. Ruminal in situ incubations were performed on 2-mm ground 186
samples as described previously. Starch sources were barley grain, cassava root, cassava starch 187
residue, corn flakes, corn kernels from silage (separated manually from whole-plant corn silage), 188
mature corn grain, whole-plant corn silage, oat flakes, potato root, rehydrated and ensiled corn, 189
rehydrated and ensiled sorghum, sorghum grain, sweet potato root, wheat bran, wheat flakes, 190
whole wheat flour, and wheat grain. These ingredients were collected either in Brazil or in the 191
United States. 192
Statistical analysis 193
Fraction A data were analyzed using PROC MIXED of SAS (version 9.4; SAS Institute, 194
Inc., Cary, NC), the model included the fixed effects of wash procedure (B, W, RB, RW, IB, and 195
IW), grinding size (1, 2, 4 and 6-mm), and their interaction, and the random effect of run. 196
Fraction C and kinetics of DM and starch degradation data were also analyzed using PROC 197
MIXED (SAS Institute, 2004). The model included the fixed effects of grinding size (1, 2, 4 and 198
6 mm), incubation time (48, 72, 96, and 120 for fraction C; or 0, 3, 6, 12, 18, 24, 48, and 120 for 199
kinetic), and their interaction, and the random effect of cow. 200
For kd of fraction B and ERD estimates, data were analyzed using PROC MIXED of SAS 201
(version 9.4; SAS Institute, Inc., Cary, NC), with a model inclusive of the fixed effects of 202
grinding size (1, 2, 4 and 6-mm), model (2-pool or 3-pool), and the interaction of grinding size 203
and model, with cow as a random effect. Means were determined using the least squares means 204

116
statement and treatment means were compared using the PDIFF option. Statistical significance 205
and trends were declared at P ≤ 0.05 and 0.05 < P ≤ 0.10, respectively. 206
Correlations and relationships between fractions A and C, degradation time-points, and 207
kd from DM and starch were determined using the CORR and REG procedures of SAS (version 208
9.4; SAS Institute, Inc., Cary, NC). 209
To determine if accurate kd estimates could be obtained with fewer ruminal in situ 210
incubation time-points, a subsequent data analysis was performed to analyze the correlation and 211
relationships between estimates calculated using all time-points 0 (fraction A), 3, 6, 12, 18, 24, 212
and 48 h and estimates calculated using combinations of three or two time-points were 213
determined using the CORR and REG procedures of SAS (version 9.4; SAS Institute, Inc., Cary, 214
NC). 215
RESULTS AND DISCUSSION 216
Nutrient composition and particle size distribution of ground corn grain are in Table 1. 217
Starch composition of corn was 65.9%, with a SD of 0.55 among different grinding size samples. 218
This variation is not biologically expressive, and it is likely related to the method used for starch 219
analyses; according to Hall (2015), the SD within sample of dry ground corn was 0.34. The 220
range in GMPS was 390 to 1,181-µm, for samples ground using sieves of 1 to 6-mm. Similarly, 221
Hoffman et al. (2012) reported a range of 378 to 1,410- µm when samples were ground using 222
sieves of 1 to 8-mm. The minimal amount of sample (0.1%) passing through the 150-µm sieve 223
(Table 1) suggests that the loss of particulate material when fraction A was measured was minor, 224
since bag porosity was 50-µm. According to López (2005), the loss of undegraded particulate 225
matter from bags leads to an overestimation of the soluble fraction. 226

117
Fraction A of DM and starch was reduced (P < 0.01) with increased grinding size 227
(Figures 1A and 1C). Particle size interferes with nutrient degradation as increased grinding size 228
reduces (Table 1) surface area and thereby may impair the attachment of ruminal 229
microorganisms and the action of their enzymes (McAllister et al., 1993). Furthermore, with 230
reduced surface area the amount of nutrient in contact with water is decreased, a plausible 231
explanation for the reduction of 13.77 and 14.98%-units in the soluble fraction of DM and starch, 232
respectively (Figures 1A and 1C). 233
The estimation of the fraction A of DM differed (P < 0.01) among washing procedures 234
(Figure 1B) with samples determined by IB having the greatest fraction A (26.15% vs. 24.43% 235
of DM, on average). However, the fraction A of starch was unaffected (P = 0.82) by washing 236
procedure. Interestingly, the fraction A of DM was 10.2%-units numerically greater, on average, 237
than fraction A of starch. Perhaps there is a difference in solubility of other components of DM, 238
as soluble carbohydrates or nitrogenous components, which potentially alters the Fraction A 239
estimates from varying washing procedures. The soluble and mechanical particle losses may 240
account for a considerable proportion of nutrients, particularly of N (Nocek, 1988). Therefore, 241
the use of the washing machine is recommended as the use of a mechanical procedure could 242
eliminate inherent variation in washing intensity between and within technicians (De Boer et al., 243
1987). The linear relationship between fraction A of DM and starch is shown in Figure 2 (P = 244
0.01, r2 = 0.75); the slope was similar to one, indicating that a constant adjustment factor 245
[Fraction A, % of starch = - 12.647 + (1.098 × Fraction A, % of DM)] may be used for the 246
estimation of the fraction A of starch based on values of the fraction A of DM. Furthermore, the 247
correlation of fraction A of DM and starch was 0.87 (P < 0.01, Figure 2), which is similar to the 248
correlation of 0.85 reported by Ramsey et al. (2001). 249

118
An interaction between grinding size and incubation time was observed (P = 0.01; Figure 250
3A) for fraction C of DM; greater fraction C was observed when using the 6-mm grinding size 251
compared with other treatments at 48 and 72 h, and compared with 1-mm at 96 h of incubation. 252
However, fraction C of DM was similar among grinding size treatments at 120 h. Therefore, the 253
determination of fraction C using an incubation time-point of 120 h is recommended regardless 254
of the grinding size used. An interaction between grinding size and incubation time was also 255
observed (P = 0.01; Figure 3B) for fraction C of starch. At 48 h of incubation, samples ground at 256
6-mm had the greatest, at 4-mm intermediate, and 1- and 2-mm the lowest values of fraction C; 257
after 72 h of incubation fraction C was greater for 6-mm compared with other treatments; and at 258
96 or 120 h grinding size did not affect fraction C. Overall, fraction C of DM and starch 259
demonstrated greater variation when samples were ground at greater particle size; samples 260
ground at 1 or 2-mm were more homogeneous. Fraction C of DM had numerically greater values 261
than fraction C of starch throughout all time-points. This is likely related to fraction C of DM 262
containing fibrous components such as pericarp and tip cap compared to solely starch. These 263
components are resistant to bacterial attachment (Huntington, 1996) whereas NFC are virtually 264
100% degradable in the rumen (Hall and Mertens, 2017). Fraction C of DM and starch were 265
related (P < 0.01), but relationship was not adequate (r2 = 0.66; Figure 4) based on the slope and 266
intercept values. These results suggest that despite the relationship, accurate determination of 267
fraction C requires starch analysis. 268
The DM and starch disappearance had a similar pattern throughout ruminal in situ 269
incubation time-points (Figure 5) and a time effect was observed (P < 0.05) with disappearance 270
increasing logarithmically. Interestingly, despite the difference among most time-points, 3- and 6 271
h of incubation were similar. A grinding size by time interaction was observed for starch (P = 272

119
0.05) but not for DM (P = 0.40) ruminal degradation. Samples ground at 1-mm had greater 273
starch disappearance than 6-mm from 0 to 48 h, than 4-mm at 0, 12, 18 and 24 h, and compared 274
with 2-mm only at 24 h. Likewise, starch disappearance of samples ground at 2-mm were greater 275
than 6-mm from 6 to 48 h, and compared with 4-mm at 12 and 18 h. Samples ground at 4-mm 276
had greater starch disappearance than 6-mm at 18 and 24 h of incubation. A strong positive 277
relationship between ruminal in situ degradation of DM and starch was observed (P < 0.01, r2 = 278
0.97; Figure 6). However, the adjustment factor underestimates the starch disappearance in the 279
initial hours of incubation and overestimate for the late incubation time-points. This is likely 280
related to the loss of particulate matter and hence overestimation of DM disappearance at early 281
time-points (López, 2005), and the contamination with microorganisms which may 282
underestimate the DM disappearance at late time-points (Vanzant et al., 1998). 283
Ruminal disappearance kinetics of DM and starch are in Table 2. Although the effects of 284
grinding size (P < 0.01) were observed for all DM and starch parameters, model (P < 0.01) and 285
interaction between grinding size and model were observed solely on fraction B. The kd and 286
ERD 3 of DM had a tendency (P = 0.09) to decrease when the model without fraction C was 287
used. These data suggest that a model of 2-pools is adequate to determine starch digestion 288
kinetics. Previously, Herrera-Saldana et al. (1990) used a 2-pools model to estimate the kd of 289
DM, starch, and crude protein of cereal grains. 290
The relationship between kd of DM and starch was positive (P < 0.01, r2 = 0.88; Figure 291
7). Although the high correlation between the two kd measurements was high, the intercept was 292
not close to zero, and slope was not close to 1. Possibly, samples ground at 6-mm or greater, 293
required that microorganisms degraded protein and other components prior to accessing the 294
starch granule (McAllister et al., 1993; Hoffman et al., 2011). The correlation coefficients of kd 295

120
estimated with all time-points of ruminal in situ incubation (0, 3, 6, 12, 18, 24, and 48 h) and the 296
combination of two or three time-points are in Table 3. All kd calculated with the 48 h 297
incubation time-point had linear correlation coefficients greater than 0.99, except for the kd 298
estimated with incubations for 24 and 48 (r = 0.938), suggesting that the 48 h incubation is 299
required for accurate determination of the kd. The highest linear correlation coefficient (0.998) 300
was obtained with combination of 0, 3, and 48 h of incubations, with intercept close to zero, and 301
slope close to one. Another combination which could be used is 0, 6, and 48 h, as it presents 302
similar characteristics. According to Vanzant et al. (1998), the use of simple modeling strategies 303
may offer some benefits relative to ease of application without large compromises in the 304
accuracy or precision of estimates. 305
Based on previous results, a 2-pool model, and incubation times of 0, 3, and 48 h were 306
used to determine the ruminal kinetics parameters of starchy feedstuffs. These results are in 307
Table 4. Ruminal in situ incubation at 120 h highlighted that a fraction C does not exist or could 308
be considered null for most feedstuffs as the residue amount is not biologically meaningful. 309
Herrera-Saldana (1990) found different concentration of starch (% of DM), fraction A (%), and 310
kd (% h-1), respectively, for barley 64.3, 66.2, and 14.7; corn 75.7, 21.0, and 6.43; oats 58.1, 311
96.6, and 7.05; sorghum 71.3, 3.5 and 5.34; and wheat 70.3, 78.2, and 19.28. These values are 312
slightly higher than our data. This is likely related to grinding size as Herrera-Saldana ground 313
samples at 1-mm, whereas in this study a 2-mm sieve was used. In addition, their procedure used 314
to measure starch did not consider free glucose. Our methodology considered both free and 315
released glucose (Hall, 2015). The variation (SD = 18.8) in the ERD estimate ranged from 25.47 316
to 97.67%, with an average of 71.85%. This variation was higher than the observed (SD = 12.2) 317
in the meta-analysis by Ferraretto and Shaver (2015) which summarized ruminal in vivo starch 318

121
digestibility data ranging from 24.0 to 66.4% of the starch intake for dairy cows fed on TMR. 319
However, the variation in the present study is similar to the variation (SD = 18.5) of values 320
obtained in another meta-analysis conducted with in vivo data with a range of 22.4 to 94.2% and 321
an average of 68.1% of ruminal starch digestibility (Moharrery et al., 2014). These data suggest 322
that the in situ procedure may represent the variation of ruminal starch degradation of feedstuffs, 323
similarly to the in vivo evaluation. It should be emphasized that the calculated range in ruminal 324
digestibility of starch in feedstuffs, although biologically coherent, assumes a constant kp for all 325
starch sources. The concentration of starch in the diet, DMI, and source of starch are known 326
factors affecting starch kp and the role of the intestines on total tract starch digestibility (Oba and 327
Allen, 2003). The use of a constant starch kp for all feedstuffs is a major imprecision in 328
nutritional models attempting to predict ruminal starch degradation and its quantification under 329
different feeding scenarios is a plausible field for research aiming at improving the accuracy of 330
starch ERD predictions for ration formulation. 331
CONCLUSIONS 332
Although no effects of methodology were observed for starch fraction A in the present 333
study, the use of a washing machine for determination of fraction A may be the most effective at 334
reducing the potential variation between various technicians. Our results underscore that ruminal 335
in situ incubation at 120 h is necessary to determine fraction C of DM, but not for starch because 336
the residues were minimal (0.13% of starch, on average among all grinding sizes) and a model 337
with 2-pools represents the starch degradation kinetics. As expected, grinding size affected all 338
fractions, disappearance rate, and effective ruminal disappearance. A strong correlation was 339
observed between 0, 3, and 48 h of incubation and the whole set of time-points to determine 340
starch fractional disappearance rate suggesting that the use of fewer time-points is feasible. 341
122
ACKNOWLEDGMENTS 342
Appreciation is extended to Drs. A. T. Adesogan and D. Vyas (Department of Animal 343
Sciences, University of Florida, Gainesville, FL) and their group for the opportunity to use their 344
laboratory equipment during this experiment; and to Mr. Todd Pritchard (University of Florida 345
Dairy Research Unit, Gainesville, FL) for assisting with the use of cannulated cows. The authors 346
are also grateful to the Brazilian Federal Agency for Post-Graduate Education (CAPES; Brasilia, 347
DF, Brazil) and National Research Council (CNPq; Brasilia, DF, Brazil) for the grants to the 348
authors. 349
REFERENCES 350
Andreazzi, A. S. R., M. N. Pereira, R. B. Reis, R. A. N. Pereira, N. N. Morais Júnior, T. S. 351
Acedo, R. G. Hermes, and C. S. Cortinhas. (2018). Effect of exogenous amylase on lactation 352
performance of dairy cows fed a high starch diet. J. Dairy Sci. (in presse). 353
ASABE. 2007. Method of determining and expressing fineness of feed materials by sieving. 354
ANSI/ASAE S319.4:646–649. Am. Soc. Ag. Biol. Eng., St. Joseph, MI. 355
Baker, S., and T. Herrman. 2002. Evaluating particle size. MF-2051. Kansas State Univ., 356
Manhattan. 357
Batajoo, K. K., and R. D. Shaver. 1997. In situ dry matter, crude protein, and starch 358
degradabilities of selected grains and by-product feeds. Anim. Feed Sci. Technol. 71:165-359
176. 360
Benton, J. R., T. J. Klopfenstein, and G. E. Erickson. 2005. Effects of Corn Moisture and Length 361
of Ensiling on Dry Matter Digestibility and Rumen Degradable Protein. Nebraska Beef 362
Cattle Reports. Paper 151. http://digitalcommons.unl.edu/animalscinbcr/151. 363

123
De Boer, G., J. J. Murphy, and J. J. Kennelly. 1987. A modified method for determination of in 364
situ rumen degradation of feedstuffs. Can. J. Anim. Sci. 67:93−102. 365
Dias Junior, G. S., L. F. Ferraretto, G. G. S. Salvati, L. C. de Resende, P. C. Hoffman, M. N. 366
Pereira, and R. D. Shaver. 2016. Relationship between processing score and kernel-fraction 367
particle size in whole-plant corn silage. J. Dairy Sci. 99:2719–2729. 368
Dieho, K., B. Van den Bogert, G. Henderson, A. Bannink, J. Ramiro-Garcia, H. Smidt, and J. 369
Dijkstra. 2017. Changes in rumen microbiota composition and in situ degradation kinetics 370
during the dry period and early lactation as affected by rate of increase of concentrate 371
allowance. J. Dairy Sci. 100:2695–2710. 372
Dulphy, J. P., C. Demarquilly, R. Baumont, M. Jailler, L. L’Hotelier, and C. Dragomir. 1999. 373
Study of modes of preparation of fresh and conserved forage samples for measurement of 374
their dry matter and nitrogen degradations in the rumen. Ann. Zootechnol. 48:275–288. 375
Ferraretto, L. F., P. M. Crump, and R. D. Shaver. 2013. Effect of cereal grain type and corn grain 376
harvesting and processing methods on intake, digestion and milk production by dairy cows 377
through a meta-analysis. J. Dairy Sci. 96:533–550. 378
Ferraretto, L. F., and R. D. Shaver. 2012. Effect of corn shredlage on lactation performance and 379
total tract starch digestibility by dairy cows. Prof. Anim. Sci. 28:639–647. 380
Ferraretto, L. F., and R. D. Shaver. 2015. Effects of whole-plant corn silage hybrid type on 381
intake, digestion, ruminal fermentation, and lactation performance by dairy cows through a 382
meta-analysis. J. Dairy Sci. 98:1–14. 383
Ferreira, G., and D. R. Mertens. 2005. Chemical and physical characteristics of corn silages and 384
their effects of in vitro disappearance. J. Dairy Sci. 88:4414–4425. 385
124
Firkins, J. L., M. L. Eastridge, N. R. St-Pierre, and S. M. Noftsger. 2001. Effects of grain 386
variability and processing on starch utilization by lactating cattle. J. Anim. Sci. 79: E218-387
E238. 388
Fredin, S.M., L.F. Ferraretto, M.S. Akins1, P.C. Hoffman, R.D. Shaver. 2014. Fecal starch as an 389
indicator of total-tract starch digestibility by lactating dairy cows. J. Dairy Sci. 97:1862–390
1871. 391
Gallo, A., G. Giuberti, and F. Masoero. 2016. Gas production and starch degradability of corn 392
and barley meals differing in mean particle size. J. Dairy Sci. 99:4347–4359. 393
Hall, M. B. 2015. Determination of dietary starch in animal feeds and pet food by an enzymatic-394
colorimetric method: Collaborative study. J. Assoc. Off. Anal. Chem. 98:397-409. 395
Hall, M. B., and D. R. Mertens. 2017. A 100-Year Review: Carbohydrates—Characterization, 396
digestion, and utilization. J. Dairy Sci. 100:10078–10093. 397
Herrera-Saldana, R. E., J. T. Huber, and M. H. Poore. 1990. Dry matter, crude protein, and starch 398
degradability of five cereal grains. J. Dairy Sci. 73:2386–2393. 399
Hristov, A. N., S. Zaman, M. VanderPol, P. Szasz, K. Huber, and D. Greer. 2007. Effect of a 400
saponin-based surfactant and aging time on ruminal degradability of flaked corn grain dry 401
matter and starch. J. Anim. Sci. 85:1459–1466 402
Hoffman, P. C., N. M. Esser, R. D. Shaver, W. K. Coblentz, M. P. Scott, A. L. Bodnar, R J. 403
Schmidt, and R. C. Charley. 2011. Influence of ensiling time and inoculation on alteration of 404
the starch-protein matrix in high-moisture corn. J. Dairy Sci. 94:2465-2474. 405
Hoffman, P. C., R. D. Shaver, and D. R. Mertens. 2012. Feed Grain V2.0 Background and 406
development guide. Accessed Dec. 5, 2017. https://shaverlab.dysci.wisc.edu/spreadsheets. 407

125
Huntington, G. B. 1997. Starch utilization by ruminants: From basics to the bunk. J. Anim. Sci. 408
75:852–867. 409
Keim, J. P., X. Valderrama, D. Alomar, and I. F. López. 2013. In situ rumen degradation kinetics 410
as affected by type of pasture and date of harvest. Sci. Agric. 70:405-414. 411
Lanzas, C., C. J. Sniffen, S. Seo, L. O. Tedeschi, and D. G. Fox. 2007. A revised CNCPS feed 412
carbohydrate fractionation scheme for formulating rations for ruminants. Anim. Feed Sci. 413
Technol. 136:167–190. 414
Lopez, S. 2005. In vitro and In situ techniques for estimating digestibility. Pages 87-111 in 415
Quantitative Aspects of Ruminant Digestion and Metabolism. Dijkstra, J., J. M. Forbes, J. 416
France, 2nd ed. CABI puplishing, London, UK. 417
McAllister, T. A., R. C. Phillippe, L. M. Rode, and K.-J. Cheng. 1993. Effect of the protein 418
matrix on the digestion of cereal grains by ruminal microorganisms. J. Anim. Sci. 71:205–419
212. 420
Moharrery. A., M. Larsen, and M. R. Weisbjerg. 2014. Starch digestion in the rumen, small 421
intestine, and hind gut of dairy cows - A meta-analysis. Anim. Feed Sci. Technol. 192:1–14. 422
Nocek, J. E. 1988. In situ and Other Methods to Estimate Ruminal Protein and Energy 423
Digestibility: A Review. J. Dairy Sci. 71:2051-2069. 424
NRC. 2001. Nutrient Requirements of Dairy Cattle. 7th rev. ed. National Academies Press, 425
Washington, DC. 426
Oba, M., and M. S. Allen. 2003. Effects of corn grain conservation method on ruminal digestion 427
kinetics for lactating dairy cows at two dietary starch concentrations. J. Dairy Sci. 86:184-428
194. 429
126
Owens, C.E., R.A. Zinn, A. Hassen, N.F. Owens. 2016. Mathematical linkage of total-tract 430
digestion of starch and neutral detergent fiber to their fecal concentrations and the effect of 431
site of starch digestion on extent of digestion and energetic efficiency of cattle. Prof. Anim. 432
Sci. 32:531–549. 433
Peyrata, J., P. Nozièrea, A. Le Morvana, A.Férard, P. V. Protin, and R. Baumon. 2014. Effects of 434
ensiling maize and sample conditioning on in situ rumen degradation of dry matter, starch 435
and fibre. Anim. Feed Sci. Technol. 196:12–2. 436
Philippeau, C., and B. Michalet-Doreau. 1997. Influence of genotype and stage of maturity of 437
maize on rate of ruminal starch degradation. Anim. Feed Sci. Technol. 68:25–35. 438
Ramsey, P. B., G. W. Mathison, L. A. Goonewardene. 2001. Relationships between rumina dry 439
matter and starch disappearance and apparent digestibility of barley grain. Anim. Feed Sic. 440
Technol. 94:155-170. 441
Seifried, N., H. Steinga, W. Schipprack, and M. Rodehutscord. 2016. Variation in ruminal in situ 442
degradation of crude protein and starch from maize grains compared to in vitro gas 443
production kinetics and physical and chemical characteristics. Arch. Anim. Nutr. 70:333–444
349. 445
Tylutki, T. P., D. G. Fox, V. M. Durbal, L. O. Tedeschi, J. B. Russell, M. E. Van Amburgh, T. R. 446
Overton, L. E. Chase, and A. N. Pell. 2007. Cornell Net Carbohydrate and Protein System: 447
A model for precision feeding of dairy cattle. Anim. Feed Sci. Technol. 143:174-202. 448
Vanzant, E. S., R. C. Cochran, and E. C. Titgemeyer. 1998. Standardization of In situ 449
Techniques for Ruminant Feedstuff Evaluation. J. Anim. Sci. 76:2717–2729. 450

127
Volden, H., and M. Larsen. 2011. Digestion and metabolism in the gastrointestinal tract. In: 451
Volden, H. (Ed.), NorFor – The Nordic Feed Evaluation System. EAAP Publication No. 452
130. Wageningen Academic Publishers, Wageningen, The Netherlands, pp.59–80. 453
454

128
Table 1. Dry matter and starch concentrations, particle size distribution, geometric mean particle 455
size (GMPS), and surface area of dry corn ground at varying grinding sizes 456
Grinding size
1-mm 2-mm 4-mm 6-mm
Dry matter, % of as fed 89.5 89.5 89.5 89.3
Starch, % of DM 65.8 66.5 65.2 66.1
Free Glucose, % of DM 0.63 0.71 0.63 0.68
Sieves,1 µm --- % of particles retained, DM basis ---
3350 0.0 0.0 0.1 3.9
2360 0.3 0.1 1.6 24.5
1700 0.3 0.1 13.9 35.7
1180 0.7 17.9 55.7 21.6
600 80.0 73.5 22.7 11.0
300 17.0 6.2 4.3 2.3
150 1.6 1.9 1.5 0.9
Bottom pan 0.1 0.1 0.1 0.1
GMPS, µm 390 468 746 1,181
Surface area, cm2/g 41.0 39.2 34.2 29.0
457
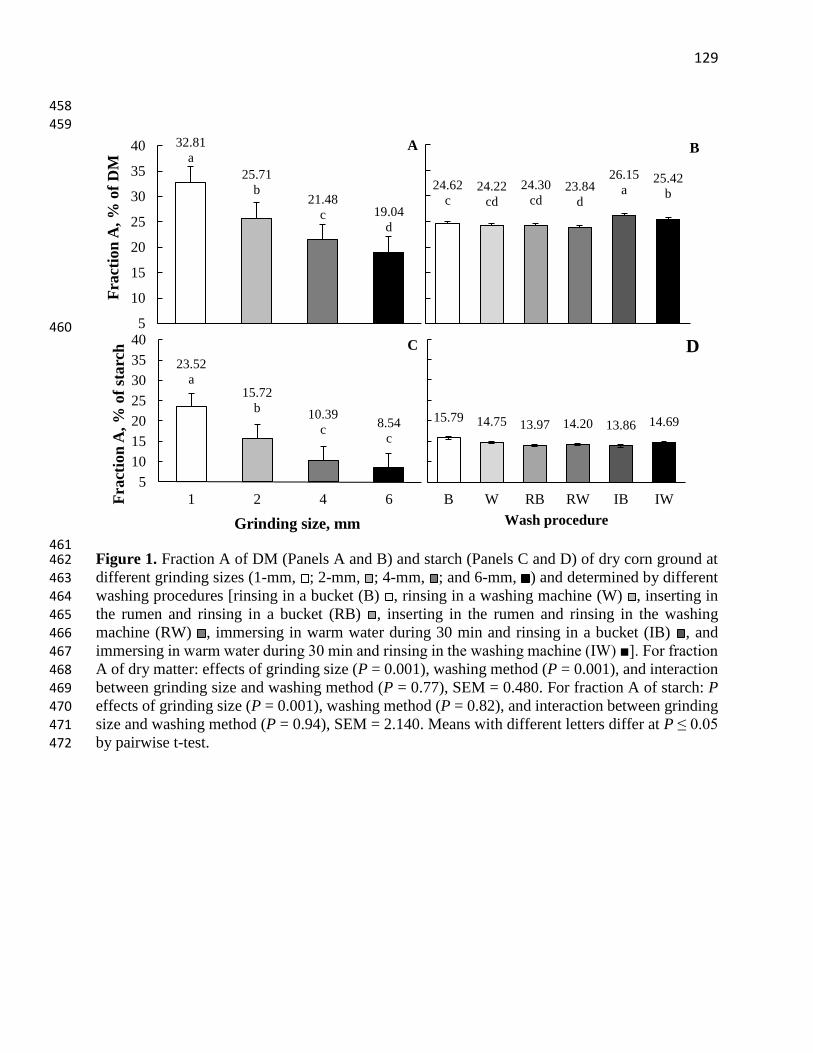
129
458
459
460
461 Figure 1. Fraction A of DM (Panels A and B) and starch (Panels C and D) of dry corn ground at 462
different grinding sizes (1-mm, ; 2-mm, ; 4-mm, ; and 6-mm, ) and determined by different 463 washing procedures [rinsing in a bucket (B) , rinsing in a washing machine (W) , inserting in 464
the rumen and rinsing in a bucket (RB) , inserting in the rumen and rinsing in the washing 465 machine (RW) , immersing in warm water during 30 min and rinsing in a bucket (IB) , and 466 immersing in warm water during 30 min and rinsing in the washing machine (IW) ■]. For fraction 467
A of dry matter: effects of grinding size (P = 0.001), washing method (P = 0.001), and interaction 468 between grinding size and washing method (P = 0.77), SEM = 0.480. For fraction A of starch: P 469
effects of grinding size (P = 0.001), washing method (P = 0.82), and interaction between grinding 470 size and washing method (P = 0.94), SEM = 2.140. Means with different letters differ at P ≤ 0.05 471
by pairwise t-test. 472
32.81
a
25.71
b21.48
c 19.04
d
5
10
15
20
25
30
35
40
Fra
ctio
n A
, %
of
DM
A
24.62
c24.22
cd
24.30
cd23.84
d
26.15
a25.42
b
B
23.52
a15.72
b10.39
c8.54
c
5
10
15
20
25
30
35
40
1 2 4 6Fra
ctio
n A
, %
of
sta
rch
Grinding size, mm
C
15.79 14.75 13.97 14.20 13.86 14.69
B W RB RW IB IW
Wash procedure
D

130
473
474
475 Figure 2. Relationship of the instantaneously degradable Fraction A of DM and starch of dry corn 476 ground at different grinding sizes (1-mm ●, 2-mm ▲, 4-mm ◆, and 6-mm ) and determined by 477
different washing procedures. Prediction equation: Y = - 12.647 + 1.098 X; n = 144, root mean 478
square error = 15.63, R2 = 0.75, P < 0.001. 479 480 481
0
10
20
30
40
0 10 20 30 40
Fra
ctio
n A
, %
of
starc
h
Fraction A, % of DM
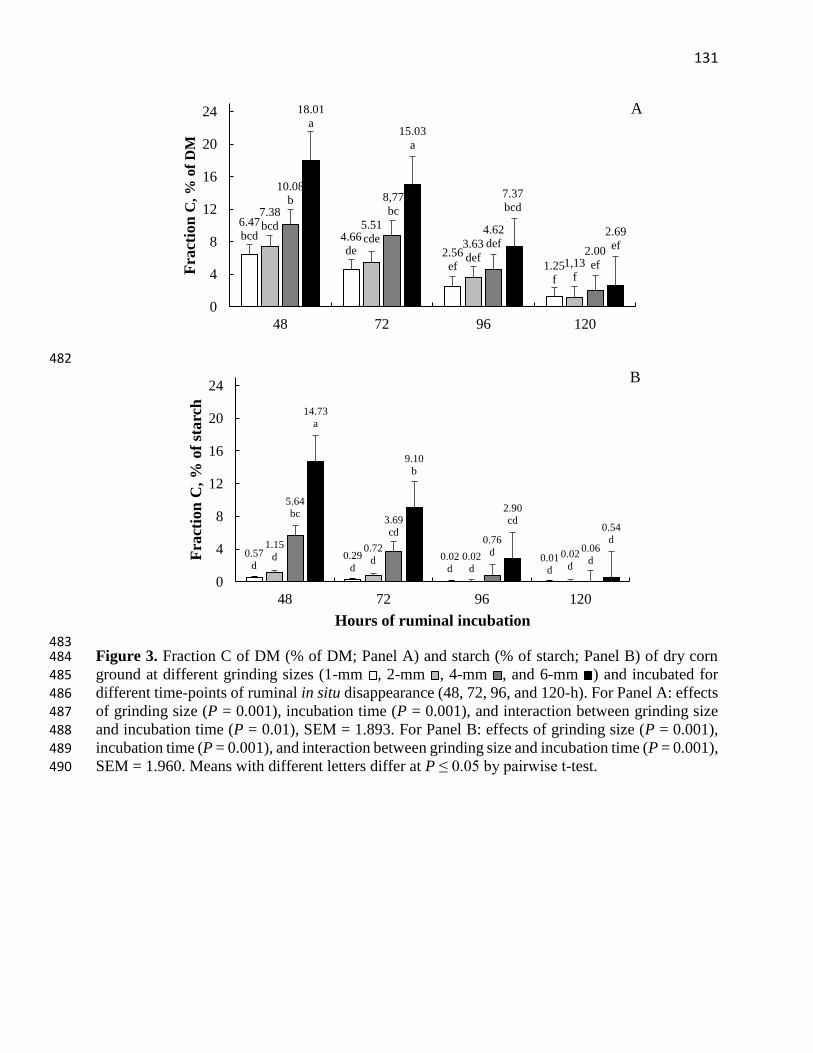
131
482
483 Figure 3. Fraction C of DM (% of DM; Panel A) and starch (% of starch; Panel B) of dry corn 484 ground at different grinding sizes (1-mm , 2-mm , 4-mm , and 6-mm ) and incubated for 485 different time-points of ruminal in situ disappearance (48, 72, 96, and 120-h). For Panel A: effects 486
of grinding size (P = 0.001), incubation time (P = 0.001), and interaction between grinding size 487 and incubation time (P = 0.01), SEM = 1.893. For Panel B: effects of grinding size (P = 0.001), 488 incubation time (P = 0.001), and interaction between grinding size and incubation time (P = 0.001), 489
SEM = 1.960. Means with different letters differ at P ≤ 0.05 by pairwise t-test. 490
6.47
bcd 4.66
de 2.56
ef 1.25
f
7.38
bcd 5.51
cde 3.63
def 1,13
f
10.08
b 8,77
bc
4.62
def2.00
ef
18.01
a15.03
a
7.37
bcd
2.69
ef
0
4
8
12
16
20
24
48 72 96 120
Fra
ctio
nC
, %
of
DM
A
0.57
d0.29
d0.02
d0.01
d
1.15
d0.72
d 0.02
d
0.02
d
5.64
bc3.69
cd0.76
d 0.06
d
14.73
a
9.10
b
2.90
cd0.54
d
0
4
8
12
16
20
24
48 72 96 120
Fra
ctio
n C
, %
of
starc
h
Hours of ruminal incubation
B

132
491 Figure 4. Relationship of the Fraction C of DM and starch (residue of the 120-h ruminal in situ 492
incubation) of dry corn ground at different grinding sizes (1-mm ●, 2-mm ▲, 4-mm ◆, 6-mm ). 493
Prediction equation: Y = - 0.3532 + 0.2889 X; n = 24, root mean square error = 0.27, R2 = 0.66, P 494
< 0.001. 495
-1
0
1
2
3
4
-1 0 1 2 3 4
Fra
ctio
n C
, %
of
starc
h
Fraction C, % of DM
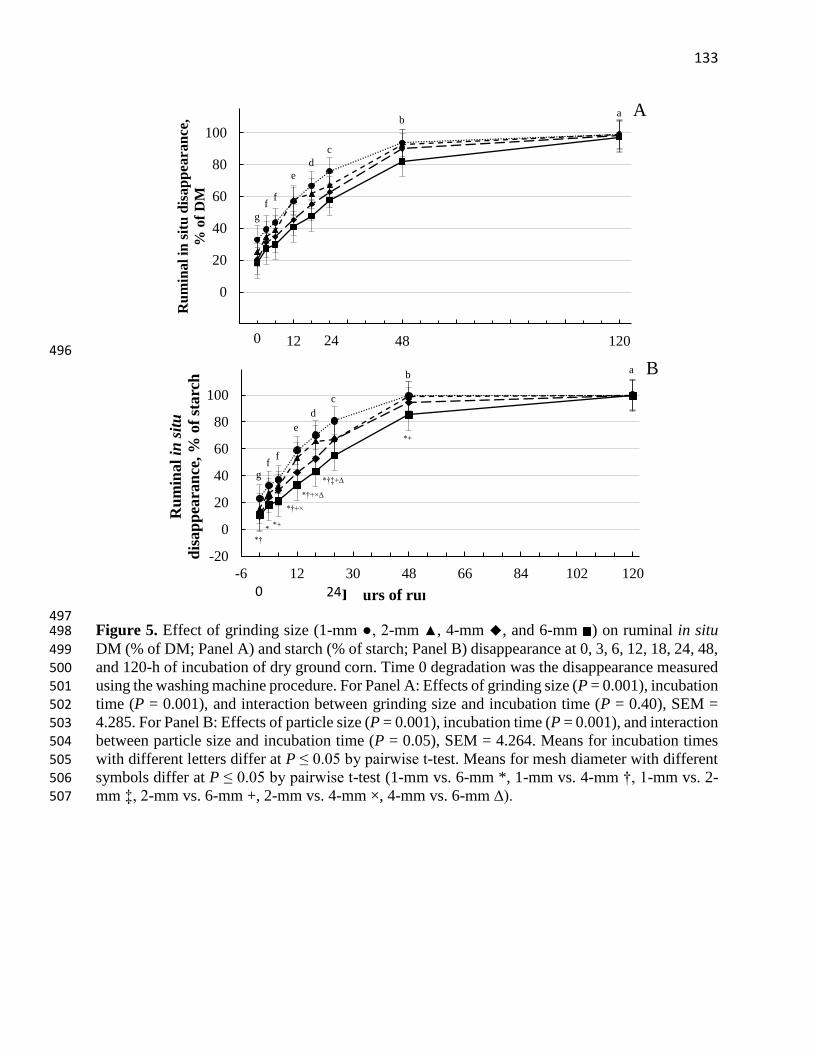
133
496
497 Figure 5. Effect of grinding size (1-mm ●, 2-mm ▲, 4-mm ◆, and 6-mm ) on ruminal in situ 498
DM (% of DM; Panel A) and starch (% of starch; Panel B) disappearance at 0, 3, 6, 12, 18, 24, 48, 499
and 120-h of incubation of dry ground corn. Time 0 degradation was the disappearance measured 500 using the washing machine procedure. For Panel A: Effects of grinding size (P = 0.001), incubation 501 time (P = 0.001), and interaction between grinding size and incubation time (P = 0.40), SEM = 502
4.285. For Panel B: Effects of particle size (P = 0.001), incubation time (P = 0.001), and interaction 503 between particle size and incubation time (P = 0.05), SEM = 4.264. Means for incubation times 504 with different letters differ at P ≤ 0.05 by pairwise t-test. Means for mesh diameter with different 505 symbols differ at P ≤ 0.05 by pairwise t-test (1-mm vs. 6-mm *, 1-mm vs. 4-mm †, 1-mm vs. 2-506 mm ‡, 2-mm vs. 6-mm +, 2-mm vs. 4-mm ×, 4-mm vs. 6-mm ∆). 507
g
ff
e
d
c
ba
-20
0
20
40
60
80
100
-6 12 30 48 66 84 102 120
Ru
min
al
in s
itu
dis
ap
pea
ran
ce,
% o
f D
M
A
0 24
gf
f
e
d
c
ba
*†
**+
*†+×
*†+×∆
*†‡+∆
*+
-20
0
20
40
60
80
100
-6 12 30 48 66 84 102 120
Ru
min
al
in s
itu
dis
ap
pea
ran
ce, %
of
starc
h
Hours of ruminal incubation
B
0 24

134
508 Figure 6. Relationship of ruminal disappearance of DM and starch of dry corn ground at different 509 grinding sizes (1, 2, 4, and 6-mm) and incubated in situ for 3-h (+), 6-h (◇), 12-h (□), 18-h (△), 510
24-h (○), and 48-h (×). Prediction equation: Y = - 14.394 + 1.2245 X; n = 144, root mean square 511 error = 59.89, R2 = 0.97, P < 0.001. 512 513
0
20
40
60
80
100
0 20 40 60 80 100
Ru
min
al
in s
itu
dis
ap
pea
ran
ce,
% o
f st
arc
h
Ruminal in situ disappearance,
% of DM

135
Table 2. Fractions A, B, and C1, fractional disappearance rate of Fraction B (kd), effective ruminal disappearance (ERD2) estimated 514 with differing ruminal fractional passage rates (kp) of dry corn ground at different grinding sizes (GS; 1, 2, 4, and 6-mm) and subjected 515
to ruminal in situ incubations for 0, 3, 6, 12, 18, 24, and 48-h. Two (Fractions A and B) or 3-pool models (Fractions A, B, and C) were 516 used to estimate the ruminal disappearance parameters. 517
Mesh Diameter
SEM P-value
1-mm 2-mm 4-mm 6-mm
3-Pool 2-Pool 3-Pool 2-Pool 3-Pool 2-Pool 3-Pool 2-Pool GS Model GS*Model
Dry matter
Fraction A, % 32.75 32.75 25.10 25.10 20.56 20.56 18.46 18.46
Fraction B, % 66.00 67.25 73.77 74.90 77.44 79.44 78.85 81.54 0.138 < 0.01 < 0.01 < 0.01
Fraction C, % 1.25 1.13 2.00 2.69 0.188 < 0.01
kd, % h-1 5.39 4.99 5.06 4.75 4.89 4.37 3.43 3.16 0.297 < 0.01 0.09 0.98
ERD 13-, % of DM 59.09 59.59 53.66 54.10 48.82 49.64 40.46 42.58 1.163 < 0.01 0.26 0.88
ERD 24, % of DM 60.48 61.00 55.20 55.65 50.42 51.24 41.95 44.06 1.189 < 0.01 0.27 0.88
ERD 35, % of DM 48.10 48.69 41.64 42.19 36.53 37.50 29.66 31.87 0.841 < 0.01 0.09 0.74
Starch
Fraction A, % 23.00 23.00 15.40 15.40 9.92 9.92 10.69 10.69
Fraction B, % 76.98 77.00 84.58 84.60 90.02 90.08 88.77 89.30 0.072 < 0.01 0.01 0.01
Fraction C, % 0.02 0.02 0.06 0.54 0.098 0.01
kd, % h-1 10.72 10.65 9.61 9.56 6.24 6.22 3.98 3.92 0.406 < 0.01 0.86 0.99
ERD 1, % of starch 68.05 67.95 62.50 62.43 50.22 50.23 40.64 41.03 1.020 < 0.01 0.94 0.99
ERD 2, % of starch 69.65 69.55 64.28 64.21 52.13 52.14 42.38 42.77 1.052 < 0.01 0.94 0.99
ERD 3, % of starch 53.67 53.57 46.83 46.76 34.83 34.69 27.69 28.11 0.749 < 0.01 0.91 0.98 1A = soluble fraction, B = slowly degradable fraction, C = undigested fraction; Fraction C was the residue of a 120-h incubation. 518 2ERD = Fraction A + Fraction B × [kd / (kd + kp)] 519 3ERD 1 = kp estimated by the Cornel Net Carbohydrate and Protein System, 7.47 % h-1 (Tylutki et al., 2008) 520 4ERD 2 = kp estimated by the Nordic Feed Evaluation System, 6.85 % h-1 (Volden and Larsen, 2011) 521 5ERD 3 = kp of 16.0 % h-1 (Hoffman et al., 2012) 522
523

136
524
525
526 Figure 7. Relationship between the fractional disappearance rate of Fraction B (kd) estimated with 527 a 2-pool model (Fractions A and B) of DM and starch of dry corn ground at different grinding 528
sizes (1-mm ●, 2-mm ▲, 4-mm ◆, and 6-mm ). Prediction equation: Y = - 5.2317 + 3.0882 X; n 529
= 24, root mean square error = 8.15, R2 = 0.88, P < 0.001. 530 531
0
3
6
9
12
15
0 3 6 9 12 15
kd
, %
of
starc
h
kd, % of DM

137 Table 3. The linear correlation coefficients between the fractional disappearance rate (kd) of starch estimated with all ruminal 532 incubation time-points (Times. 0, 3, 6, 12, 18, 24, and 48-h) and the kd estimated with 3 or 2 incubation time-points using a 2-pool 533 model (Fractions A and B) 1 534
Times kd, % h-1 r P-value Linear regression2 Times kd, % h-1 r P-value Linear regression1
0, 3, 6 3.31 0.350 0.261 Y = 5.167 + 0.712 X 0, 18 4.15 0.882 < 0.001 Y = - 0.414 + 1.912 X
0, 3, 12 3.89 0.422 0.166 Y = 4.327 + 0.820 X 0, 24 4.47 0.749 0.004 Y = 2.313 + 1.166 X
0, 3, 18 3.94 0.903 < 0.001 Y = 0.490 + 1.783 X 0, 48 7.73 0.997 < 0.001 Y = - 0.229 + 1.003 X
0, 3, 24 4.32 0.749 0.004 Y = 2.909 + 1.069 X 3, 6 0.73 0.355 0.253 Y = 7.650 + 0.177 X
0, 3, 48 7.74 0.998 < 0.001 Y = 0.030 + 0.968 X 3, 12 3.07 0.468 0.119 Y = 5.634 + 0.614 X
0, 6, 12 4.14 0.347 0.265 Y = 4.682 + 0.686 X 3, 18 3.51 0.834 < 0.001 Y = 3.180 + 1.237 X
0, 6, 18 4.21 0.884 < 0.001 Y = - 0.242 + 1.844 X 3, 24 4.06 0.727 0.006 Y = 3.966 + 0.877 X
0, 6, 24 4.56 0.739 0.005 Y = 2.589 + 1.082 X 3, 48 7.75 0.997 < 0.001 Y = 0.395 + 0.919 X
0, 6, 48 7.96 0.997 < 0.001 Y = - 0.134 + 0.962 X 6, 12 4.97 0.152 0.636 Y = 6.882 + 0.129 X
0, 12, 18 4.15 0.876 < 0.001 Y = - 0.980 + 2.049 X 6, 18 4.57 0.846 < 0.001 Y = 1.289 + 1.363 X
0, 12, 24 4.47 0.749 0.004 Y = 2.313 + 1.166 X 6, 24 4.85 0.704 0.009 Y = 3.398 + 0.850 X
0, 12, 48 8.00 0.997 < 0.001 Y = - 0.037 + 0.945 X 6, 48 8.36 0.996 < 0.001 Y = 0.029 + 0.897 X
0, 18, 24 4.39 0.814 0.001 Y = 1.247 + 1.428 X 12, 18 4.17 0.629 0.025 Y = 5.630 + 0.454 X
0, 18, 48 7.94 0.997 < 0.001 Y = - 0.172 + 0.968 X 12, 24 4.79 0.611 0.031 Y = 5.246 + 0.475 X
0, 24, 48 7.73 0.997 < 0.001 Y = - 0.229 + 1.003 X 12, 48 8.92 0.993 < 0.001 Y = 0.547 + 0.782 X
0, 3 7.35 - 0.191 0.055 Y = 8.247 - 0.099 X 18, 24 5.42 0.359 0.248 Y = 6.527 + 0.184 X
0, 6 3.31 0.350 0.261 Y = 5.167 + 0.712 X 18, 48 9.87 0.993 < 0.001 Y = 0.257 + 0.736 X
0, 12 4.14 0.347 0.265 Y = 4.682 + 0.686 X 24, 48 10.98 0.938 < 0.001 Y = 1.075 + 0.587 X 1Twelve samples of dry corn per incubation time were ground through sieves varying in mesh diameter and incubated in 3 rumen 535
cannulated cows. Time 0 degradation was the disappearance measured by wash with a washing machine. The kd estimated with all 536
incubation times was 7.52 % h-1 537 2Y = kd estimated with all incubation times. X = kd estimated with 2 or 3 incubation times. 538 539

138 Table 4. Feed starch concentration, fractions A, B, and C1, fractional disappearance rate of Fraction B (kd), effective ruminal 540 disappearance (ERD2) estimated with differing ruminal fractional passage rates (kp). All samples were ground at 2-mm 541
Feed
Starch
% of DM
Fraction A
% of starch
Fraction B
% of starch
kd
% h-1
ERD 13
% of starch
ERD 24
% of starch
ERD 35
% of starch
Residue 120h
% of starch
Barley, grain 1 71.46 35.71 64.29 10.98 73.97 75.30 61.87 0.004
Barley, grain 2 71.77 33.70 66.30 11.49 73.88 74.84 61.41 0.003
Cassava, root 79.87 94.06 5.94 7.59 97.05 97.31 95.97 0.003
Cassava, starch waste 1 48.17 22.15 77.85 7.73 61.74 63.16 47.51 0.060
Cassava, starch waste 2 51.44 23.97 76.03 7.46 61.97 63.73 48.16 0.068
Corn, grain from silage6 1 72.15 30.81 69.19 6.84 63.13 69.88 51.14 0.011
Corn, grain from silage 2 72.18 13.83 86.17 5.75 50.80 57.72 36.37 0.004
Corn, grain from silage 3 74.23 84.84 15.16 6.50 91.89 92.05 89.22 0.007
Corn, grain from silage 4 77.87 74.00 26.00 8.63 87.93 88.31 83.11 0.001
Corn, grain from silage 5 79.42 82.45 17.55 6.74 90.77 91.13 87.65 0.003
Corn, grain ground BR 1 66.19 13.50 86.50 3.52 40.79 47.48 28.94 0.007
Corn, grain ground BR 2 67.02 13.36 86.64 6.44 52.32 61.56 37.64 0.004
Corn, grain ground BR 3 68.72 24.78 75.22 4.83 53.80 60.32 42.00 0.015
Corn, grain ground BR 4 69.29 21.03 78.97 5.44 53.24 62.00 40.57 0.002
Corn, grain ground BR 5 71.17 20.19 79.81 5.67 54.03 61.02 40.79 0.003
Corn, grain ground BR 6 72.35 26.05 73.95 4.53 53.33 60.30 42.10 0.024
Corn, grain ground US 1 56.76 29.35 70.65 6.87 63.01 67.11 50.47 0.026
Corn, grain ground US 2 57.67 15.69 84.31 6.89 55.82 61.49 40.90 0.002
Corn, ground grain US 3 69.88 56.37 43.63 8.60 79.61 82.05 71.56 0.003
Corn, rehydrated and ensiled grain 1 62.65 36.25 63.75 4.65 41.45 50.18 27.03 0.002
Corn, rehydrated and ensiled grain 2 66.75 95.41 4.59 5.00 97.20 97.67 96.48 0.004
Corn, rehydrated and ensiled grain 3 66.88 87.47 12.53 5.34 92.69 93.02 90.61 0.004
Corn, rehydrated and ensiled grain 4 69.11 33.97 66.03 4.75 40.16 50.55 25.47 0.005
Corn, rehydrated and ensiled grain 5 69.59 49.32 50.68 6.25 72.31 74.98 63.50 0.004
Corn, rehydrated and ensiled grain 6 70.44 83.82 16.18 5.27 90.44 89.91 87.79 0.004
Corn, steam-flaked grain BR 1 82.89 18.80 81.20 8.93 63.02 64.87 47.89 0.004
Corn, steam-flaked grain BR 2 85.61 27.15 72.85 9.41 67.57 71.62 54.01 0.004

139
Corn, steam-flaked grain BR 3 86.81 30.99 69.01 10.73 71.66 72.88 58.68 0.002
Corn, steam-flaked grain US 70.78 42.47 57.53 8.63 73.22 75.91 62.58 0.033
Corn, whole-plant silage BR 1 19.03 80.53 19.47 2.82 85.83 85.38 83.44 0.232
Corn, whole-plant silage BR 2 19.85 31.38 68.62 5.28 59.69 58.96 48.36 0.148
Corn, whole-plant silage BR 3 22.29 61.33 38.67 4.81 76.45 78.12 70.26 0.125
Corn, whole-plant silage BR 4 34.89 88.28 11.72 3.93 92.31 92.19 90.59 0.073
Corn, whole-plant silage US 33.15 69.93 30.07 5.51 82.67 83.90 77.62 0.006
Oats, rolled grain 1 59.08 81.81 18.19 6.51 90.28 90.52 87.07 0.006
Oats, rolled grain 2 60.54 92.50 7.50 5.19 95.57 95.64 94.34 0.007
Oats, rolled grain 3 65.30 96.14 3.86 3.96 97.48 97.58 96.90 0.009
Potato, root 1 65.78 76.45 23.55 8.51 88.81 90.74 84.52 0.003
Potato, root 2 67.39 71.67 28.33 11.18 88.61 88.49 83.30 0.004
Potato, root 3 69.83 81.09 18.91 10.63 92.19 92.53 88.63 0.003
Sorghum, ground grain 1 71.18 27.05 72.95 4.73 54.16 63.04 43.19 0.456
Sorghum, ground grain 2 71.61 31.87 68.13 3.35 52.26 59.55 43.41 1.444
Sorghum, rehydrated and ensiled grain 1 64.21 26.29 73.71 3.56 48.35 59.44 39.07 0.485
Sorghum, rehydrated and ensiled grain 2 65.86 49.81 50.19 4.04 67.06 71.63 59.79 1.100
Sorghum, rehydrated and ensiled grain 3 66.36 23.30 76.70 4.00 47.97 60.00 37.82 0.290
Sorghum, rehydrated and ensiled grain 4 72.59 45.45 54.55 3.51 62.23 68.38 55.02 0.939
Sweet potato, root 1 62.78 82.00 18.00 10.28 92.38 92.22 89.01 0.006
Sweet potato, root 2 64.78 84.32 15.68 9.28 93.00 93.37 90.07 0.016
Sweet potato, root 3 64.79 89.17 10.83 7.88 94.73 94.95 92.74 0.000
Wheat, bran 1 18.08 78.96 21.04 3.26 85.36 85.86 82.52 0.315
Wheat, bran 2 18.63 81.18 18.82 2.41 85.76 86.37 83.64 0.308
Wheat, bran 3 19.51 52.27 47.73 2.11 62.72 64.79 57.81 0.560
Wheat, flour 1 68.04 91.30 8.70 5.26 94.85 94.80 93.43 0.271
Wheat, flour 2 69.91 86.93 13.07 6.51 93.02 93.28 90.71 0.020
Wheat, ground grain 75.15 50.45 49.55 9.36 78.00 79.36 68.74 0.010
Wheat, rolled grain 63.18 60.05 39.95 8.43 81.20 82.78 73.82 0.003
Mean 62.19 53.80 46.20 6.39 73.42 76.47 65.66 0.128
Maximum 86.81 96.14 86.64 11.49 97.48 97.67 96.90 1.44

140
Minimum 18.08 13.36 3.86 2.11 40.16 47.48 25.47 0.00
Standard deviation 17.68 27.97 27.97 2.44 17.63 14.69 21.98 0.285
Coefficient of variation 28.43 51.98 60.55 38.17 24.01 19.22 33.47 223.363 1A = soluble fraction, B = slowly degradable fraction, C = undigested fraction; Fraction C was the residue of a 120-h incubation. 542 2ERD = Fraction A + Fraction B × [kd / (kd + kp)] 543 3ERD 1 = kp estimated by the Cornel Net Carbohydrate and Protein System, 7.47 % h-1 (Tylutki et al., 2008) 544 4ERD 2 = kp estimated by the Nordic Feed Evaluation System, 6.85 % h-1 (Volden and Larsen, 2011) 545 5ERD 3 = kp of 16.0 % h-1 (Hoffman et al., 2012). 546 6Corn grain hand-picked from whole-plant corn silage. 547
548
549 550
551 552