Embed Size (px)
Citation preview

Energy Conversion and Management 81 (2014) 322–329
Contents lists available at ScienceDirect
Energy Conversion and Management
journal homepage: www.elsevier .com/locate /enconman
Characterization of phase change materials for thermal controlof photovoltaics using Differential Scanning Calorimetryand Temperature History Method
http://dx.doi.org/10.1016/j.enconman.2014.02.0420196-8904/� 2014 Elsevier Ltd. All rights reserved.
Abbreviations: CL, eutectic mixture of capric–lauric acid; CP, eutectic mixture ofcapric–palmitic acid; DSC, Differential Scanning Calorimetry; EG, expanded graph-ite; LDPE, low-density polyethylene; (P(BMA-co-MAA)), p(n-butyl methacrylate-co-methacrylic acid); PCM, phase change material; PEG, polyethylene glycol; PGMA,polyethylene glycol poly (glycidyl methacrylat); PUs, polyurethane polymers; RT20,a commercial paraffin wax; SP22, a commercial blend of salt hydrate and paraffinwax; THM, Temperature History Method.⇑ Corresponding author. Tel.: +971 555454069.
E-mail address: [email protected] (A. Hasan).
A. Hasan a,⇑, S.J. McCormack b, M.J. Huang c, B. Norton d
a Department of Architectural Engineering, College of Engineering, United Arab Emirates University, P.O. Box 15551, Al Ain, UAEb Department of Civil, Structure and Environmental Engineering, University of Dublin, Trinity College, Dublin 2, Irelandc Centre for Sustainable Technologies, University of Ulster, Newtownabbey, N. Ireland BT370QB, UKd Dublin Energy Lab., Focas Institute, School of Physics, Dublin Institute of Technology, Kevin St., Dublin 8, Ireland
a r t i c l e i n f o a b s t r a c t
Article history:Received 7 November 2013Accepted 19 February 2014
Keywords:Phase change materialsThermal controlPhotovoltaicsTemperature History Method
Five solid–liquid phase change materials comprising three basic classes, paraffin waxes, salt hydrates andmixtures of fatty acids were thermophysically characterized for thermal regulation applications in photo-voltaics. The PCM were investigated using Differential Scanning Calorimetry and Temperature HistoryMethod to find their thermophysical properties of interest. The relationship between thermophysicalproperties of the PCM and their choice as temperature regulators in photovoltaics is discussed in relationto the ambient conditions under which PV systems operate.
� 2014 Elsevier Ltd. All rights reserved.
1. Introduction range [7], which results in temperature induced power failure as
Silicon photovoltaics (PV) show a power drop of �0.3%/K up to�0.65%/K [1,2] above 25 �C panel temperature depending on typeof the PV cell and the manufacturing technology [3]. Various math-ematical correlations have been developed to describe dependenceof PV operating temperature on climatic conditions and PV materi-als [4]. The operating temperature reached by PV panels and asso-ciated power drop largely depends on the climate of the site. InGermany 50% of the solar radiation incident on a PV panel is above600 W/m2 while in Sudan this value reaches 80% resulting differentoperating temperatures and associated power drop [5,6]. A maxi-mum PV operating temperature of 125 �C has been reported insouthern Libya (27.6 N and 14.2 E) resulting in a 69% reductionin the nominal power [7]. The advisable operating temperaturelimit for PV ranges from �40 to 85 �C [8] however in hot and aridclimates, PV temperature frequently rises above this temperature
well as PV cell delamination and rapid degradation [9] urging astrong need for PV temperature regulation to maximize both panelpower output and lifetime.
In an attempt to avoid temperature dependant PV power loss,passive cooling of PV with paraffin wax based solid–liquid phasechange materials (PCMs) was evaluated both experimentally andnumerically. The PCM was contained in a rectangular aluminiumcontainer with internal dimension of (300 mm � 132 mm �40 mm) and front surface of the container was selectively coatedto mimic a PV cell attached to the surface [9]. Temperature distri-butions on the front surface and inside the PCM were measuredand validated through a 2D as well as a 3D finite volume heattransfer model [10,11]. Building on this work, Hasan et al. 2010,replaced the selective coating meant to mimic the PV cell withan actual PV cell encapsulated in perspex sheet and evaluated 5PCMs under various solar radiation intensities to mimic differentweather conditions. Two PCMs, a eutectic mixture of capric acid–palmitic acid and a salt hydrate CaCl2�6H2O achieved relativelyhigher temperature regulation at all solar radiation intensities[12]. A temperature regulation of 18 �C was recorded for 30 minand 10 �C for 5 h at 1000 W/m2 insulation and 23 �C ambient tem-perature. Huang et al. [13] evaluated the insertion of metallic finsin the PV-PCM systems previously investigated [10,11] andreported an improvement in temperature regulation due toincreased natural convection. A simulation study was conducted
Nomenclature
SymbolsAc convective heat transfer areaBi biot numbercp,l mean specific heat capacity of liquid PCMcps mean specific heat capacity of solid PCMcp,t specific heat capacity of test tubecp,w mean specific heat capacity of waterHm latent heat of fusion of PCMhc convective heat loss coefficient
mp mass of PCMmt mass of test tubemw mass of watert1 start of solidification timet2 end of solidification timeTo cooling curve start pointTr reference fluid (water) temperatureTs start of solidification temperatureT1,a ambient temperature
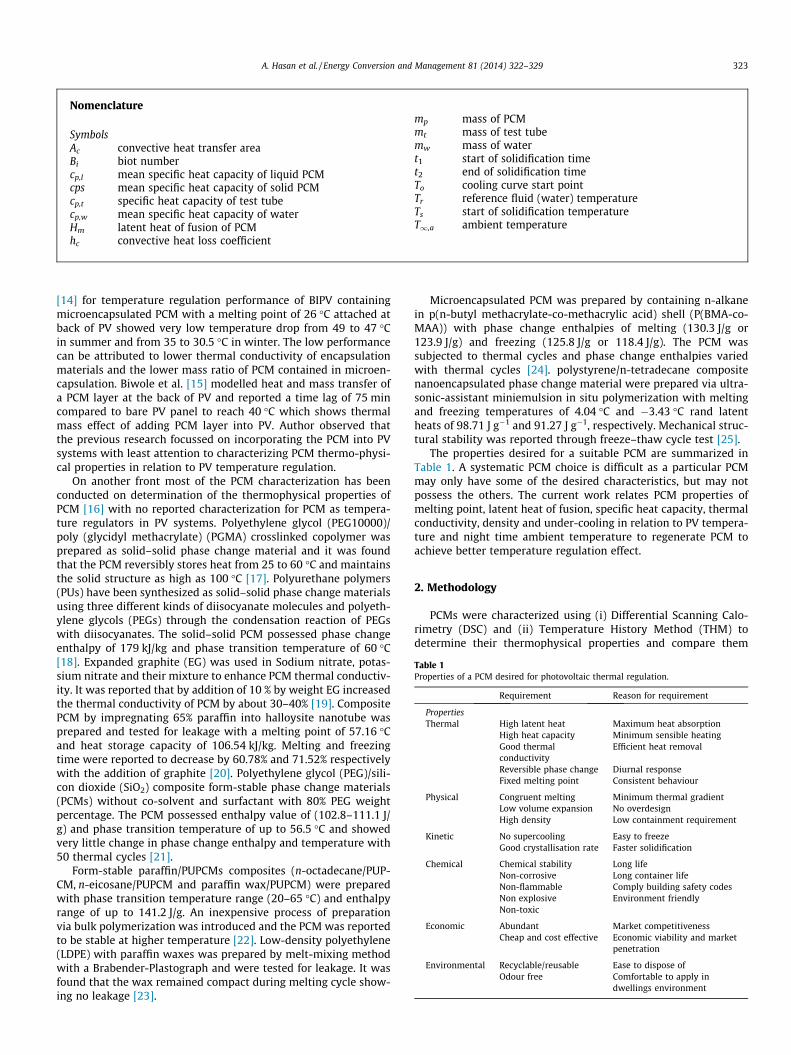
Table 1Properties of a PCM desired for photovoltaic thermal regulation.
Requirement Reason for requirement
PropertiesThermal High latent heat Maximum heat absorption
High heat capacity Minimum sensible heatingGood thermalconductivity
Efficient heat removal
Reversible phase change Diurnal responseFixed melting point Consistent behaviour
Physical Congruent melting Minimum thermal gradientLow volume expansion No overdesignHigh density Low containment requirement
Kinetic No supercooling Easy to freezeGood crystallisation rate Faster solidification
Chemical Chemical stability Long lifeNon-corrosive Long container lifeNon-flammable Comply building safety codesNon explosive Environment friendlyNon-toxic
Economic Abundant Market competitivenessCheap and cost effective Economic viability and market
penetration
Environmental Recyclable/reusable Ease to dispose ofOdour free Comfortable to apply in
dwellings environment
A. Hasan et al. / Energy Conversion and Management 81 (2014) 322–329 323
[14] for temperature regulation performance of BIPV containingmicroencapsulated PCM with a melting point of 26 �C attached atback of PV showed very low temperature drop from 49 to 47 �Cin summer and from 35 to 30.5 �C in winter. The low performancecan be attributed to lower thermal conductivity of encapsulationmaterials and the lower mass ratio of PCM contained in microen-capsulation. Biwole et al. [15] modelled heat and mass transfer ofa PCM layer at the back of PV and reported a time lag of 75 mincompared to bare PV panel to reach 40 �C which shows thermalmass effect of adding PCM layer into PV. Author observed thatthe previous research focussed on incorporating the PCM into PVsystems with least attention to characterizing PCM thermo-physi-cal properties in relation to PV temperature regulation.
On another front most of the PCM characterization has beenconducted on determination of the thermophysical properties ofPCM [16] with no reported characterization for PCM as tempera-ture regulators in PV systems. Polyethylene glycol (PEG10000)/poly (glycidyl methacrylate) (PGMA) crosslinked copolymer wasprepared as solid–solid phase change material and it was foundthat the PCM reversibly stores heat from 25 to 60 �C and maintainsthe solid structure as high as 100 �C [17]. Polyurethane polymers(PUs) have been synthesized as solid–solid phase change materialsusing three different kinds of diisocyanate molecules and polyeth-ylene glycols (PEGs) through the condensation reaction of PEGswith diisocyanates. The solid–solid PCM possessed phase changeenthalpy of 179 kJ/kg and phase transition temperature of 60 �C[18]. Expanded graphite (EG) was used in Sodium nitrate, potas-sium nitrate and their mixture to enhance PCM thermal conductiv-ity. It was reported that by addition of 10 % by weight EG increasedthe thermal conductivity of PCM by about 30–40% [19]. CompositePCM by impregnating 65% paraffin into halloysite nanotube wasprepared and tested for leakage with a melting point of 57.16 �Cand heat storage capacity of 106.54 kJ/kg. Melting and freezingtime were reported to decrease by 60.78% and 71.52% respectivelywith the addition of graphite [20]. Polyethylene glycol (PEG)/sili-con dioxide (SiO2) composite form-stable phase change materials(PCMs) without co-solvent and surfactant with 80% PEG weightpercentage. The PCM possessed enthalpy value of (102.8–111.1 J/g) and phase transition temperature of up to 56.5 �C and showedvery little change in phase change enthalpy and temperature with50 thermal cycles [21].
Form-stable paraffin/PUPCMs composites (n-octadecane/PUP-CM, n-eicosane/PUPCM and paraffin wax/PUPCM) were preparedwith phase transition temperature range (20–65 �C) and enthalpyrange of up to 141.2 J/g. An inexpensive process of preparationvia bulk polymerization was introduced and the PCM was reportedto be stable at higher temperature [22]. Low-density polyethylene(LDPE) with paraffin waxes was prepared by melt-mixing methodwith a Brabender-Plastograph and were tested for leakage. It wasfound that the wax remained compact during melting cycle show-ing no leakage [23].
Microencapsulated PCM was prepared by containing n-alkanein p(n-butyl methacrylate-co-methacrylic acid) shell (P(BMA-co-MAA)) with phase change enthalpies of melting (130.3 J/g or123.9 J/g) and freezing (125.8 J/g or 118.4 J/g). The PCM wassubjected to thermal cycles and phase change enthalpies variedwith thermal cycles [24]. polystyrene/n-tetradecane compositenanoencapsulated phase change material were prepared via ultra-sonic-assistant miniemulsion in situ polymerization with meltingand freezing temperatures of 4.04 �C and �3.43 �C rand latentheats of 98.71 J g�1 and 91.27 J g�1, respectively. Mechanical struc-tural stability was reported through freeze–thaw cycle test [25].
The properties desired for a suitable PCM are summarized inTable 1. A systematic PCM choice is difficult as a particular PCMmay only have some of the desired characteristics, but may notpossess the others. The current work relates PCM properties ofmelting point, latent heat of fusion, specific heat capacity, thermalconductivity, density and under-cooling in relation to PV tempera-ture and night time ambient temperature to regenerate PCM toachieve better temperature regulation effect.
2. Methodology
PCMs were characterized using (i) Differential Scanning Calo-rimetry (DSC) and (ii) Temperature History Method (THM) todetermine their thermophysical properties and compare them
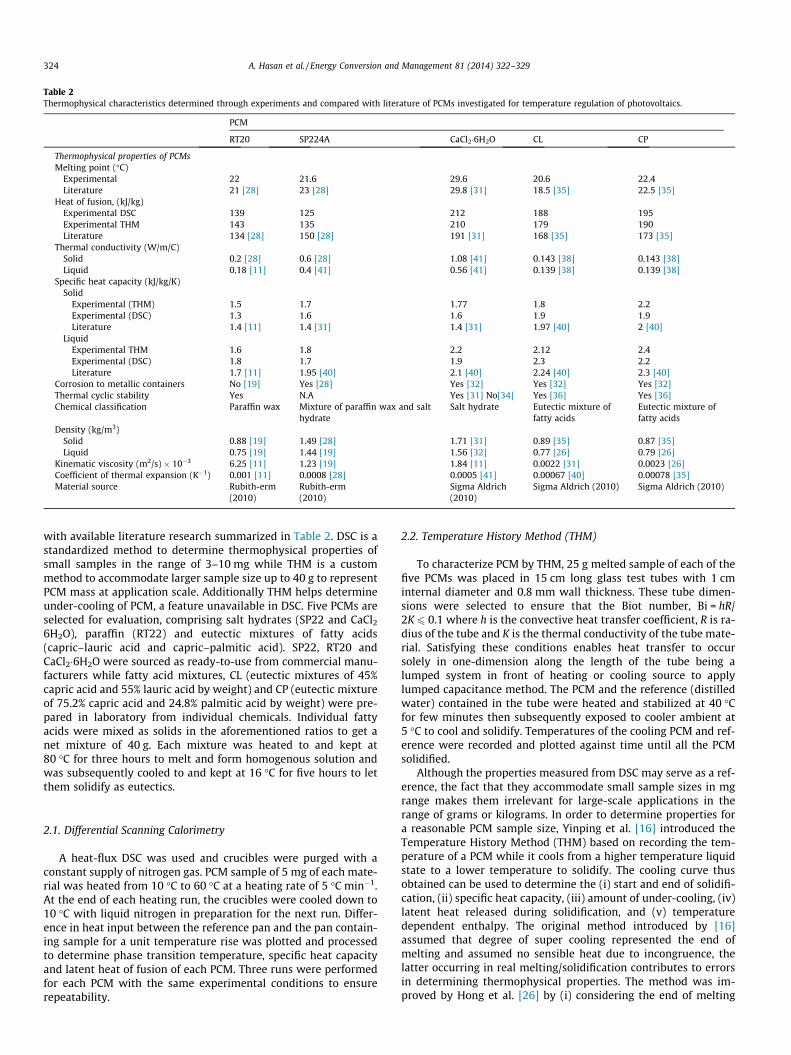
Table 2Thermophysical characteristics determined through experiments and compared with literature of PCMs investigated for temperature regulation of photovoltaics.
PCM
RT20 SP224A CaCl2�6H2O CL CP
Thermophysical properties of PCMsMelting point (�C)
Experimental 22 21.6 29.6 20.6 22.4Literature 21 [28] 23 [28] 29.8 [31] 18.5 [35] 22.5 [35]
Heat of fusion, (kJ/kg)Experimental DSC 139 125 212 188 195Experimental THM 143 135 210 179 190Literature 134 [28] 150 [28] 191 [31] 168 [35] 173 [35]
Thermal conductivity (W/m/C)Solid 0.2 [28] 0.6 [28] 1.08 [41] 0.143 [38] 0.143 [38]Liquid 0.18 [11] 0.4 [41] 0.56 [41] 0.139 [38] 0.139 [38]
Specific heat capacity (kJ/kg/K)Solid
Experimental (THM) 1.5 1.7 1.77 1.8 2.2Experimental (DSC) 1.3 1.6 1.6 1.9 1.9Literature 1.4 [11] 1.4 [31] 1.4 [31] 1.97 [40] 2 [40]
LiquidExperimental THM 1.6 1.8 2.2 2.12 2.4Experimental (DSC) 1.8 1.7 1.9 2.3 2.2Literature 1.7 [11] 1.95 [40] 2.1 [40] 2.24 [40] 2.3 [40]
Corrosion to metallic containers No [19] Yes [28] Yes [32] Yes [32] Yes [32]Thermal cyclic stability Yes N.A Yes [31] No[34] Yes [36] Yes [36]Chemical classification Paraffin wax Mixture of paraffin wax and salt
hydrateSalt hydrate Eutectic mixture of
fatty acidsEutectic mixture offatty acids
Density (kg/m3)Solid 0.88 [19] 1.49 [28] 1.71 [31] 0.89 [35] 0.87 [35]Liquid 0.75 [19] 1.44 [19] 1.56 [32] 0.77 [26] 0.79 [26]
Kinematic viscosity (m2/s) � 10�3 6.25 [11] 1.23 [19] 1.84 [11] 0.0022 [31] 0.0023 [26]Coefficient of thermal expansion (K�1) 0.001 [11] 0.0008 [28] 0.0005 [41] 0.00067 [40] 0.00078 [35]Material source Rubith-erm
(2010)Rubith-erm(2010)
Sigma Aldrich(2010)
Sigma Aldrich (2010) Sigma Aldrich (2010)
324 A. Hasan et al. / Energy Conversion and Management 81 (2014) 322–329
with available literature research summarized in Table 2. DSC is astandardized method to determine thermophysical properties ofsmall samples in the range of 3–10 mg while THM is a custommethod to accommodate larger sample size up to 40 g to representPCM mass at application scale. Additionally THM helps determineunder-cooling of PCM, a feature unavailable in DSC. Five PCMs areselected for evaluation, comprising salt hydrates (SP22 and CaCl2
6H2O), paraffin (RT22) and eutectic mixtures of fatty acids(capric–lauric acid and capric–palmitic acid). SP22, RT20 andCaCl2�6H2O were sourced as ready-to-use from commercial manu-facturers while fatty acid mixtures, CL (eutectic mixtures of 45%capric acid and 55% lauric acid by weight) and CP (eutectic mixtureof 75.2% capric acid and 24.8% palmitic acid by weight) were pre-pared in laboratory from individual chemicals. Individual fattyacids were mixed as solids in the aforementioned ratios to get anet mixture of 40 g. Each mixture was heated to and kept at80 �C for three hours to melt and form homogenous solution andwas subsequently cooled to and kept at 16 �C for five hours to letthem solidify as eutectics.
2.1. Differential Scanning Calorimetry
A heat-flux DSC was used and crucibles were purged with aconstant supply of nitrogen gas. PCM sample of 5 mg of each mate-rial was heated from 10 �C to 60 �C at a heating rate of 5 �C min�1.At the end of each heating run, the crucibles were cooled down to10 �C with liquid nitrogen in preparation for the next run. Differ-ence in heat input between the reference pan and the pan contain-ing sample for a unit temperature rise was plotted and processedto determine phase transition temperature, specific heat capacityand latent heat of fusion of each PCM. Three runs were performedfor each PCM with the same experimental conditions to ensurerepeatability.
2.2. Temperature History Method (THM)
To characterize PCM by THM, 25 g melted sample of each of thefive PCMs was placed in 15 cm long glass test tubes with 1 cminternal diameter and 0.8 mm wall thickness. These tube dimen-sions were selected to ensure that the Biot number, Bi = hR/2K 6 0.1 where h is the convective heat transfer coefficient, R is ra-dius of the tube and K is the thermal conductivity of the tube mate-rial. Satisfying these conditions enables heat transfer to occursolely in one-dimension along the length of the tube being alumped system in front of heating or cooling source to applylumped capacitance method. The PCM and the reference (distilledwater) contained in the tube were heated and stabilized at 40 �Cfor few minutes then subsequently exposed to cooler ambient at5 �C to cool and solidify. Temperatures of the cooling PCM and ref-erence were recorded and plotted against time until all the PCMsolidified.
Although the properties measured from DSC may serve as a ref-erence, the fact that they accommodate small sample sizes in mgrange makes them irrelevant for large-scale applications in therange of grams or kilograms. In order to determine properties fora reasonable PCM sample size, Yinping et al. [16] introduced theTemperature History Method (THM) based on recording the tem-perature of a PCM while it cools from a higher temperature liquidstate to a lower temperature to solidify. The cooling curve thusobtained can be used to determine the (i) start and end of solidifi-cation, (ii) specific heat capacity, (iii) amount of under-cooling, (iv)latent heat released during solidification, and (v) temperaturedependent enthalpy. The original method introduced by [16]assumed that degree of super cooling represented the end ofmelting and assumed no sensible heat due to incongruence, thelatter occurring in real melting/solidification contributes to errorsin determining thermophysical properties. The method was im-proved by Hong et al. [26] by (i) considering the end of melting
A. Hasan et al. / Energy Conversion and Management 81 (2014) 322–329 325
to be when the derivative of the temperature–time graph on thecooling curve becomes minimum and (ii) including sensible heat-ing in the calculation of heat capacity and enthalpy. The THMwas further extended by Marin et al. [27] to determine tempera-ture dependent properties such as specific heat capacity and en-thalpy of the PCM and produced enthalpy temperature curves forPCMs. The governing equations to calculate specific heat capacity,heat of fusion and heat transfer coefficient are obtained by simpleenergy balance given in Eq. (1)[16]:
ðmtcp;t þmpcp;lÞðT0 � TsÞ ¼ hcAcA1 ð1Þ
where mt and mp are the masses of the tube and PCM respectively,cp,l and cp,t are the mean specific heat capacities of liquid PCM andtest tube material respectively, T0 and Ts are the start of coolingand start of solidification temperature, hc is the convective heat losscoefficient, Ac is the convective heat transfer area of a tube andA1 ¼
R t10 ðT0 � T1;aÞdt. Heat loss by the cooling PCM is due to natural
convection given by Eq. (2):
mpHm ¼ hcAcA2 ð2Þ
where Hm is the heat of fusion of the PCM, A2 ¼R t2
t1ðTs � T1;aÞdt
where T1,a is the ambient temperature and (t1 ? t2) is the time inwhich the phase change occurs and:
ðmtcp;t þmpcp;sÞðTs � TrÞ ¼ hcAcA3 ð3Þ
where cp,s is the mean specific heat capacity of the solid PCM,A3 ¼
R t3t2ðT0 � T1;aÞdt where Tr is the reference temperature. If a tube
containing pure water is suddenly exposed to the same ambient asof the PCM, it also cools and releases heat following the curveshown in Fig. 6. Considering the Bi < 0.1 similarly we have:
ðmtcp;t þmwcp;wÞðTs � TrÞ ¼ hcAcA02 ð4Þ
ðmtcp;t þmwcp;wÞðT0 � TsÞ ¼ hcAcA01 ð5Þ
where mw and cp,w are the mass and mean specific heat capacity ofwater respectively,
A01 ¼Z t01
0ðT � T1;aÞdt and A02 ¼
Z t02
t1ðT � T1;aÞdt
Using Eq. (5) the natural convective heat transfer coefficient (hc)of air outside the tube is calculated which is 4.5 W/m2 K. Rearrang-ing the equations described above, the specific heat capacities (cp,s
and cp,l) and the latent heat of fusion (Hm) of the PCM are calculatedusing the Eqs. (6)–(8).
Cp;s ¼mwcp;w þmtcp;t
mp
A3
A02� mt
mpCp;t ð6Þ
(a)
10
15
20
25
30
35
40
45
50
55
60
Tem
pera
ture
(ºC
)
Peak: 29.7 °CHeat: 213 kJ/kg
Onset 29.2 [°C]
0.0 10.0 20.0 30.0 40.0 50.0 60.0-5.0
-4.0
-3.0
-1.0
-1.0
0.0
1.
Temperature (°C)
Hea
t F
lux
(kJ/
kg)
Fig. 1. (a) Differential Scanning Calorimetry (DSC) and (b) Temperatur
Hm ¼mwcp;w þmtcp;t
mp
A2
A01ðT0 � TsÞ ð7Þ
Cp;l ¼mwcp;w þmtcp;t
mp
A1
A01� mt
mpCp;t ð8Þ
3. Results and discussion
Result for characterization of the five selected PCM using DSCand THM are explained and discussed below.
3.1. Characterization of CaCl2�6H2O
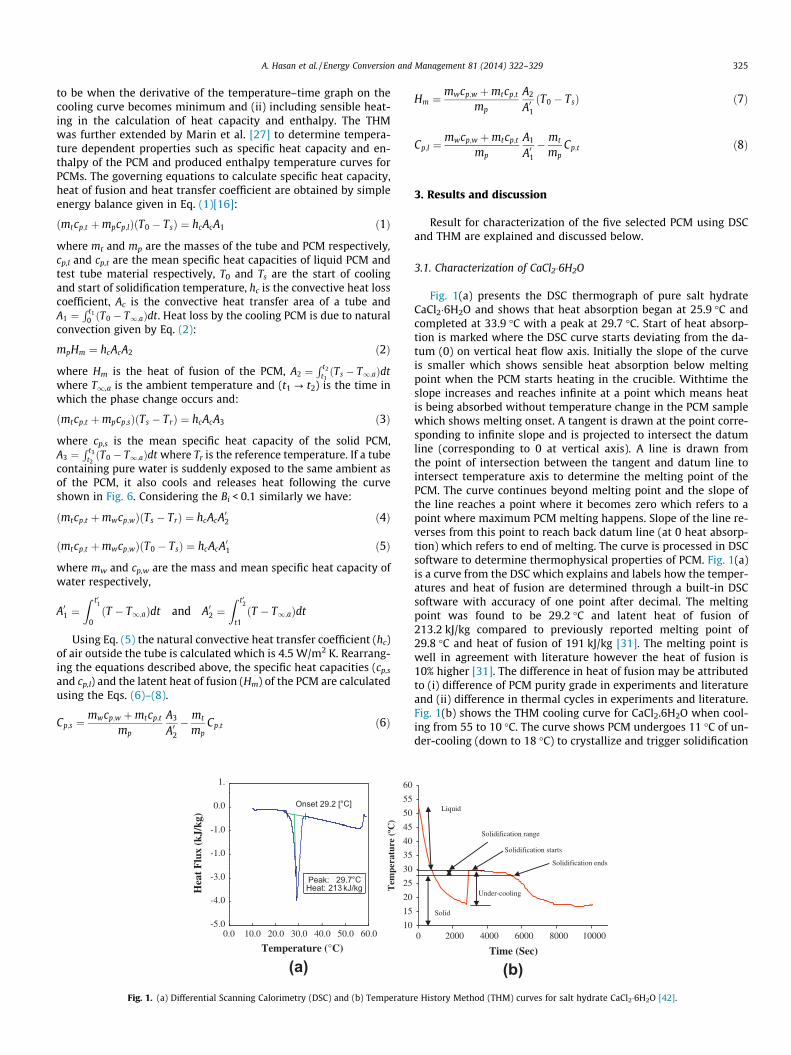
Fig. 1(a) presents the DSC thermograph of pure salt hydrateCaCl2�6H2O and shows that heat absorption began at 25.9 �C andcompleted at 33.9 �C with a peak at 29.7 �C. Start of heat absorp-tion is marked where the DSC curve starts deviating from the da-tum (0) on vertical heat flow axis. Initially the slope of the curveis smaller which shows sensible heat absorption below meltingpoint when the PCM starts heating in the crucible. Withtime theslope increases and reaches infinite at a point which means heatis being absorbed without temperature change in the PCM samplewhich shows melting onset. A tangent is drawn at the point corre-sponding to infinite slope and is projected to intersect the datumline (corresponding to 0 at vertical axis). A line is drawn fromthe point of intersection between the tangent and datum line tointersect temperature axis to determine the melting point of thePCM. The curve continues beyond melting point and the slope ofthe line reaches a point where it becomes zero which refers to apoint where maximum PCM melting happens. Slope of the line re-verses from this point to reach back datum line (at 0 heat absorp-tion) which refers to end of melting. The curve is processed in DSCsoftware to determine thermophysical properties of PCM. Fig. 1(a)is a curve from the DSC which explains and labels how the temper-atures and heat of fusion are determined through a built-in DSCsoftware with accuracy of one point after decimal. The meltingpoint was found to be 29.2 �C and latent heat of fusion of213.2 kJ/kg compared to previously reported melting point of29.8 �C and heat of fusion of 191 kJ/kg [31]. The melting point iswell in agreement with literature however the heat of fusion is10% higher [31]. The difference in heat of fusion may be attributedto (i) difference of PCM purity grade in experiments and literatureand (ii) difference in thermal cycles in experiments and literature.Fig. 1(b) shows the THM cooling curve for CaCl2.6H2O when cool-ing from 55 to 10 �C. The curve shows PCM undergoes 11 �C of un-der-cooling (down to 18 �C) to crystallize and trigger solidification
0 2000 4000 6000 8000 10000
Time (Sec)
Solidification range
Solidification ends
Solid
Solidification starts
Under-cooling
Liquid
(b)e History Method (THM) curves for salt hydrate CaCl2�6H2O [42].
(a)
(b)
SolidSolidification range
Solidification starts
Solidification ends
Liquid
Hea
t Flu
x kJ
/kg
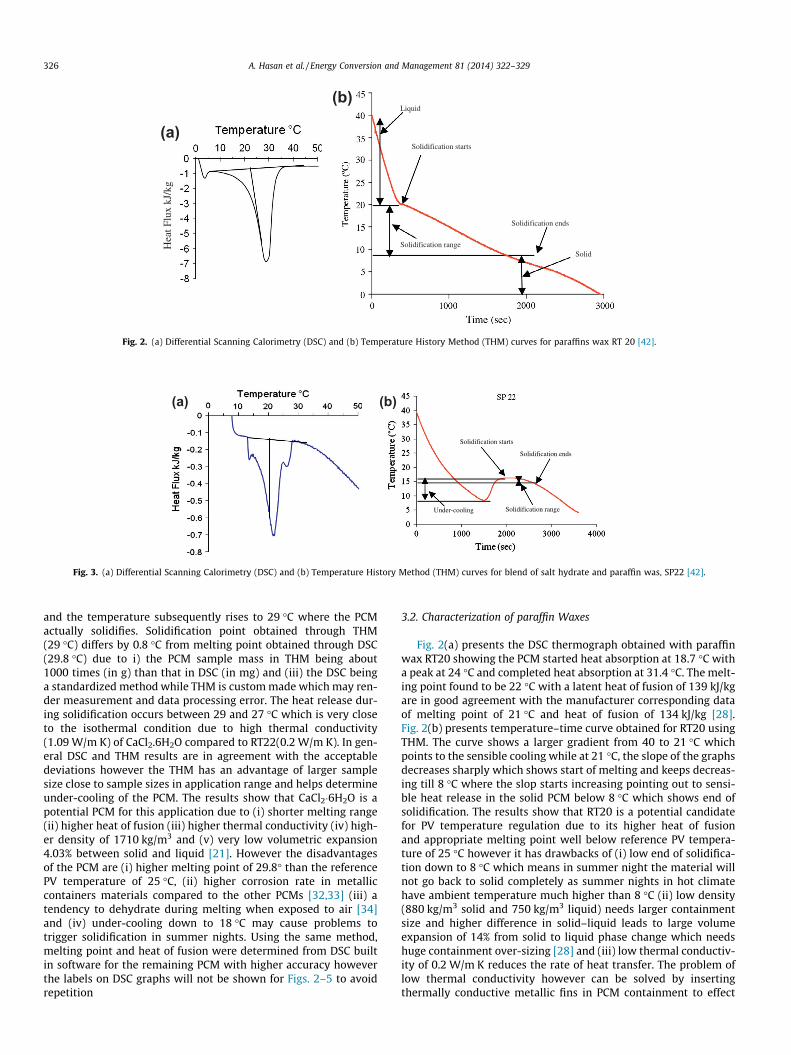
Fig. 2. (a) Differential Scanning Calorimetry (DSC) and (b) Temperature History Method (THM) curves for paraffins wax RT 20 [42].
Solidification starts
Solidification ends
(a) (b)
Under-cooling Solidification range
Fig. 3. (a) Differential Scanning Calorimetry (DSC) and (b) Temperature History Method (THM) curves for blend of salt hydrate and paraffin was, SP22 [42].
326 A. Hasan et al. / Energy Conversion and Management 81 (2014) 322–329
and the temperature subsequently rises to 29 �C where the PCMactually solidifies. Solidification point obtained through THM(29 �C) differs by 0.8 �C from melting point obtained through DSC(29.8 �C) due to i) the PCM sample mass in THM being about1000 times (in g) than that in DSC (in mg) and (iii) the DSC beinga standardized method while THM is custom made which may ren-der measurement and data processing error. The heat release dur-ing solidification occurs between 29 and 27 �C which is very closeto the isothermal condition due to high thermal conductivity(1.09 W/m K) of CaCl2.6H2O compared to RT22(0.2 W/m K). In gen-eral DSC and THM results are in agreement with the acceptabledeviations however the THM has an advantage of larger samplesize close to sample sizes in application range and helps determineunder-cooling of the PCM. The results show that CaCl2�6H2O is apotential PCM for this application due to (i) shorter melting range(ii) higher heat of fusion (iii) higher thermal conductivity (iv) high-er density of 1710 kg/m3 and (v) very low volumetric expansion4.03% between solid and liquid [21]. However the disadvantagesof the PCM are (i) higher melting point of 29.8� than the referencePV temperature of 25 �C, (ii) higher corrosion rate in metalliccontainers materials compared to the other PCMs [32,33] (iii) atendency to dehydrate during melting when exposed to air [34]and (iv) under-cooling down to 18 �C may cause problems totrigger solidification in summer nights. Using the same method,melting point and heat of fusion were determined from DSC builtin software for the remaining PCM with higher accuracy howeverthe labels on DSC graphs will not be shown for Figs. 2–5 to avoidrepetition
3.2. Characterization of paraffin Waxes
Fig. 2(a) presents the DSC thermograph obtained with paraffinwax RT20 showing the PCM started heat absorption at 18.7 �C witha peak at 24 �C and completed heat absorption at 31.4 �C. The melt-ing point found to be 22 �C with a latent heat of fusion of 139 kJ/kgare in good agreement with the manufacturer corresponding dataof melting point of 21 �C and heat of fusion of 134 kJ/kg [28].Fig. 2(b) presents temperature–time curve obtained for RT20 usingTHM. The curve shows a larger gradient from 40 to 21 �C whichpoints to the sensible cooling while at 21 �C, the slope of the graphsdecreases sharply which shows start of melting and keeps decreas-ing till 8 �C where the slop starts increasing pointing out to sensi-ble heat release in the solid PCM below 8 �C which shows end ofsolidification. The results show that RT20 is a potential candidatefor PV temperature regulation due to its higher heat of fusionand appropriate melting point well below reference PV tempera-ture of 25 �C however it has drawbacks of (i) low end of solidifica-tion down to 8 �C which means in summer night the material willnot go back to solid completely as summer nights in hot climatehave ambient temperature much higher than 8 �C (ii) low density(880 kg/m3 solid and 750 kg/m3 liquid) needs larger containmentsize and higher difference in solid–liquid leads to large volumeexpansion of 14% from solid to liquid phase change which needshuge containment over-sizing [28] and (iii) low thermal conductiv-ity of 0.2 W/m K reduces the rate of heat transfer. The problem oflow thermal conductivity however can be solved by insertingthermally conductive metallic fins in PCM containment to effect
(a)Solidification starts
Solidification ends
Solidification range
Liquid
Solid
(b)
Fig. 4. (a) Differential Scanning Calorimetry (DSC) and (b) Temperature History Method (THM) curves for capric–lauric acid [42].
(a)(b)
Solid
Solidification range
Solidification starts
Solidification ends
Under cooling
Fig. 5. (a) Differential Scanning Calorimetry (DSC) and (b) Temperature History Method (THM) curves for capric–palmitic acid [42].
A. Hasan et al. / Energy Conversion and Management 81 (2014) 322–329 327
melting in narrow temperature range [10–12]. Combustibility ofRT20 with flash point of 154 �C [28] can also be a potential problemprohibiting its use in building integrated photovoltaics (BIPV) dueto fire safety issue.
3.3. Characterization of SP22
Fig. 3(a) presents DSC thermographs of a mixture of paraffinwax and salt hydrate, SP22 showing that the PCM has a wide melt-ing range from 14 to 26 �C with melting point of 21.6 �C and the la-tent heat of fusion of 125 kJ/kg. The manufacturer’s catalogue datashows a melting range of 13–28 �C with melting point of 23 �C andlatent heat fusion of 150 kJ/kg [29]. The larger difference in latentheat can be attributed to difference of melting ranges in experi-ment (14–26 �C) and catalogue (13–28 �C). Fig. 3(b) representsTHM result of SP22 which shows PCM needs under-cooling downto 9 �C to trigger solidification however bulk solidification occursnearly isothermally between 15 and 16 �C due to high thermal con-ductivity (0.6 W/m K) of SP22 compared to RT20 (0.2 W/m K).Though under-cooling is expected in salt hydrates [20] the solidifi-cation at a lower temperature (16 �C) is due to the salt hydratebeing blended with paraffin wax. PCM SP22 shows promise for thisapplication due to (i) reasonable heat of fusion (ii) higher thermalconductivity (iii) higher density of 1490 kg/m3 and (iv) lowervolume expansion of 4.03% from solid to liquid however under-cooling down to 9 �C makes it unsuitable in hot climates wherehigher night time ambient temperatures hamper PCM solidifica-tion [30].
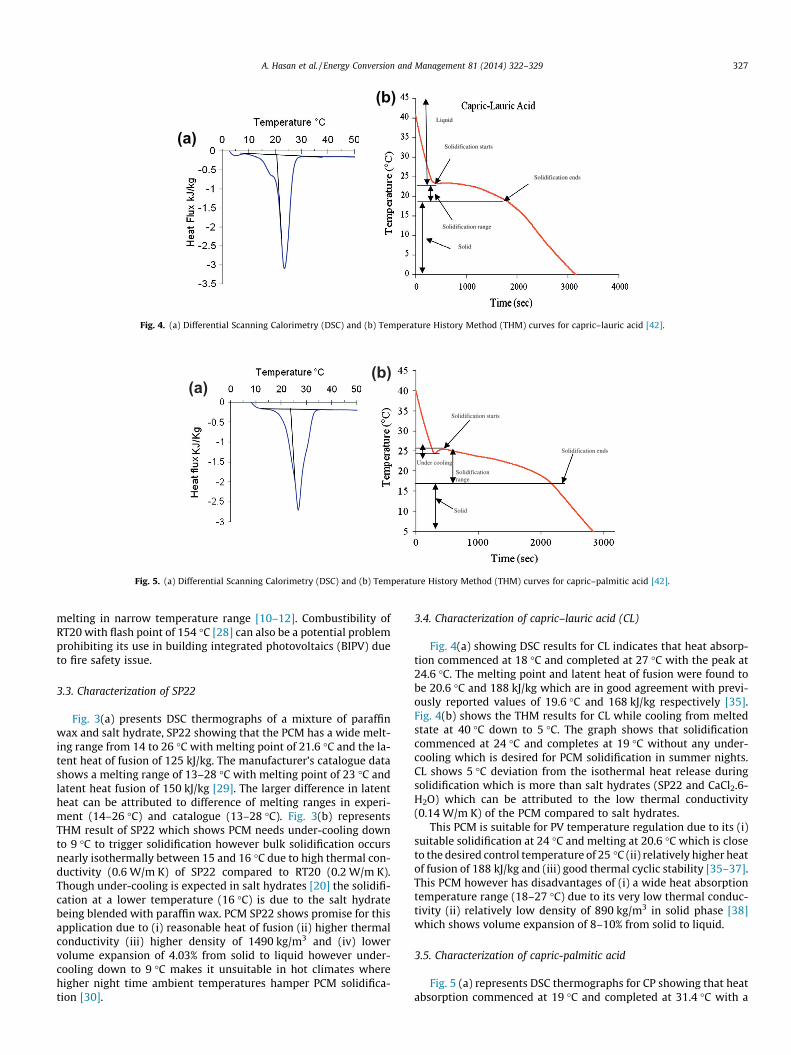
3.4. Characterization of capric–lauric acid (CL)
Fig. 4(a) showing DSC results for CL indicates that heat absorp-tion commenced at 18 �C and completed at 27 �C with the peak at24.6 �C. The melting point and latent heat of fusion were found tobe 20.6 �C and 188 kJ/kg which are in good agreement with previ-ously reported values of 19.6 �C and 168 kJ/kg respectively [35].Fig. 4(b) shows the THM results for CL while cooling from meltedstate at 40 �C down to 5 �C. The graph shows that solidificationcommenced at 24 �C and completes at 19 �C without any under-cooling which is desired for PCM solidification in summer nights.CL shows 5 �C deviation from the isothermal heat release duringsolidification which is more than salt hydrates (SP22 and CaCl2.6-H2O) which can be attributed to the low thermal conductivity(0.14 W/m K) of the PCM compared to salt hydrates.
This PCM is suitable for PV temperature regulation due to its (i)suitable solidification at 24 �C and melting at 20.6 �C which is closeto the desired control temperature of 25 �C (ii) relatively higher heatof fusion of 188 kJ/kg and (iii) good thermal cyclic stability [35–37].This PCM however has disadvantages of (i) a wide heat absorptiontemperature range (18–27 �C) due to its very low thermal conduc-tivity (ii) relatively low density of 890 kg/m3 in solid phase [38]which shows volume expansion of 8–10% from solid to liquid.
3.5. Characterization of capric-palmitic acid
Fig. 5 (a) represents DSC thermographs for CP showing that heatabsorption commenced at 19 �C and completed at 31.4 �C with a

T°
T°
10
15
20
25
30
35
40
45
50
55
60T
(C)
Time (min)
Ambient Reference
0 20 40 60 80 100 12010
15
20
25
30
35
40
45
50
55
60
t (min)
T(C
)
Time
AmbientC aCl2
0 20 40 60 80 100 120
(a) (b)
Fig. 6. Temperature History Method (THM) curves for the distilled water taken as reference (left) and the sample PCM, CaCl2.6H2O (right) when cooling from a highertemperature in the same ambient [42].
328 A. Hasan et al. / Energy Conversion and Management 81 (2014) 322–329
peak at 26.4 �C. The melting point and latent heat of fusion werefound to be 22.4 �C and 195 kJ/kg respectively compared to litera-ture values of 22.5 �C and 173.6 kJ/kg respectively [37,39]. Fig. 5 (b)presenting THM results shows that solidification starts at 25.5 �Cand completes at 18 �C with negligible under-cooling of 1 �C. Heatrelease during solidification occurs in temperature range (7.5 �C)slightly higher than that of CL (5 �C) although both PCM have samethermal conductivity (0.14 W/m K).
CP shows promise for PV cooling application due to (i) higherheat of fusion of 195 kJ/kg, (ii) higher solidification point of25.5 �C suitable for summer nights and (iii) lower melting pointof 22.4 �C close to PV reference temperature of 25 �C. CP has disad-vantages of (i) an undesired wide range of melting (19–31.4 �C)and solidification (25.5–18 �C) caused by its very low thermal con-ductivity (ii) relatively low density of 870 kg/m3 in solid phase [38]which causes a moderate volume expansion of 8–10% from solid toliquid.
Specific heat capacity and heat of fusion of each of the PCMs insolid and liquid phases is calculated using Eqs. (1)–(8) and aresummarized in Table 2. The calculated values from THM are withinmaximum 5% deviation from DSC results and 10% from literaturevalues. The deviation can be attributed to the fact that (i) THM re-lies on overly simplified custom made set up which are not pre-cisely calibrated like conventional DSC (ii) DSC results also showvariation based on sample size and (iii) literature may use differentpurity grades of the PCM. Considering these factors, the values ob-tained from THM are reasonably reliable.
4. Conclusion
Main contribution of the paper is to establish a qualitativerelationship between thermophysical properties of PCM and PVtemperature regulation. The research mainly investigates intothermophysical properties of three different classes of PCM inone study, discuss their merits and helps selection of PCM for tem-perature control applications in PV. Some novel results related tounder-cooling of PCM are also determined. CaCl2�6H2O and SP22shows higher under-cooling unachievable in summer nights inhot climates while paraffin wax RT20 melts and solidifies over awide temperature range along with higher volumetric expansionwhich render these PCM unsuitable for the temperature controlof PV. Although eutectic mixtures of fatty acids have very low ther-mal conductivities, their higher heat of fusions, reasonable range ofmelting and solidification between 19and 25 �C, no under-coolingand reasonable volumetric expansion renders them suitable forPV temperature control at 25 �C. Amongst fatty acid, CP has amelting point closer to PV control temperature and heat of fusion
higher than CL makes it most suitable candidate for PV tempera-ture regulation.
Acknowledgements
The authors would like to acknowledge the Higher EducationAuthority through Strand 3 funding, Science Foundation Irelandthrough their Research Frontiers Program and the Research Sup-port Unit at Dublin Institute of Technology. They would also liketo acknowledge COST Action TU0802: Next generation cost effectivephase change materials for increased energy efficiency in renewableenergy systems in buildings for providing an invaluable platform todiscuss and develop this work.
References
[1] Radziemska E. The effect of temperature on the power drop in crystallinesilicon solar cell. Renew Energy 2003;28(1):1–12.
[2] Radziemska E, Klugmann E. Thermally affected parameters of the current-voltage characteristics of silicon photocell. Energy Convers Manage2002;43(14):1889–900.
[3] Makrides G, Zinsser BG, George E, Schubert M, Werner JH. Temperaturebehavior of different photovoltaic systems installed in Cyprus and Germany.Sol Energy Mater Sol Cells 2009;93(6–7):1095–9.
[4] Skoplaki E, Palyvos JA. Operating temperature of photovoltaic modules: asurvey of pertinent correlations. Renew Energy 2009;34(1):23–9.
[5] Bücher K. Site dependence of the energy collection of PV modules. Sol EnergyMater Sol Cells 1999;47(1–4):85–94.
[6] Breteque AE. Thermal aspects of c-Si photovoltaic module energy rating. SolEnergy 2009;83(9):1425–33.
[7] Nassar YF, Salem AA. The reliability of the photovoltaic utilization in southerncities of Libya. Desalination 2007;209(1–3):86–90.
[8] Suntechnics. Product Manual; 2008 Suntechnics STP065-12/Sb PV Panel.[9] Saly V, Ruzinsky M, Redi P. Indoor study and ageing tests of solar cells and
encapsulations of experimental modules. Electronics Technology 2001. In:24th international spring seminar on concurrent engineering in electronicpackaging.
[10] Huang MJ, Eames PC, Norton B. Thermal regulation of building-integratedphotovoltaics using phase change materials. Int J Heat Mass Transf2004;47(12–13):2715–33.
[11] Huang MJ, Eames PC, Norton B. Phase change materials for limitingtemperature rise in building integrated photovoltaics. Sol Energy2006;80(9):1121–30.
[12] Huang MJ, Eames PC, Norton B. Comparison of a small-scale 3D PCM thermalcontrol model with a validated 2D PCM thermal control model. Sol EnergyMater Sol Cells 2006;90(13):1961–72.
[13] Hasan A, McCormack SJ, Huang MJ, Norton B. Evaluation of phase changematerials for thermal regulation enhancement of building integratedphotovoltaics. Sol Energy 2010;84(515):1601–12.
[14] Ho CJ, Tanuwijava AO, Lai CM. Thermal and electrical performance of a BIPVintegrated with a microencapsulated phase change material layer. EnergyBuild 2012;50:331–8.
[15] Biwole PH, Eclache P, Kuznik F. Phase-change materials to improve solarpanel’s performance. Energy Build 2013;62:59–67.
[16] Yinping Z, Yi J. A simple method, the T-history method, of determining theheat of fusion, specific heat and thermal conductivity of phase-changematerials. Meas Sci Technol 1999;10(3).

A. Hasan et al. / Energy Conversion and Management 81 (2014) 322–329 329
[17] Chen Changzhong, Liu Wenmin, Yang Hao, Zhao Yiyang, Liu Shanshan.Synthesis of solid–solid phase change material for thermal energy storage bycrosslinking of polyethylene glycol with poly (glycidyl methacrylate). SolEnergy 2011;85:2679–85.
[18] Alkan Cemil, Günther Eva, Hiebler Stefan, Ensari Ömer F, Kahraman Derya.Polyurethanes as solid–solid phase change materials for thermal energystorage. Sol Energy 2012;86:1761–9.
[19] Xiao X, Zhang P, Li M. Thermal characterization of nitrates and nitrates/expanded graphite mixture phase change materials for solar energy storage.Energy Convers Manage 2013;73:86–94.
[20] Zhang Jiangshan, Zhang Xiang, Wan Yazhen, Zhang Dandan Meiand Bing.Preparation and thermal energy properties of paraffin/halloysite nanotubecomposite as form-stable phase change material. Sol Energy 2012;86:1142–8.
[21] Tang Bingtao, Cui Junshuo, Wang Yunming, Jia Chao, Zhang Shufen. Facilesynthesis and performances of PEG/SiO2 composite form-stable phase changematerials. Sol Energy 2013;97:484–92.
[22] Chen Keping, Yu Xuejiang, Tian Chunrong, Wang Jianhua. Preparation andcharacterization of form-stable paraffin/polyurethane composites as phasechange materials for thermal energy storage. Energy Convers Manage2014;77:13–21.
[23] Karkri Abdelwaheb Trigui Mustapha, Krupa Igor. Thermal conductivity andlatent heat thermal energy storage properties of LDPE/wax as a shape-stabilized composite phase change material. Energy Convers Manage2014;77:586–96.
[24] Qiu Xiaolin, Song Guolin, Chu Xiaodong, Li Xuezhu, Tang Guoyi.Microencapsulated n-alkane with p(n-butyl methacrylate-co-methacrylicacid) shell as phase change materials for thermal energy storage. Sol Energy2013;91:212–20.
[25] Fang Yutang, Yu Huimin, Wan Weijun, Gao Xuenong, Zhang Zhengguo.Preparation and thermal performance of polystyrene/n-tetradecanecomposite nanoencapsulated cold energy storage phase change materials.Energy Convers Manage 2013;76(430–43):201–5.
[26] Hong H, Kim SK, Kim YS. Accuracy improvement of T-history method formeasuring heat of fusion of various materials. Int J Refrig 2004;27(4):360–6.
[27] Marín JM, Zalba B, Cabeza LF, Mehling H. Determination of enthalpy-temperature curves of phase change materials with the temperature-historymethod: improvement to temperature dependent properties. Meas SciTechnol 2003;14(2):184–9.
[28] Rubitherm, Technologies. Innovative PCM’s and thermal technology. ProductManual RUBITHERM� 2009; SP22A17.
[29] Günther E, Mehling H, Hiebler S. Modelling of under-cooling and solidificationof phase change materials. Modell Simul Mater Sci Eng 2007;15(8):879–93.
[30] Günther E, Mehling H, Werner M. Melting and nucleation temperatures ofthree salt hydrate phase change materials under static pressures up to800 MPa. J Phys: D Appl Phys 2007;40(15):4636–42.
[31] Tyagi VV, Buddhi D. Thermal cycle testing of calcium chloride hexahydrate as apossible PCM for latent heat storage. Sol Energy Mater Sol Cells2008;92(8):891–9.
[32] Cabeza LF, Roca J, Nogués M, Mehling H, Hiebler S. Immersion corrosion testson metal-salt hydrate pairs used for latent heat storage in the 48–58 �Ctemperature range. Mater Corros 2002;53(12):902–7.
[33] Farrell AJ, Norton B, Kennedy DM. Corrosive effects of salt hydrate phasechange materials used with aluminium and copper. J Mater Process Technol2006;175(1–3):198–205.
[34] El-Sebaii AA, Al-Amir S, Al-Marzouki FM, Faidah AS, Al-Ghamdi AA, Al-Heniti S.Fast thermal cycling of acetanilide and magnesium chloride hexahydrate forindoor solar cooking. Energy Convers Manage 2009;50(12):3104–11.
[35] Sari A, Karaipekli A. Preparation and thermal properties of capric acid/palmiticacid eutectic mixture as a phase change energy storage material. Mater Lett2008;62(6–7):903–6.
[36] Sedat K, Kamil K, Ahmet S. Lauric and myristic acids eutectic mixture as phasechange material for low-temperature heating applications. Int J Energy Res2005;29(9):857–70.
[37] Shilei LV, Neng Z, Guohui F. Eutectic mixtures of capric acid and lauric acidapplied in building wallboards for heat energy storage. Energy Build2006;38(6):708–11.
[38] Sharma SD, Sagara K. Latent heat storage materials and systems: a review. Int JGreen Energy 2005;2(1):1–56.
[39] Karaipekli A, Sari A. Capric acid and palmitic acid eutectic mixture applied inbuilding wallboard for latent heat thermal energy storage. J Sci Ind Res (JSIR)2007;66(06):470–6.
[40] Sari A, Kaygusuz K. Thermal performance of a eutectic mixture of lauric andstearic acids as PCM encapsulated in the annulus of two concentric pipes. SolEnergy 2002;72(6):493–504.
[41] Zalba B, Marín JM, Cabeza LF, Mehling H. Review on thermal energy storagewith phase change: materials, heat transfer analysis and applications. ApplTherm Eng 2003;23(3):251–83.
[42] Hasan A, McCormack SJ, Huang MJ, Norton B. Phase change materials forthermal regulation of building integrated photovoltaics. PhD thesis. DublinInstitute of Technology; 2010, p. 71–88.


![untitled [uir.ulster.ac.uk]uir.ulster.ac.uk/35061/1/SpikeTemp .docx · Web viewThis article has been accepted for inclusion in a future issue of this journal. Content is final as](https://img.dokumen.tips/doc/110x75/5b0a254b7f8b9abe5d8dc3ba/untitled-uir-uir-docxweb-viewthis-article-has-been-accepted-for-inclusion-in.jpg)