Embed Size (px)
Citation preview

Purdue University Purdue University
Purdue e-Pubs Purdue e-Pubs
Open Access Theses Theses and Dissertations
January 2016
Characterization of particle emission from desktop 3D printers: A Characterization of particle emission from desktop 3D printers: A
look at the effect of part design and build pathing look at the effect of part design and build pathing
Giovanny Aguilera Purdue University
Follow this and additional works at: https://docs.lib.purdue.edu/open_access_theses
Recommended Citation Recommended Citation Aguilera, Giovanny, "Characterization of particle emission from desktop 3D printers: A look at the effect of part design and build pathing" (2016). Open Access Theses. 1217. https://docs.lib.purdue.edu/open_access_theses/1217
This document has been made available through Purdue e-Pubs, a service of the Purdue University Libraries. Please contact [email protected] for additional information.

Graduate School Form30 Updated
PURDUE UNIVERSITYGRADUATE SCHOOL
Thesis/Dissertation Acceptance
This is to certify that the thesis/dissertation prepared
By
Entitled
For the degree of
Is approved by the final examining committee:
To the best of my knowledge and as understood by the student in the Thesis/Dissertation Agreement, Publication Delay, and Certification Disclaimer (Graduate School Form 32), this thesis/dissertation adheres to the provisions of Purdue University’s “Policy of Integrity in Research” and the use of copyright material.
Approved by Major Professor(s):
Approved by:Head of the Departmental Graduate Program Date
GIOVANNY AGUILERA
CHARACTERIZATION OF PARTICLE EMISSIONS FROM DESKTOP 3D PRINTERS: A LOOK AT THE EFFECT OFPART DESIGN AND BUILD PATHING
Master of Science in Mechanical Engineering
FU ZHAOChair
CAROL A. HANDWERKER
LIANG PAN
FU ZHAO
JAY P. GORE 7/25/2016

CHARACTERIZATION OF PARTICLE EMISSIONS FROM DESKTOP 3D
PRINTERS: A LOOK AT THE EFFECT OF PART DESIGN AND BUILD PATHING
A Thesis
Submitted to the Faculty
of
Purdue University
by
Giovanny A. Aguilera
In Partial Fulfilment of the
Requirements for the Degree
of
Master of Science in Mechanical Engineering
August 2016
Purdue University
West Lafayette, Indiana

ii
Dedicated to my parents

iii
ACKNOWLEDGEMENTS
I would like to gratefully acknowledge everyone that has helped me throughout
this two-year journey. First, I would like to thank my advisor, Dr. Fu Zhao, for all the
support and encouragement you provided me. Without you, none of this would have been
possible. I appreciate you being open minded and allowing me to find a project in which I
was passionate about, even though it took several months of searching. I have learned so
much during my time at Purdue. You have helped me develop a wide variety of skills, by
challenging me with different experience and situations. You gave me enough space to
learn and grow, while steering me in the right direction so I wouldn’t get lost. I am
confident that you have prepared me to have a successful career in whatever direction life
takes me.
I would also like to thank Dr. Carol Handwerker for her support throughout the
NSF IGERT program on Sustainable Electronics. You were a huge support that I could
always count on. You allowed me to meet and establish connections with numerous
professors from different departments throughout the program. Also, you showed me that
everyone has something to bring to the table by getting people of such different
backgrounds together in the IGERT program. It was truly a wonderful experience and I
hope to continue being a part of the program. Thank you, Dr. Liang Pan, for talking with
me early on at my time at Purdue and making time for me at the end on such short notice.

iv
A special thanks to Dr. Brandon Boor and Dr. Andrew Whelton for helping all with this
thesis project. Even though I was not officially a student in your research groups, both of
you were always there to provide me with any resources that I needed and your doors
were always open to give provide me guidance and advice.
My thanks go out to the National Science Foundation especially the IGERT
program on Sustainable Electronics for the funding of my education and my research
projects. I appreciate all the opportunities the IGERT gave me to travel to India and
around the United States for various conferences. I would like to thank the GEM
consortium for the opportunity to meet other underrepresented graduate students in
different areas of science and engineering. It helped me find a support group that I would
have not found otherwise. Thank you to all the staff that helped along the way. Lastly, I
would like to thank my family and friends for being there for me through the good and
not so good times as well as the countless sleepless nights.
v
TABLE OF CONTENTS
Page
LIST OF FIGURES ........................................................................................................... vi LIST OF TABLES ............................................................................................................ vii
LIST OF ABBREVIATIONS .......................................................................................... viii ABSTRACT ....................................................................................................................... ix CHAPTER 1: INTRODUCTION .................................................................................. 1
1.1 Sustainable Design and 3D Printing ................................................................... 2 1.2 Fuse Deposition Modeling .................................................................................. 3 1.3 Materials used in Desktop 3D Printers ............................................................... 5
1.4 Previous Research in this Area ........................................................................... 6
CHAPTER 2: PRELIMINARY TESTING.................................................................... 9
2.1 Equipment ........................................................................................................... 9 2.2 Preliminary Results ........................................................................................... 13
2.3 Discussion of Preliminary Results .................................................................... 15
CHAPTER 3: PARTICLE TESTING INSIDE A CHAMBER ................................... 20
3.1 Adjustment for follow up testing ...................................................................... 20 3.2 Procedure of Testing with ELPI ....................................................................... 27
3.3 Results of the NIST Test Part ........................................................................... 28 3.4 Results of the Test Cube ................................................................................... 31
3.5 Discussion of Results ........................................................................................ 34
CHAPTER 4: CONCLUSIONS, MITIGATION, AND FUTURE WORK ................ 42
4.1 Conclusions ....................................................................................................... 42 4.2 Possible Solutions and Mitigation Techniques ................................................. 43
4.3 Recommendations for Future Work.................................................................. 45
LIST OF REFERENCES .................................................................................................. 47

vi
LIST OF FIGURES
Figure Page
Figure 1.1: Fused Deposition Printer. ................................................................................. 4 Figure 2.1: Diagram of office space where testing took place. ........................................ 10 Figure 2.2: Particle Concentration of 3D Printing Process using ABS Filament. ............ 13
Figure 2.3: SMPS Particle Concentration Measurements a Two Week Period. ............... 14 Figure 2.4: Differences Between Heating and Printing Phase. ......................................... 16
Figure 2.5: TEM Images of the Particles Captured During the Printing Process. ............ 18
Figure 3.1: Dimensions of the Filtration Box. .................................................................. 22 Figure 3.2: Diagram of Impactor Stages. .......................................................................... 24 Figure 3.3: Schematic of the Testing Chamber System. ................................................... 25
Figure 3.4: Testing Chamber System inside of the Fume Hood Inside the Cleanroom. .. 26 Figure 3.5: Diagram of NIST Standardized 3D Printing Test Part. .................................. 27
Figure 3.6: Particle Concentration of NIST Test Part over Time. .................................... 29 Figure 3.7: Size Distribution of Particles of the NIST Test Part. ..................................... 30 Figure 3.8: Size Distribution of Initial Burst of Particles of the NIST Test Part. ............. 31 Figure 3.9: Size Distribution of a 20-Minute Period of the NIST Test Part. .................... 31
Figure 3.10: Particle Concentration of the Test Cube over Time. .................................... 32
Figure 3.11: Size Distribution of Particles of the Test Cube. ........................................... 33 Figure 3.12: Size Distribution of Initial Burst of Particles of the Test Cube.................... 33
Figure 3.13: Size Distribution of a 20-Minute Period of the Test Cube. .......................... 34 Figure 3.14: Build Path of Different Layers in the NIST Test Part. ................................. 35 Figure 3.15: Build Path of the Pin Features on the NIST Test Part. ................................. 37
Figure 3.16: Build Path of Different Layers of the Test Cube. ......................................... 38 Figure 3.17: Particle Concentration of Both Printed Parts. .............................................. 40

vii
LIST OF TABLES
Table Page
Table 1: Printing Statistics of Different Layers. ............................................................... 36

viii
LIST OF ABBREVIATIONS
ABS – Acrylonitrile Butadiene Styrene
AM – Additive Manufacturing
CAD – Computer Aided Design
ELPI – Electrical Low Pressure Impactor
FDM – Fused Deposition Modeling
OPS – Optical Particle Sizer
PLA – Polyactic Acid
SMPS – Scanning Mobility Particle Sizer
STL - Stereolithography

ix
ABSTRACT
Aguilera, Giovanny A., M.S.M.E, Purdue University, August 2016. Characterization of
Particle Emissions from Desktop 3D Printers: A Look at the Effect of Part Design and
Build Pathing. Major Professor: Dr. Fu Zhao, School of Mechanical Engineering.
3D Printing has been heralded as a revolutionary technology that can change
manufacturing and design in the foreseeable future. One of the most popular forms of 3D
printing is fused deposition modeling (FDM) where plastic filament is heated to a
temperature where it is softened enough to be extruded to build a part, layer by layer.
This technique is found in most commercial desktop 3D printers today. Despite the great
potential that 3D printing possesses, research studies have shown that ultrafine particles
are being generated during the printing process on the order of 1.0 - 1.5 x 10⁵ #/cm3.
These ultrafine particles pose a health risk to owners and operators of 3D printers because
their small size, less than 100 nm, allows them to penetrate deep within the lungs’
airways. Adding to the potential risk, it is not yet fully understood what the chemical
composition of these particles is or how exactly they are being formed during printing.
The research covered in this study took a closer look at the FDM 3D printing process
and tried to shed some light on what may be generating these particles. The heating of the
plastic filament during printing was identified as the possible cause for the creation of
these ultrafine particles and thus examined in-depth. A strong correlation between the

x
emission of particles and different actions being performed by the printer could be shown
by conducting real-time high resolution particle concentration measurements of the 3D
printing process and simultaneously tracking the instructed build path of the nozzle.
Results indicated that the plastic filament may be overheating within the nozzle
during the heating and printing processes. This overheating causes the filament structure
to soften and weakens the chemical bonds of the plastic, which may allow additives to
escape and cause the formation of these ultrafine particles. Since high temperatures and
the softening of the plastic filament are required for FDM 3D printing, it seem like
particle emissions are an inherent issue. Therefore, mitigation strategies such as limiting
any unnecessary heating time of the filament needs to be developed and tested in the
future. Luckily, the technology of 3D printing is in its infancy stage and changes can be
made to ensure that widespread health problems do not arise as a result of using
commercial 3D printers.

1
CHAPTER 1: INTRODUCTION
Sustainable design and manufacturing can mean a lot of different things to many
people. To some it means designing a product to be easily repaired or recycled. To others,
it could mean introducing renewable resources into a product or materials that are
biodegradable. Design is one of the most important steps to creating a truly sustainable
product or process. It has a significant influence on all the other stages of the lifecycle
from raw materials, manufacturing, transportation, use, and end of life. Additive
manufacturing is a novel technology having a positive impact on the design process
through product development and prototyping that could grow and be adapted to other
stages of the lifecycle.
Additive manufacturing is a wide range of processes and techniques that build a
three-dimensional part layer by layer using a computer generated model. There are many
different types of additive manufacturing including fuse deposition modeling (FDM),
Binder Jet Printing, Sheet Lamination, and Selective Laser Sintering (SLS) to name a few
of the processes. 3D Printing has become a popular synonym for additive manufacturing.
Currently, the most popular form of 3D printing is fuse deposition modeling that is the
method used in many commercial desktop 3D printers. These commercial desktop 3D

2
printers have seen a rapid growth in use in schools, universities, design firms, and even in
personal homes.
The concept of additive manufacturing is not a new one. It was first developed
and patented in the 1980s, but it did not become adopted by industries such as the
aerospace and medical field until the early 2000s. Commercial desktop 3D printers
started becoming popular with household consumers and hobbyists in 2012 when several
companies introduced their first generation printers for about $5000. Since then, many
others have entered the market making improvements to earlier version printers. The
price of 3D printers has dramatically decreased over the last 4 years with a low-end
printer costing around $500-600.
Revenues from the worldwide 3D Printing industry reached $3 billion in 2013 and
are expected to skyrocket up to $18 billion in 2018 (PwC, 2014). Also, PwC estimates
that consumer 3D printers make up 25.5% of the market and expect it to grow up to
40.7% by 2019. In the same report, PwC estimated that 67% of manufactures were using
3D printing in some sort of capacity. Siemens predicts that 3D printing will become 50%
cheaper and 400% faster by 2020. Based on these statistic, there is a lot of optimism that
3D printing will continue to grow in the future.
1.1 Sustainable Design and 3D Printing
3D Printing has several advantages over traditional manufacturing causing many
industries and universities to invest in research. It can create various opportunities to shift
products into a sustainable direction. It is a technology that can disrupt the traditional
way of thinking of a product’s life cycle. In order to make a truly sustainable change; the

3
economic, environmental, and societal dimensions of that decision must be weighted. The
main advantage of additive manufacturing is that it reduces waste and scrap material.
Traditional methods rely on shaping and forming stock material through subtracting
excess material to create the desired part, while 3D printing builds a part through the
addition of a stock material. Additive methods allow complex geometries to be created
that cannot be replicated using traditional methods. These complex geometries can lead
to significant weight reduction of parts that have the same strength as conventional parts.
Furthermore, the reduction in weight lowers the fuel cost and emissions during
transportation.
1.2 Fuse Deposition Modeling
For the purpose of this study, 3D printers using fuse deposition modeling will be
the main focus. It is the technique that is the most popular among commercial 3D printers
and one of the cheapest methods. Typically, FDM printers heat up plastic filament past
their glass transition temperatures, soften it enough to be extruded into tiny lines through
a metal nozzle. The nozzle follows the design of the part and builds it up layer by layer.
Once a layer is complete, the process begins once again by depositing the next layer on
top of the completed one. Layers can range from 0.1 – 0.3mm in height and lines are
typically 0.1 – 0.5mm thick.
In Figure 1.1, many of the key parts of a desktop 3D printer are labeled. The
printer has an extruder assembly mounted on rails that can be moved in the x and z-
directions using stepper motors connected to a belt. The extruder contains an additional
stepper motor that feeds the filament through the heating element and then out of the

4
nozzle tip. The printing bed moves in the y-direction using the same type of mechanism
with the rails and belt.
Figure 1.1: Fused Deposition Printer.
In order to print a model part, it needs to be designed in a computer-aided design
(CAD) program where the size and shape are determined. After the part is designed in the
CAD program, it needs to be converted into stereolithography (STL) format. STL format
represents the part surface geometry and dimensions as triangulated sections in order to
reduce the amount of data stored in a file. Also, it does not store any information of color,
texture, or material properties that may have been attributed to the part in the CAD
software. Once the part is converted into the STL format, it is then input into a “slicer”
program, which slices the STL file into individual layers and produces a G-code for the
part. G-code is a programming language that is used in computer-aided manufacturing

5
that controls automation in machine tools. Essentially, it is a list of coordinates that tells
the printer where it needs to go and what direction as well as how fast to get there.
1.3 Materials used in Desktop 3D Printers
The two type of filament that are most common in 3D printing are PLA,
polylactic acid, and ABS, Acrylonitrile Butadiene Styrene, plastic. Polylactic acid is a
biodegradable thermoplastic that is derived from corn or sugarcane. Acrylonitrile
Butadiene Styrene is a thermoplastic polymer that can be made in various ratios of its
monomers. It is a strong and tough plastic due to the properties of the nitrile group and
polybutadiene that make up the chains in its molecular structure. Even though ABS has
superior material properties compare to PLA, PLA is the most readily used because it is
easier to print. It does not require a heated printing bed and prints at a lower extruder
temperature.
The heating properties of the plastic are very important when it comes to 3D
printing. Thermal conductivity is the property that determines how well a material
conducts heat. Both plastic types have a low thermal conductivity. ABS has a slightly
higher thermal conductivity at 0.17 W/m·K, while PLA has a thermal conductivity at
0.13 W/m·K, meaning both plastics are not very good at conducting heat. PLA and ABS
plastic start to soften once they reach their glass transition temperature at 65C and
110C respectively. Hence, the extruder temperature, 210C for PLA and 230C for
ABS, is set well above this temperature to heat the plastic filament rapidly while it is
constantly being fed through the extruder,. Additionally, ABS requires the printing bed to
be heated to a temperature of 110C. If the bed is not heated, the ABS plastic does not

6
stick well to the surface or to the previously printed layers. In this study, the focus will be
on ABS plastic. Even though PLA shows some elevated levels of particle emissions, it is
not as significant as ABS.
1.4 Previous Research in this Area
Additive manufacturing and more specially FDM have been believed to be a more
sustainable option to traditional manufacturing methods, but research has been limited to
studies that have had to make assumptions and predictions on the future of the
technology. In reality, 3D printing is in its early stage and further development is needed
in order to be applied on a large scale. Industrial activity accounts for 22% of energy
consumption (IEA, 2012) and for about 20% of the global CO2 emissions (Barker et al.,
2007), so there would be a significant impact in making additive manufacturing
applicable in producing a wide array of products. Right now, different additive
manufacturing techniques are being used in industries, such as the medical implant and
aerospace field, that have small production volumes that require high levels of
customization and are typically high value. In a study looking at the global sustainability
perspective of 3D printing, it was calculated that in order for FDM to be more cost
efficient than injection modeling your total production would have to be less than 7,500
parts (Gebler et al., 2014). Additive manufacturing being in its infancy stage also allows
for changes to have a huge impact in the direction in the technology.
Despite all the advantages and the endless possibilities that additive
manufacturing and more specially FDM 3D printing provide, some unforeseen
consequences of the process may have been overlooked. Recent research has shown that

7
ultrafine particles were being produced by commercial desktop 3D printers on the order
of 1.0-1.5 x 10⁵ #/cm3, which is on the order of smoking indoors (Stephens et. al., 2013).
Even though these particles were measured, it was not fully understood what causes the
formation of these particles during the printing process. These ultrafine particles could
pose a risk to human health because they can penetrate deep into the lungs due to their
small size. Also, the chemical composition of these particles are unknown to this point
and could most likely be synthetic organic compounds that are released from the heating
of the thermoplastic filaments used as feedstock. This can pose a huge risk to the many
users that have purchased desktop 3D printer to use in their home or workshop if they are
operating these printers in poorly ventilated areas.
Follow-up studies have tried to replicate the quantification of these ultrafine
particles formed during the 3D printing process with great success. Many have looked at
a variety of factors that could influence the emissions of particles from printers. Different
printers and filament combinations, including new filaments such as nylon and
polycarbonate plastic, were tested and resulted in particles generation of varying elevated
levels (Azimi et. al., 2016). Also, this study used an aerosol chamber to isolate the 3D
printer from outside factors that could affect measurements in normal room conditions.
Using the chamber confirmed that indeed the particles were being generated from 3D
printers and not any other source or interaction in the office space. Many studies have
confirmed that ABS plastic emits more ultrafine particles than PLA. This may be due to
the difference in chemical composition of plastics as well as the printing temperatures
that are required. Also, differences in the color of the plastic filament have an effect on

8
particle emissions due to the additives introduced into the formulation of the filament to
produce different colors (Stable et. al., 2016).
The type and color of the filament have an influence on the total particle
emissions and size of the particles, but it seems like it is not a major factor that
contributes to the emissions. In a particular study, researchers took a closer look at the
different stages of the printing process and concluded that the majority of the particles
were generated during the heating process of the nozzle before the printing even began
(Deng et. al., 2016). This was a result of the plastic filament residing in the nozzle for an
extended period of time causing overheating of the filament. This concept of overheating
and the amount of time the filament resides in the extruder will be investigated further in
this study, as well.

9
CHAPTER 2: PRELIMINARY TESTING
The overall goal of this study was to gain more insight into what exactly was
causing particle emissions in desktop 3D printers. In order to accomplish this, some
preliminary testing needed to be done to determine if the testing method and results of
previous studies could be replicated. Another key accomplishment would be to standardize
the testing procedure so it could be repeated.
2.1 Equipment
The first piece of equipment that was needed was a 3D printer. After looking at
many choices for a printer, it was decided to purchase a Makerbot Replicator 2X. At the
time, it was one of the popular 3D printers for schools and universities. It was a printer
that could print ABS due to the heated printer bed and had a dual extruder so two color
parts could be printed. Makerbot provided their own software to set up printing jobs that
allowed for printing using an SD card or a computer using a USB.
Two different types of particle measuring devices were used during the initial
phase of testing. One device was TSI’s optical particle sizer (OPS) 3330. It uses optics to
measure the size of the particles in the airflow coming into the device. It has a size range
from 10nm - 10µm and takes real-time measurements every 60 seconds. The other

10
measurement device that was used during testing was a NanoScan scanning mobility
particle sizer (SMPS) from TSI as well. This device charges the particles in the airstream
and enlarges the particles in a liquid to get a better count of the number of particles. This
device has a size range from 10nm to 420 nm.
Once the 3D printer and particle measurement devices were obtained, an office
space was used to conduct the experiments. The dimensions of the office were 13’ x 11’
and a diagram of the office layout can be found in Figure 2.1.
Figure 2.1: Diagram of office space where testing took place.
The air circulation/return system was shut off for the office in order to have a controlled
environment. There were three desks in the room, each measuring 6 feet by 3 feet. The
3D printer was situated in the top right corner and laid on the same desk as the SMPS and
OPS. Three-foot non-conductive rubber tubing was used to sample inside the enclosure

11
of the printer. The tubing inlet was placed as close to the extruder without getting in the
way during printing. This was 6” away from the center of the printer and 4” above the
extruder. Samples for capturing images on a transmission electron microscope (TEM)
were taken in the bottom right corner of the room as well as inside the enclosure of the
printer.
Before testing, the pumps for the TEM grid samples needed to be calibrated to a
flow rate of 0.7 L/min. Three TEM grids were prepared per testing run. One of the grids
was run during the background phase. Another grid was run during printing and one
during the cool down phase. This was done in order to see if there was any difference
between the particles in each phase. The SMPS and OPS were turned on and run for 15
minutes without recording data in order for the devices to get warmed up and acclimated
to the ambient conditions of the office space. During this time frame, the printer was
turned on and the printer bed was manually leveled. The leveling process for the
Makerbot replicator 2X requires that the extruder move to the center, front right, and
front left corners of the bed. It stops at each position and the user places a single sheet of
paper between the nozzle tip and the bed. Then, the user adjusts the height of the printer
bed by turning screws under the bed. The paper must be able to slide between the nozzle
and the bed with little resistance. Each position is checked twice and then the leveling
process is complete.
After both particle sizers warm up and the printer is leveled, 30 minutes of
background measurements were taken of the room in order to establish a baseline
concentration reading. During the test, the door remained closed and only the personnel

12
running the experiments were allowed within the room. Once the background
measurements were taken, the printer was turned on and a cube with 2 inch sides was
queued to print. For the cube print, the nozzle temperature was set to 230°C and the
heating bed was set to 110°C as recommended by the manufacturer. The standard settings
were selected in the Makerware software, which is the program used by all Makerbot
printers. This included 0.2 mm layer height and 20% infill. A raft was set to print below
the cube to improve the adhesion between the part and the printer bed. The raft is a
0.5mm layer that contains thicker lines to create a level base for the part. It is peeled off
the part once the part is completed and cooled. The raft also stops the part from cooling
unevenly and warping at the edges. Warping can cause the part to lift off of the bed
surface and collide with the nozzle, forcing the user to stop printing and have to start
over. The 3D printer starts the actual print job by heating up the printer bed. It takes
around 7 minutes for the bed to heat up from room temperature to 110°C. Once the bed
reaches its preset temperature, the nozzle heats up to 230°C. It takes about 2-3 minutes
for the nozzle to reach the printing temperature at a rate around 2°C/sec.
Once the nozzle and printer bed reach the printing temperature, the part starts being
printed, beginning with the raft. After the raft is complete, the bottom side of the cube is
printed that consist of three solid layers. Then, the middle layers of the cube consist of the
outer edges being printed while the inside is filled with an infill pattern. The infill pattern
used by the Makerware software is a hexagon pattern, similar to a honeycomb structure.
For the top side of the cube, the same layer patterns as the bottom side are repeated. The
whole part prints in an hour and 58 minutes. After the cube was done printing, it was left
in the printer and allowed to cool down. Measurements were continued during the cool
13
down phase for an additional 30 minutes. This procedure was repeated several times over
the course of a three-week period.
2.2 Preliminary Results
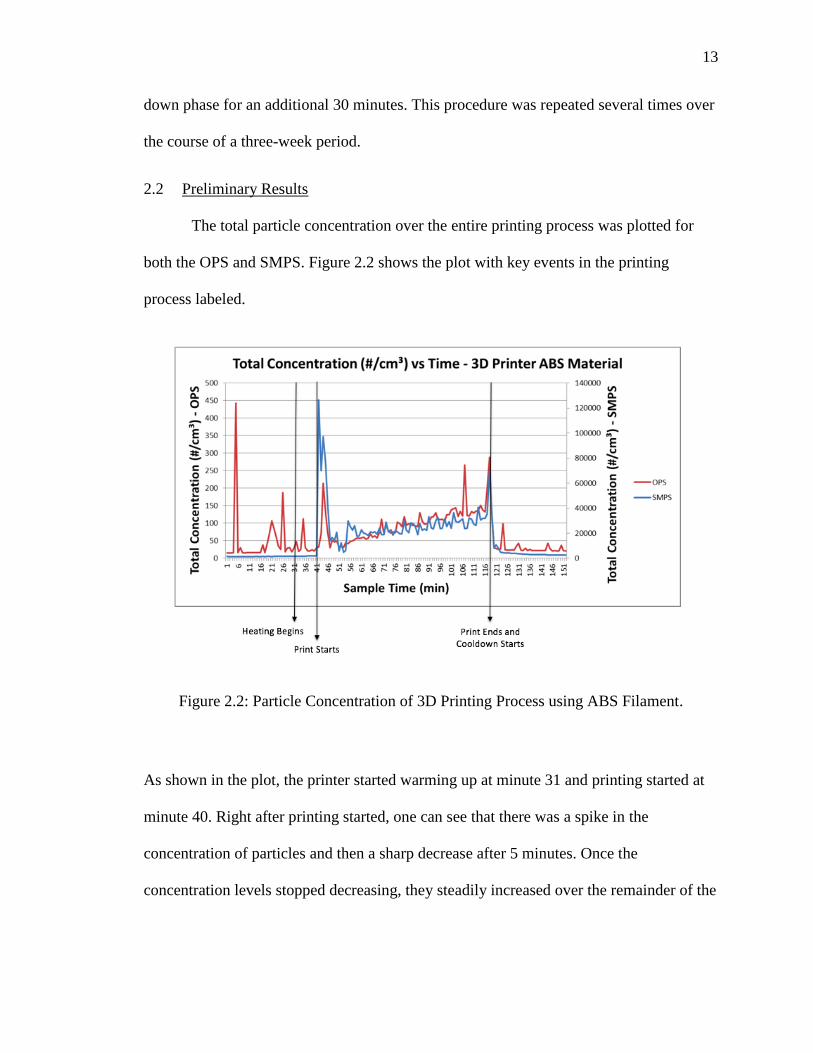
The total particle concentration over the entire printing process was plotted for
both the OPS and SMPS. Figure 2.2 shows the plot with key events in the printing
process labeled.
Figure 2.2: Particle Concentration of 3D Printing Process using ABS Filament.
As shown in the plot, the printer started warming up at minute 31 and printing started at
minute 40. Right after printing started, one can see that there was a spike in the
concentration of particles and then a sharp decrease after 5 minutes. Once the
concentration levels stopped decreasing, they steadily increased over the remainder of the
14
printing of the cube. Then another spike was detected once the printing was complete and
the cool down phase began. It is easy to see that both the OPS and SMPS measurements
follow a similar trend even though their magnitudes were different. The magnitudes
differed because the OPS measures larger particles that are typically in fewer number
than the smaller nano-sized particles that the SMPS detects. Another key observation was
that there was a bit of noise to the OPS measurements during the background phase. This
can be attributed to dust and other large particles being suspended in the air of the office.
These particles are not detected by the SMPS because they are larger than the particle
size range the SMPS can measure.
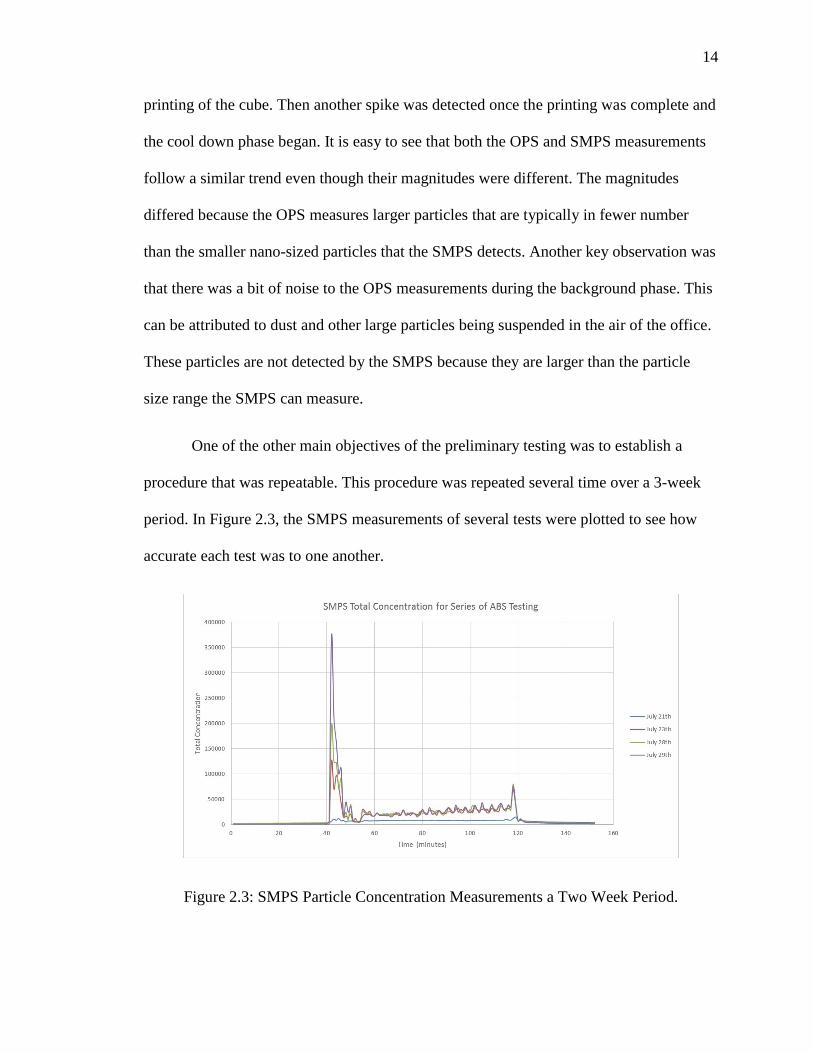
One of the other main objectives of the preliminary testing was to establish a
procedure that was repeatable. This procedure was repeated several time over a 3-week
period. In Figure 2.3, the SMPS measurements of several tests were plotted to see how
accurate each test was to one another.
Figure 2.3: SMPS Particle Concentration Measurements a Two Week Period.

15
It can be seen that each test, except for the test on July 21st, had similar results despite the
difference in height of the initial spike in concentration when printing started. The reason
for the difference in height of the initial spikes could not be determined at this stage of
the study, but was looked at further in the follow-up testing that was conducted. Also, the
concentration data for July 21st was significant lower than the rest of the test due to a
calibration issue that took place on that day. The calibration issue was addressed for the
subsequent tests and the changes were made to the procedure to assure that it was
followed identically each time.
2.3 Discussion of Preliminary Results
The results from the preliminary testing showed that it could be confirmed that
elevated concentrations of ultrafine particles were being generated by 3D printers in an
office setting. A procedure was developed that could get repeatable results, but
adjustments were made based on some of the observations and learnings from this round
of testing. The initial burst of particles was an interesting occurrence seen in each test
run. Looking closer into the cause of this burst of particles, the changes between the
heating phase and printing phase needed to be compared.
First, during the heating phase, the temperature of the nozzle and bed increase from
the room temperature to the printing temperatures of 230°C and 110°C, respectively.
During the printing phase, the temperature of the nozzle and bed are held constant.
Another difference is that during the warming phase there is no movement of the
extruder, while during printing the extruder follows the design of the part. Looking at

16
both differences, it was apparent that the burst was most likely caused by the difference
in heating. Figure 2.4 illustrates the difference in the two phases.
Figure 2.4: Differences Between Heating and Printing Phase.
The time that the filament sits inside the nozzle was defined as the filament’s
residence time. In the heating phase, the filament sits within the nozzle and heating
element for a total of about 2 minutes as it warms up, while during printing the filament
is only exposed to the heating element for a few seconds. Therefore, during the heating
phase the filament has a larger residence time than the printing phase. This higher
residence time could lead to an overheating of the filament and, therefore, be the cause of
the burst of particles that was seen throughout testing. For example, ABS plastic has a
glass transition temperature around 110°C at which it starts to soften due to the polymer
chains loosen up. Exceeding this temperature, similar to what may occur in the heating

17
phase, further weakens the bonds in the chain and allows more molecules to escape from
the structure leading to more particles being emitted. To confirm this theory, more testing
would need to be run focusing on the heating of the filament.
The concentration of particles during the printing phase exhibited another
interesting trend after the initial burst. The concentration would rapidly decrease after 5
minutes of printing and then start increasing slowly afterwards. The expectations were
that the 3D printer was a constant emitter of particles and that the particles levels would
increase steadily throughout the whole printing phase without any rapid increases or
decreases. But looking closer to the behavior of the individual particles themselves, it
was hypothesized that the particles were coagulating with one another to form larger
particles and therefore decreasing the concentration level. This coagulation of particles
may have been the root cause of the sharp decrease after the burst of particles during the
transition between the heating phase and the printing phase. Once these large particles
were formed in the air, they would act as a sink for other small particles to attach
themselves on. Taking a look at the TEM images of the particles supported this
hypothesis, shown in Figure 2.5.

18
Figure 2.5: TEM Images of the Particles Captured During the Printing Process.
The image on the right shows a close-up of two particles. As one can see, the particles are
spherical in shape and have a dark core with a lighter ring around it. Without knowing the
exact chemical composition of the particles, the dark core and lighter ring suggest that the
particle started as a vapor/liquid droplet and solidified as it cooled down. Another clue
from the TEM images was that the particles measured about 400 nm. This differed from
the size distribution that was measured from the SMPS and OPS. The measurement
devices registered that the majority of the particles were within the 80-100 nm size range,
leading to the hypothesis that there was some sort of particle growth occurring once the
particles were emitted from the source.
Another phenomenon that observed in the results was that the concentration
fluctuated up and down during the printing phase. The fluctuation may have been from
the noise of the measurement devices themselves, but it seemed to follow a pattern that
may have corresponded to changes in the printing path and speed. The speed of printing

19
slows as the nozzle goes around a corner and makes a sharp turn. Also, cooling may have
had an effect on the particles emitted that would require a further look into the heat
transfer of the printed part.

20
CHAPTER 3: PARTICLE TESTING INSIDE A CHAMBER
Based on the findings of the preliminary testing, it was clear that the generation and
emission of particles was much more complex than originally thought, before any testing
was done. Many factors that could contribute to the emission of particles were not fully
understood. Furthermore, it was difficult to make any concrete statements from the data
to this point. Quickly, it became apparent that more testing need to be done with some
adjustments in order to dive deeper into the cause of these ultrafine particles.
3.1 Adjustment for follow up testing
One of the main improvements that could be made to the testing setup would be
isolating the printer from the environment so particles did not have a chance to interact
with dust or any other particles in ambient conditions. It would also increase the
confidence that all the particles that were being measured were from the actual printing
process and from no other source. In order to do this an aerosol chamber would need to
be designed. The chamber would need to be made of stainless steel so the particles would
not react with the walls of the chamber. Ideally, the chamber would be at least 1 meter on
all sides. Unfortunately, having a custom built stainless steel chamber of that size was
fairly expensive. Another less expensive solution needed to be developed. It was settled
that the next best thing would be a prefabricated filter box for a residential air

21
conditioning system. The filter box had 18-inch sides and a 14-inch diameter inlet and
outlet. A box of this size would not fit the Makerbot printer, so a smaller size 3D printer
would have to be purchased. The 3D printer that was selected was from a small
manufacturer called MakeBlock. The printer model was the mElephant and its
dimensions were 16.4 x 13.5 x 13.0 inches. The printer was based off of the open source
design of the Prusa i3 3D printers from the RepRap community. This community shares
various designs and information with the goal of advancing the technology of 3D printing
so a printer can be a self-replicating machine that would allow everyone and anyone to
own one. The MakeBlock company follows the Prusa i3 design, but made improves to
the frame by manufacturing it out of aluminum instead of plastic. The aluminum frame
also ensures that any particles would not react to the coated metal frame of the printer.
The filter box would need to be connected to duct piping in order to supply clean
air to the chamber as well as exhaust any particles that were generated into a fume hood.
A fan would need to be added to either the inlet or the outlet of the system in order to
have control of the airflow through the chamber that would carry the particles to the
sampling point. Figure 3.1 shows the dimensions of the the filter box that would be
converted into an aerosol testing chamber. In order to get the correct airflow and the right
air exchange rate, the fan at the outlet needed to be sized properly.

22
Figure 3.1: Dimensions of the Filtration Box.
Because of the relatively small size of the designed testing chamber compared to other
aerosol chambers, a small fan with low speeds and airflow would need to be selected. It
was calculated that a fan with a volumetric airflow between 5 to 10 cubic foot per minute,
CFM, was needed. A fan that produced that small of an airflow was difficult to track
down. Ultimately, a 90mm x 90mm x 25mm PC cooling fan capable of producing a
maximum of 55 CFM was selected. In order to reduce the air flow further, it was
connected to a variable DC power supply. At the lowest setting of 3V and 0.12A, its air
flow was close to 7 CFM.
To ensure a clean air supply, a HEPA filter and active carbon filter were selected
to be placed upstream of the testing chamber. The HEPA filter would reduce about 99.7%
of the particles larger than 1 µm. The active carbon filter would get rid of any volatile
organic compounds that may have reacted with the particles coming off the printer.

23
During the design process of the testing chamber, the opportunity of conducting our
experiments at Purdue’s Birck Nanotechnology Center arose. The Birck Nanotechnology
Center contained a Class 1 cleanroom that ensured that there would be one particle larger
than 1 µm per cubic meter of air. This was the cleanest possible air supply that could be
obtained. For comparison of how clean the air was in Birck’s cleanroom, the ambient air
in a typical city environment contains about 3.5 x 10⁷ particles per cubic meter (Kumar
et. al., 2014). The ultra-clean air inside the cleanroom removed the need for any filters at
the inlet of our testing system. Another added benefit of testing at Birck was that there
was a fume hood already in place to exhaust any particulate matter that would be
generated out of the testing room at variable speeds. This removed the need to attach a
flexible duct pipe at the outlet of the chamber. Instead of the flexible duct pipe, a standard
three-foot aluminum duct pipe was added to the outlet. A hole was drilled a foot away
from the outlet of the chamber to allow for a non-conductive tube to be inserted, which
was attached to the air sampling equipment. The flexible duct pipe was added to the inlet
in order to capture clean air from the cleanroom and away from the fume hood that the
chamber system was exhausting into, in order to reduce any possibility of recirculating
any particles into the system.
For this set of testing, a high resolution Electrical Low Pressure Impactor (ELPI)
was selected to be used instead of the SMPS and OPS. The ELPI is a real-time air
sampling instrument that measures airborne particle size distribution of an air stream. The
particles in the incoming air stream are charged at the inlet of the ELPI. Once the
particles are charged, the size of the particles are sorted in a low pressure cascade
impactor. The impactor contains 14 different stages that particles of a certain size range

24
are collected upon. The air stream is constricted gradually by reducing the size of the air
passages, causing particles to deposit on the impactor stages. Larger particles deposit at
higher stages, while the smaller particles collect at the lower stages. Each stage is
connected to an electrometer that reads the electrical current that is produced by the
charged deposited particles. This electrical current is directly proportional to the number
concentration of the particles on that stage. Figure 3.2 illustrates how the impact stages of
the ELPI are set up.
Figure 3.2: Diagram of Impactor Stages.
The advantage of using the high resolution ELPI over the SMPS and OPS is that the
ELPI can run one second scans, while the SMPS and OPS were limited to scanning every

25
minute. The increase in time-resolution would give us a better picture of the behavior of
the particles coming out during the printing process. Another added benefit of using the
ELPI was that it could detect particles down to 6 nm, increasing the range of detection
and providing additional information of possible growth of the particles.
Once the testing chamber system was designed and equipment was selected, it
was time to build the actual system. A diagram of the complete system is shown in Figure
3.3.
Figure 3.3: Schematic of the Testing Chamber System.
As shown in the diagram of the complete system, the ELPI would be attached to non-
conductive tubing in order to sample downstream of where the 3D printer was located.
Duct reducers were needed at both the inlet and outlet of the testing chamber in order to
change the diameter of the duct pipes from 14 inches to 8 inches at the outlet and from 14

26
inches to 6 inches at the inlet. The diameters were reduced so the system would be more
compact and fit inside the cleanroom space. The exhaust fan was placed at the exhaust
end of the system to eliminate the risk of particulate coming off the fan and
contaminating the air before reaching the 3D printer and skewing results. This way it
would be guaranteed that any particles that was measured would be from the 3D printer.
Figure 3.4 shows the testing chamber next to the fume hood and the complete
experimental setup in place inside the cleanroom.
Figure 3.4: Testing Chamber System inside of the Fume Hood Inside the Cleanroom.
Aside from the cube that was printed during preliminary testing, a standardized part for
additive manufacturing was released by the National Institute of Standards and
Technology (NIST). The part contains pins, holes, and other features of various shapes
and sizes to determine the performance of additive manufacturing equipment. In Figure

27
3.5, the NIST test part is shown from a top and isometric view with major features being
pointed out and labeled.
Figure 3.5: Diagram of NIST Standardized 3D Printing Test Part.
3.2 Procedure of Testing with ELPI
To begin testing, the ELPI and vacuum pump were turned on and a leakage check
was performed to ensure that the impactor was assembled correctly after it was opened to
replace the foil substrate. The foil substrates were changed before conducting any tests
involving 3D printing, to make sure that it was clean before making any measurements.
The procedure to open the impactor and change the foil substrate will not be covered in
this thesis. To see the foil changing procedure, refer to the ELPI manual provided by
Dekati, the manufacturer of the device.
Once the leakage check was passed, the ELPI was allowed to run for 30 minutes
to stabilize to the ambient conditions in the cleanroom. Once 30 minutes passed, a zero

28
check was done to establish a baseline. The zero check required the air pump on the ELPI
to be turned on so that the air flow entering the device would be diverted and filtered
before entering the impactor. After the ELPI was zeroed, the charger was turned on and a
background measurement of the chamber was taken with the exhaust fan on to have some
air flow through the chamber. The background measurements were taken for 20 minutes.
After the background was complete, the 3D printer was set to print and
measurements were taken throughout the entire printing process. Once one printing job
was complete, the printer was allowed to cool down and measurements were taken for 20
additional minutes. After the cool down phase, the particle concentration was back to
background levels and the testing procedure was repeated. The first part that was printed
was the NIST test part with a nozzle temperature of 235°C and a heating bed temperature
of 115°C. Then, a cube at the same nozzle and bed temperature was printed. The NIST
part was attempted again at a nozzle temperature of 245°C and the heating bed set at
115°C. The decision to increase the temperature was made because the clean room
temperature was set to 18.3°C, which was causing an issue with the nozzle cooling down
and fluctuating 1 to 2 degrees away from the printing temperature that was specified.
3.3 Results of the NIST Test Part
With the design of the testing chamber and the use of the ELPI, providing real-time
measurements every second, shifts in the printing process could be detected in the
particle concentration data. Figure 3.6 is a plot of the particle concentration over the
course of the entire printing time of the NIST test part. Key events of the printing process

29
are labeled on the plot. These events also correspond with shifts in particle
concentrations, which will be discussed further in the following sections.
Figure 3.6: Particle Concentration of NIST Test Part over Time.
The same initial burst of particles that was observed in the preliminary results
occurred once again. The concentration during the burst of particles was close to 1.0 x
107 #/cm3. For the next 10 minutes after the burst, the particle concentration remained
elevated and finally dropped around the same time that the raft finished printing. While
the bottom side of the part was being printed, there was close to no emission of particles.
This was the first time that this phenomenon had occurred throughout all the testing that

30
was conducted. The same behavior was observed while printing the cube and the test part
at a higher nozzle temperature as well. After the bottom side of the part was completed,
the concentration of particles rose once again until the top layer of the base of the part
was started. The average concentration during this time was about 7.0 x 10⁵ #/cm3. Once
the top layer of the base was started, the concentration took a slight dip and increased
only when the pin features were being printed, where it reached a concentration of 4.0 x
105 #/cm3.
The high resolution of the ELPI allowed us to take a deeper look at the behavior
of the particles throughout the printing process. Figure 3.7 shows a color map of the
particle concentration between 6 – 200 nm over the entire printing period.
Figure 3.7: Size Distribution of Particles of the NIST Test Part.
The burst of particles during the transition between the heating phase and the printing
phase consists mainly of particles between the size range of 10 – 50 nm. In a close-up
view of the burst itself, in Figure 3.8, one can see that at around 20 minutes the burst

31
starts and then the size of the particles increases slightly from 30 nm to 50 nm. Pass that
point there is not much particle growth and the particles just dissipate.
Figure 3.8: Size Distribution of Initial Burst of Particles of the NIST Test Part.
Looking closer into the printing period between the bottom side of the part and the top
base layer, one can see that there are spikes in particle concentration at different points in
time. Figure 3.9 shows a 20-minute section of printing that exhibits this behavior.
Figure 3.9: Size Distribution of a 20-Minute Period of the NIST Test Part.
3.4 Results of the Test Cube
In order to have a direct comparison to the preliminary test results and a different
shape to test, the cube was printed out using the same settings as the NIST test part. The
cube results from the ELPI had the same trends as the preliminary tests. A short burst of

32
particles, lasting one to two minutes, was observed at the very beginning of printing
followed by a rapid decline in particles. The burst peaked at a concentration of 5.0 x 10⁶
#/cm3. This was significantly smaller than the burst seen while printing the NIST part.
Again, few particles were measured while the bottom layer of the part was being printed.
Then, there are a steady increase while the infill layers printed with particle
concentrations ranging from 7.0 – 9.0 x 10⁵ #/cm3 during this period. Another spike was
measured, a few moments after printing end with similar characteristic to the first burst.
Figure 3.10 shows the concentration of the entire process for the cube.
Figure 3.10: Particle Concentration of the Test Cube over Time.

33
The size distribution of all the size bins from 6 nm - 200 nm was plotted over time
and color was added to represent the concentration of each bin. In Figure 3.11, the color
map is shown with labels of key events of the printing process.
Figure 3.11: Size Distribution of Particles of the Test Cube.
Zooming in to the initial burst of particles at the beginning of printing, it became
apparent that in the case of the cube, the burst only last one minute before particles
started to dissipate. There was no clear signs of particle growth or coagulation, which was
surprising to see. The deep red between 20.5 – 21 minutes in Figure 3.12 shows that most
of the particles are around 20 nm in diameter.
Figure 3.12: Size Distribution of Initial Burst of Particles of the Test Cube.

34
Now, looking at the printing of the infill layers which makes up around 90% of
the part, one can see a pattern start to develop. Figure 3.13 shows the pattern over a 20-
minute period. The pattern is interesting because it closely follows the repetition of two
layers that make up the infill of the cube.
Figure 3.13: Size Distribution of a 20-Minute Period of the Test Cube.
3.5 Discussion of Results
The particle concentration measurements seemed to suggest that particle
generation was closely connected to the change in the design of layer that was being
printed. Looking closely at the layers that seemed to change the concentration of the
particles being generated, it became clear that each layer had major differences when
compared to one another. Figure 3.14 shows the geometry of three different layers within
the NIST test part.

35
Figure 3.14: Build Path of Different Layers in the NIST Test Part.
Starting with the base of the raft, this layer prints at the slowest speed of any
layer. It extrudes at a speed of 10 mm/s to form thicker lines and a good base for the part
to be printed on top of it. This layer is made up of 1224.6 mm of filament and takes 375.1
seconds. This layer was printed right at the start of the printing process and had an
average particle concentration of 2.20 x 10⁶ #/cm3. The bottom side of the NIST part
extruded at a speed of 40 mm/s at the outer edges and 90mm/s inside of the edges. 865.43
mm of filament was used during this layer and took 285.0 seconds. During this time
period the average concentration was 5.45 x 10⁵ #/cm3. The middle layer of the part that
included infill extruded at the same speed as the bottom layer of the part, 40 mm/s and 90
mm/s. The total time this layer took was 54.8 seconds and used 140.35 mm of filament.
In this phase of printing, the average concentration was steadily increasing until the top
layer of the base was printed. The concentration was 7.32 x 10⁵ #/cm3. The table below
shows all the information of each layer and makes it easier to compare each layer to one
another.

36
Table 1: Printing Statistics of Different Layers.
Layer Time to
Complete
(sec)
Filament
Length
(mm)
Extrusion per
second
(mm/s)
Average
Concentration
(#/cm3)
Raft 375.1 1224.6 3.26 2.20 x 10⁶
Bottom
Side
285.0 865.43 3.04 5.45 x 10⁵
Middle w/
Infill
54.8 140.35 2.56 7.32 x 10⁵
The table shows that the particle concentration does not correspond to the amount
of material that is being extruded. During the printing of the bottom side of the NIST
part, 2.157 grams of filament was extruded, while the middle layer used only about a
sixth of the material, 0.352 grams of filament. Even though the bottom layer used more
filament, more particles were emitted during the middle layer. This implies that not all
filament that is extruded emits the same amount of particles. This means that there must
be another factor that is causing the filament to emit particles. When looking at this
information with the fact that the initial burst of particles is caused by the residence time
of the filament within the nozzle, the next logical step was to look to see if anything was
causing a change in the residence time during printing. The only factor that would change
the residence time of the filament during printing would be the travel distance and speed
of the nozzle when it moves from features that are far apart from one another without
extruding any filament. Figure 3.15 shows a close up view of one of the layers near the
end of the printing process of the NIST part that features the pins above the top surface.
This represents a good example of how a printer travels from feature to feature. The
green lines in the figure represent the distance that the nozzle travels without extruding
any filament.

37
Figure 3.15: Build Path of the Pin Features on the NIST Test Part.
While the nozzle travels from point to point without extruding, it is increasing the
residence time of the filament. When looking at the three layers that were compared
earlier, it turned out that the middle layer had more time that it spent traveling without
extruding than the bottom layer. The raft had the highest particle concentration due to the
fact that it had the highest amount of travel time without extruding because it moved very
slowly between features.
The NIST test part has a lot of feature that make it hard to see this correlation
between residence time of the filament and the emission of particles. Many of layers have
very different designs making it hard to compare layers to one another. The results from
the test cube were simpler to interpret because there were only four types of layers that
made up the part. The four types of layers were a raft layer, the top/bottom side of the

38
cube, and two infill layers that were sandwiched in between the top and bottom layers.
The raft layer was a thick pattern of left to right steps that were extruded slowly. The
whole layer is slightly larger than the dimensions of the cube. The top/bottom sides of the
cube are made of a square outline printed at 40 mm/s and a diagonal pattern filling the
inner area printed at 90 mm/s. These are the same extrusion speeds that the NIST test part
was printed at, as well. The middle layers of infill consist of the repetition of two layers,
one with a honeycomb pattern and the other with a zigzag pattern. Again, the outer edge
was extruded at a speed of 40 mm/s, while the infill pattern printed at 90 mm/s.
Figure 3.16 shows the four different layers that make up the cube. The teal color
lines represent extruding at 90 mm/s and the pink lines are extruded at 40 mm/s.
Figure 3.16: Build Path of Different Layers of the Test Cube.

39
Comparing the four different layers to one another, the raft layer was a part of the sharp
decrease in particle concentration right after the burst at the end of the heating phase. It
had a short travel time at the beginning and at the end of the raft represented by the green
lines in Figure 3.16. Similar to the raft of the NIST test part, the raft of the cube was
extruded very slowly at 10 mm/s and had long travel times compared other layers. The
top and bottom layers had short travel times compared to time spent extruding material,
meaning that the residence time of the filament was low for these layers. This low
residence time corresponded to the low particle concentrations during the same time
period. The residence time of the infill layers were higher than the other layers because
low amounts of material were used in these layers with a long travel time at the beginning
of each layer. This is most likely the cause of the steady increase in particle concentration
during the printing of the middle layers.
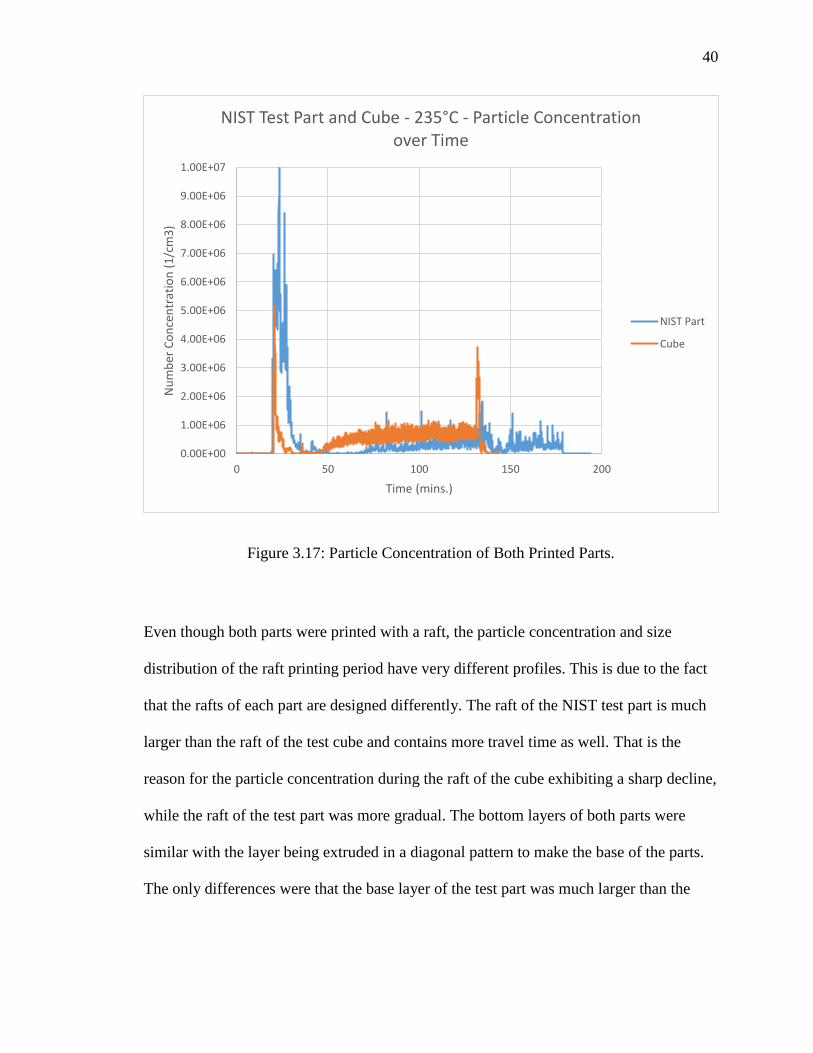
Plotting the particle concentration of the two parts in Figure 3.17 showed that
each of them had different levels of particle concentration throughout the print processes.
40
Figure 3.17: Particle Concentration of Both Printed Parts.
Even though both parts were printed with a raft, the particle concentration and size
distribution of the raft printing period have very different profiles. This is due to the fact
that the rafts of each part are designed differently. The raft of the NIST test part is much
larger than the raft of the test cube and contains more travel time as well. That is the
reason for the particle concentration during the raft of the cube exhibiting a sharp decline,
while the raft of the test part was more gradual. The bottom layers of both parts were
similar with the layer being extruded in a diagonal pattern to make the base of the parts.
The only differences were that the base layer of the test part was much larger than the
0.00E+00
1.00E+06
2.00E+06
3.00E+06
4.00E+06
5.00E+06
6.00E+06
7.00E+06
8.00E+06
9.00E+06
1.00E+07
0 50 100 150 200
Nu
mb
er C
on
cen
trat
ion
(1
/cm
3)
Time (mins.)
NIST Test Part and Cube - 235°C - Particle Concentration over Time
NIST Part
Cube

41
cube and the base layer contained a set of holes at each corner and in the middle. After
the bottom layers, the layers of the rest of the parts are very different. Even though the
NIST part uses more filament and is much larger than the test cube, the average
concentration of the NIST part and the test cube were almost identical, 5.55 x 10⁵ #/cm3
and 5.47 x 10⁵ #/cm3 respectively. Again, this supports the notion that the particle
emissions during 3D printing are not connected to how much filament is extruded.

42
CHAPTER 4: CONCLUSIONS, MITIGATION, AND FUTURE WORK
4.1 Conclusions
A research study in 2013 showed that ultrafine particles were being generated
while using a commercial 3D printer. Based on that study, preliminary testing was
conducted to see if the results could be replicated using aerosol measurement devices
available at Purdue University. During preliminary testing, it was confirmed that ultrafine
particles were indeed being emitted during the 3D printing process. A large burst of
particles was continuously being detected across all the experimental runs during the end
of the heating phase and the beginning of printing phase. A hypothesis was formed that
the prolonged residence time of the plastic filament during the heating period was
causing the filament to overheat. The burst of particles would be released as the first bit
of filament was being extruded at the beginning of the printing phase. To confirm this
hypothesis, adjustments were made to the experimental set-up to get better results. Some
of these adjustments were building a testing chamber that would isolate the printer from
the ambient conditions of the office as well as using a high resolution ELPI that could
take real time measurements every second. The results of the testing with the adjustments
supported the hypothesis of the overheating of the filament at the beginning of printing.
Also, the results showed that slight overheating may be occurring during the printing
process as well. This overheating may be caused by the nozzle having

43
to travel across the part without extruding when different features are far apart within a
layer. This further supports the thought that the residence time of the filament within the
nozzle may be related to the magnitude of the particle concentration being emitted from
the printing process. Although there is a strong connection between these two factors,
more testing is needed to confirm this fact with more confidence. Ideally, a part would be
designed that had layers with different nozzle travel times, which would in turn cause
during residence time throughout the building of the part.
4.2 Possible Solutions and Mitigation Techniques
Emissions during the 3D printing process seems to be inevitable and inherit to the
process. In order to successfully 3D print a part out of plastic, the filament needs to be
softened using temperatures that greatly exceed its glass transition temperature, which is
the cause of the particle emissions. The key to making 3D printing safer may be to try to
mitigate the exposure to the operator and users of the printer, instead of eliminating it
altogether.
Filtration is a common solution to many particulate and dust problems, but it may
not work in this scenario because the particles generated by 3D particles are ultrafine
particles in the size range of 10 – 100 nm. Many filters cannot capture particulate of this
size. It is difficult to have the filter fibers so close together to capture particles of this size
and also allow enough air to pass through it. Ventilation is another technique used to
reduce the concentration of particles. Ventilation is already recommended by the
manufacturers of 3D printers and many studies have emphasized this method. It is the
most convenient and cost effective method, because it does not require any changes or

44
add-ons to the printer. It only requires the user to move the printer to a more suitable
location.
Particle emissions from 3D printers have a strong connection to the heating of the
filament. The residence time and the possible overheating of the filament during the
heating phase needs to be reduced. A change to the heating procedure may be required.
Currently, during the heating phase, the feed motor is kept off and filament oozes out of
the nozzle once the pressure gets too high due to the rising temperature. The main issue
in the heating phase is that the filament sits in the nozzle for too long. This issue can be
overcome by starting to feed more filament into the nozzle after a certain temperature is
reached and forcing the once stagnant filament out of the nozzle before it overheats. This
would require better temperature control and monitoring of the nozzle. Some possible
concerns to this method would be clogging the nozzle with too much filament and what
to do with the filament that is being forced out of the nozzle before printing. Fears of
clogging the nozzle can be addressed by pinpointing the temperature at which the
filament is soft enough to begin extruding out and finding the correct feed rate that
matches the rate at which the filament is coming out of the nozzle.
Another possible solution comes from a research paper that looked at the effects
of printing parameters, such as temperature and feed rate on particle emissions. In the
paper, they proposed the idea of not having the filament in the nozzle during the heating
phase (Deng 2016). They showed that this simple design change could reduce the
emissions of the initial particle burst up to 75%. It is an interesting solution that needs to
be refined further. Once the nozzle is cleared, it is easy to insert the filament after the

45
heating phase, but the key is how to remove the filament once printing is done and clear
the nozzle so that it is ready for the next print. When the filament is removed from the
extruder manually, the nozzle is required to be heated to a temperature close to the
printing temperature, which places a limit on the time frame of removal to right after
printing is complete. Any delay in removal will lead to an overheating of the plastic
because no extrusion is taking place. Another issue to this method is that removing the
filament manually leaves residue of the filament inside the nozzle that will still be
overheated the next time the printer heats up to start another print. An automated method
of completely flushing out the nozzle needs to be developed in order for this solution to
work.
Another way to look at a possible solution to the particle emission problem would
be to look at controlling the environment within the printer’s enclosure and frame. One
idea is to somehow electrically charge the particles that are emitted and collect them with
an oppositely charge collection area so that the particles do not escape to the surrounding
area. Other collection methods such as adding moisture to immediate area of the printer,
so particles would become trapped in water droplet or reacting the particles with another
substance could be a possibility once the chemical composition of these particles is
discovered. In the end, more information is needed about the composition and formation
of these particles in order to come up with mitigation strategies.
4.3 Recommendations for Future Work
The research area of 3D printing has become extremely competitive in the last
two years. Just in the first half of 2016, five papers have been published in the area of

46
particle emissions related to 3D printers. The product of additive manufacturing and
commercial desktop 3D printer is in its infancy stage. It is in the perfect stage for changes
to be made to the technology before it gets too big and resistant to change. Even with
various published papers on the topic, the emission of particles from 3D printers is still
not fully understood. In this thesis, a strong correlation was made between the residence
time of the filament within the nozzle and the particle concentration measured within the
immediate area of the printer. More testing needs to be done on the heating of the
filament to strengthen this correlation and support these findings. Because particle
emissions in this size range may have adverse health risk to owners and operators of 3D
printers, the chemical composition of particles needs to be determined in order to see
exactly how harmful the exposure is to humans. If the health threat is substantial, reliable
solutions will need to be developed and tested.
Aside from the particle emissions of 3D printers, other areas looking at the
sustainability of additive manufacturing, specifically FDM 3D printing, should be
studied. Even with case studies focusing on producing specific products through additive
manufacturing methods, a complete sustainability assessment needs to be done that
includes the potential environmental and social impacts of feedstock production, process
waste, emissions, and end-of-life implications of shifting over to additive manufacturing.

LIST OF REFERENCES

47
LIST OF REFERENCES
Afshar-Mohajer, N., Wu, C.Y., Ladun, T., Rajon, D.A. and Huang, Y., 2015.
Characterization of particulate matters and total VOC emissions from a binder
jetting 3D printer. Building and Environment, 93, pp.293-301.
Azimi, P., Zhao, D., Pouzet, C., Crain, N. and Stephens, B., 2016. Emissions of ultrafine
particles and volatile organic compounds from commercially available desktop
3D printers with multiple filaments. Environmental science & technology.
Bilton, N., 2013. Disruptions: On the fast track to routine 3-D printing.Retrieved
November, 6, p.2014.
Campbell, T., Williams, C., Ivanova, O. and Garrett, B., 2011. Could 3D printing change
the world. Technologies, Potential, and Implications of Additive Manufacturing,
Atlantic Council, Washington, DC.
Deng Y., Cao S., Chen A., Guo Y., 2016. The impact of manufacturing parameters on
submicron particle emissions from a desktop 3D printer in the perspective of
emission reduction, Building and Environment.
Gebler, M., Uiterkamp, A., Visser, C., 2014. A global sustainability perspective on 3D
printing technologies. Energy Policy. 74(158-167).
He, C., Morawska, L., Hitchins, J., Gilbert D., 2004. Contribution from indoor sources to
particle number and mass concentrations in residential houses. Atmospheric
Environment. 38(3405-3415).
He, C., Morawska, L., Taplin, L., 2007. Particle Emission Characteristics of Office
Printers. Environmental Science & Technology. 41(6039-6045).
IEA, 2012. Key World Energy Statistics. International Energy Agency, Paris/France.
Kodama, H., 1981. A scheme for three-dimensional display by automatic fabrication of
three-dimensional model. J. IEICE, 64, pp.1981-4.

48
Kumar, P., Morawska L., Birmili, W., Paasonen, P., Hu, M., Kulmala, M., Harrison, R.,
Norford, L., Britter, R., 2014. Ultrafine particles in cities. Environment
International. 66(1-10).
MatterHackers 3D printer filament comparison guide, 2015;
https://www.matterhackers.com/3d-printer-filament-compare
McKinsey Global Institue, 2013. Disruptive Technologies: Advances That Will
Transform Life, Business, and the Global Economy. McKinsey Global Institutes
& Company, Seoul, South Korea.
PWC, 2014. The future 3-D printing: Moving beyond prototyping to finished products.
PriceWaterhouseCoopers Technology Forecast.
Ramani, K., Ramanujan, D., Bernstein, W., Zhao, F., Sutherland, J., Handwerker, C.,
Choi, J., Kim, H., Thurston, D., 2010. Integrated Sustainable Life Cycle Design:
A Review. ASME Journal of Mechanical Design. 132(9).
Stabile, L., Scungio, M., Buonanno, G., Arpino, F., Ficco G., 2016. Airborne particle
emission of a commercial 3D printer: the effect of printer material and printing
temperature. Indoor Air.
Stephens, B., Azimi, P., El Orch, Z. and Ramos, T., 2013. Ultrafine particle emissions
from desktop 3D printers. Atmospheric Environment.
WHO. Review of evidence on health aspects of air pollution – REVIHAAP. World
Health Organization. Regional Office for Europe; 201333.
Yi, J., LeBouf, R. F., Duling, M. G., Nurkiewicz, T., Chen B. T., Schwegler-Berry, D.,
Virji, M. A., Stefaniak, A. B., 2016. Emission of particulate matter from a desktop
three-dimensional (3D) printer. Journal of Toxicology and Environmental Health