Embed Size (px)
Citation preview
CHARACTERIZATION OF MULTIBLOCK
COPOLYMERS BY CHROMATOGRAPHY METHODS
Vom Fachbereich Chemie
der Technischen Universität Darmstadt
zur Erlangung des akademischen Grades eines
Doktor rerum naturalium
(Dr.rer.nat)
genehmigte Dissertation
vorgelegt von
Habib Patrick Richard YOBA-N’GOMA (M.Sc)
aus Loubomo
Referent: Prof. Dr. Harald Pasch
Korreferent: Prof. Dr. Markus Busch
Tag der Einreichung: 03.12.2009
Tag der mündlichen Prüfung: 08.02.2010
Darmstadt 2010
D 17

I thank the Almighty and Saviour, The Lord Jesus Christ, for the support during my
struggle time.
I would like to express my gratitude to all the people who played an active role in the
achievement of this PhD thesis. I thank Prof. Harald Pasch who gave me the
opportunity to work in his group and who devoted me a lot of his time during my stay
at DKI.
I would also like to thank Dr. Wolfgang Radke for his assistance, advice and valuable
contributions made towards this interesting and challenging research. His experience
represented always high quality inputs to this PhD. His sense of humour will be
missed.
I am very grateful to Deutscher Akademischer Austausch Dienst (DAAD) for the
financial support.
I am also grateful to all my past and present colleagues of DKI who made my stay at
the institute so pleasant. I appreciate the friendly atmosphere during the work as well
as during the leisure activities. Thank you for having made me feel more than
welcome in Germany.
A special thank you goes to Achille Bivigou Koumba and Isabel Haamel. They have
always been there for me during the difficulties and troubles times I encountered
throughout this study.
Big thank goes to my friends outside the institute. I personally want to mention Yann
Moupinda, Regis Ngoma, Romual Itomba, Ivan Mikomba, Yannick Affogolo, Come
Ngouele, Ghislain Talani, and Stephane Ibinga
Enfin je remercie tous mes parents qui m’ont aidé, soutenu et encouragé dans mes
études, à qui je souhaite exprimer toute ma tendresse et l’immense joie qui m’habite
lorsque je suis avec eux.

Diese Arbeit wurde am Deutschen Kunststoff-Institut unter Leitung von
Prof. Dr. H. Pasch in der Zeit von Februar 2006 bis December 2009 durchgeführt.
Je dédis cette thèse de doctorat à tous ceux, qui m’ont soutenu de près ou de
loin, d’une manière ou d’une autre au nom du Tout Puissant Seigneur Jésus
Christ.
TABLE OF CONTENT
German Summary 1
1. Introduction 5
2. The Objectives of the Thesis 10
3. Theoretical Background 11
3.1 Molecular characterization of polymers 11
3.1.1 Liquid Chromatographic Separation of Polymers 11
3.1.2 Definition of liquid chromatography 12
3.1.3 Separation modes in the chromatography of polymers 12
3.1.3.1 Size exclusion chromatography 14
3.1.3.2 Liquid adsorption chromatography 16
3.1.3.3 Liquid chromatography at critical conditions (LC-CC) 17
3.1.3.4 Gradient liquid chromatography 18
3.2 Detection and identification of polymers 20
3.2.1 Evaporative Light Scattering Detector (ELSD) 20
3.2.2 Fourier Transform Infrared (FTIR) Spectroscopy 21
3.2.3 Nuclear Magnetic Resonance (NMR) 22
3.2.4 Pyrolysis GC-MS 23
4. Results and Discussions 25
4.1 Functionality Type Distribution (FTD) of PCLs and PPDOs-diols 27
4.1.1 Separation of PCL-diols according to functional hydroxyl groups 27
4.1.1.1 Analysis of PCL-monool and PCL-diols at critical conditions 30
4.1.1.2 Separation of PPDO-diols according to end group functionality 31
4.2 Characterization of chemical heterogeneity of multiblock copolymer (MBC) 37
4.2.1 Analysis of molar mass distribution by SEC 38
4.2.2 Investigation of chemical composition by SEC- FTIR 40
4.2.3 Brief view on synthesis of samples 45
4.2.3.1 Synthesis of multiblock polymers 45
4.2.3.2 Synthesis of multiblock copolymers (MBP) 46
4.3 Separation of MBCs by chemical composition distribution using gradient HPLC 47
4.3.1 Polymers solubility test 47
4.3.2 Selection of stationary phase and mobile phase 48
4.4 Chromatography method development 49
4.4.1 Isocratic measurements of the PCLs, the PPDOs and multiblock polymers (PCL-MBP and PPDO-MBP) in dichloromethane and acetonitrile 49
4.4.2 Gradient liquid chromatography of the polymers 52
4.4.2.1 Gradient liquid chromatography of the PCL-diols, PPDO-diols and their multiblock polymers 52
4.4.2.2 Gradient liquid chromatography of multiblock copolymers 56
4.4.3 Liquid chromatography under critical conditions for PCL 57
4.4.4 Investigation of MBC at critical conditions of PCL 60
4.5 Characterization of different peaks from gradient chromatography 62
4.5.1 Fourier-Transform Infrared Spectroscopic (Attenuated Total Reflectance) Analysis 62
4.5.2 Determination of composition in peaks 1 and 2 from gradient chromatography of the MBCs by LC-FTIR spray device. 67
4.5.3 Pyrolysis Gas Chromatography Mass Spectroscopy (Py-GC-MS) 70
4.5.3.1 Strategy of identification 70
4.5.3.2 Pyrolysis of the multiblock copolymers 72
4.5.3.3 Determination of PCL content in the multiblock copolymers 74
4.5.3.4 Pyrolysis of the fractions 1 and 2 from gradient chromatography 76
4.5.4 On-line coupling of gradient chromatography and 1H-NMR 80
5. Experimental Part 95
5.1 Chromatographic equipment 95
5.2 Chromatographic columns 95
5.3 Polymer synthesis 97
6. Summary and Conclusions 102
7. List of Abbreviations and Symbols 106
8. Bibliographic References 108
PhD Thesis
Habib-Patrick-Richard-Yoba-N’goma
1
German Summary
Das Interesse und die Forderung nach innovativen Produkten mit neuen
Eigenschaften resultiert in der Entwicklung einer großen Vielzahl neuer komplexer
Polymermaterialien. Dies führt zu einer erhöhten Nachfrage nach geeigneten
Charakterisierungsmethoden, um die molekulare Struktur dieser Materialien zu
verstehen und mit den makroskopisch messbaren Eigenschaften verknüpfen zu
können, woraus sich schließlich Struktur-Eigenschaftsbeziehungen ableiten lassen.
Deren Kenntnis erlaubt die Optimierung der Syntheseparameter und damit der
resultierenden Gebrauchseigenschaften.
Das Ziel der vorliegenden Arbeit war es daher analytische Methoden zu erarbeiten,
um die Funktionalitätsverteilung (FTD) von Poly(p-dionanon)- (PPDO) und
Poly(caprolactone)-diolen (PCL) aufzuklären. Weiterhin sollten Informationen zur
chemischen Heterogenität von Multiblockcopolymeren (MBC), die durch Verknüpfung
der beiden genannten Polyesterdiole mit Diisocyanaten erhalten wurden, gewonnen
werden.
Zunächst wurden chromatographische Bedingungen erarbeitet, die eine Trennung
der PPDO- und PCL-Diolproben nach der Anzahl der OH endgruppen ermöglichten.
Für PCL wurden hierzu auf einer polaren stationären Phase die kritische
Eluentenzusammensetzung zu 92% Dichlormethan (DCM) und 8% Tetrahydrofuran
(THF) bestimmt. Für alle PCL-Diole wurden unter diesen Bedingungen zwei Peaks
erhalten. Der erste Peak eluierte nahe dem Totvolumen der Säule und wurde PCLs
ohne polaren OH-Gruppen zugeordnet. Der zweite Peak eluierte bei höherem
Elutionsvolumen, bedingt durch die zusätzliche Retention zweier OH-Gruppen mit
der stationären Phase. Obwohl unter kritischen Bedingungen gearbeitet wurde,
eluierten die Diole in der Reihenfolge abnehmender Molekulargewichte. Der Grund
hierfür kann darin gesehen werden, dass bei hohen Molekulargewichten die beiden
OH-Gruppen statistisch unabhängig voneinander adsorbiert werden. Bei kurzen
Polymerketten hingegen adsorbieren die OH-Gruppen nicht mehr unabhängig
voneinander. Sobald die erste OH-Gruppe adsorbiert ist, befindet sich auch die
zweite OH-Gruppe in der Nähe der Oberfläche der stationären Phase. Hierdurch wird
PhD Thesis
Habib-Patrick-Richard-Yoba-N’goma
2
die Wahrscheinlichkeit für die Adsorption erhöht, was zu längeren Retentionszeiten
führt.
Ein 10 minütiger linearer Gradient von 100% DCM nach 100% Dimethylformamid
(DMF) wurde auf einer polaren stationären Phase verwendet, um PPDOs nach ihren
Endgruppen zu trennen. Unter den gewählten chromatographischen Bedingungen
zeigten die PPDO-Diolproben zwei Peaks. Die Charakterisierung der Fraktionen
mittels MALDI-TOF-MS (Matrix Assisted Laser Desorption Ionisation Time Of Flight
Mass Spectrometry) zeigten, dass der erste Peak hauptsächlich PPDO-Ketten mit
zwei OH endgruppen enthielt. Die MALDI-TOF-Spektren des zweiten Peaks wiesen
drei unterschiedliche Serien auf. Die Massen dieser Serien waren in Einklang mit der
Annahme zyklischer PPDOs sowie Ketten mit je einer Carboxyl- und einer OH- bzw.
einer Li-Carboxylat- und einer OH endgruppe.
Um Informationen zur chemischen Heterogenität der MBC-Proben zu erhalten,
wurde eine Gradientenmethode entwickelt. Diese erlaubt die Trennung von PPDO-
Diolen und PPDO-Multiblockpolymeren (MBP) von PCL-Diolen und PCL-MBP. MBP
sind dabei definiert als Polymere die durch die Verknüpfung von entweder PCL- oder
PPDO-Diolen mit Diisocyanaten enthalten werden. Die Anwendung des entwickelten
Gradientenverfahrens auf die MBC-Proben ergab jeweils zwei gut getrennte Peaks.
Der erste der Peak eluierte dabei im SEC-Modus, vor Beginn des Gradienten im
Elutionsbereich von PPDO-Diolen und PPDO-MBP. Da der bei Gradientenstart
verwendete Eluent eine Adsorption der PCL-Einheiten bewirkt, lässt sich aus den
Retentionszeiten des ersten Peaks auf das Vorliegen rein PPDO-haltiger Strukturen
schließen. Der zweite Peak zeigte ähnlichen Retentionszeiten wie die PCL-Diole und
die PCL-MBP. In der Gradientenchromatograpie werden die Retentionszeiten von
Blockcopolymeren im Wesentlichen durch die chemische Struktur des adsorbierten
Blockes bestimmt. Daher eluieren Homopolymere mit der gleichen chemischen
Struktur wie der adsorbierende Block eines Blockcopolymeren bei ähnlichen
Retentionsvolumen, wie das Blockcopolymer. Somit kann aus den Retentionszeiten
der Gradientenchromatographie gefolgert werden, dass der zweite Peak PCL-
Einheiten aufweist. Somit kann er aus PCL-Diolen, PCL-MBP oder MBC resultieren.
PhD Thesis
Habib-Patrick-Richard-Yoba-N’goma
3
Zur Klärung der Frage, ob der zweite Peak der Gradientenchromatographie echte
Copolymerstrukturen enthält oder nur aus PCL aufgebauten Strukturen (Diole und
MBP) wurde die Flüssigkeitschromatographie unter den kritischen Bedingungen der
Adsorption (LCCC) angewandt. Auf einer Umkehrphase wurden zunächst die
kritischen Bedingungen für PCL ermittelt (76% Acetonitril (ACN), 24% Dichlormethan
(DCM)). Unter diesen Bedingungen erwartet man für Strukturen, die PPDO enthalten
eine Elution vor dem Totvolumen der Säule, während für nur PCL-haltige Ketten eine
Elution am Totvolumen der Säule erwartet wird. Die Messung der MBC-Proben unter
den genannten Bedingungen ergab zwei Peaks für alle Proben. Basierend auf den
Retentionszeiten kann für den ersten Peak vermutet werden, dass er durch PPDO-
haltige Strukturen (Diole, PPDO-MBP, MBC) hervorgerufen wird. Der zweite Peak
eluierte am Totvolumen der Säule, ebenso wir PCL-Diole und PCL-MBP. Daher kann
dieser Peak “reinen” PCLs und/oder PCL-MBP zugeordnet werden.
Anhand der chromatographischen Untersuchungen kann somit gefolgert werden,
dass die MBC-Proben sowohl signifikante Anteile an nur PPDO-haltigen
(Gradientenchromatographie) als auch nur PCL-haltigen (LCCC) Strukturen
aufweisen. Es ist jedoch anhand der chromatographischen Ergebnisse nicht möglich,
die Existenz von MBC auszuschließen, da diese in beiden chromatographischen
Experimenten mit MBP oder Diolen coeluieren sollten.
Um die gemachten Zuordnungen weiter zu verifizieren und um herauszufinden, ob
auch MBC-Strukturen vorliegen, wurden die Peaks der Gradientenchromatographie
off-line mittels Fourier Transform Infrarot-Spektroskopie (FTIR) untersucht. Dabei
zeigte das FTIR-Spektrum des ersten Peaks die charakteristisch Absorptionsbanden
von PPDO, während die für PCL charakteristischen Absorptionen nicht auftraten.
Dies belegt das Vorliegen von rein PPDO-haltigen Strukturen. Das FTIR-Spektrum
des zweiten Peaks hingegen zeigte die charakteristischen Banden von PCL, ohne
hedoch die charakteristischen Banden des PPDO aufzuweisen. Dies lässt vermuten,
dass die zweite Fraktion in der Gradientenchromatographie nahezu vollständig aus
PCL-Einheiten besteht. Diese Ergebnisse bestätigen somit die anhand der
Retentionszeiten gemachten Zuordnungen. Weiterhin belegen die FTIR-Ergebnisse,
PhD Thesis
Habib-Patrick-Richard-Yoba-N’goma
4
dass die MBC-Proben sich aus reinen PPDO-haltigen- bzw. reinen PCL-haltigen
Ketten zusammensetzen, ohne dass PPDO und PCL als MBC in der gleichen Kette
vorliegen. Es scheint sich somit um Mischungen aus PPDO-MBP und PCL-MBP zu
handeln.
Diese sehr unerwarteten Resultate sollten durch weitere Untersuchungen
abgesichert werden. Daher wurde die Pyrolyse mit gekoppelter
Gaschromatographie/Massenspektrometrie (Py-GC-MS) als alternative Methode zur
FTIR eingesetzt. Die Gradientenchromatographie wurde verwendet, um die beiden
Peaks in zwei Fraktionen zu trennen. Diese Fraktionen wurden anschließend mittels
PY-GC-MS untersucht. Die quantitativen Untersuchungen zeigten, dass die erste
Fraktion der MBC, die dem ersten Peak der Gradientenchromatographie entspricht,
zu mehr als 80 % aus PPDO besteht, wogegen in der zweiten Fraktion nur bis zu
10 % PPDO gefunden wurde.
Die Ergebnisse der FTIR- und der Py-GC-MS sind qualitativ in guter
Übereinstimmung, belegen Sie doch, dass die beiden Peaks sich in ihren
Zusammensetzungen deutlich unterscheiden. In den quantitativen Ergebnissen
hingegen unterscheiden sie sich, da die FTIR-Spektroskopie jeweils nur eine
Polyesterkomponente pro Peak identifizieren konnte, während die Py-GC-MS die in
jedem chromatographischen Peak jeweils beide andere Polyesterkomponenten,
wenn auch mit sehr unterschiedlichen Anteilen nachweisen konnte.
Weitere Charakterisierungen der beiden Fraktionen der MBC wurden mittels 1H-
NMR-Spektrsokopie (1H-NMR) durchgeführt. Die quantitative Auswertung der
Spektren für die Fraktionen zeigte, dass die erste Fraktion mehr als 80% PPDO
enthält, die zweite hingegen nur etwa 20%. Diese Ergebnisse sind daher in guter
Übereinstimmung mit denen der Py-GC-MS.
Aus den durchgeführten Untersuchungen konnte somit geschlossen werden, dass
die untersuchten MBC bezüglich ihrer chemischen Zusammensetzung unerwartet
heterogen sind. Diese Ergebnisse waren sehr wertvoll, da sie erlaubten die
Synthesebedingungen so zu verändern, dass Proben mit erheblich geringerer
chemischer Heterogenität resultierten.
PhD Thesis
Habib-Patrick-Richard-Yoba-N’goma
5
1. Introduction
Shape memory materials (SMMs) are materials, including shape memory alloys
(SMAs), ceramics and polymers (SMPs) which are termed intelligent or adaptive
materials. Shape memory materials have been used for some time in the past and a
variety of engineering and biomedical applications are based on shape memory
alloys and ceramics already today [1-3,30,35]. In comparison to these materials
shape memory polymers, which have been developed in the last decade, are lagging
behind despite their many novel advantageous properties, e.g. maximum recoverable
strain up to 400% [4-5,30], very high shape recoverability, low density, low cost, easy
shape programming, easy control of recovery temperature and the possibility to
adjust color. In contrast to other shape memory materials, the shape memory effect
of shape memory polymers can be triggered by various external stimuli, other than
heat, such as light or pH change. This allows for innovative usage in new fields of
application. Due to the different stimuli that can be used to trigger the shape memory
effect, SMPs are categorized into three types, namely, thermal-responsive SMPs,
photo-responsive SMPs and chemo-responsive SMPs [1,6,30]. Among them, the
thermo-responsive SMPs have been the major focus of investigation in the past
years and some products utilizing their properties are commercially available at
present.
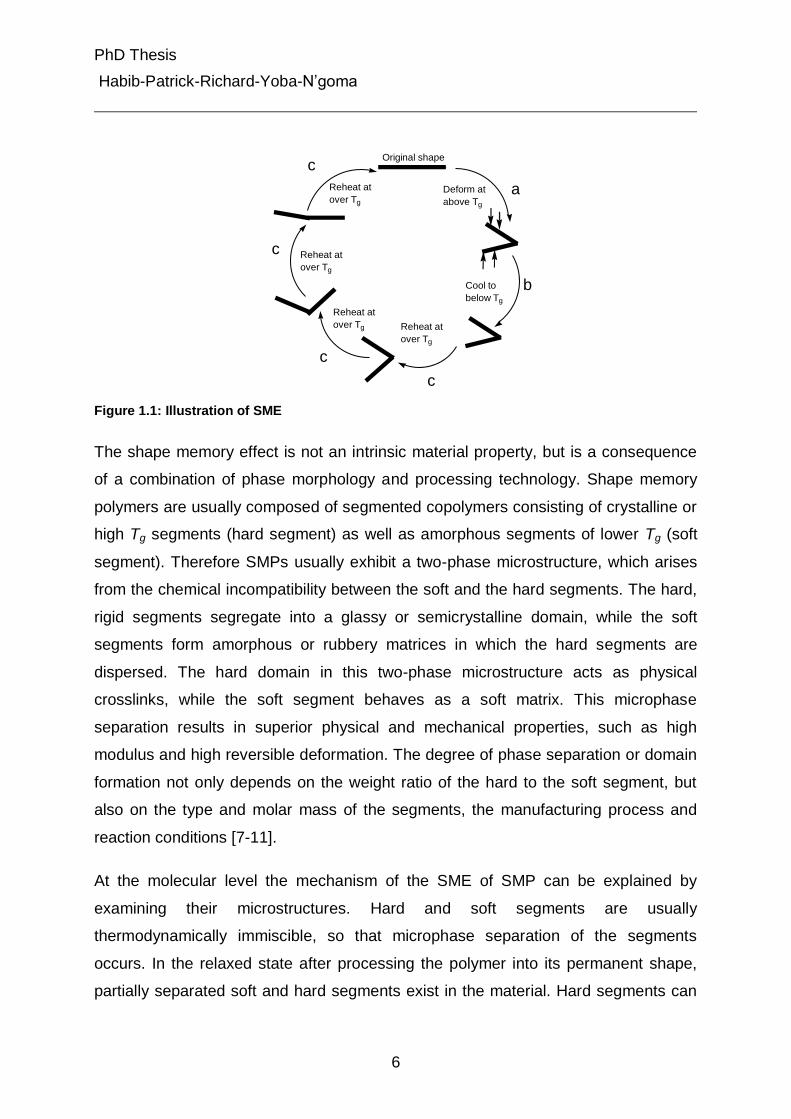
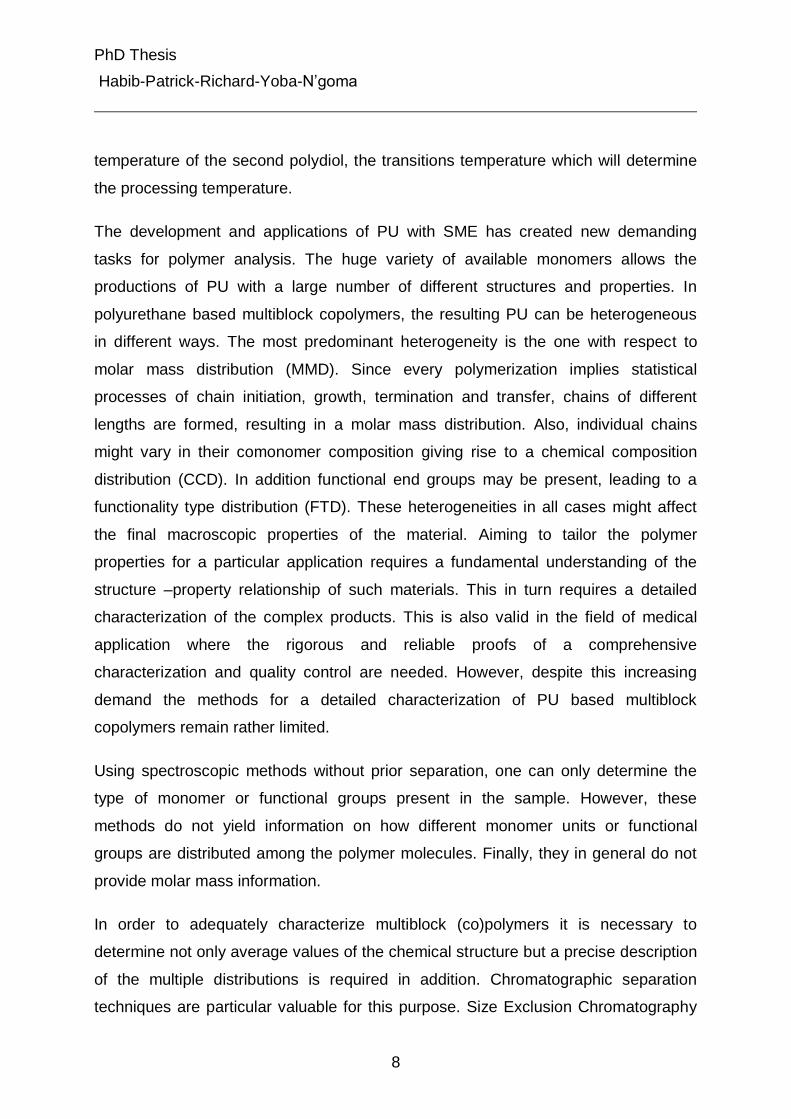
The actual shape memory effect (SME) consists of a thermo-mechanical cycle and is
schematically illustrated in Fig. 1.1[91]. The raw material is simply processed into a
pre-determined shape (the original or permanent shape) by molding, heating, casting
or coating. In the next step the SMP is deformed into its temporary shape at an
elevated temperature (programming temperature). The load is maintained during
cooling to maintain the temporary shape (a). After cooling the removal of the load
results in a very small elastic shape recovery, but the deformed shape is largely
maintained (b). The deformed shape is stable until shape recovery triggered by an
external stimulus (e.g. heating). Upon activation by reheating the SMPs to or above
the programming temperature, the material adopts its original or permanent form
without any additional mechanical action (c). This SME cycle is repeatable.
PhD Thesis
Habib-Patrick-Richard-Yoba-N’goma
6
Cool to
below Tg
Original shape
Deform at
above Tg
Reheat at
over Tg
Reheat at
over Tg
Reheat at
over Tg
Reheat at
over Tg
Figure 1.1: Illustration of SME
The shape memory effect is not an intrinsic material property, but is a consequence
of a combination of phase morphology and processing technology. Shape memory
polymers are usually composed of segmented copolymers consisting of crystalline or
high Tg segments (hard segment) as well as amorphous segments of lower Tg (soft
segment). Therefore SMPs usually exhibit a two-phase microstructure, which arises
from the chemical incompatibility between the soft and the hard segments. The hard,
rigid segments segregate into a glassy or semicrystalline domain, while the soft
segments form amorphous or rubbery matrices in which the hard segments are
dispersed. The hard domain in this two-phase microstructure acts as physical
crosslinks, while the soft segment behaves as a soft matrix. This microphase
separation results in superior physical and mechanical properties, such as high
modulus and high reversible deformation. The degree of phase separation or domain
formation not only depends on the weight ratio of the hard to the soft segment, but
also on the type and molar mass of the segments, the manufacturing process and
reaction conditions [7-11].
At the molecular level the mechanism of the SME of SMP can be explained by
examining their microstructures. Hard and soft segments are usually
thermodynamically immiscible, so that microphase separation of the segments
occurs. In the relaxed state after processing the polymer into its permanent shape,
partially separated soft and hard segments exist in the material. Hard segments can
b
a
c
c
c
c
PhD Thesis
Habib-Patrick-Richard-Yoba-N’goma
7
form physical cross-links between themselves through hydrogen bonding and
crystallization, making the material solid at below the melting or glass transition
temperature of the hard segments. These hard segments are fixed for shape
recovery. The soft segments can absorb most of the external stress applied on the
polymers. The soft segments exist coiled in their unperturbed dimensions. At a
temperature below Tg, micro-Brownian motion is almost negligible and the soft
segment cannot gain enough kinetic energy to achieve the mobility. Thus, SMP are
more difficult to deform in the glass state. Upon heating over Tg, however, micro-
Brownian motion in soft segments is activated, and enough kinetic energy can be
obtained to overcome the restriction for large-scale motion in the segments. Hence,
above Tg SMP transit from the glassy state to the rubbery state can be easy
deformed into its temporary shape. Thereby the soft and hard segments reorient
themselves in the direction of external force, and the coiled soft segments are
stretched causing an unfavorable chain conformation. By cooling SMPs below Tg
while maintaining the load the micro-Brownian motion in soft segments is frozen.
Thus, the elongated chains of the soft segments become fixed so that the
deformation is maintained even after removal of the constraints. However, upon re-
heating above Tg micro-Brownian motion is triggered for action again. Soft segments
achieve the mobility to return to its original coiled conformation. The hard segments
from the physical cross links by way of polar interaction hydrogen bonding, with such
cross-links being able to withstand moderately high temperature without being
destroyed. This results in the recovery of the original shape of SMPs.
The structural demands to be fulfilled by shape memory can be realized by
polyurethanes. The synthesis of polyurethanes usually involves diols and
diisocyanates. For the synthesis of PUs used as SMP two different polydiols can be
linked together by a diisocyanate resulting in the desired multiblock structure. The
large number of available diols and diisocyanates allows adjusting the properties of
polyurethanes in numerous ways according to a specific demand. E.g. the use of
specific polyols allows adjusting the transition temperatures in such a way that the
SME is triggered at a desired temperature sufficiently below the transition
PhD Thesis
Habib-Patrick-Richard-Yoba-N’goma
8
temperature of the second polydiol, the transitions temperature which will determine
the processing temperature.
The development and applications of PU with SME has created new demanding
tasks for polymer analysis. The huge variety of available monomers allows the
productions of PU with a large number of different structures and properties. In
polyurethane based multiblock copolymers, the resulting PU can be heterogeneous
in different ways. The most predominant heterogeneity is the one with respect to
molar mass distribution (MMD). Since every polymerization implies statistical
processes of chain initiation, growth, termination and transfer, chains of different
lengths are formed, resulting in a molar mass distribution. Also, individual chains
might vary in their comonomer composition giving rise to a chemical composition
distribution (CCD). In addition functional end groups may be present, leading to a
functionality type distribution (FTD). These heterogeneities in all cases might affect
the final macroscopic properties of the material. Aiming to tailor the polymer
properties for a particular application requires a fundamental understanding of the
structure –property relationship of such materials. This in turn requires a detailed
characterization of the complex products. This is also valid in the field of medical
application where the rigorous and reliable proofs of a comprehensive
characterization and quality control are needed. However, despite this increasing
demand the methods for a detailed characterization of PU based multiblock
copolymers remain rather limited.
Using spectroscopic methods without prior separation, one can only determine the
type of monomer or functional groups present in the sample. However, these
methods do not yield information on how different monomer units or functional
groups are distributed among the polymer molecules. Finally, they in general do not
provide molar mass information.
In order to adequately characterize multiblock (co)polymers it is necessary to
determine not only average values of the chemical structure but a precise description
of the multiple distributions is required in addition. Chromatographic separation
techniques are particular valuable for this purpose. Size Exclusion Chromatography
PhD Thesis
Habib-Patrick-Richard-Yoba-N’goma
9
(SEC) is the established method for analyzing polymer molar mass distribution as
macromolecules are separates according to the hydrodynamic size in solution. Other
suitable chromatographic techniques can be used to analyze the chemical
composition distribution or the functionality type distribution of complex polymers.
However, such separations techniques are often not readily available and need to be
developed for a particular polymer system.
PhD Thesis
Habib-Patrick-Richard-Yoba-N’goma
10
2. The Objectives of the Thesis
For the reasons stated above, the proposed project focuses on the development of
new chromatographic characterization methods for the detailed qualitative and
quantitative characterization of shape memory polymers. The polymers under
investigation are polyurethanes composed of poly (p-dioxanone) (PPDO) and poly (ε-
caprolactone) (PCL) segments.
The samples were produced by reacting mixtures of PCL- and PPDO-diols with a
diisocyanate. This copolymerization process is expected to produce multiblock
copolymers (MBC) with shape memory properties. However, the synthetic strategy
might result in complex polymers, heterogeneous in both, molar mass and chemical
composition. The distribution of the sample components might influence the SMP
and thus needs to be characterized adequately. However, since no suitable methods
existed, specific chromatographic techniques should be developed within this PhD
thesis. The separation methods should allow for comprehensive characterization of
complex polymer mixtures. As a first step a separation according to chemical
composition was aimed for. Having established separation conditions the
characterization of the fractions should be performed by applying different analytic
techniques.
PhD Thesis
Habib-Patrick-Richard-Yoba-N’goma
11
3. Theoretical Background
3.1 Molecular characterization of polymers
The simultaneous reaction of two different polyols and diisocyanate might result in
multiblock copolymers formation. However, due to the statistical processes inherent
in any polymerization process the products might be heterogeneous in both molar
mass and chemical composition. It can be foreseen that only one analytical
technique will not be sufficient to comprehensively characterize such complex
products. Thus, combinations of several methods will be necessary [14]. The
average values on chemical composition, end groups or molar masses can be
obtained by spectroscopic and spectrometric methods. However, as spectroscopic
and spectrometric methods will yield only average values but no information on the
underlying distribution functions, the application of separation methods is required for
a detailed characterization of the products. Separation techniques are useful to
fractionate the samples by a certain characteristic feature and to obtain a distribution
profile for this feature. On the other hand chromatographic methods as such separate
but give no information on the structure of the separated species. It is beneficial to
hyphenate separation methods with other spectroscopic or spectrometric methods.
This allows obtaining qualitative and quantitative information e.g. on the chemical
composition of the chromatographic fractions [15]. This results in highly detailed
information on the chemical composition distribution of the sample. Also coupling two
different chromatographic methods will allow resolving coeluting species, allowing
determining e.g. correlations of chemical composition and molar mass of the
macromolacular species.
3.1.1 Liquid Chromatographic Separation of Polymers
In order to separate polymers with respect to a specific structural feature, suitable
chromatographic methods have to be developed. The method developments which
have been conducted within this thesis were particularly focused on liquid
chromatography. In the following section, a description of the principles of liquid
PhD Thesis
Habib-Patrick-Richard-Yoba-N’goma
12
chromatography will be given with a special attention to the peculiarities of the
technique when applied to polymer analysis.
3.1.2 Definition of liquid chromatography
Liquid chromatography is an analytical separation technique. The definition of the
general term chromatography formulated by the International Union of Pure and
Applied Chemistry (IUPAC) is as follows:” Chromatography is a physical method of
separation in which the components to be separated are distributed between two
phases, one of which is stationary (stationary phase) while the other (the mobile
phase) moves in a definite direction” [16].The IUPAC definition of the more specific
term liquid chromatography is as follows: “A separation technique in which the
mobile phase is a liquid. Liquid chromatography can either be carried out in a
column or in a plane” [16]. Liquid chromatography can be divided, according to the
mobile phase composition, in two groups of applications: isocratic analysis and
gradient analysis. During isocratic elution, the eluent composition remains constant
throughout the chromatographic experiment. In gradient elution, the eluent
composition (and therefore eluent strength) is changed during the chromatographic
run.
3.1.3 Separation modes in the chromatography of polymers
Chromatographic separations are processes where different analytes spend different
times on their way through a chromatographic column. The different residence or
retention times of different analytes are caused by the differences in the distribution
equilibria of the solutes between the stationary phase and the mobile phase [31]. The
well-known distribution coefficient dK is the ratio of the concentrations of the analyte
in the stationary phase to that in the mobile phase (i.e. msd CCK ). It is related,
thermodynamically, to the free energy difference, G of the molecules in the two
phases (mobile and stationary) [60]. The difference in free energy comprises
enthalpic and entropic contributions [17]. The separation process in liquid
chromatography can be described by:
PhD Thesis
Habib-Patrick-Richard-Yoba-N’goma
13
dKRTSTHG ln 3.1
RT
STH
RT
GKd
ln 3.2
where, R is the gas constant, T the absolute temperature, H and S are the
differences in enthalpy and entropy of the molecule in the stationary and the mobile
phase, respectively.
When analyzing small molecules the enthalpic contributions are most of the time
larger than the entropic contribution which is defined by the change in entropy due to
the transfer of the analyte from the diluted mobile phase into the stationary phase
where the analyte has a higher concentration. However, for macromolecules, the
entropic contributions are more important as macromolecules are susceptible to
adopt a large number of conformations. The conformation modification can be found
in solution as the macromolecule enters the stationary phase pore (confinement of
the macromolecules). The variation of entropy is a function of the volume of the
polymer in solution and of the pore size distribution. Due to the large size of the
macromolecules, they cannot penetrate the complete pore volume. Entering the pore
from the free mobile phase causes a loss of entropy. Certain conformations of the
polymer molecules simply do not fit into the pore [61].
.
Taking into account what has been mentioned above, this brief summary of possible
thermodynamic contributions which are susceptible to occur when analyzing
polymers, it is possible to define three kinds of chromatographic modes for polymer
separation:
Exclusion chromatography, where macromolecules are excluded from the
pores of the packing material and thus are separated according to their size in
solution (hydrodynamic volume): 10 dK . Thus, molecules with the largest
volume in solution are eluted first and elution occurs in order of decreasing
hydrodynamic volume. This mode of separation is only directed by entropic
contributions.
PhD Thesis
Habib-Patrick-Richard-Yoba-N’goma
14
Adsorption chromatography, where chromatographic conditions are designed
such that the polymer interacts with the stationary phase: 1dK . Since the
molar mass increase with number of repeating units, macromolecules will be
absorbed the stronger the higher its molar mass. Therefore the elution volume
will increase with the molar mass of the macromolecules. This mode of
separation is directed by enthalpic interactions.
Critical condition chromatography, where enthalpic and entropic interactions
compensate each other. Polymer chains are neither excluded from nor
attracted by the stationary phase. Thus their elution volume is equal to the
system hold-up volume: 1dK .
In addition to these three kinds of chromatographic modes, gradient chromatography
is usually used for separation of polymers of very different adsorption strengths.
The use of each chromatographic mode depends on types of separation and
information that has to be achieved. In the following more detailed characteristics of
each chromatographic mode will be given.
3.1.3.1 Size exclusion chromatography
Molecular size or more precisely, hydrodynamic volume governs the separation
process of sizes exclusion chromatography (SEC) [62-63]. That is as a mixture of
solutes of different size passes through a column packed with porous particles, the
molecules that are too large to penetrate the pores of the packing elute first
because they have less access to the pore volume, and smaller molecules capable
to penetrate or diffuse into the pores, elute at a later time or elution while volume.
The large molecules that cannot penetrate the pores of the packing elute at the
interstitial or void volume iV of the column. The interstitial volume is the volume of
the mobile phase that is located between the packing particles. As the molecular
size of the molecules becomes smaller and begins to approach the average pore
size of the packing, the molecules will penetrate or partition into the pores of the
PhD Thesis
Habib-Patrick-Richard-Yoba-N’goma
15
packing at all and elute at a longer retention time. Finally, when the molecular size
of the solute is small relative to the pore size, the molecules will freely diffuse into
the pores sampling the total pore volume, PV , of the packing. The elution volume of
small solutes will be equal to the total mobile phase volume tV of the packed SEC
column
pit VVV 3.3
The dependence of retention volume on distribution coefficient in SEC can be
described the general chromatographic equation
PdiR VKVV 3.4
where RV is the retention volume or the elution volume of a solute and dK is the
SEC distribution coefficient.
In ideal SEC only exclusion from the pores of the packing material takes place,
while no additional enthalpic contributions exist ( 0H ). By considering the
general thermodynamic equation 3.2, the distribution coefficient in ideal SEC can
therefore be expressed as
dK = )/exp( RSKSEC 3.5
Due to the confined space of the pore the macromolecules cannot adopt all possible
conformations. Therefore the conformational entropy S decreases upon entering
the pore from the free solution. Thus, S takes negatives values and SECK has
defined limits of 10 SECK , i.e. the macromolecules elute before the total volume
of the column.
In SEC the accessible volume for a macromolecule decreases with its increasing
size, resulting in a decreasing elution volume with molar mass. After suitable
calibration which is usually done by running several samples having narrow molar
PhD Thesis
Habib-Patrick-Richard-Yoba-N’goma
16
mass distribution and known molar mass (for example polystyrene) , the molar mass
distribution and the molar mass averages of a polymer sample can be determined.
3.1.3.2 Liquid adsorption chromatography
Liquid adsorption chromatography (LAC) is frequently utilized for separation of small
molecules. In contrast to low molar mass analytes, polymers have a large number of
adsorbable groups. These are all identical in the case of homopolymers but differ for
copolymers. The number of the adsorbable groups increases with molar mass of a
homopolymer. Therefore the total interaction energy and thus the distribution
coefficient in adsorption chromatography increases also with the number of adsorbed
monomer units. As a consequence, homopolymers elute at large elution volumes
than the solvent band even if the interaction of a single repeating unit with stationary
phase is weak. This behaviour can be described by the simultaneous adsorption of
more than one repeating unit which is known as multisite attachment mechanism [18,
47,58-59]. The adsorption phenomenon implies a decrease of the enthalpic energy
when adsorbing to the stationary phase. Thus, H has a negative value
and 1)/exp( RTHKLAC . Therefore, if the interaction between the
macromolecules and stationary phase is sufficiently strong, retention of the
macromolecules will occur and the molecules will elute later than the solvent band.
The polymer spends more time adsorbed on the stationary phase than the mobile
phase.
The retention behaviour of a high molar mass polydisperse sample in LAC is
different from a low molar mass monodisperse samples. Samples which consist of
species differing substantially in molar mass or chemical composition cannot be
separated isocratically because the different species would exhibit very different
interaction strengths and therefore elution volumes. The higher molar mass
polymers are strongly retained due to multiple attachments. The desorption of a
strongly adsorbed macromolecules therefore requires displacement by a stronger
eluent which in turn would reduce the retention of the lower molar masses.
Therefore gradient methods are often applied, which will be described below. Since
retention in LAC is strongly influenced by molar mass, minor differences in the
PhD Thesis
Habib-Patrick-Richard-Yoba-N’goma
17
chemical structure as end groups or differences in topology might be hidden by the
peak broadening due to the molar mass dependence. In order to achieve
separations by end groups or other small structural differences one has to choose
the conditions which allow a molar mass independent chromatographic elution.
3.1.3.3 Liquid chromatography at critical conditions (LC-CC)
As mentioned above in the size-exclusion mode the higher molar mass polymers are
excluded from the pores and will therefore elute before the lower molar mass
molecules. However, when the separation conditions favour adsorption, the retention
order is inversed. The transition between these two chromatographic modes is
observed under special conditions which are known as critical conditions. Under
these conditions the molar mass dependence of retention time vanishes. The eluent
composition at which this happens is called “critical composition”. Chromatography
performed under such conditions is referred to as chromatography at critical
conditions of adsorption (LCCC) [17]. At critical conditions the entropic losses due to
the exclusion of the molecules from the pores of the stationary phase are exactly
compensated by the enthalpic gains due to interaction of molecules with the
stationary phase hence HST [64-65]. Accordingly, 0G and the distribution
coefficient is 1dK , irrespective of the molar mass of the polymer molecules [66-72].
Under these conditions, which are sensitive to small changes of temperature or
mobile phase composition, macromolecules of a given chemical structure elute at the
same elution volume, irrespective of their molar mass, as depicted in Fig. 3.1 [73].
The critical conditions are experimentally determined by examining the molar mass
dependence of retention times of the respective homopolymer at different isocratic
eluent compositions. The critical conditions are identified as the eluent composition at
which the retention of homopolymer becomes independent of its molar mass. Since
at critical conditions the elution volume of an end-functionalized homopolymer is not
affected by the molar mass of the polymer chain, LCCC can be used to separate
homopolymers having different end groups provides these end groups differ in their
adsorption strenghts. Consequently, a functional type distribution (FTD) of polymers
can be obtained [19-20,74-82]. Also block copolymers or graft copolymer can be
PhD Thesis
Habib-Patrick-Richard-Yoba-N’goma
18
characterized by LCCC [21-23, 48-49,83-90]. If critical conditions are realized for the
polymer forming one block, this block will not contribute to the retention of the block
copolymer any longer. Therefore the retention will be determined by the other block
only. The homopolymer forming that block might thereby elute either in SEC or in
LAC elution order [83]. If a calibration is made with the respective homopolymer, the
molar mass distribution of a single block in a block copolymer can be determined. A
review has been written detailing the principles of the technique and summarizing
critical conditions for a large variety of polymers [24]. The determination of the critical
conditions of elution for a polymer is frequently a time consuming experimental
process. Indeed critical conditions are very sensitive and slight deviations of the
mobile phase from the critical composition can change the retention mode to SEC or
LAC.
3.1.3.4 Gradient liquid chromatography
Since isocratic elution at adsorbing conditions has its difficulties when polymers of
very different adsorption strengths need to be separated, gradient chromatography is
used frequently in polymer chromatography. In gradient chromatography the eluent
strength is varied systematically during the chromatographic experiment. This is
usually done by changing the eluent composition. The mechanism of gradient elution
in polymer chromatography remains still more difficult to understand as compared to
that of isocratic chromatography. From a thermodynamic point of view, both enthalpic
and entropic effects are operative in polymer gradient elution. However, like in LAC,
the enthalpic effects are more dominant ( HST ). At the start of gradient, the
polymer molecules are adsorbed strongly in the weak initial eluent composition, i.e.
1dK . Polymer molecules of high molar mass are more strongly adsorbed than
those of lower molar mass. By increasing the eluent strength desorption occurs ( dK
decreases) with weakly adsorbed molecules desorbing first. Therefore, lower molar
mass molecules elute earlier than those of higher molar masses. At sufficiently high
molar masses, a nearly molar mass independent elution is observed. Retention
processes have been discussed by Snyder and others and tests have been
suggested to identify the actual operative mechanism [32-33].
PhD Thesis
Habib-Patrick-Richard-Yoba-N’goma
19
The macromolecules start eluting when the composition of the mobile phase
becomes close to their critical conditions: 0G . This corresponds to the point
where adsorptive interactions are dramatically reduced by the proportion of eluting
solvent in the mobile phase and they reach the same order of magnitude than
entropic contributions. As these desorbing conditions differ according to the chemical
composition of the chains (the nature of the repeat unit is responsible for the
interaction strength), a chemical composition distribution is determined: similar
fractions of macromolecules will elute from the column together independent of the
molar mass with a mobile phase composition close to their critical conditions
[34,27,42,43]. Since the critical composition strongly depends on the chemical nature
of the polymer molecule a separation according to chemical composition can be
achieved. Therefore gradient chromatography is often applied for separation of
polymers blends or copolymers according to chemical composition [36-41].
The kinetics of the dissolution of the polymer in the eluent may then further
complicate the mechanism of gradient elution. At this stage, it is generally accepted
that the mechanisms of gradient elution of high molar mass polymers will depend on
the sample, the concentration of sample injected onto the column, on the choice of
mobile phase and on the strength of the interaction between the sample and the
stationary phase.
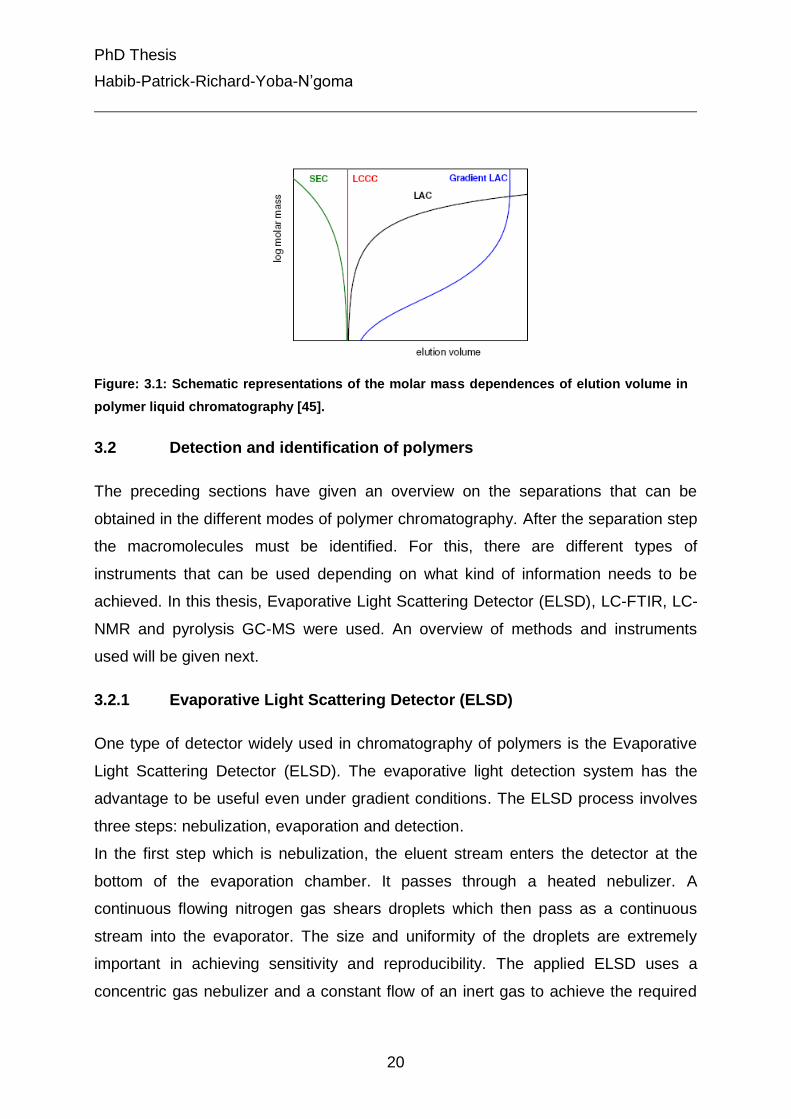
Usually the three modes of chromatography are represented on the same diagram
showing the effect of the molar mass on the elution volume. Gradient liquid
chromatography can also be figured on this plot as showed in Fig. 3.1.
PhD Thesis
Habib-Patrick-Richard-Yoba-N’goma
20
Figure: 3.1: Schematic representations of the molar mass dependences of elution volume in
polymer liquid chromatography [45].
3.2 Detection and identification of polymers
The preceding sections have given an overview on the separations that can be
obtained in the different modes of polymer chromatography. After the separation step
the macromolecules must be identified. For this, there are different types of
instruments that can be used depending on what kind of information needs to be
achieved. In this thesis, Evaporative Light Scattering Detector (ELSD), LC-FTIR, LC-
NMR and pyrolysis GC-MS were used. An overview of methods and instruments
used will be given next.
3.2.1 Evaporative Light Scattering Detector (ELSD)
One type of detector widely used in chromatography of polymers is the Evaporative
Light Scattering Detector (ELSD). The evaporative light detection system has the
advantage to be useful even under gradient conditions. The ELSD process involves
three steps: nebulization, evaporation and detection.
In the first step which is nebulization, the eluent stream enters the detector at the
bottom of the evaporation chamber. It passes through a heated nebulizer. A
continuous flowing nitrogen gas shears droplets which then pass as a continuous
stream into the evaporator. The size and uniformity of the droplets are extremely
important in achieving sensitivity and reproducibility. The applied ELSD uses a
concentric gas nebulizer and a constant flow of an inert gas to achieve the required
PhD Thesis
Habib-Patrick-Richard-Yoba-N’goma
21
consistency. After the nebulization, the next step is the evaporation during which the
spray moves through the heated evaporation tube assisted by the carrier gas. In the
evaporation tube the solvent is volatilized to produce particles or droplets of the pure
non-volatile analyte. The tube provides evaporation of solvents at low temperatures
to minimize evaporation of the analyte. The last step refers to the detection. The
particles emerging from the evaporation tube enter the optical cell, where the analyte
particles pass through a beam of light where the light is scattered at the particle. The
amount of light detected is proportional to the solute concentration and solute particle
size distribution.
The ELSD is relatively easy to set up and can be used even in gradient
chromatography. However the response depends on a variety of parameters which
influence the formation of the particles. Analyte concentration in the mobile phase
when it reaches the detector is definitely the most important factor for ELSD [46]. But
it has to be taken into account that a high sample concentration is susceptible to
favor formation of larger particles hence giving a more intensive response. Other
influencing factors are the mobile phase composition and flow rate which both
change the quality of the evaporation. As the detection process might be affected by
the size of the droplets of the liquid, the rate of evaporation and the nebulizer gas
flow, then it is important to maintain steady conditions both internal and external to
during the all experimental.
3.2.2 Fourier Transform Infrared (FTIR) Spectroscopy
Fourier transform infrared spectroscopy is an excellent tool for characterizing
polymers. It yields information on the overall chemical composition and the presence
or absence of specific functional groups in the polymer molecules. FTIR has the
advantages of speed and sensitivity. It can be applied as an on-line technique after
separation by LC with a specific flow-cell. However, solvent adsorption remains the
main limitation when using a flow cell. This is because the major parts of the
spectrum might be completely obscured by solvent absorbances. This drawback can
be overcome by using a special interface, (LC-Transform) to remove the solvent
before acquiring the FTIR-spectra of the fractions. Therefore this setup requires two
PhD Thesis
Habib-Patrick-Richard-Yoba-N’goma
22
steps: first deposition and then analysis of the spectra. The most important element
of the interface is a heated nozzle positioned above a moving Ge-plate. The eluent is
heated upon flowing through the nozzle. At the same time the back pressure of the
nozzle decreases towards the end of the nozzle resulting in solvent evaporation at
the nozzle end. Non-volatile substrates will not evaporate but deposit on the Ge-
plate. Due to the Ge-plate motion, sample fractions corresponding to different
chromatographic elution times will be deposited at different positions on the Ge-plate.
For polymers, which usually are not separated into separated peaks, usually a film
like deposition is observed. After ending the chromatographic experiment the Ge-
plate is transferred and placed in a special optical device within the FTIR
spectrometer for the analysis of deposited fractions. FTIR spectra are taken at
regular intervals along the polymer film. The lower surface of the Ge-plate is coated
with aluminum, rendering it reflective. Therefore infrared energy is directed from the
FTIR source onto the sample deposit. The FTIR beam passes through the deposit
and the Germanium to the reflective surface. The laser beam is reflected from this
surface back through the sample, and then to the FTIR detector. The result is a dual-
pass transmission measurement of the sample. Afterwards, the spectra are analyzed
by means of specific software and then interpreted in order to identify the structure of
the compounds of interest. Albrecht et al. used this technique to determine the
chemical composition distribution of copolymer species [15].
3.2.3 Nuclear Magnetic Resonance (NMR)
Another useful technique for quantification of polymers is NMR. It is one of the most
informative methods for structural characterization of polymers. NMR provides
much more and detailed information on the polymer. Similar to FTIR, NMR as a
stand alone technique provides only average information on the sample. In order to
study complex polymers hyphenation of liquid chromatography and NMR is a useful
approach. Hyphenation of liquid chromatography and NMR can be done off- or on-
line. When carrying out off-line experiments, contamination and decomposition of
the sample might happen and might affect the final results. Therefore, the
application of on-line LC-NMR is superior. However, two problems exist in coupling
PhD Thesis
Habib-Patrick-Richard-Yoba-N’goma
23
NMR to chromatography. On-line LC-NMR experiments require the use of solvent
suppression techniques because the solvent suppression allows recording a weak
signal of the solute in the background of dominating solvent peak. This technique is
well suited for isocratic LC separations (e.g. SEC separations) but remains difficult
to implement for gradient chromatography. The major problem with on-line NMR is
the lack of sensitivity of NMR spectrometry in conjunction with the low sample
concentration used in liquid chromatography, which limits the use of this coupling
technique. This is the major reason why on-line proton LC-NMR is generally the tool
of choice as compared to 13C-NMR. Compared to off-line LC-NMR, on-line LC–
NMR will probably give accurate information on the chemical composition and
structure elucidation because it permits the direct analysis of the chemical
composition at each elution volume of the chromatogram. Hiller et al. showed by
coupling a LCCC separation with 1H-NMR that it is possible to determine in one
experiment the molar mass distribution and chemical composition of the copolymers
[26].
3.2.4 Pyrolysis GC-MS
Pyrolysis GC-MS has been used extensively as an analytical technique in which
large molecules are degraded into smaller volatile species using only thermal energy.
Pyrolysis, combined with modern analytical methods, such as gas chromatography
and mass spectrometry (Py-GC-MS) is a very useful technique for analysis of
polymeric materials.
Py-GC-MS needs less than 100 µg of the original material to be analysed directly.
Pyrolysis involves a thermal dissociation of materials in an inert atmosphere (in
presence of He). Large molecules cleave at their weakest points and produce
smaller, more volatile fragments. A flow of inert gas (He) flushes the pyrolysates into
the GC-column, where the different analytes will be separated. The stream of
separated compounds is fed on-line into a mass spectrometer. The mass
spectrometer uses an ion source, containing a metallic filament to which high voltage
is applied. This filament emits electrons which ionize the compounds. The ions are
PhD Thesis
Habib-Patrick-Richard-Yoba-N’goma
24
further fragmented, yielding predictable patterns of the component. Intact ions and
fragments pass into the mass spectrometer's analyzer and are eventually detected.
PhD Thesis
Habib-Patrick-Richard-Yoba-N’goma
25
4. Results and Discussions
In this part, results of the chromatographic method development for the functionality
type distribution (FTD) of PPDO- and PCL-diols and multiblockcopolymers (MBC)
separation is reported. FTD of PPDO- and PCL-diols was performed in order to
determine the end groups. The analyses of the MBCs were mainly conducted in
order to obtain structural and compositional information on products with the aim of
understanding the copolymerization and by this mean optimizing the reaction
synthesis. The results are divided in two main parts. The first is dedicated to the
study of the FTD of PPDO and PCL-diols. In the second part the MBCs are analyzed.
The macrodiols used for the synthesis of the multiblock polymers (MBP) are p-
dioxanone (PPDO) and ε-caprolactone (PCL) diols. PCL-diols are commercially
available, while PPDO-diols are not. Thus, the PPDO-diols were synthesized by ring
opening polymerization from commercially available p-dioxan-2-one (PDO) with a diol
as initiator. The multiblock polymers (MBP) of PPDO and PCL were synthesized by
reacting the respective macrodiols (PPDO or PCL-diols) with trimethyl
hexamethylene diisocyanate (TMDI) in solution at elevated temperature. The MBCs
used in this study were synthesized as one-step reaction by simultaneously mixing
the macrodiols (PPDO- and PCL-diols), and TMDI, together in the solvent and
heating the solution at elevated temperature. The schematic synthesis of PPDO-
diols, MBP and MBC is reported in experimental part.
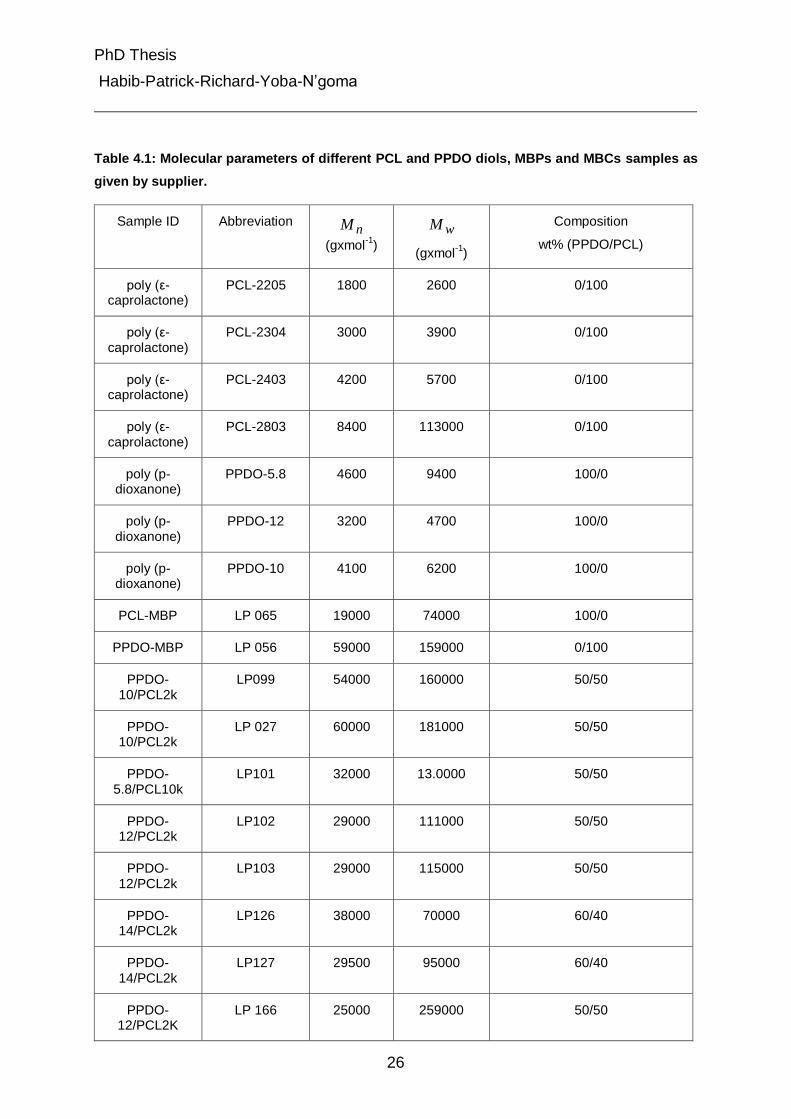
The molecular parameters of different ε-caprolactone (PCL)diols, p-dioxanone
(PPDO)-diols, mutiblock polymers (MBP) and multiblock copolymers (MBC) samples
given by the supplier are listed in Table 4.1.
PhD Thesis
Habib-Patrick-Richard-Yoba-N’goma
26
Table 4.1: Molecular parameters of different PCL and PPDO diols, MBPs and MBCs samples as
given by supplier.
Sample ID Abbreviation nM
(gxmol-1
)
wM
(gxmol-1
)
Composition
wt% (PPDO/PCL)
poly (ε-caprolactone)
PCL-2205 1800 2600 0/100
poly (ε-caprolactone)
PCL-2304 3000 3900 0/100
poly (ε-caprolactone)
PCL-2403 4200 5700 0/100
poly (ε-caprolactone)
PCL-2803 8400 113000 0/100
poly (p-dioxanone)
PPDO-5.8 4600 9400 100/0
poly (p-dioxanone)
PPDO-12 3200 4700 100/0
poly (p-dioxanone)
PPDO-10 4100 6200 100/0
PCL-MBP LP 065 19000 74000 100/0
PPDO-MBP LP 056 59000 159000 0/100
PPDO-10/PCL2k
LP099 54000 160000 50/50
PPDO-10/PCL2k
LP 027 60000 181000 50/50
PPDO-5.8/PCL10k
LP101 32000 13.0000 50/50
PPDO-12/PCL2k
LP102 29000 111000 50/50
PPDO-12/PCL2k
LP103 29000 115000 50/50
PPDO-14/PCL2k
LP126 38000 70000 60/40
PPDO-14/PCL2k
LP127 29500 95000 60/40
PPDO- 12/PCL2K
LP 166 25000 259000 50/50
PhD Thesis
Habib-Patrick-Richard-Yoba-N’goma
27
Please note that different numbers after PPDO represents the batch# for the
polymerization of PPDO from commercially available PDO. PCL is caprolactone
purchased from solvay chemicals (2k and 10k represent the molar mass). nM being
the number average molar mass and wM being the weight average molar mass
4.1 Functionality Type Distribution (FTD) of PCLs and PPDOs-diols
As mentioned above, the first section of the results deals with the functionality type
distribution (FTD) of functionalized PCL and PPDO-diols in order to check the purity
of the samples. Since these diols were used for the synthesis of the MBCs, the
functionality analysis will allow gaining information on the end group of the resulting
final MBC.
4.1.1 Separation of PCL-diols according to functional hydroxyl groups
The task here was to separate PCL-diols samples according to end groups. PCL-
diols were purchased from solvay chemicals while PCL-monool was obtained in
house (DKI). The monool is needed to check for the molar mass independent elution
with other PCL-diols samples. Since it is not easy to determine the liquid
chromatography at critical conditions (LCCC) by using functionalize PCL-monool and
PCL-diols, because they cannot elute at the same retention time. For this reason, first
the PCL-monool and PCL-diols were modified in such a way that the resulting end
group should not interact with the stationary phase and decrease the retention. In this
case, for the modification of the hydroxyl function, acetyl chloride was selected
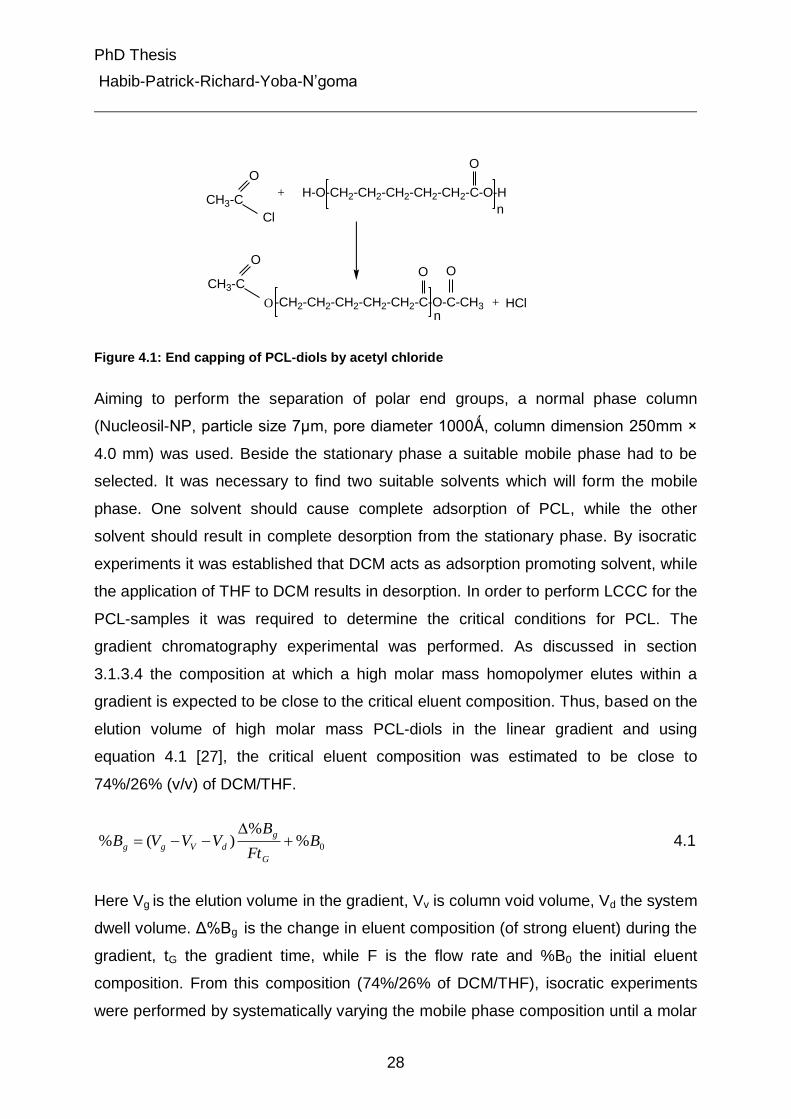
aiming to form the terminal acetate groups. The modification reaction is illustrated in
Fig. 4.1.
PhD Thesis
Habib-Patrick-Richard-Yoba-N’goma
28
Figure 4.1: End capping of PCL-diols by acetyl chloride
Aiming to perform the separation of polar end groups, a normal phase column
(Nucleosil-NP, particle size 7µm, pore diameter 1000Ǻ, column dimension 250mm ×
4.0 mm) was used. Beside the stationary phase a suitable mobile phase had to be
selected. It was necessary to find two suitable solvents which will form the mobile
phase. One solvent should cause complete adsorption of PCL, while the other
solvent should result in complete desorption from the stationary phase. By isocratic
experiments it was established that DCM acts as adsorption promoting solvent, while
the application of THF to DCM results in desorption. In order to perform LCCC for the
PCL-samples it was required to determine the critical conditions for PCL. The
gradient chromatography experimental was performed. As discussed in section
3.1.3.4 the composition at which a high molar mass homopolymer elutes within a
gradient is expected to be close to the critical eluent composition. Thus, based on the
elution volume of high molar mass PCL-diols in the linear gradient and using
equation 4.1 [27], the critical eluent composition was estimated to be close to
74%/26% (v/v) of DCM/THF.
0%%
)(% BFt
BVVVB
G
g
dVgg
4.1
Here Vg is the elution volume in the gradient, Vv is column void volume, Vd the system
dwell volume. Δ%Bg is the change in eluent composition (of strong eluent) during the
gradient, tG the gradient time, while F is the flow rate and %B0 the initial eluent
composition. From this composition (74%/26% of DCM/THF), isocratic experiments
were performed by systematically varying the mobile phase composition until a molar
CH3-C
Cl
O
+ H-O-CH2-CH2-CH2-CH2-CH2-C-O-H
O
CH3-C
O
O
O
n
O
n+ HCl-CH2-CH2-CH2-CH2-CH2-C-O-C-CH3
PhD Thesis
Habib-Patrick-Richard-Yoba-N’goma
29
mass-independent elution was observed, which characterizes critical elution
behavior. Molar mass independent elution was observed at a solvent composition of
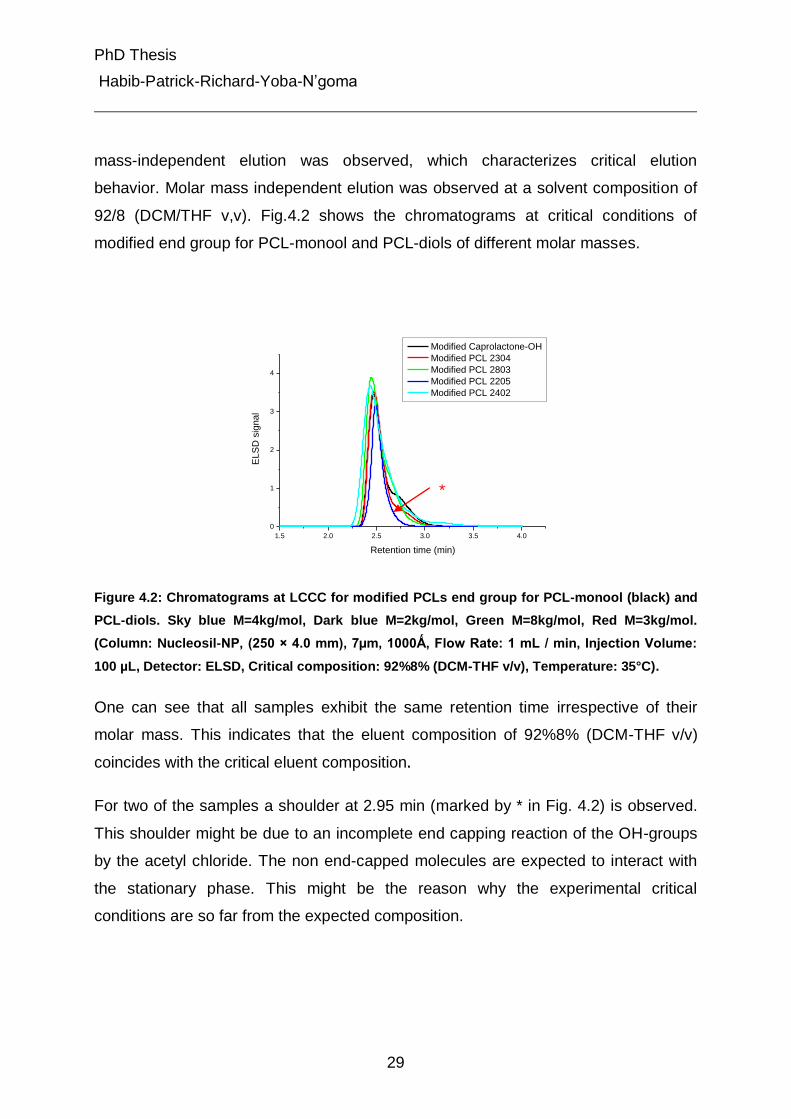
92/8 (DCM/THF v,v). Fig.4.2 shows the chromatograms at critical conditions of
modified end group for PCL-monool and PCL-diols of different molar masses.
1.5 2.0 2.5 3.0 3.5 4.0
0
1
2
3
4
Modified Caprolactone-OH
Modified PCL 2304
Modified PCL 2803
Modified PCL 2205
Modified PCL 2402
EL
SD
sig
na
l
Retention time (min)
Figure 4.2: Chromatograms at LCCC for modified PCLs end group for PCL-monool (black) and
PCL-diols. Sky blue M=4kg/mol, Dark blue M=2kg/mol, Green M=8kg/mol, Red M=3kg/mol.
(Column: Nucleosil-NP, (250 × 4.0 mm), 7µm, 1000Ǻ, Flow Rate: 1 mL / min, Injection Volume:
100 µL, Detector: ELSD, Critical composition: 92%8% (DCM-THF v/v), Temperature: 35°C).
One can see that all samples exhibit the same retention time irrespective of their
molar mass. This indicates that the eluent composition of 92%8% (DCM-THF v/v)
coincides with the critical eluent composition.
For two of the samples a shoulder at 2.95 min (marked by * in Fig. 4.2) is observed.
This shoulder might be due to an incomplete end capping reaction of the OH-groups
by the acetyl chloride. The non end-capped molecules are expected to interact with
the stationary phase. This might be the reason why the experimental critical
conditions are so far from the expected composition.
*
PhD Thesis
Habib-Patrick-Richard-Yoba-N’goma
30
4.1.1.1 Analysis of PCL-monool and PCL-diols at critical conditions
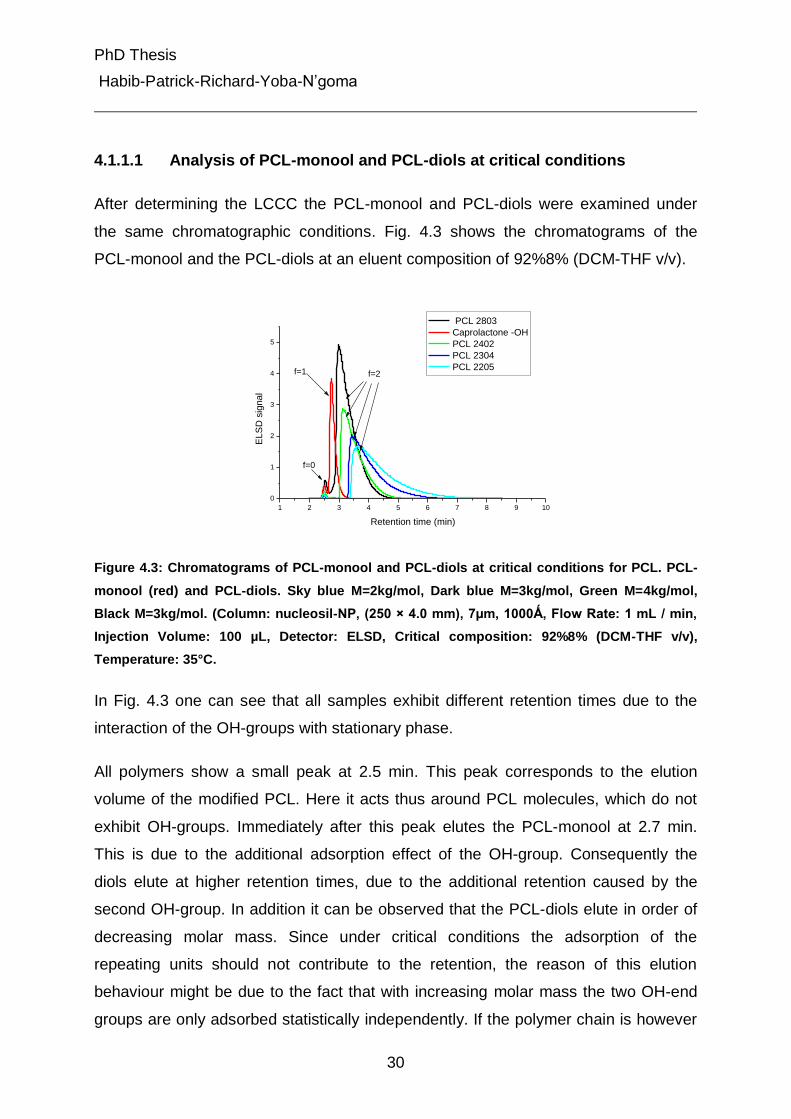
After determining the LCCC the PCL-monool and PCL-diols were examined under
the same chromatographic conditions. Fig. 4.3 shows the chromatograms of the
PCL-monool and the PCL-diols at an eluent composition of 92%8% (DCM-THF v/v).
1 2 3 4 5 6 7 8 9 10
0
1
2
3
4
5
PCL 2803
Caprolactone -OH
PCL 2402
PCL 2304
PCL 2205
ELS
D s
ignal
Retention time (min)
f=0
f=1 f=2
Figure 4.3: Chromatograms of PCL-monool and PCL-diols at critical conditions for PCL. PCL-
monool (red) and PCL-diols. Sky blue M=2kg/mol, Dark blue M=3kg/mol, Green M=4kg/mol,
Black M=3kg/mol. (Column: nucleosil-NP, (250 × 4.0 mm), 7µm, 1000Ǻ, Flow Rate: 1 mL / min,
Injection Volume: 100 µL, Detector: ELSD, Critical composition: 92%8% (DCM-THF v/v),
Temperature: 35°C.
In Fig. 4.3 one can see that all samples exhibit different retention times due to the
interaction of the OH-groups with stationary phase.
All polymers show a small peak at 2.5 min. This peak corresponds to the elution
volume of the modified PCL. Here it acts thus around PCL molecules, which do not
exhibit OH-groups. Immediately after this peak elutes the PCL-monool at 2.7 min.
This is due to the additional adsorption effect of the OH-group. Consequently the
diols elute at higher retention times, due to the additional retention caused by the
second OH-group. In addition it can be observed that the PCL-diols elute in order of
decreasing molar mass. Since under critical conditions the adsorption of the
repeating units should not contribute to the retention, the reason of this elution
behaviour might be due to the fact that with increasing molar mass the two OH-end
groups are only adsorbed statistically independently. If the polymer chain is however
PhD Thesis
Habib-Patrick-Richard-Yoba-N’goma
31
short, then the two end group adsorb no longer independently. If the first OH-group is
adsorbed, then also the second OH-group is in the proximity of the stationary phase
and the probability for its simultaneous adsorption is increased [44]. In this way, the
effect should be stronger for short polymer chains than for longer polymer ones. In
other words: the longer the polymer chain is, the less will the adsorption of the first
functional group influence the adsorption of the other one. As a consequence,
polymers with increasing molar mass elute before those of lower molar mass as can
be observed in Fig. 4.3.
4.1.1.2 Separation of PPDO-diols according to end group functionality
The separation of PPDO-diols according to end group functionality was planned to be
performed similar to the PCL-diols. However, a number of difficulties were
encountered with PPDO-diols. However, firstly, the PPDO-diols available were
unknown in terms of purity if the OH were the end groups. Secondly, two of available
PPDO-diols had almost similar molar mass. Therefore, it was not possible to
determine critical conditions in the common way by proving molar mass independent
elution for a series of samples of different molar masses.
In order to overcome the problems mentioned above, the separations of PPDO-diols
were finally performed using gradient chromatography. Aimed at the separation of
polar end-groups, a normal phase (Nucleosil (bare silica), particle size 7µm, pore
diameter 1000 Ǻ, column dimension 250 mm × 4.0 mm) column was selected. Based
on this selection of stationary phase two suitable solvents had to be identified, one of
which should cause complete adsorption of PPDO-diols on the stationary phase,
while the other should completely desorb PPDO-diols. DCM and dimethylformamide
(DMF) were found to fulfill these criteria. The linear gradient ranging within 10
minutes from 100% DCM to 100% DMF was used. 100% DMF was hold for 1 minute
before returning to the initial composition. Finally, a re-equilibration of the column was
allowed for 5 min with DCM.
PhD Thesis
Habib-Patrick-Richard-Yoba-N’goma
32
0 2 4 6 8 10
0.0
0.2
0.4
0.6
0.8
1.0
ELD
S s
ign
al
Retention time (min)
PPDO 12
PPDO 8
PPDO 5
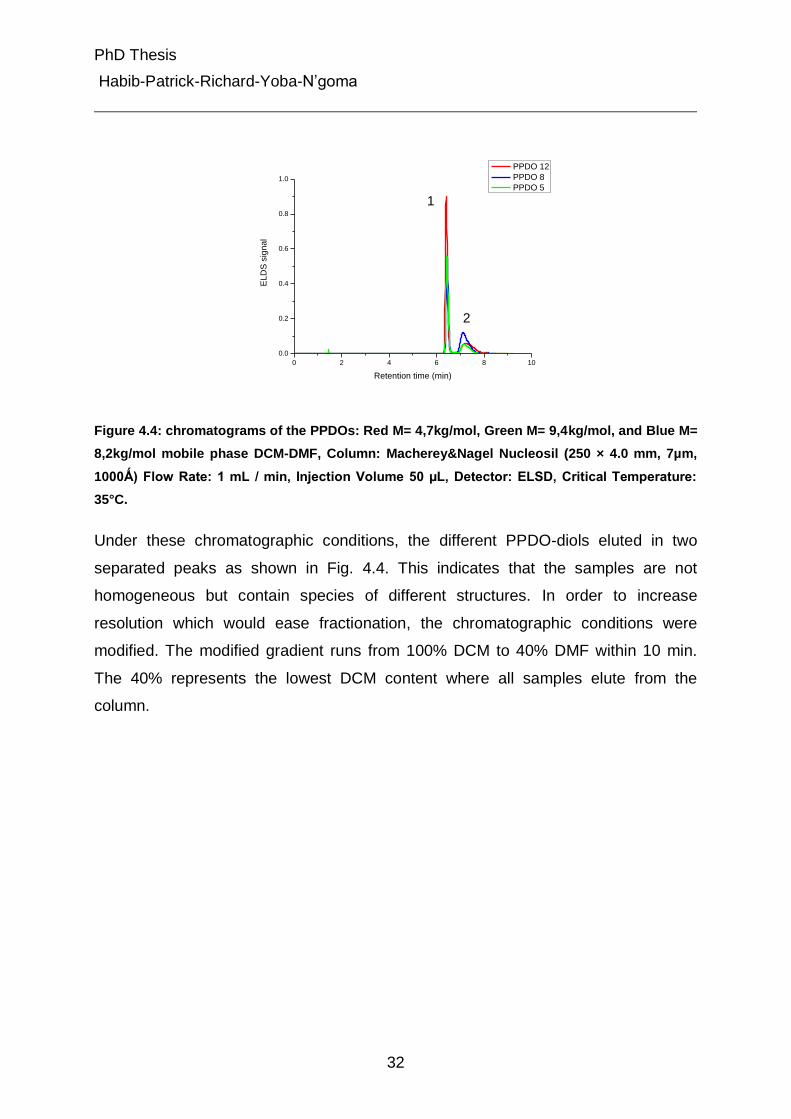
Figure 4.4: chromatograms of the PPDOs: Red M= 4,7kg/mol, Green M= 9,4kg/mol, and Blue M=
8,2kg/mol mobile phase DCM-DMF, Column: Macherey&Nagel Nucleosil (250 × 4.0 mm, 7µm,
1000Ǻ) Flow Rate: 1 mL / min, Injection Volume 50 µL, Detector: ELSD, Critical Temperature:
35°C.
Under these chromatographic conditions, the different PPDO-diols eluted in two
separated peaks as shown in Fig. 4.4. This indicates that the samples are not
homogeneous but contain species of different structures. In order to increase
resolution which would ease fractionation, the chromatographic conditions were
modified. The modified gradient runs from 100% DCM to 40% DMF within 10 min.
The 40% represents the lowest DCM content where all samples elute from the
column.
1
2
PhD Thesis
Habib-Patrick-Richard-Yoba-N’goma
33
0 2 4 6 8 10 12 14
0.0
0.2
0.4
0.6
0.8
1.0
1.2
ELS
D s
ign
al
Retention time (min)
PPDO 12
PPDO 8
PPDO 5
1
2
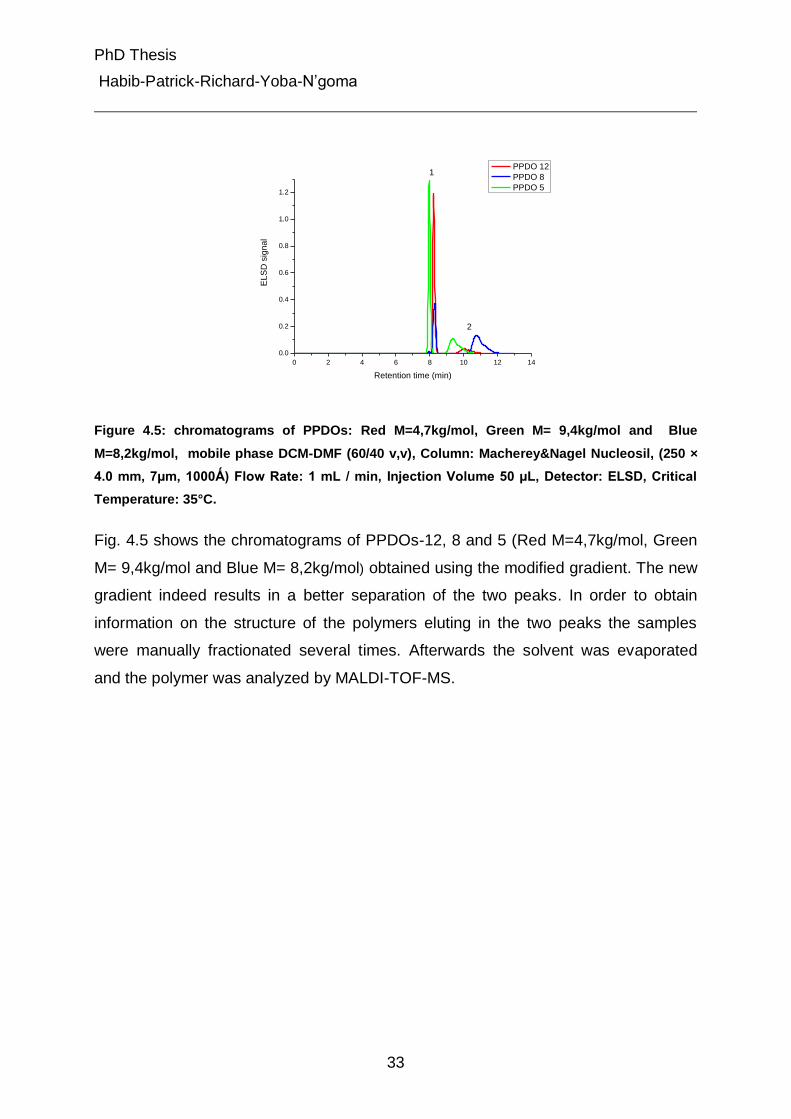
Figure 4.5: chromatograms of PPDOs: Red M=4,7kg/mol, Green M= 9,4kg/mol and Blue
M=8,2kg/mol, mobile phase DCM-DMF (60/40 v,v), Column: Macherey&Nagel Nucleosil, (250 ×
4.0 mm, 7µm, 1000Ǻ) Flow Rate: 1 mL / min, Injection Volume 50 µL, Detector: ELSD, Critical
Temperature: 35°C.
Fig. 4.5 shows the chromatograms of PPDOs-12, 8 and 5 (Red M=4,7kg/mol, Green
M= 9,4kg/mol and Blue M= 8,2kg/mol) obtained using the modified gradient. The new
gradient indeed results in a better separation of the two peaks. In order to obtain
information on the structure of the polymers eluting in the two peaks the samples
were manually fractionated several times. Afterwards the solvent was evaporated
and the polymer was analyzed by MALDI-TOF-MS.
PhD Thesis
Habib-Patrick-Richard-Yoba-N’goma
34
0
10
20
30
40
50
60
70
80
90
100
%Int.
1000 1500 2000 2500 3000 3500 4000 4500 5000
Mass/Charge
1[c].M8
29 mV[sum= 8068 mV] Profiles 1-282 Smooth Av 50 -Baseline 100
10 mg/ml Dith/Dioxan -- 4 mg/ml PPDO5_1 HFIP -- LiCl 5µl 10mg/ml
Data: PPDO5_1_Li_0002.M8[c] 26 Jun 2008 14:24 Cal: tof-PEG4000-10000 26 Jun 2008 14:12
Shimadzu Biotech Axima ToF² 2.7.2.20070105: Mode Linear, Power: 91, P.Ext. @ 10000 (bin 149)
12
94
.2
13
96
.3
14
98
.2
19
06
.7
20
08
.6
21
10
.7
22
12
.8
11
92
.3
16
00
.5
23
14
.9
18
04
.6
17
02
.4
24
16
.9
25
19
.0
26
21
.1
27
23
.2
28
25
.2
10
90
.0
29
27
.1
13
34
.4
30
29
.4
31
31
.5
32
33
.1
33
35
.6
15
38
.5
34
37
.6
13
10
.4
14
12
.3
11
30
.3
35
39
.5
98
7.9
36
41
.7
37
43
.7
20
24
.8
21
26
.7
22
28
.9
19
22
.5
39
47
.5
38
45
.7
18
20
.7
40
49
.7
25
35
.2
24
33
.5
23
31
.5
27
39
.3
26
37
.3
28
41
.4
41
51
.8
42
53
.8
43
56
.0
31
47
.0
29
43
.0
30
45
.1
44
58
.2
32
49
.6
33
51
.5
45
59
.9
46
62
.3
0
10
20
30
40
50
60
70
80
90
100
%Int.
1000 1500 2000 2500 3000 3500 4000 4500 5000
Mass/Charge
1[c].M9
13 mV[sum= 2857 mV] Profiles 1-222 Smooth Av 50 -Baseline 100
10 mg/ml Dith/Dioxan -- 4 mg/ml PPDO5_2 HFIP -- LiCl 5µl 10mg/ml
Data: PPDO5_2_Li_0002.M9[c] 26 Jun 2008 14:34 Cal: tof-PEG4000-10000 26 Jun 2008 14:30
Shimadzu Biotech Axima ToF² 2.7.2.20070105: Mode Linear, Power: 92, P.Ext. @ 10000 (bin 149)
15
56
.9
14
55
.0
13
52
.8
16
59
.1
17
61
.1
12
50
.7
18
63
.4
19
65
.6
14
60
.6
21
69
.5
20
67
.7
15
63
.1
13
58
.7
94
4.2
11
48
.6
16
64
.9
22
71
.6
12
56
.6
23
73
.4
18
68
.9
19
71
.5
25
78
.2
24
75
.6
17
67
.1
10
46
.2
26
80
.1
11
54
.5
27
82
.1
28
84
.5
29
86
.2
13
35
.4
18
79
.9
30
88
.2
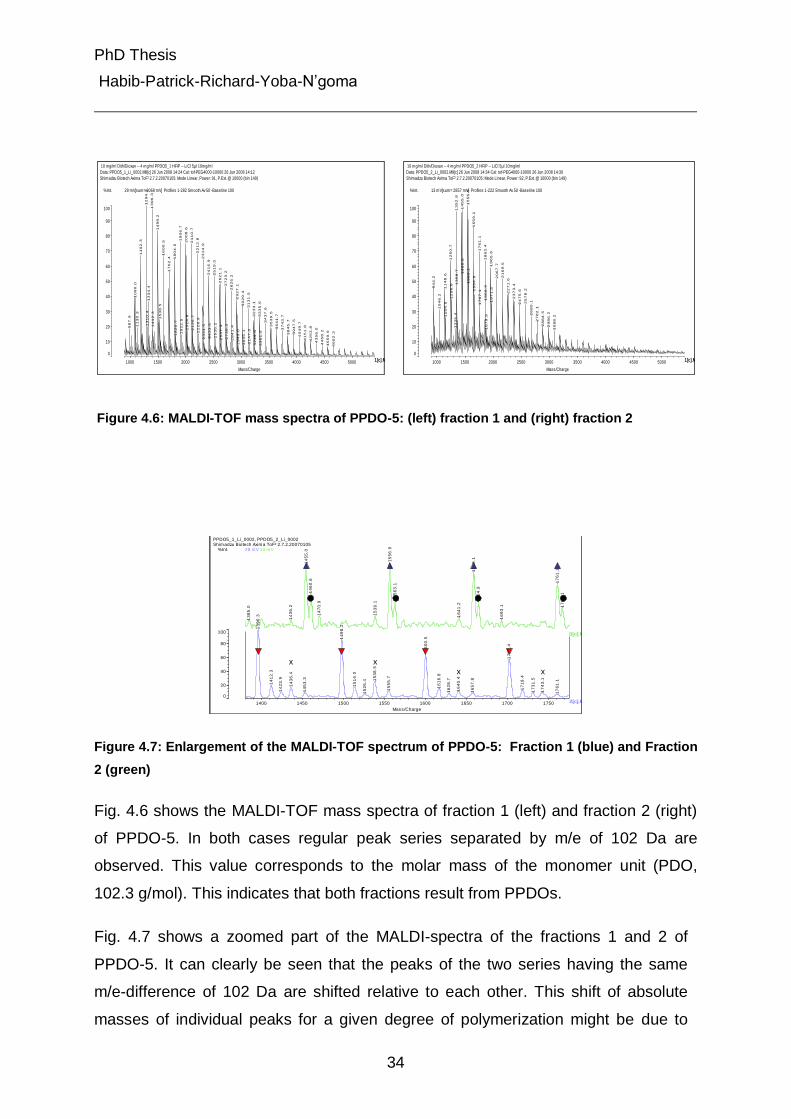
Figure 4.6: MALDI-TOF mass spectra of PPDO-5: (left) fraction 1 and (right) fraction 2
0
20
40
60
80
100
%Int.
1400 1450 1500 1550 1600 1650 1700 1750
Mass/Charge
2[c].M8
3[c].M9
28 mV 13 mV
PPDO5_1_Li_0002, PPDO5_2_Li_0002Shimadzu Biotech Axima ToF² 2.7.2.20070105
13
96
.3
14
98
.2
16
00
.5
17
02
.4
15
56
.9
14
55
.0
16
59
.1
17
61
.1
15
38
.5
14
12
.3
14
60
.6
15
63
.1
14
36
.4
15
14
.0
16
64
.9
16
16
.8
17
67
.1
17
18
.4
15
55
.7
16
40
.4
14
23
.9
14
53
.3
17
43
.1
17
31
.5
16
28
.7
14
70
.9
15
39
.1
16
57
.8
16
41
.2
15
26
.4
17
61
.1
16
93
.1
14
36
.2
13
85
.0
x xx x
Figure 4.7: Enlargement of the MALDI-TOF spectrum of PPDO-5: Fraction 1 (blue) and Fraction
2 (green)
Fig. 4.6 shows the MALDI-TOF mass spectra of fraction 1 (left) and fraction 2 (right)
of PPDO-5. In both cases regular peak series separated by m/e of 102 Da are
observed. This value corresponds to the molar mass of the monomer unit (PDO,
102.3 g/mol). This indicates that both fractions result from PPDOs.
Fig. 4.7 shows a zoomed part of the MALDI-spectra of the fractions 1 and 2 of
PPDO-5. It can clearly be seen that the peaks of the two series having the same
m/e-difference of 102 Da are shifted relative to each other. This shift of absolute
masses of individual peaks for a given degree of polymerization might be due to
PhD Thesis
Habib-Patrick-Richard-Yoba-N’goma
35
differences in the initiator or the end groups. In the present case, based on the
manufacturer’s information the PPDOs have been initiated by different low molar
mass diols, e.g. ethyleneglycol, which related to a series of peaks expected which
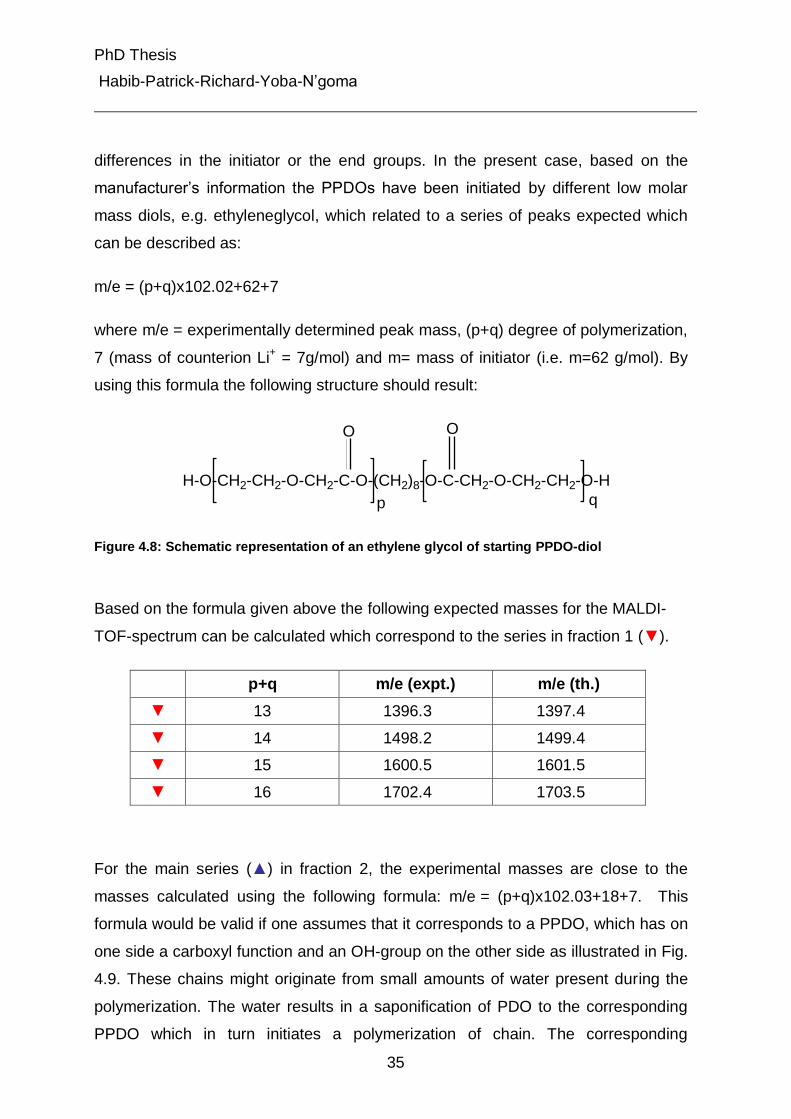
can be described as:
m/e = (p+q)x102.02+62+7
where m/e = experimentally determined peak mass, (p+q) degree of polymerization,
7 (mass of counterion Li+ = 7g/mol) and m= mass of initiator (i.e. m=62 g/mol). By
using this formula the following structure should result:
H-O-CH2-CH2-O-CH2-C-O-(CH2)8-O-C-CH2-O-CH2-CH2-O-H
O O
p q
Figure 4.8: Schematic representation of an ethylene glycol of starting PPDO-diol
Based on the formula given above the following expected masses for the MALDI-
TOF-spectrum can be calculated which correspond to the series in fraction 1 (▼).
p+q m/e (expt.) m/e (th.)
▼ 13 1396.3 1397.4
▼ 14 1498.2 1499.4
▼ 15 1600.5 1601.5
▼ 16 1702.4 1703.5
For the main series (▲) in fraction 2, the experimental masses are close to the
masses calculated using the following formula: m/e = (p+q)x102.03+18+7. This
formula would be valid if one assumes that it corresponds to a PPDO, which has on
one side a carboxyl function and an OH-group on the other side as illustrated in Fig.
4.9. These chains might originate from small amounts of water present during the
polymerization. The water results in a saponification of PDO to the corresponding
PPDO which in turn initiates a polymerization of chain. The corresponding
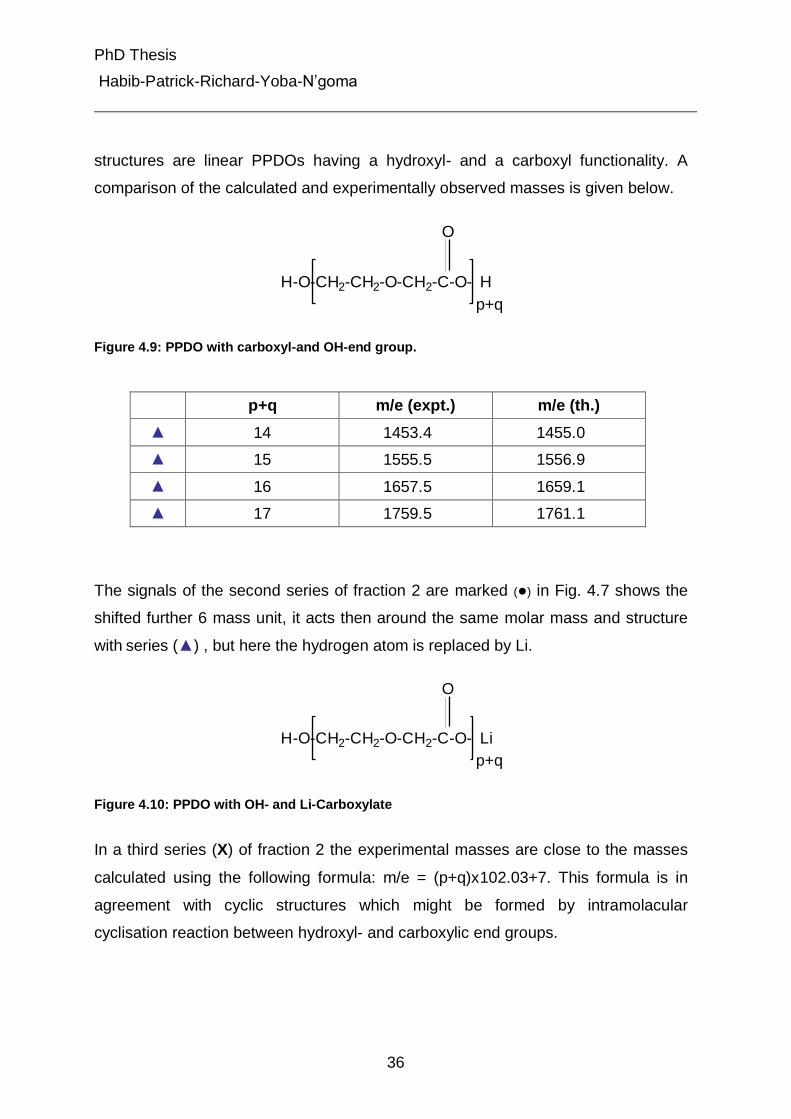
PhD Thesis
Habib-Patrick-Richard-Yoba-N’goma
36
structures are linear PPDOs having a hydroxyl- and a carboxyl functionality. A
comparison of the calculated and experimentally observed masses is given below.
O
p+q
H-O-CH2-CH2-O-CH2-C-O- H
Figure 4.9: PPDO with carboxyl-and OH-end group.
p+q m/e (expt.) m/e (th.)
▲ 14 1453.4 1455.0
▲ 15 1555.5 1556.9
▲ 16 1657.5 1659.1
▲ 17 1759.5 1761.1
The signals of the second series of fraction 2 are marked (●) in Fig. 4.7 shows the
shifted further 6 mass unit, it acts then around the same molar mass and structure
with series (▲) , but here the hydrogen atom is replaced by Li.
O
p+q
H-O-CH2-CH2-O-CH2-C-O- Li
Figure 4.10: PPDO with OH- and Li-Carboxylate
In a third series (X) of fraction 2 the experimental masses are close to the masses
calculated using the following formula: m/e = (p+q)x102.03+7. This formula is in
agreement with cyclic structures which might be formed by intramolacular
cyclisation reaction between hydroxyl- and carboxylic end groups.
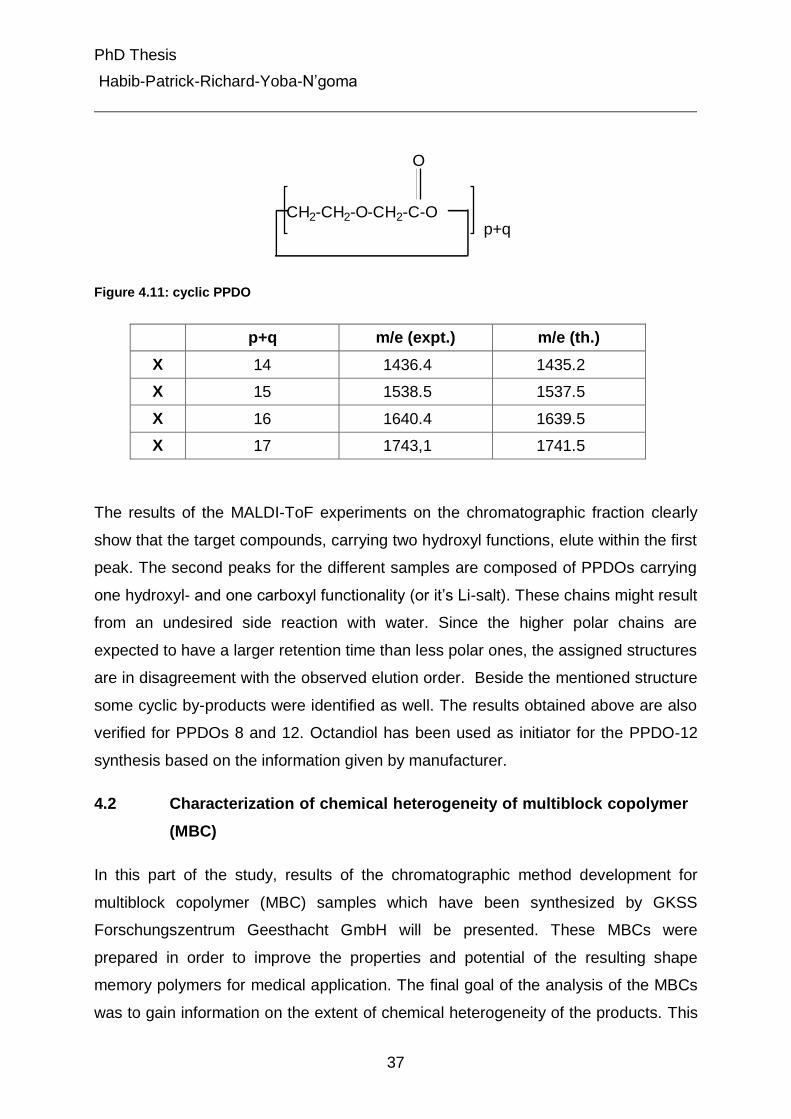
PhD Thesis
Habib-Patrick-Richard-Yoba-N’goma
37
O
p+qCH2-CH2-O-CH2-C-O
Figure 4.11: cyclic PPDO
p+q m/e (expt.) m/e (th.)
X 14 1436.4 1435.2
X 15 1538.5 1537.5
X 16 1640.4 1639.5
X 17 1743,1 1741.5
The results of the MALDI-ToF experiments on the chromatographic fraction clearly
show that the target compounds, carrying two hydroxyl functions, elute within the first
peak. The second peaks for the different samples are composed of PPDOs carrying
one hydroxyl- and one carboxyl functionality (or it’s Li-salt). These chains might result
from an undesired side reaction with water. Since the higher polar chains are
expected to have a larger retention time than less polar ones, the assigned structures
are in disagreement with the observed elution order. Beside the mentioned structure
some cyclic by-products were identified as well. The results obtained above are also
verified for PPDOs 8 and 12. Octandiol has been used as initiator for the PPDO-12
synthesis based on the information given by manufacturer.
4.2 Characterization of chemical heterogeneity of multiblock copolymer
(MBC)
In this part of the study, results of the chromatographic method development for
multiblock copolymer (MBC) samples which have been synthesized by GKSS
Forschungszentrum Geesthacht GmbH will be presented. These MBCs were
prepared in order to improve the properties and potential of the resulting shape
memory polymers for medical application. The final goal of the analysis of the MBCs
was to gain information on the extent of chemical heterogeneity of the products. This
PhD Thesis
Habib-Patrick-Richard-Yoba-N’goma
38
information would help to understand how the heterogeneity of the product influences
the properties of the final products and how the extend of heterogeneity is affected by
the synthesis methods.
The MBCs under investigation were all synthesized by reacting simultaneously poly
(p-dioxanone)-(PPDO) and poly(ε-caprolactone) (PCL)-diols with trimethyl
hexamethylene diisocyanate (TMDI). Since the coupling reaction should result in the
formation of urethane linkages, the materials are called polyurethane multiblock
copolymers.
As every polymer synthesis involves statistical processes, the MBCs were expected
to present heterogeneities in both molar mass and chemical composition. In order to
get first information on the heterogeneity with respect to molar mass size exclusion
chromatography (SEC) was performed. In addition SEC-FITR experiments were
performed to determine potential compositional changes across the molar mass
distribution (MMD) and thus to obtain first information on chemical heterogeneity.
4.2.1 Analysis of molar mass distribution by SEC
The MBCs were at first analyzed by SEC in order to determine nM and wM . A typical
example of a SEC separation of a MBC is shown in Fig. 4.12 for MBC LP 102.
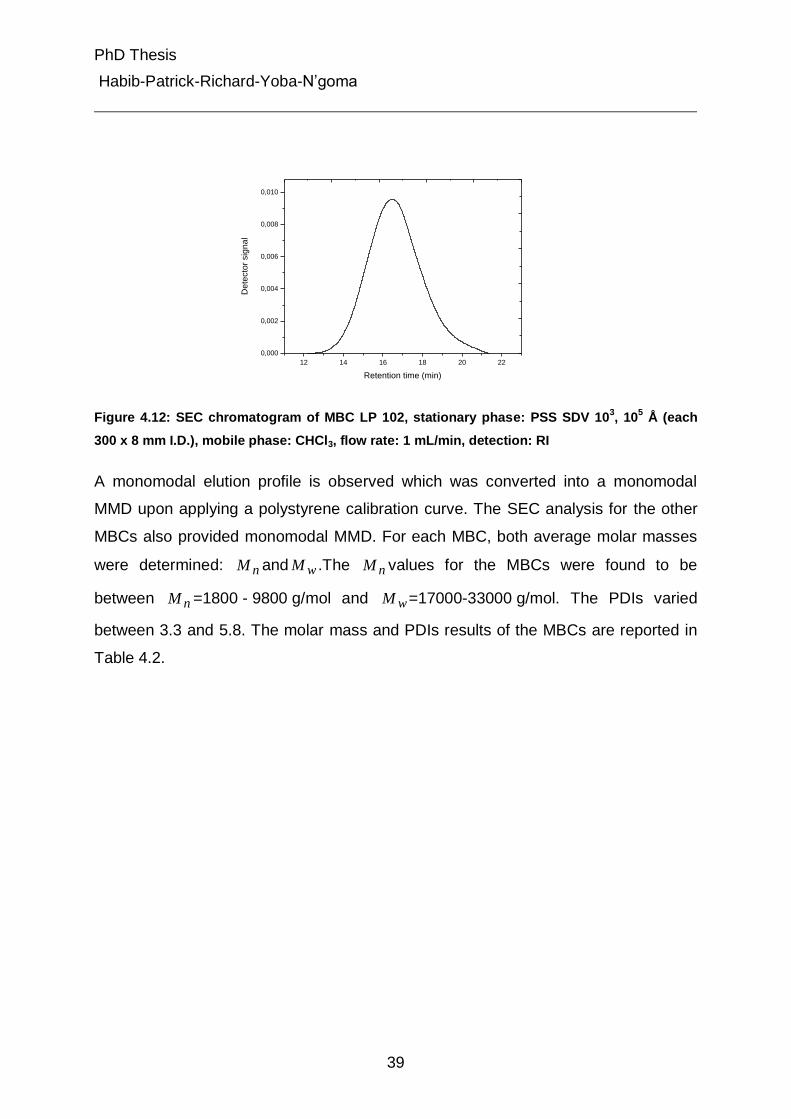
PhD Thesis
Habib-Patrick-Richard-Yoba-N’goma
39
12 14 16 18 20 22
0,000
0,002
0,004
0,006
0,008
0,010
De
tecto
r sig
na
l
Retention time (min)
Figure 4.12: SEC chromatogram of MBC LP 102, stationary phase: PSS SDV 103, 10
5 Å (each
300 x 8 mm I.D.), mobile phase: CHCl3, flow rate: 1 mL/min, detection: RI
A monomodal elution profile is observed which was converted into a monomodal
MMD upon applying a polystyrene calibration curve. The SEC analysis for the other
MBCs also provided monomodal MMD. For each MBC, both average molar masses
were determined: nM and wM .The nM values for the MBCs were found to be
between nM =1800 - 9800 g/mol and wM =17000-33000 g/mol. The PDIs varied
between 3.3 and 5.8. The molar mass and PDIs results of the MBCs are reported in
Table 4.2.
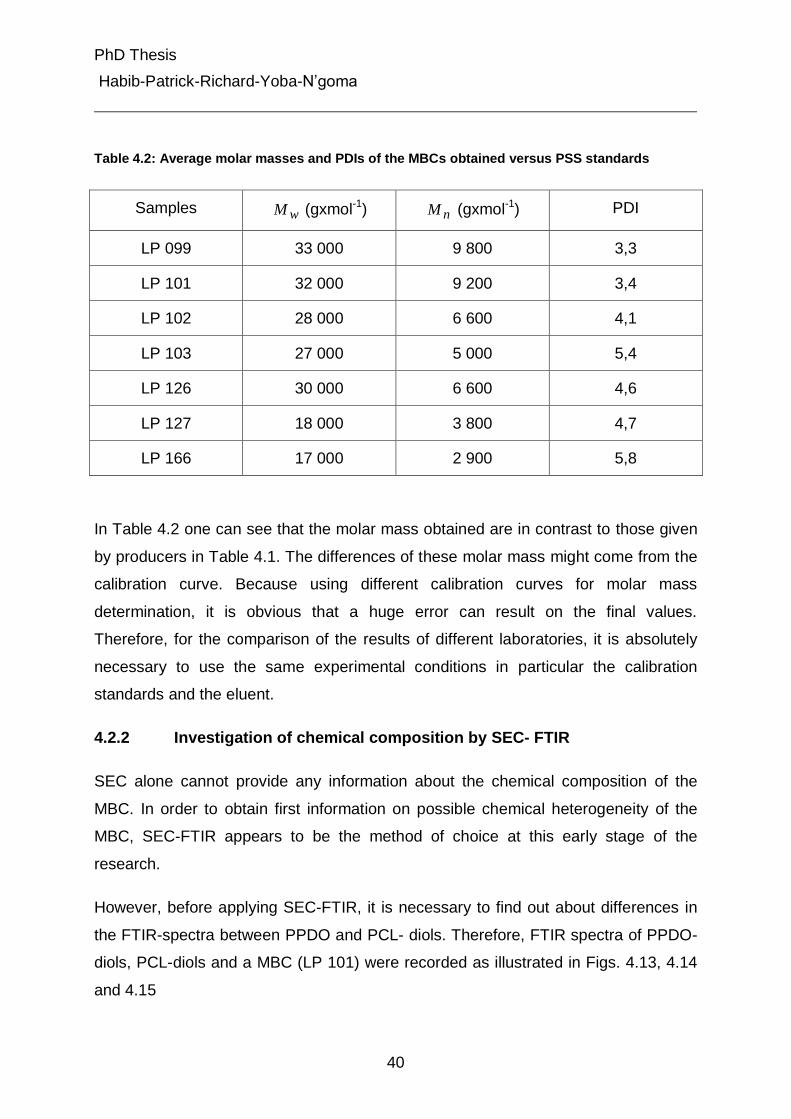
PhD Thesis
Habib-Patrick-Richard-Yoba-N’goma
40
Table 4.2: Average molar masses and PDIs of the MBCs obtained versus PSS standards
Samples wM (gxmol-1) nM (gxmol-1) PDI
LP 099 33 000 9 800 3,3
LP 101 32 000 9 200 3,4
LP 102 28 000 6 600 4,1
LP 103 27 000 5 000 5,4
LP 126 30 000 6 600 4,6
LP 127 18 000 3 800 4,7
LP 166 17 000 2 900 5,8
In Table 4.2 one can see that the molar mass obtained are in contrast to those given
by producers in Table 4.1. The differences of these molar mass might come from the
calibration curve. Because using different calibration curves for molar mass
determination, it is obvious that a huge error can result on the final values.
Therefore, for the comparison of the results of different laboratories, it is absolutely
necessary to use the same experimental conditions in particular the calibration
standards and the eluent.
4.2.2 Investigation of chemical composition by SEC- FTIR
SEC alone cannot provide any information about the chemical composition of the
MBC. In order to obtain first information on possible chemical heterogeneity of the
MBC, SEC-FTIR appears to be the method of choice at this early stage of the
research.
However, before applying SEC-FTIR, it is necessary to find out about differences in
the FTIR-spectra between PPDO and PCL- diols. Therefore, FTIR spectra of PPDO-
diols, PCL-diols and a MBC (LP 101) were recorded as illustrated in Figs. 4.13, 4.14
and 4.15
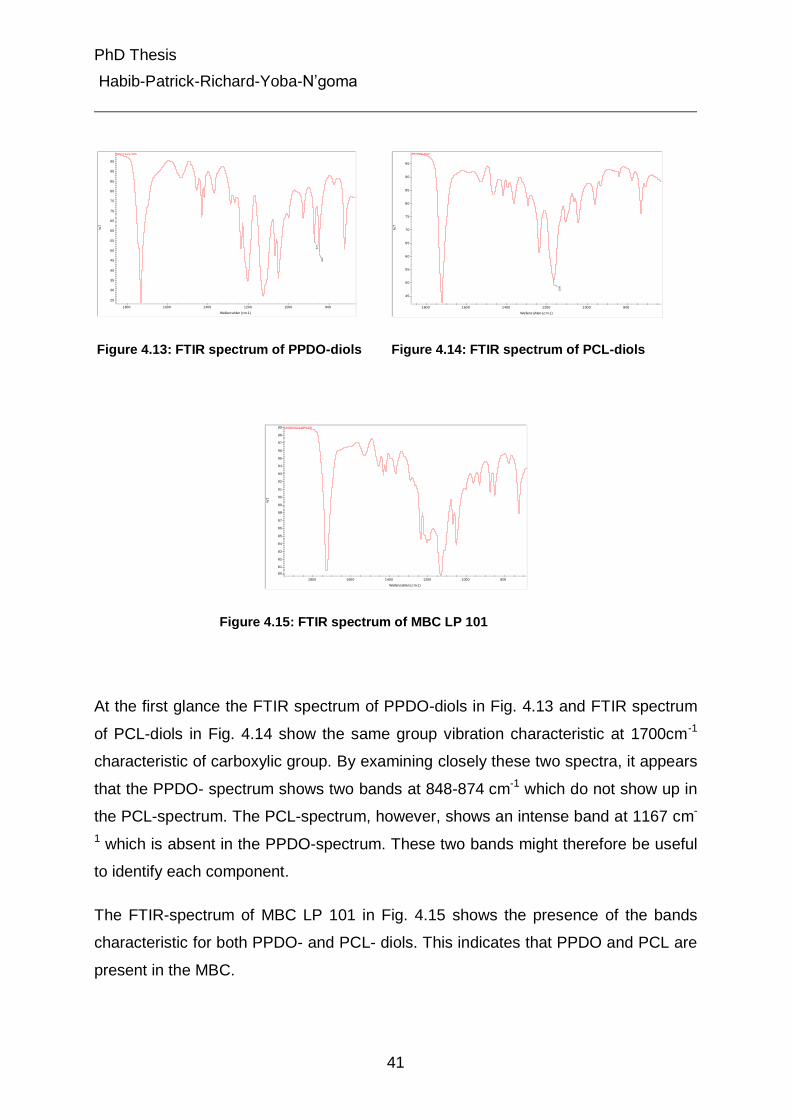
PhD Thesis
Habib-Patrick-Richard-Yoba-N’goma
41
848
872,
PP DO-homo-TMDI
25
30
35
40
45
50
55
60
65
70
75
80
85
90
95
%T
800 1000 1200 1400 1600 1800
Wellenzahlen (cm-1)
1165
PC l-homo-TMDI
45
50
55
60
65
70
75
80
85
90
95
%T
800 1000 1200 1400 1600 1800
Wellenzahlen (cm-1)
Figure 4.13: FTIR spectrum of PPDO-diols Figure 4.14: FTIR spectrum of PCL-diols
LP099(PPD O-10/C-2205)
80
81
82
83
84
85
86
87
88
89
90
91
92
93
94
95
96
97
98
99
%T
800 1000 1200 1400 1600 1800
Wellenzahlen (cm-1)
Figure 4.15: FTIR spectrum of MBC LP 101
At the first glance the FTIR spectrum of PPDO-diols in Fig. 4.13 and FTIR spectrum
of PCL-diols in Fig. 4.14 show the same group vibration characteristic at 1700cm-1
characteristic of carboxylic group. By examining closely these two spectra, it appears
that the PPDO- spectrum shows two bands at 848-874 cm-1 which do not show up in
the PCL-spectrum. The PCL-spectrum, however, shows an intense band at 1167 cm-
1 which is absent in the PPDO-spectrum. These two bands might therefore be useful
to identify each component.
The FTIR-spectrum of MBC LP 101 in Fig. 4.15 shows the presence of the bands
characteristic for both PPDO- and PCL- diols. This indicates that PPDO and PCL are
present in the MBC.
PhD Thesis
Habib-Patrick-Richard-Yoba-N’goma
42
Having identified characteristic bands for PPDO and PCL, it was possible to use
SEC-FTIR to determine a peak ratio which is related to compositional changes
across the molar mass distribution of the MBCs. This operation was done by
measuring the peak heights (I1) at 1146cm-1 (CHOH) and the peak height (I2) at
1178cm-1 (COH) slice by slice. The ratio was determined by dividing I1/ I2. Figure 4.16
illustrates the variation of the peak ratio across the chromatograms in different MBCs.
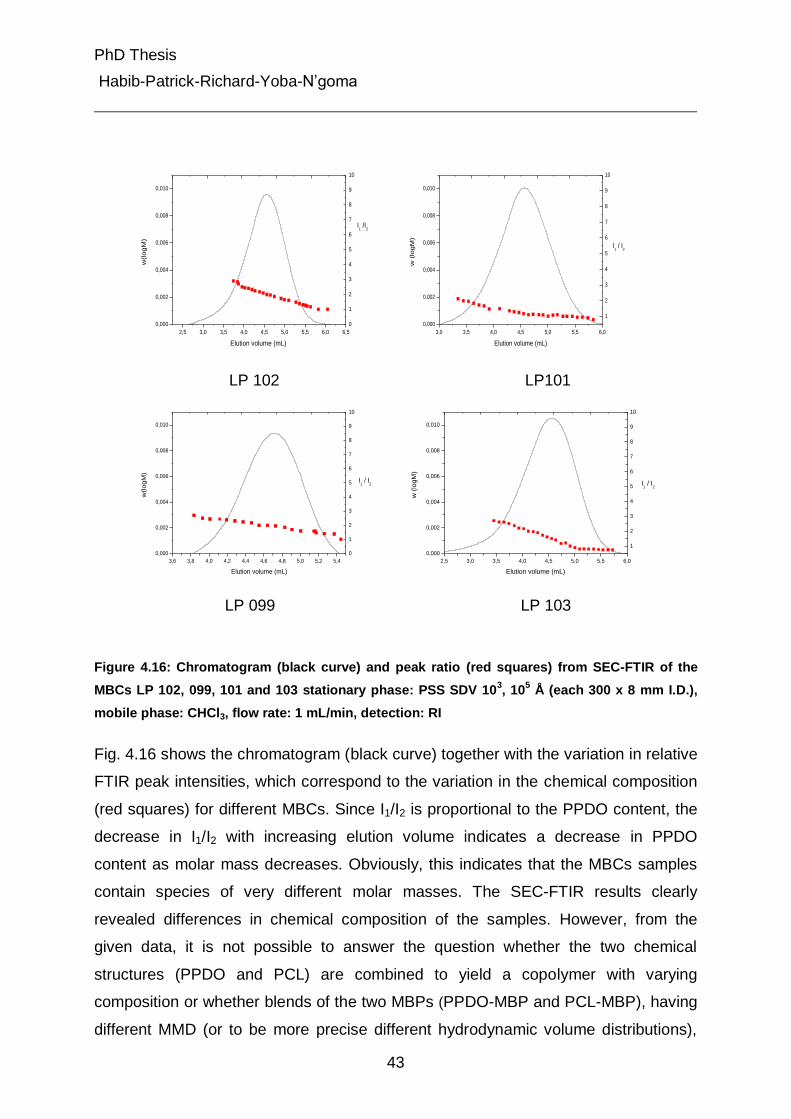
PhD Thesis
Habib-Patrick-Richard-Yoba-N’goma
43
2,5 3,0 3,5 4,0 4,5 5,0 5,5 6,0 6,5
0,000
0,002
0,004
0,006
0,008
0,010
I1 /I
2
w(l
og
M)
Elution volume (mL)
0
1
2
3
4
5
6
7
8
9
10
3,0 3,5 4,0 4,5 5,0 5,5 6,0
0,000
0,002
0,004
0,006
0,008
0,010
I1 / I
2
w (
log
M)
Elution volume (mL)
1
2
3
4
5
6
7
8
9
10
LP 102 LP101
3,6 3,8 4,0 4,2 4,4 4,6 4,8 5,0 5,2 5,4
0,000
0,002
0,004
0,006
0,008
0,010
I1 / I
2
w(l
og
M)
Elution volume (mL)
0
1
2
3
4
5
6
7
8
9
10
2,5 3,0 3,5 4,0 4,5 5,0 5,5 6,0
0,000
0,002
0,004
0,006
0,008
0,010
I1 / I
2
w (
log
M)
Elution volume (mL)
1
2
3
4
5
6
7
8
9
10
LP 099 LP 103
Figure 4.16: Chromatogram (black curve) and peak ratio (red squares) from SEC-FTIR of the
MBCs LP 102, 099, 101 and 103 stationary phase: PSS SDV 103, 10
5 Å (each 300 x 8 mm I.D.),
mobile phase: CHCl3, flow rate: 1 mL/min, detection: RI
Fig. 4.16 shows the chromatogram (black curve) together with the variation in relative
FTIR peak intensities, which correspond to the variation in the chemical composition
(red squares) for different MBCs. Since I1/I2 is proportional to the PPDO content, the
decrease in I1/I2 with increasing elution volume indicates a decrease in PPDO
content as molar mass decreases. Obviously, this indicates that the MBCs samples
contain species of very different molar masses. The SEC-FTIR results clearly
revealed differences in chemical composition of the samples. However, from the
given data, it is not possible to answer the question whether the two chemical
structures (PPDO and PCL) are combined to yield a copolymer with varying
composition or whether blends of the two MBPs (PPDO-MBP and PCL-MBP), having
different MMD (or to be more precise different hydrodynamic volume distributions),

PhD Thesis
Habib-Patrick-Richard-Yoba-N’goma
44
exist. The reason is that SEC separates by molecular size and not by chemical
composition. Thus, in order to get more precise information on chemical composition
distribution (CCD) a separation according the chemical composition was required.
Such separations can be achieved by gradient high performance liquid
chromatography (HPLC) or liquid chromatography at critical conditions (LCCC).
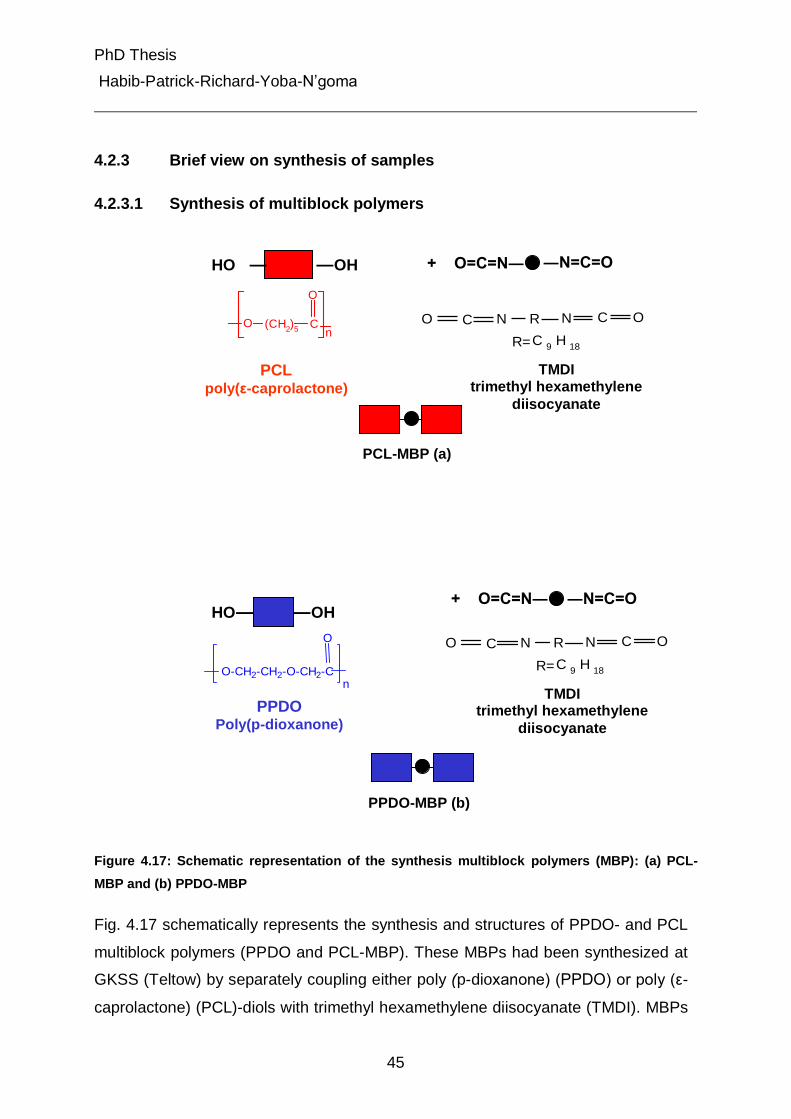
PhD Thesis
Habib-Patrick-Richard-Yoba-N’goma
45
4.2.3 Brief view on synthesis of samples
4.2.3.1 Synthesis of multiblock polymers
Figure 4.17: Schematic representation of the synthesis multiblock polymers (MBP): (a) PCL-
MBP and (b) PPDO-MBP
Fig. 4.17 schematically represents the synthesis and structures of PPDO- and PCL
multiblock polymers (PPDO and PCL-MBP). These MBPs had been synthesized at
GKSS (Teltow) by separately coupling either poly (p-dioxanone) (PPDO) or poly (ε-
caprolactone) (PCL)-diols with trimethyl hexamethylene diisocyanate (TMDI). MBPs
O C N R N C O
R=C 9 H
18
TMDI trimethyl hexamethylene
diisocyanate
PCL poly(ε-caprolactone)
―OH HO ―
―N=C=O +
+ O=C=N―
PCL-MBP (a)
O (CH2)5
Cn
O
O C N R N C O
R=C 9 H
18
―N=C=O +
+ O=C=N―
TMDI trimethyl hexamethylene
diisocyanate
PPDO Poly(p-dioxanone)
HO― ―OH
PPDO-MBP (b)
O-CH2-CH2-O-CH2-C
O
n
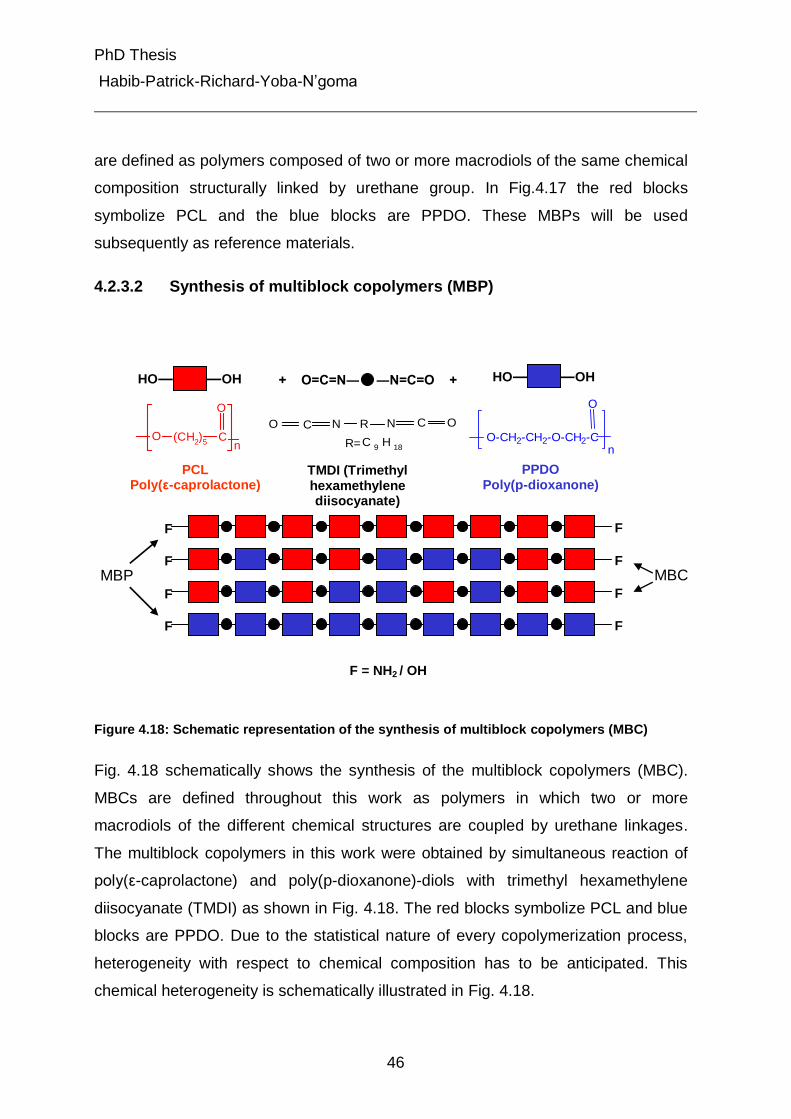
PhD Thesis
Habib-Patrick-Richard-Yoba-N’goma
46
are defined as polymers composed of two or more macrodiols of the same chemical
composition structurally linked by urethane group. In Fig.4.17 the red blocks
symbolize PCL and the blue blocks are PPDO. These MBPs will be used
subsequently as reference materials.
4.2.3.2 Synthesis of multiblock copolymers (MBP)
Figure 4.18: Schematic representation of the synthesis of multiblock copolymers (MBC)
Fig. 4.18 schematically shows the synthesis of the multiblock copolymers (MBC).
MBCs are defined throughout this work as polymers in which two or more
macrodiols of the different chemical structures are coupled by urethane linkages.
The multiblock copolymers in this work were obtained by simultaneous reaction of
poly(ε-caprolactone) and poly(p-dioxanone)-diols with trimethyl hexamethylene
diisocyanate (TMDI) as shown in Fig. 4.18. The red blocks symbolize PCL and blue
blocks are PPDO. Due to the statistical nature of every copolymerization process,
heterogeneity with respect to chemical composition has to be anticipated. This
chemical heterogeneity is schematically illustrated in Fig. 4.18.
―N=C=O + + O=C=N―
O C N R N C O
R=C 9 H
18
TMDI (Trimethyl hexamethylene diisocyanate)
O (CH2)5
Cn
O
PCL Poly(ε-caprolactone)
―OH HO―
PPDO Poly(p-dioxanone)
HO― ―OH
F = NH2 / OH
F
F
F
F
F
F
F F
MBP MBC
O-CH2-CH2-O-CH2-C
O
n
PhD Thesis
Habib-Patrick-Richard-Yoba-N’goma
47
The chemical composition distribution of the formed multiblock copolymers might
have an influence on microscopic properties of the materials. Therefore, the
chemical composition distribution of the synthesized multiblock copolymers needs
to be examined. Up to now, suitable methods have not yet been commented in the
literature for the materials under investigation. Hence, suitable chromatography
methods needed to be developed.
4.3 Separation of MBCs by chemical composition distribution using
gradient HPLC
The following section is aimed to provide the detailed chromatographic
characterization methods for the PPDO-PCL-MBCs. It will be explained step by step
how the method development was conducted and how the results have been
achieved.
4.3.1 Polymers solubility test
In order to perform liquid chromatography experiments, first at least two different
solvents had to be found, in which the two polyester polyols as well as the resulting
MBPs and MBCs are completely soluble. Besides solubilizing the different polymers
one of the solvents should provide the complete adsorption on the stationary phase
while the other should be able to cause the complete desorption from the stationary
phase. Therefore, a solvent screening for the different polymers was performed.
1mg of polymer was weighed into a 1.5 mL vial and 1mL of solvent was added. Two
samples for each polymer were prepared. One was left for about 1-2 hours at room
temperature while the other sample was heated to 50°C for about 30 min.
Afterwards, the solutions were gently shaken and visually inspected in order to
determine whether or not the polymer has fully dissolved. The results for the
different polymers in different solvents are given in Table 4.3.
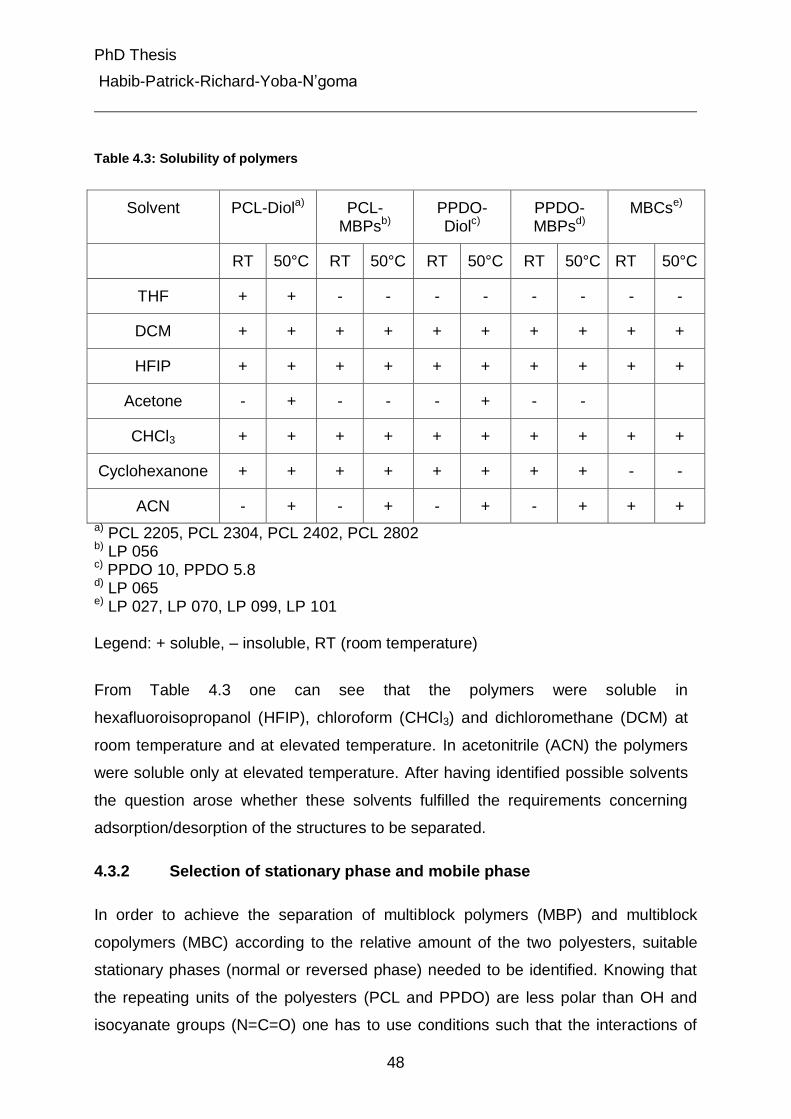
PhD Thesis
Habib-Patrick-Richard-Yoba-N’goma
48
Table 4.3: Solubility of polymers
Solvent PCL-Diola) PCL-MBPsb)
PPDO-Diolc)
PPDO- MBPsd)
MBCse)
RT 50°C RT 50°C RT 50°C RT 50°C RT 50°C
THF + + - - - - - - - -
DCM + + + + + + + + + +
HFIP + + + + + + + + + +
Acetone - + - - - + - -
CHCl3 + + + + + + + + + +
Cyclohexanone + + + + + + + + - -
ACN - + - + - + - + + +
a) PCL 2205, PCL 2304, PCL 2402, PCL 2802 b) LP 056 c) PPDO 10, PPDO 5.8 d) LP 065 e) LP 027, LP 070, LP 099, LP 101 Legend: + soluble, – insoluble, RT (room temperature)
From Table 4.3 one can see that the polymers were soluble in
hexafluoroisopropanol (HFIP), chloroform (CHCl3) and dichloromethane (DCM) at
room temperature and at elevated temperature. In acetonitrile (ACN) the polymers
were soluble only at elevated temperature. After having identified possible solvents
the question arose whether these solvents fulfilled the requirements concerning
adsorption/desorption of the structures to be separated.
4.3.2 Selection of stationary phase and mobile phase
In order to achieve the separation of multiblock polymers (MBP) and multiblock
copolymers (MBC) according to the relative amount of the two polyesters, suitable
stationary phases (normal or reversed phase) needed to be identified. Knowing that
the repeating units of the polyesters (PCL and PPDO) are less polar than OH and
isocyanate groups (N=C=O) one has to use conditions such that the interactions of
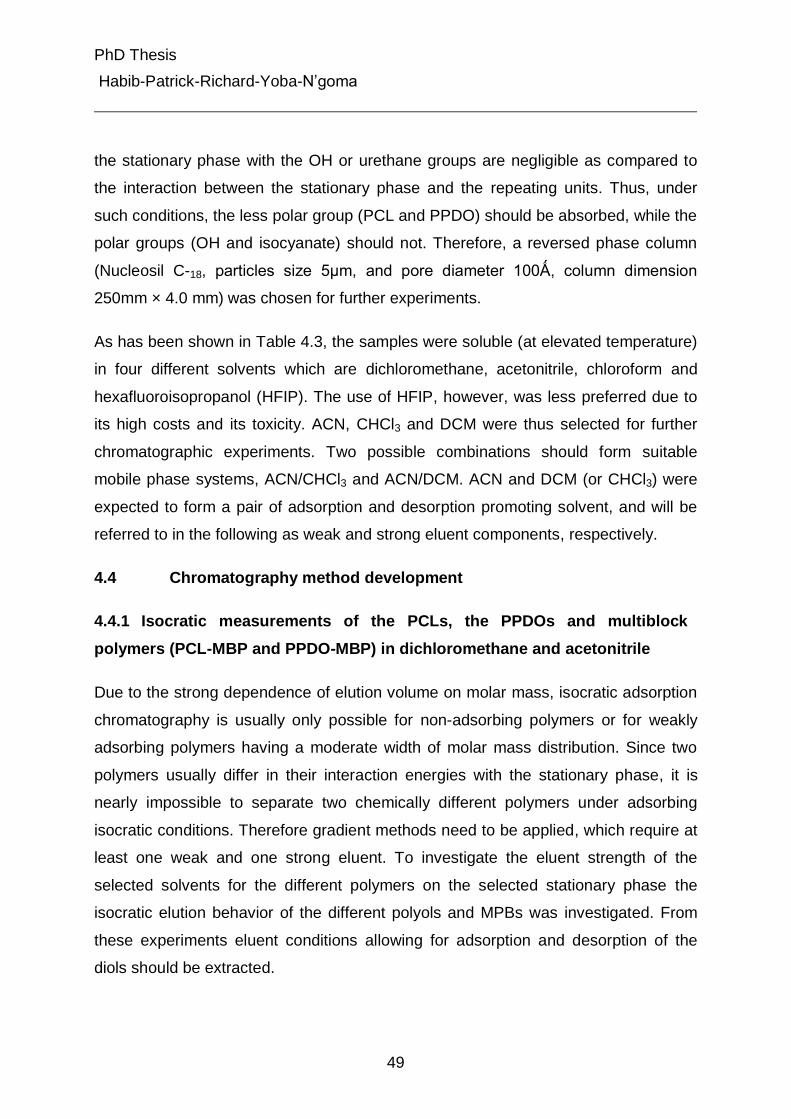
PhD Thesis
Habib-Patrick-Richard-Yoba-N’goma
49
the stationary phase with the OH or urethane groups are negligible as compared to
the interaction between the stationary phase and the repeating units. Thus, under
such conditions, the less polar group (PCL and PPDO) should be absorbed, while the
polar groups (OH and isocyanate) should not. Therefore, a reversed phase column
(Nucleosil C-18, particles size 5µm, and pore diameter 100Ǻ, column dimension
250mm × 4.0 mm) was chosen for further experiments.
As has been shown in Table 4.3, the samples were soluble (at elevated temperature)
in four different solvents which are dichloromethane, acetonitrile, chloroform and
hexafluoroisopropanol (HFIP). The use of HFIP, however, was less preferred due to
its high costs and its toxicity. ACN, CHCl3 and DCM were thus selected for further
chromatographic experiments. Two possible combinations should form suitable
mobile phase systems, ACN/CHCl3 and ACN/DCM. ACN and DCM (or CHCl3) were
expected to form a pair of adsorption and desorption promoting solvent, and will be
referred to in the following as weak and strong eluent components, respectively.
4.4 Chromatography method development
4.4.1 Isocratic measurements of the PCLs, the PPDOs and multiblock
polymers (PCL-MBP and PPDO-MBP) in dichloromethane and acetonitrile
Due to the strong dependence of elution volume on molar mass, isocratic adsorption
chromatography is usually only possible for non-adsorbing polymers or for weakly
adsorbing polymers having a moderate width of molar mass distribution. Since two
polymers usually differ in their interaction energies with the stationary phase, it is
nearly impossible to separate two chemically different polymers under adsorbing
isocratic conditions. Therefore gradient methods need to be applied, which require at
least one weak and one strong eluent. To investigate the eluent strength of the
selected solvents for the different polymers on the selected stationary phase the
isocratic elution behavior of the different polyols and MPBs was investigated. From
these experiments eluent conditions allowing for adsorption and desorption of the
diols should be extracted.
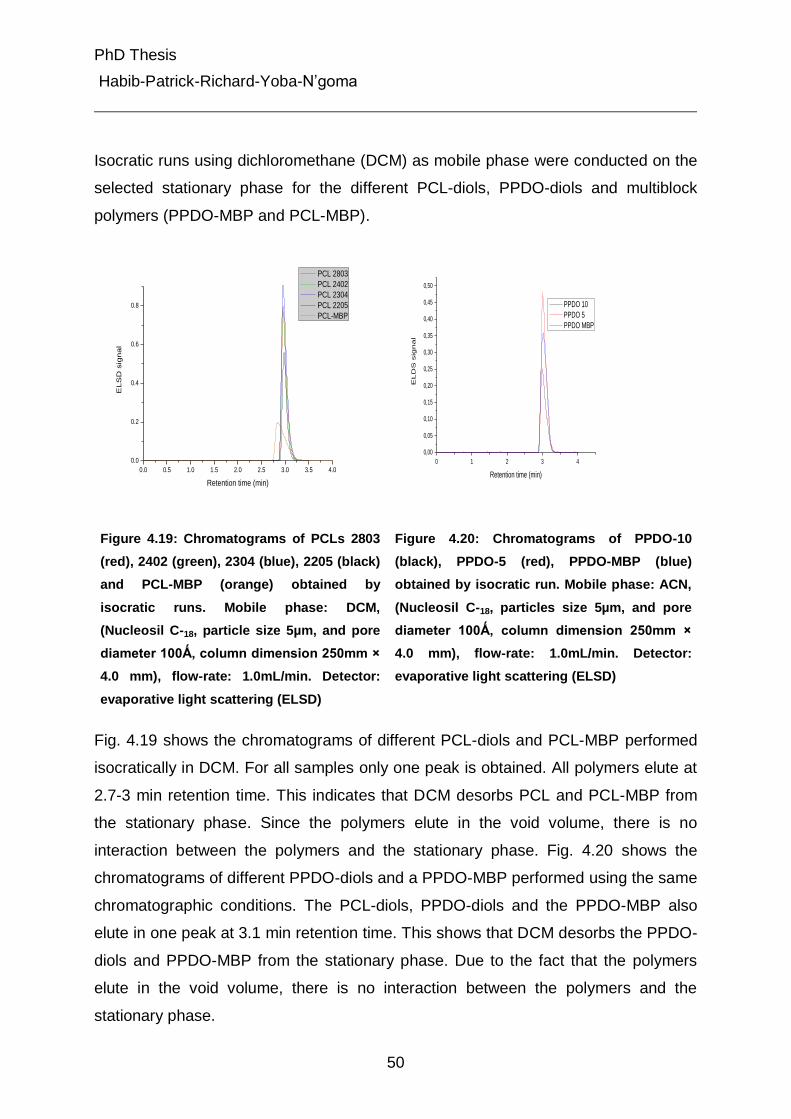
PhD Thesis
Habib-Patrick-Richard-Yoba-N’goma
50
Isocratic runs using dichloromethane (DCM) as mobile phase were conducted on the
selected stationary phase for the different PCL-diols, PPDO-diols and multiblock
polymers (PPDO-MBP and PCL-MBP).
0.0 0.5 1.0 1.5 2.0 2.5 3.0 3.5 4.0
0.0
0.2
0.4
0.6
0.8
ELS
D s
ign
al
Retention time (min)
PCL 2803
PCL 2402
PCL 2304
PCL 2205
PCL-MBP
0 1 2 3 4
0,00
0,05
0,10
0,15
0,20
0,25
0,30
0,35
0,40
0,45
0,50
EL
DS
sig
na
l
Retention time (min)
PPDO 10
PPDO 5
PPDO MBP
Figure 4.19: Chromatograms of PCLs 2803
(red), 2402 (green), 2304 (blue), 2205 (black)
and PCL-MBP (orange) obtained by
isocratic runs. Mobile phase: DCM,
(Nucleosil C-18, particle size 5µm, and pore
diameter 100Ǻ, column dimension 250mm ×
4.0 mm), flow-rate: 1.0mL/min. Detector:
evaporative light scattering (ELSD)
Figure 4.20: Chromatograms of PPDO-10
(black), PPDO-5 (red), PPDO-MBP (blue)
obtained by isocratic run. Mobile phase: ACN,
(Nucleosil C-18, particles size 5µm, and pore
diameter 100Ǻ, column dimension 250mm ×
4.0 mm), flow-rate: 1.0mL/min. Detector:
evaporative light scattering (ELSD)
Fig. 4.19 shows the chromatograms of different PCL-diols and PCL-MBP performed
isocratically in DCM. For all samples only one peak is obtained. All polymers elute at
2.7-3 min retention time. This indicates that DCM desorbs PCL and PCL-MBP from
the stationary phase. Since the polymers elute in the void volume, there is no
interaction between the polymers and the stationary phase. Fig. 4.20 shows the
chromatograms of different PPDO-diols and a PPDO-MBP performed using the same
chromatographic conditions. The PCL-diols, PPDO-diols and the PPDO-MBP also
elute in one peak at 3.1 min retention time. This shows that DCM desorbs the PPDO-
diols and PPDO-MBP from the stationary phase. Due to the fact that the polymers
elute in the void volume, there is no interaction between the polymers and the
stationary phase.
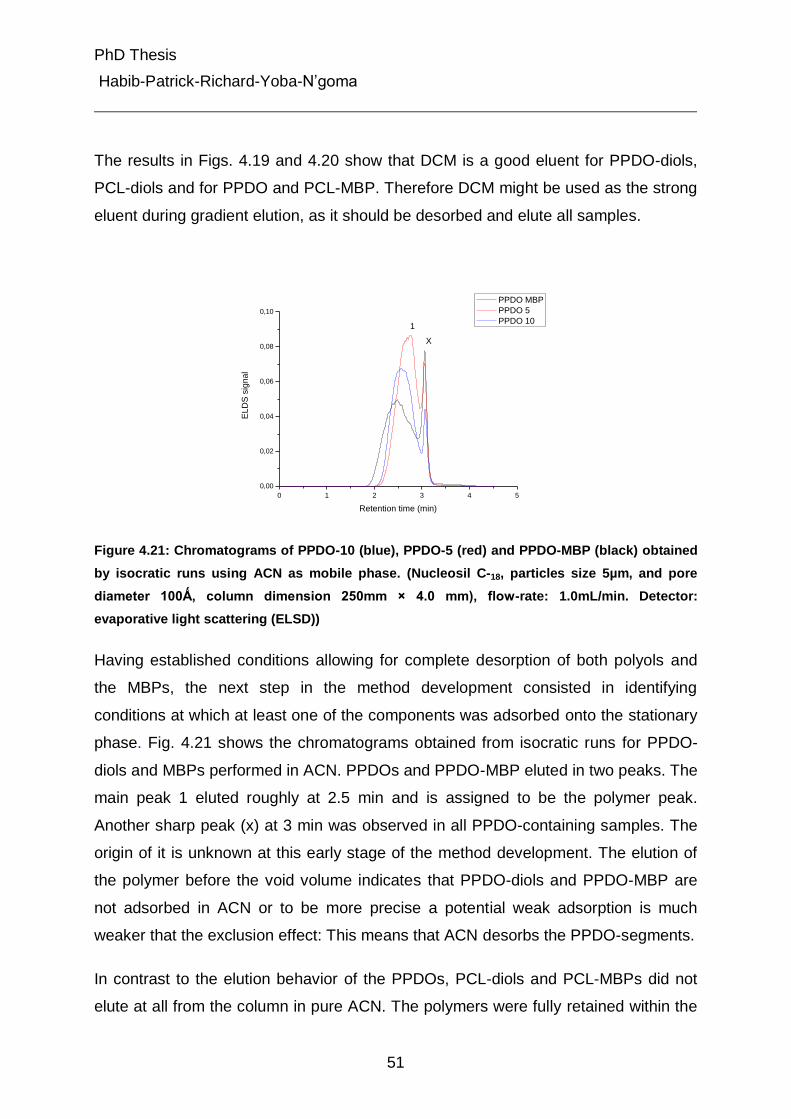
PhD Thesis
Habib-Patrick-Richard-Yoba-N’goma
51
The results in Figs. 4.19 and 4.20 show that DCM is a good eluent for PPDO-diols,
PCL-diols and for PPDO and PCL-MBP. Therefore DCM might be used as the strong
eluent during gradient elution, as it should be desorbed and elute all samples.
0 1 2 3 4 5
0,00
0,02
0,04
0,06
0,08
0,10
EL
DS
sig
na
l
Retention time (min)
PPDO MBP
PPDO 5
PPDO 101
X
Figure 4.21: Chromatograms of PPDO-10 (blue), PPDO-5 (red) and PPDO-MBP (black) obtained
by isocratic runs using ACN as mobile phase. (Nucleosil C-18, particles size 5µm, and pore
diameter 100Ǻ, column dimension 250mm × 4.0 mm), flow-rate: 1.0mL/min. Detector:
evaporative light scattering (ELSD))
Having established conditions allowing for complete desorption of both polyols and
the MBPs, the next step in the method development consisted in identifying
conditions at which at least one of the components was adsorbed onto the stationary
phase. Fig. 4.21 shows the chromatograms obtained from isocratic runs for PPDO-
diols and MBPs performed in ACN. PPDOs and PPDO-MBP eluted in two peaks. The
main peak 1 eluted roughly at 2.5 min and is assigned to be the polymer peak.
Another sharp peak (x) at 3 min was observed in all PPDO-containing samples. The
origin of it is unknown at this early stage of the method development. The elution of
the polymer before the void volume indicates that PPDO-diols and PPDO-MBP are
not adsorbed in ACN or to be more precise a potential weak adsorption is much
weaker that the exclusion effect: This means that ACN desorbs the PPDO-segments.
In contrast to the elution behavior of the PPDOs, PCL-diols and PCL-MBPs did not
elute at all from the column in pure ACN. The polymers were fully retained within the
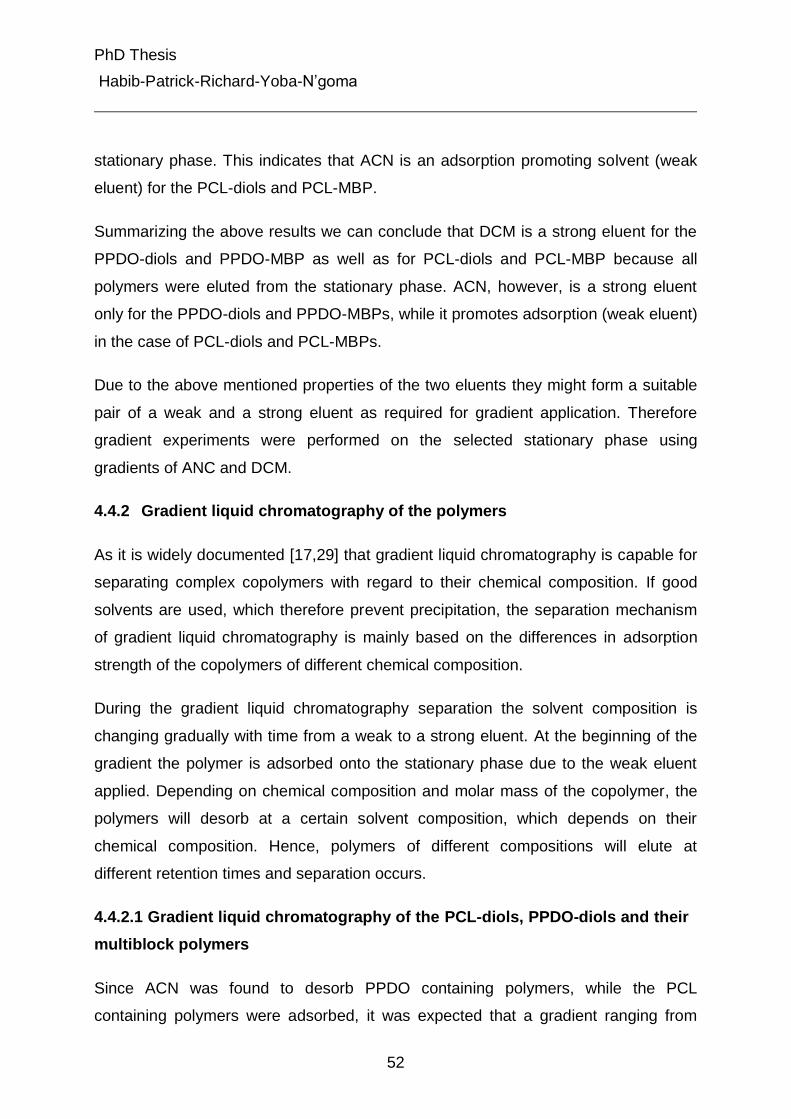
PhD Thesis
Habib-Patrick-Richard-Yoba-N’goma
52
stationary phase. This indicates that ACN is an adsorption promoting solvent (weak
eluent) for the PCL-diols and PCL-MBP.
Summarizing the above results we can conclude that DCM is a strong eluent for the
PPDO-diols and PPDO-MBP as well as for PCL-diols and PCL-MBP because all
polymers were eluted from the stationary phase. ACN, however, is a strong eluent
only for the PPDO-diols and PPDO-MBPs, while it promotes adsorption (weak eluent)
in the case of PCL-diols and PCL-MBPs.
Due to the above mentioned properties of the two eluents they might form a suitable
pair of a weak and a strong eluent as required for gradient application. Therefore
gradient experiments were performed on the selected stationary phase using
gradients of ANC and DCM.
4.4.2 Gradient liquid chromatography of the polymers
As it is widely documented [17,29] that gradient liquid chromatography is capable for
separating complex copolymers with regard to their chemical composition. If good
solvents are used, which therefore prevent precipitation, the separation mechanism
of gradient liquid chromatography is mainly based on the differences in adsorption
strength of the copolymers of different chemical composition.
During the gradient liquid chromatography separation the solvent composition is
changing gradually with time from a weak to a strong eluent. At the beginning of the
gradient the polymer is adsorbed onto the stationary phase due to the weak eluent
applied. Depending on chemical composition and molar mass of the copolymer, the
polymers will desorb at a certain solvent composition, which depends on their
chemical composition. Hence, polymers of different compositions will elute at
different retention times and separation occurs.
4.4.2.1 Gradient liquid chromatography of the PCL-diols, PPDO-diols and their
multiblock polymers
Since ACN was found to desorb PPDO containing polymers, while the PCL
containing polymers were adsorbed, it was expected that a gradient ranging from
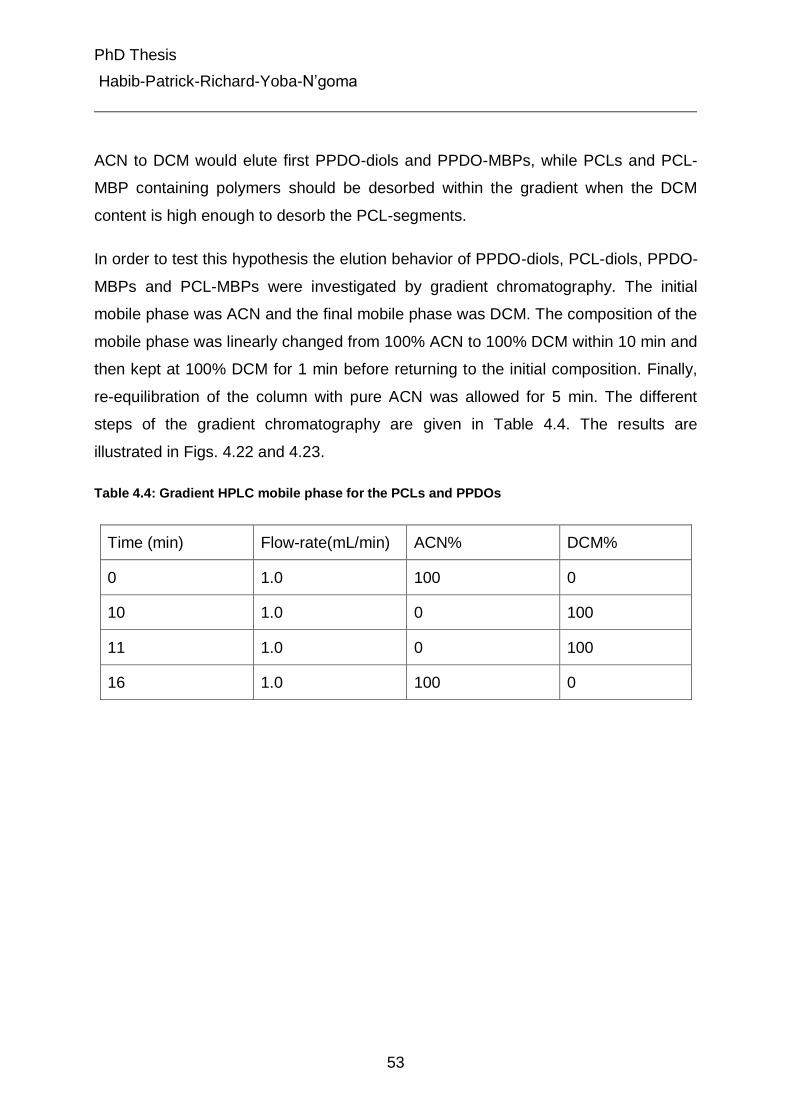
PhD Thesis
Habib-Patrick-Richard-Yoba-N’goma
53
ACN to DCM would elute first PPDO-diols and PPDO-MBPs, while PCLs and PCL-
MBP containing polymers should be desorbed within the gradient when the DCM
content is high enough to desorb the PCL-segments.
In order to test this hypothesis the elution behavior of PPDO-diols, PCL-diols, PPDO-
MBPs and PCL-MBPs were investigated by gradient chromatography. The initial
mobile phase was ACN and the final mobile phase was DCM. The composition of the
mobile phase was linearly changed from 100% ACN to 100% DCM within 10 min and
then kept at 100% DCM for 1 min before returning to the initial composition. Finally,
re-equilibration of the column with pure ACN was allowed for 5 min. The different
steps of the gradient chromatography are given in Table 4.4. The results are
illustrated in Figs. 4.22 and 4.23.
Table 4.4: Gradient HPLC mobile phase for the PCLs and PPDOs
Time (min) Flow-rate(mL/min) ACN% DCM%
0 1.0 100 0
10 1.0 0 100
11 1.0 0 100
16 1.0 100 0
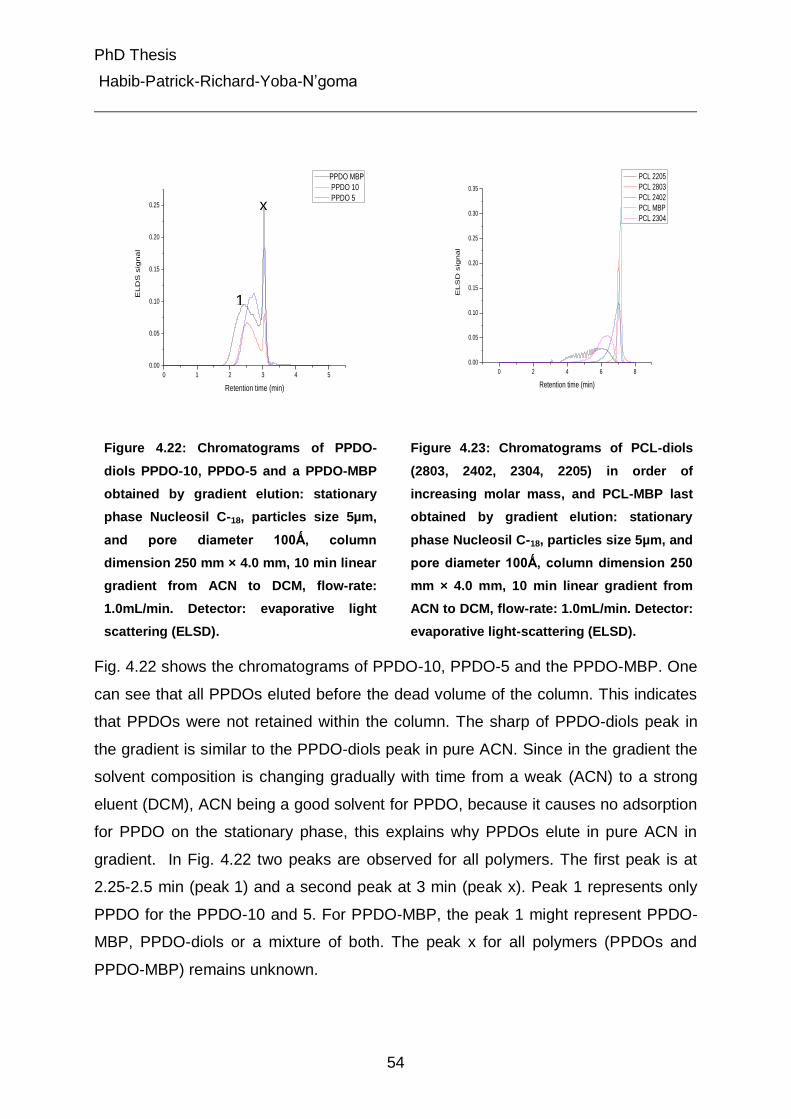
PhD Thesis
Habib-Patrick-Richard-Yoba-N’goma
54
0 1 2 3 4 5
0.00
0.05
0.10
0.15
0.20
0.25
EL
DS
sig
na
l
Retention time (min)
PPDO MBP
PPDO 10
PPDO 5
0 2 4 6 8
0.00
0.05
0.10
0.15
0.20
0.25
0.30
0.35
EL
SD
sig
na
l
Retention time (min)
PCL 2205
PCL 2803
PCL 2402
PCL MBP
PCL 2304
Figure 4.22: Chromatograms of PPDO-
diols PPDO-10, PPDO-5 and a PPDO-MBP
obtained by gradient elution: stationary
phase Nucleosil C-18, particles size 5µm,
and pore diameter 100Ǻ, column
dimension 250 mm × 4.0 mm, 10 min linear
gradient from ACN to DCM, flow-rate:
1.0mL/min. Detector: evaporative light
scattering (ELSD).
Figure 4.23: Chromatograms of PCL-diols
(2803, 2402, 2304, 2205) in order of
increasing molar mass, and PCL-MBP last
obtained by gradient elution: stationary
phase Nucleosil C-18, particles size 5µm, and
pore diameter 100Ǻ, column dimension 250
mm × 4.0 mm, 10 min linear gradient from
ACN to DCM, flow-rate: 1.0mL/min. Detector:
evaporative light-scattering (ELSD).
Fig. 4.22 shows the chromatograms of PPDO-10, PPDO-5 and the PPDO-MBP. One
can see that all PPDOs eluted before the dead volume of the column. This indicates
that PPDOs were not retained within the column. The sharp of PPDO-diols peak in
the gradient is similar to the PPDO-diols peak in pure ACN. Since in the gradient the
solvent composition is changing gradually with time from a weak (ACN) to a strong
eluent (DCM), ACN being a good solvent for PPDO, because it causes no adsorption
for PPDO on the stationary phase, this explains why PPDOs elute in pure ACN in
gradient. In Fig. 4.22 two peaks are observed for all polymers. The first peak is at
2.25-2.5 min (peak 1) and a second peak at 3 min (peak x). Peak 1 represents only
PPDO for the PPDO-10 and 5. For PPDO-MBP, the peak 1 might represent PPDO-
MBP, PPDO-diols or a mixture of both. The peak x for all polymers (PPDOs and
PPDO-MBP) remains unknown.
1
x
PhD Thesis
Habib-Patrick-Richard-Yoba-N’goma
55
Fig. 4.23 shows the chromatograms of PCL-diols and PCL-MBP. Contrary to the
PPDO-diols and PPDO-MBPs, the PCL-diols and PCL-MBP elute within the gradient.
This can be ascribed to the fact that the PCL-diols and PCL-MBP are absorbed at the
initial mobile phase composition onto the stationary phase and were desorbed as the
eluent reaches a sufficient solvent strength due to the addition of the DCM. The lower
molar mass samples of the PCL-diols show series of peaks which are most probably
separated oligomers of different degrees of polymerization. With higher (average)
molar mass the samples elute later and the peaks become narrower. This can be
attributed to the typical elution behavior of homopolymers. The typical elution
behaviour of homopolymers was explained in chapter 3.
Furthermore, the effects of urethane linkages and the end groups existing in the
MBPs were examined. One can see that in Figs. 4.22 and 4.23 that PPDO-MBPs
elute similar to PPDO-diols in pure ACN and while PCL-MBP elutes similar to PCL-
diols within the gradient. The end groups do not contribute to the retention of the
polymers.
From the above results two conclusions can be drawn:
In the same gradient conditions PPDO- and PCL-diols show completely
different chromatographic behavior in terms of retention time. PPDO-diols
elute before the gradient while PCL-diols elute within the gradient. As a
result, a separation according to the chemical composition might be possible
by gradient chromatography.
Under the chromatographic conditions given, PPDO-MBPs elute in the same
range as PPDO-diols before the gradient i.e. without any retention in pure
ACN. PCL-MBPs elute within the gradient in the same retention range as
PCL-diols of high molar mass. Therefore, it is clear to state that the retention
of the polymers is governed by the polyester components and the effects of
the urethane linkage and functional end groups present on the MBPs are
negligible.
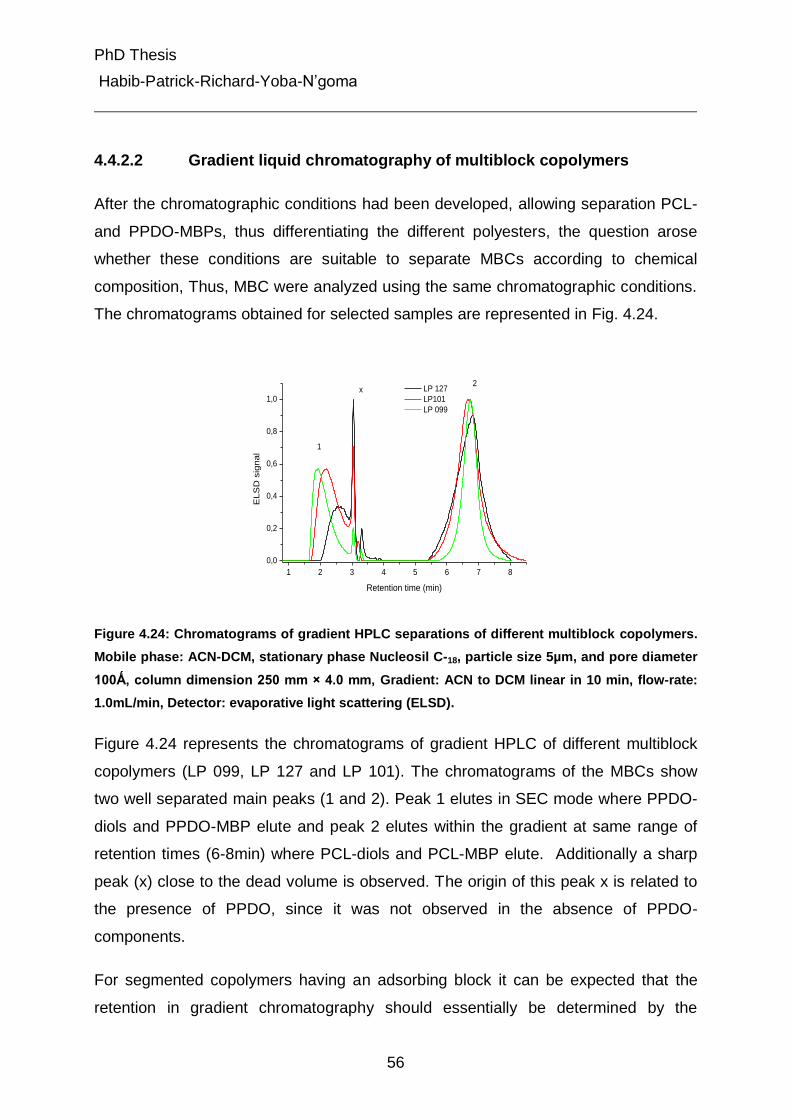
PhD Thesis
Habib-Patrick-Richard-Yoba-N’goma
56
4.4.2.2 Gradient liquid chromatography of multiblock copolymers
After the chromatographic conditions had been developed, allowing separation PCL-
and PPDO-MBPs, thus differentiating the different polyesters, the question arose
whether these conditions are suitable to separate MBCs according to chemical
composition, Thus, MBC were analyzed using the same chromatographic conditions.
The chromatograms obtained for selected samples are represented in Fig. 4.24.
1 2 3 4 5 6 7 8
0,0
0,2
0,4
0,6
0,8
1,0
LP 127
LP101
LP 099
EL
SD
sig
na
l
Retention time (min)
1
2x
Figure 4.24: Chromatograms of gradient HPLC separations of different multiblock copolymers.
Mobile phase: ACN-DCM, stationary phase Nucleosil C-18, particle size 5µm, and pore diameter
100Ǻ, column dimension 250 mm × 4.0 mm, Gradient: ACN to DCM linear in 10 min, flow-rate:
1.0mL/min, Detector: evaporative light scattering (ELSD).
Figure 4.24 represents the chromatograms of gradient HPLC of different multiblock
copolymers (LP 099, LP 127 and LP 101). The chromatograms of the MBCs show
two well separated main peaks (1 and 2). Peak 1 elutes in SEC mode where PPDO-
diols and PPDO-MBP elute and peak 2 elutes within the gradient at same range of
retention times (6-8min) where PCL-diols and PCL-MBP elute. Additionally a sharp
peak (x) close to the dead volume is observed. The origin of this peak x is related to
the presence of PPDO, since it was not observed in the absence of PPDO-
components.
For segmented copolymers having an adsorbing block it can be expected that the
retention in gradient chromatography should essentially be determined by the
PhD Thesis
Habib-Patrick-Richard-Yoba-N’goma
57
adsorbing block, here the PCL. The PCL and the block copolymers should elute in
two distinct peaks. This is because the block copolymers being made of part of
PPDO-PCL should adsorb less than pure PCL. As a result, the block copolymer
should elute before the pure PCL component. Unfortunately, this is not the case in
Fig. 4.24 where only one peak elutes within the gradient. Therefore, based solely on
the chromatographic behavior, it is difficult to say whether peak 2 contains the block
copolymers or not.
From the above results it appears as if the MBCs contain a significant amount of
PPDO-diols and/or PPDO-MBP
4.4.3 Liquid chromatography under critical conditions for PCL
In order to clarify whether the block copolymers and PCL-MBP or PCL-diols co-elute
within peak 2 of the gradient chromatography, chromatography under critical
conditions for PCL was applied. At critical conditions (LCCC) of one block, the block
is “chromatographically invisible”, i.e. its molar mass does not influence the retention.
And the retention of the diblock copolymer is solely determined by the other visible
block [17, 21-23, 29, 50-51]. Despite the controversy as to the precision of the
method, there is a consensus that LCCC can estimate individual block length
copolymers reasonably [52-54].
For two component tribolck copolymers, there can exist another variation in chain
architecture, i.e., ABA or BAB type. If they have similar molar mass and composition,
can we distinguish them by chromatography? Different possibility can be discussed
about the influence of polymer architecture on the LCCC retention behavior of AB,
ABA and BAB type block copolymers. Under the critical conditions of B block,
retention of AB and BAB follows the normal LCCC behavior, and one can measure
the molar mass of A block by LCCC while the elution behavior of ABA depends on
the relative size of B block [22, 53, 55-57]. If block B length were long, LCCC analysis
would not provide the correct molar mass of 2A [50-51].
PhD Thesis
Habib-Patrick-Richard-Yoba-N’goma
58
Aiming to perform the separation according to the chemical composition of the
components, a reversed phase (Nucleosil , particles size 5µm, and pore diameter
100Ǻ, column dimension 250mm × 4.0 mm) column was selected where the less
polar component PPDO compare to PCL component should not be absorbed and
the polar groups (OH and isocyanate) should not play a role on the retention. After
that it was necessary to find two suitable solvents which will form the mobile phase.
As already explained above, one solvent should cause the complete adsorption of
PCL on the stationary phase and another one should promote the complete
desorption of PCL from the stationary phase. For this task DCM/ACN were selected.
Similar to the explanation on page 28 in section 4.1.1 and by using the formula 4.1
the critical composition can be estimated to be 78%/22% DCM/ACN. On the basis
of the estimated critical composition, isocratic experiments were performed at the
estimated composition of 78%/22% ACN/DCM. The results show that the higher
molar mass PCL-diols elute earlier than the lower molar mass ones. This elution
behavior indicates SEC-like elution behavior. Therefore the next experiment was
conducted at a slightly higher content of ACN. As can be seen in Fig. 4.26 LAC-like
elution order was observed, which resulted in an additional experiment performed
using an eluent composition of 76%/24% ACN/DCM and finally PCL-diols of higher
and lower molar mass elute almost at the same retention time. Accordingly, this
shows critical conditions.
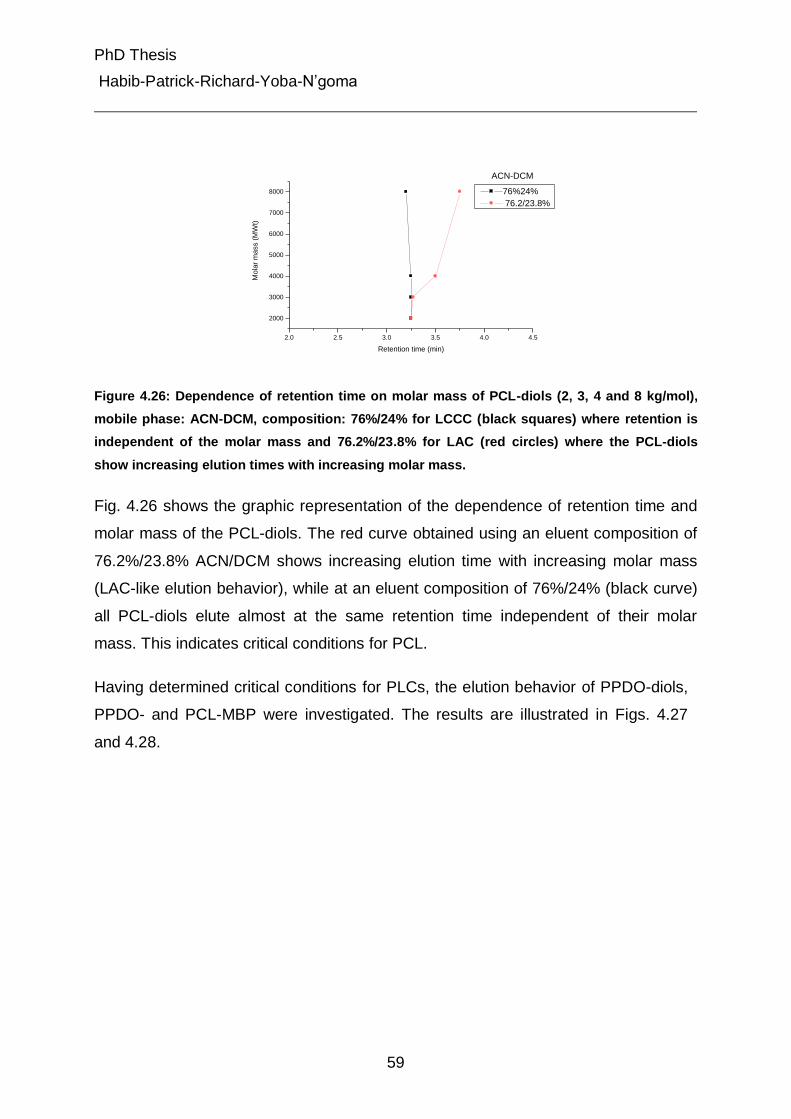
PhD Thesis
Habib-Patrick-Richard-Yoba-N’goma
59
2.0 2.5 3.0 3.5 4.0 4.5
2000
3000
4000
5000
6000
7000
8000
ACN-DCM
76%24%
76.2/23.8%
Mo
lar
ma
ss (
MW
t)
Retention time (min)
Figure 4.26: Dependence of retention time on molar mass of PCL-diols (2, 3, 4 and 8 kg/mol),
mobile phase: ACN-DCM, composition: 76%/24% for LCCC (black squares) where retention is
independent of the molar mass and 76.2%/23.8% for LAC (red circles) where the PCL-diols
show increasing elution times with increasing molar mass.
Fig. 4.26 shows the graphic representation of the dependence of retention time and
molar mass of the PCL-diols. The red curve obtained using an eluent composition of
76.2%/23.8% ACN/DCM shows increasing elution time with increasing molar mass
(LAC-like elution behavior), while at an eluent composition of 76%/24% (black curve)
all PCL-diols elute almost at the same retention time independent of their molar
mass. This indicates critical conditions for PCL.
Having determined critical conditions for PLCs, the elution behavior of PPDO-diols,
PPDO- and PCL-MBP were investigated. The results are illustrated in Figs. 4.27
and 4.28.
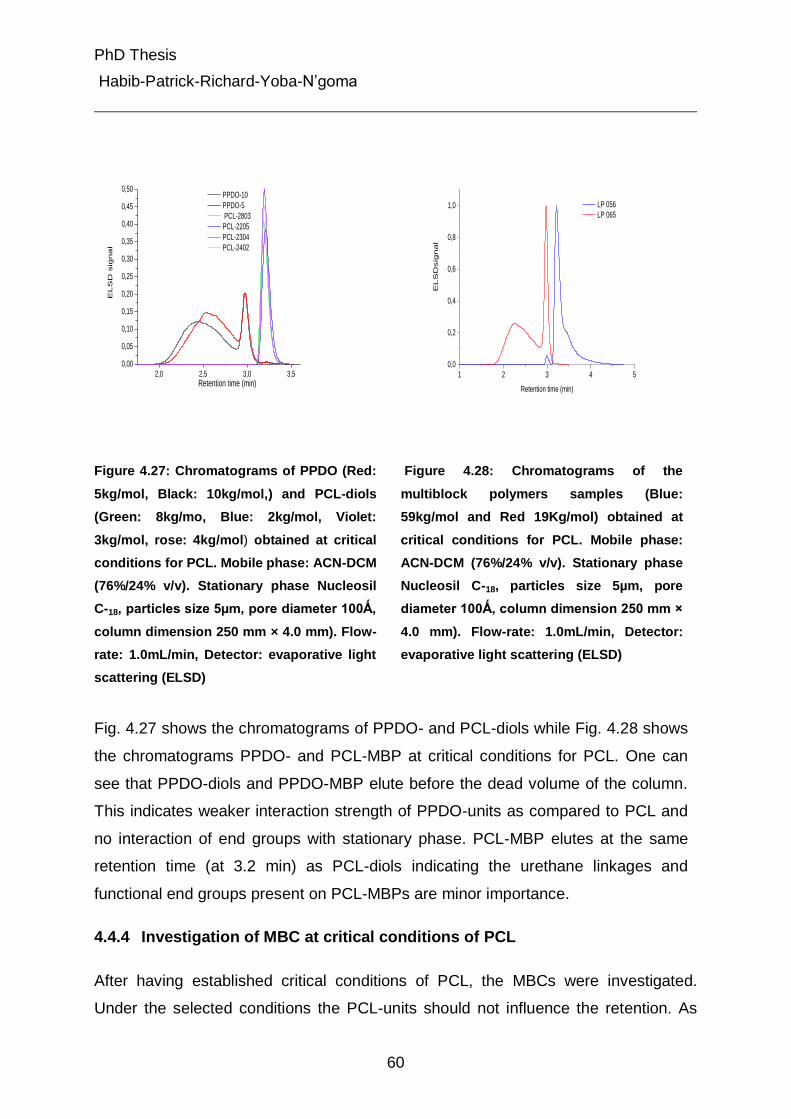
PhD Thesis
Habib-Patrick-Richard-Yoba-N’goma
60
2,0 2,5 3,0 3,5
0,00
0,05
0,10
0,15
0,20
0,25
0,30
0,35
0,40
0,45
0,50 PPDO-10
PPDO-5
PCL-2803
PCL-2205
PCL-2304
PCL-2402
ELS
D s
igna
l
Retention time (min)
1 2 3 4 5
0,0
0,2
0,4
0,6
0,8
1,0 LP 056
LP 065
EL
SD
sig
na
l
Retention time (min)
Figure 4.27: Chromatograms of PPDO (Red:
5kg/mol, Black: 10kg/mol,) and PCL-diols
(Green: 8kg/mo, Blue: 2kg/mol, Violet:
3kg/mol, rose: 4kg/mol) obtained at critical
conditions for PCL. Mobile phase: ACN-DCM
(76%/24% v/v). Stationary phase Nucleosil
C-18, particles size 5µm, pore diameter 100Ǻ,
column dimension 250 mm × 4.0 mm). Flow-
rate: 1.0mL/min, Detector: evaporative light
scattering (ELSD)
Figure 4.28: Chromatograms of the
multiblock polymers samples (Blue:
59kg/mol and Red 19Kg/mol) obtained at
critical conditions for PCL. Mobile phase:
ACN-DCM (76%/24% v/v). Stationary phase
Nucleosil C-18, particles size 5µm, pore
diameter 100Ǻ, column dimension 250 mm ×
4.0 mm). Flow-rate: 1.0mL/min, Detector:
evaporative light scattering (ELSD)
Fig. 4.27 shows the chromatograms of PPDO- and PCL-diols while Fig. 4.28 shows
the chromatograms PPDO- and PCL-MBP at critical conditions for PCL. One can
see that PPDO-diols and PPDO-MBP elute before the dead volume of the column.
This indicates weaker interaction strength of PPDO-units as compared to PCL and
no interaction of end groups with stationary phase. PCL-MBP elutes at the same
retention time (at 3.2 min) as PCL-diols indicating the urethane linkages and
functional end groups present on PCL-MBPs are minor importance.
4.4.4 Investigation of MBC at critical conditions of PCL
After having established critical conditions of PCL, the MBCs were investigated.
Under the selected conditions the PCL-units should not influence the retention. As
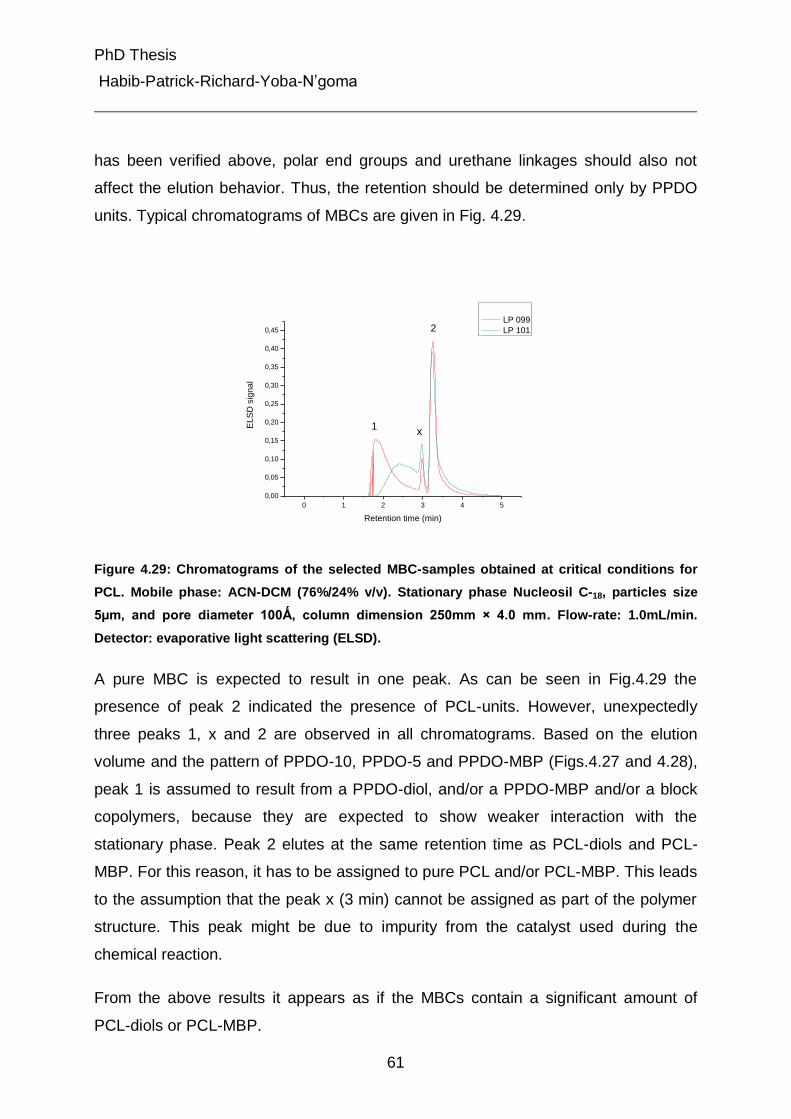
PhD Thesis
Habib-Patrick-Richard-Yoba-N’goma
61
has been verified above, polar end groups and urethane linkages should also not
affect the elution behavior. Thus, the retention should be determined only by PPDO
units. Typical chromatograms of MBCs are given in Fig. 4.29.
0 1 2 3 4 5
0,00
0,05
0,10
0,15
0,20
0,25
0,30
0,35
0,40
0,45
EL
SD
sig
na
l
Retention time (min)
LP 099
LP 101
1x
2
Figure 4.29: Chromatograms of the selected MBC-samples obtained at critical conditions for
PCL. Mobile phase: ACN-DCM (76%/24% v/v). Stationary phase Nucleosil C-18, particles size
5µm, and pore diameter 100Ǻ, column dimension 250mm × 4.0 mm. Flow-rate: 1.0mL/min.
Detector: evaporative light scattering (ELSD).
A pure MBC is expected to result in one peak. As can be seen in Fig.4.29 the
presence of peak 2 indicated the presence of PCL-units. However, unexpectedly
three peaks 1, x and 2 are observed in all chromatograms. Based on the elution
volume and the pattern of PPDO-10, PPDO-5 and PPDO-MBP (Figs.4.27 and 4.28),
peak 1 is assumed to result from a PPDO-diol, and/or a PPDO-MBP and/or a block
copolymers, because they are expected to show weaker interaction with the
stationary phase. Peak 2 elutes at the same retention time as PCL-diols and PCL-
MBP. For this reason, it has to be assigned to pure PCL and/or PCL-MBP. This leads
to the assumption that the peak x (3 min) cannot be assigned as part of the polymer
structure. This peak might be due to impurity from the catalyst used during the
chemical reaction.
From the above results it appears as if the MBCs contain a significant amount of
PCL-diols or PCL-MBP.
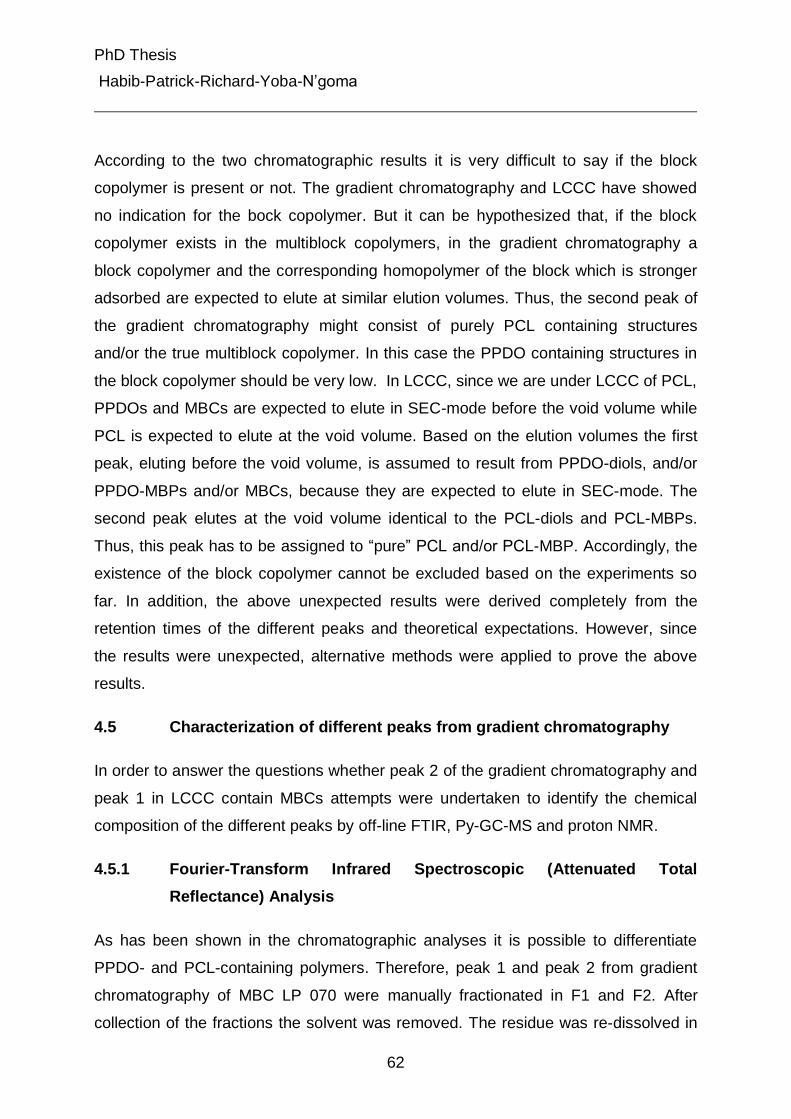
PhD Thesis
Habib-Patrick-Richard-Yoba-N’goma
62
According to the two chromatographic results it is very difficult to say if the block
copolymer is present or not. The gradient chromatography and LCCC have showed
no indication for the bock copolymer. But it can be hypothesized that, if the block
copolymer exists in the multiblock copolymers, in the gradient chromatography a
block copolymer and the corresponding homopolymer of the block which is stronger
adsorbed are expected to elute at similar elution volumes. Thus, the second peak of
the gradient chromatography might consist of purely PCL containing structures
and/or the true multiblock copolymer. In this case the PPDO containing structures in
the block copolymer should be very low. In LCCC, since we are under LCCC of PCL,
PPDOs and MBCs are expected to elute in SEC-mode before the void volume while
PCL is expected to elute at the void volume. Based on the elution volumes the first
peak, eluting before the void volume, is assumed to result from PPDO-diols, and/or
PPDO-MBPs and/or MBCs, because they are expected to elute in SEC-mode. The
second peak elutes at the void volume identical to the PCL-diols and PCL-MBPs.
Thus, this peak has to be assigned to “pure” PCL and/or PCL-MBP. Accordingly, the
existence of the block copolymer cannot be excluded based on the experiments so
far. In addition, the above unexpected results were derived completely from the
retention times of the different peaks and theoretical expectations. However, since
the results were unexpected, alternative methods were applied to prove the above
results.
4.5 Characterization of different peaks from gradient chromatography
In order to answer the questions whether peak 2 of the gradient chromatography and
peak 1 in LCCC contain MBCs attempts were undertaken to identify the chemical
composition of the different peaks by off-line FTIR, Py-GC-MS and proton NMR.
4.5.1 Fourier-Transform Infrared Spectroscopic (Attenuated Total
Reflectance) Analysis
As has been shown in the chromatographic analyses it is possible to differentiate
PPDO- and PCL-containing polymers. Therefore, peak 1 and peak 2 from gradient
chromatography of MBC LP 070 were manually fractionated in F1 and F2. After
collection of the fractions the solvent was removed. The residue was re-dissolved in
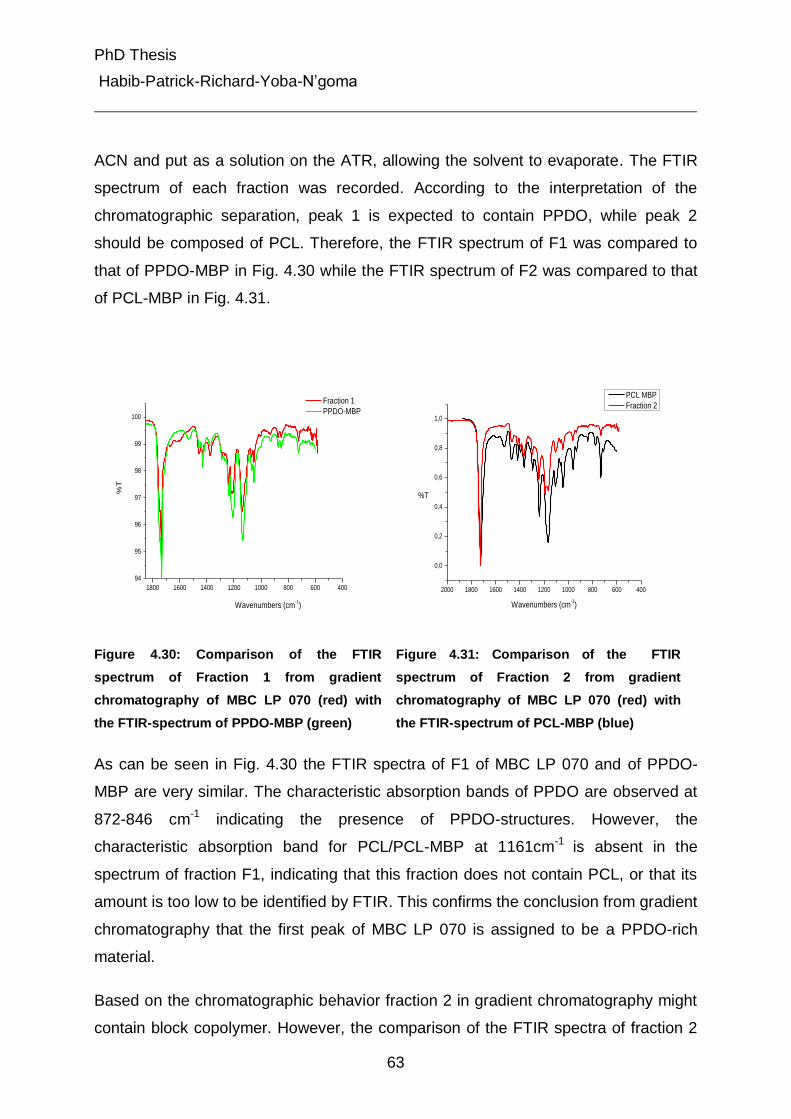
PhD Thesis
Habib-Patrick-Richard-Yoba-N’goma
63
ACN and put as a solution on the ATR, allowing the solvent to evaporate. The FTIR
spectrum of each fraction was recorded. According to the interpretation of the
chromatographic separation, peak 1 is expected to contain PPDO, while peak 2
should be composed of PCL. Therefore, the FTIR spectrum of F1 was compared to
that of PPDO-MBP in Fig. 4.30 while the FTIR spectrum of F2 was compared to that
of PCL-MBP in Fig. 4.31.
1800 1600 1400 1200 1000 800 600 400
94
95
96
97
98
99
100
Fraction 1
PPDO-MBP
%T
Wavenumbers (cm-1)
2000 1800 1600 1400 1200 1000 800 600 400
0,0
0,2
0,4
0,6
0,8
1,0
%T
Wavenumbers (cm-1)
PCL MBP
Fraction 2
Figure 4.30: Comparison of the FTIR
spectrum of Fraction 1 from gradient
chromatography of MBC LP 070 (red) with
the FTIR-spectrum of PPDO-MBP (green)
Figure 4.31: Comparison of the FTIR
spectrum of Fraction 2 from gradient
chromatography of MBC LP 070 (red) with
the FTIR-spectrum of PCL-MBP (blue)
As can be seen in Fig. 4.30 the FTIR spectra of F1 of MBC LP 070 and of PPDO-
MBP are very similar. The characteristic absorption bands of PPDO are observed at
872-846 cm-1 indicating the presence of PPDO-structures. However, the
characteristic absorption band for PCL/PCL-MBP at 1161cm-1 is absent in the
spectrum of fraction F1, indicating that this fraction does not contain PCL, or that its
amount is too low to be identified by FTIR. This confirms the conclusion from gradient
chromatography that the first peak of MBC LP 070 is assigned to be a PPDO-rich
material.
Based on the chromatographic behavior fraction 2 in gradient chromatography might
contain block copolymer. However, the comparison of the FTIR spectra of fraction 2
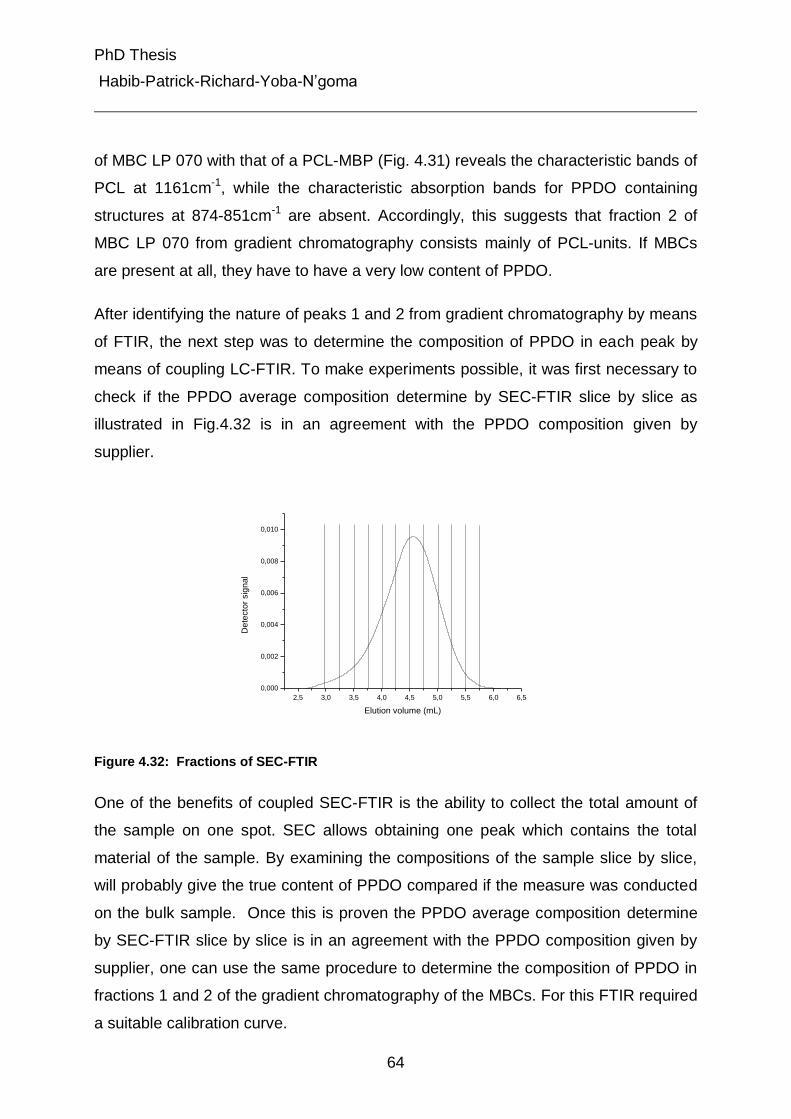
PhD Thesis
Habib-Patrick-Richard-Yoba-N’goma
64
of MBC LP 070 with that of a PCL-MBP (Fig. 4.31) reveals the characteristic bands of
PCL at 1161cm-1, while the characteristic absorption bands for PPDO containing
structures at 874-851cm-1 are absent. Accordingly, this suggests that fraction 2 of
MBC LP 070 from gradient chromatography consists mainly of PCL-units. If MBCs
are present at all, they have to have a very low content of PPDO.
After identifying the nature of peaks 1 and 2 from gradient chromatography by means
of FTIR, the next step was to determine the composition of PPDO in each peak by
means of coupling LC-FTIR. To make experiments possible, it was first necessary to
check if the PPDO average composition determine by SEC-FTIR slice by slice as
illustrated in Fig.4.32 is in an agreement with the PPDO composition given by
supplier.
2,5 3,0 3,5 4,0 4,5 5,0 5,5 6,0 6,5
0,000
0,002
0,004
0,006
0,008
0,010
De
tecto
r sig
na
l
Elution volume (mL)
Figure 4.32: Fractions of SEC-FTIR
One of the benefits of coupled SEC-FTIR is the ability to collect the total amount of
the sample on one spot. SEC allows obtaining one peak which contains the total
material of the sample. By examining the compositions of the sample slice by slice,
will probably give the true content of PPDO compared if the measure was conducted
on the bulk sample. Once this is proven the PPDO average composition determine
by SEC-FTIR slice by slice is in an agreement with the PPDO composition given by
supplier, one can use the same procedure to determine the composition of PPDO in
fractions 1 and 2 of the gradient chromatography of the MBCs. For this FTIR required
a suitable calibration curve.
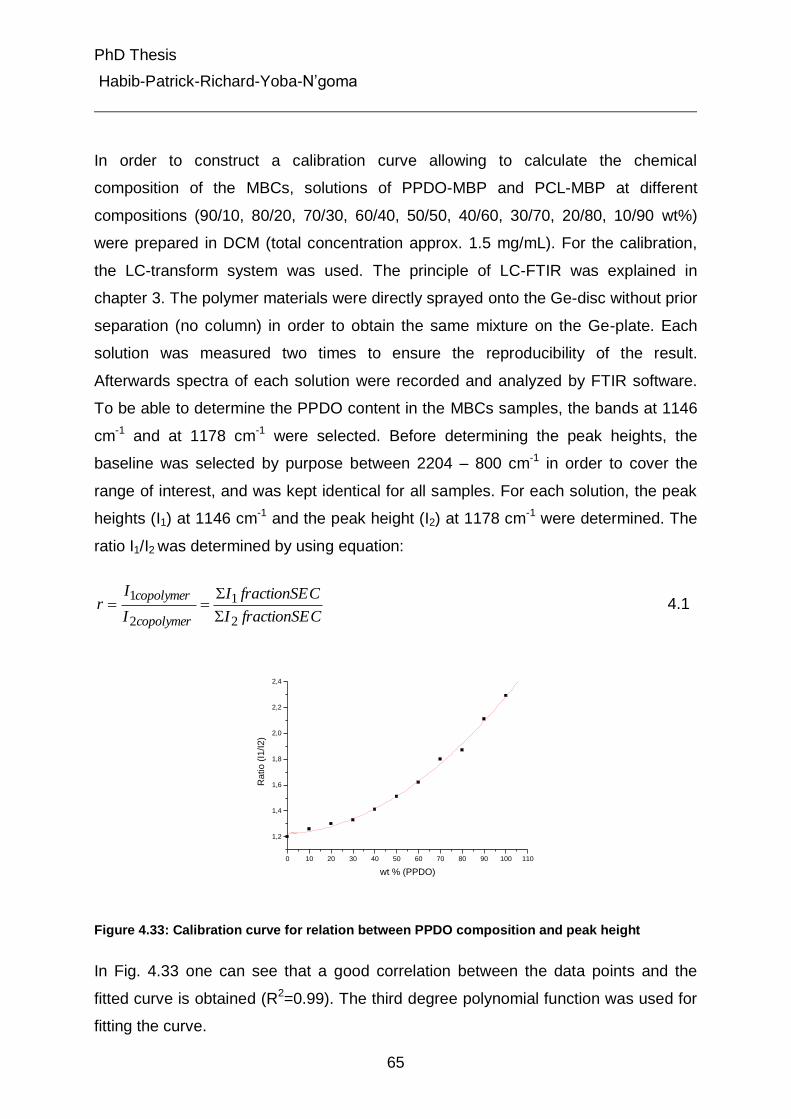
PhD Thesis
Habib-Patrick-Richard-Yoba-N’goma
65
In order to construct a calibration curve allowing to calculate the chemical
composition of the MBCs, solutions of PPDO-MBP and PCL-MBP at different
compositions (90/10, 80/20, 70/30, 60/40, 50/50, 40/60, 30/70, 20/80, 10/90 wt%)
were prepared in DCM (total concentration approx. 1.5 mg/mL). For the calibration,
the LC-transform system was used. The principle of LC-FTIR was explained in
chapter 3. The polymer materials were directly sprayed onto the Ge-disc without prior
separation (no column) in order to obtain the same mixture on the Ge-plate. Each
solution was measured two times to ensure the reproducibility of the result.
Afterwards spectra of each solution were recorded and analyzed by FTIR software.
To be able to determine the PPDO content in the MBCs samples, the bands at 1146
cm-1 and at 1178 cm-1 were selected. Before determining the peak heights, the
baseline was selected by purpose between 2204 – 800 cm-1 in order to cover the
range of interest, and was kept identical for all samples. For each solution, the peak
heights (I1) at 1146 cm-1 and the peak height (I2) at 1178 cm-1 were determined. The
ratio I1/I2 was determined by using equation:
CfractionSEI
CfractionSEI
I
Ir
copolymer
copolymer
2
1
2
1
4.1
0 10 20 30 40 50 60 70 80 90 100 110
1,2
1,4
1,6
1,8
2,0
2,2
2,4
Ra
tio
(I1
/I2
)
wt % (PPDO)
Figure 4.33: Calibration curve for relation between PPDO composition and peak height
In Fig. 4.33 one can see that a good correlation between the data points and the
fitted curve is obtained (R2=0.99). The third degree polynomial function was used for
fitting the curve.
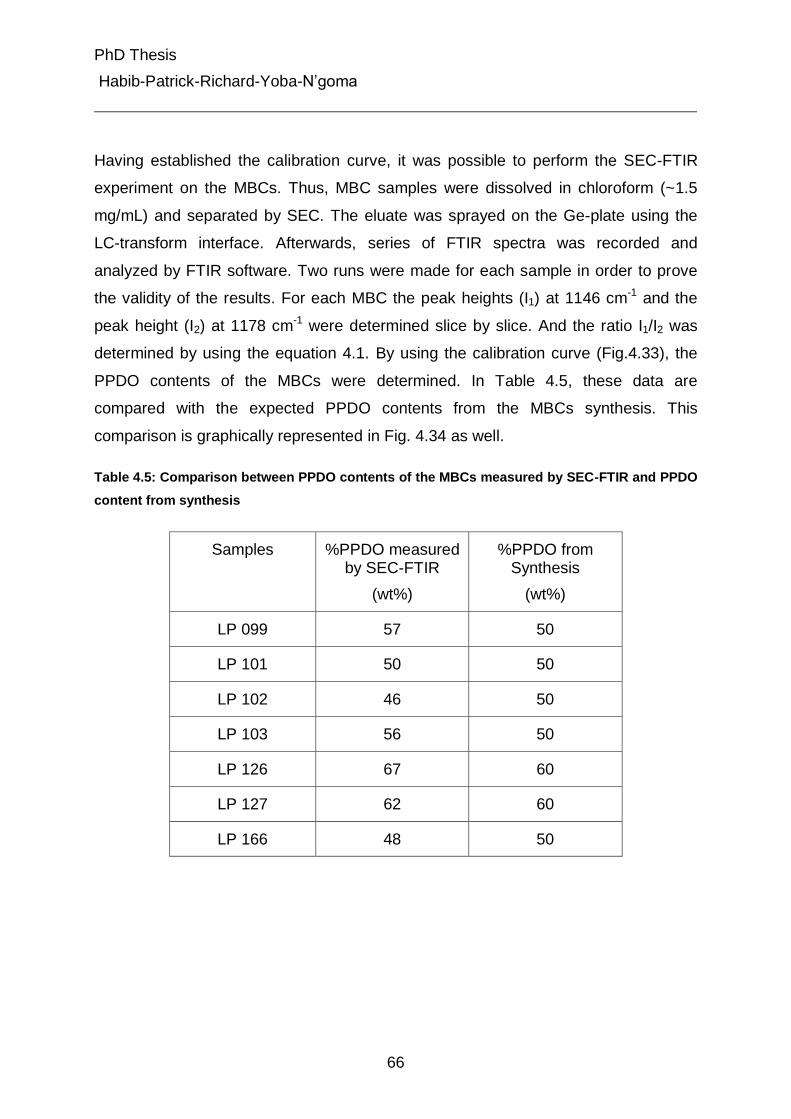
PhD Thesis
Habib-Patrick-Richard-Yoba-N’goma
66
Having established the calibration curve, it was possible to perform the SEC-FTIR
experiment on the MBCs. Thus, MBC samples were dissolved in chloroform (~1.5
mg/mL) and separated by SEC. The eluate was sprayed on the Ge-plate using the
LC-transform interface. Afterwards, series of FTIR spectra was recorded and
analyzed by FTIR software. Two runs were made for each sample in order to prove
the validity of the results. For each MBC the peak heights (I1) at 1146 cm-1 and the
peak height (I2) at 1178 cm-1 were determined slice by slice. And the ratio I1/I2 was
determined by using the equation 4.1. By using the calibration curve (Fig.4.33), the
PPDO contents of the MBCs were determined. In Table 4.5, these data are
compared with the expected PPDO contents from the MBCs synthesis. This
comparison is graphically represented in Fig. 4.34 as well.
Table 4.5: Comparison between PPDO contents of the MBCs measured by SEC-FTIR and PPDO
content from synthesis
Samples %PPDO measured by SEC-FTIR
(wt%)
%PPDO from Synthesis
(wt%)
LP 099 57 50
LP 101 50 50
LP 102 46 50
LP 103 56 50
LP 126 67 60
LP 127 62 60
LP 166 48 50
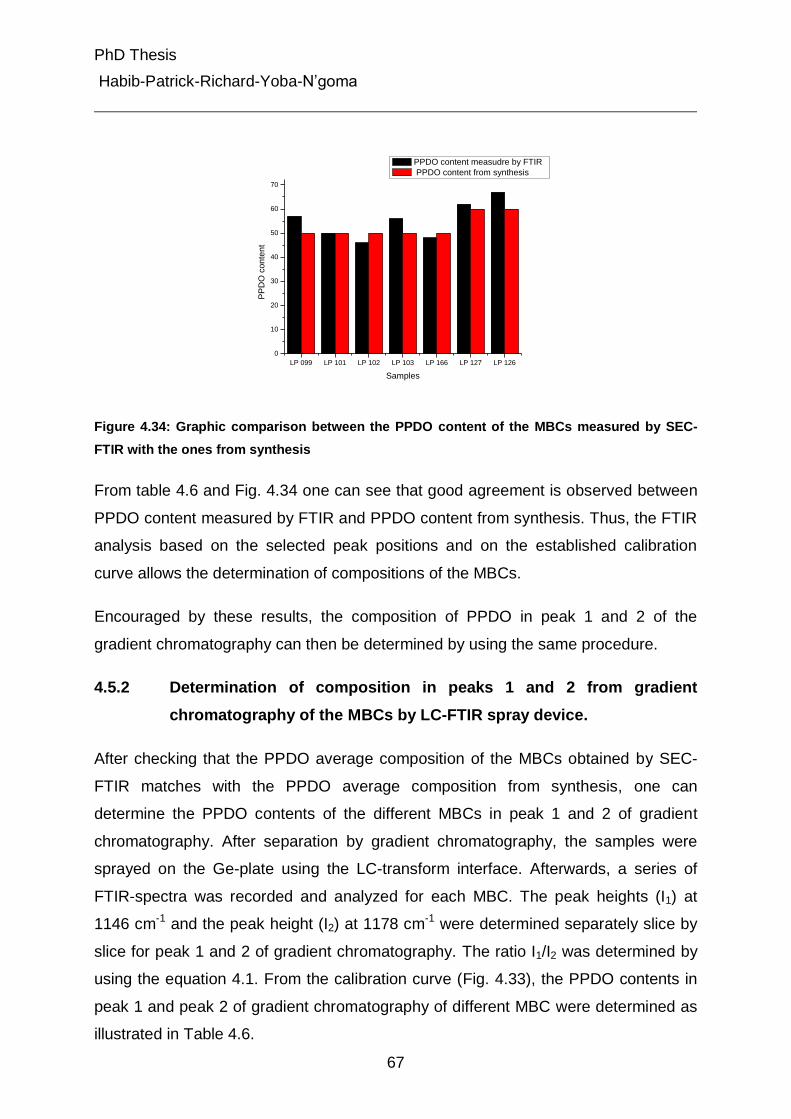
PhD Thesis
Habib-Patrick-Richard-Yoba-N’goma
67
LP 099 LP 101 LP 102 LP 103 LP 166 LP 127 LP 126
0
10
20
30
40
50
60
70
PP
DO
co
nte
nt
Samples
PPDO content measudre by FTIR
PPDO content from synthesis
Figure 4.34: Graphic comparison between the PPDO content of the MBCs measured by SEC-
FTIR with the ones from synthesis
From table 4.6 and Fig. 4.34 one can see that good agreement is observed between
PPDO content measured by FTIR and PPDO content from synthesis. Thus, the FTIR
analysis based on the selected peak positions and on the established calibration
curve allows the determination of compositions of the MBCs.
Encouraged by these results, the composition of PPDO in peak 1 and 2 of the
gradient chromatography can then be determined by using the same procedure.
4.5.2 Determination of composition in peaks 1 and 2 from gradient
chromatography of the MBCs by LC-FTIR spray device.
After checking that the PPDO average composition of the MBCs obtained by SEC-
FTIR matches with the PPDO average composition from synthesis, one can
determine the PPDO contents of the different MBCs in peak 1 and 2 of gradient
chromatography. After separation by gradient chromatography, the samples were
sprayed on the Ge-plate using the LC-transform interface. Afterwards, a series of
FTIR-spectra was recorded and analyzed for each MBC. The peak heights (I1) at
1146 cm-1 and the peak height (I2) at 1178 cm-1 were determined separately slice by
slice for peak 1 and 2 of gradient chromatography. The ratio I1/I2 was determined by
using the equation 4.1. From the calibration curve (Fig. 4.33), the PPDO contents in
peak 1 and peak 2 of gradient chromatography of different MBC were determined as
illustrated in Table 4.6.
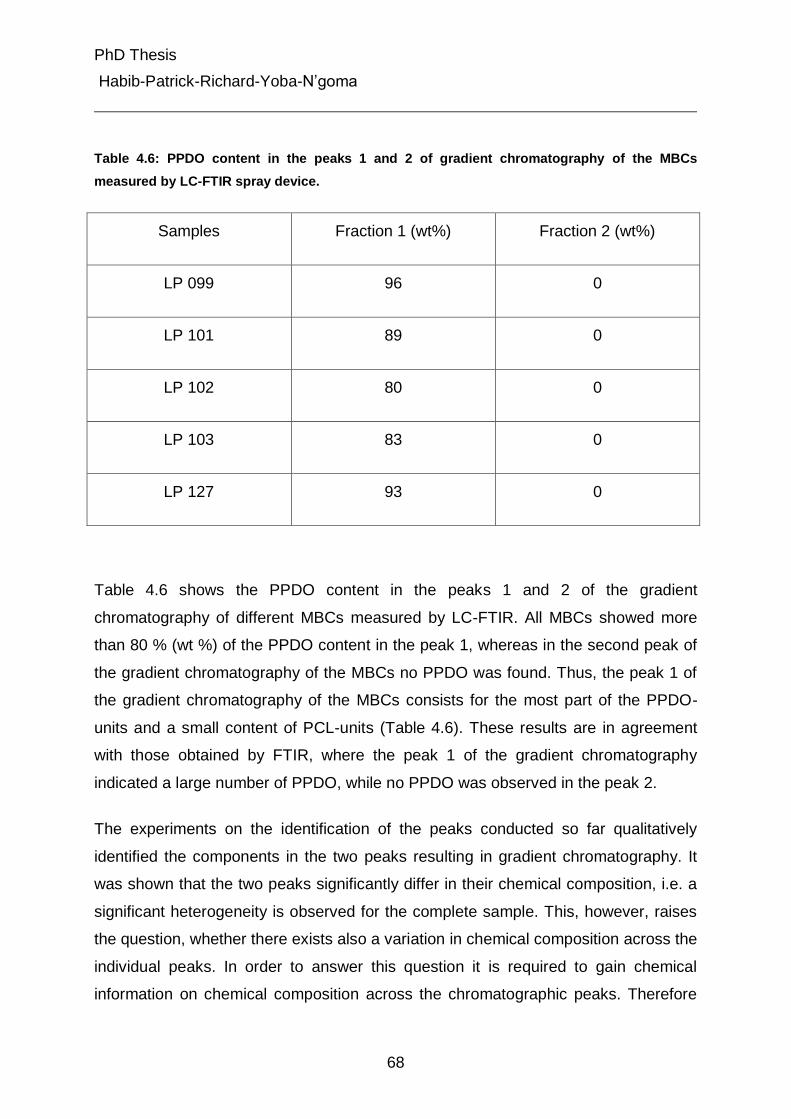
PhD Thesis
Habib-Patrick-Richard-Yoba-N’goma
68
Table 4.6: PPDO content in the peaks 1 and 2 of gradient chromatography of the MBCs
measured by LC-FTIR spray device.
Samples Fraction 1 (wt%) Fraction 2 (wt%)
LP 099 96 0
LP 101 89 0
LP 102 80 0
LP 103 83 0
LP 127 93 0
Table 4.6 shows the PPDO content in the peaks 1 and 2 of the gradient
chromatography of different MBCs measured by LC-FTIR. All MBCs showed more
than 80 % (wt %) of the PPDO content in the peak 1, whereas in the second peak of
the gradient chromatography of the MBCs no PPDO was found. Thus, the peak 1 of
the gradient chromatography of the MBCs consists for the most part of the PPDO-
units and a small content of PCL-units (Table 4.6). These results are in agreement
with those obtained by FTIR, where the peak 1 of the gradient chromatography
indicated a large number of PPDO, while no PPDO was observed in the peak 2.
The experiments on the identification of the peaks conducted so far qualitatively
identified the components in the two peaks resulting in gradient chromatography. It
was shown that the two peaks significantly differ in their chemical composition, i.e. a
significant heterogeneity is observed for the complete sample. This, however, raises
the question, whether there exists also a variation in chemical composition across the
individual peaks. In order to answer this question it is required to gain chemical
information on chemical composition across the chromatographic peaks. Therefore
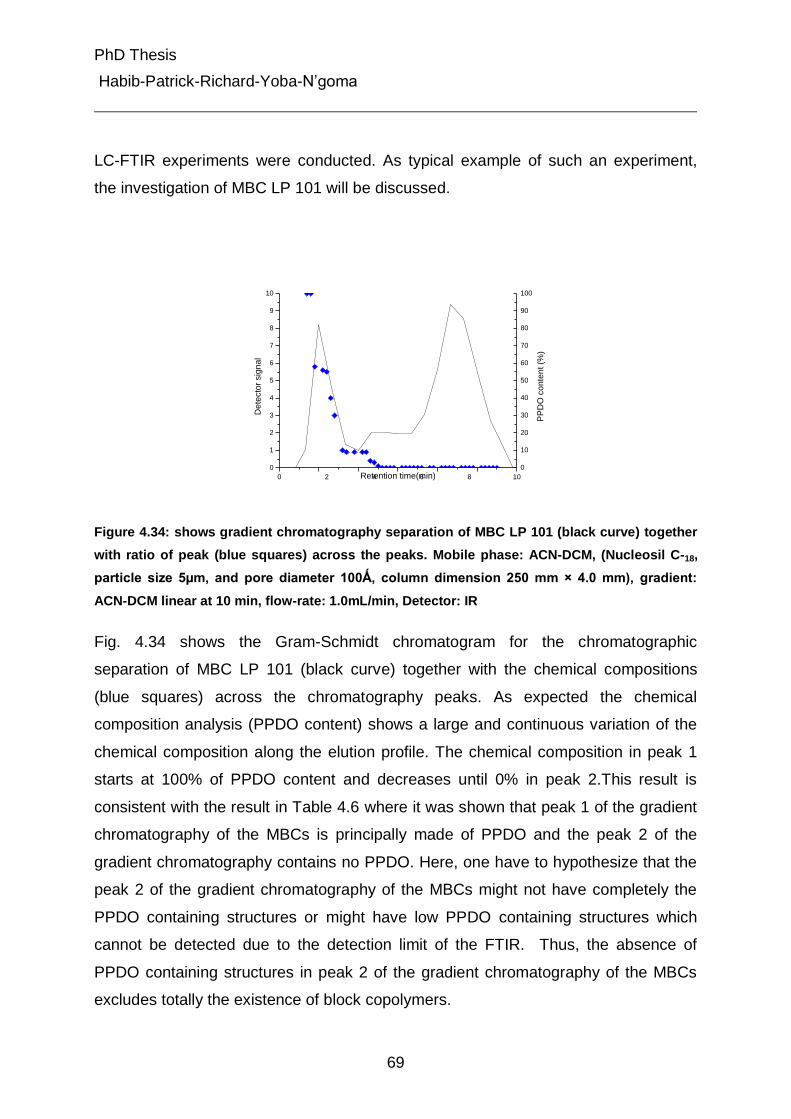
PhD Thesis
Habib-Patrick-Richard-Yoba-N’goma
69
LC-FTIR experiments were conducted. As typical example of such an experiment,
the investigation of MBC LP 101 will be discussed.
Retention time(min)0
10
20
30
40
50
60
70
80
90
100
0 2 4 6 8 10
0
1
2
3
4
5
6
7
8
9
10
PP
DO
co
nte
nt (%
)
De
tecto
r sig
na
l
Figure 4.34: shows gradient chromatography separation of MBC LP 101 (black curve) together
with ratio of peak (blue squares) across the peaks. Mobile phase: ACN-DCM, (Nucleosil C-18,
particle size 5µm, and pore diameter 100Ǻ, column dimension 250 mm × 4.0 mm), gradient:
ACN-DCM linear at 10 min, flow-rate: 1.0mL/min, Detector: IR
Fig. 4.34 shows the Gram-Schmidt chromatogram for the chromatographic
separation of MBC LP 101 (black curve) together with the chemical compositions
(blue squares) across the chromatography peaks. As expected the chemical
composition analysis (PPDO content) shows a large and continuous variation of the
chemical composition along the elution profile. The chemical composition in peak 1
starts at 100% of PPDO content and decreases until 0% in peak 2.This result is
consistent with the result in Table 4.6 where it was shown that peak 1 of the gradient
chromatography of the MBCs is principally made of PPDO and the peak 2 of the
gradient chromatography contains no PPDO. Here, one have to hypothesize that the
peak 2 of the gradient chromatography of the MBCs might not have completely the
PPDO containing structures or might have low PPDO containing structures which
cannot be detected due to the detection limit of the FTIR. Thus, the absence of
PPDO containing structures in peak 2 of the gradient chromatography of the MBCs
excludes totally the existence of block copolymers.
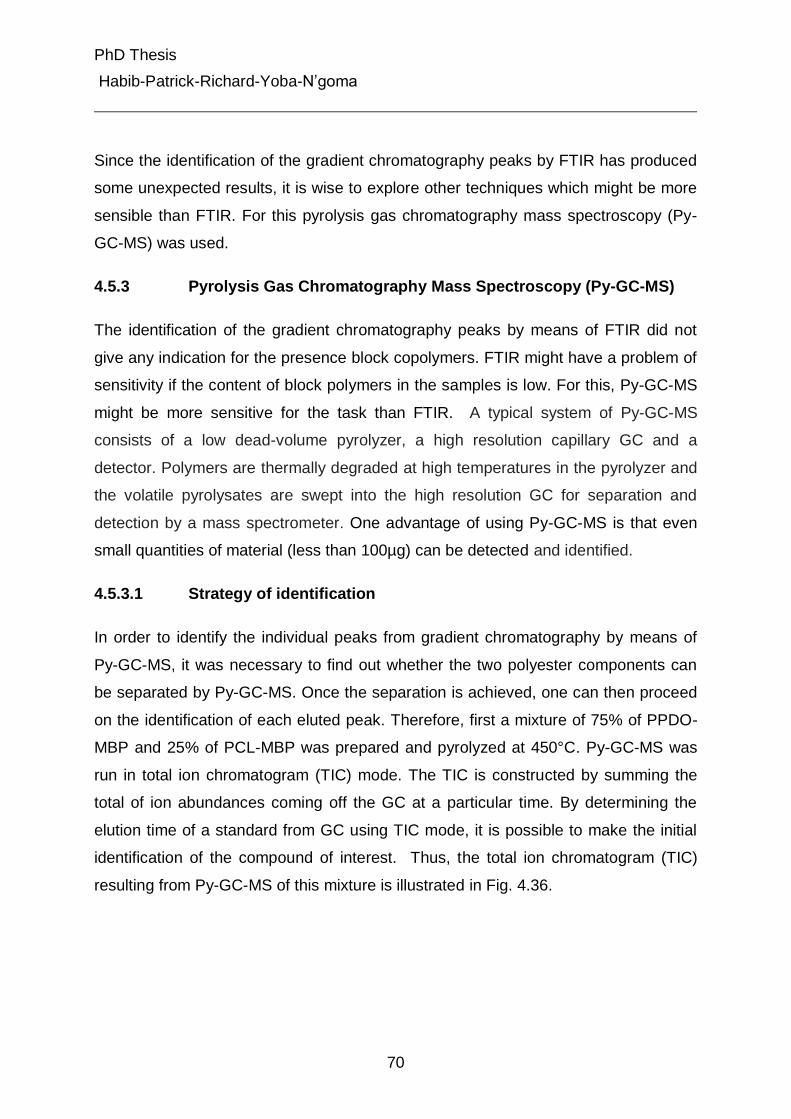
PhD Thesis
Habib-Patrick-Richard-Yoba-N’goma
70
Since the identification of the gradient chromatography peaks by FTIR has produced
some unexpected results, it is wise to explore other techniques which might be more
sensible than FTIR. For this pyrolysis gas chromatography mass spectroscopy (Py-
GC-MS) was used.
4.5.3 Pyrolysis Gas Chromatography Mass Spectroscopy (Py-GC-MS)
The identification of the gradient chromatography peaks by means of FTIR did not
give any indication for the presence block copolymers. FTIR might have a problem of
sensitivity if the content of block polymers in the samples is low. For this, Py-GC-MS
might be more sensitive for the task than FTIR. A typical system of Py-GC-MS
consists of a low dead-volume pyrolyzer, a high resolution capillary GC and a
detector. Polymers are thermally degraded at high temperatures in the pyrolyzer and
the volatile pyrolysates are swept into the high resolution GC for separation and
detection by a mass spectrometer. One advantage of using Py-GC-MS is that even
small quantities of material (less than 100µg) can be detected and identified.
4.5.3.1 Strategy of identification
In order to identify the individual peaks from gradient chromatography by means of
Py-GC-MS, it was necessary to find out whether the two polyester components can
be separated by Py-GC-MS. Once the separation is achieved, one can then proceed
on the identification of each eluted peak. Therefore, first a mixture of 75% of PPDO-
MBP and 25% of PCL-MBP was prepared and pyrolyzed at 450°C. Py-GC-MS was
run in total ion chromatogram (TIC) mode. The TIC is constructed by summing the
total of ion abundances coming off the GC at a particular time. By determining the
elution time of a standard from GC using TIC mode, it is possible to make the initial
identification of the compound of interest. Thus, the total ion chromatogram (TIC)
resulting from Py-GC-MS of this mixture is illustrated in Fig. 4.36.
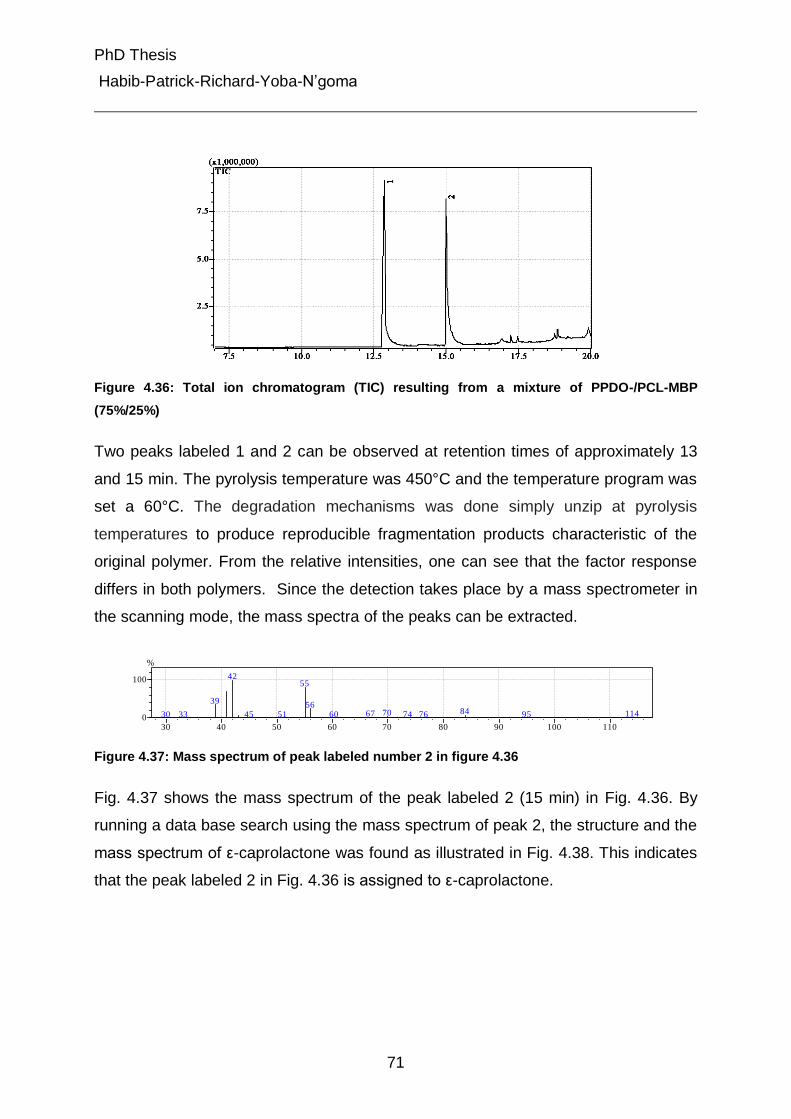
PhD Thesis
Habib-Patrick-Richard-Yoba-N’goma
71
Figure 4.36: Total ion chromatogram (TIC) resulting from a mixture of PPDO-/PCL-MBP
(75%/25%)
Two peaks labeled 1 and 2 can be observed at retention times of approximately 13
and 15 min. The pyrolysis temperature was 450°C and the temperature program was
set a 60°C. The degradation mechanisms was done simply unzip at pyrolysis
temperatures to produce reproducible fragmentation products characteristic of the
original polymer. From the relative intensities, one can see that the factor response
differs in both polymers. Since the detection takes place by a mass spectrometer in
the scanning mode, the mass spectra of the peaks can be extracted.
30 40 50 60 70 80 90 100 1100
100
%
4255
3956
8470 1146730 5145 6033 9574 76
Figure 4.37: Mass spectrum of peak labeled number 2 in figure 4.36
Fig. 4.37 shows the mass spectrum of the peak labeled 2 (15 min) in Fig. 4.36. By
running a data base search using the mass spectrum of peak 2, the structure and the
mass spectrum of ε-caprolactone was found as illustrated in Fig. 4.38. This indicates
that the peak labeled 2 in Fig. 4.36 is assigned to ε-caprolactone.
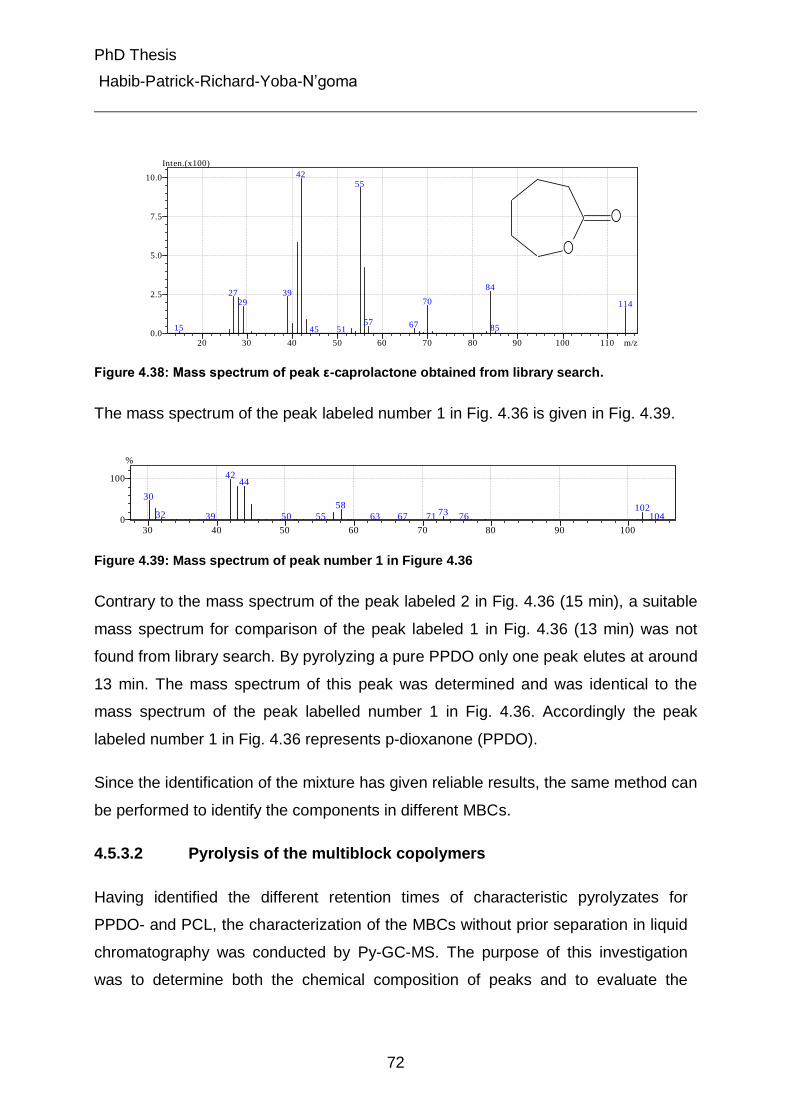
PhD Thesis
Habib-Patrick-Richard-Yoba-N’goma
72
20 30 40 50 60 70 80 90 100 110 m/z0.0
2.5
5.0
7.5
10.0
Inten.(x100)
4255
843927
7029 114
57 67 8515 45 51
O
O
Figure 4.38: Mass spectrum of peak ε-caprolactone obtained from library search.
The mass spectrum of the peak labeled number 1 in Fig. 4.36 is given in Fig. 4.39.
30 40 50 60 70 80 90 1000
100
%
4244
3058 1027332 5539 10471 7650 6763
Figure 4.39: Mass spectrum of peak number 1 in Figure 4.36
Contrary to the mass spectrum of the peak labeled 2 in Fig. 4.36 (15 min), a suitable
mass spectrum for comparison of the peak labeled 1 in Fig. 4.36 (13 min) was not
found from library search. By pyrolyzing a pure PPDO only one peak elutes at around
13 min. The mass spectrum of this peak was determined and was identical to the
mass spectrum of the peak labelled number 1 in Fig. 4.36. Accordingly the peak
labeled number 1 in Fig. 4.36 represents p-dioxanone (PPDO).
Since the identification of the mixture has given reliable results, the same method can
be performed to identify the components in different MBCs.
4.5.3.2 Pyrolysis of the multiblock copolymers
Having identified the different retention times of characteristic pyrolyzates for
PPDO- and PCL, the characterization of the MBCs without prior separation in liquid
chromatography was conducted by Py-GC-MS. The purpose of this investigation
was to determine both the chemical composition of peaks and to evaluate the
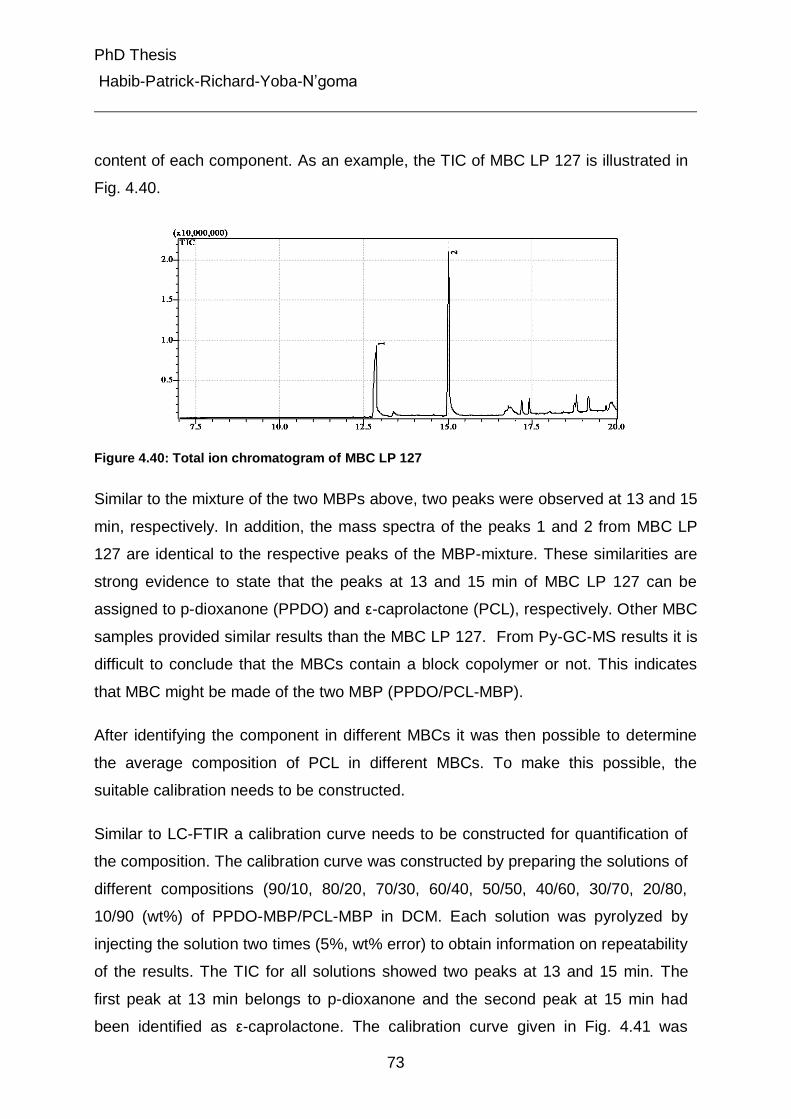
PhD Thesis
Habib-Patrick-Richard-Yoba-N’goma
73
content of each component. As an example, the TIC of MBC LP 127 is illustrated in
Fig. 4.40.
Figure 4.40: Total ion chromatogram of MBC LP 127
Similar to the mixture of the two MBPs above, two peaks were observed at 13 and 15
min, respectively. In addition, the mass spectra of the peaks 1 and 2 from MBC LP
127 are identical to the respective peaks of the MBP-mixture. These similarities are
strong evidence to state that the peaks at 13 and 15 min of MBC LP 127 can be
assigned to p-dioxanone (PPDO) and ε-caprolactone (PCL), respectively. Other MBC
samples provided similar results than the MBC LP 127. From Py-GC-MS results it is
difficult to conclude that the MBCs contain a block copolymer or not. This indicates
that MBC might be made of the two MBP (PPDO/PCL-MBP).
After identifying the component in different MBCs it was then possible to determine
the average composition of PCL in different MBCs. To make this possible, the
suitable calibration needs to be constructed.
Similar to LC-FTIR a calibration curve needs to be constructed for quantification of
the composition. The calibration curve was constructed by preparing the solutions of
different compositions (90/10, 80/20, 70/30, 60/40, 50/50, 40/60, 30/70, 20/80,
10/90 (wt%) of PPDO-MBP/PCL-MBP in DCM. Each solution was pyrolyzed by
injecting the solution two times (5%, wt% error) to obtain information on repeatability
of the results. The TIC for all solutions showed two peaks at 13 and 15 min. The
first peak at 13 min belongs to p-dioxanone and the second peak at 15 min had
been identified as ε-caprolactone. The calibration curve given in Fig. 4.41 was
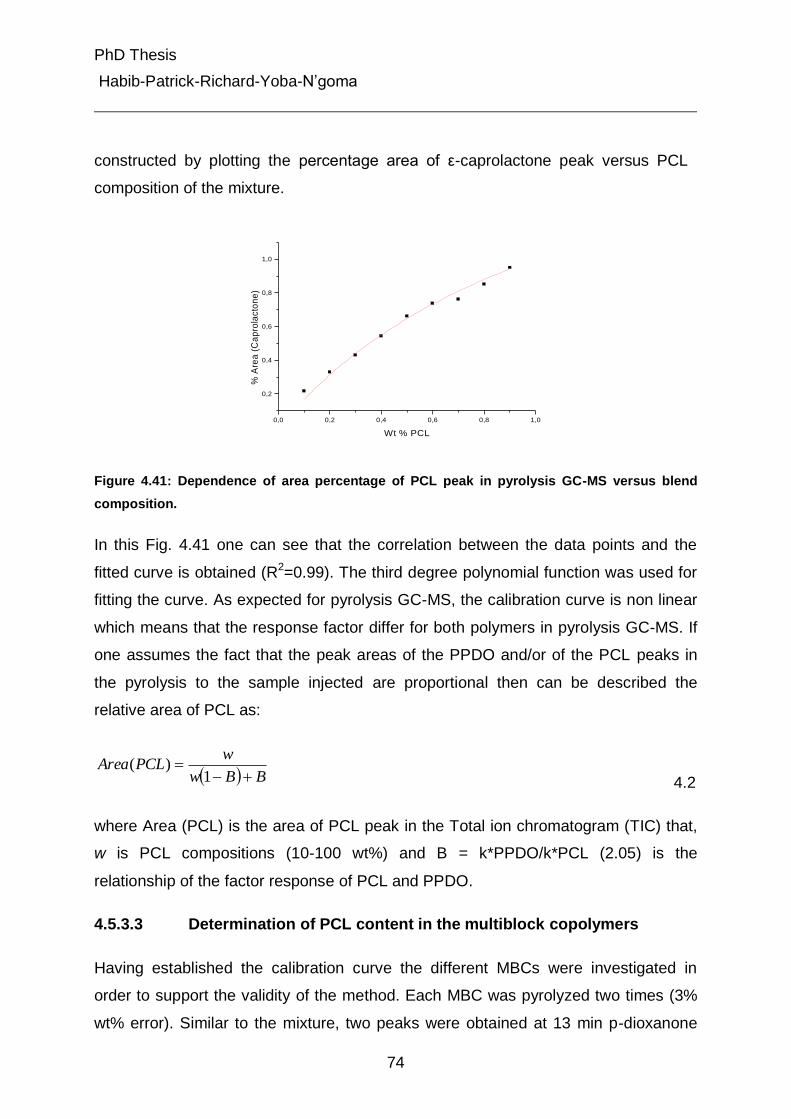
PhD Thesis
Habib-Patrick-Richard-Yoba-N’goma
74
constructed by plotting the percentage area of ε-caprolactone peak versus PCL
composition of the mixture.
0,0 0,2 0,4 0,6 0,8 1,0
0,2
0,4
0,6
0,8
1,0%
Are
a (
Ca
pro
lacto
ne
)
Wt % PCL
Figure 4.41: Dependence of area percentage of PCL peak in pyrolysis GC-MS versus blend
composition.
In this Fig. 4.41 one can see that the correlation between the data points and the
fitted curve is obtained (R2=0.99). The third degree polynomial function was used for
fitting the curve. As expected for pyrolysis GC-MS, the calibration curve is non linear
which means that the response factor differ for both polymers in pyrolysis GC-MS. If
one assumes the fact that the peak areas of the PPDO and/or of the PCL peaks in
the pyrolysis to the sample injected are proportional then can be described the
relative area of PCL as:
BBw
wPCLArea
1)(
4.2
where Area (PCL) is the area of PCL peak in the Total ion chromatogram (TIC) that,
w is PCL compositions (10-100 wt%) and B = k*PPDO/k*PCL (2.05) is the
relationship of the factor response of PCL and PPDO.
4.5.3.3 Determination of PCL content in the multiblock copolymers
Having established the calibration curve the different MBCs were investigated in
order to support the validity of the method. Each MBC was pyrolyzed two times (3%
wt% error). Similar to the mixture, two peaks were obtained at 13 min p-dioxanone
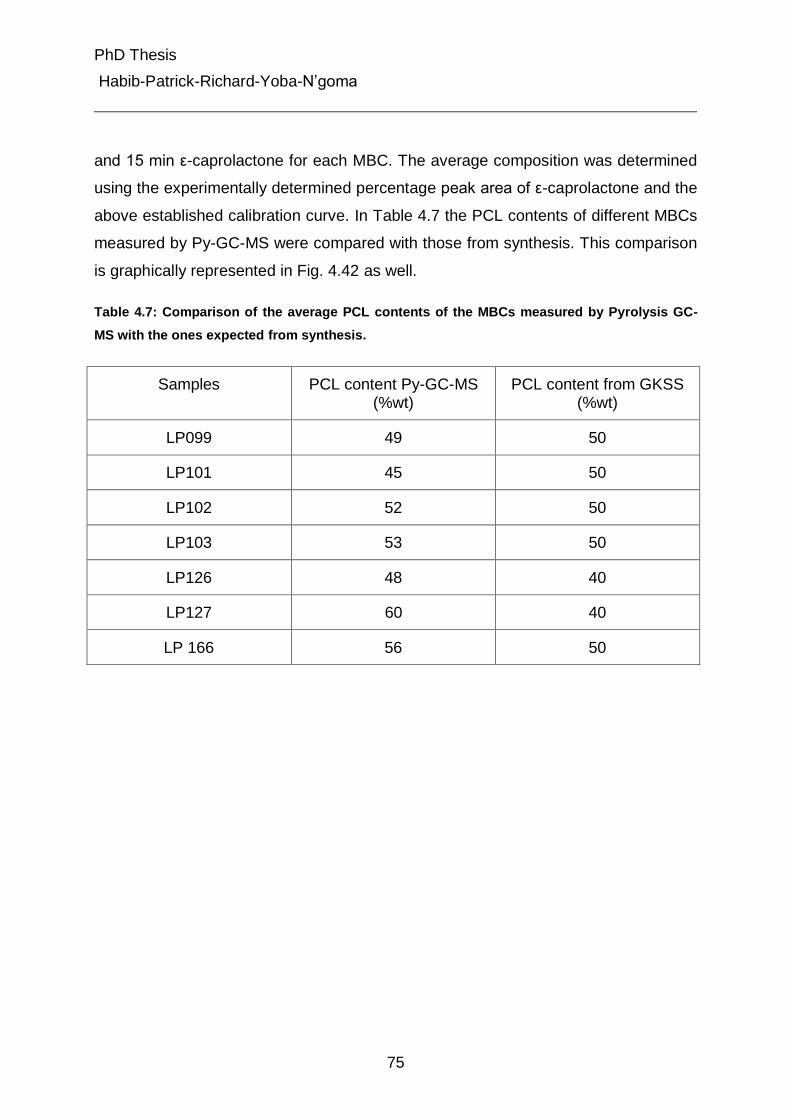
PhD Thesis
Habib-Patrick-Richard-Yoba-N’goma
75
and 15 min ε-caprolactone for each MBC. The average composition was determined
using the experimentally determined percentage peak area of ε-caprolactone and the
above established calibration curve. In Table 4.7 the PCL contents of different MBCs
measured by Py-GC-MS were compared with those from synthesis. This comparison
is graphically represented in Fig. 4.42 as well.
Table 4.7: Comparison of the average PCL contents of the MBCs measured by Pyrolysis GC-
MS with the ones expected from synthesis.
Samples PCL content Py-GC-MS (%wt)
PCL content from GKSS (%wt)
LP099 49 50
LP101 45 50
LP102 52 50
LP103 53 50
LP126 48 40
LP127 60 40
LP 166 56 50
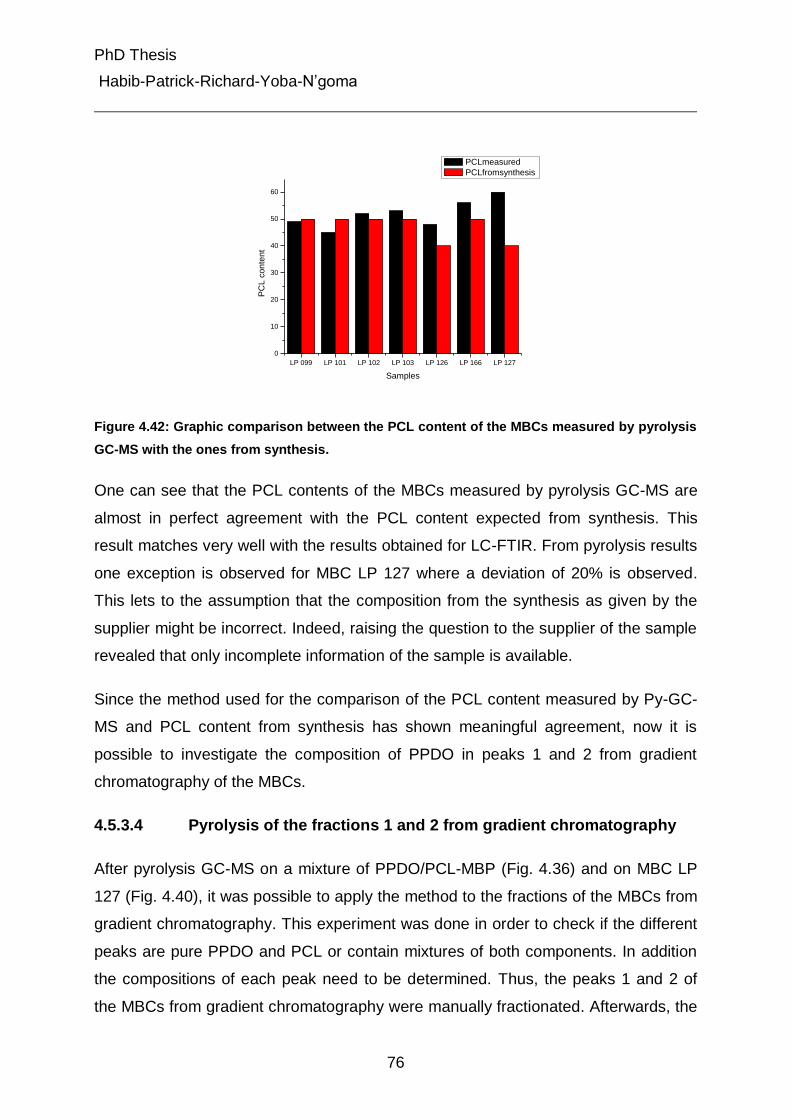
PhD Thesis
Habib-Patrick-Richard-Yoba-N’goma
76
LP 099 LP 101 LP 102 LP 103 LP 126 LP 166 LP 127
0
10
20
30
40
50
60
PC
L c
on
ten
t
Samples
PCLmeasured
PCLfromsynthesis
Figure 4.42: Graphic comparison between the PCL content of the MBCs measured by pyrolysis
GC-MS with the ones from synthesis.
One can see that the PCL contents of the MBCs measured by pyrolysis GC-MS are
almost in perfect agreement with the PCL content expected from synthesis. This
result matches very well with the results obtained for LC-FTIR. From pyrolysis results
one exception is observed for MBC LP 127 where a deviation of 20% is observed.
This lets to the assumption that the composition from the synthesis as given by the
supplier might be incorrect. Indeed, raising the question to the supplier of the sample
revealed that only incomplete information of the sample is available.
Since the method used for the comparison of the PCL content measured by Py-GC-
MS and PCL content from synthesis has shown meaningful agreement, now it is
possible to investigate the composition of PPDO in peaks 1 and 2 from gradient
chromatography of the MBCs.
4.5.3.4 Pyrolysis of the fractions 1 and 2 from gradient chromatography
After pyrolysis GC-MS on a mixture of PPDO/PCL-MBP (Fig. 4.36) and on MBC LP
127 (Fig. 4.40), it was possible to apply the method to the fractions of the MBCs from
gradient chromatography. This experiment was done in order to check if the different
peaks are pure PPDO and PCL or contain mixtures of both components. In addition
the compositions of each peak need to be determined. Thus, the peaks 1 and 2 of
the MBCs from gradient chromatography were manually fractionated. Afterwards, the
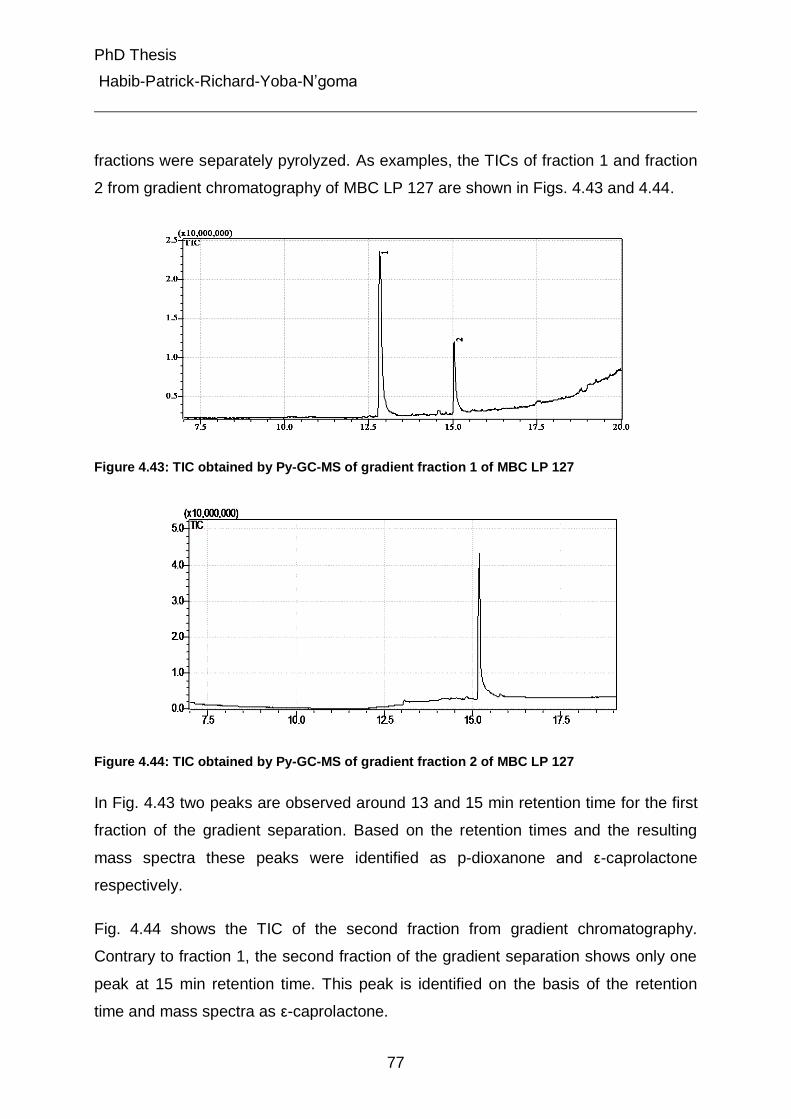
PhD Thesis
Habib-Patrick-Richard-Yoba-N’goma
77
fractions were separately pyrolyzed. As examples, the TICs of fraction 1 and fraction
2 from gradient chromatography of MBC LP 127 are shown in Figs. 4.43 and 4.44.
Figure 4.43: TIC obtained by Py-GC-MS of gradient fraction 1 of MBC LP 127
Figure 4.44: TIC obtained by Py-GC-MS of gradient fraction 2 of MBC LP 127
In Fig. 4.43 two peaks are observed around 13 and 15 min retention time for the first
fraction of the gradient separation. Based on the retention times and the resulting
mass spectra these peaks were identified as p-dioxanone and ε-caprolactone
respectively.
Fig. 4.44 shows the TIC of the second fraction from gradient chromatography.
Contrary to fraction 1, the second fraction of the gradient separation shows only one
peak at 15 min retention time. This peak is identified on the basis of the retention
time and mass spectra as ε-caprolactone.
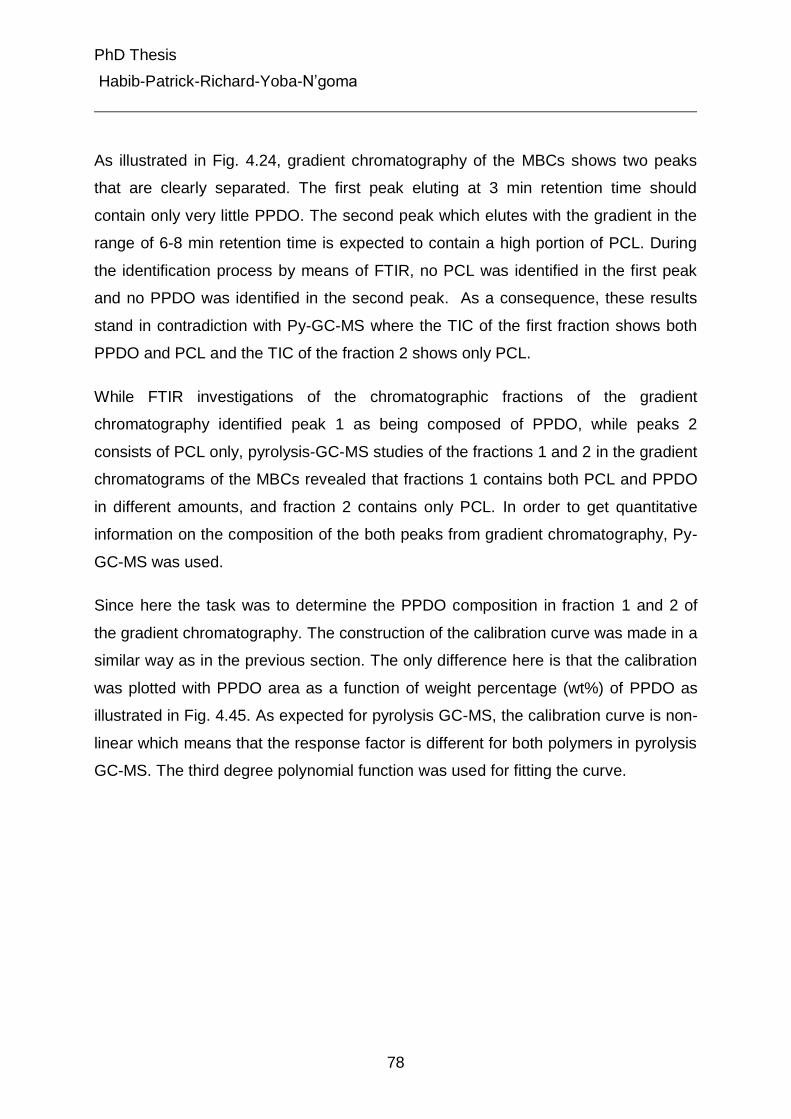
PhD Thesis
Habib-Patrick-Richard-Yoba-N’goma
78
As illustrated in Fig. 4.24, gradient chromatography of the MBCs shows two peaks
that are clearly separated. The first peak eluting at 3 min retention time should
contain only very little PPDO. The second peak which elutes with the gradient in the
range of 6-8 min retention time is expected to contain a high portion of PCL. During
the identification process by means of FTIR, no PCL was identified in the first peak
and no PPDO was identified in the second peak. As a consequence, these results
stand in contradiction with Py-GC-MS where the TIC of the first fraction shows both
PPDO and PCL and the TIC of the fraction 2 shows only PCL.
While FTIR investigations of the chromatographic fractions of the gradient
chromatography identified peak 1 as being composed of PPDO, while peaks 2
consists of PCL only, pyrolysis-GC-MS studies of the fractions 1 and 2 in the gradient
chromatograms of the MBCs revealed that fractions 1 contains both PCL and PPDO
in different amounts, and fraction 2 contains only PCL. In order to get quantitative
information on the composition of the both peaks from gradient chromatography, Py-
GC-MS was used.
Since here the task was to determine the PPDO composition in fraction 1 and 2 of
the gradient chromatography. The construction of the calibration curve was made in a
similar way as in the previous section. The only difference here is that the calibration
was plotted with PPDO area as a function of weight percentage (wt%) of PPDO as
illustrated in Fig. 4.45. As expected for pyrolysis GC-MS, the calibration curve is non-
linear which means that the response factor is different for both polymers in pyrolysis
GC-MS. The third degree polynomial function was used for fitting the curve.
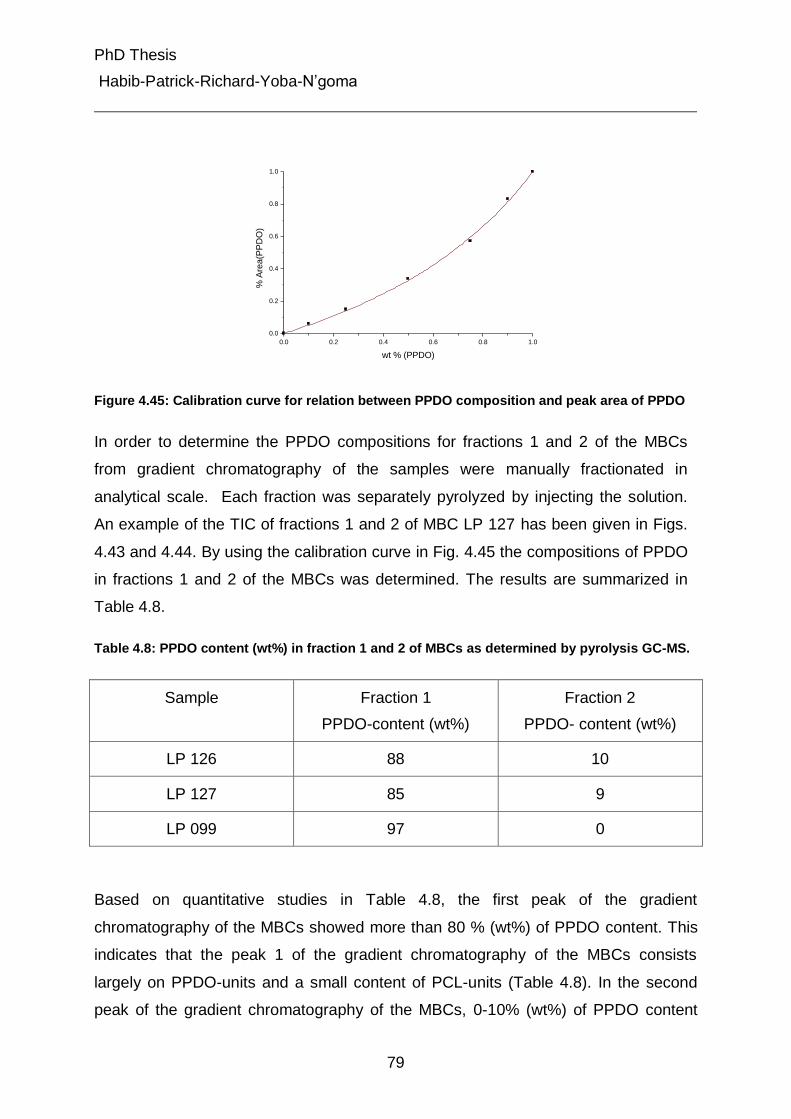
PhD Thesis
Habib-Patrick-Richard-Yoba-N’goma
79
0.0 0.2 0.4 0.6 0.8 1.0
0.0
0.2
0.4
0.6
0.8
1.0
% A
rea(P
PD
O)
wt % (PPDO)
Figure 4.45: Calibration curve for relation between PPDO composition and peak area of PPDO
In order to determine the PPDO compositions for fractions 1 and 2 of the MBCs
from gradient chromatography of the samples were manually fractionated in
analytical scale. Each fraction was separately pyrolyzed by injecting the solution.
An example of the TIC of fractions 1 and 2 of MBC LP 127 has been given in Figs.
4.43 and 4.44. By using the calibration curve in Fig. 4.45 the compositions of PPDO
in fractions 1 and 2 of the MBCs was determined. The results are summarized in
Table 4.8.
Table 4.8: PPDO content (wt%) in fraction 1 and 2 of MBCs as determined by pyrolysis GC-MS.
Sample Fraction 1
PPDO-content (wt%)
Fraction 2
PPDO- content (wt%)
LP 126 88 10
LP 127 85 9
LP 099 97 0
Based on quantitative studies in Table 4.8, the first peak of the gradient
chromatography of the MBCs showed more than 80 % (wt%) of PPDO content. This
indicates that the peak 1 of the gradient chromatography of the MBCs consists
largely on PPDO-units and a small content of PCL-units (Table 4.8). In the second
peak of the gradient chromatography of the MBCs, 0-10% (wt%) of PPDO content
PhD Thesis
Habib-Patrick-Richard-Yoba-N’goma
80
was found. This implies that the peak 2 of the gradient chromatography of the MBCs
is principally made of PCL-units. Thus, the absence of the p-dioxanone peak in the
TIC of the fraction 2 (Fig. 4.44) might be due to the sensitivity of the system.
Please note that fractions 1 and 2 from gradient chromatography for other MBCs
samples gave the similar results in terms of identification of composition of each
peak.
The results above are in an agreement with the interpretation of the retention times in
gradient chromatography, where it was concluded that fractions 1 and 2 of the MBCs
from gradient chromatography are composed mainly of PPDO and PCL, respectively.
Since the two previous methods FTIR and pyrolysis-GC-MS have shown different
results on identification of the gradient chromatography peaks, but have produced
meaningful result on the composition of the components, in order to gain more
information on the nature of gradient chromatography peaks and on their composition
on-line coupling of gradient chromatography and proton nuclear magnetic resonance
(1H-NMR) spectroscopy (1H-NMR) was used.
4.5.4 On-line coupling of gradient chromatography and 1H-NMR
For supporting the information obtained above, the samples of the MBC were also
examined by direct coupling of gradient HPLC and proton nuclear magnetic
resonance (1H-NMR) spectroscopy. This method will minimize all problems of
degradation and contamination and should allow a direct analysis of different peaks.
On-line 1H-NMR experiments were performed using solvent suppression techniques.
As an example for on-line coupling of gradient chromatography and 1H-NMR, the
NMR-spectra at different retention times of MBC LP 127 in gradient chromatography
are illustrated in Fig. 4.46.
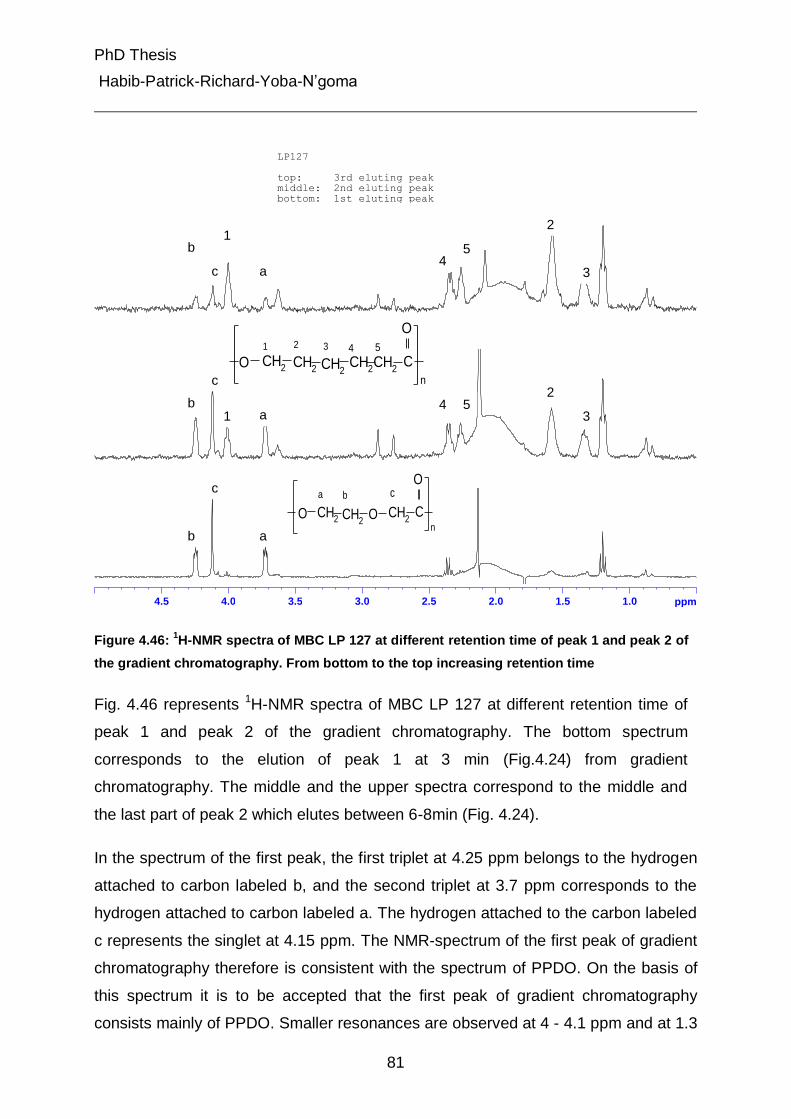
PhD Thesis
Habib-Patrick-Richard-Yoba-N’goma
81
1.01.52.02.53.03.54.04.5 ppm
LP127
top: 3rd eluting peakmiddle: 2nd eluting peak
bottom: 1st eluting peak
Figure 4.46: 1H-NMR spectra of MBC LP 127 at different retention time of peak 1 and peak 2 of
the gradient chromatography. From bottom to the top increasing retention time
Fig. 4.46 represents 1H-NMR spectra of MBC LP 127 at different retention time of
peak 1 and peak 2 of the gradient chromatography. The bottom spectrum
corresponds to the elution of peak 1 at 3 min (Fig.4.24) from gradient
chromatography. The middle and the upper spectra correspond to the middle and
the last part of peak 2 which elutes between 6-8min (Fig. 4.24).
In the spectrum of the first peak, the first triplet at 4.25 ppm belongs to the hydrogen
attached to carbon labeled b, and the second triplet at 3.7 ppm corresponds to the
hydrogen attached to carbon labeled a. The hydrogen attached to the carbon labeled
c represents the singlet at 4.15 ppm. The NMR-spectrum of the first peak of gradient
chromatography therefore is consistent with the spectrum of PPDO. On the basis of
this spectrum it is to be accepted that the first peak of gradient chromatography
consists mainly of PPDO. Smaller resonances are observed at 4 - 4.1 ppm and at 1.3
b
c
1
aa
4
2
3
b
c
1 aa
4
2
3
b
c
aa
O C
O
CH2 CH
2CH
2n
O
a b c
C
O
CH2 CH
2CH
2n
CH2
1
CH2
2 3
O4 5
5
5
PhD Thesis
Habib-Patrick-Richard-Yoba-N’goma
82
– 1.7 ppm which cannot be assigned to those of PPDO and are suspected to be
impurity.
The middle spectrum was taken in the middle part of peak 2 of MBC LP 127 from
gradient chromatography. This spectrum shows five additional resonances as
compared to the main resonances of the lowest spectrum in Fig. 4.46. These five
additional resonances at 4, 2.3, 2.2, 1.6 and 1.3 ppm can be assigned to the
hydrogens attached to the carbons labeled 1, 4, 5, 2, and 3 of PCL, respectively. The
middle spectrum however shows comparable signal intensities of both components
PPDO and PCL. The presence of PPDO and PCL peaks in the middle spectrum
proved that in the middle part of peak 2 both components PPDO and PCL eluted
simultaneously.
The upper spectrum corresponds to the end part of peak 2 of MBC LP 127 from the
gradient chromatography. The results are typically identical to those of the middle
part of peak 2. But here, the relative intensity of the PPDO signals indicated by the
letters a, b and c is considerably lower than the intensity of PCL resonances.
Accordingly, it is clear that at the end of peak 2 of MBC LP 127 from gradient
chromatography both components PPDO and PCL are also present with a large
content of PCL since the intensities of PPDO peaks are weaker. Note that the results
commented above could also be verified for other MBC samples.
From on-line coupling gradient chromatography and 1H- NMR results the following
conclusion can be draw:
On-line coupling of gradient chromatography and 1H-NMR has also verified
the pyrolysis-GC-MS results by showing that peak 1 (lower spectrum) of
MBC LP 127 from gradient chromatography contains only PPDO, while the
peak 2 (middle and upper spectra) contains both PPDO and PCL peaks. The
presence of PPDO peaks in peak 2 of the gradient chromatography let’s to
the assumption that the peak 2 of gradient chromatography is made of PCL-
MBP and/or block copolymers (PPDO-PCL-MBC). The difference in peak
intensity between the middle and upper spectra is due to a chemical
composition distribution of the MBCs.
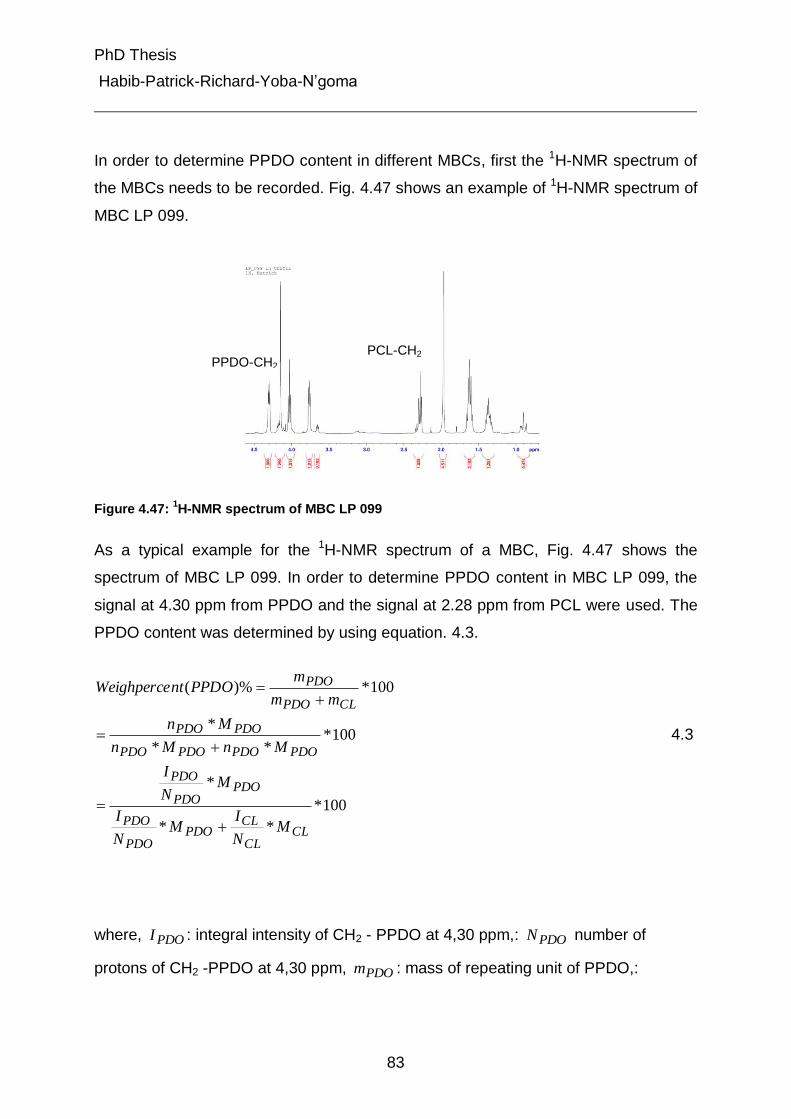
PhD Thesis
Habib-Patrick-Richard-Yoba-N’goma
83
In order to determine PPDO content in different MBCs, first the 1H-NMR spectrum of
the MBCs needs to be recorded. Fig. 4.47 shows an example of 1H-NMR spectrum of
MBC LP 099.
Figure 4.47: 1H-NMR spectrum of MBC LP 099
As a typical example for the 1H-NMR spectrum of a MBC, Fig. 4.47 shows the
spectrum of MBC LP 099. In order to determine PPDO content in MBC LP 099, the
signal at 4.30 ppm from PPDO and the signal at 2.28 ppm from PCL were used. The
PPDO content was determined by using equation. 4.3.
100*
**
*
100***
*
100*)%(
CLCL
CLPDO
PDO
PDO
PDOPDO
PDO
PDOPDOPDOPDO
PDOPDO
CLPDO
PDO
MN
IM
N
I
MN
I
MnMn
Mn
mm
mPPDOntWeighperce
4.3
where, PDOI : integral intensity of CH2 - PPDO at 4,30 ppm,: PDON number of
protons of CH2 -PPDO at 4,30 ppm, PDOm : mass of repeating unit of PPDO,:
PPDO-CH2
PCL-CH2
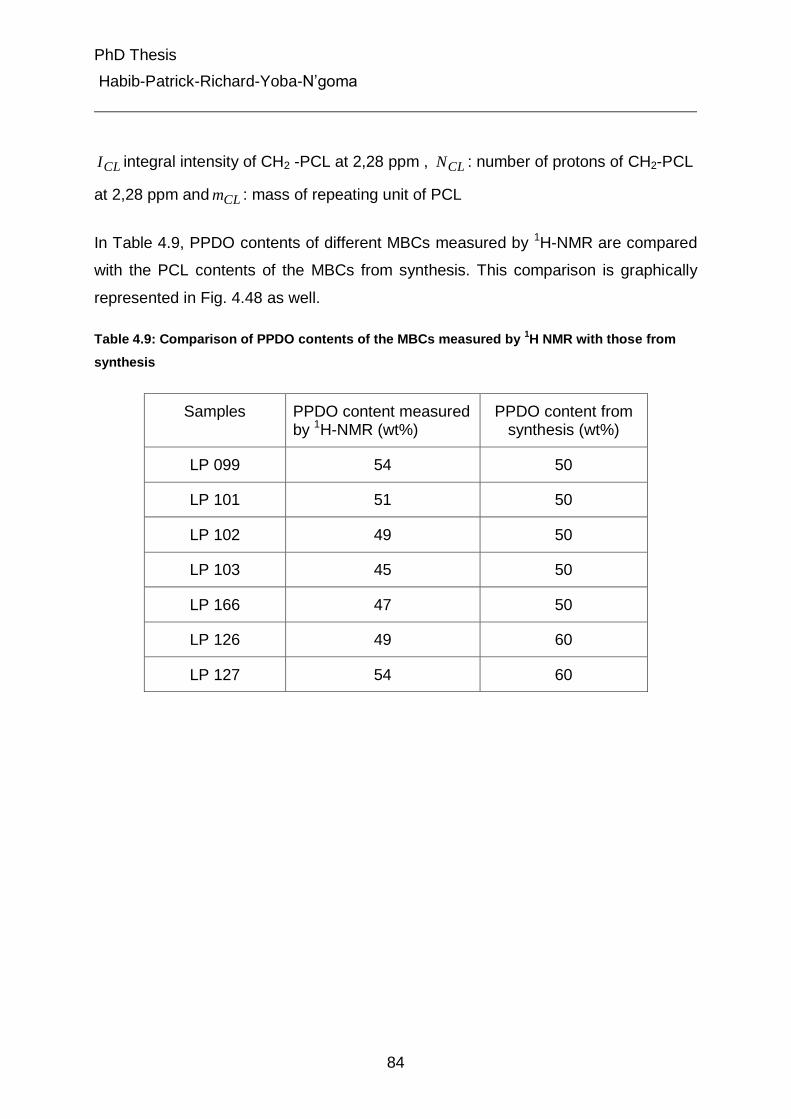
PhD Thesis
Habib-Patrick-Richard-Yoba-N’goma
84
CLI integral intensity of CH2 -PCL at 2,28 ppm , CLN : number of protons of CH2-PCL
at 2,28 ppm and CLm : mass of repeating unit of PCL
In Table 4.9, PPDO contents of different MBCs measured by 1H-NMR are compared
with the PCL contents of the MBCs from synthesis. This comparison is graphically
represented in Fig. 4.48 as well.
Table 4.9: Comparison of PPDO contents of the MBCs measured by 1H NMR with those from
synthesis
Samples PPDO content measured by 1H-NMR (wt%)
PPDO content from synthesis (wt%)
LP 099 54 50
LP 101 51 50
LP 102 49 50
LP 103 45 50
LP 166 47 50
LP 126 49 60
LP 127 54 60
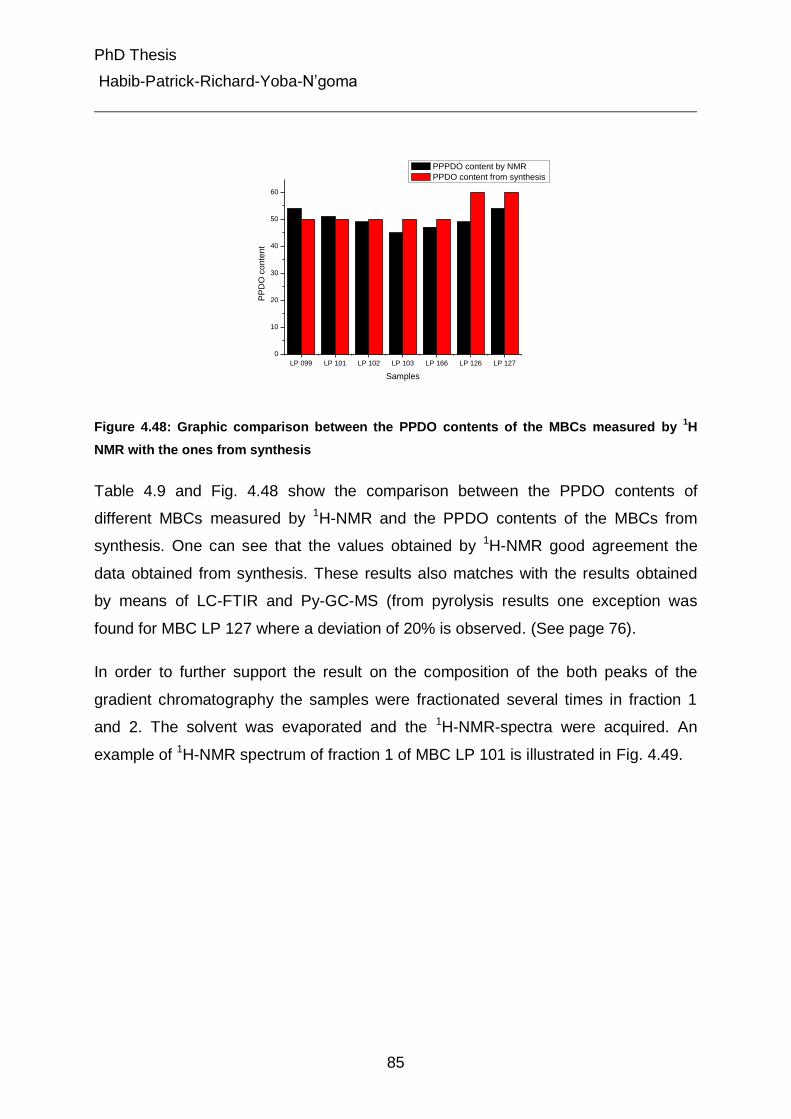
PhD Thesis
Habib-Patrick-Richard-Yoba-N’goma
85
LP 099 LP 101 LP 102 LP 103 LP 166 LP 126 LP 127
0
10
20
30
40
50
60
PP
DO
co
nte
nt
Samples
PPPDO content by NMR
PPDO content from synthesis
Figure 4.48: Graphic comparison between the PPDO contents of the MBCs measured by 1H
NMR with the ones from synthesis
Table 4.9 and Fig. 4.48 show the comparison between the PPDO contents of
different MBCs measured by 1H-NMR and the PPDO contents of the MBCs from
synthesis. One can see that the values obtained by 1H-NMR good agreement the
data obtained from synthesis. These results also matches with the results obtained
by means of LC-FTIR and Py-GC-MS (from pyrolysis results one exception was
found for MBC LP 127 where a deviation of 20% is observed. (See page 76).
In order to further support the result on the composition of the both peaks of the
gradient chromatography the samples were fractionated several times in fraction 1
and 2. The solvent was evaporated and the 1H-NMR-spectra were acquired. An
example of 1H-NMR spectrum of fraction 1 of MBC LP 101 is illustrated in Fig. 4.49.
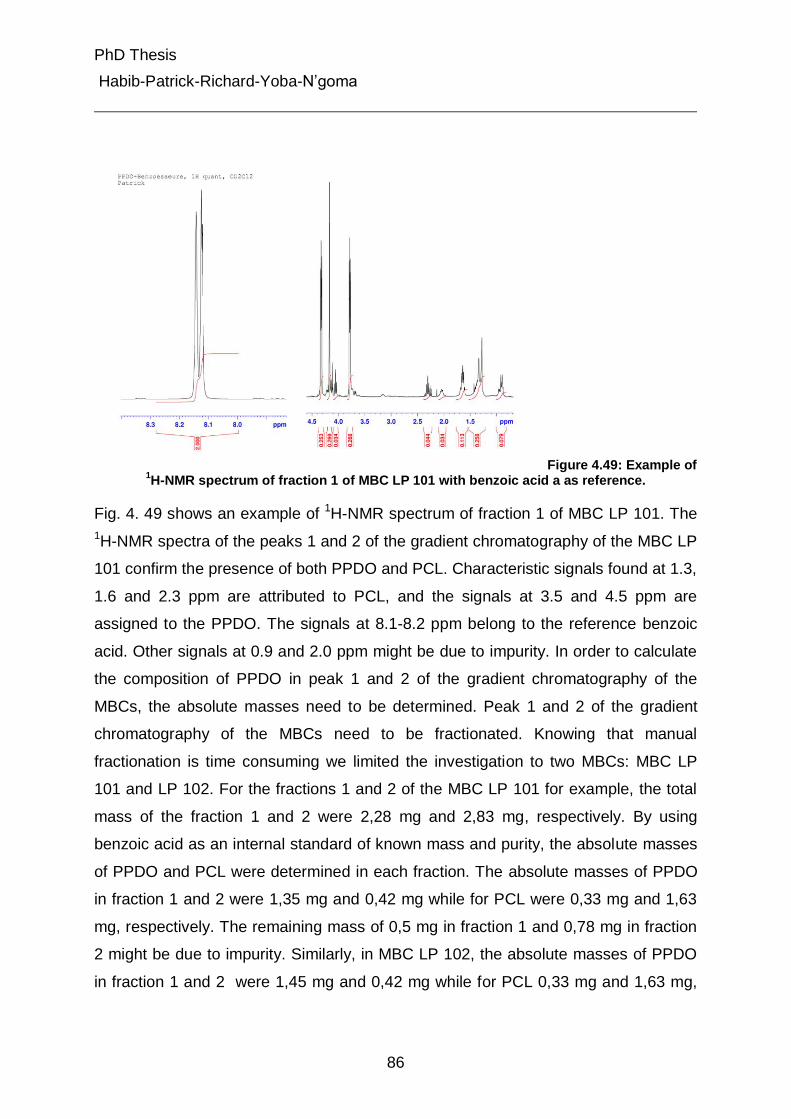
PhD Thesis
Habib-Patrick-Richard-Yoba-N’goma
86
Figure 4.49: Example of 1H-NMR spectrum of fraction 1 of MBC LP 101 with benzoic acid a as reference.
Fig. 4. 49 shows an example of 1H-NMR spectrum of fraction 1 of MBC LP 101. The
1H-NMR spectra of the peaks 1 and 2 of the gradient chromatography of the MBC LP
101 confirm the presence of both PPDO and PCL. Characteristic signals found at 1.3,
1.6 and 2.3 ppm are attributed to PCL, and the signals at 3.5 and 4.5 ppm are
assigned to the PPDO. The signals at 8.1-8.2 ppm belong to the reference benzoic
acid. Other signals at 0.9 and 2.0 ppm might be due to impurity. In order to calculate
the composition of PPDO in peak 1 and 2 of the gradient chromatography of the
MBCs, the absolute masses need to be determined. Peak 1 and 2 of the gradient
chromatography of the MBCs need to be fractionated. Knowing that manual
fractionation is time consuming we limited the investigation to two MBCs: MBC LP
101 and LP 102. For the fractions 1 and 2 of the MBC LP 101 for example, the total
mass of the fraction 1 and 2 were 2,28 mg and 2,83 mg, respectively. By using
benzoic acid as an internal standard of known mass and purity, the absolute masses
of PPDO and PCL were determined in each fraction. The absolute masses of PPDO
in fraction 1 and 2 were 1,35 mg and 0,42 mg while for PCL were 0,33 mg and 1,63
mg, respectively. The remaining mass of 0,5 mg in fraction 1 and 0,78 mg in fraction
2 might be due to impurity. Similarly, in MBC LP 102, the absolute masses of PPDO
in fraction 1 and 2 were 1,45 mg and 0,42 mg while for PCL 0,33 mg and 1,63 mg,
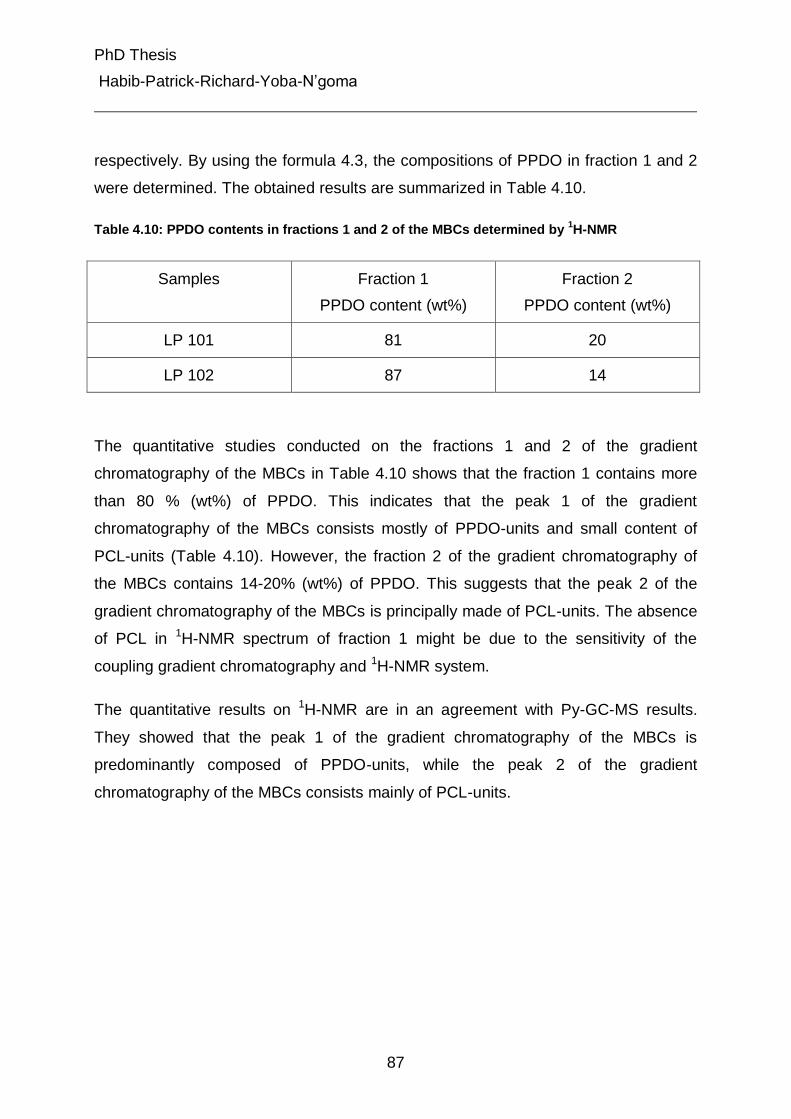
PhD Thesis
Habib-Patrick-Richard-Yoba-N’goma
87
respectively. By using the formula 4.3, the compositions of PPDO in fraction 1 and 2
were determined. The obtained results are summarized in Table 4.10.
Table 4.10: PPDO contents in fractions 1 and 2 of the MBCs determined by 1H-NMR
Samples Fraction 1
PPDO content (wt%)
Fraction 2
PPDO content (wt%)
LP 101 81 20
LP 102 87 14
The quantitative studies conducted on the fractions 1 and 2 of the gradient
chromatography of the MBCs in Table 4.10 shows that the fraction 1 contains more
than 80 % (wt%) of PPDO. This indicates that the peak 1 of the gradient
chromatography of the MBCs consists mostly of PPDO-units and small content of
PCL-units (Table 4.10). However, the fraction 2 of the gradient chromatography of
the MBCs contains 14-20% (wt%) of PPDO. This suggests that the peak 2 of the
gradient chromatography of the MBCs is principally made of PCL-units. The absence
of PCL in 1H-NMR spectrum of fraction 1 might be due to the sensitivity of the
coupling gradient chromatography and 1H-NMR system.
The quantitative results on 1H-NMR are in an agreement with Py-GC-MS results.
They showed that the peak 1 of the gradient chromatography of the MBCs is
predominantly composed of PPDO-units, while the peak 2 of the gradient
chromatography of the MBCs consists mainly of PCL-units.
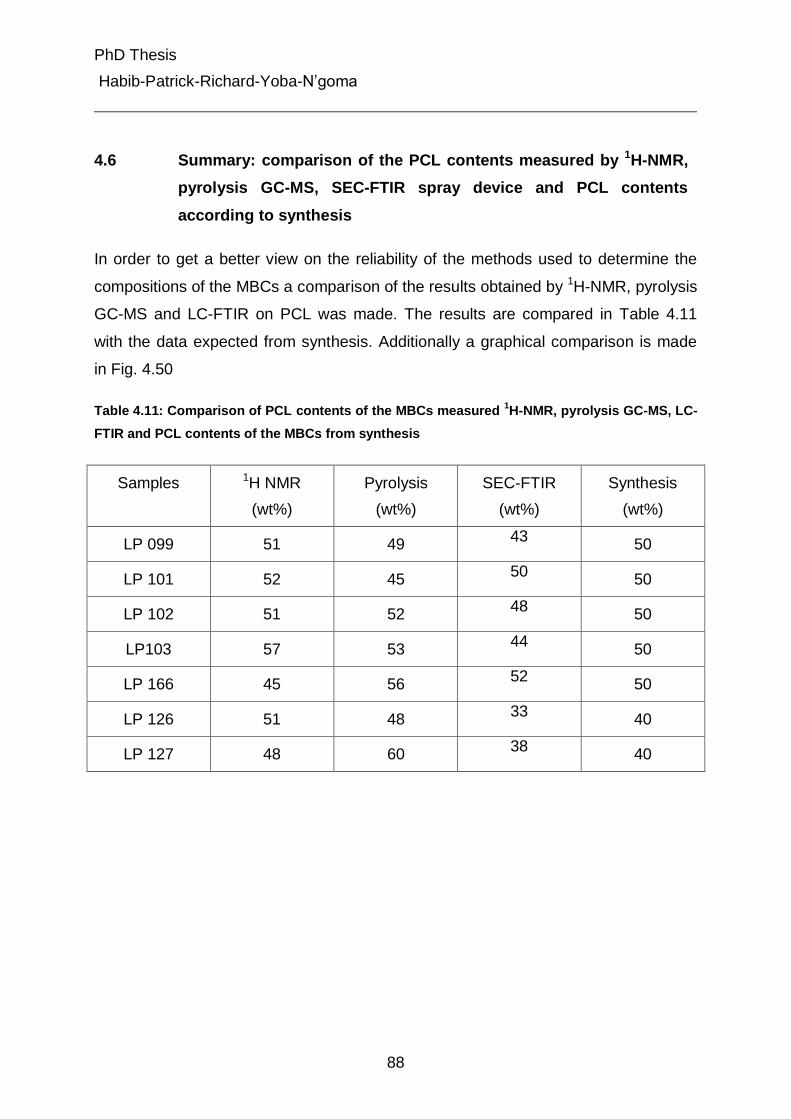
PhD Thesis
Habib-Patrick-Richard-Yoba-N’goma
88
4.6 Summary: comparison of the PCL contents measured by 1H-NMR,
pyrolysis GC-MS, SEC-FTIR spray device and PCL contents
according to synthesis
In order to get a better view on the reliability of the methods used to determine the
compositions of the MBCs a comparison of the results obtained by 1H-NMR, pyrolysis
GC-MS and LC-FTIR on PCL was made. The results are compared in Table 4.11
with the data expected from synthesis. Additionally a graphical comparison is made
in Fig. 4.50
Table 4.11: Comparison of PCL contents of the MBCs measured 1H-NMR, pyrolysis GC-MS, LC-
FTIR and PCL contents of the MBCs from synthesis
Samples 1H NMR
(wt%)
Pyrolysis
(wt%)
SEC-FTIR
(wt%)
Synthesis
(wt%)
LP 099 51 49 43
50
LP 101 52 45 50
50
LP 102 51 52 48
50
LP103 57 53 44
50
LP 166 45 56 52
50
LP 126 51 48 33
40
LP 127 48 60 38
40
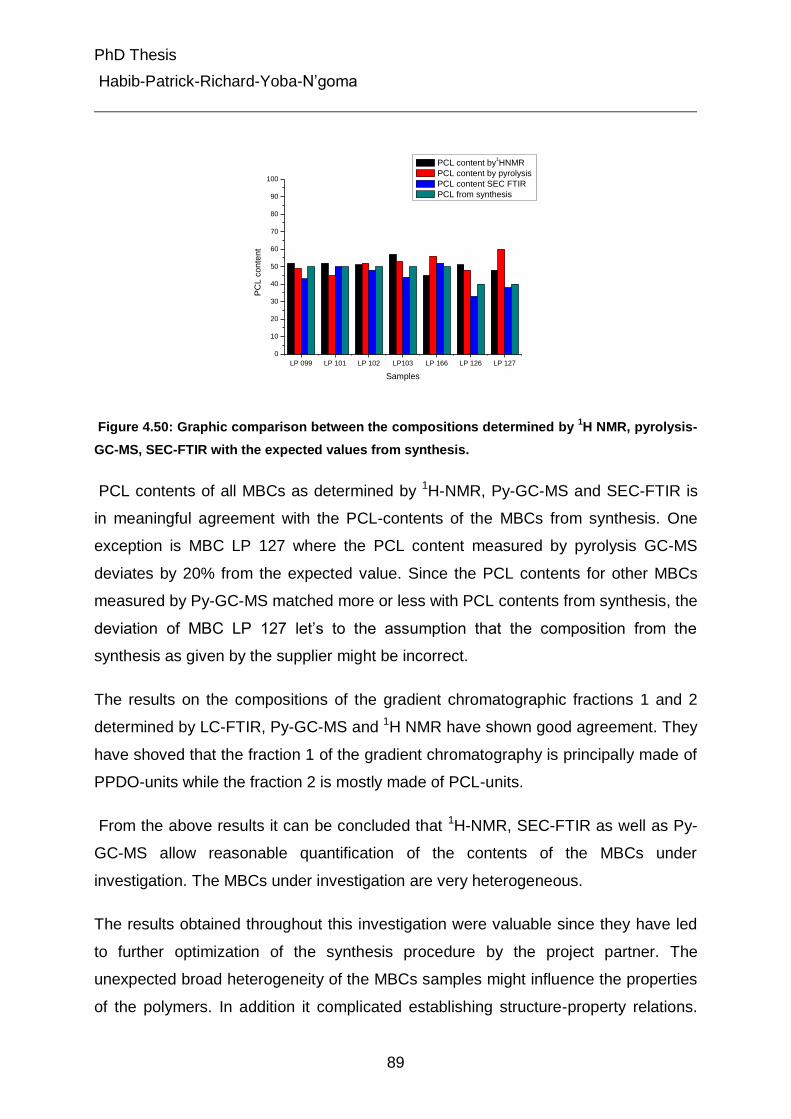
PhD Thesis
Habib-Patrick-Richard-Yoba-N’goma
89
LP 099 LP 101 LP 102 LP103 LP 166 LP 126 LP 127
0
10
20
30
40
50
60
70
80
90
100
PC
L c
on
ten
t
Samples
PCL content by1HNMR
PCL content by pyrolysis
PCL content SEC FTIR
PCL from synthesis
Figure 4.50: Graphic comparison between the compositions determined by 1H NMR, pyrolysis-
GC-MS, SEC-FTIR with the expected values from synthesis.
PCL contents of all MBCs as determined by 1H-NMR, Py-GC-MS and SEC-FTIR is
in meaningful agreement with the PCL-contents of the MBCs from synthesis. One
exception is MBC LP 127 where the PCL content measured by pyrolysis GC-MS
deviates by 20% from the expected value. Since the PCL contents for other MBCs
measured by Py-GC-MS matched more or less with PCL contents from synthesis, the
deviation of MBC LP 127 let’s to the assumption that the composition from the
synthesis as given by the supplier might be incorrect.
The results on the compositions of the gradient chromatographic fractions 1 and 2
determined by LC-FTIR, Py-GC-MS and 1H NMR have shown good agreement. They
have shoved that the fraction 1 of the gradient chromatography is principally made of
PPDO-units while the fraction 2 is mostly made of PCL-units.
From the above results it can be concluded that 1H-NMR, SEC-FTIR as well as Py-
GC-MS allow reasonable quantification of the contents of the MBCs under
investigation. The MBCs under investigation are very heterogeneous.
The results obtained throughout this investigation were valuable since they have led
to further optimization of the synthesis procedure by the project partner. The
unexpected broad heterogeneity of the MBCs samples might influence the properties
of the polymers. In addition it complicated establishing structure-property relations.
PhD Thesis
Habib-Patrick-Richard-Yoba-N’goma
90
Therefore, optimizations of the synthesis process were performed by the project
partner. One is a more elaborated process (two-step growth polymerization) which
yielded MBCs LP 151, 177, 185 187 and 188. In the two-step growth polymerization,
the first step is to react the first polyol with an excess of the diisocyanate to form a
diisocyanate terminated oligomer. The second step consists of adding the second
polydiol in order to convert the isocyanate-terminated prepolymer to the final
polyurethane. This procedure was expected to produce more homogeneous MBCs.
Another procedure is a one-step growth polymerization with different solvents
(modified synthesis) which yielded the MBCs AMC 9, 27, 22/3, 34 and 52. By
changing the solvent one might avoid early phase separation which is suspected to
be one cause of the heterogeneity of MBC.
The relevant characteristic information on molecular parameters of different samples
given by the supplier is listed in Table 4.12.
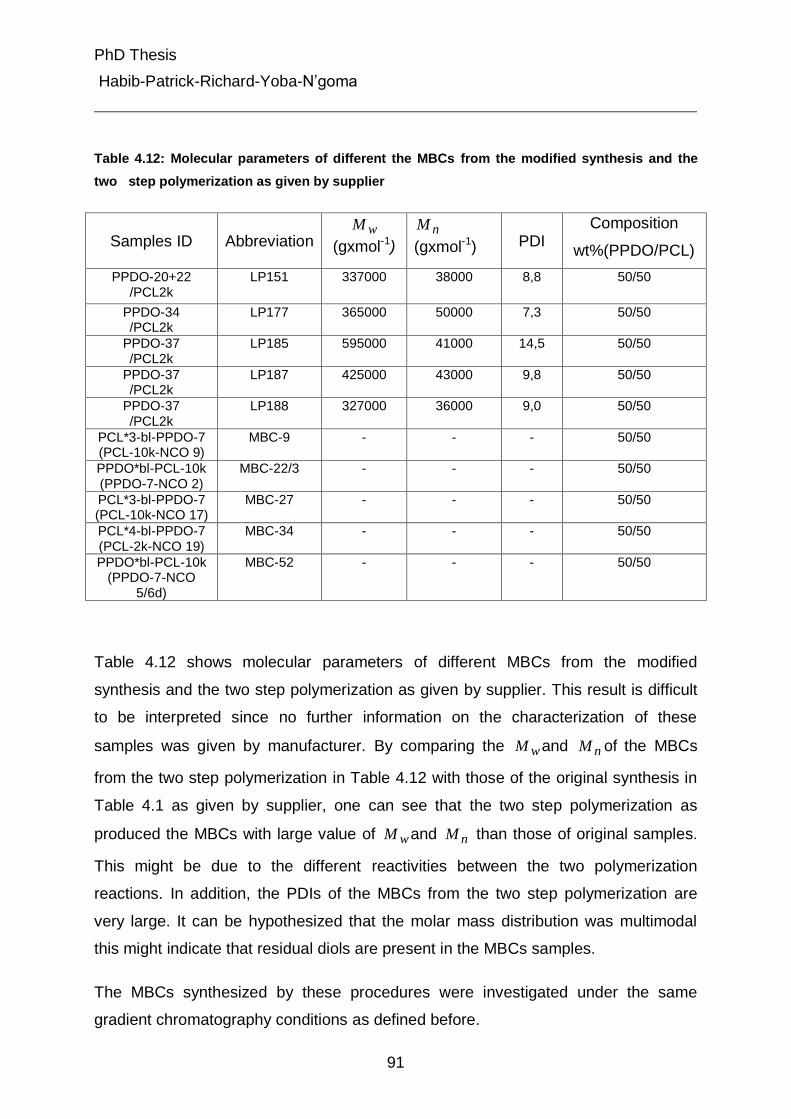
PhD Thesis
Habib-Patrick-Richard-Yoba-N’goma
91
Table 4.12: Molecular parameters of different the MBCs from the modified synthesis and the
two step polymerization as given by supplier
Samples ID
Abbreviation
wM
(gxmol-1) nM
(gxmol-1)
PDI
Composition
wt%(PPDO/PCL)
PPDO-20+22 /PCL2k
LP151 337000 38000 8,8 50/50
PPDO-34 /PCL2k
LP177
365000 50000 7,3 50/50
PPDO-37 /PCL2k
LP185 595000 41000 14,5 50/50
PPDO-37 /PCL2k
LP187 425000 43000 9,8 50/50
PPDO-37 /PCL2k
LP188 327000 36000 9,0 50/50
PCL*3-bl-PPDO-7 (PCL-10k-NCO 9)
MBC-9 - - - 50/50
PPDO*bl-PCL-10k (PPDO-7-NCO 2)
MBC-22/3 - - - 50/50
PCL*3-bl-PPDO-7 (PCL-10k-NCO 17)
MBC-27 - - - 50/50
PCL*4-bl-PPDO-7 (PCL-2k-NCO 19)
MBC-34 - - - 50/50
PPDO*bl-PCL-10k (PPDO-7-NCO
5/6d)
MBC-52
- - - 50/50
Table 4.12 shows molecular parameters of different MBCs from the modified
synthesis and the two step polymerization as given by supplier. This result is difficult
to be interpreted since no further information on the characterization of these
samples was given by manufacturer. By comparing the wM and nM of the MBCs
from the two step polymerization in Table 4.12 with those of the original synthesis in
Table 4.1 as given by supplier, one can see that the two step polymerization as
produced the MBCs with large value of wM and nM than those of original samples.
This might be due to the different reactivities between the two polymerization
reactions. In addition, the PDIs of the MBCs from the two step polymerization are
very large. It can be hypothesized that the molar mass distribution was multimodal
this might indicate that residual diols are present in the MBCs samples.
The MBCs synthesized by these procedures were investigated under the same
gradient chromatography conditions as defined before.
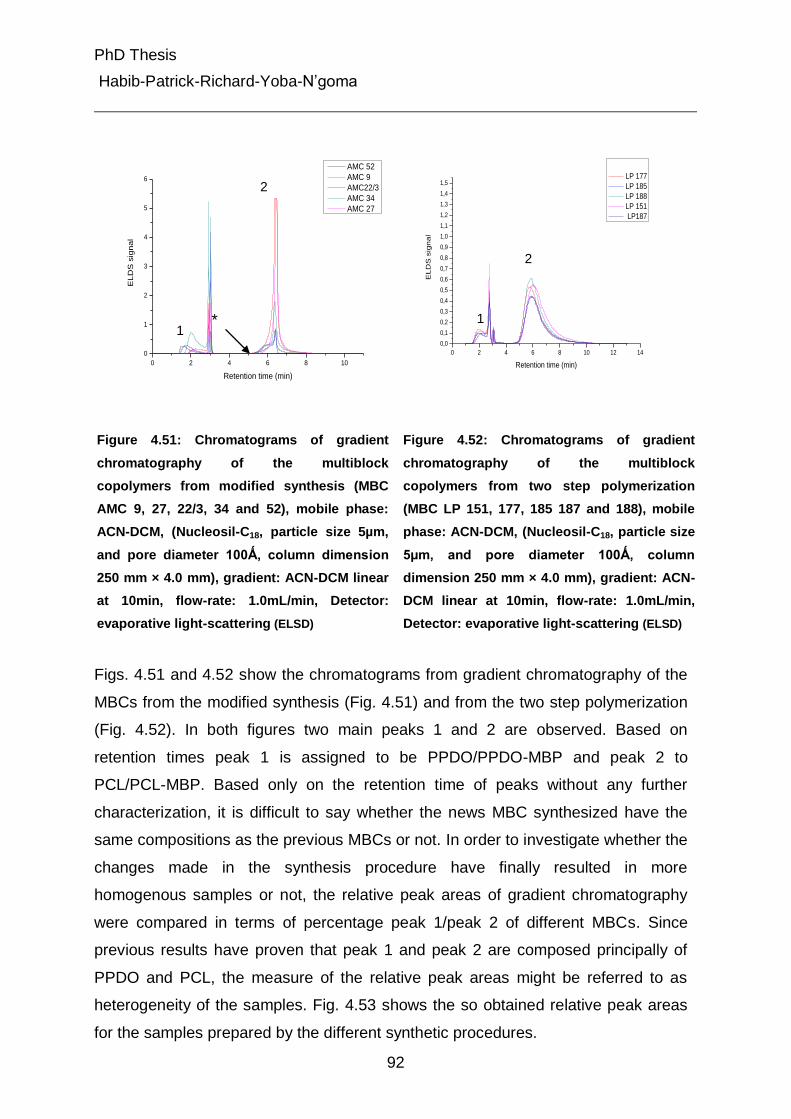
PhD Thesis
Habib-Patrick-Richard-Yoba-N’goma
92
0 2 4 6 8 10
0
1
2
3
4
5
6
EL
DS
sig
na
l
Retention time (min)
AMC 52
AMC 9
AMC22/3
AMC 34
AMC 27
0 2 4 6 8 10 12 14
0,0
0,1
0,2
0,3
0,4
0,5
0,6
0,7
0,8
0,9
1,0
1,1
1,2
1,3
1,4
1,5
EL
DS
sig
na
l
Retention time (min)
LP 177
LP 185
LP 188
LP 151
LP187
Figure 4.51: Chromatograms of gradient
chromatography of the multiblock
copolymers from modified synthesis (MBC
AMC 9, 27, 22/3, 34 and 52), mobile phase:
ACN-DCM, (Nucleosil-C18, particle size 5µm,
and pore diameter 100Ǻ, column dimension
250 mm × 4.0 mm), gradient: ACN-DCM linear
at 10min, flow-rate: 1.0mL/min, Detector:
evaporative light-scattering (ELSD)
Figure 4.52: Chromatograms of gradient
chromatography of the multiblock
copolymers from two step polymerization
(MBC LP 151, 177, 185 187 and 188), mobile
phase: ACN-DCM, (Nucleosil-C18, particle size
5µm, and pore diameter 100Ǻ, column
dimension 250 mm × 4.0 mm), gradient: ACN-
DCM linear at 10min, flow-rate: 1.0mL/min,
Detector: evaporative light-scattering (ELSD)
Figs. 4.51 and 4.52 show the chromatograms from gradient chromatography of the
MBCs from the modified synthesis (Fig. 4.51) and from the two step polymerization
(Fig. 4.52). In both figures two main peaks 1 and 2 are observed. Based on
retention times peak 1 is assigned to be PPDO/PPDO-MBP and peak 2 to
PCL/PCL-MBP. Based only on the retention time of peaks without any further
characterization, it is difficult to say whether the news MBC synthesized have the
same compositions as the previous MBCs or not. In order to investigate whether the
changes made in the synthesis procedure have finally resulted in more
homogenous samples or not, the relative peak areas of gradient chromatography
were compared in terms of percentage peak 1/peak 2 of different MBCs. Since
previous results have proven that peak 1 and peak 2 are composed principally of
PPDO and PCL, the measure of the relative peak areas might be referred to as
heterogeneity of the samples. Fig. 4.53 shows the so obtained relative peak areas
for the samples prepared by the different synthetic procedures.
1
2
1
2
*
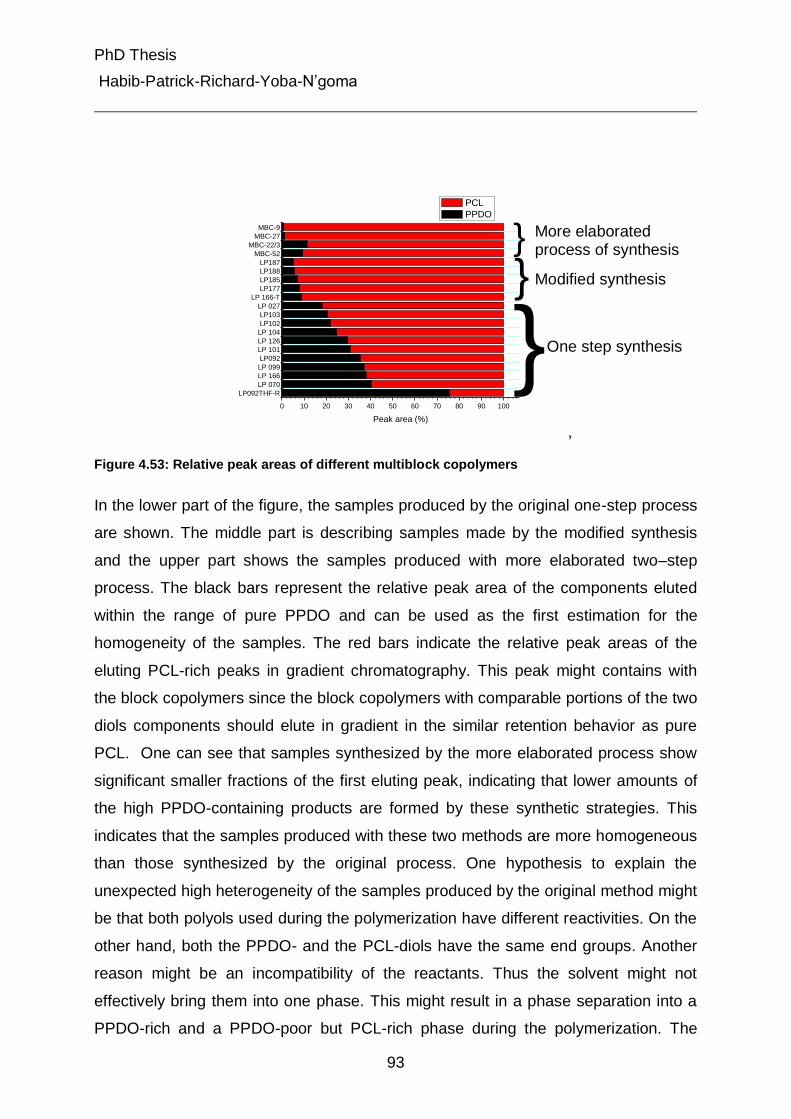
PhD Thesis
Habib-Patrick-Richard-Yoba-N’goma
93
LP092THF-R
LP 070
LP 166
LP 099
LP092
LP 101
LP 126
LP 104
LP102
LP103
LP 027
LP 166-T
LP177
LP185
LP188
LP187
MBC-52
MBC-22/3
MBC-27
MBC-9
0 10 20 30 40 50 60 70 80 90 100
}}
Peak area (%)
PCL
PPDO
}
,
Figure 4.53: Relative peak areas of different multiblock copolymers
In the lower part of the figure, the samples produced by the original one-step process
are shown. The middle part is describing samples made by the modified synthesis
and the upper part shows the samples produced with more elaborated two–step
process. The black bars represent the relative peak area of the components eluted
within the range of pure PPDO and can be used as the first estimation for the
homogeneity of the samples. The red bars indicate the relative peak areas of the
eluting PCL-rich peaks in gradient chromatography. This peak might contains with
the block copolymers since the block copolymers with comparable portions of the two
diols components should elute in gradient in the similar retention behavior as pure
PCL. One can see that samples synthesized by the more elaborated process show
significant smaller fractions of the first eluting peak, indicating that lower amounts of
the high PPDO-containing products are formed by these synthetic strategies. This
indicates that the samples produced with these two methods are more homogeneous
than those synthesized by the original process. One hypothesis to explain the
unexpected high heterogeneity of the samples produced by the original method might
be that both polyols used during the polymerization have different reactivities. On the
other hand, both the PPDO- and the PCL-diols have the same end groups. Another
reason might be an incompatibility of the reactants. Thus the solvent might not
effectively bring them into one phase. This might result in a phase separation into a
PPDO-rich and a PPDO-poor but PCL-rich phase during the polymerization. The
More elaborated process of synthesis
Modified synthesis
One step synthesis

PhD Thesis
Habib-Patrick-Richard-Yoba-N’goma
94
simultaneous copolymerization in two phases of different composition might then
result in a high heterogeneity of the final product. This assumption could also explain
the observed more homogenous product distributions when changing the reaction
solvent.
PhD Thesis
Habib-Patrick-Richard-Yoba-N’goma
95
5. Experimental Part
5.1 Chromatographic equipment
Separations were carried out on a Shimadzu system (Kyoto, Japan) comprising a
DG-2410 degasser, a FCV-10ALvp solvent mixing chamber, a LC-10ADvp pump.
The temperature was regulated with a column oven model K4 from Techlab. For
detection, an evaporative light scattering detector, ELSD 1000 (Polymer
Laboratories, Church Stretton, England) and/or a differential refractive index detector
Waters 450 (Waters, Milford, MA, USA) was used. For data collection and processing
the software package “WinGPC-Unity” software v. 7.0” (Polymer Standards Service
GmbH, Mainz, Germany) was used.
5.2 Chromatographic columns
SEC
A set of two of PSS SDV columns (103, 105 Å, each 300 x 8 mm I.D.; Polymer
Standards Service, Mainz, Germany) was used.
Gradient HPLC and LCCC
Nucleosil C18; (Macherey–Nagel, Düren, Germany). Particle size 5 μm, pore
diameter 300 Å, column dimensions 250×4.0 mm i.d.
Nucleosil bare silica (Macherey–Nagel, Düren, Germany).Particle size 7 μm, pore
diameter 1000 Å, column dimensions 250×4.0 mm i.d.
Gradient HPLC and LC-CC samples were prepared by dissolution of samples in
highly concentrated HFIP (3-5 drops), followed by dilution with ACN.
Following solvents were used as received:
Acetonitril (ACN), HPLC grade, Acros Organics, Dichloromethane (DCM), Chloroform
(CHCl3) and Dimethylformamide (DMF), were purchased from VWR (West Chester,
PA, USA) and are all HPLC grade.
PhD Thesis
Habib-Patrick-Richard-Yoba-N’goma
96
Tetrahydrofuran (THF, BASF) was refluxed and distilled from CaH2
Polymer standards
All narrow distributed polymer standards of polystyrene (PS) are synthesized and
distributed by Polymer Standards Service GmbH (Mainz, Germany), unless otherwise
mentioned.
Samples
Samples were delivered by GKSS Forschungszentrum Geesthacht GmbH,
(Germany, Teltow):
Molar mass analysis by MALDI-ToF-MS
Mass spectra were aquired using an AXIMA ToF2 Spectrometer (Shimadzu Biotech,
Kyoto, Japan). Spectra were recorded and integrated with the software Shimadzu
Biotech. The polymers were dissolved in HFIP at a concentration of 0.5-4 mg/mL.
The matrix (trihydroxyanthracene) was dissolved in dioxane at a concentration of
10mg/mL.
LC-FTIR interface and FTIR spectrometer
LC-FTIR coupling accomplished using a LC-Transform 600XY system
(LabConnections, A mocon company, Northborough, MA, USA). After evaporation of
the mobile phase samples were deposited on square Germanium plates (55 x 55
mm). Spraying conditions were: gas flow 30 psi, the nozzle temperature 160°C, plate
speed of 20 mm/min.
FTIR analyses of the fractions were carried out on a Nicolet Protégé 460 FTIR
spectrometer (Thermo Scientific, Waltham, MA, USA). Spectra were recorded
between 800 and 4000 cm-1 every 2 mm along the sample track. 32 scans were
taken per spectrum. Data acquisition and treatment were performed with the software
Omnic developed by the spectrometer manufacturer:
PhD Thesis
Habib-Patrick-Richard-Yoba-N’goma
97
NMR
NMR spectra were acquired on a 400 MHz spectrometer Varian (Mercury VX 400,
Sao Paulo, USA) with a 5 mm, inverse detection CID probe at an observing
frequency of 400.12 for 1H. Samples were dissolved in deuterated (CD2Cl2) Further
experimental parameters were as follows:
1H-NMR: 90°exciting pulse 9.8 µs, 64k data points corresponding to an
acquisition time of 7s, relaxation delay of 30s and total of 128 scans and
spectra width was 12 ppm.
LC-NMR: measurements were performed using a probe containing a 60µL
flow cell. The 90° 1H pulse was 4.7µs, 16k data points corresponding to an
acquisition time of 1.0s, relaxation delay of 0.1 s and total of 16 scans. Spectra
width was 20ppm and WET with 13C decoupling was optimized to suppress
signals of chloroform.
Pyrolysis-GC-MS
The analysis of the pyrolysis products was carried out using the SHIMADZU QP-
5000 GC/MS system (Analytical Instrument Division, Kyoto, Japan). Pyrolyzer: Pyr
4A, Pyrolyzation temperature: 450°C, column: RTX-5Sil MS, 30m, 0,25mm, 5µm,
Gas: He, Gas flow: 7,1mL/min, Temperature program: 60-320°C, Scanning range:
33-200m/z, Data point density: 0,5sec, Sample amount: 20µL.
5.3 Polymer synthesis
The following part of the thesis gives a short overview on the synthetic routes of the
macrodiols, multiblock polymers and multiblock copolymers used throughout the
present work. Multiblock polymers are defined as polymers which are linked with two
or more macrodiols of the same type, multiblock copolymers however are defined as
polymers which are linked with two or more macrodiols of the different type.
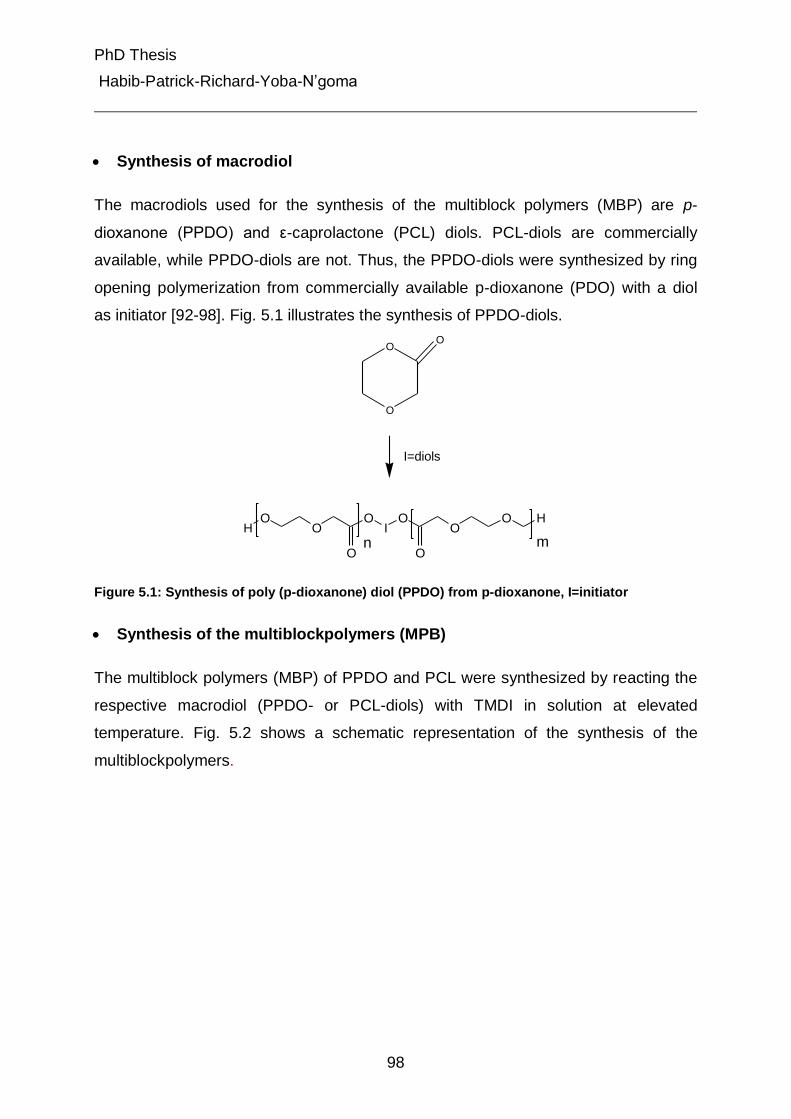
PhD Thesis
Habib-Patrick-Richard-Yoba-N’goma
98
Synthesis of macrodiol
The macrodiols used for the synthesis of the multiblock polymers (MBP) are p-
dioxanone (PPDO) and ε-caprolactone (PCL) diols. PCL-diols are commercially
available, while PPDO-diols are not. Thus, the PPDO-diols were synthesized by ring
opening polymerization from commercially available p-dioxanone (PDO) with a diol
as initiator [92-98]. Fig. 5.1 illustrates the synthesis of PPDO-diols.
HO
OO
IO
OO H
O O
O
OO
n m
I=diols
Figure 5.1: Synthesis of poly (p-dioxanone) diol (PPDO) from p-dioxanone, I=initiator
Synthesis of the multiblockpolymers (MPB)
The multiblock polymers (MBP) of PPDO and PCL were synthesized by reacting the
respective macrodiol (PPDO- or PCL-diols) with TMDI in solution at elevated
temperature. Fig. 5.2 shows a schematic representation of the synthesis of the
multiblockpolymers.
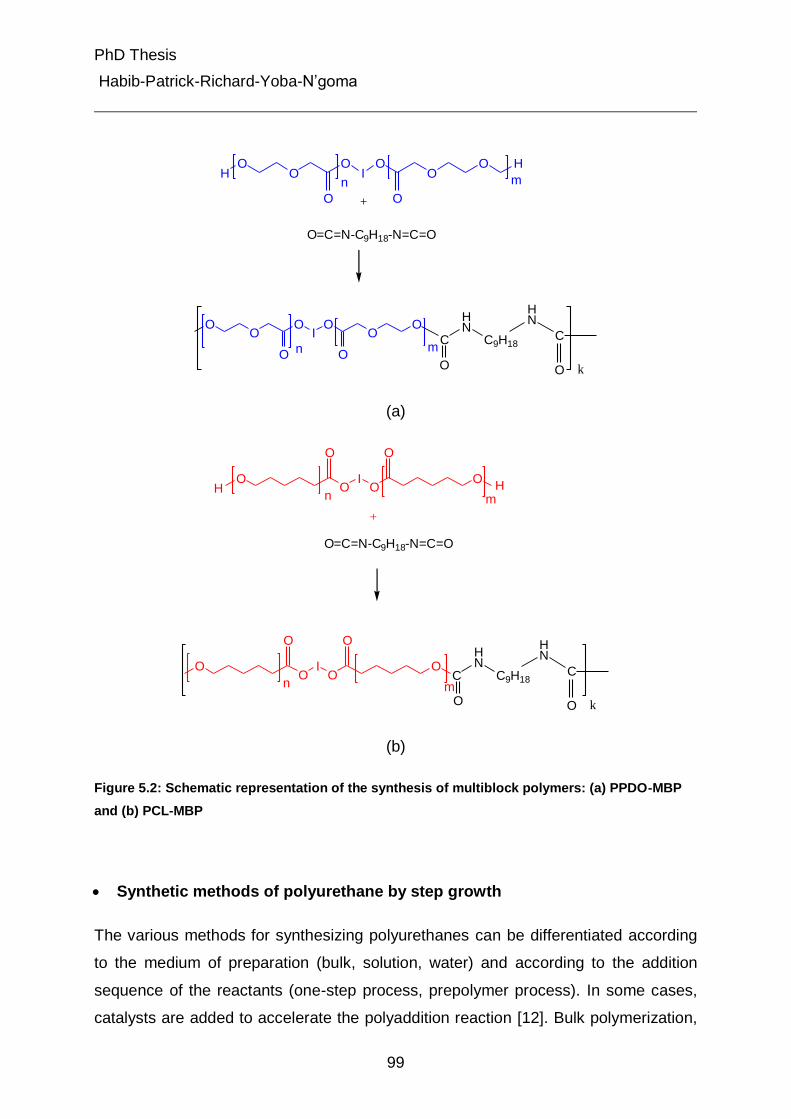
PhD Thesis
Habib-Patrick-Richard-Yoba-N’goma
99
HO
OO
IO
OO H
O O
O=C=N-C9H18-N=C=O
+
OO
OI
OO
O
O OC
HN
O
C9H18n m
HN
C
O k
n m
(a)
OO
IO
O
O O
n m
OO
IO
O
O O
n mHH
O=C=N-C9H18-N=C=O
+
C
HN
O
C9H18
HN
C
O k
(b)
Figure 5.2: Schematic representation of the synthesis of multiblock polymers: (a) PPDO-MBP
and (b) PCL-MBP
Synthetic methods of polyurethane by step growth
The various methods for synthesizing polyurethanes can be differentiated according
to the medium of preparation (bulk, solution, water) and according to the addition
sequence of the reactants (one-step process, prepolymer process). In some cases,
catalysts are added to accelerate the polyaddition reaction [12]. Bulk polymerization,
PhD Thesis
Habib-Patrick-Richard-Yoba-N’goma
100
either one-step or two-step, has been the main industrial process for polyurethane
production, because of its environmentally friendly solvent-free synthesis. Solution
polymerization has largely been used in laboratory synthesis of polyurethanes. The
different synthetic processes have an effect on the heterogeneity of the final product.
For example, during polyurethane bulk synthesis, the incompatibility between the
reactants might induce formation of a heterogeneous system or the system becomes
heterogeneous at a relatively early stage of the polymerization. This might lead to
formation of the heterogeneous polymer in both molar mass and chemical
composition. This heterogeneity might affect the properties of the final product.
However, in the solution process, the problem of heterogeneity can be avoided by
selection of a suitable choice of solvent. Reactants incompatible in bulk might be
dissolved in a suitable solvent resulting in a homogenous one phase system.
Common solvents used in polyurethane synthesis are dipolar aprotic solvents
including N, N'-dimethylacetamide (DMAc) and dimethylformamide (DMF). In a one
step synthesis, the reaction is carried out by simultaneously mixing a polyol, and
diisocyanate together in the reaction solvent and heating the solution at elevated
temperature. In some cases, catalysts are applied to accelerate the reaction. The
reaction rate is usually determined by the temperature profile of chemical reaction
[13].
Synthesis of the investigated multiblock copolymers (MBCs)
The MBC used in this study were synthesized as one-step reaction by simultaneously
mixing the macrodiols (PPDO- and PCL-diols), and trimethyl hexamethylene
diisocyanate (TMDI), together in the solvent and heating the solution at elevated
temperature. Fig. 5.3 shows a schematic representation of the synthesis of the
multiblock copolymers.
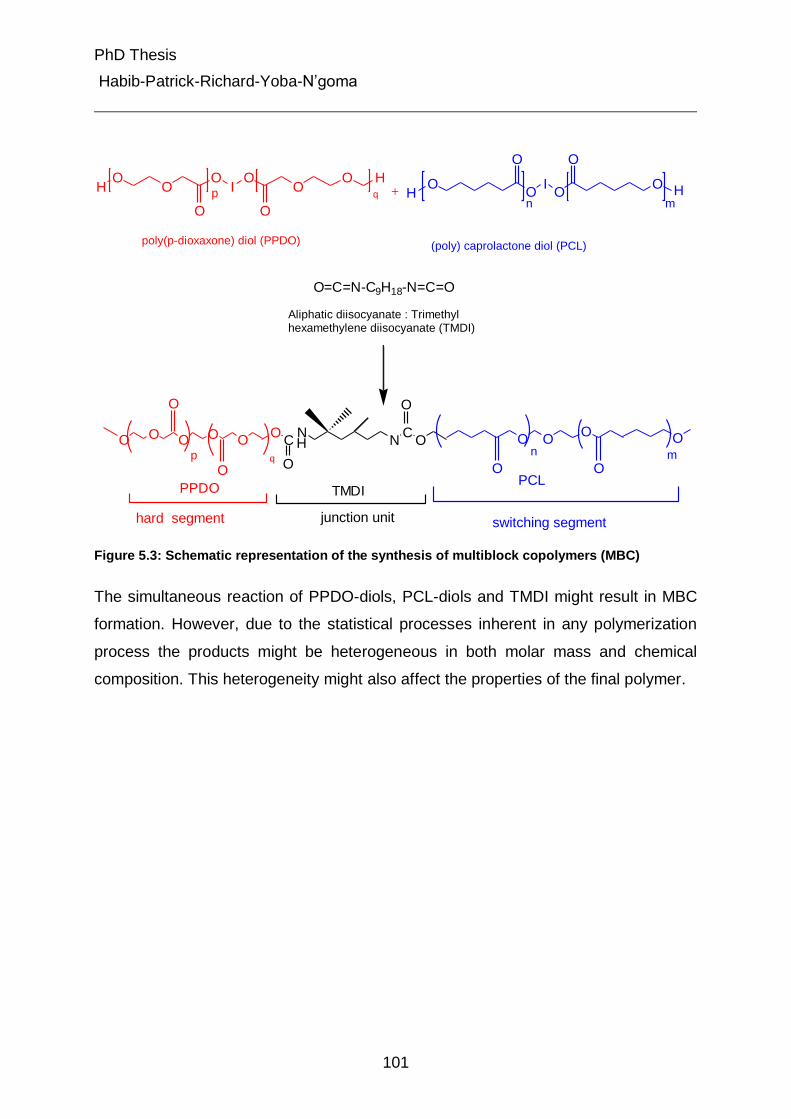
PhD Thesis
Habib-Patrick-Richard-Yoba-N’goma
101
OO
IO
O
O O
HH
O=C=N-C9H18-N=C=O
HO
OO
IO
OO H
O On m
+p
poly(p-dioxaxone) diol (PPDO) (poly) caprolactone diol (PCL)
Aliphatic diisocyanate : Trimethyl hexamethylene diisocyanate (TMDI)
q
O O O O O
O
O
OC
NN
COH
O
O
O OO
O O
O
hard segment
PCL
switching segment
PPDO TMDI
junction unit
p qn m
Figure 5.3: Schematic representation of the synthesis of multiblock copolymers (MBC)
The simultaneous reaction of PPDO-diols, PCL-diols and TMDI might result in MBC
formation. However, due to the statistical processes inherent in any polymerization
process the products might be heterogeneous in both molar mass and chemical
composition. This heterogeneity might also affect the properties of the final polymer.
PhD Thesis
Habib-Patrick-Richard-Yoba-N’goma
102
6. Summary and Conclusions
The interest and the need for innovative products with new properties lead to the
development of a large variety of new complex polymer materials. This results in an
increasing demand in characterization tools allowing understanding the molecular
structure of these new products in order to relate them to the observed properties,
which finally will allow establishing structure-property relationships. Such knowledge
allows for optimization of the synthesis parameters and consequently of the final
application properties.
The aim of this work was to develop analytical methods and tools to characterise the
functionality type distribution (FTD) of poly (p-dioxanone)- (PPDO) and poly
(caprolactone)-diol (PCL) samples. In addition information on the heterogeneities of
multiblock copolymers (MBC) derived by reacting mixtures of the two polymeric diols
with diisocyanates was requested.
First chromatographic conditions were developed to determine the number of OH end
groups in PCL and PPDO-diols. Critical conditions for PCL were established on a
polar stationary phase, using 92%/8% dichloromethane (DCM) and tetrahydrofuran
(THF). For all the PCL-diols two peaks were observed. The first peak eluted close to
the void volume of the column indicating the presence of PCL molecules without
polar OH end groups. The second peak eluted at higher retention times. This is due
to the additional interaction of the two OH end group with the stationary phase.
Although critical conditions were applied, the PCL-diols eluted in the order of
decreasing molar mass. The reason for this elution behaviour might be that only at
high molar masses of the two OH end groups adsorb statistically independent. If the
polymer chain, however, is short, the statistical independence is not valid any longer.
If the first OH-group is adsorbed, the second OH-group is in the proximity of the
stationary phase and the probability for its simultaneous adsorption is enhanced,
resulting in prolonged retention.
A linear 10 minutes gradient ranging from 100% DCM to 100% dimethylformamide
(DMF) was employed on a polar stationary phase to separate PPDOs according to
their end groups. Under the chromatographic conditions chosen the PPDO-diol
samples showed two separated peaks. The characterization of the chromatographic
PhD Thesis
Habib-Patrick-Richard-Yoba-N’goma
103
fractions using matrix assisted laser desorption ionisation time of flight mass
spectrometry (MALDI-TOF-MS) revealed the first peak to contain PPDOs with two
OH end groups as the predominant structure. The MALDI-TOF spectra for the
second peaks showed three different series. The masses of the three series were
consistent cyclic PPDOs, PPDOs carrying one carboxyl and one OH end group and
PPDOs having one Li-carboxylate and one OH end group.
To gain insight into the chemical heterogeneity of the MBCs samples a gradient
method was developed. The method allowed separating PPDO-diols and PPDO-
multiblock polymers (MBP) from the PCL-diols and the PCL-MBPs. MBPs were
derived by linking either PCL- or PPDO-diols with a diisocyanate. The application of
the developed gradient to the MBC-samples resulted in two well separated main
peaks. The first peak eluted in SEC mode before the start of the gradient in the
retention range of the PPDO-diols and the PPDO-MBPs. Since at the start of the
experiment the eluent promotes adsorption of PCL, the retention volume of the first
peak therefore suggests the existence of purely PPDO containing structures in the
MBC-samples. The second peak eluted at retention times similar to PCL-diols and
PCL-MBPs. Since in gradient chromatography the retention of a block copolymer is
mainly determined by the chemical structure of the adsorbing block, a homopolymer
of the same chemical structure than the adsorbing block is expected elute close to
the block copolymer. Thus, based on the retention time of the second peak in
gradient chromatography, this peak might consist of only PCL containing structures
and/or the true multiblock copolymer.
In order to clarify whether the second peak contains true multiblock copolymer
structures or only PCL containing structures (diols and MBPs), liquid chromatography
under critical conditions (LCCC) for PCL was applied. On a reverse phase column
critical conditions for PCL were achieved at 76% acetonitrile (ACN) and 24% DCM.
Under these conditions PPDO containing structures are expected to elute before the
void volume. Purely PCL containing structures are expected to elute at the void
volume. Analysis of the MBC-samples at critical conditions revealed two main peaks
in all chromatograms. Based on the elution volume the first peak is assumed to result
from PPDO-diols, and/or PPDO-MBPs and/or MBCs. The second peak, eluting at the
void volume, was assigned to “pure” PCL and/or PCL-MBP.
PhD Thesis
Habib-Patrick-Richard-Yoba-N’goma
104
According to the chromatographic results it can be concluded that the MBCs contain
significant amount of purely PPDO-containing (gradient chromatography) as well as
purely PCL-containing (LCCC) structures. However, the existence of MBCs cannot
be excluded based on the experiments so far, since the MBCs are expected to
coelute with MBPs or diols in both of the chromatographic modes.
In order to validate the assignments of the peaks of the gradient chromatography and
to find out about the existence of MBC-structures, identification of the peaks was
conducted by means of off-line Fourier Transform Infrared (FTIR). The FTIR
spectrum of the first peak revealed the characteristic absorption bands of PPDO
while the bands characteristic for PCL were absent, indicating the presence of only
PPDO-structures. The FTIR-spectrum of the second peak reveals the characteristic
bands of PCL whereas the characteristics bands of PPDO were not found. This
suggests that fraction 2 of the MBC from gradient chromatography consists mainly of
PCL-units. These results therefore are in an agreement with the assignments based
on the retention times. In addition the result indicates that peaks observed in gradient
chromatography of the MBC-samples consist of purely PPDO- and purely PCL-
containing structures. Accordingly the MBC-samples seem to be composed of
PPDO/PPDO-MBP and PCL/PCL-MBP.
Since the results were rather unexpected, additional proof was aimed for. Pyrolysis
gas chromatography/mass spectrometry (Py-GC-MS) was used as an alternative
method to FTIR to verify the results. Gradient chromatography was used to
fractionate the MBC-sample into two fractions, corresponding to the observed peaks.
The resulting fractions were then analyzed by Py-GC-MS. Based on quantitative
studies, the first peak of the gradient chromatography of the MBCs contained more
than 80 % (wt%) of PPDO content whereas in the second peak of the gradient
chromatography of the MBCs, 0-10% (wt%) of PPDO were found.
The results of the Py-GC-MS and FTIR studies on the fractions are qualitatively in
good agreement. They clearly proof a strong difference in chemical composition of
the two peaks in gradient chromatography. However, the quantitative results differ.
According to the results of FTIR the peaks contain either PPDO- or PCL units, while
Py-GC-MS detects smaller amounts of the respective other polyester in each peak.
PhD Thesis
Habib-Patrick-Richard-Yoba-N’goma
105
Further characterization of fractions 1 and 2 of the gradient chromatography of the
MBCs was performed by proton nuclear magnetic resonance (1H-NMR). Quantitative
1H-NMR-studies conducted on the two fractions showed that the first fraction
contains more than 80 % (wt %) of PPDO, while the second fraction contains 20%
(wt %) of PPDO. The 1H-NMR results are therefore in qualitative an agreement with
Py-GC-MS results. They showed that the peak 1 of the gradient chromatography of
the MBCs is predominantly composed of PPDO-units, while the peak 2 of the
gradient chromatography of the MBCs consists mainly of PCL-units.
From the results above it can be concluded that the MBCs under investigation are
very heterogeneous. Thus, these results were valuable since they led to optimize of
the synthesis conditions of the MBCs in order to reduce the chemical heterogeneity
PhD Thesis
Habib-Patrick-Richard-Yoba-N’goma
106
7. List of Abbreviations and Symbols
ACN Acetonitrile
ATR Attenuated Total Reflection
C Sample concentration
CCD Chemical composition distribution
CHCl3 Chloroform
DCM Dichloromethane
DMAc N, N'-dimethylacetamide
DMF Dimethylformamide
ELSD Evaporative Light Scattering Detector
F Flow rate
FTD Functionality type distribution
FTIR Fourier Transform Infra Red
Ge Germanium
GLC Gradient Liquid Chromatography
He Hel ium
HFIP Hexafluoroisopropanol
HPLC High Performance Liquid Chromatography
IUPAC Union of Pure and Applied Chemistry
dK Distribution coefficient
KLAC Contribution of adsorption to distribution coefficient
KSEC Contribution of size exclusion to distribution coefficient
LAC Liquid Adsorption Chromatography
LC Liquid chromatography
LC-CC Liquid Chromatography at Critical Conditions
MALDI Matrix-Assisted Laser/Desorption Ionization
MBC Multiblock copolymer
MBP Multiblock polymer
nM Number average molar mass
wM Weight average molar mass
MWD Molar mass distribution
PhD Thesis
Habib-Patrick-Richard-Yoba-N’goma
107
NMR Nuclear Magnetic Resonance
PCL poly (ε-caprolactone)
PDI Polydispersity Index
PDO 1,4-dioxane-2-one
PPDO poly (p-dioxanone)
PU polyurethane
Py-GC-MS Pyrolysis Gas Chromatography Mass Spectrometry
r Ratio
R Gas constant
RP Reverse Phase
SEC Size Exclusion Chromatography
SMAs Shape memory alloys
SME Shape memory effect
SMMs Shape memory materials
SMPs Shape memory polymers
T Absolute temperature
Tg Glass transition temperature
%T Transmission
THF Tetrahydrofuran
TIC Total ion chromatogram
TMDI Trimethyldiisocyanate
tR Retention time
V0 Hold-up volume of the system
Vi Column interstitial volume
Vd Dwell volume
Vp Pore volume of the HPLC column
VR Retention volume
G Free Gibbs energy difference
H Change in adsorption enthalpy
S Change in conformational entropy
PhD Thesis
Habib-Patrick-Richard-Yoba-N’goma
108
8. Bibliographic References
1 Hasiguti R. R, Iwasaki K., J Appl. Phys. (1968), 39, 2182
2 Tadaki T, Otsuka K, Shimizu K, Ann.Rev. Mater.Sci, (1988), 18, 25
3 Das N.C, Chaki T.K, Khastgir D, Polymer International, (2002), 51 (2), 156
4 Hayashi S, International Progress in Urethanes, (1993), 6, 90
5 Liang C, Rogers C.A, Malafeew E, Journal of Intelligent Material Systems and
Structures, (1997), 8 (4), 380
6 T, Tanaka K, Ichimura K, Macromol, (1997), 30 (20), 6401
7 A, Kelch S, Angew. Chem.Int, (2002), 41, 2034
8 Lu X, Sun Z, Cai W, Phys.Scr, (2007),T129, 231
9 Wang Y, Li Y, Luo Y, Huang M, Liang Z, Materials Letters, (2009), 63, 347
10 Petrovic Z, Ferguson J, Prog. Polym. Sci., (1991), 16, 695
11 Yang J.H, Chun B.C, Chung Y.C, Cho J.H, Polymer, (2003), 44 (11), 3251
12 Grablowitz H, Lendlein A, J. Mater. Chem. (2007), 17, 4050
13 Lelah M.D, Cooper S. L, Polyurethane in Medicine, CRC press, Boca Raton,
(1986)
14 Pasch H, Adv Polymer Sci, (2000), 157, 1
15 Albrecht A, Brüll R, Macko T, Sinha P, Pasch H, Macromol Chem Phys,
(2008), 209, 1909
16 Ellere L.S, Pure Appl.Chem, (1993), 65, 819
17 Pasch H, Trathnigg B, HPLC of Polymers, Springer-Verlag, Berlin
Heidelberg,Germany, (1998)
PhD Thesis
Habib-Patrick-Richard-Yoba-N’goma
109
18 Glöckner G, Adv. Polym. Sci., (1986), 79, 159
19
Gorshkov A.V, Much H, Becker H, Pasch H, Evreinov V.V, Entelis S.G, J.
Chromatogr., (1990), 523, 91
20 Mengerink Y, Peters R, Van der Wal Sj, Claessens H. A, Cramers C.A,
J. Chromatogr. A, (2002), 949, 337
21 Pasch H, Brinkmann C, Much H, Just U, J. Chromatogr., (1992), 623, 315
22 Pasch H, Augenstein M, Trathnigg B, Macromol. Chem. Phys., (1994), 195,
743
23 Falkenhagen J, Much H, Stauf W, Müller A.H.E, Macromol, (2000), 33, 3687
24 Macko T, Hunkeler D, Adv. Polym. Sci., (2003), 163, 61
25 Wilczek-Vera G, Yu1 Y, Waddell K, Danis PO, Eisenberg A, Rapid Commum
Mass Spectrom, (1999), 13, 764
26 Hiller W, Sinha P, Pasch H, Macromol Chem Physic, (2007), 208, 1965
27 Mubasher AB, Brüll A, Radke W, Polymer, (2005), 46, 3223
28 Mengerink Y, Peters R, Van der Wal Sj, Claessens H. A, Cramers C.A, J.
Chromatogr. A, (2001), 131, 145
29 Pasch H, Adv.Polym.Sci, Springer-Verlag, Berlin Heidelberg, Germany,
(1997)
30 Liu C, Qin H, Mather H.T, J. Mater. Chem., (2007), 17, 1543
31 Snyder L.R, Kirkland J. J, Introduction to Modern Liquid Chromatography,
2nd Edition, John Wiley & Sons Inc., New York, USA,(1979).
32 QuarryQuarry M.A, Stadalius M.A, Mourey T.H, Snyder L.R, J Chromatogr,
(1986), 358,1
33 Stadalius M.A, Quarry M.A, Mourey T.H, Snyder L.R, J Chromatogr, (1986),
358 17
34 Brun Y, Alden P, J Chromatogr A, (2002), 966, 25
PhD Thesis
Habib-Patrick-Richard-Yoba-N’goma
110
35 Small Basinski Z.B, Christian J.W, Acta Matall, (1954), 2, 101
36 Augenstein M, Sticker M, Macromol. Chem, (1990), 191, 415
37 Kawai T, Akashima M, Teramachi S, Polymer, (1995), 36, 2857
38 Teramachi S, Hasegawa A, Matsumoto T, Kitahara K, Tsukahara Y,
Yamashita S, Macromol, (1992), 25, 4025
39 Teramachi S, Sato S, Shimura H, Watanabe S, Tsukahara, Macromol,
(1995), 28, 6183
40 Braun D, Krämer I, Pasch H, Mori S, Macromol. Chem and Phys, (1999),
200(5), 949
41 Braun D, Henze I, Pasch H, Macromol. Chem and Phys, (1997), 198, 3365
42 Brun Y, Alden Y, J. Chromatogr, (2002), 699, 25
43 Brun Y, J. Liq. Chrom and Rel Technol, (1999), 22, 3067
44 Skvortsov A.M, Fleer J.G, Macromol, (2002), 35, 8609
45
Raust J.A, PhD thesis, development of multidimentional chromatography for
complex (meth) acrylate-based copolymers used in cosmetic applications,
Darmstadt university, (2008)
46 Oppenheimer L.E, Mourey T.H, J Chromatogr, (1985), 323, 297
47 Glöckner G, Polymercharakterisierung durch Flüssigkeitschromatographie,
VEB Deutscher Verlag der Wissenschaften, Berlin, (1980)
48 Lee H.C, Lee W, Chang T, Korea Polym. J, (1996), 4, 160
49 Chang T, Adv. Polym. Sci. (2003), 163, 1
50 Guttman C.M Di Marzio E.A, Douglas J. F, Macromol, (1996), 29, 5723
51 Park I, Park S, Cho, D, Chang T, Kim E, Lee K, Kim Jin Y, Macromol, (2003),
36, 8539
52 Berek D, Macromol. Symp, (1996), 110, 33
PhD Thesis
Habib-Patrick-Richard-Yoba-N’goma
111
53 Lee W, Cho D, Chang T, Hanley K.J, Lodge T.P, Macromol, (2001), 34, 2353
54 Lee W, Park S, Chang T, Anal. Chem, (2001), 73, 3884
55 Zimmer T.M, Kever J.J, Melenevskaya E.Y. Fell A.F, J. Chromatogr, (1992),
593, 233
56 Pasch H, Brinkmann C, Gallot Y, Polymer, (1993), 34, 4100
57 Falkenhagen J, Much H, Stauf W, Muller A.H.E, Macromol, (2000), 33, 3687
58 Chang T, Adv. Polym. Sci, (2003), 163, 1
59 Philipsen H. J. A, J. Chromatogra A, (2004), 1037, 329
60 Glöckner G, Gradient HPLC of Copolymers and Chromatographic
Crossfractionation, Chapter 3, Springer, Berlin Heidelberg New York, (1991)
61
Macromolecular Engineering Precise Synthesis, Material Properties
Applications, Volume 3: Structure-Property Correlation and Characterization
Techniques, Edited by Matyjaszewski K, Gnanou y, Leibler L, WILEY-VCH
Verlag GmbH & Co. KgaA, Weinheim, (2007)
62 Barth G.B, Mays J.W, Eds. Modern Methods of Polym. Character, John
Wiley& Sons, New York, (1991)
63 Mori S, Barth H.G, Size Exclusion Chromatography, Springer Verlag: New
York, (1999)
64 Entelis G.S, Evreinov V. V, Gorshkov A.V, Adv. Polym. Sci, (1986), 76, 129
65 Entelis G.S, Evreinov V.V, Kuzaev A.I, Reactive Oligomers, Khimiya
Moscow, (1985)
66 Gorbunov A.A, Skvortsov A.M, , Adv. Colloid Interface Sci, (1995), 62, 31
67 Belenkii B.G, Gankina E.S, Tennikov M.B, Vilenchik L.Z, Dokl. Akad. Nauk
SSR, (1976), 231, 1147
68 Belenkii B.G, Valchikhina M.D, Vakhtina I.A, Gankina E.S, Tarakanov O.G,
J. Chromatogr., (1976), 129, 115
PhD Thesis
Habib-Patrick-Richard-Yoba-N’goma
112
69 Belenkii B.G, Gankina E.S, Tennikov M.B, Vilenchik L.Z, J.Chromatogr,
(1978), 147, 99
70 Skvortsov A.M, Belenkii B.G, Gankina E.S, Tennikov M.B, Vysokomol.
Soed.A , (1978), 20, 678
71 Skvortsov A.M, Gorbunov A.A, J. Chromatogr, (1986), 358, 77
72 Gorbunov A, Trathnigg B, J. Chromatogr. A, (2002), 955, 9
73 Macko T, Hunkeler D, Berek D, Macromol, (2002), 35, 1797
74 Lee W, Lee H, Lee H.C, Cho D, Chang T, Gorbunov A.A, Roovers J,
Macromol, (2002), 35, 529
75 Pasch H, Deffieux A, Henze I, Schappacher M, Rique-Lurbet L,
Macromol, (1996), 29, 8776
76 Biela T, Duda A, Rode K, Pasch H, Polymer, (2003), 44, 1851
77 Radke W, Rode K, Gorshkov A.V, Biela T, Polymer, (2005), 46, 5456
78 Kukula H, Schlaad H, Falkenhagen J , Krüger R.P, Macromol, (2002),
35, 7157
79 Jiang X, Lima V, Schoenmakers P.J, J. Chromatogr. A, (2003), 1018, 19
80 Adrian J, Braun D, Pasch H, Angew. Makromol. Chem., (1999), 267, 82
81 Adrian J, Braun D, Rode K, Pasch H, Angew. Makromol. Chem., (1999), 267
82 Pasch H, Zammert I, J. Liq. Chromatogr., (1994), 17, 3091
83 Pasch H, Brinkmann C, Gallot Y, Polymer, (1993), 34, 4100
84 Pasch H, Augenstein M, Makromol. Chem., (1993), 194, 2533
85 Pasch H, Gallot Y, Trathnigg B, Polymer, (1993), 34, 4986
86 Lee H, Chang T, Lee D, Shim M. S, Ji H, Nonidez W.K, Mays J.W, Anal.
Chem., (2001), 73, 1726
PhD Thesis
Habib-Patrick-Richard-Yoba-N’goma
113
87 Adrian J, Esser E, Hellmann G, Pasch H, Polymer, (2000), 41, 2439
88 Pasch H, Adler M, Rittig F, Becker S, Macromol. Rapid Commun., (2005), 26,
438
89 Berek D, Janco M, Hatada K, Kitayama T, Fujimoto N, Polym. J., (1997),
29,1029
90 Gao H, Min K, Matyjaszewski K, Macromol. Chem. Phys, (2009), 207, 1707
91 Berl M, Lendlein A, Mater. Today, (2007), 10, 20
92 Grablowotz H, Lendlien A, J. Mater. Chem, (2007), 17, 4050
93 Chen Y-Y, Wu G, Qiu Z-C, Wang X-L, Zhang Y, Fang L, Wang Y-Z, J. Polym.
Sci: Part A:Polym Chem, (2008), 46, 3207
94 Rovshandeh J.M, Sci. Asia, (2008), 34, 207
96 Kricherldorf H.R, Macromol. Rapid. Commun, (2000), 21, 528
97 Kricherldorf H.R, Macromol.Symp, (2003), 199
98 Duda A, Penczek S, ACS Symp. Ser, (2000), 764, 160
PhD Thesis
Habib-Patrick-Richard-Yoba-N’goma
114
SURNAMES: YOBA N´GOMA NAMES: HABIB PATRICK RICHARD DATE OF BIRTH: 18 FEBRUARY 1977, LOUBOMO NATIONALITY:GABONESE
EDUCATION
HIGH SCHOOL :LYCEE D ETAT DE FRANCEVILLE, GABON Baccalaureat , Serie D (Scientific field) (1997)
UNIVERSITY OF SCIENCE AND TECHNIQUE OF MASUKU, GABON Second year Chemistry –Biology II ( 2000) ( DUES: Diplome d’etude universitaire Scientifique (2000) UNIVERSITY OF STELLENBOSCH, SOUTH AFRICA Third year chemistry in general chemistry (2002) UNIVERSITY OF STELLENBOSCH, SOUTH AFRICA BSc Honours in general chemistry (2003) UNIVERSITY OF STELLENBOSCH, SOUTH AFRICA Master of polymer science (MSc) (2005). Project title: Synthesis and use of 2-dimethyladamantylethylcyclopentadiene metallocene catalysts in polymer chemistry DEUTSCHES KUNSTSTOFF INSTITUT (DKI), GERMANY Since february 2006 Ph.D student Deutsches Kunststoff Institut (DKI) Darmstadt Project title: Characterization of multiblock copolymers by chromatography methods.
PhD Thesis
Habib-Patrick-Richard-Yoba-N’goma
115
Eidesstattliche Erklärung Ich erkläre hiermit an Eides Statt, dass ich meine Dissertation selbständig und nur
mit den angegebenen Hilfsmitteln angefertigt und noch keine Promotionsversuch
unternommen habe.
Darmstadt, den 03 December 2009
Habib-Patrick-Richard-YOBA-N’GOMA

![Reinforced sulfonated poly(phenylene sulfone) membranes · sulfonated polysulfones and hydrophobic polymers •Hydrophilic-hydrophobic Multiblock Copolymers[3] Previous study utilizing](https://img.dokumen.tips/doc/110x75/60f8ec38147b7a3a2e50e030/reinforced-sulfonated-polyphenylene-sulfone-membranes-sulfonated-polysulfones.jpg)