Embed Size (px)
Citation preview

Characterization of miRNA-regulated networks, hubs ofsignaling, and biomarkers in obstruction-induced bladderdysfunction
Ali Hashemi Gheinani, … , Fiona C. Burkhard, Katia Monastyrskaya
JCI Insight. 2017;2(2):e89560. https://doi.org/10.1172/jci.insight.89560.
Bladder outlet obstruction (BOO) induces significant organ remodeling, leading to lower urinary tract symptomsaccompanied by urodynamic changes in bladder function. Here, we report mRNA and miRNA transcriptome sequencingof bladder samples from human patients with different urodynamically defined states of BOO. Patients’ miRNA and mRNAexpression profiles correlated with urodynamic findings. Validation of RNA sequencing results in an independent patientcohort identified combinations of 3 mRNAs (NRXN3, BMP7, UPK1A) and 3 miRNAs (miR-103a-3p, miR-10a-5p, miR-199a-3p) sufficient to discriminate between bladder functional states. All BOO patients shared cytokine and immuneresponse pathways, TGF-β and NO signaling pathways, and hypertrophic PI3K/AKT signaling pathways. AP-1 and NFkBwere dominant transcription factors, and TNF-α was the top upstream regulator. Integrated miRNA-mRNA expressionanalysis identified pathways and molecules targeted by differentially expressed miRNAs. Molecular changes in BOOsuggest an increasing involvement of miRNAs in the control of bladder function from the overactive tounderactive/acontractile states.
Research Article Aging Muscle biology
Find the latest version:
https://jci.me/89560/pdf

1insight.jci.org doi:10.1172/jci.insight.89560
R E S E A R C H A R T I C L E
Conflict of interest: The authors have declared that no conflict of interest exists.
Submitted: July 13, 2016 Accepted: December 12, 2016 Published: January 26, 2017
Reference information: JCI Insight. 2017;2(2):e89560. doi:10.1172/jci.insight.89560.
Characterization of miRNA-regulated networks, hubs of signaling, and biomarkers in obstruction-induced bladder dysfunctionAli Hashemi Gheinani,1 Bernhard Kiss,2 Felix Moltzahn,2 Irene Keller,3 Rémy Bruggmann,3 Hubert Rehrauer,4 Catharine Aquino Fournier,4 Fiona C. Burkhard,2 and Katia Monastyrskaya1,2
1Urology Research Laboratory, Department of Clinical Research, University of Bern, Bern, Switzerland. 2Department of
Urology, University Hospital, Bern, Switzerland. 3Interfaculty Bioinformatics Unit, University of Bern, Bern, Switzerland. 4Functional Genomics Center Zurich, Zurich, Switzerland.
IntroductionBladder outlet obstruction (BOO) is often caused by benign prostatic hyperplasia and induces voiding lower urinary tract symptoms (LUTS), including weak stream, delayed or intermittent voiding, incomplete emptying, and storage symptoms, such as frequency, urgency, and nocturia. Moderate to severe LUTS are found in approximately 25% of men aged between 40 and 49 years and in 50% of men aged between 70 and 79 (1). Functionally, BOO often results in reduced bladder compliance, alterations in sensitivity, detru-sor overactivity (DO), or detrusor underactivity (UA). BOO necessitates an increased intravesical pressure to void completely, and the resulting chronic pressure overload causes profound structural and functional changes in the bladder wall, leading to bladder hypertrophy. The increase in wall thickness corresponds to the severity of obstruction (2), with a significant correlation between the two observed in men with benign prostatic hyperplasia (3). Although surgical relief of obstruction is a traditional form of therapy, many storage and voiding symptoms persist after surgery. As BOO progresses from inflammation to hypertrophy and to fibrosis (4), early identification of structural changes can prevent further damage to the bladder and optimize the timing of treatment. Reliable markers of bladder function are urgently needed in order not to surpass the “point of no return,” leading to bladder decompensation and failure. The studies of individual cellular signaling pathways conducted in animal models (5–7) identified some of the regulated genes typ-ical for a specific symptomatic state; similarly, a number of regulatory miRNAs have been implicated in bladder pathologies (8–12) and function (13). Increasing evidence indicates that miRNAs may play a role in the regulation of urothelial permeability (14) and bladder contractility (15, 16).
In order to investigate the regulatory role of miRNAs in BOO-induced lower urinary tract dysfunction (LUTD), we performed an integrated analysis of miRNA and mRNA paired expression profiling in the bladder biopsies of human patients using comprehensive next-generation sequencing–derived (NGS-de-
Bladder outlet obstruction (BOO) induces significant organ remodeling, leading to lower urinary tract symptoms accompanied by urodynamic changes in bladder function. Here, we report mRNA and miRNA transcriptome sequencing of bladder samples from human patients with different urodynamically defined states of BOO. Patients’ miRNA and mRNA expression profiles correlated with urodynamic findings. Validation of RNA sequencing results in an independent patient cohort identified combinations of 3 mRNAs (NRXN3, BMP7, UPK1A) and 3 miRNAs (miR-103a-3p, miR-10a-5p, miR-199a-3p) sufficient to discriminate between bladder functional states. All BOO patients shared cytokine and immune response pathways, TGF-β and NO signaling pathways, and hypertrophic PI3K/AKT signaling pathways. AP-1 and NFkB were dominant transcription factors, and TNF-α was the top upstream regulator. Integrated miRNA-mRNA expression analysis identified pathways and molecules targeted by differentially expressed miRNAs. Molecular changes in BOO suggest an increasing involvement of miRNAs in the control of bladder function from the overactive to underactive/acontractile states.

2insight.jci.org doi:10.1172/jci.insight.89560
R E S E A R C H A R T I C L E
rived) transcriptome data. We studied the activated pathways and altered biological processes based on the global gene expression changes and subsequently explored the presence and regulatory role of the individu-al miRNA targets in these pathways. We identified common and unique miRNAs and their mRNA targets characteristic of BOO-induced LUTD and specific for urodynamically defined states of the disease. Our approach allows systematic examination of the association between bladder function and the underlying activated biological processes (pathways and networks). We validated NGS-based findings in independent patient groups using quantitative PCR (QPCR) and present a rationale for biomarker selection, based on a combination of group-specific mRNA and miRNA markers. Using this tool allows discrimination among urodynamically defined BOO states, opening up diagnostic applications.
ResultsPatient grouping after urodynamic assessment. Patients were recruited and examined as described in Methods. Group 1 patients, designated as “controls,” were mostly patients being treated for bladder stones with normal bladder function. In all patients with LUTS due to BOO (groups 2–4), urodynamic studies were performed, and the representative urodynamic evaluation is shown in Supplemental Figure 1 (supplemen-tal material available online with this article; doi:10.1172/jci.insight.89560DS1), and full data are included in Supplemental Table 1. Based on questionnaires and urodynamic examination, the patients were divided into the following groups: group 2, which consisted of BOO with DO patients (referred to as DO patients); group 3, which consisted of BOO without DO patients (referred to as BO patients); and group 4, which consisted of patients with BOO with UA or acontractile bladders (referred to as UA patients below). The DO group included patients with increased detrusor pressure and reduced urine flow in combination with involuntary detrusor contractions during the filling phase (phasic and/or terminal). The BO group con-tained obstructed patients without involuntary detrusor contractions. The UA group consisted of patients with weak detrusor contractions (UA) or patients with acontractile detrusor and cystoscopy in line with obstruction. In all groups, 4 urothelium-covered muscle-containing biopsies were collected from the blad-der dome by the same urologist and total RNA was isolated as described previously (12).
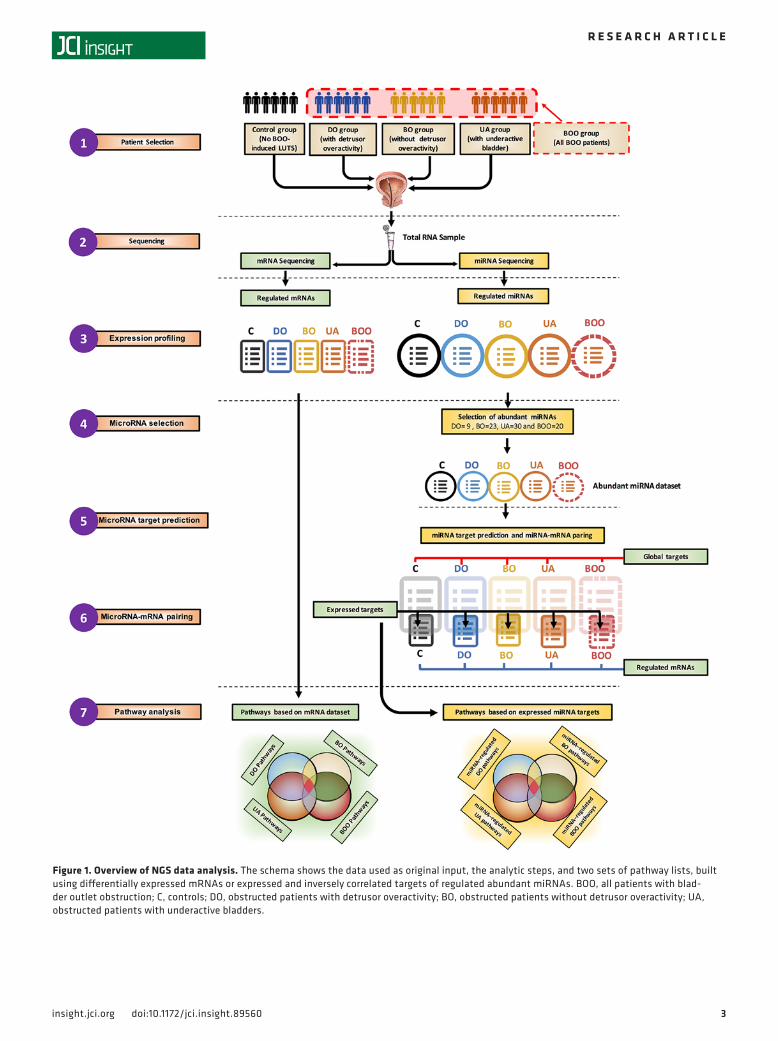
Overview of data analysis. The data analysis procedure is illustrated in Figure 1. Following the patient recruitment, urodynamic examination, and biopsy collection (step 1), mRNA and miRNA sequencing from the same RNA sample was performed (step 2) (n = 6 samples per group in control, DO, BO, and UA or n = 6 samples in control and n = 18 samples in the BOO group [DO, BO, and UA patients together], for a total of n = 24 samples). We used edgeR, and the group size was determined in accordance with Schurch et al. (17). Differentially expressed mRNAs and miRNAs were identified (step 3). mRNAs were used directly as an input for pathway analysis to generate pathways based on mRNA data set (step 7). The regulatory effect of differentially expressed miRNAs on the gene expression changes was evaluated by identifying the important hubs of intracellular signaling that they target. Abundant miRNAs (more than 500 reads), which are most likely to have biological activity, were selected in each patient group for further target prediction and pathway analysis (step 4). For each abundant miRNA, a list containing all top score bioinformatically predicted targets was generated (“Global targets,” step 5). Global targets then were paired with lists of expressed and regulated mRNAs from mRNA sequencing (step 3) to select the mRNA targets with opposite regulation respective of their miRNAs. These transcripts, designated “expressed targets” (step 6), were used for pathway analysis (step 7), resulting in pathways based on expressed miRNA targets or miRNA-regulated pathways (step 7).
miRNA and mRNA expression profiles correlate with urodynamically defined bladder function in patient groups. Differentially expressed mRNAs and miRNAs were determined in each BOO group (absolute fold change ≥1.5 time, P < 0.05, and adjusted P < 0.15). The overall number of differentially expressed mRNAs increased from 288 transcripts in the DO group to 958 in the BO group and 4,549 in the UA group. All 18 BOO-induced LUTD patients, compared with the 6 controls, yielded 663 significant dif-ferentially expressed transcripts (Supplemental Tables 8–11). Of 1,906 sequenced miRNAs, over 500 miRNAs were expressed in patients’ biopsies and controls, and the number of miRNAs significantly altered (P < 0.04) in different BOO states varied from 94 in the DO group, 182 in the BO group, and 236 in the UA group; all BOO patients pooled showed 158 significantly regulated miRNAs (Supple-mental Tables 12–15). Top 5 abundant significant miRNAs strongly regulated in the DO, BO, and UA groups and all BOO patients are listed in Tables 1 and 2. Hierarchical clustering of mRNAs and miR-NA revealed high expression profile similarity between DO and controls, whereas BO clustered with
3insight.jci.org doi:10.1172/jci.insight.89560
R E S E A R C H A R T I C L E
Figure 1. Overview of NGS data analysis. The schema shows the data used as original input, the analytic steps, and two sets of pathway lists, built using differentially expressed mRNAs or expressed and inversely correlated targets of regulated abundant miRNAs. BOO, all patients with blad-der outlet obstruction; C, controls; DO, obstructed patients with detrusor overactivity; BO, obstructed patients without detrusor overactivity; UA, obstructed patients with underactive bladders.

4insight.jci.org doi:10.1172/jci.insight.89560
R E S E A R C H A R T I C L E
UA (Figure 2, A and B). These findings were confirmed by further analysis: in order to quantify the similarity between clusterings, a tanglegram (Figure 2C) was built by compar-ing the clusters made from the mRNA data set and the miRNA data set. The entangle-ment score (scoring: 0–1, 0 for best) was cal-culated. Dendrograms of both mRNA and miRNA samples had very good similarity with an entanglement score of 0.05.
The principal component analysis (PCA) was performed using log2 fold changes of 1,800 mRNAs and 343 miRNAs identified by NGS (Figure 2D). The variation in patient coordina-tion on PCA plots was much lower in the UA group than in the other groups, probably due to a higher number of regulated mRNAs and miRNAs in the UA group and the intensity of the mRNA and miRNA regulation.
Changes in miRNA and mRNA expression reflect similar biological processes. An inde-pendently performed sample clustering, using mRNAs encoding contractile proteins and proteins involved in Ca2+ signaling, hypertrophy, and fibrosis showed that profi-brotic transcripts were increased and smooth muscle–specific mRNAs were decreased in BO and UA samples (Figure 3A). In accor-dance, miRNA sequencing data revealed an
upregulation of miRNAs known to control hypertrophy and profibrotic processes in the same sample clusters; on the other hand, muscle-specific miRNAs were downregulated in BO and UA groups but increased in the DO group (Figure 3B). Bioinformatic prediction of potential targets of the differen-tially expressed miRNAs identified several contractile proteins and proteins involved in fibrotic organ remodeling (Supplemental Table 2).
Receiver-operating characteristic curve analysis. A receiver-operating characteristic (ROC) curve analysis was applied to assess the discriminative potential of differentially expressed miRNAs and mRNAs for BOO patient groups (Figure 4). We identified 3 mRNAs (NRXN3, BMP7, and UPK1A) (Figure 4A) and 3 miRNAs (miR-103a-3p, miR-10a-5p, and miR-199a-3p) (Figure 4B) characteristic of each patient group, representing a different functional state of the bladder. The areas under the curve and upper and lower bound (95% CI) are presented in Supplemental Table 3. Levels of these mRNAs and miRNAs were examined by QPCR in independent groups of BOO patients (49 samples for mRNAs and 28 samples for miR-NAs). Box-and-whisker plots were generated for the response variables in the mRNA (Figure 4A) and miRNA (Fig-ure 4B) QPCR data sets classified by groups. The QPCR results indi-cate that NRXN3 and miR-103a-3p are regu-lated specifically in DO
Table 1. Top 5 differentially expressed miRNAs in the DO, BO, and UA groups
miRNA name Average read number Average log2 fold changeC DO BO UA DO BO UA
DOhsa-miR-132-3p 664.8 1,322.9 1,074.1 1,387.7 0.9 0.6 1.0hsa-miR-335-5p 552.9 287.3 384.7 297.1 –0.9 –0.5 –0.8hsa-miR-374a-5p 872.9 473.1 942.6 965.4 –0.8 0.1 0.1hsa-miR-182-5p 11,916.8 19,713.3 27,095 18,023.3 0.7 1.1 0.597hsa-miR-26b-5p 116,900 72,931.7 71,553.3 63,001.7 –0.6 –0.7 –0.8
BOhsa-miR-146b-5p 4,538.7 9,333.5 26,819.8 49,415 1.04 2.5 3.4hsa-miR-21-3p 2061 6,135.2 9,334.2 12,675.7 1.5 2.1 2.6hsa-miR-486-5p 25,456 83,228.3 102,286.7 97,413.3 1.7 2.08 1.9hsa-miR-486-3p 20,615 68,726.7 80,753.3 77,043.3 1.7 1.9 1.9hsa-miR-146a-5p 2,130.8 2,033.5 8,124.8 16,781.2 –0.07 1.9 2.9
UAhsa-miR-146b-5p 4,538.7 9,333.5 26,819.8 49,415 1.04 2.5 3.4hsa-miR-146a-5p 2,130.8 2,033.5 8,124.8 16,781.2 –0.07 1.9 2.9hsa-miR-21-3p 2061 6,135.2 9,334.2 12,675.7 1.5 2.1 2.6hsa-miR-155-5p 2,070.7 2,663.3 5,242.3 12,379.7 0.3 1.3 2.5hsa-miR-142-5p 23,413.3 28,045 50,656.7 92,678.3 0.26 1.1 1.9
Abundant (read number in controls >500) and highly regulated miRNAs are shown. Table is sorted based on log2 fold change. BOO, bladder outlet obstruction; DO, BOO patients with urodynamically determined detrusor overactivity; BO, BOO patients without detrusor overactivity; UA, underactive bladder; C, controls (n = 6 patients per group).
Table 2. Top 5 differentially expressed miRNAs in all BOO patients
miRNA name Average read number Average BOO log2 fold changeC BOO
hsa-miR-1 3,726.7 3,726.7 –3.1hsa-miR-146b-5p 4,709.3 4,709.3 2.6hsa-miR-21-3p 2081.3 2,081.3 2.2hsa-miR-146a-5p 2,263.9 2,263.9 2.0hsa-miR-486-5p 26,415.3 26,415.3 1.8
Abundant (read number in controls >500) and highly regulated miRNAs are shown. Table is sorted based on log2 fold change. BOO, all bladder outlet obstruction patients; C, controls (n = 6 patients per group).

5insight.jci.org doi:10.1172/jci.insight.89560
R E S E A R C H A R T I C L E
Figure 2. Differentially expressed mRNAs and miRNAs in BOO-induced LUTD patients. (A) Hierarchical clustering and heatmap of log2 fold change of 2,634 significantly regulated mRNAs (y axis) in 24 patients (x axis). (B) Hierarchical clustering of 343 significantly regulated miRNAs (y axis) and 24 samples (x axis). Hierarchical clustering of mRNAs and miRNAs revealed high expression profile similarity between DO and controls, whereas BO is similar to UA. (C) miRNA-mRNA tanglegram. Unique nodes, with a combination of patients not present in the other tree, are highlighted with dashed lines. Entanglement has the score of 0.05, indicating a very high similarity between the dendrograms of both mRNA and miRNA samples. (D) Principal component analysis of mRNA and miRNA expression was done based on profiles of 10,064 mRNAs (top) and 343 miRNAs (bottom) for each

6insight.jci.org doi:10.1172/jci.insight.89560
R E S E A R C H A R T I C L E
patients, BMP7 and miR-199a-3p are characteristic of UA patients, miR-10a-5p is specifically upregulated in the BO group, and UPK1A is shared between the BO and UA groups. Thus, with an exception of UPK1A, specific-ity of all selected biomarkers was confirmed in independent patients groups (n ≥ 12).
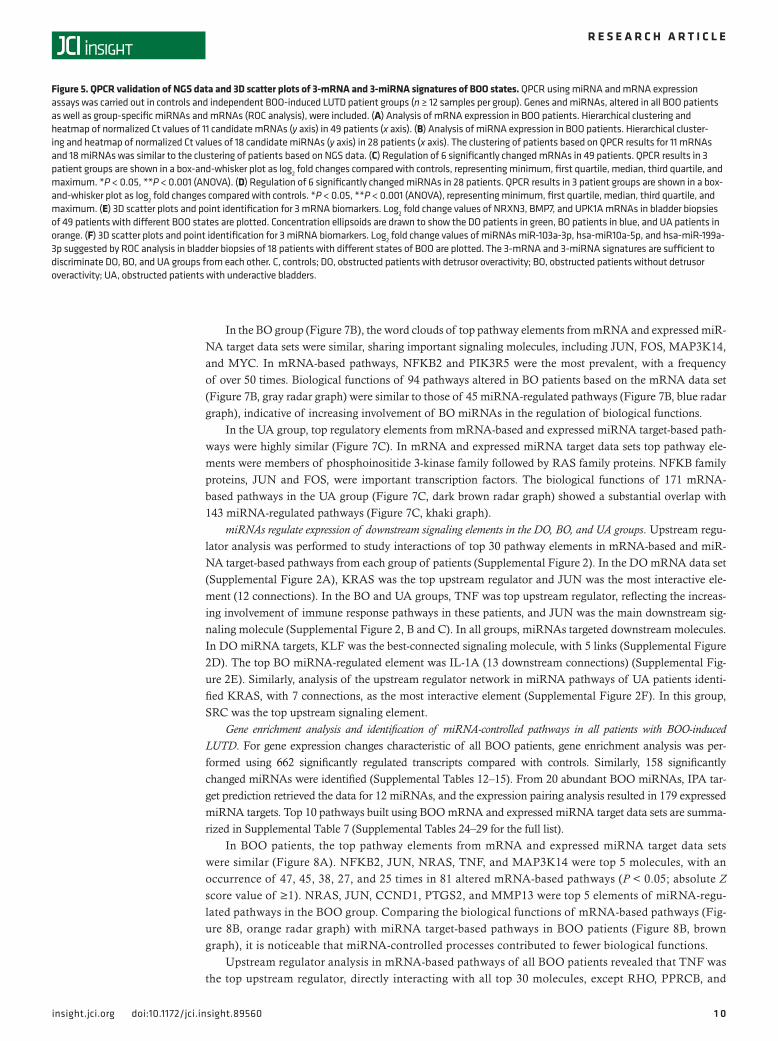
Validation of NGS data and defining 3-mRNA and 3-miRNA signatures of bladder states. We carried out QPCR using miRNA and mRNA expression assays on n ≥ 12 samples per group of independent BOO-in-duced LUTD patient biopsies. Group-specific miRNAs and mRNAs were selected based on ROC analysis; we also included genes and miRNAs, which were altered in all BOO patients. The clustering of patients based on QPCR results for 11 mRNAs (Figure 5A) and 18 miRNAs (Figure 5B) was similar to the cluster-ing of patients based on NGS data (Figure 2, A and B). Fold differences for 6 significant mRNAs (BMP7, FOSL1, MYC, NRXN3, SERPIN1, and UPK1A) (Figure 5C) and miRNAs (miR-10a-5p, miR-29c-3p, miR-103a-3p, miR-142-3p, miR-199a-3p, and miR-342-3p) (Figure 5D) are shown.
Log2 fold change values for NRXN3, BMP7, and UPK1A mRNAs and miR-103a-3p, hsa-miR10a-5p, and hsa-miR-199a-3p miRNAs in bladder tissues of 32 and 28 patients, respectively, with different states of BOO, are illustrated in 3D scatter plots (Figure 5, E and F). The coordinates of each sample correspond to the log2 fold changes of the 3 mRNA or miRNA markers, and the confidence ellipse represents an isocon-tour of the Gaussian distribution and allows visualization of a 3D confidence interval. The 3-mRNA and 3-miRNA signatures were sufficient to discriminate the DO, BO, and UA groups from each other.
Testing the mRNA and miRNA signatures of bladder dysfunction states in a blinded study. The 3-mRNA and 3-miRNA signatures of urodynamically defined bladder states were tested in an independent blinded fol-low-up study encompassing 40 patient biopsies and 11 control biopsies. Investigators conducing RNA isolations and QPCR assays for NRXN3, BMP7, and UPK1A mRNAs and miR-103a-3p, hsa-miR10a-5p, and hsa-miR-199a-3p miRNAs were not aware of the patients’ urodynamic status. Clustering of the miRNA results (Figure 6B) was similar to mRNA results (Figure 6A), clearly separating controls from BOO patients. Normalized Ct values for 3-mRNA or 3-miRNA signatures of the samples with the known urodynamic status (Figure 5, E and F) were employed in machine-based learning algorithms described in the Methods to train the model. Using the Ct values for either mRNA or miRNA signatures of the blinded samples as an input, the model allocated them to 3 groups corresponding to the predicted bladder function-al state: BOO7, 24, 31, 32, 37, 38, 39, 40, 6, 5, 21, 22 and 23 belonged to the DO group; BOO16, 14, 15, 9, 8, 33, and 34 belonged to the BO group, and the remaining samples (BOO28, 29, 30, 41, 42, 10, 11, 12, 13, 17, 18, 19, 20, 4, 3, 2, 1, 25, 26, 27) were from the UA group. On the heatmaps, the samples were colored according to the machine-based group allocation (DO in blue, BO in green, and UA in orange) (Figure 6, A and B). Note that samples predicted to belong to the same group often cocluster.
To visualize the results, the log2 fold change values for each marker were plotted into 3D scatter plots, with samples predicted to share a urodynamic state occupying a concise ellipsoid, with 75% confidence interval (Fig-ure 6, C and D). The 3D coordinates were close to the coordinates of the DO, BO, and UA samples shown in Figure 5, E and F. Urodynamic parameters and bladder function (diagnosis) of the BOO patients from the blind-ed study are shown in Supplemental Table 4. Lifting the code revealed that all patients were accurately allocated into functional groups based on either 3-mRNA or 3-miRNA signatures (Supplemental Table 5).
Gene enrichment analysis and miRNA-mediated regulation of pathway elements in the DO, BO, and UA groups. Despite the small size of the DO, BO, and UA groups (n = 6 patients each), sample clustering based on the differentially expressed mRNAs and miRNAs was in good agreement with urodynamic characterization of the patients’ bladder function (Figure 2, A and B for NGS; Figure 5, A and B, for QPCR). In order to study biolog-ical processes leading to the functional differences, we performed gene enrichment analysis using mRNA and miRNA target expression data from each group. miRNAs, regulated and abundant in each group (Supplemental Tables 16–19), were selected, and their expressed targets (Supplemental Tables 20–23) used to build signaling pathways. Top 10 canonical pathways based on mRNA and expressed miRNA target data sets for each group are shown in Supplemental Table 6 (full list of pathways in Supplemental Tables 24–29). Pathway analysis infor-mation was further integrated using Word Cloud and the Biological Function Classification Database to identify top signaling molecules and biological functions in each patient group. In the DO group (Figure 7A), KRAS,
group (6 patients per group). The position of patients from each group on 3D plots indicates the similarity of mRNA or miRNA expression patterns. PCA confirms the sample clustering shown in the heatmaps, with controls clustered with DO and BO clustered with UA. The intergroup dispersity is low, indicating sample homogeneity. C, controls; DO, obstructed patients with detrusor overactivity; BO, obstructed patients without detrusor overac-tivity; UA, obstructed patients with underactive bladders.

7insight.jci.org doi:10.1172/jci.insight.89560
R E S E A R C H A R T I C L E
Figure 3. Regulation of mRNA and miRNA expression reflects similar biological processes. (A) Hierarchical clustering of log2 fold changes of mRNA (y axis) encoding muscle-specific proteins, growth factors, proteins involved in Ca2+ homeostasis, and regulators of hypertrophy and fibrosis in BOO patients: obstructed patients with detrusor overactivity (DO), obstructed patients without detrusor overactivity (BO), obstructed patients with underactive bladders (UA), and controls (C) (x axis). (B) Hierarchical clustering of selected muscle-specific miRNAs and miRNAs regulated during hypertrophy and fibrosis. Smooth muscle-specific mRNAs and miRNAs decreased in BO and UA, but increased in DO samples; profibrotic transcripts and miRNAs were increased in BO and UA biopsies.

8insight.jci.org doi:10.1172/jci.insight.89560
R E S E A R C H A R T I C L E
JUN, GNAQ, PTGS2, PRKAR2A, and MYC were among most recur-rent signaling molecules occurring in 40 pathways with Z score based on mRNA sequencing data. From 35 significant pathways built using expressed miRNA targets, only 2 had a defined Z score. The word cloud of frequent elements from all significant pathways of the miRNA target data set contains CCND1, GNA13, DUSP8, ITDA5, SOCS3, and PTGS2 and shows little overlap with mRNA-based pathway ele-ments. Comparison of the biologi-cal functions of 40 DO mRNA data set pathways (Figure 7A, yellow radar graph) to 35 miRNA-regulat-ed pathways (Figure 7A, red radar graph) revealed that miRNA-regu-lated pathways were assigned sub-stantially fewer biological functions.
Figure 4. ROC curve analyses of mRNA and miRNA signatures to discriminate BOO patient groups. (A) The ROC curves were calculated for individual mRNAs using NGS data. The area under the curve is calculated with 95% confidence interval. The data were validated by QPCR (n = 49 samples), and box-and-whisker plots for the response variables in the mRNA PCR data set classified by groups are shown. The results are shown as log2 fold change range, and the distribution of data are shown based on minimum, first quartile, median, third quartile, and maximum. (B) ROC curves for selected miRNAs. Area under ROC curve (AUC) for each marker is indicated. Box-and-whis-ker plots of QPCR validation (n = 28 samples) results are shown. The results are shown as log2 fold change range, and the distribution of data are shown based on minimum, first quartile, median, third quartile, and maximum. Neurexin 3 (NRXN3) and miR-103a-3p are regulated specifically in DO patients; bone morphogenetic protein 7 (BMP7) and miR-199a-3p are characteristic of UA patients; miR-10a-5p is specifically upregulated in the BO group; and uroplakin 1A (UPK1A) is shared between BO and UA groups. DO, obstructed patients with detrusor overactivity; BO, obstructed patients without detrusor overac-tivity; UA, obstructed patients with underactive bladders.

9insight.jci.org doi:10.1172/jci.insight.89560
R E S E A R C H A R T I C L E
1 0insight.jci.org doi:10.1172/jci.insight.89560
R E S E A R C H A R T I C L E
In the BO group (Figure 7B), the word clouds of top pathway elements from mRNA and expressed miR-NA target data sets were similar, sharing important signaling molecules, including JUN, FOS, MAP3K14, and MYC. In mRNA-based pathways, NFKB2 and PIK3R5 were the most prevalent, with a frequency of over 50 times. Biological functions of 94 pathways altered in BO patients based on the mRNA data set (Figure 7B, gray radar graph) were similar to those of 45 miRNA-regulated pathways (Figure 7B, blue radar graph), indicative of increasing involvement of BO miRNAs in the regulation of biological functions.
In the UA group, top regulatory elements from mRNA-based and expressed miRNA target-based path-ways were highly similar (Figure 7C). In mRNA and expressed miRNA target data sets top pathway ele-ments were members of phosphoinositide 3-kinase family followed by RAS family proteins. NFKB family proteins, JUN and FOS, were important transcription factors. The biological functions of 171 mRNA-based pathways in the UA group (Figure 7C, dark brown radar graph) showed a substantial overlap with 143 miRNA-regulated pathways (Figure 7C, khaki graph).
miRNAs regulate expression of downstream signaling elements in the DO, BO, and UA groups. Upstream regu-lator analysis was performed to study interactions of top 30 pathway elements in mRNA-based and miR-NA target-based pathways from each group of patients (Supplemental Figure 2). In the DO mRNA data set (Supplemental Figure 2A), KRAS was the top upstream regulator and JUN was the most interactive ele-ment (12 connections). In the BO and UA groups, TNF was top upstream regulator, reflecting the increas-ing involvement of immune response pathways in these patients, and JUN was the main downstream sig-naling molecule (Supplemental Figure 2, B and C). In all groups, miRNAs targeted downstream molecules. In DO miRNA targets, KLF was the best-connected signaling molecule, with 5 links (Supplemental Figure 2D). The top BO miRNA-regulated element was IL-1A (13 downstream connections) (Supplemental Fig-ure 2E). Similarly, analysis of the upstream regulator network in miRNA pathways of UA patients identi-fied KRAS, with 7 connections, as the most interactive element (Supplemental Figure 2F). In this group, SRC was the top upstream signaling element.
Gene enrichment analysis and identification of miRNA-controlled pathways in all patients with BOO-induced LUTD. For gene expression changes characteristic of all BOO patients, gene enrichment analysis was per-formed using 662 significantly regulated transcripts compared with controls. Similarly, 158 significantly changed miRNAs were identified (Supplemental Tables 12–15). From 20 abundant BOO miRNAs, IPA tar-get prediction retrieved the data for 12 miRNAs, and the expression pairing analysis resulted in 179 expressed miRNA targets. Top 10 pathways built using BOO mRNA and expressed miRNA target data sets are summa-rized in Supplemental Table 7 (Supplemental Tables 24–29 for the full list).
In BOO patients, the top pathway elements from mRNA and expressed miRNA target data sets were similar (Figure 8A). NFKB2, JUN, NRAS, TNF, and MAP3K14 were top 5 molecules, with an occurrence of 47, 45, 38, 27, and 25 times in 81 altered mRNA-based pathways (P < 0.05; absolute Z score value of ≥1). NRAS, JUN, CCND1, PTGS2, and MMP13 were top 5 elements of miRNA-regu-lated pathways in the BOO group. Comparing the biological functions of mRNA-based pathways (Fig-ure 8B, orange radar graph) with miRNA target-based pathways in BOO patients (Figure 8B, brown graph), it is noticeable that miRNA-controlled processes contributed to fewer biological functions.
Upstream regulator analysis in mRNA-based pathways of all BOO patients revealed that TNF was the top upstream regulator, directly interacting with all top 30 molecules, except RHO, PPRCB, and
Figure 5. QPCR validation of NGS data and 3D scatter plots of 3-mRNA and 3-miRNA signatures of BOO states. QPCR using miRNA and mRNA expression assays was carried out in controls and independent BOO-induced LUTD patient groups (n ≥ 12 samples per group). Genes and miRNAs, altered in all BOO patients as well as group-specific miRNAs and mRNAs (ROC analysis), were included. (A) Analysis of mRNA expression in BOO patients. Hierarchical clustering and heatmap of normalized Ct values of 11 candidate mRNAs (y axis) in 49 patients (x axis). (B) Analysis of miRNA expression in BOO patients. Hierarchical cluster-ing and heatmap of normalized Ct values of 18 candidate miRNAs (y axis) in 28 patients (x axis). The clustering of patients based on QPCR results for 11 mRNAs and 18 miRNAs was similar to the clustering of patients based on NGS data. (C) Regulation of 6 significantly changed mRNAs in 49 patients. QPCR results in 3 patient groups are shown in a box-and-whisker plot as log2 fold changes compared with controls, representing minimum, first quartile, median, third quartile, and maximum. *P < 0.05, **P < 0.001 (ANOVA). (D) Regulation of 6 significantly changed miRNAs in 28 patients. QPCR results in 3 patient groups are shown in a box-and-whisker plot as log2 fold changes compared with controls. *P < 0.05, **P < 0.001 (ANOVA), representing minimum, first quartile, median, third quartile, and maximum. (E) 3D scatter plots and point identification for 3 mRNA biomarkers. Log2 fold change values of NRXN3, BMP7, and UPK1A mRNAs in bladder biopsies of 49 patients with different BOO states are plotted. Concentration ellipsoids are drawn to show the DO patients in green, BO patients in blue, and UA patients in orange. (F) 3D scatter plots and point identification for 3 miRNA biomarkers. Log2 fold change values of miRNAs miR-103a-3p, hsa-miR10a-5p, and hsa-miR-199a-3p suggested by ROC analysis in bladder biopsies of 18 patients with different states of BOO are plotted. The 3-mRNA and 3-miRNA signatures are sufficient to discriminate DO, BO, and UA groups from each other. C, controls; DO, obstructed patients with detrusor overactivity; BO, obstructed patients without detrusor overactivity; UA, obstructed patients with underactive bladders.

1 1insight.jci.org doi:10.1172/jci.insight.89560
R E S E A R C H A R T I C L E
NRAS (Supplemental Figure 3A). IL-1A, JUN, IL-6, IL-1B, MYC, and CXCL1 were the main down-stream molecules. All miRNA-controlled elements were downstream of TNF and IL-1A (Supplemen-tal Figure 3B). In most of its interactions, JUN is an upstream regulator of other genes and thus can be considered the top miRNA-targeted element influencing gene expression in BOO patients. CCND1 and PTGS2, on the other hand, were downstream miRNA targets.
Figure 6. Testing the 3-mRNA and 3-miRNA bladder dysfunction signatures in a blinded study. (A) Analysis of NRXN3, BMP7, and UPK1A mRNA expres-sion in BOO patients of unknown urodynamic status and controls. Hierarchical clustering and heatmap of normalized Ct values of 3 signature mRNAs (y axis) in 40 patients and 11 controls (x axis). (B) Analysis of hsa-miR-103a-3p, hsa-miR-10a-5p, and hsa-miR-199a-3p miRNA expression in BOO patients. Hierarchical clustering and heatmap of normalized Ct values of 3 candidate miRNAs (y axis) in 38 BOO patients and 11 controls (x axis). Clustering of the miRNA results was similar to mRNA results, clearly separating controls from BOO patients. Using machine-based learning algorithms, the samples were allocated to phenotypic groups, represented by box border colors: green for DO (BOO with detrusor overactivity), blue for BO (BOO without detrusor over-activity), and orange for UA (underactive bladders) phenotypes. (C) 3D scatter plots for 3 mRNA biomarkers. Log2 fold change values of NRXN3, BMP7, and UPK1A mRNAs in bladder biopsies of 40 patients with unknown BOO states are plotted. Concentration ellipsoids are drawn to show the 3 patients groups (DO in green, BO in blue, and UA in orange). (D) 3D scatter plots and point identification for 3 miRNA biomarkers. Log2 fold change values of hsa-miR-103a-3p, hsa-miR-10a-5p, and hsa-miR-199a-3p miRNAs in bladder biopsies of 40 patients of unknown states of BOO are plotted. Ellipsoids are colored in green for DO-, blue for BO-, and orange for UA-allocated patients.

1 2insight.jci.org doi:10.1172/jci.insight.89560
R E S E A R C H A R T I C L E
Figure 7. Gene enrichment analysis and pathway elements targeted by miRNAs in the DO, BO, and UA groups. (A) DO group. The word clouds show path-way elements in the mRNA data set and in the miRNA target data set. The radar graphs for biological functions of 40 mRNA data set pathways (yellow) and 35 expressed miRNA target pathways (red) in DO patients. In this group, there is little overlap between shown signaling hubs and miRNA-regulated signaling hubs; in addition, the miRNA-regulated pathways are assigned noticeably fewer biological functions. (B) BO group. The word clouds show path-

1 3insight.jci.org doi:10.1172/jci.insight.89560
R E S E A R C H A R T I C L E
Key signaling pathways defining organ remodeling in BOO-induced LUTD. To identify the key cell signaling events important for bladder organ remodeling during BOO, we carried out a Venn analysis of all significant and regulated pathways (mRNA data sets) present in the DO, BO, and UA groups and in all BOO patients (Figure 8C). The 22 intersecting pathways (Table 3) were significant (P < 0.05 in all groups) and regulated (absolute Z score value of ≥1). The heatmap of pathways based on the Z score (Figure 8D) showed the sim-ilarity of pathway activation in the BO group versus all BOO patients. Predicted pathway activity was the highest in the UA group, reflecting the biggest number of regulated mRNAs available for pathway analysis. Analysis of biological functions of the 22 common pathways (Figure 8E, radar graph) revealed that cellular growth, proliferation and development, and cytokine signaling were the main biological functions shared by all groups. The most frequent pathway elements identified in the 22 common pathways included NRAS, NFKB2, JUN, PRKCB, TNF, and MAP3K14 (Figure 8E, word cloud). Upstream analysis of transcription factors and cytokines in the 22 common pathways (Figure 8F) showed TNF, connected to 63 downstream elements, as the top upstream regulator.
Impact assessment of abundant miRNAs and identification of disease-relevant miRNA targets. We compared the number of abundant miRNAs altered in each condition (Figure 9A) to the number of significant path-ways with a Z score that were built using expressed targets of these miRNAs (Figure 9B). The number of abundant miRNAs progressively increased among BOO states (9 miRNAs for DO, 23 miRNAs for BO, and 30 miRNAs for UA), in line with an increase of regulated transcripts identified by NGS in each group. Nevertheless, the number of miRNA-regulated pathways in each condition did not increase proportionally to the input of expressed miRNA targets used to build them. In the DO group, 109 miRNA targets of 9 miRNAs produced only 2 significant pathways with a Z score. In the BO group, 350 expressed targets of 23 miRNAs yielded 45 such pathways and in the UA group, 2,122 expressed targets of 30 miRNAs resulted in 143 significant pathways with a Z score prediction. These differences indicate that regulated abundant miRNAs may target a progressively increasing number of pathway elements in DO, BO, and UA.
Next, we calculated the effect of the miRNAs that were differentially expressed in all BOO patients. They accounted for 7.76% of all miRNA reads (Figure 9C). The most abundant differentially expressed miRNAs were miR-22-3p, miR-26b-5p, miR-21-5p, miR-181a-5p, and miR-191-5p (Figure 9C). Direct interaction of the 12 most abundant miRNAs with 66 mRNA targets represented among pathway elements of miRNA-regulated pathways is shown in Figure 9D. Downregulated miRNAs miR-497-5p, miR-26b-5p, and miR-29c-3p had 20, 17, and 17 inversely regulated mRNA targets among the pathway elements. Upreg-ulated KLF, NRAS, and PTGS2 were targeted by 4, 3, 2 downregulated miRNAs (Figure 9D). Surprisingly, despite the high number of upregulated miRNAs, we identified very few of their targets among pathway elements. To address this discrepancy, we predicted targets of 36 regulated BOO miRNAs and analyzed their expression in the mRNA data set (Figure 1, step 6). From 19 upregulated and 17 downregulated BOO miRNAs, 221 and 215 mRNA targets, respectively, were present in the BOO mRNA data set. However, miRNA-mRNA expression pairing function revealed that only 25 targets (11%) of upregulated miRNAs were downregulated, whereas 194 targets (90%) of downregulated miRNAs were upregulated.
DiscussionDuring BOO, the increased outflow resistance induces hypertrophy, leading to organ failure due to advanced fibrosis and the subsequent loss of contractility. Here, we report quantitative transcriptome and miRNA profiling using biopsy samples from human patients with different states of urodynamically defined BOO-induced bladder dysfunction. Our results correspond well with those of previous studies in animal models of partial BOO (pBOO) and cardiac hypertrophy (19) and point to the similarity of mecha-nisms underlying organ remodeling during pressure overload.
way elements in the mRNA data set and in the expressed miRNA target data set. The biological functions of 95 mRNA data set pathways (violet) and 45 expressed miRNA target pathways (blue). Here, the top pathway elements from mRNA and expressed miRNA target data sets share important signaling molecules. Biological functions of 94 altered pathways are similar to those of 45 miRNA-regulated pathways, indicative of increasing involvement of BO miRNAs in the regulation of signaling. (C) UA group. The word clouds show pathway elements in the mRNA data set and the expressed miRNA target data set. The biological functions of 171 pathways based on the mRNA data set (brown) and 143 pathways based on the expressed miRNA target data set (khaki). The top regulatory elements from mRNA-based and expressed miRNA target-based pathways are highly similar in the UA group, and there is a considerable overlap in biological functions of mRNA-based and miRNA-regulated pathways. C, controls; DO, obstructed patients with detrusor overactivi-ty; BO, obstructed patients without detrusor overactivity; UA, obstructed patients with underactive bladders.

1 4insight.jci.org doi:10.1172/jci.insight.89560
R E S E A R C H A R T I C L E

1 5insight.jci.org doi:10.1172/jci.insight.89560
R E S E A R C H A R T I C L E
miRNA and mRNA expression profiles in the BOO patients, assigned based on prior urodynamic examination into DO, BO, and UA groups, revealed a progressive increase in the number of altered mRNA and miRNAs from the DO group to the BO group to the UA group, with the most pronounced changes of miRNA and mRNA expression detected in the UA group. Both hierarchical and PCA demonstrated clus-tering of DO samples with controls and of BO samples with UA. The relative homogeneity of mRNA and miRNA expression profiles in UA samples could be explained by the lack of detrusor contractility in UA patients, which presents a more homogeneous functional phenotype. BO patients showed more variation in PCA plot, possibly due to the wide range of bladder contractility parameters within this patient group. Overall, the gene expression profiles correlated well with the functional characteristics of the bladder iden-tified by urodynamics. The predictive performance of individual mRNAs and miRNAs for defining the functional state of the bladder was demonstrated by multivariate logistic regression analysis. Three-mRNA
Figure 8. Pathway analysis in all BOO patients and identification of 22 key signaling pathways. We investigated mRNAs and miRNAs differentially expressed in all bladder outlet obstruction (BOO) patients (n = 18) compared with controls (n = 6) and performed gene enrichment analysis using mRNAs and the expressed targets of 12 abundant miRNAs. (A) The word clouds show frequent pathway elements in the mRNA data set of all BOO patients and pathway elements targeted by abundant BOO miRNAs. Many signaling hubs in BOO are potentially miRNA regulated. (B) The radar graph for biolog-ical functions of significant (P < 0.05) BOO mRNA data set pathways (orange) and pathways built using expressed BOO miRNA targets (brown). The miRNA-controlled processes contribute to fewer biological functions. (C) Venn diagram of common regulated pathways (mRNA data sets, P < 0.05) in 3 patient groups (DO, BO, and UA) intersecting with the all BOO patient group; 22 common pathways are indicated. (D) Heatmap and clustering based on Z score of 22 common pathways. Z scores of the common pathways in all BOO patients resemble the scores in the BO group. (E) Radar graph for the biological functions of 22 common pathways of all BOO patients. The word cloud shows top pathway elements, and font size indicates the frequency of occurrence. Cellular growth, proliferation and development, and cytokine signaling were the main biological functions shared by all groups. (F) Hierarchical view of upstream analysis mechanistic network made of transcription factors and cytokines in 22 common pathways (mRNAs) of all BOO patients. TNF is the top upstream regulator, connected to 63 downstream elements, including NFkB, JUN, and MYC. C, controls; DO, obstructed patients with detrusor overactivity; BO, obstructed patients without detrusor overactivity; UA, obstructed patients with underactive bladders.
Table 3. Key signaling pathways, defining organ remodeling in BOO-induced LUTD
Pathways DO BO UA BOO vs. C–log(P value) Z score –log(P value) Z score –log(P value) Z score –log(P value) Z score
ERK5 signaling 6.88 2.828 2.22 2.449 7.66 2.887 3.19 2.449PI3K/AKT signalingA 4.43 1.89 2.11 –0.632 4.21 3 2.34 1.414Protein kinase A signaling 3.7 0.775 1.93 0.229 3.39 1.59 1.29 0Colorectal cancer metastasis signalingA 3.51 2.111 3.93 3.674 9.16 4.111 5.41 3.411Cholecystokinin/gastrin-mediated signalingA
3.42 2.646 3.33 3.051 4.89 4.644 3.57 3.317
TGF-β signaling 2.99 2.449 2.33 0.632 2.64 1.877 2.86 1.414IGF-1 signaling 2.75 1 1.58 0.447 4.85 2.268 1.53 0HGF signalingA 2.57 2.236 1.39 1.89 3.55 4.382 2.3 2.121STAT3 pathway 2.56 1.342 1.39 0.378 2.39 0.408 2.16 –0.378Pancreatic adenocarcinoma signaling 2.55 2 2.63 2.309 5.94 4.004 3.39 3HMGB1 signalingA 2.29 2.236 7.96 3.71 6.22 4.523 8.37 3.771IL-1 signaling 2.15 2.236 2.19 1.897 5.01 4.131 1.66 2.449Acute phase response signalingA 2.14 1.89 5.85 1.789 7.91 4.18 6.59 3.153Endothelin-1 signalingA 2.1 2.646 3.24 2 3.99 2.828 1.77 3.162IL-8 signalingA 1.95 2.646 6.29 4.2 9.32 5.253 3.75 3.357Chemokine signaling 1.84 1 1.91 2.828 2.31 2.858 2.22 2.646JAK/STAT signalingA 1.82 1 2.94 0 5.63 2.335 3.47 1Prolactin signaling 1.8 1 1.84 1.134 4.57 3.157 2.76 1.134IL-6 signalingA 1.73 1.342 11.3 3.4 10.9 5.357 7.04 3.153Production of nitric oxide and reactive oxygen species in macrophages
1.49 0 8.9 2.117 7.88 6.155 3.35 3.357
PPAR signalingA 1.45 –2 6.21 –2.668 5.01 –3.55 2.63 –3ILK signalingA 1.43 1.342 7.35 1 2.19 3.355 2.31 3.162AThese pathways contain at least 3 of 4 of the most representative signaling molecules: JUN, NRAS, PTGS2, and NFKB2. BOO, all bladder outlet obstruction patients (n = 18 patients); DO, BOO patients with urodynamically determined detrusor overactivity; BO, BOO patients without detrusor overactivity; UA, underactive bladder; C, controls (n = 6 patients per group). LUTD, lower urinary tract dysfunction.

1 6insight.jci.org doi:10.1172/jci.insight.89560
R E S E A R C H A R T I C L E

1 7insight.jci.org doi:10.1172/jci.insight.89560
R E S E A R C H A R T I C L E
(NRXN3, BMP7, and UPK1A) and three-miRNA (miR-103a-3p, miR-10a-5p, and miR-199a-3p) signa-tures were identified based on ROC curve analysis of NGS data and validated by QPCR in an independent patient population. A blinded follow-up study confirmed that these 3-mRNA and 3-miRNA signatures were sufficient to discriminate DO, BO, and UA groups.
Gene enrichment analysis in the DO mRNA data set showed that pathways characteristic for hyper-trophy and cell differentiation were most important. Characteristic for the DO group was an activation of neurotransmitters and other nervous system signaling, including an upregulation of the DO-specific marker neurexin 3 (NRXN3). Comparative biological function analysis from the DO group to the BO group and the UA group indicated a progressive increase of the number of pathways, corresponding to immune response, growth responses, and apoptosis. Processes contributing to fibrosis and bladder cell dedifferentiation were enhanced, reflected by the downregulation of antifibrotic bone morphogenetic protein 7 (BMP7) and uro-plakin genes, including UPK1A, specifically in UA and BO groups.
We identified 22 pathways shared by all BOO states. These included cytokine and immune response pathways, growth factor signaling pathways (TGF-β, HGF, and IGF-1), activation of GPCR pathways (endothelin and cholecytokinin/gastrin pathways), and NO signaling and hypertrophy-relevant PI3K/AKT signaling pathways. The main transcription factors were activator protein AP-1 (JUN-FOS) and NFkB.
HMGB1 signaling was the most significant (-log(P value)=8.37) shared activated pathway in all BOO patients, in line with its involvement in fibrotic disorders (20). Cytokine signaling, including IL-1, IL-6 and IL-8 signaling pathways, was highly activated during BOO. Endothelin and cholesystokinin/gastrin-mediated path-ways in BOO mRNA data set are indicative of the role of GPCR signaling in bladder organ remodeling, similar to the changes observed in pressure overloaded heart (21). There is increasing experimental evidence of the involvement of endothelin in LUTS pathogenesis (22) and animal models of pBOO (23), supporting our data.
NFkB, involved in immune-related processes, and JUN were identified here as the key upregulated transcription factors during BOO. Our results are in line with animal and cell culture studies showing that BOO and stretch and growth factor stimulation upregulated NFkB and activator protein (AP-1) transcription factors (24). MYC, JUN, EGR1, MYB, and RUNX1 are the transcription factors import-ant for fibroproliferative responses in smooth muscle cells (25).
PI3K/AKT signaling was activated in BOO, and multiple genes encoding for constituents of this path-way are upregulated in BOO patients. This pathway has been shown to be highly regulated in cardiac hypertrophy (26). In particular, GPCR-coupled p110γ PI3K is prominent in heart pathology. TGF-β is a key player in wound healing, fibrosis, and negative regulation of inflammation, and its levels are increased in the majority of fibrotic diseases (27, 28). Here, we show that pathways involving TGF-β and modulator ERK5 (29) are considerably altered in all patient groups. Overall, within shared pathways, only PPAR signaling was predicted to be inhibited, in line with its antiinflammatory and antiproliferative effects (30).
Our study identified TNF-α as the top upstream regulator in all analyzed data sets (BOO and individual groups). These findings are supported by a previous study implicating this cytokine in developing bladder dysfunction in an animal model of type 2 diabetes, which is associated with bladder hypertrophy and over-activity (31). Similarly, studies using detrusor smooth muscle cells showed that TNF-α and IL-1β induced secretion of IL-8 and IL-6 (32), in line with our data in BOO patients. The source of TNF-α in the obstruct-ed bladder was not investigated here, but a recent study in human bladder smooth muscle cells demonstrat-ed that the inflammatory cytokines TGF-β (protein and mRNA), IL-1β, IL-6, and TNF-α (mRNA) were increased by hypoxia (33). Hypoxia is a hallmark of BOO (34), and our study demonstrated an increase of HIF1α mRNA levels in the patient biopsies, supporting this observation.
Here, we also delineated the miRNAs, common in all states of BOO-induced LUTD, as well as specif-ic subsets of regulated miRNAs characteristic of each state. Several profibrotic miRNAs were upregulated in
Figure 9. Regulatory role of miRNAs and their targets in different states of BOO. (A) Number of abundant miRNAs used for pathway analysis. miRNAs had at least 400 reads in control group and were significantly (P < 0.05) regulated in their data set (>± 1.5-fold change). The number of abundant miRNAs progressively increased between BOO states: 9 for DO, 23 for BO, and 30 for UA. (B) Number of pathways built using miRNA targets. Pathways are signifi-cant (P < 0.05), with a Z score prediction. Regulated abundant miRNAs may target a progressively increasing number of pathway elements in DO, BO, and UA. (C) The abundances of individual miRNAs calculated as percentages of individual read counts in the BOO patient miRNA library. The relative content of the most abundant regulated miRNAs is shown. (D) Force-directed graph visualizing direct interaction of 12 miRNAs with 66 mRNA targets represented among pathway elements of miRNA-regulated pathways. Node color is indicative of direction of regulation, and node size is proportional to the absolute value of their log2 fold changes compared with controls. Downregulated miRNAs target the majority of important pathway elements in BOO. C, controls; DO, obstructed patients with detrusor overactivity; BO, obstructed patients without detrusor overactivity; UA, obstructed patients with underactive bladders.

1 8insight.jci.org doi:10.1172/jci.insight.89560
R E S E A R C H A R T I C L E
BOO-induced LUTD, including miR-192 (35, 36) in the BO and UA groups and the hypoxia-induced miRNAs miR-34c (37) and miR-21 (38) in all groups. miR-146a-5p and miR-146b-5p were strongly upregulated in BOO patients. These findings were similar to those in the heart, where miR-146a-5p was elevated in diffuse miocardial fibrosis (39), while miR-146b-5p acted as a mediator in atrial fibrosis (40). Interestingly, miR-146b-5p is induced by angiotensin in cardiac fibroblasts (41). Angiotensin signaling plays an important role in DO in pBOO models (42) and might be an underlying cause of this miRNA upregulation in human patients. We identified the miR-212/132 cluster as upregulated in all BOO patient groups. These miRNAs control hypertrophy in the heart, and their synthesis is activated by calcineurin/NFAT signaling (43–45). The miR-212/132 cluster was upregulated in animals with pBOO (6), concomitant with activation of the calcineurin/NFAT pathway (46).
Notably, muscle-specific miRNAs, including miR-1, miR-133, and miR-143/145, were downregulated in BOO patients in parallel with a decrease in detrusor contractility. In pBOO animal models, miR-133 was down-regulated during BOO-induced TGF-β–mediated hypertrophic and fibrotic responses (47). Similarly, miR-143 and miR-145, enriched in mature smooth muscle (48), were downregulated in the BO and UA groups.
When identifying the pathway elements appropriately regulated by differentially expressed miRNAs, it became apparent that the targets of upregulated miRNAs were disproportionally underrepresented. Only 11% of mRNA targets of upregulated miRNAs were inversely correlated and could be included in the anal-ysis, in contrast to 90% of targets of the downregulated miRNAs. Our results are supported by the global transcriptome level studies showing that expression of only 10%–30% of mRNAs targeted by upregulated miRNAs was changed in the opposite direction (49, 50). Similar to our findings, most targets of the high-ly upregulated miR-21 and miR-34a in kidney cancer were increased at the mRNA and/or protein level (51). This phenomenon, which might be a manifestation of transcriptional override or a similar mechanism (52), awaits further investigation. Nevertheless, we paired 12 abundant differentially expressed miRNAs with mRNA targets involved in main activated pathways. Our data confirmed the role of miR-1 and miR-29c-3p previously identified in animal studies and implicated in pathogenesis of pBOO and bladder overactivity (53). We identified JUND, BDNF, and CCND1 among hubs of signaling activity targeted by miR-1 in human BOO patients. A recent expression profile in a rat pBOO model showed a decrease of miR-29b and miR-29c concomitant with an upregulation of c-Myc, NFkB, and SMAD3 (16). Our results confirm these find-ings in human patients with BOO. We paired miR-29c-3p with 17 mRNA targets participating in signaling pathways, including CREM, NRAS, KLF4, HBEGF, and LIF. Interestingly, 3 of 7 abundant downregulated BOO miRNAs (miR-29c-3p, miR-26b-5p, and miR-497-5p) and several other shared miRNAs (miR-195-3p, miR-30c-5p, miR-195-3p, miR-100-5p, and let-7c-5p) from our study are repressed by activated Myc (54). Our NGS and upstream regulator analysis identified Myc, activated in BOO-induced LUTD downstream of TNF-α, as one of the major hubs of signaling. TNF-α induces synthesis of miRNAs, including miR-155-5p and miR-146b-5p (55), which are upregulated in BOO patients. In line with downstream activation of NFkB, we detected downregulation of abundant miR-497-5p, which has been described as inhibited by NFkB (56). It targets SMAD3 (57), JUN, FOSL1, TNFSF9, CCND1, and other mRNAs involved in pathways altered in BOO patients. Similarly, upregulation of miR-486-5p, as detected here, is in line with activated TNF-α and NFkB signaling (58). These observations indicate that miRNAs might be involved in the secondary feedback loops rather than being primary drivers of the disease-mediated gene expression changes.
We did not examine the biopsies for cell composition and morphology, which is a limitation of this study. Previously, ultrastructural changes in the detrusor indicative of bladder hypertrophy and fibrosis were demonstrated by electron microscopy in human BOO patient biopsies (59, 60). However, the signs of inflammation and fibrosis did not correlate with the severity of BOO upon light microscopic exam-ination (61). Therefore, a quantitative assessment of the mRNA and miRNA expression levels may be a more sensitive and reliable method for monitoring bladder remodeling when comparing BOO and control biopsies collected following the same procedure.
In summary, signaling pathways regulated in BOO-induced LUTD that we identified in this study show parallels with other conditions involving hypertrophy and fibrosis and support the animal models of bladder dysfunction. The number of miRNA-regulated pathways increased among the disease states from the DO group via the BO group to the UA group. Together with the upstream regulator analysis, these results suggest an increasing involvement of miRNAs in the control of bladder function from the overactive to underactive/acontractile states. Relating the levels of circulating urinary miRNA, including the newly identified signature miRNAs, to the symptoms of BOO-induced dysfunction and inhibiting the fibrotic pathways described here in cell-based and animal models will lay foundation for the new diagnostic and therapeutic tools.

1 9insight.jci.org doi:10.1172/jci.insight.89560
R E S E A R C H A R T I C L E
Methods
Data depositoryThe mRNA and miRNA sequencing data sets were deposited in the European Nucleotide Archive under accession numbers PRJEB11369 (for mRNAs) and ERP012260 (for miRNAs).
Patient selection, biopsy collection, and RNA isolationVoiding symptoms were assessed in all patients by International Prostate Symptom Score (IPSS) and O’Leary-Sant questionnaires, pelvic pain VAS score, 48-hour urinary diary, and urinary free flow and sono-graphic measurements of residual urine volumes (62).
Group 1. Controls were mostly recruited from patients undergoing cystoscopy for stone treatment. They had IPSS score <8, O’Leary-Sant symptom index <6, O’Leary-Sant problem index <6, pelvic pain VAS score <4, voiding frequency <8/24 hours, a bell-shaped flow curve, and no post-void residual urine.
Groups 2–4 (BOO patents). In all patients with LUTS due to BOO, urodynamic studies were performed according to the International Continence Society (ICS) standards. Groups were defined according to ICS termi-nology after all urodynamic results had been reviewed by a second experienced functional urologist as follows.
Group 2 (DO patients). Group 2 patients had increased detrusor pressure and reduced urine flow during pressure flow in combination with involuntary detrusor contractions during filling phase (phasic and/or terminal), which was defined as obstructive according to the Abrams-Griffith nomogram.
Group 3 (BO patients). Group 3 patients were defined as obstructive according to the Abrams-Griffith nomogram and did not have involuntary detrusor contractions during filling phase.
Group 4 (UA patients). Group 4 patients were defined as having contractions of reduced strength and/or duration, resulting in prolonged bladder emptying and or failure to achieve complete bladder emptying within a normal time span (UA). Alternatively, these patients were found to be without detrusor contrac-tions during urodynamic study (acontractile detrusor) and cystoscopy in line with obstruction.
miRNA and mRNA sequencing and pathway analysisIllumina miRNA and mRNA sequencing. Both miRNA and mRNA sequencing were performed on the Illu-mina HiSeq 2000 using RNA isolated from the same patient’s biopsy. The TruSeq RNA Sample Prep Kit v2 (Illumina Inc.) was used for library preparation. The TruSeq PE Cluster Kit v3-cBot-HS or TruSeq SR Cluster Kit v3-cBot-HS (Illumina Inc.) was used for cluster generation using 10 pM of pooled nor-malized libraries on the cBOT. Sequencing was performed on the Illumina HiSeq 2000 (single-end 100 bp) using the TruSeq SBS Kit v3-HS (Illumina Inc.). For mRNA sequencing, read mapping to human reference genome hg19 was done using Tophat 2.0.9. Counting the number of reads per gene was done using HTSeq v.0.5.4p3. The Bioconductor package edgeR (Bioconductor version release 3.2) was used to identify differentially expressed genes. For miRNA sequencing, input preprocessing, read mapping, read annotation, annotation analysis, and enrichment analysis were done via the ncPRO using the human genome build hg19 and mirBase v19. We used Bioconductor package Edge to identify differentially expressed miRNAs. We choose to set the threshold for FDR-adjusted P value to 0.15 in order to maxi-mize the number of genes used to build the pathways.
miRNA target prediction. We used the miRNA Target Filter tool in IPA (QIAGEN; https://www.qiagen-bioinformatics.com/products/ingenuity-pathway-analysis/) to associate miRNAs from our miRNA sequenc-ing data sets with experimentally observed and predicted mRNA targets. The predicted relationships are from TargetScan (v7.0; http://www.targetscan.org), and the experimentally observed relationships are from TarBase.
miRNA-mRNA expression pairing. We applied the miRNA-mRNA expression pairings function (IPA) to identify the direction of miRNA and mRNA expression changes. Then, we prioritized miRNAs and their targets by choosing those that were inversely correlated.
Prediction of biological function of canonical pathways. We built a tool in R program that searches for involvement of each IPA canonical pathway in the Biological Function Classification Database of IPA known as “Ingenuity canonical pathway” and counts the number of pathways involved in a specific biolog-ical function. The results are illustrated as radar graphs.
Z score calculation for activity of canonical pathways. In order to determine whether the activity of canon-ical pathways, including functional end points, is increased or decreased based on differentially expressed genes in the data sets, the pathway activity (Z score) was calculated by IPA.

2 0insight.jci.org doi:10.1172/jci.insight.89560
R E S E A R C H A R T I C L E
Upstream regulator analysis. The upstream pathway analysis module of Ingenuity Pathway Analysis (IPA) (application build 377306M, dated March 26, 2016, content version 27216297 building_idris, dated March 16, 2016) was used to calculate upstream regulator enrichment. Overlapping P values were calculat-ed by IPA using Fisher’s exact test based on the significance of the overlap between the known targets and an experimentally identified set of regulated genes.
Hierarchical clustering and heatmaps. Hierarchical clustering and the associated heatmaps for miRNA and mRNA sequencing data were generated with the function heatmap2 in the R package gplots or Gene-E R package. The pairwise correlation matrix between items was computed (based on Pearson correlation method) and then converted as a distance matrix; finally, clustering was computed on the resulting distance matrix. The average linkage method used the average distance to calculate the distance matrix. For the heatmap visualization, the log2 expression values were used.
Visualizing and comparing trees of hierarchical clusterings. We used dendextend R package to create and com-pare visually appealing tree diagrams. Entanglement degree of two dendrograms was quantified by entangle-ment score. A lower entanglement coefficient corresponds to a good alignment. Entanglement was measured by matching the left and right trees as a vector, and entanglement equals the normal distance between vectors: score = Σ |x-y|L / worst case entanglement level, where x represents the left tree label value, y represents the left tree label value, and L represents the penalty level that we assigned.
PCA. For a PCA of log2 fold change of mRNA and miRNA expression of BOO patients compared with controls, prcomp function implemented in R (R Core Team, 2016), rgl, and scatterplot3d R package were used for the PCA of 3D plots. To achieve better numerical accuracy, the calculation was performed using a singular value decomposition of the (centered and scaled) data matrix.
ROC curve analysis. ROC curve analysis was performed using SPSS (IBM Corp., released 2013, IBM SPSS Statistics for Windows, version 22.0.). We included the cutoff value for positive classification to see the power of miRNAs and mRNAs to differentiate the BOO patients. The area under the curve was calcu-lated with 95% confidence interval. The area under the curve was accepted as significantly different from 0.5 when P value was greater than 0.5.
3D ellipsoid chart and point identification for biomarkers. The scatter3d() function in car (Companion to Applied Regression) package was used in order to call for the rgl package, which draws 3D scatter plots with various regression surfaces (http://cran.r-project.org) using XQuartz (The X Window System, version 2.7.9). In con-centration ellipsoids, the DO patients are shown in green, BO group are shown in blue, and UA patients are shown in orange color. The data used to plot the graph were calculated based on calculation of distance of each value from the mean of the corresponding group. The coordination of each point on the 3D graph was identified based on its Mahalanobis distance from the centroid of the 3 variables as follows: D(X, μ) = √(X – μ)ts-1(X – μ), where D represents Mahalanobis distance, X represents the value for each variable, S–1 represents the inverse of the variance-covariance matrix, t indicates vector should be transposed, and μ is mean of observations.
Venn diagrams. We used “Venny” to draw simple Venn diagrams without size adjustments.Force-directed graph. We used a force-directed approach to correlate the miRNAs and their targets and
to cluster them based on the regulation direction (downregulation or upregulation). We used package net-workD3 in R, which created a D3 JavaScript force-directed network graph.
Gene and miRNA clouds (tag clouds, word clouds). To condense and visualize gene enrichment data from a pathway analysis data set, a cloud was created using Wordle.net and Word cloud R package. The font size of a gene or miRNA (tag) is determined by its incidence in the pathway analysis data set.
QPCR validation of NGS studiesTotal RNA was isolated from bladder dome biopsies using the miRVana miRNA isolation kit (Ambion). The reverse-transcription reactions were carried out using the High-Capacity cDNA Reverse Transcription Kit (Applied Biosystems) with random hexamer primers. TaqMan assays were from Applied Biosyste-ms. Quantification of mature miRNAs was performed using TaqMan Advanced miRNA assays (Applied Biosystems). QPCR was carried out in triplicate using the 7900HT Fast Real-time PCR System (Applied Biosystems). The Ct values obtained after real-time QPCR were normalized and fold differences were com-pared with the control calculated.
Blinded study for biomarker validationFor validation of the biomarker selection, additional bladder dome biopsy samples were processed
2 1insight.jci.org doi:10.1172/jci.insight.89560
R E S E A R C H A R T I C L E
by the investigators blinded to the urodynamic state of the patients. The samples belonged to the control group or patient (BOO) group, with no further details of the patients’ bladder function provid-ed. Expression levels of 3 miRNAs (hsa-miR-103a-3p, hsa-miR-10a-5p, and hsa-miR-199a-3p) and 3 mRNAs (NRXN3, BMP7, and UPKA1) were examined by QPCR, and the samples were allocated to the DO, BO, or UA group using machine-based learning algorithms. Plotting log2 fold change values relative to controls into 3D scatter plots allowed for the visualization of the confidence interval of sample distribution. Following the blinded sample grouping and patient status decoding, the urody-namic data for each patient were revealed and the molecular signature-based results were correlated with the functional diagnosis.
StatisticsHierarchical clustering and heatmaps. Hierarchical clustering and the associated heatmaps for miRNA and mRNA sequencing data were generated with the function heatmap2 in the R package gplots or Gene-E R package. Pairwise correlation matrices between items were computed based on the Pearson correlation method. The average linkage method used average to calculate the distance matrix. For the heatmap visu-alization, the log2 expression values were used. We used dendextend R package to create and compare visually appealing tree diagrams.
PCA. Prcomp function implemented in R (R Core Team, 2016), rgl, and scatterplot3d R package were used for the PCA of 3D plots. The calculation was performed using a singular value decomposition of the (centered and scaled) data matrix.
ROC curve analysis. ROC curve analysis was performed using SPSS (IBM Corp., released 2013, IBM SPSS Statistics for Windows, version 22.0). The area under the curve was calculated with 95% confidence interval.
Z score calculation for activity of canonical pathways. Z score (IPA – Pathways) was used to mathematically compare the uploaded data set (differentially expressed mRNAs) with the canonical pathway patterns. The significance values for the canonical pathways were calculated by right-tailed Fisher’s exact test.
Upstream regulator analysis. The upstream pathway analysis module of IPA (application build 377306M, dated March 26, 2016, content version 27216297 build ing_idris, dated March 16, 2016) was used. Over-lapping P values were calculated by IPA using Fisher’s exact test based on the significance of the overlap between the known targets and an experimentally identified set of regulated genes.
3D ellipsoid chart and point identification for biomarkers. The scatter3d() function in car (Companion to Applied Regression) package was used in order to call for rgl package, which draws 3D scatter plots with various regression surfaces (http://cran.r-project.org) using XQuartz (The X Window System, version 2.7.9). The coordination of each point on the 3D graph was identified based on its Mahalanobis distance from the centroid of the 3 variables.
QPCR validation of NGS studies. To choose reference (endogenous control) miRNA, expression stabili-ties of the different miRNAs were evaluated using NormFinder R package. Normalized values were cen-tered and scaled. A 1-way ANOVA was employed, and the Tukey correction was used to correct P values. P < 0.05 was considered statistically significant (GraphPad Prism, version 6.0).
Classifiers identification (blinded test). Machine-learning algorithms (naive Bayes, support vector machine, random forests, and k-nearest neighbor) were used in this study to train and examine the power of bio-markers. The algorithms were trained with biomarker expression Ct values of the known samples, and subsequently Ct values of blinded samples were used as input for decoding.
Study approvalApproval to conduct this study was obtained from the ethics committee of Canton Bern, Switzerland (KEK 146/05 original study, KEK 331/14 follow-up blinded study), and all subjects gave written informed consent. The study is registered in ClinicalTrials.gov (Protocol Record 331/2014, Clinical-Trials.gov identifier: NCT01482676).
Author contributionsAHG, FCB, and KM designed the study; FCB supervised the patient recruitment; FCB, FM, and BK examined the patients and collected biopsies; AHG and KM performed the experiments; IK, RB, CAF, and HR conducted NGS; AHG analyzed the data; and AHG, FCB, and KM wrote the manuscript.

2 2insight.jci.org doi:10.1172/jci.insight.89560
R E S E A R C H A R T I C L E
AcknowledgmentsThe authors thank Andrea Bucher for expert technical assistance. We are grateful to Rosalyn M. Adam (Department of Urology, Boston Children’s Hospital, Boston, Massachusetts, USA) for many helpful dis-cussions and critically reading the manuscript. We thank Janine Hensel for discussions and Ivonne Koeck for help in data validation. The financial support of the Swiss National Science Foundation (SNF grant 320030_156161/1) and the Velux Foundation (grant 895) is gratefully acknowledged.
Address correspondence to: Katia Monastyrskaya, Urology Research Laboratory, Department of Clinical Research, University of Bern, Bern, Switzerland. Phone: 41.31.632.87.19; E-mail: [email protected]. Or to: Fiona C. Burkhard, Department of Urology, Inselspital, University Hospital Bern, CH-3010 Bern, Switzerland. Phone: 41.31.632.2725; E-mail: [email protected].
1. McVary KT. BPH: epidemiology and comorbidities. Am J Manag Care. 2006;12(5 Suppl):S122–S128. 2. Hakenberg OW, Linne C, Manseck A, Wirth MP. Bladder wall thickness in normal adults and men with mild lower urinary
tract symptoms and benign prostatic enlargement. Neurourol Urodyn. 2000;19(5):585–593. 3. Kojima M, Inui E, Ochiai A, Naya Y, Ukimura O, Watanabe H. Noninvasive quantitative estimation of infravesical obstruction
using ultrasonic measurement of bladder weight. J Urol. 1997;157(2):476–479. 4. Metcalfe PD, et al. Bladder outlet obstruction: progression from inflammation to fibrosis. BJU Int. 2010;106(11):1686–1694. 5. Lin W, et al. Molecular mechanisms of bladder outlet obstruction in transgenic male mice overexpressing aromatase (Cyp19a1).
Am J Pathol. 2011;178(3):1233–1244. 6. Sadegh MK, et al. Detrusor induction of miR-132/212 following bladder outlet obstruction: association with MeCP2 repression
and cell viability. PLoS ONE. 2015;10(1):e0116784. 7. LaBelle E, Zderic S, Delaney D, Hypolite J, Wein A, Chacko S. Lipid signaling changes in smooth muscle remodeling associat-
ed with partial urinary bladder outlet obstruction. Neurourol Urodyn. 2006;25(2):179–184. 8. Duan LJ, et al. MiR-133 modulates TGF-β1-induced bladder smooth muscle cell hypertrophic and fibrotic response: implication
for a role of microRNA in bladder wall remodeling caused by bladder outlet obstruction. Cell Signal. 2015;27(2):215–227. 9. Ekman M, Bhattachariya A, Dahan D, Uvelius B, Albinsson S, Swärd K. Mir-29 repression in bladder outlet obstruction con-
tributes to matrix remodeling and altered stiffness. PLoS One. 2013;8(12):e82308. 10. Sadegh MK, et al. Detrusor induction of miR-132/212 following bladder outlet obstruction: association with MeCP2 repression
and cell viability. PLoS One. 2015;10(1):e0116784. 11. Gheinani AH, Burkhard FC, Monastyrskaya K. Deciphering microRNA code in pain and inflammation: lessons from bladder
pain syndrome. Cell Mol Life Sci. 2013;70(20):3773–3789. 12. Sanchez Freire V, Burkhard FC, Kessler TM, Kuhn A, Draeger A, Monastyrskaya K. MicroRNAs may mediate the down-regu-
lation of neurokinin-1 receptor in chronic bladder pain syndrome. Am J Pathol. 2010;176(1):288–303. 13. Hashemi Gheinani A, Burkhard FC, Rehrauer H, Aquino Fournier C, Monastyrskaya K. MicroRNA MiR-199a-5p regulates
smooth muscle cell proliferation and morphology by targeting WNT2 signaling pathway. J Biol Chem. 2015;290(11):7067–7086. 14. Monastyrskaya K, et al. miR-199a-5p regulates urothelial permeability and may play a role in bladder pain syndrome. Am J
Pathol. 2013;182(2):431–448. 15. Zhang S, et al. Loss of dicer exacerbates cyclophosphamide-induced bladder overactivity by enhancing purinergic signaling. Am
J Pathol. 2012;181(3):937–946. 16. Ekman M, Bhattachariya A, Dahan D, Uvelius B, Albinsson S, Swärd K. Mir-29 repression in bladder outlet obstruction con-
tributes to matrix remodeling and altered stiffness. PLoS One. 2013;8(12):e82308. 17. Schurch NJ, et al. How many biological replicates are needed in an RNA-seq experiment and which differential expression tool
should you use? RNA. 2016;22(6):839–851. 18. Mullokandov G, et al. High-throughput assessment of microRNA activity and function using microRNA sensor and decoy
libraries. Nat Methods. 2012;9(8):840–846. 19. Koeck I, Burkhard FC, Monastyrskaya K. Activation of common signaling pathways during remodeling of the heart and the
bladder. Biochem Pharmacol. 2016;102:7–19. 20. Li LC, Gao J, Li J. Emerging role of HMGB1 in fibrotic diseases. J Cell Mol Med. 2014;18(12):2331–2339. 21. Brunner F, Brás-Silva C, Cerdeira AS, Leite-Moreira AF. Cardiovascular endothelins: essential regulators of cardiovascular
homeostasis. Pharmacol Ther. 2006;111(2):508–531. 22. Füllhase C, Soler R, Gratzke C. New strategies in treating male lower urinary tract symptoms. Curr Opin Urol. 2014;24(1):29–35. 23. Ukai M, et al. Participation of endogenous endothelin and ETA receptor in premicturition contractions in rats with bladder out-
let obstruction. Naunyn Schmiedebergs Arch Pharmacol. 2006;373(3):197–203. 24. Persson K, Dean-Mckinney T, Steers WD, Tuttle JB. Activation of the transcription factors nuclear factor-kappaB and activator
protein-1 in bladder smooth muscle exposed to outlet obstruction and mechanical stretching. J Urol. 2001;165(2):633–639. 25. Yang W, et al. Integration of proteomic and transcriptomic profiles identifies a novel PDGF-MYC network in human smooth
muscle cells. Cell Commun Signal. 2014;12:44. 26. Aoyagi T, Matsui T. Phosphoinositide-3 kinase signaling in cardiac hypertrophy and heart failure. Curr Pharm Des.
2011;17(18):1818–1824. 27. Bowen T, Jenkins RH, Fraser DJ. MicroRNAs, transforming growth factor beta-1, and tissue fibrosis. J Pathol. 2013;229(2):274–285. 28. Meng XM, Chung AC, Lan HY. Role of the TGF-β/BMP-7/Smad pathways in renal diseases. Clin Sci. 2013;124(4):243–254. 29. Kim S, Lim JH, Woo CH. ERK5 inhibition ameliorates pulmonary fibrosis via regulating Smad3 acetylation. Am J Pathol.

2 3insight.jci.org doi:10.1172/jci.insight.89560
R E S E A R C H A R T I C L E
2013;183(6):1758–1768. 30. Lehrke M, Lazar MA. The many faces of PPARgamma. Cell. 2005;123(6):993–999. 31. Wang Z, et al. Inhibition of TNF-α improves the bladder dysfunction that is associated with type 2 diabetes. Diabetes.
2012;61(8):2134–2145. 32. Bouchelouche K, Alvarez S, Horn T, Nordling J, Bouchelouche P. Human detrusor smooth muscle cells release interleukin-6,
interleukin-8, and RANTES in response to proinflammatory cytokines interleukin-1beta and tumor necrosis factor-alpha. Urolo-gy. 2006;67(1):214–219.
33. Wiafe B, Adesida A, Churchill T, Adewuyi EE, Li Z, Metcalfe P. Hypoxia-increased expression of genes involved in inflam-mation, dedifferentiation, pro-fibrosis, and extracellular matrix remodeling of human bladder smooth muscle cells [published online ahead of print September 8, 2016]. In Vitro Cell Dev Biol Anim. doi:10.1007/s11626-016-0085-2.
34. Schröder A, et al. Effect of chronic bladder outlet obstruction on blood flow of the rabbit bladder. J Urol. 2001;165(2):640–646. 35. Putta S, Lanting L, Sun G, Lawson G, Kato M, Natarajan R. Inhibiting microRNA-192 ameliorates renal fibrosis in diabetic
nephropathy. J Am Soc Nephrol. 2012;23(3):458–469. 36. Hong JP, Li XM, Li MX, Zheng FL. VEGF suppresses epithelial-mesenchymal transition by inhibiting the expression of Smad3
and miR-192, a Smad3-dependent microRNA. Int J Mol Med. 2013;31(6):1436–1442. 37. Xu X, et al. Hypoxia induces downregulation of soluble guanylyl cyclase β1 by miR-34c-5p. J Cell Sci. 2012;125(Pt 24):6117–6126. 38. Mace TA, Collins AL, Wojcik SE, Croce CM, Lesinski GB, Bloomston M. Hypoxia induces the overexpression of microR-
NA-21 in pancreatic cancer cells. J Surg Res. 2013;184(2):855–860. 39. Fang L, et al. Circulating microRNAs as biomarkers for diffuse myocardial fibrosis in patients with hypertrophic cardiomyopa-
thy. J Transl Med. 2015;13:314. 40. Wang J, et al. Integrated analysis of microRNA and mRNA expression profiles in the left atrium of patients with nonvalvular
paroxysmal atrial fibrillation: Role of miR-146b-5p in atrial fibrosis. Heart Rhythm. 2015;12(5):1018–1026. 41. Jiang X, Ning Q, Wang J. Angiotensin II induced differentially expressed microRNAs in adult rat cardiac fibroblasts. J Physiol
Sci. 2013;63(1):31–38. 42. Cho ST, Park EY, Kim JC. Effect of angiotensin II receptor antagonist telmisartan on detrusor overactivity in rats with bladder
outlet obstruction. Urology. 2012;80(5):1163.e1–1163.e7. 43. Kumarswamy R, et al. Vascular importance of the miR-212/132 cluster. Eur Heart J. 2014;35(45):3224–3231. 44. Eskildsen TV, et al. The microRNA-132/212 family fine-tunes multiple targets in Angiotensin II signalling in cardiac fibroblasts.
J Renin Angiotensin Aldosterone Syst. 2015;16(4):1288–1297. 45. Ucar A, et al. The miRNA-212/132 family regulates both cardiac hypertrophy and cardiomyocyte autophagy. Nat Commun.
2012;3:1078. 46. Chang AY, et al. Calcineurin mediates bladder wall remodeling secondary to partial outlet obstruction. Am J Physiol Renal Physi-
ol. 2011;301(4):F813–F822. 47. Duan LJ, et al. MiR-133 modulates TGF-β1-induced bladder smooth muscle cell hypertrophic and fibrotic response: implication
for a role of microRNA in bladder wall remodeling caused by bladder outlet obstruction. Cell Signal. 2015;27(2):215–227. 48. Xin M, et al. MicroRNAs miR-143 and miR-145 modulate cytoskeletal dynamics and responsiveness of smooth muscle cells to
injury. Genes Dev. 2009;23(18):2166–2178. 49. Shahab SW, et al. Evidence for the complexity of microRNA-mediated regulation in ovarian cancer: a systems approach. PLoS
ONE. 2011;6(7):e22508. 50. Matkovich SJ, Hu Y, Dorn GW. Regulation of cardiac microRNAs by cardiac microRNAs. Circ Res. 2013;113(1):62–71. 51. Li Z, et al. Integrated microRNA, mRNA, and protein expression profiling reveals microRNA regulatory networks in rat kidney
treated with a carcinogenic dose of aristolochic acid. BMC Genomics. 2015;16:365. 52. Hill CG, Matyunina LV, Walker D, Benigno BB, McDonald JF. Transcriptional override: a regulatory network model of indirect
responses to modulations in microRNA expression. BMC Syst Biol. 2014;8:36. 53. Imamura M, et al. Myocardin and microRNA-1 modulate bladder activity through connexin 43 expression during post-natal
development. J Cell Physiol. 2013;228(9):1819–1826. 54. Chang TC, et al. Widespread microRNA repression by Myc contributes to tumorigenesis. Nat Genet. 2008;40(1):43–50. 55. Ma X, Becker Buscaglia LE, Barker JR, Li Y. MicroRNAs in NF-kappaB signaling. J Mol Cell Biol. 2011;3(3):159–166. 56. Wei W, et al. The NF-κB-modulated microRNAs miR-195 and miR-497 inhibit myoblast proliferation by targeting Igf1r, Insr
and cyclin genes. J Cell Sci. 2016;129(1):39–50. 57. Jafarzadeh M, Soltani BM, Dokanehiifard S, Kay M, Aghdami N, Hosseinkhani S. Experimental evidences for hsa-miR-497-5p
as a negative regulator of SMAD3 gene expression. Gene. 2016;586(2):216–221. 58. Song L, et al. miR-486 sustains NF-κB activity by disrupting multiple NF-κB-negative feedback loops. Cell Res. 2013;23(2):274–289. 59. Brierly RD, Hindley RG, McLarty E, Harding DM, Thomas PJ. A prospective evaluation of detrusor ultrastructural changes in
bladder outlet obstruction. BJU Int. 2003;91(4):360–364. 60. Hindley RG, Brierly RD, McLarty E, Harding DM, Thomas PJ. A qualitative ultrastructural study of the hypocontractile detru-
sor. J Urol. 2002;168(1):126–131. 61. Horn T, et al. Routine bladder biopsies in men with bladder outlet obstruction? Urology. 2004;63(3):451–456. 62. Abrams P, et al. The standardisation of terminology in lower urinary tract function: report from the standardisation sub-com-
mittee of the International Continence Society. Urology. 2003;61(1):37–49.