Embed Size (px)
Citation preview

PNNL-22236
Prepared for the U.S. Army Corps of Engineers, Portland District, under an Interagency Agreement with the U.S. Department of Energy Contract DE-AC05-76RL01830
Characterization of Fish Passage Conditions through the Fish Weir and Turbine Unit 1 at Foster Dam, Oregon, Using Sensor Fish, 2012 Final Report JP Duncan February 2013

PNNL-22236
Characterization of Fish Passage Conditions through the Fish Weir and Turbine Unit 1 at Foster Dam, Oregon, Using Sensor Fish, 2012 Final Report JP Duncan February 2013 Prepared for the U.S. Army Corps of Engineers, Portland District, under an Interagency Agreement with the U.S. Department of Energy Contract DE-AC05-76RL01830 Pacific Northwest National Laboratory Richland, Washington 99352

Final Report
iii
Summary
Fish passage conditions through a Kaplan turbine and spillway fish weir at Foster Dam, located on the South Santiam River in Linn County, Oregon, were evaluated by Pacific Northwest National Laboratory for the U.S. Army Corps of Engineers, Portland District, using Sensor Fish devices. The objective of the study was to describe and compare passage exposure conditions, identifying potential fish injury regions encountered during passage via specific routes. The investigation was performed in May 2012, concurrent with HI-Z balloon-tag studies by Normandeau Associates, Inc.
Sensor Fish data were analyzed to characterize the passage exposure conditions through the spillway fish weir and turbine Unit 1 at Foster Dam at two forebay pool elevations (616 and 634 ft mean sea level [MSL]) and to estimate data relationships with live fish injury and mortality estimates.
For the spillway fish weir evaluation, Sensor Fish and live fish were deployed through injection system piping mounted on the weir. The bottom of the injection pipe was at an elevation of approximately 614 ft during testing at the 616-ft MSL (low) forebay elevation and at 632 ft during the 634-ft MSL (high) forebay level tests. Two systems were used—a 4-in. pipe for juvenile fish releases and an 8-in. pipe for adult releases at each elevation.
Low discharge flows over the fish weir at Foster Dam resulted in a shallow depth of flow and a poorly formed discharge jet. As a result, the Sensor Fish came into contact with the spillway surface multiple times during passage, from initial impact to the bottom of the spillway chute. In addition, the slope of the spillway chute, at approximately 25 degrees, and the discharge jet’s angle of impact contributed to conditions that could be deleterious to fish passing via this route.
All Sensor Fish passing over the spillway weir experienced significant events, as determined from acceleration magnitude data (n = 42). A significant event is defined as an impulse in acceleration magnitude greater than or equal to 95 g. Significant events are caused by strike, collision with dam structure, or exposure to shear. Shear events were observed during the high-forebay treatment (634 ft MSL), and all occurred at chute impact. All other significant events were collisions, regardless of treatment condition. Event severity was greatest for Sensor Fish passing over the weir at the low-forebay level through the juvenile fish pipe, with a mean value of 157.6 g. However, 23% of the Sensor Fish passing over the weir at the high-forebay level were damaged following passage through the juvenile fish pipe compared with 5% at the low-forebay level.
The nearly vertical drop after exiting the injection pipe and the fact that some of the Sensor Fish and steelhead were not entrained in the flow prior to passage over the spillway weir likely contributed to injuries—especially at the high-forebay level, where the drop was over 40 ft. Sensor Fish weighing approximately 50 grams with their attached balloons and radio tag would have an impact force of 1,865 and 3,185 newtons (N) for the low- and high-forebay levels, respectively. Adult steelhead may experience forces of as much as 260,540 N, resulting in injury or mortality, depending on the surface area over which the force was distributed.
For the turbine evaluation, Sensor Fish were injected into the turbine intake flow at an elevation of approximately 593 ft MSL, slightly higher than the penstock centerline elevation (590 ft MSL). Exit from the pipe terminus occurred into flows of approximately 5 fps, providing guidance into the penstock.

Final Report
iv
Four turbine operation levels were tested at the low-forebay level, ranging from 2.8 to 7.0 MW, and three operation levels were tested at the high-forebay level, ranging from 4.9 to 9.0 MW.
Sensor Fish experienced high damage/loss rates of more than 22% during turbine passage. Evidence of grinding or squeezing was evident in several Sensor Fish units, assumed to be from being compressed between the turbine blade and wall. Sixty-two percent of the Sensor Fish experienced at least one significant event during turbine passage (n = 50). For the low-forebay turbine operations, events were most frequent at the wicket gates; for the high-forebay operations, events were more prevalent during runner passage. Events observed at the wicket gates at high-forebay operations were generally of a lower magnitude than those detected at the low-forebay operations.
The significant event magnitude values for the most severe event experienced by Sensor Fish during passage through turbine Unit 1 were greatest at the low-forebay 4.9/5.0-MW operation, averaging 152.8 g. Highest severe event magnitude at the high-forebay level was 142.8 g, at the 6.5-MW operation. Significant events of the greatest magnitudes were generally higher during the low-forebay treatment than during high-forebay treatment. The occurrence of more than one significant event during the passage of an individual Sensor Fish was more likely during high-forebay operations.
Significant event occurrences as experienced by the Sensor Fish were two to three times more frequent for Foster Dam turbine passage than those observed during previously conducted studies of Kaplan turbine passage at Columbia River dams. Contributing factors to the higher number of events at Foster Dam may include the following: the turbine runners are smaller in diameter, have six blades, and rotate at 257 rpm, and the associated velocity at the periphery of the runner is approximately 224 fps. A simulation model was used to estimate the possibility of fish being injured by a strike with the runner blade. The strike probability estimates made using a blade strike model compared favorably with the frequency of occurrence of severe events observed using Sensor Fish. In addition, the blade strike model estimates of injury probability tracked the observed frequency of occurrence of injury to live balloon-tagged test fish.
Lowest pressure nadirs observed during turbine passage were for the high-head (high-forebay) operations. The observed nadir values for the Foster Dam turbine are comparable to those observed for Kaplan turbines installed in the mainstem Columbia and Snake river dams, ranging from approximately 14 to 21 psia.
Comparison of Sensor Fish results for the two passage routes tested at Foster Dam during spring 2012 indicate that Sensor Fish passing over the spillway weir experienced higher event magnitudes than those passing through the turbine because most experienced significant events upon impact with the spillway chute. Increasing the depth of flow would likely enhance passage conditions by providing an improved discharge jet as well as a cushioning effect for fish and Sensor Fish. Possible changes to the weir design should also be investigated to improve the route’s safety at both pool levels.

Final Report
v
Acronyms and Abbreviations
°C degrees Celsius
°F degrees Fahrenheit
cfs cubic feet per second
DOF degrees of freedom
fps feet per second
ft foot, feet
g average acceleration produced by gravity at the Earth’s surface (sea level); used in this report as a measure of event magnitude
hr hour(s)
Hz hertz
in. inch(es)
kcfs thousand-cubic feet per second
kg kilogram(s)
LRP natural log of the ratio of acclimation pressure to exposure pressure
min minute(s)
mm millimeter(s)
MPa megapascal(s)
MSL mean sea level
MW megawatt(s)
N newton(s)
PNNL Pacific Northwest National Laboratory
PSF pressure-sensitive film
psia pounds per square inch absolute
RPA Reasonable and Prudent Alternative
rpm revolutions per minute
s second(s)
SD standard deviation
SE standard error
TDG total dissolved gas
USACE U.S. Army Corps of Engineers

Final Report
vii
Contents
Summary ............................................................................................................................................... iii Acronyms and Abbreviations ............................................................................................................... v 1.0 Introduction .................................................................................................................................. 1.1
1.1 Objectives ............................................................................................................................. 1.1 1.2 Report Overview .................................................................................................................. 1.1
2.0 Methods ........................................................................................................................................ 2.1 2.1 Study Site ............................................................................................................................. 2.1 2.2 Sensor Fish Device ............................................................................................................... 2.2 2.3 Procedures ............................................................................................................................ 2.3
2.3.1 Spillway Fish Weir Evaluation.................................................................................. 2.3 2.3.2 Turbine Passage Evaluation ...................................................................................... 2.4
2.4 Data Analysis ....................................................................................................................... 2.4 3.0 Results .......................................................................................................................................... 3.1
3.1 Treatment Release Data ....................................................................................................... 3.1 3.1.1 Spillway Fish Weir Evaluation.................................................................................. 3.1 3.1.2 Turbine Evaluation .................................................................................................... 3.1
3.2 Data Analysis ....................................................................................................................... 3.2 3.2.1 Spillway Fish Weir Passage ...................................................................................... 3.2 3.2.2 Penstock/Turbine Passage ......................................................................................... 3.3
3.3 Collision, Strike, and Shear Events ...................................................................................... 3.4 3.3.1 Spillway Fish Weir Passage ...................................................................................... 3.5 3.3.2 Turbine Passage ......................................................................................................... 3.9
3.4 Turbulence Index.................................................................................................................. 3.12 3.5 Comparison of Sensor Fish and Live-Fish Data .................................................................. 3.13
4.0 Discussion ..................................................................................................................................... 4.1 4.1 Spillway Fish Weir Passage ................................................................................................. 4.1 4.2 Penstock/Turbine Passage .................................................................................................... 4.6
5.0 Conclusions .................................................................................................................................. 5.1 6.0 References .................................................................................................................................... 6.1 Appendix A – Field Log Data Sheets ................................................................................................... A.1 Appendix B – Data Summary Tables for Each Sensor Fish Release .................................................... B.1 Appendix C – Pressure and Acceleration Magnitude Time Histories for Each Sensor Fish
Release ........................................................................................................................... C.1 Appendix D – Pressure and Angular Rate-of-Change Time Histories of Each Sensor Fish
Release ........................................................................................................................... D.1

Final Report
viii
Figures
2.1 Foster Dam, Oregon .................................................................................................................... 2.1 2.2 Foster Dam spillway ................................................................................................................... 2.2 2.3 Six-degree-of-freedom Sensor Fish device ................................................................................. 2.2 2.4 Approximate height of the spillway fish weir above the spillway crest for the high
forebay level and low forebay level ............................................................................................ 2.3 3.1 Representative Sensor Fish data overlaid on a cross section of the Foster Dam spillway
weir showing the approximate locations of selected major timing marks .................................. 3.3 3.2 Representative Sensor Fish data overlaid on a cross section of the Foster Dam turbine
region showing the approximate locations of selected major timing marks ............................... 3.4 3.3 Location of all Sensor Fish significant events by region following spillway weir passage ........ 3.7 3.4 Sensor Fish significant event occurrence by type following spillway weir passage ................... 3.7 3.5 Mean acceleration magnitude location for the most severe significant events experienced
by Sensor Fish during spillway fish weir passage ...................................................................... 3.8 3.6 Mean acceleration magnitude location for all significant events experienced by Sensor
Fish during spillway fish weir passage ....................................................................................... 3.8 3.7 Sensor Fish event magnitudes for the most severe event and cumulative events by
turbine operation ......................................................................................................................... 3.11 3.8 Nadir pressures observed during passage through Foster Dam turbine Unit 1 as measured
by Sensor Fish ............................................................................................................................. 3.11 3.9 Average pressure rate of change through Foster Dam turbine Unit 1 ......................................... 3.12 3.10 Live-fish mortality and malady estimates contrasted with Sensor Fish significant event
magnitudes for passage over the spillway fish weir .................................................................... 3.16 3.11 Live-fish mortality and malady estimates contrasted with Sensor Fish significant event
magnitudes through turbine Unit 1 ............................................................................................. 3.17 3.12 Live-fish mortality and malady estimates contrasted with the Sensor Fish turbulence
index for passage through turbine Unit 1 .................................................................................... 3.17 3.13 Live-fish mortality and malady estimates contrasted with the Sensor Fish pressure rate
of change during passage through turbine Unit 1 ....................................................................... 3.18 4.1 Spillway weir flow impacts the concrete chute prior to flowing into the stilling basin .............. 4.1 4.2 Spill over the weir at John Day Dam with Sensor Fish data superimposed ................................ 4.2 4.3 Comparison of spillways at John Day Dam and Foster Dam ..................................................... 4.3 4.4 Fish injection system pipe attachment at Foster Dam and juvenile and adult steelhead
being propelled out of the system during testing ........................................................................ 4.4 4.5 Flow over the spillway fish weir at Foster Dam during the high-forebay condition .................. 4.5 4.6 Sensor Fish in pieces following passage at the 9.0-MW, high-forebay condition ...................... 4.7 4.7 Data from cracked Sensor Fish stops at the runner ..................................................................... 4.7 4.8 A stress crack in the Sensor Fish polycarbonate body following passage through turbine
Unit 1 .......................................................................................................................................... 4.8 4.9 Probability of mortal injury from simulated turbine passage ...................................................... 4.9

Final Report
ix
4.10 Fit of a linear model between live-fish estimated 48-hr mortality and the percentage of Sensor Fish experiencing a significant event at Columbia and Snake River dams and Foster Dam .................................................................................................................................. 4.11
4.11 Turbine runner passage pressure rate of change by nadir pressure for Foster, John Day, Bonneville, and Ice Harbor dams ................................................................................................ 4.14
4.12 Probability of injury from simulation model and actual live-fish injury estimates ..................... 4.15
Tables
2.1 Turbine operation levels tested at Foster Dam in 2012 ............................................................... 2.4 3.1 Number of Sensor Fish releases by study treatment during the May 2012 fish weir
evaluation .................................................................................................................................... 3.1 3.2 Number of Sensor Fish releases by study treatment during the May 2012 turbine
evaluation at Foster Dam ............................................................................................................ 3.2 3.3 Location, frequency, and type of the most severe significant event observed for Sensor
Fish releases over the spillway weir............................................................................................ 3.6 3.4 Frequency of occurrence of all Sensor Fish significant events by event location and type
for Sensor Fish releases over the spillway weir .......................................................................... 3.6 3.5 Sensor Fish turbine releases showing type of most severe significant event observed .............. 3.10 3.6 Sensor Fish frequency of occurrence of multiple turbine runner events by type ........................ 3.10 3.7 Computed area under the curve for angular rate-of-change and acceleration magnitudes
per second ................................................................................................................................... 3.13 3.8 Mortality and malady rates of steelhead released over the spillway fish weir at Foster
Dam compared with hydraulic information obtained by Sensor Fish, May 2012 ...................... 3.14 3.9 Mortality and malady rates of steelhead released through Unit 1 turbine at Foster Dam
compared with hydraulic information obtained by Sensor Fish, May 2012 ............................... 3.15 4.1 Sensor Fish nadir pressures; estimated depth acclimation pressures at approach and
passage, ratio of acclimation to nadir, and natural log of the ratio for passage through turbine Unit 1 at Foster Dam, 2012 ............................................................................................. 4.10
4.2 Average live-fish mortality and percentage of Sensor Fish experiencing a significant event during Kaplan turbine passage at USACE hydropower projects....................................... 4.11
4.3 Pressure nadirs observed in Sensor Fish data during turbine passage at USACE hydropower projects .................................................................................................................... 4.12
4.4 Pressure rates of change observed from Sensor Fish turbine passage at USACE hydropower projects .................................................................................................................... 4.13
4.5 Probability of strike and injury for fish passing through Foster Dam turbine Unit 1 ................. 4.15

Final Report
1.1
1.0 Introduction
The Willamette River and its tributaries provide essential habitat for salmon and trout species. The development of hydropower dams in the upper basin tributaries has impacted conditions throughout the river system, altering the stream ecology and fish survival.
This evaluation provides information to the U.S. Army Corps of Engineers (USACE), Bonneville Power Administration, and the U.S. Department of Reclamation (the Willamette Valley project action agencies) that can be used to implement Reasonable and Prudent Alternatives (RPAs) 4.3 “Willamette Fish Operations Plan,” 4.8 “Interim Downstream Fish Passage,” 4.11 “Assess downstream juvenile fish passage through dams,” 4.13 “Willamette configuration and operations plan,” and 9.3 “Fish passage RM&E” under the National Marine Fisheries Service 2008 Biological Opinion. RPAs are measures designed to minimize adverse effects of dams, reservoirs, and other reservoir projects on Endangered Species Act-listed species and their critical habitat. Monitoring and reporting are required as part of the Biological Opinion to ensure compliance.
This report documents investigations of downstream fish passage research involving a spillway fish weir and turbine passage conditions at Foster Dam in May 2012. The studies were conducted by Pacific Northwest National Laboratory (PNNL) for the U.S. Army Corps of Engineers (USACE), Portland District, and performed concurrently with HI-Z balloon-tag studies of passage survival for juvenile and adult steelhead conducted by Normandeau Associates, Inc. (Normandeau).
1.1 Objectives
The objectives of this study were to
• Characterize the passage exposure conditions through the spillway fish weir at Foster Dam at two forebay pool elevations (616 and 634 ft mean sea level [MSL]).
• Describe and compare the passage exposure conditions through a turbine unit at Foster Dam under three operations at two pool elevations (616 ft MSL and 634 ft MSL).
• Collaborate with Normandeau staff on a Sensor Fish and live test fish comparison for the study.
1.2 Report Overview
Chapter 2 describes the study site, the Sensor Fish device, and the data collection and analysis procedures used in the research. Chapter 3 presents the results of the study, followed by a discussion in Chapter 4. Conclusions are offered in Chapter 5, followed by Chapter 6, the sources cited in this report.
The compact disc included in the pocket on the inside back cover of printed copies of this report contains supplementary details and data in four appendices. Appendix A contains field log data that provide dam operating conditions, release elevations, and deployment and recovery times for each Sensor Fish release. Appendix B provides summary data tables for each Sensor Fish release. Dam operating conditions, exposure event descriptions, pressures at injection, and rates of change in pressure are included in the data tables. Appendices C and D present graphics showing pressure, acceleration magnitude, and change of magnitude time histories for each Sensor Fish release.

Final Report
2.1
2.0 Methods
2.1 Study Site
Foster Dam is located at river mile 38.5 on the South Santiam River in Linn County, Oregon (Figure 2.1). It is a storage dam used for flood control, power generation, irrigation, navigation, and recreation. The dam, a rock-fill embankment approximately 126 ft tall and 4,600 ft long, has four radial tainter spillway gates and a powerhouse containing two Kaplan turbine units. The turbines have a hydraulic capacity of 3,200 cubic feet per second (cfs) and a total capacity of 20 megawatts (MW). Full pool is 641.0 ft MSL; minimum pool is 613.0 ft MSL.
Figure 2.1. Foster Dam, Oregon.
There are separate intakes for each of the turbine units; each has a 13.5-ft-diameter penstock located
at a centerline elevation of 590 ft MSL, progressing approximately 215 ft to its terminus at a centerline elevation of 516 ft MSL. Each Allis-Chalmers Kaplan turbine is a 13,800-horsepower unit, operating at 257 revolutions per minute (rpm) with a maximum discharge of approximately 1,350 cfs. The runner diameter is approximately 100 in., and runner opening height is 42.5 in.; velocity at the periphery of the runner is approximately 224 feet per second (fps). Each turbine unit has 6 blades and 20 wicket gates.
The spillway crest is at elevation 596.8 ft MSL (Figure 2.2).

Final Report
2.2
Figure 2.2. Foster Dam spillway.
2.2 Sensor Fish Device
The Sensor Fish housing is constructed of clear polycarbonate plastic (Figure 2.3). It is 24.5 mm in diameter and 90 mm long and weighs approximately 43 grams. The Sensor Fish is nearly neutrally buoyant in fresh water. The device measures the three components of linear acceleration, the three components of angular velocity (these together comprise the six degrees of freedom [DOF]), absolute pressure, and temperature, at a sampling frequency of 2,000 Hz per sensor channel over a recording time of about 4 min.
Figure 2.3. Six-degree-of-freedom Sensor Fish device.
The Sensor Fish consists of modules that charge its internal battery, program the sensor settings,
acquire data, and convert from analog signal to digital form. The acquired data are stored in an internal memory card and transferred to computers via a wireless infrared link using an external infrared link
Final Report
2.3
modem. Sensor Fish are deployed, acquiring data in response to hydraulic conditions and interaction with structure; units are retrieved; and the data are downloaded, analyzed, and interpreted.
Retrieval of the Sensor Fish is aided by the attachment of a micro-radio transmitter (Advanced Telemetry Systems, Isanti, Minnesota) and HI-Z balloon tags (Normandeau Associates, Inc., Bedford, New Hampshire), which are identical to those used for live test fish (Heisey et al. 1992). HI-Z tags contain a water-soluble capsule filled with a chemical that produces gas when activated with water, a process that takes approximately 3 min following initiation. The balloons inflate sufficiently to bring the Sensor Fish to the surface for recovery, and a directional radio receiver antenna used by boaters in the tailrace homes in on the radio transmitter attached to the Sensor Fish.
2.3 Procedures
Sensor Fish releases were interspersed with releases of HI-Z balloon-tagged live fish through the same release pipes in concurrent studies conducted by Normandeau Associates. Study plans called for 1 Sensor Fish release for every 10 live juvenile fish treatment releases, when feasible.
2.3.1 Spillway Fish Weir Evaluation
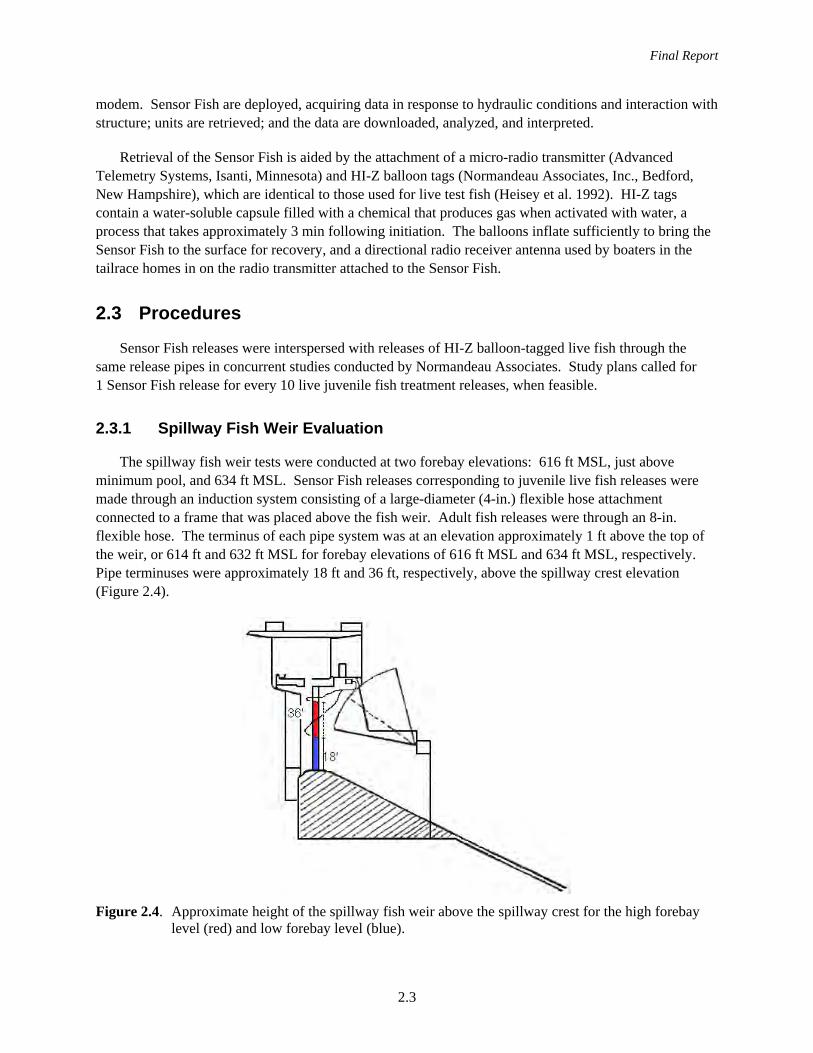
The spillway fish weir tests were conducted at two forebay elevations: 616 ft MSL, just above minimum pool, and 634 ft MSL. Sensor Fish releases corresponding to juvenile live fish releases were made through an induction system consisting of a large-diameter (4-in.) flexible hose attachment connected to a frame that was placed above the fish weir. Adult fish releases were through an 8-in. flexible hose. The terminus of each pipe system was at an elevation approximately 1 ft above the top of the weir, or 614 ft and 632 ft MSL for forebay elevations of 616 ft MSL and 634 ft MSL, respectively. Pipe terminuses were approximately 18 ft and 36 ft, respectively, above the spillway crest elevation (Figure 2.4).
Figure 2.4. Approximate height of the spillway fish weir above the spillway crest for the high forebay level (red) and low forebay level (blue).

Final Report
2.4
2.3.2 Turbine Passage Evaluation
Four turbine operations at turbine Unit 1 were tested at the low-forebay elevation and three operations were tested at the high-forebay elevation (Table 2.1). Sensor Fish releases were made through an induction system similar to that used for the spillway fish weir passage evaluation. Flexible hosing (4 in. in diameter) connected the head of a steel pipe to the juncture of the modified head tank where live fish and Sensor Fish were introduced into the induction system. The frame was attached to the penstock bulkhead slot, and the terminus of the pipe system was at an elevation of approximately 593 ft MSL, slightly higher than the penstock centerline elevation (590 ft MSL). Exit from the pipe terminus occurred into flows of approximately 5 fps, providing guidance into the penstock.
Table 2.1. Turbine operation levels tested at Foster Dam in 2012.
Forebay Elevation (ft MSL)
Unit Output (MW)
Flow (cfs)
616
2.8/3.0 550
4.9/5.0 800
6.0 970
7.0 1150
634
4.9/5.0 650
6.5 820
9.0 1150
2.4 Data Analysis
Sensor Fish data sets consist of time histories of angular motion (pitch, roll, and yaw), pressure, acceleration (x, y, and z axes), temperature, and battery status extending from the time of release through the period of data acquisition programmed into the Sensor Fish (Deng et al. 2007a). Data time histories contain a data point for each transducer every 0.0005 s. This time interval between digital samples corresponds to a 2,000-Hz sampling rate for each of the analog outputs from Sensor Fish acceleration, rotation, and pressure sensors. Sampling of all analog data streams occurs nearly simultaneously within each sampling interval.
Water depth in feet is estimated, when appropriate, from absolute pressure at various points along each Sensor Fish route by subtracting atmospheric pressure, determined at the time of the release of each Sensor Fish, and dividing the resulting gage pressure by 0.4335, the pressure in pounds per square inch of 12 in. of fresh (distilled) water at 39.2°F (4°C). The raw output of the triaxial accelerometers is processed to detect and quantify Sensor Fish response to turbulence, contact with structure (strike or collision), and shear. Triaxial angle rate-of-change data are processed similarly to triaxial acceleration data to provide further information about the response of the Sensor Fish to flow conditions and another measure of quality of flow.
Analysis of the raw data from the Sensor Fish begins with preparation of plots showing absolute pressure, triaxial acceleration, and triaxial rotation. These records are visually inspected to identify

Final Report
2.5
prospective collision, strike, and shear events and to obtain a general overview of the passage conditions present for each test treatment. Changes in pressure during passage include features consistently present that result from the design of passageway structures and the dynamics of water flow through the passageway. These features in the pressure time history permit acceleration and rotation data to be divided into segments corresponding to specific locations (zones) that extend from Sensor Fish injection to exit from the stilling basin. Each region is identified by characteristic features in the Sensor Fish pressure time history and characteristics in triaxial acceleration and rotation data. For each Sensor Fish data set, events of interest, such as rapid pressure changes, collisions, strikes, shear, and severe turbulence, are identified and quantified. Quantification of events includes the time of occurrence, location by zone, and extraction of information describing severity as well as additional information to separate collisions and strikes from shear exposure.
Final Report
3.1
3.0 Results
Detailed data on which this chapter is based are provided in the appendices. Appendix A contains study data that include the release and recovery times for each Sensor Fish, discharge and other information describing the operation of the passage route for each Sensor Fish release, and other project information for passage over the spillway fish weir and through the penstock and turbine. Appendix B contains tables of observed maximum acceleration magnitudes, pressure rates of change, and turbine pressure nadirs for Sensor Fish releases, as well as dam operations data for the respective studies. Graphs with plots of pressure and acceleration magnitude for each successful Sensor Fish release are located in Appendix C; those of pressure and angular rate-of-change magnitude are in Appendix D.
3.1 Treatment Release Data
Data were acquired from Sensor Fish following passage over the spillway fish weir and through turbine Unit 1 at Foster Dam. Release and recovery information for each route follows.
3.1.1 Spillway Fish Weir Evaluation
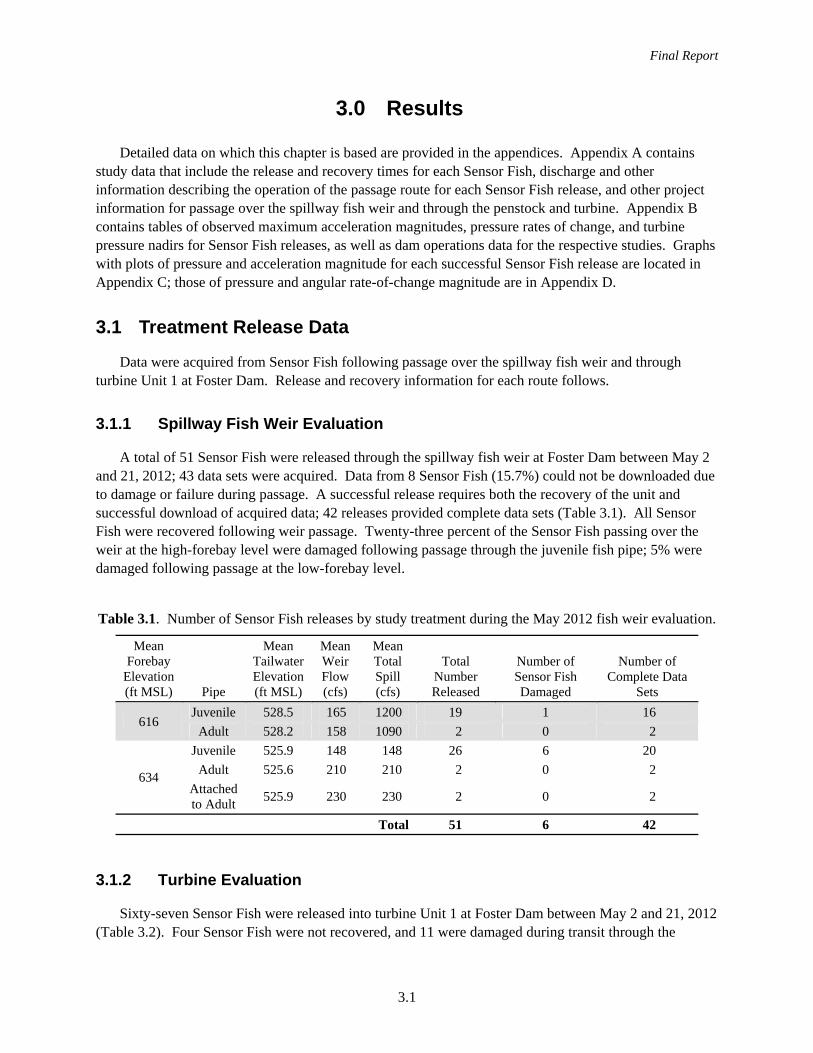
A total of 51 Sensor Fish were released through the spillway fish weir at Foster Dam between May 2 and 21, 2012; 43 data sets were acquired. Data from 8 Sensor Fish (15.7%) could not be downloaded due to damage or failure during passage. A successful release requires both the recovery of the unit and successful download of acquired data; 42 releases provided complete data sets (Table 3.1). All Sensor Fish were recovered following weir passage. Twenty-three percent of the Sensor Fish passing over the weir at the high-forebay level were damaged following passage through the juvenile fish pipe; 5% were damaged following passage at the low-forebay level.
Table 3.1. Number of Sensor Fish releases by study treatment during the May 2012 fish weir evaluation.
Mean Forebay
Elevation (ft MSL) Pipe
Mean Tailwater Elevation (ft MSL)
Mean Weir Flow (cfs)
Mean Total Spill (cfs)
Total Number Released
Number of Sensor Fish Damaged
Number of Complete Data
Sets
616 Juvenile 528.5 165 1200 19 1 16
Adult 528.2 158 1090 2 0 2
634
Juvenile 525.9 148 148 26 6 20
Adult 525.6 210 210 2 0 2
Attached to Adult
525.9 230 230 2 0 2
Total 51 6 42
3.1.2 Turbine Evaluation
Sixty-seven Sensor Fish were released into turbine Unit 1 at Foster Dam between May 2 and 21, 2012 (Table 3.2). Four Sensor Fish were not recovered, and 11 were damaged during transit through the

Final Report
3.2
turbine. Due to the high failure/damage rate, an earlier version of Sensor Fish that measure only pressure and x-y-z acceleration (3 DOF) rather than the 6-DOF model were used for data collection at the higher 634-ft MSL forebay elevation (approximately 75% were the older-style units). These units sample the data at a lower collection rate (200 sample points vs. 2,000 sample points per second for the 6-DOF model). The data from the older units were comparable to those from the 6-DOF units; however, there is a possibility that data are truncated due to the slower sampling rate and because the nadir value and/or a significant event occurrence were not recorded.
Table 3.2. Number of Sensor Fish releases by study treatment during the May 2012 turbine evaluation at Foster Dam.
Mean Forebay
Elevation (ft MSL)
Mean Tailwater Elevation (ft MSL)
Unit Output (MW)
Mean Turbine
Flow (cfs)
Total Number Released
Number of Sensor Fish
Damaged/Lost
Number of Complete Data Sets
Sensor Fish with Runner
Data
616
529.3 2.8/3.0 550 7 0 6 6
529.7 4.9/50 800 13 4 9 10
529.7 6.0 970 10 4 6 6
530.1 7.0 1,150 9 4 5 5
634
526.1 4.9/5.0 650 8 0 8 8
526.2 6.5 820 11 2 8 8
526.5 9.0 1,150 9 1 8 8
Total 67 15 50 51
3.2 Data Analysis
Sensor Fish data analysis included computing the absolute and gage pressures and the acceleration and rotational magnitudes, then reviewing their time histories. Collision, strike, and/or shear events appear as high-amplitude impulses in acceleration magnitude time histories. To qualify as a significant event, a high-amplitude acceleration impulse must have a peak value equal to or greater than 95 g. Significant events frequently also show concurrent high-amplitude pressure and rotation magnitude values, which aid in identifying the location of the event in time and space and in distinguishing collisions and strike events from shear events.
The location of a significant event is determined by the location of the impulse relative to distinctive consistent features observed in the pressure time histories.
3.2.1 Spillway Fish Weir Passage
Timing marks used to locate significant events and identify regions of spillway fish weir passage include
1. passage through the injection system piping
2. exit from the injection system pipe into the air (free fall)

Final Report
3.3
3. impact with the spillway chute
4. passage along the spillway concrete chute
5. transition into the stilling basin/tailrace.
Examples of pressure timing marks used for the spillway fish weir study are shown in Figure 3.1.
Figure 3.1. Representative Sensor Fish data overlaid on a cross section of the Foster Dam spillway weir showing the approximate locations of selected major timing marks. The blue line is pressure; the red line is acceleration vector magnitude in g.
3.2.2 Penstock/Turbine Passage
Timing marks used to locate significant events and identify regions of penstock/turbine passage include
1. passage through the penstock
2. passage through the wicket gate region
3. passage through the runner
4. nadir value during passage through the runner
5. passage through the turbine draft tube
6. passage to the tailrace.
Examples of pressure timing marks used for the turbine study are shown in Figure 3.2.

Final Report
3.4
Figure 3.2. Representative Sensor Fish data overlaid on a cross section of the Foster Dam turbine region showing the approximate locations of selected major timing marks. The blue line is pressure; the red line is acceleration vector magnitude in g.
Pressure rises as the Sensor Fish passes down the induction pipe to the point of injection into the
penstock, gradually increasing as the sensor is carried with penstock flow through decreasing elevation of the penstock. As the Sensor Fish passes through the turbine runner, there is a rapid decrease in pressure. Pressure reaches its lowest point, its nadir, during transit of the suction side of the turbine runner. Following passage through the turbine runner, the Sensor Fish is carried with flow through the turbine draft tube and into the powerhouse tailrace.
3.3 Collision, Strike, and Shear Events
A significant event is defined as an impulse in acceleration magnitude greater than or equal to 95 g. Significant events are caused by strike, collision with dam structure, or exposure to shear. All Sensor Fish experienced at least one significant event during spillway fish weir passage, and 62% experienced at least one significant event during turbine passage.

Final Report
3.5
3.3.1 Spillway Fish Weir Passage
Nearly 81% of the Sensor Fish experienced more than one significant event during passage over the spillway weir. Significant events were observed at the impact zone of the concrete chute, on the chute as the unit moved down the spillway, at the terminus of the chute as it plunged into the stilling basin, and in the stilling basin/tailrace.
Table 3.3 shows the number of analyzed Sensor Fish data sets by release location and type of the most severe significant event. The greatest severe events were observed as collisions on the spillway chute. At the low-forebay elevation, all of the most severe events were collisions on the chute, while at the high-forebay elevation, 83% of the most severe events were collisions on the chute and the remaining events were shear.
Table 3.4 summarizes the total number of significant collision and shear events by significant event type and location. Multiple events were most frequent for Sensor Fish passing through the juvenile pipe over the spillway weir at the low-forebay elevation, averaging 5.5 events per Sensor Fish release; the fewest events were observed following passage through the adult pipe at the same low-forebay elevation, averaging approximately 2.5 events per release.
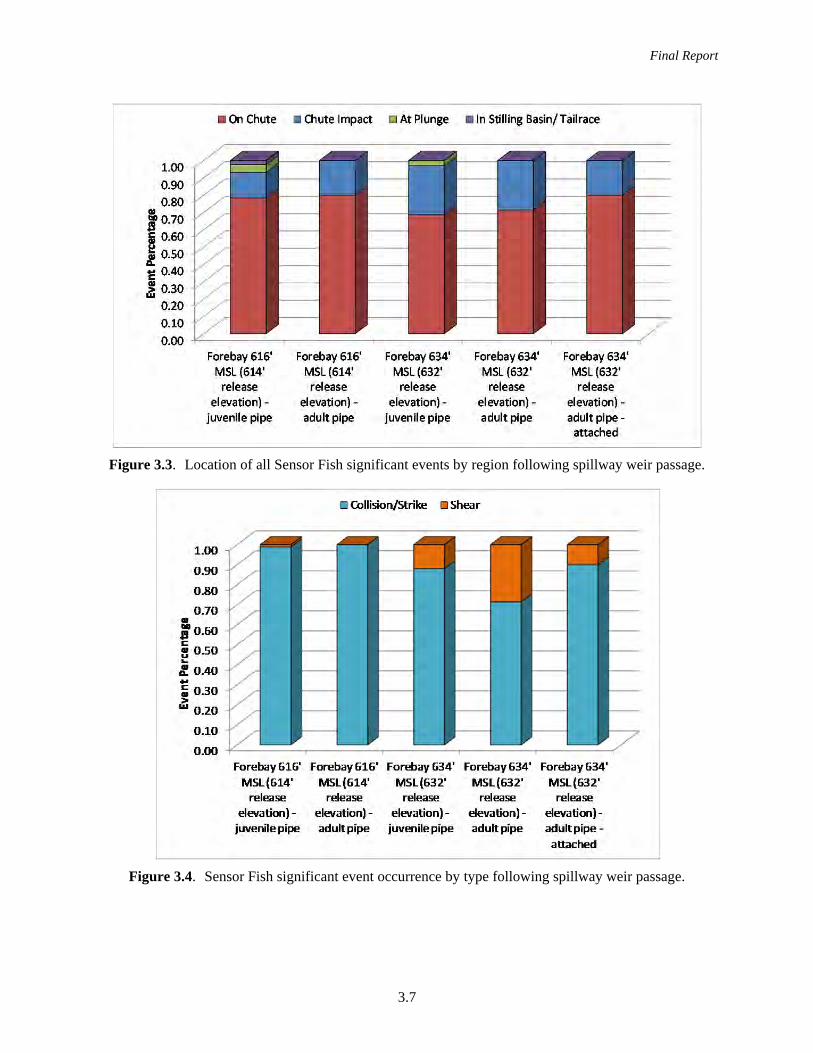
Significant events were observed most frequently on the spillway chute (Figure 3.3); all Sensor Fish experienced at least one collision or shear event at that location or at impact with the chute, regardless of forebay elevation or release pipe used. Sensor Fish passing over the spillway weir at the low-forebay level experienced a greater percentage of events on the chute, presumably due to a more shallow flow depth on the chute. Sensor Fish were more likely to experience shear when passing over the weir at the high-forebay level (Figure 3.4).
Subsequent to passing through the juvenile passage pipe, Sensor Fish passing over the spillway fish weir at the low elevation had the highest mean significant event magnitude (157.6 g); lowest was 136.5 g following passage over the weir through the adult pipe. Comparing multiple event values, the differences are small, ranging from approximately 123 g following passage through the adult pipe at the high elevation to 132.6 g following passage through the juvenile pipe at the lower elevation. The one exceptional difference (173.9 g) occurred for passage through the adult pipe at the low elevation.
The mean acceleration magnitude values for the most severe event per release by event location are shown in Figure 3.5. The highest mean magnitude was observed upon impact with the spillway chute during Sensor Fish passage through the juvenile pipe at the lower weir elevation; passage through the adult pipe at the same elevation also resulted in a high magnitude event. Significant events on the chute were frequent due to depth of flow and the resultant distance from structure, as well as the lengthier exposure times experienced during transit. The mean acceleration magnitude values for all Sensor Fish significant events by event location are shown in Figure 3.6.
Events observed at the plunge and in the stilling basin/tailrace were the minority. Significant events in these regions were observed only for passage through the smaller juvenile release pipe, at both forebay levels. Mean magnitudes were higher for the high-forebay treatment (144.75 g) than for the low-forebay treatment (122.01 g).

3.6
Final R
eport
Table 3.3. Location, frequency, and type of the most severe significant event observed for Sensor Fish releases over the spillway weir.
Forebay (ft MSL) Pipe
Number of Data
Sets
Frequency of Occurrence of the Most Severe Strike Events by Location
Frequency of Occurrence of the Most Severe Shear Events by Location
Frequency of Occurrence of the Most Severe Events by Location
Chute Impact
On Chute
At Plunge
In Stilling Basin/
Tailrace Chute Impact
On Chute
At Plunge
In Stilling Basin/
Tailrace Chute Impact
On Chute
At Plunge
In Stilling Basin/
Tailrace
616 juvenile 16 8 8 0 0 0 0 0 0 8 8 0 0
adult 2 1 1 0 0 0 0 0 0 1 1 0 0
634
juvenile 20 7 10 1 0 2 0 0 0 9 10 1 0
adult 2 0 0 0 0 2 0 0 0 2 0 0 0
attached 2 0 2 0 0 0 0 0 0 0 2 0 0
Table 3.4. Frequency of occurrence of all Sensor Fish significant events by event location and type for Sensor Fish releases over the spillway weir.
Forebay (ft MSL) Pipe
Number of Data Sets
Single Event
>1 event
Total No. of Events
Avg. No. of Events
Event Location
Event Location and Type
Chute Impact On Chute At Plunge In Stilling
Basin/Tailrace
Chute Impact
On Chute
At Plunge
In Stilling Basin/
Tailrace Strike Shear Strike Shear Strike Shear Strike Shear
616 juvenile 16 1 15 88 5.50 13 69 4 2 12 1 69 0 4 0 2 0
adult 2 1 1 5 2.50 1 4 0 0 1 0 4 0 0 0 0 0
634
juvenile 20 5 15 67 3.35 19 46 2 0 11 8 46 0 2 0 0 0
adult 2 0 2 7 3.50 2 5 0 0 0 2 5 0 0 0 0 0
attached 2 0 2 10 5.00 2 8 0 0 1 1 8 0 0 0 0 0
Final Report
3.7
Figure 3.3. Location of all Sensor Fish significant events by region following spillway weir passage.
Figure 3.4. Sensor Fish significant event occurrence by type following spillway weir passage.

Final Report
3.8
Figure 3.5. Mean acceleration magnitude location for the most severe significant events experienced by Sensor Fish during spillway fish weir passage. Error bars represent standard error of the mean.
Figure 3.6. Mean acceleration magnitude location for all significant events experienced by Sensor Fish during spillway fish weir passage. Error bars represent standard error of the mean.
0
50
100
150
200
250
Chute Impact Chute Plunge Tailrace
Mea
n Ev
ent M
agni
tude
(g)
FB 616' MSL: Adult Pipe - FB 616' FB 634' MSL: Adult Pipe - FB 634' Attached - FB 634'
0
20
40
60
80
100
120
140
160
180
200
220
Chute Impact Chute Plunge Tailrace
Mea
n Ev
ent M
agni
tude
(g)
FB 616' MSL: Adult Pipe - FB 616' FB 634' MSL: Adult Pipe - FB 634' Attached - FB 634'

Final Report
3.9
3.3.2 Turbine Passage
Sixty-two percent of Sensor Fish passing through turbine Unit 1 experienced at least one significant event; 24% experienced multiple events. No events were observed in the penstock. More than 22% of the Sensor Fish were damaged or lost during passage through the turbine.
Table 3.5 shows the number of successful Sensor Fish releases and the type and location of the most severe significant event. The majority of the most severe events occurred in the wicket gate–runner region of the turbine; one event occurred in the draft tube. All the events were classified as collisions following turbine passage at the low-forebay level, and 72% were collisions following passage at the high-forebay level; shear was observed in the runner region only.
Multiple events per Sensor Fish run occurred more frequently during passage at the higher forebay level. The total number of events experienced during turbine passage is summarized in Table 3.6. Nearly all events occurred in the wicket gate–runner region, along with one in the draft tube. The majority of events observed at the high-forebay level occurred in the runner region. Most events occurred in the wicket gate region during Sensor Fish passage at the low-forebay treatment at operational outputs of 6.0 MW and less. Shear events occurred in the runner region only, increasing in frequency with the higher forebay treatment.
The significant event magnitude values for the most severe event experienced by Sensor Fish during passage through turbine Unit 1 were greatest at the low-forebay level–4.9/5.0-MW operation, averaging 152.8 g. Magnitudes were the least, at 128.9 g, for the same operating level but at the high-forebay level. Comparing these values to those from multiple events per condition, the greatest mean acceleration magnitude occurred during Sensor Fish passage at the 2.8/3.0-MW operation (144.8 g) (Figure 3.7). Average multiple event magnitude decreased with turbine operating level at the low-forebay treatment and increased with turbine operating level at the high-forebay treatment.
A rapid pressure decrease occurs during passage through the turbine runner region as the sensor is carried with flow from the pressure to suction sides of the turbine runner. The lowest pressure (nadir) observed during turbine passage occurs as flow passes under the runner blade prior to draft tube entry. The lowest nadir occurred during the high-forebay treatment (634-ft forebay level), when the turbine was operating at 9.0 MW, averaging 14.68 psia. Average nadir was highest (20.59 psia) during low operation (2.8/3.0 MW) at the low-forebay treatment (Figure 3.8).
Pressure rate of change differences among turbine operation treatments were generally associated with turbine flow; that is, the greater the discharge, the higher the observed pressure rate of change. In addition, the forebay levels contributed to higher pressures due to water depth, which usually translated to higher pressure rates of change (Figure 3.9). Sensor Fish data for the deeper passage at the highest operation did not represent the greatest rate of change as expected; which was unexpected. However, the slower data acquisition rate of 200 samples per second for the 3-DOF Sensor Fish may have contributed to this anomaly.

Final R
eport
3.10
Table 3.5. Sensor Fish turbine releases showing type of most severe significant event observed. All events occurred in the turbine runner region.
Turbine Output
Number of Releases
Number of Releases with Data
Number of Sensor Fish Having at Least 1 Event
|a| > 95 g
Frequency of Occurrence of the Most Severe Event by Type Location of the Most Severe Event
Shear Collision/Strike Wicket Gate Runner Draft Tube
616 ft MSL
2.8/3.0 MW 7 6 3 0 1.0 2 (66.7%) 1 (33.3%) 0
4.9/5.0 MW 13 9 4 0 1.0 3 (60%) 2 (40%) 0
6.0 MW 10 6 4 0 1.0 3 (75%) 1 (25%) 0
7.0 MW 9 5 2 0 1.0 1 (50%) 1 (50%) 0
634 ft MSL
4.9/5.0 MW 8 8 8 0.25 0.75 1 (12.5%) 6 (75%) 1 (12.5%)
6.5 MW 11 8 3 1.0 0 3 (100%) 0
9.0 MW 9 8 7 0.43 0.57 1 (14.3%) 6 (85.7%) 0
Table 3.6. Sensor Fish frequency of occurrence of multiple turbine runner events by type.
Turbine Output
Number of Data
Sets No
Event Single Event
>1 Event
Total Number
of Events
Average Number of Events per Condition
Event Type Event Location
Collision/ Strike Shear
Wicket Gate Runner Draft Tube
616 ft MSL
2.8/3.0 MW 6 3 3 0 3 0.50 3 (100%) 0 2 (66.7%) 1 (33.3%) 0
4.9/5.0 MW 9 5 2 2 8 0.89 7 (87.5%) 1 (12.5%) 4 (50%) 4 (50%) 0
6.0 MW 6 2 4 0 4 0.67 4 (100%) 0 3 (75%) 1 (25%) 0
7.0 MW 5 3 1 1 3 0.60 3 (100%) 0 1 (33.3%) 2 (66.7%) 0
634 ft MSL
4.9/5.0 MW 8 0 5 3 12 1.50 9 (75%) 3 (25%) 3 (25%) 8 (66.7%) 1 (8.3%)
6.5 MW 8 5 1 2 5 0.63 4 (80%) 1 (20%) 0 5 (100%) 0
9.0 MW 8 1 4 3 11 1.38 8 (72.7%) 3 (27.3%) 2 (18.2%) 9 (81.8%) 0

Final Report
3.11
Figure 3.7. Sensor Fish event magnitudes for the most severe event and cumulative events by turbine operation. Error bars represent standard error of the mean.
Figure 3.8. Nadir pressures observed during passage through Foster Dam turbine Unit 1 as measured by Sensor Fish.
95
105
115
125
135
145
155
165
175
185
195
2.8/3.0 MW 4.9/5.0 MW 6.0 MW 7.0 MW 4.9/5.0 MW 6.5 MW 9.0 MW
Mea
n Ev
ent M
agni
tude
(g)
Turbine Unit 1 Operating Level
Severe Event Magnitude All Events Magnitude
10
12
14
16
18
20
22
24
Pres
sure
Nad
ir (p
sia)
2.8/3.0 MW 4.9/5.0 MW 6.0 MW 7.0 MW 4.9/5.0 MW
6.5 MW 9.0 MW 2.8/3.0 MW Average 4.9/5.0 MW Average 6.0 MW Average
7.0 MW Average 4.9/5.0 MW Average 6.5 MW Average 9.0 MW Average
616 ft MSL 634 ft MSL

Final Report
3.12
Figure 3.9. Average pressure rate of change through Foster Dam turbine Unit 1. Error bars represent standard error of the mean.
3.4 Turbulence Index
The turbulence index as it is used here is a subjective measure developed by computing the area (integrating) under the acceleration magnitude and angular rate-of-change magnitude curves for a given period, with the premise that larger area equates to greater turbulence. A 7-s period following spillway weir passage was used, and 10 s (5 s prior to the runner nadir and 5 subsequent seconds) was applied for turbine passage. Each time segment encompasses the most turbulent passage interval for all passage treatments. Computed areas were normalized to seconds for evaluation purposes.
The turbulence index values for passage over the spillway fish weir and the associated tumbling down the spillway chute were highest. Turbulence index values were lower during turbine runner passage; highest values were recorded at the low-forebay level at the 2.8/3.0-MW treatment, followed by the high-forebay low- and high-MW treatments (Table 3.7). Limited available data for Sensor Fish with angular rate of change capability in the high-forebay turbine may be distorting the results, as only one or two data sets were produced. Turbulence index for the lowest turbine operation was highest, indicating the lower flows through the unit were less uniform.
-700.00
-600.00
-500.00
-400.00
-300.00
-200.00
-100.00
0.00
Pres
sure
Rat
e of
Cha
nge
(psia
/s)
2.8/3.0 MW- Low 4.9/5.0 MW - Low 6.0 MW - Low 7.0 MW - Low 4.9/5.0 MW - High 6.5 MW - High 9.0 MW - High

Final Report
3.13
Table 3.7. Computed area under the curve for angular rate-of-change and acceleration magnitudes per second (turbulence index).
Passage Route and Condition
Area – Acceleration Magnitude per Second
Area – Angular Rate-of-Change Magnitude
per Second Combined Area
per Second
Spillway Fish Weir – Low Forebay Juvenile Pipe 2.2 781 783
Adult Pipe 2.0 664 666
Spillway Fish Weir – High Forebay Juvenile Pipe 2.3 756 758
Adult Pipe 2.6 780 783
Turbine Unit 1 – Low Forebay
2.8/3.0 MW 2.9 491 494
4.9/5.0 MW 2.0 337 339
6.0 MW 2.0 349 351
7.0 MW 2.0 352 354
Turbine Unit 1 – High Forebay
4.9/5.0 MW 6.8 411 418
6.5 MW 2.9 373 376
9.0 MW 4.1 413 417
3.5 Comparison of Sensor Fish and Live-Fish Data
Live-fish HI-Z–tag studies were conducted by Normandeau concurrent with the Sensor Fish studies at Foster Dam. Normandeau scientists released live fish through the same injection systems as the Sensor Fish, under the same test conditions. In most cases, Sensor Fish releases were interspersed with live-fish releases.
A total of 442 juvenile and 104 adult steelhead and 51 Sensor Fish were released over the spillway fish weir at two forebay elevations at Foster Dam. Table 3.8 shows fish release and recapture rates, estimated survival rate, and malady-free rate for live fish (Normandeau 2013). A total of 1,238 juvenile steelhead and 67 Sensor Fish were released into turbine Unit 1 at all operational levels (Table 3.9).
For comparison with Sensor Fish magnitudes, the reciprocal of the malady-free rate is reported as the injury or malady rate; the reciprocal of survival is reported as mortality.
Figure 3.10 shows live-fish malady and mortality rates along with the Sensor Fish average significant event magnitudes for spillway fish weir passage. Flow over the weir was thin, providing no cushioning effect at impact and during chute passage for the Sensor Fish. As a result, most exhibited a substantial significant event upon colliding with the concrete, along with additional events during the path down the chute.

3.14
Final R
eport
Table 3.8. Mortality and malady rates of steelhead released over the spillway fish weir at Foster Dam compared with hydraulic information obtained by Sensor Fish, May 2012.
Target Elevation (ft)
Elevation 614 Elevation 632
Juvenile Adult Juvenile Adult
Mortality
Sample size 193 55 249 49
Mortality rate (48 h) 0.005 0.000 0.056 0.225
SE 0.005 0.000 0.015 0.057
Malady
Sample size(a) 193 55 248 49
Malady rate (48 h) 0.063 0.016 0.181 0.400
SE 0.014 0.110 0.025 0.101
Sensor Fish
Sample size 16 2 20 4
Severe event magnitude 157.6 178.0 147.0 144.1
SE 7.95 52.45 5.99 6.16
All events magnitude 128.5 173.9 132.6 123.5
SE 3.01 18.52 3.33 4.13
% with significant event 1.0 1.0 1.0 1.0
Turbulence index 783 666 758 783
SE 29.7 67.3 23.6 17.7
(a) Based on only recaptured fish.

3.15
Final R
eport
Table 3.9. Mortality and malady rates of steelhead released through Unit 1 turbine at Foster Dam compared with hydraulic information obtained by Sensor Fish, May 2012.
Unit Output
Elevation 614 Elevation 632
2.8/3.0 MW 4.9/5.0 MW 6.0 MW 7.0 MW 4.9/5.0 MW 6.5 MW 9.0 MW
Live Fish
Mortality
Sample size 100 196 150 185 209 200 198
Mortality rate (48 hr) 0.210 0.184 0.260 0.146 0.118 0.241 0.207
SE 0.041 0.028 0.036 0.026 0.023 0.030 0.029
Malady
Sample size(a) 92 189 137 182 202 195 193
Malady rate (48 hr) 0.228 0.254 0.285 0.181 0.193 0.261 0.207
SE 0.044 0.032 0.039 0.029 0.028 0.032 0.029
Sensor Fish
Sample size 6 9 6 5 8 8 8
Severe event magnitude 144.8 152.8 132.2 132.6 128.9 142.8 140.1
SE 0.167 30.99 16.5 12.35 9.25 18.49 10.91
All events magnitude 144.8 137.15 132.2 124.5 125.6 126.6 137.0
SE 0.167 17.48 16.5 10.75 6.52 14.31 8.07
% with significant event 0.50 0.44 0.67 0.40 1.0 0.38 0.88
Turbulence index 494 339 351 354 418 376 417
SE 43.8 42.4 22.4 14.3 11.8 NA 137.2
Pressure rate of change -412.2 -543.7 -578.5 -579.2 -567.8 -599.6 -575.2
SE 28.2 24.12 25.7 30.9 53.2 41.5 27.8
(a) Based on only recaptured fish. NA = Not applicable.

Final Report
3.16
Figure 3.10. Live-fish mortality and malady estimates contrasted with Sensor Fish significant event magnitudes for passage over the spillway fish weir. Error bars represent standard error of the mean.
Sensor Fish were attached directly to two individual adult steelhead. Multiple significant events were
recorded during passage, all of which occurred on the spillway chute. Readings from one Sensor Fish (No. 214) showed events at impact and during transit down the chute, while the readings from the other Sensor Fish (No. 250) indicated an event at impact and immediately afterward, but none during passage down the spillway chute. The steelhead with Sensor Fish No. 214 attached had a bruise at recapture, and that with No. 250 attached had scrapes on the head near the eye; both were fine after 48 hr.
Figure 3.11 shows live-fish malady and mortality rates along with the Sensor Fish average significant event magnitudes (± standard error of the mean) for passage through turbine Unit 1. The severe event magnitude generally trends with the malady estimate, and the 48-hr mortality estimate trends with the multiple events average magnitudes, with the exception of the 6.5-MW treatment, regardless of forebay level. The explanation for the higher injury and mortality rates during this turbine operation is not obvious and may be the result of the interaction of several conditions.
Sensor Fish passage through turbine Unit 1 at the 6.0-MW operation, low-forebay treatment were more likely to experience a significant event—80% compared with less than 50% for the other low-forebay operations tested. However, at the high-forebay treatment, the opposite was observed (fewer events were experienced at the 6.5-MW operation), although more Sensor Fish were lost or damaged.
Turbulence index values from the Sensor Fish indicate the passage route through the turbine at the 6.5-MW operations was actually less turbulent than the other operational conditions at the high-forebay treatment; the 6.0-MW operation was essentially the same as the other operational conditions for all but the 2.8/3.0-MW operations at the low-forebay level, which exhibited the highest turbulence for turbine passage (Figure 3.12).
0
50
100
150
200
250
0.000
0.100
0.200
0.300
0.400
0.500
0.600
Juvenile Adult Juvenile Adult Attached
Sens
or F
ish
Even
t Mag
nitu
de (g
)
Live
Fis
h Ra
te
48-hr Mortality Malady Rate Severe Event Magnitude All Events Magnitude
Forebay 616 ft MSL Forebay 634 ft MSL

Final Report
3.17
Figure 3.11. Live-fish mortality and malady estimates contrasted with Sensor Fish significant event magnitudes through turbine Unit 1. Error bars represent standard error of the mean.
Figure 3.12. Live-fish mortality and malady estimates contrasted with the Sensor Fish turbulence index for passage through turbine Unit 1. Error bars represent standard error of the mean.
0
20
40
60
80
100
120
140
160
180
200
0.00
0.05
0.10
0.15
0.20
0.25
0.30
0.35
0.40
2.8/3.0 MW 4.9/5.0 MW 6.0 MW 7.0 MW 4.9/5.0 MW 6.5 MW 9.0 MW
Mea
n Se
nsor
Fis
h M
agni
tude
(g)
Live
Fis
h Ra
te48-hr Mortality Malady Rate Severe Event Magnitude All Events Magnitude
Forebay 616 ft MSL Forebay 634 ft MSL
0
100
200
300
400
500
600
0.00
0.05
0.10
0.15
0.20
0.25
0.30
0.35
2.8/3.0 MW 4.9/5.0 MW 6.0 MW 7.0 MW 4.9/5.0 MW 6.5 MW 9.0 MW
Turb
ulen
ce In
dex
Live
Fis
h Es
timat
e
48-hr Mortality Malady Rate Turbulence Index

Final Report
3.18
Pressure rate-of-change differences among turbine operation treatments are usually associated with turbine flow; that is, the greater the discharge and larger the head, the higher the observed pressure rate of change. Live-fish malady estimates trend somewhat with the rate-of-change values (Figure 3.13).
Figure 3.13. Live-fish mortality and malady estimates contrasted with the Sensor Fish pressure rate of change during passage through turbine Unit 1.
-650.00
-600.00
-550.00
-500.00
-450.00
-400.00
-350.00
-300.000.00
0.05
0.10
0.15
0.20
0.25
0.30
0.35
2.8/3.0 MW 4.9/5.0 MW 6.0 MW 7.0 MW 4.9/5.0 MW 6.5 MW 9.0 MW
Pres
sure
Rat
e of
Cha
nge
(psi/
s)
Live
Fish
Est
imat
es
48-hr Mortality Malady Rate Pressure Rate of Change

Final Report
4.1
4.0 Discussion
The objective of this study was to describe and compare passage exposure conditions through the spillway fish weir and turbine Unit 1 at Foster Dam using Sensor Fish to identify operations and structural features that might cause fish injury or mortality.
4.1 Spillway Fish Weir Passage
Sensor Fish were used to evaluate the spillway fish weir at forebay elevations of approximately 616 ft and 634 ft MSL. Weir flow rates varied for each test elevation, ranging from 154 to 169 cfs at the lower forebay (616.1 to 616.2 ft MSL) and 120 to 230 cfs at the higher forebay (633.7 to 634.6 ft MSL). Weir elevations were 614 ft and 632 ft for the low- and high-forebay levels, respectively, and the injection system pipes were placed 1 ft above the spillway weir crest.
Weir flow impacted the spillway chute surface and then coursed down the chute into the stilling basin (Figure 4.1). Distances from the injection pipe exit to impact (based on the spillway crest elevation of 596.8 ft) were approximately 18 and 36 ft for the two forebay elevations, respectively. Sensor Fish velocities prior to impact were estimated to be 40 and 52 ft/s for the low- and high-forebay levels, respectively. Impact force of the Sensor Fish was calculated to be 1,862 and 3,185 N (419 and 716 pounds force) for the low- and high-forebay levels, respectively.
Figure 4.1. Spillway weir flow impacts the concrete chute prior to flowing into the stilling basin.

Final Report
4.2
Previous studies at dams on the Columbia and Snake rivers and the Willamette tributaries revealed a relationship between Sensor Fish data and live-fish mortality and injury. The nature of the relationship between live fish and Sensor Fish data was not explicitly clear for the spillway fish weir evaluation at Foster Dam, as the weir presents unique conditions that are atypical compared to those for similar weir configurations and characteristics of discharge over the weirs at mainstem Columbia and Snake river dams.
An evaluation was conducted at John Day Dam in 2008 using Sensor Fish and balloon-tagged juvenile Chinook salmon (Normandeau et al. 2008; Carlson and Duncan 2009). John Day Dam has a top spill weir in two spillbays that have been used successfully to aid in juvenile fish passage. The weir design is similar to that at Foster Dam, in that the inserts are placed in the bulkhead slot, forming a flat-topped weir, and water flows over the weir where discharge is controlled by the forebay elevation. The flow over the spillway weir forms a broad, relatively thin discharge jet that impacts the spillway surface before flowing down the spillway chute into the stilling basin (Figure 4.2).
Figure 4.2. Spill over the weir at John Day Dam with Sensor Fish data superimposed. The blue line is pressure; the red line is acceleration vector magnitude in g.
Comparing the spillways at Foster and John Day dams, the slope of the latter has a greater horizontal
component, resulting in a trajectory with an angle of approximately 50 degrees, while that at Foster is approximately 25 degrees (Figure 4.3). Flow over the weir at John Day was maintained at approximately

Final Report
4.3
9.6 kcfs with a flow depth of approximately 6.4 ft. The force of the discharge over the weir created a jet with a trajectory that caused the jet to land on the spillway chute at a horizontal distance of approximately 35 to 40 ft downstream of the weir and approximately 14 ft below the elevation of the spillway crest (Figure 4.2). The impact of fish carried in the John Day discharge jet onto the concrete at John Day is relatively benign, as the flow depth was greater than 2 ft during the entire chute passage, and fish passing were entrained within the body of the discharge jet. Thus, no significant events were observed in the Sensor Fish data in this section of weir passage. Fish contained within the discharge jet would not impact on the spillway chute but would be retained within the discharge jet away from the spillway surface as the discharge jet was redirected at impact to follow the spillway chute.
Figure 4.3. Comparison of spillways at John Day Dam and Foster Dam.
Depth of flow on the spillway was very shallow at Foster Dam because the discharge jet was poorly
formed due to small discharge flow rates. The discharge over the spillway weir at Foster did not form a defined jet but was rather a shallow disorganized flow that had little forward momentum prior to impact on the spillway chute surface. The Sensor Fish is made of rigid polycarbonate and has no shock-absorbing capability. The Sensor Fish collided with the concrete at least once during each release and as many as 12 times as it traveled down the chute. The depth of flow on the spillway was insufficient to keep the Sensor Fish within the discharge flow and away from the spillway chute concrete surface, unlike that during the study at John Day Dam. The majority of significant events recorded by the Sensor Fish were those observed as it traversed the spillway. A few significant events were observed during entry of the Sensor Fish into the stilling basin upon exit from the spillway chute. However, these events were relatively minor for the low-forebay condition, averaging 122 g, and somewhat more harsh for the high-forebay treatment, averaging 145 g.
The characteristics of the fish injection systems used at John Day and Foster dams differed as well. At John Day Dam, the injection pipe was installed upstream of the spillway at a depth of approximately

Final Report
4.4
6.5 ft, so that Sensor Fish and live test fish were entrained in discharge flow during weir passage. At Foster, the injection pipe was installed on top of the spillway weir crest to ensure the fish would pass, because the depth of flow over the weir was less than 2 ft and the water velocities were low just upstream of the weir. Fish were occasionally observed to be propelled out of the pipe and were easily observed in mid-air before falling onto the spillway concrete surface (Figure 4.4).
Figure 4.4. Fish injection system pipe attachment at Foster Dam and juvenile (left) and adult (right) steelhead being propelled out of the system during testing.
Flow over the spillway weir at Foster Dam was variable, ranging from 154 to 169 cfs for the low-
forebay condition and from 120 to 230 cfs for the high-forebay treatment. Depth of flow also varied; intended flow depth over the weir was 1 to 2 ft. Given that the flow at Foster was low, the horizontal component of the discharge over the weir was much less than that at John Day; further, the trajectory of water and fish upon passing over the weir was almost vertical onto the concrete surface of the spillway chute. The horizontal component of the weir discharge trajectory was estimated to be approximately 3 to 5 ft. The Foster spillway chute angle also contributes to the probability of injury to fish passing over the weir because more of the change in momentum when the fish impacts the spillway surface is likely to go into deformation of the fish’s body than change in direction (Figure 4.5).
The nearly vertical drop after exiting the injection pipe, coupled with the fact that some of the fish were not entrained in the flow prior to passage over the spillway weir, likely contributed to injuries—especially at the higher forebay level (i.e., longer drop). Given the mass of the fish and the distance to concrete, impact force can be estimated. Sensor Fish, with a mass of approximately 0.05 kg (with attached balloons and radio tag) had an estimated impact force of 1,862 and 3,185 N (419 and 716 pounds force) for the low- and high-forebay levels, respectively. Considering the observed mass of a juvenile steelhead (average 212 mm fork length) as 0.11 kg and that of an adult (average 708 mm fork length) as 4.2 kg, estimated impact force would be 4,096 N and 156,408 N (921 and 35,200 pounds force), respectively, for the low-forebay treatment and 7,007 N and 267,540 N (1,580 and 60,100 pounds force), respectively, for the high-forebay treatment. These estimated impact forces were calculated for impact at an elevation of 590 ft MSL (approximately 7 ft below the crest for a mass impacting a flat surface, so the

Final Report
4.5
actual forces would be less on a 115-degree incline, as found on the Foster Dam spillway. Also, the consequences of impact would vary for each fish, depending on the part of the body contacting the concrete—the area over which the impact force was applied and subsequent fish injury will depend on the orientation of the fish at contact with the spillway surface. Assuming a juvenile fish impacts on its snout, the total force can be estimated to be exerted on an area of approximately 4 mm2. The resultant pressure on this part of the body would be approximately 1,024 megapascals (MPa), which is a very high pressure and would almost certainly cause deformation of the fish’s body and likely organ damage. If a larger area of the body impacted on the concrete structure (e.g., the side—12 cm2), the impact forces would be spread over more area, resulting in a pressure of approximately 3.4 MPa over the area. Nonetheless, the differences in the mass of the Sensor Fish as compared with the mass of the steelhead used in the current evaluation would result in lower force at impact for Sensor Fish relative to either the juvenile or adult steelhead. This means that the absolute magnitudes of collision events observed in the Sensor Fish data may underestimate the forces that would be acting on the bodies of live fish. Further testing with Sensor Fish attached to adult fish may be warranted, including the examination of attachment methods and locations to attain more accurate impact data.
Figure 4.5. Flow over the spillway fish weir at Foster Dam during the high-forebay condition.
Čada et al. (2005) examined the effects of mechanical and fluid structures using a prototype pressure-
sensitive film (PSF) to roughly estimate the contact area and pressures at collision that might cause injuries to fish. PSF was attached to Sensor Fish, which were then injected into spill discharge at The Dalles and Bonneville dams on the Columbia River. These releases were concurrent with balloon tag survival tests of live fish. The sample sizes used for this prototype study were too small to draw conclusions about a direct relationship between the PSF impacts and fish survival or injury. Čada et al. confirmed the need for tissue damage studies to evaluate the effects of impact pressure and referenced food product studies that determined impact pressures to fish tissue, whereby muscle fibers are torn, are 40 to 48 MPa (Jonsson at al. 2001; Sigurgisladottir et al. 1999), or 4,000 to 4,800 N/cm2. Similar pressures were measured by Čada et al. (2005) on the PSF.

Final Report
4.6
Given that the adult steelhead could experience forces of as much as 267,540 N upon impact with the concrete chute, and that tissue damage has been quantified in refrigerated salmon fillets at 4,000 to 4,800 N/cm2, the assumption that injury or bruising would occur is compelling. The forces are clearly available to cause injury; the variable is the surface area over which the force is distributed. This area is a random variable dependent upon the orientation of the fish at impact; any head exposure is likely more serious than tail impact.
4.2 Penstock/Turbine Passage
The Kaplan turbine at Foster Dam operates at 13,800 horsepower and 257 rpm. The runner diameter is 99.75 in., and the runner opening height is 42.5 in. Maximum discharge is approximately 3,200 cfs, and there are 6 blades and 20 wicket gates. Turbines at Foster Dam operate almost daily, based on Bonneville Power Administration load demands.
Exposure to changes in pressure, shear, turbulence, collisions, strike, cavitation, and grinding may occur during turbine passage and can cause injuries and mortality to fish. Fish are most vulnerable during passage through the wicket gates and runner, where they may collide on structure and be struck by runner blades, exposed to rapid changes in pressure, and exposed to turbulence and shear in the wake of wicket gates and runner blades. Sixty-two percent of the Sensor Fish experienced at least one significant event during turbine passage. For the low-forebay treatment, events were most frequent at the wicket gates; for the high-forebay treatment, events were more prevalent during runner passage. One Sensor Fish was broken in half during passage at the 9.0-MW treatment (high-forebay elevation) (Figure 4.6). Data was recovered from this unit showing normal passage to the runner, where the data stops abruptly (Figure 4.7). Sensor Fish experienced high loss rates during turbine passage. At the lower forebay treatment, more than 30% were lost or damaged. Evidence of grinding or squeezing was evident in several Sensor Fish units, believed to be from being compressed between the turbine blade and wall (Figure 4.8). For context, the yield strength of polycarbonate is 70 MPa.
No significant events were observed during penstock passage. During turbine operations, Sensor Fish were more likely to experience a collision or strike event during passage at low operation (4.9/5.0 MW, 650 cfs) at the high-forebay level; all Sensor Fish experienced at least one event at this treatment. One minor (95.9 g) shear event occurred at the low-forebay treatment; otherwise all events were due to collision or strike. Shear events were observed through the runner and were more prevalent at the 4.9/5.0-and 9.0-MW operations (650 and 1,150 cfs, respectively) during the high-forebay treatment. There was one event in the draft tube region, which was relatively minor (112 g); this severity would most likely cause minor injury but not be fatal.
Events were most frequent at the wicket gates during the low-forebay tests; events during the high-forebay treatment were more prevalent in the runner region. Events observed in the wicket gate region at high-forebay operations were of a much lower magnitude (averaging 121.1 g for all observed events) than those detected during the low-forebay operations, which averaged 145.7 g. Conversely, events incurred within the runner region averaged 133.2 g for the high-forebay operations and 124.1 g for low-forebay operations.

Final Report
4.7
Figure 4.6. Sensor Fish in pieces following passage at the 9.0-MW, high-forebay condition.
Figure 4.7. Data from cracked Sensor Fish stops at the runner.

Final Report
4.8
Figure 4.8. A stress crack in the Sensor Fish polycarbonate body following passage through turbine Unit 1.
Mean severe event magnitudes were greatest for the 4.9/5.0-MW treatment at the low-forebay level
(152.8 g) and at the 6.5-MW treatment at the high-forebay level (142.8 g). Live fish that were severed or nearly severed or decapitated during the Foster Dam evaluation had the highest rates of decapitation/ severance at these treatment levels (Normandeau 2013).
The live balloon-tagged fish released into the turbine at Foster Dam were not pressure-acclimated. Because of the nature of the balloon-tagging process and handling requirements at placement into injection systems, test fish could not be released in a natural state of neutral buoyancy. Research has shown that physostomous juvenile salmon that are not neutrally buoyant when exposed to rapid decompression do not show the same barotrauma injury and mortality response as fish exposed when in a neutrally buoyant physiological condition (Brown et al. 2009; Carlson et al. 2010). Brown et al. (2012) quantified the probability of mortal injury to juvenile Chinook salmon exposed to simulated hydro-turbine passage. The evaluation determined that the acclimation pressure prior to turbine passage is one of two primary factors associated with the probability of mortal injury during turbine passage; the second factor is the exposure pressure nadir. The ratio between the acclimation pressure and the lowest exposure pressure experienced during passage has been directly associated with mortal injury (McKinstry et al. 2007; Brown et al. 2012). Brown et al. (2012) examined six covariates for their contribution to probability of mortal injury during turbine passage: 1) the natural log of the ratio of acclimation pressure to exposure pressure (LRP); 2) total dissolved gas (TDG); 3) condition factor; 4) rate of pressure change; 5) fish length; and 6) fish weight. They determined that LRP, condition factor, rate of pressure change, and interaction effects between TDG and condition factor and between LRP and TDG were significant
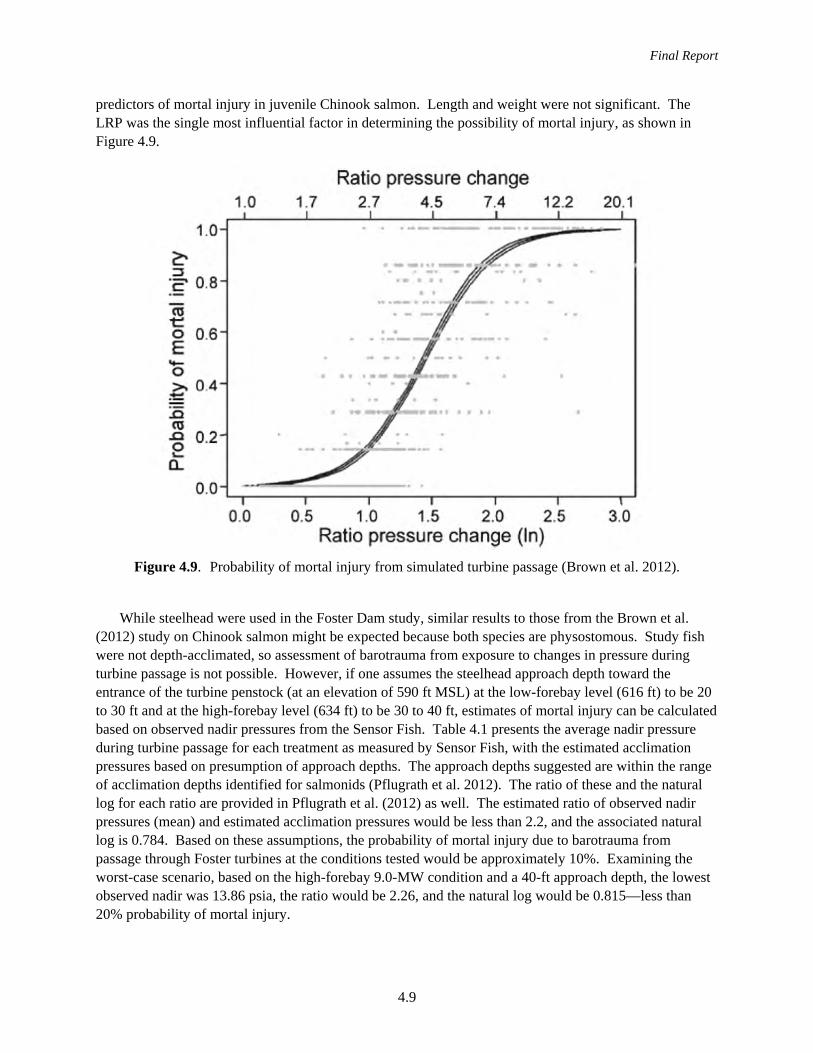
Final Report
4.9
predictors of mortal injury in juvenile Chinook salmon. Length and weight were not significant. The LRP was the single most influential factor in determining the possibility of mortal injury, as shown in Figure 4.9.
Figure 4.9. Probability of mortal injury from simulated turbine passage (Brown et al. 2012).
While steelhead were used in the Foster Dam study, similar results to those from the Brown et al.
(2012) study on Chinook salmon might be expected because both species are physostomous. Study fish were not depth-acclimated, so assessment of barotrauma from exposure to changes in pressure during turbine passage is not possible. However, if one assumes the steelhead approach depth toward the entrance of the turbine penstock (at an elevation of 590 ft MSL) at the low-forebay level (616 ft) to be 20 to 30 ft and at the high-forebay level (634 ft) to be 30 to 40 ft, estimates of mortal injury can be calculated based on observed nadir pressures from the Sensor Fish. Table 4.1 presents the average nadir pressure during turbine passage for each treatment as measured by Sensor Fish, with the estimated acclimation pressures based on presumption of approach depths. The approach depths suggested are within the range of acclimation depths identified for salmonids (Pflugrath et al. 2012). The ratio of these and the natural log for each ratio are provided in Pflugrath et al. (2012) as well. The estimated ratio of observed nadir pressures (mean) and estimated acclimation pressures would be less than 2.2, and the associated natural log is 0.784. Based on these assumptions, the probability of mortal injury due to barotrauma from passage through Foster turbines at the conditions tested would be approximately 10%. Examining the worst-case scenario, based on the high-forebay 9.0-MW condition and a 40-ft approach depth, the lowest observed nadir was 13.86 psia, the ratio would be 2.26, and the natural log would be 0.815—less than 20% probability of mortal injury.

4.10
Final R
eport
Table 4.1. Sensor Fish nadir pressures; estimated depth acclimation pressures at approach and passage, ratio of acclimation to nadir, and natural log of the ratio for passage through turbine Unit 1 at Foster Dam, 2012.
Condition
Mean Nadir Pressure
(psia)
20 ft Approach
Depth (psia) Ratio
Natural Log of Ratio
30 ft Approach
Depth (psia) Ratio
Natural Log of Ratio
40 ft Approach
Depth (psia) Ratio
Natural Log of Ratio
Low Forebay (616 ft)
2.8/3.0 MW 20.59 22.76 1.10 0.095 27.09 1.31 0.270 NA NA NA
4.9/5.0 MW 19.0 22.76 1.19 0.174 27.09 1.42 0.351 NA NA NA
6.0 MW 16.31 22.76 1.38 0.322 27.09 1.65 0.501 NA NA NA
7.0 MW 15.07 22.76 1.53 0.425 27.09 1.82 0.599 NA NA NA
High Forebay (634 ft)
4.9/5.0 MW 17.56 22.76 1.60 0.470 27.09 1.60 0.470 31.39 1.85 0.615
6.5 MW 16.86 22.76 1.64 0.495 27.09 1.64 0.495 31.39 1.90 0.642
9.0 MW 14.68 22.76 1.89 0.637 27.09 1.89 0.637 31.39 2.19 0.784
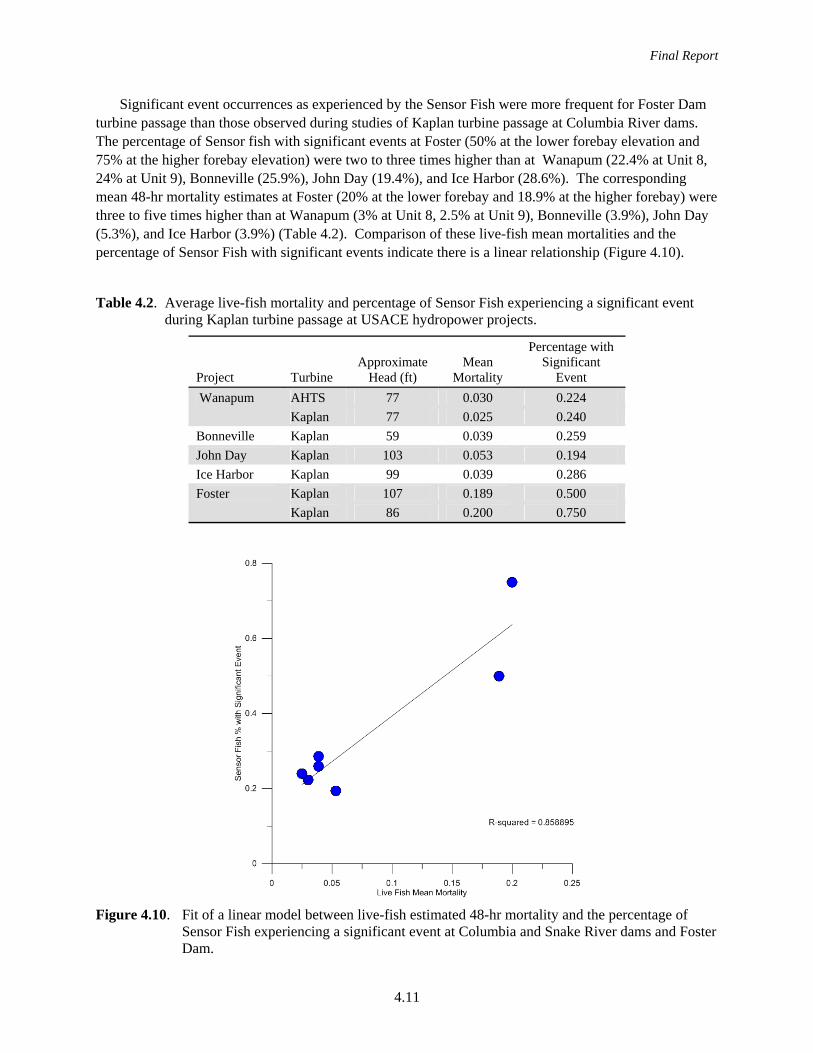
Final Report
4.11
Significant event occurrences as experienced by the Sensor Fish were more frequent for Foster Dam turbine passage than those observed during studies of Kaplan turbine passage at Columbia River dams. The percentage of Sensor fish with significant events at Foster (50% at the lower forebay elevation and 75% at the higher forebay elevation) were two to three times higher than at Wanapum (22.4% at Unit 8, 24% at Unit 9), Bonneville (25.9%), John Day (19.4%), and Ice Harbor (28.6%). The corresponding mean 48-hr mortality estimates at Foster (20% at the lower forebay and 18.9% at the higher forebay) were three to five times higher than at Wanapum (3% at Unit 8, 2.5% at Unit 9), Bonneville (3.9%), John Day (5.3%), and Ice Harbor (3.9%) (Table 4.2). Comparison of these live-fish mean mortalities and the percentage of Sensor Fish with significant events indicate there is a linear relationship (Figure 4.10).
Table 4.2. Average live-fish mortality and percentage of Sensor Fish experiencing a significant event during Kaplan turbine passage at USACE hydropower projects.
Project Turbine Approximate
Head (ft) Mean
Mortality
Percentage with Significant
Event
Wanapum AHTS 77 0.030 0.224
Kaplan 77 0.025 0.240
Bonneville Kaplan 59 0.039 0.259
John Day Kaplan 103 0.053 0.194
Ice Harbor Kaplan 99 0.039 0.286
Foster Kaplan 107 0.189 0.500
Kaplan 86 0.200 0.750
Figure 4.10. Fit of a linear model between live-fish estimated 48-hr mortality and the percentage of Sensor Fish experiencing a significant event at Columbia and Snake River dams and Foster Dam.

Final Report
4.12
The lowest pressure (nadir) that occurs in the water path from the penstock entrance through draft tube exit occurs on the underside of turbine runner blades, which is called the suction side of the turbine runner. The mean of nadir pressures observed for Sensor Fish passage through the Kaplan turbine at Foster Dam for all operating conditions was approximately 17.24 psia; pressures were lowest for the high-forebay, high-power (9.0-MW) treatment (ranging from ~13.7 to 15.08 psia; mean value 14.68 psia). The observed nadir values for the Foster Dam turbine are comparable to those observed for Kaplan turbines installed in the mainstem Columbia and Snake river dams, ranging from approximately 14 to 21 psia. Average nadir pressures measured at the Kaplan turbines on the mainstem rivers ranged from approximately 13 to 27 psia, depending upon variables such as discharge and trajectory through the turbine runner (Carlson and Duncan 2002; Dauble et al. 2007; Carlson et al. 2008). Table 4.3 shows nadir values obtained at low-head dams on the Columbia and Snake rivers, along with those observed during the Foster Dam study.
Table 4.3. Pressure nadirs observed in Sensor Fish data during turbine passage at USACE hydropower projects.
Project Flow (kcfs) Mean Head
(ft) Mean Pressure
Nadir (psia) Maximum Pressure
Nadir (psia) Minimum Pressure
Nadir (psia)
Ice Harbor 8.3 98.9 19.60 23.28 14.38 13.1 98.4 13.19 20.35 0.45 13.45 99.1 15.00 19.48 7.13 14.1 98.6 14.99 19.54 6.33
John Day 11.6 103.0 27.05 30.55 23.1 19.9 102.6 19.07 23.38 9.22 16.5 103.3 22.53 27.02 15.99 20.3 102.6 13.87 22.87 -0.26
Bonneville 11.1 45.4 20.30 23.75 13.5 15.8 45.5 16.27 20.7 8.69 16.9 55.8 18.45 21.95 11.65
Foster 0.55 86.7 20.59 22.26 19.32 0.65 107.5 17.56 19.24 16.59 0.80 86.1 19.00 19.96 17.27 0.82 107.5 16.86 18.77 15.69 0.98 85.7 16.31 18.85 13.74 1.15 86.0 15.07 17.42 13.57 1.15 107.1 14.68 15.08 13.71
Using Sensor Fish, the mean rate of change in pressure for all treatments through the Foster Dam turbine was –553.3 psia/s, observed at approach to the nadir. The mean rate of change in pressure was greatest for passage during the high-forebay treatment at the 6.5-MW operating condition (–599.6 psia/s); lowest rate of change was observed at the low-forebay, 2.8/3.0-MW treatment (–412.2 psia/s). These values are much higher than those observed for passage through Kaplan turbines at mainstem Columbia and Snake river projects, which varied between –125 to –413 psia/s (Table 4.4) (Carlson et al. 2008).
Figure 4.11 is a scatter plot of the pressure rate of change versus the pressure nadir for John Day, Bonneville, Ice Harbor, and Foster dams. The Foster Dam results generally fall mid-range within overall nadir values, while the associated pressure rates of change are somewhat higher than those acquired from Columbia River dams.

Final Report
4.13
Table 4.4. Pressure rates of change observed from Sensor Fish turbine passage at USACE hydropower projects.
Project Flow (kcfs)
Approximate Head (ft)
Mean Pressure Rate of Change
(psia/s)
Maximum Pressure Rate of Change
(psia/s)
Minimum Pressure Rate of Change
(psia/s)
Ice Harbor 8.3 98.9 –413.4 –686.4 –238.6 13.1 98.4 –318.1 –661.6 –127 13.45 99.1 –336.3 –838.8 –113.4 14.1 98.6 –374.4 –637.8 –193.2 John Day 11.6 103.0 –320.1 –572.6 –176 16.5 102.6 –351.1 –649 –227.2 19.9 103.3 –304.1 –525.6 –175.4 20.3 102.6 –373 –604.2 –241.2 Bonneville 11.1 45.4 –139.7 –297.2 –22 15.8 45.5 –184.9 –384.8 –105.4 16.9 55.8 –125.8 –339.4 –-40
Foster 0.55 86.7 –412.2 –512.4 –309.1
0.65 107.5 –567.8 –691.0 –323.4
0.80 86.1 –543.7 –707.9 –451.0
0.82 107.5 –599.6 –707.0 –380.8
0.98 85.7 –578.5 –624.4 –455.8
1.15 86.0 –579.2 –638.4 –469.2
1.15 107.1 –575.2 –680 –429.9
The probability of a fish being struck by a turbine runner blade during passage through the Kaplan turbine at Foster Dam was estimated as a function of turbine design, operation, fish length, and orientation during runner passage. The method used by Deng et al. (2007b) was used to estimate the probability of blade strike during runner passage.
The distribution of orientation of fish at runner passage was estimated to be uniform over the tilt range of 0 to 45 degrees off the tangential velocity vector (Deng et al. 2007b). Simulations to estimate the probability of strike and of injury were run for all discharges used in the live-fish and Sensor Fish studies. The simulation results are presented in Table 4.5. As is known to be the case, the probability of strike or other contact by a turbine blade is higher than is the probability of injury (Turnpenny et al. 2000). The injury rate was estimated from strike rate by applying the mutilation ratio derived by Turnpenny et al. (2000). Fish length was modeled for the strike simulation using a normal distribution with the mean (213 mm) and standard distribution (17.59 mm) of the test fish used in the live-fish portion of the Foster Dam turbine passage study.
The probability of strike estimated using the blade strike model and the occurrence of significant events observed with Sensor Fish were very similar for four of the seven test conditions. It is not clear from analysis conducted to date what the causes were for the differences between these estimates that occurred at the other flow conditions where, in all cases, the frequency of significant events was much higher than the blade strike probabilities. It could be that flow conditions at these operations resulted in a much higher probability of occurrence of high turbulence and resulting shear exposure, which would be detected by the sensor and identified in the analysis as a severe event. The injury rates of balloon-tagged fish compared with injury probability from model results are shown in Figure 4.12. The frequency of

Final Report
4.14
occurrence of injury observed for balloon-tagged fish and the probability of injury estimated using the blade strike model were not statistically different for any of the operations tested. The mean probabilities of injury were estimated by multiplying model probability of strike estimates by a mutilation ratio to account for the fact that not all fish struck by a turbine blade are injured.
Figure 4.11. Turbine runner passage pressure rate of change by nadir pressure for Foster, John Day, Bonneville, and Ice Harbor dams.

Final Report
4.15
Table 4.5. Probability of strike and injury for fish passing through Foster Dam turbine Unit 1.
Discharge
(cfs)
Forebay Level (ft)
Wicket Gate
% Open
Runner Blade Angle (deg)
Probability of Strike
Probability of Injury Live Fish Sensor Fish
Mean SD Mean SD Injury Rate SD
Damage Rate
With Event
Low-Forebay Elevation
550 616 35 flat 0.577 0.371 0.228 0.189 0.228 0.440 0 0.5
800 616 53 1 0.43 0.277 0.17 0.141 0.254 0.448 0.15 0.44
970 616 60 4 0.361 0.23 0.143 0.117 0.285 0.478 0.30 0.67
1150 616 67 7 0.308 0.196 0.122 0.1 0.181 0.394 0.44 0.4
High-Forebay Elevation
730 634 40 flat 0.449 0.289 0.178 0.147 0.193 0.405 0 1
820 634 49 2 0.415 0.267 0.164 0.136 0.261 0.453 0.09 0.38
1422 634 58 8 0.244 0.158 0.096 0.08 0.207 0.408 0.11 0.88
Figure 4.12. Probability of injury from simulation model and actual live-fish injury estimates. Error bars represent standard deviation.
-0.40
-0.20
0.00
0.20
0.40
0.60
0.80
1.00
550 800 970 1150 730 820 1422
Discharge (cfs)
Probability of Injury Malady Rate Sensor Fish with events
Low Pool High Pool

Final Report
5.1
5.0 Conclusions
Low discharge flows over the spillway fish weir at Foster Dam resulted in a shallow depth of flow and a poorly formed discharge jet, regardless of forebay elevation tested. All Sensor Fish passing over the weir experienced at least one significant event, as there was no water “cushioning” effect; the majority had multiple events as they tumbled down the spillway. The trajectory of the flow discharge at impact was at an approximate 115-degree incline; adjusting the discharge jet impact angle on the spillway chute would allow fish to be retained in the jet, away from the spillway surface. Magnitudes observed at impact with the spillway were highest for low-forebay (616-ft MSL) passage, although the distance to impact was greater for the high-forebay (634-ft MSL) treatment—an approximately 18-ft difference. This finding was likely due to the depth of flow. Shear events were observed only during the high-forebay treatment, and all occurred at chute impact. All other significant events were collisions, regardless of treatment condition.
Sensor Fish velocity prior to impact was as high as 40 and 52 ft/s for the low- and high-forebay levels, respectively, and impact force was calculated to be 1,862 and 3,185 N, respectively. The velocities and impacts of the live fish during passage would be much greater than those of the Sensor Fish, due to their larger mass. In fact, most of the injuries observed on the spillway weir-passed juvenile salmon were attributed to the shallow depth of the weir jet and the angle at which the jet contacted the spillway chute (Normandeau 2013).
Twenty-three percent of the Sensor Fish passing over the spillway weir at the high-forebay level were damaged following passage through the juvenile fish pipe; only 5% were damaged following passage at the low-forebay level.
Based on studies at Columbia and Snake River dams, restoring the discharge jet focus, depth, and trajectory would help to contribute to a safer route of passage over the spillway fish weir at Foster Dam than what was tested during the current study.
Sensor Fish experienced high loss rates during the turbine study at Foster Dam—more than 22% of the units were either lost or damaged, most at the low-forebay treatment. Evidence of grinding or squeezing was observed, assumed to be due to the units being compressed between the turbine blade and wall during runner passage.
Collision or strike events were most prevalent during turbine passage; shear events occurred mainly during the high-forebay treatment in the runner region. Events were most frequent at the wicket gates during the low-forebay tests; events during the high-forebay treatment were more prevalent in the runner region. Significant events of the highest magnitudes were generally slightly higher during the low-forebay treatment than during high-forebay passage. Significant event occurrences as experienced by the Sensor Fish were more frequent for Foster Dam turbine passage than those observed during studies of Kaplan turbine passage at Columbia River dams. The runner speed, 257 rpm, its diameter and six blades, and the velocity at the periphery of the runner (approximately 224 fps) contributed to the higher number of events. Mean severe event magnitudes were greatest for the 4.9/5.0-MW treatment at the low-forebay level (152.8 g) and at the 6.5-MW treatment at the high-forebay level (142.8 g).

Final Report
5.2
The average turbine pressure nadirs were comparable to those observed for Kaplan turbines installed in the mainstem Snake and Columbia river dams. However, all the lowest nadir values were greater than 13.56 psia, generally higher than most minimum values observed at Kaplan turbines at other Snake and Columbia River projects. Lowest nadirs were observed for the high-forebay 9.0-MW treatment, averaging 14.68 psia; highest was 20.59 psia, during low operation (2.8/3.0 MW) and low-forebay elevation.
A simulation model was used to estimate the probability of injury due to blade strike. These estimates were not statistically different from the observations of frequency of occurrence of injury for balloon-tagged fish. Differences observed between the probability of blade strike estimated using the model and the occurrence of severe events observed using Sensor Fish suggest that at a few of the operations tested, flow conditions resulted in a higher occurrence of severe turbulence and shear that increased the rate of occurrence of severe events detected.
Comparison of Sensor Fish results for the two passage routes tested at Foster Dam during spring 2012 indicate that Sensor Fish passing over the weir experienced higher event magnitudes than those passing through the turbine, as most experienced significant events upon impact with the spillway chute. Increasing the depth of flow would likely enhance passage conditions by providing an improved discharge jet as well as a cushioning effect for fish and Sensor Fish. Possible changes to the spillway weir design should also be investigated to improve the route’s safety at both pool levels.
Significant event occurrences as experienced by the Sensor Fish were two to three times more frequent for Foster Dam turbine passage than those observed during studies of Kaplan turbine passage at Columbia and Snake river dams. The corresponding mortality and injury rates for the live turbine-passed fish were also two to three times higher at Foster Dam.

Final Report
6.1
6.0 References
Brown RS, TJ Carlson, AE Welch, JR Stephenson, CS Abernethy, BD Ebberts, MJ Langeslay, ML Ahmann, DH Feil, JR Skalski, and RL Townsend. 2009. “Assessment of Barotrauma from Rapid Decompression of Depth-Acclimated Juvenile Chinook Salmon Bearing Radiotelemetry Transmitters.” Transactions of the American Fisheries Society 138:1285–1301.
Brown RS, TJ Carlson, AJ Gingerich, JR Stephenson, BD Pflugrath, and AE Welch. 2012. “Quantifying Mortal Injury of Juvenile Chinook Salmon Exposed to Simulated Hydro-Turbine Passage.” Transactions of the American Fisheries Society 141:147–157.
Čada G, J Smith, and J Busey. 2005. “Use of Pressure-Sensitive Film to Quantify Sources of Injury to Fish.” North American Journal of Fisheries Management 25:57–66.
Carlson TJ and JP Duncan. 2002. Characterization of the McNary Dam Turbine Fish Passage Environment, April 2002. PNWD-3310, Battelle–Pacific Northwest Division, Richland, Washington.
Carlson TJ and JP Duncan. 2009. Evaluation of Fish Passage Conditions for a Top Spillway Weir at John Day Dam Using the Sensor Fish. PNWD-4023, Battelle–Pacific Northwest Division, Richland, Washington.
Carlson TJ, JP Duncan, and Z Deng. 2008. Data Overview for Sensor Fish Samples Acquired at Ice Harbor, John Day, and Bonneville II Dams in 2005, 2006, and 2007. PNNL-17398, Pacific Northwest National Laboratory, Richland, Washington.
Carlson TJ, RS Brown, JR Stephenson, AJ Gingerich, BD Pflugrath, AH Colotelo, AE Welch, PL Benjamin, JR Skalski, AG Seaburg, and RL Townsend. 2010. Assessment of Barotrauma in Untagged and Tagged Juvenile Chinook Salmon Exposed to Simulated Hydro-Turbine Passage. PNNL-19625, Pacific Northwest National Laboratory, Richland, Washington.
Dauble, DD, Z Deng, MC Richmond, RA Moursund, TJ Carlson, CL Rakowski, and JP Duncan. 2007. Biological Assessment of the Advanced Turbine Design at Wanapum Dam, 2005. PNNL-16682, Pacific Northwest National Laboratory, Richland, Washington.
Deng Z, TJ Carlson, JP Duncan, and MC Richmond. 2007a. “Applications of the Sensor Fish Technology.” Hydro Review 26(5):34–41.
Deng Z, TJ Carlson, GR Ploskey, MC Richmond, and DD Dauble. 2007b. “Evaluation of Blade-Strike Models for Estimating the Biological Performance of Kaplan Turbines.” Ecological Modeling 208:165–176.
Heisey PG, D Mathur, and T Rineer. 1992. “A Reliable Tag-Recapture Technique for Estimating Turbine Passage Survival: Application to Young-of-the-Year American Shad (Alosa sapidissima).” Canadian Journal of Fisheries and Aquatic Sciences 49:1826–1834.

Final Report
6.2
Jonsson A, S Sigurgisladottir, H Hafsteinsson, and K Kristbergsson. 2001. “Textural Properties of Raw Atlantic Salmon (Salmo salar) fillets measured by Different Methods in Comparison to Expressible Moisture.” Aquiculture Nutrition 7:81–89.
McKinstry CA, TJ Carlson, and RS Brown. 2007. Derivation of Mortal Injury Metric for Studies of Rapid Decompression of Depth-Acclimated Physostomous Fish. PNNL-17080, Pacific Northwest National Laboratory, Richland, Washington.
Normandeau Associates, Inc. 2013. Estimates of Direct Effects of Steelhead Salmon During Downstream Passage Through a Turbine and Weir at Foster Dam, Oregon. Prepared for the U.S. Army Corps of Engineers, Portland District, Portland, Oregon.
Normandeau, JR Skalski, and R Townsend. 2008. Direct Survival and Injury Evaluation of Juvenile Chinook Salmon Passing John Day Dam Spillway with and without a Top Spillway Weir (TSW). Normandeau Associates, Inc., Drumore, Pennsylvania.
Pflugrath BD, RS Brown, and TJ Carlson. 2012. “Maximum Neutral Buoyancy Depth of Juvenile Chinook Salmon: Implications for Survival during Hydroturbine Passage.” Transactions of the American Fisheries Society 141(2):520–525.
Sigurgisladottir S, H Hafsteinsson, A Jonsson, O Lie, R Nortvedt, M Thomassen, and O Torrissen. 1999. “Textural Properties of Raw Salmon Fillets as Related to Sampling Method.” Journal of Food Science 64(1):99–104.
Turnpenny, AWH, S Clough, KP Hanson, R Ramsay, and D McEwan. 2000. Risk Assessment for Fish Passage through Small, Low-Head Turbines. ETSU H/06/00054/REP, Energy Technical Support Unit, Harwell, United Kingdom.

Final Report
Appendix A –
Field Log Data Sheets
Appendix A, found on the attached CD, contains field log data sheets showing dam operating conditions, release locations and deployment and recovery times for each Sensor Fish release, and other project information for the study period.

Final Report
Appendix B –
Data Summary Tables for Each Sensor Fish Release
Summary tables for each Sensor Fish release may be found on the attached CD.

Final Report
Appendix C –
Pressure and Acceleration Magnitude Time Histories for Each Sensor Fish Release
Figures showing the pressure and acceleration magnitude time histories for each Sensor Fish release may be found on the attached CD.

Final Report
Appendix D –
Pressure and Angular Rate-of-Change Time Histories of Each Sensor Fish Release
Figures showing the pressure and angular rate-of-change time histories for each Sensor Fish release may be found on the attached CD.


Appendix A –
Field Log Data Sheets

A.1
Test Date Location Test Condition Fish ID
Tag Number
Deployment Time
Recovery Time File Name
Barometric Pressure Notes
Low Forebay – ~616 ft MSL
5/2/2012 Unit 1 2.8 MW - 540 cfs 115 9 271 1445 1451 f115_L_1a 29.12 14.30 No runner data - induction pipe delay
Low FB: ~616 ft 114 9 471 1547 1553 f114_L_2 29.11 14.30
635 9 173 1649 1653 f635_L_3 29.10 14.29
5/3/2012 Unit 1 4.9/5.0 MW - 800 cfs 115 9 271 1138 1150 F115_L_1 28.92 14.20
Low FB: ~616 ft 114 9 471 1239 1244 28.95 14.22 Dead
635 9 173 1326 lost 28.99 14.24 bottom of tailrace
1112 9 480 1445 lost 29.07 no signal
1110 9 554 1544 1549 f1110_L_2 985.4 hPA 14.29
664 9 340 1629 1634 F664_L_3 29.10 14.29
1002 9 491 1657 1702 f1002_L_4 29.12 14.30 bad acceleration
5/4/2012 Unit 1 6.0 MW - 980 cfs 1011 9 194 835 840 f1011_m_1 29.41 14.44
Low FB: ~616 ft 1006 9 601 935 940 29.41 14.44broken inside - data to ~ runner position
900 9 890 1003 1006 f900_m_2 29.42 14.45
1014 9 531 1034 1045 29.42 14.45 cracked - water infiltrated
901 9 183 1109 1130 f901_m_4 29.44 14.46
900 9 890 1152 1154 f900_m_5 29.44 14.46
1015 9 471 1229 1234 f1015_m_3 29.44 14.46
1015 9 471 1438 1440 f1015_m_6 29.48 14.48
901 9 183 1509 lost 29.48 14.48 2 balloons sheared off
900 9 890 1544 1547 29.50 14.49 water inside - data to ~runner position
5/5/2012 Unit 1 7.0 MW - 1150 cfs 1016 9 601 855 859 29.75 14.61 yellow balloon only - cracked, water filled
Low FB: ~616 ft 1011 9 194 1009 1017 f1011_H_1 29.73 14.60
1015 9 471 1103 1107 f1015_H_2 29.73 14.60 Acceleration and pressure --defective
900 9 491 1149 1152 29.72 14.60 DEAD
1011 9 194 1308 1317 f1011_H_3 29.70 14.59
1006 9 491 1400 1408 29.70 14.59 collected data until runner
1011 9 194 1453 1457 f1011_H_4 29.70 14.59
1011 9 194 1548 1555 f1011_H_5 29.68 14.58
1011 9 194 1630 1635 f1011_H_6 29.67 14.57
5/6/2012 Unit 1 4.9/5.0 MW -800 cfs 1011 9 194 826 834 f1011_L_5 29.64 14.56
Low FB: ~616 ft 1011 9 194 936 941 f1011_L_6 29.64 14.56
1006 9 194 1029 1033 f1006_L_7 29.62 14.55
1011 9 194 1126 1130 f1011_L_8 29.61 14.54
1006 9 194 1207 1217 f1006_L_9 29.60 14.54

A.2
Test Date Location Test Condition Fish ID
Tag Number
Deployment Time
Recovery Time File Name
Barometric Pressure Notes
1011 9 194 1332 1338 f1011_L_10 29.57 14.52
5/6/2012 Unit 1 3.0 MW - 550 cfs 1006 9 194 1431 1440 f1006_XL_1 29.55 14.51
Low FB: ~616 ft 1110 9 194 1527 1532 f1110_XL_2 29.54 14.51
1006 9 194 1628 1634 f1006_XL_3 29.52 14.50
1011 9 531 1654 1659 f1011_XL_4 29.51 14.49
5/8/2012 weir Low forebay 1006 9 194 845 855 f1006_w_1 29.37 14.43
Juvenile pipe ~616 ft 664 9 340 925 933 f664_w_2 29.37 14.43
1106 9 531 957 1056 f1106_w_4 29.36 14.42
1011 9 271 1030 1038 f1011_w_3 29.35 14.42
1006 9 194 1056 1106 f1006_w_5 29.35 14.42
664 9 340 1126 1132 f664_w_8 29.36 14.42
1011 9 271 1205 1213 f1011_w_6 29.34 14.41
1110 9 554 1206 1212 f1110_w_7 29.34 14.41
1106 9 531 1236 1241 f1106_w_9 29.33 14.41
1006 9 194 1235 1241 f1006_w_11 29.33 14.41
1015 9 271 1307 1312 f1015_w_10 29.33 14.41 bad acceleration
1110 9 554 1338 1345 f1110_w_12 29.33 14.41
664 9 340 1339 1346 f664_w_13 29.33 14.41
1106 9 531 1403 1410 f1106_w_14 29.32 14.40
1015 9 271 1440 1452 29.31 14.40 no data
1110 9 554 1440 1452 f1110_w_15 29.31 14.40
1006 9 194 1505 1512 29.29 14.39 battery???
664 9 340 1600 1605 f664_w_16 29.28 14.38
1011 9 531 1533 1540 f1011_w_17 29.29 14.39 pressure?
5/9/2012 weir Low forebay 1006 9 194 1049 1104 f1006_adult_1 29.50 14.49
Adult pipe ~616 ft 1106 9 531 1147 1157 f1106_adult_2 29.50 14.49
High Forebay – ~634 ft MSL
5/18/2012 Unit 1 115 9 531 1407 1409 f115_h_6-5_1 29.35 14.42
6.5 MW 202 8 990 1408 1412 f202_h_6_3 29.35 14.42
High forebay: ~634 ft 244 8 570 1408 1411 f244_h_6_2 29.35 14.42
251 8 161 1409 751 f251_6_4 29.35 14.42 next day – was in pipe
5/19/2012 Unit 1 4.9/5.0 MW 699 9 271 749 754 f699_h_4_2 29.32 14.40
High forebay: ~634 ft 115 9 930 749 753 f115_h_4_1 29.32 14.40
223 9 920 750 754 f223_4_3 29.32 14.40 orange balloon detached
250 9 536 751 754 f250_4_4 29.32 14.40
272 9 948 752 757 f272_4_5 29.32 14.40
221 9 960 752 755 f221_4_6 29.32 14.40

A.3
Test Date Location Test Condition Fish ID
Tag Number
Deployment Time
Recovery Time File Name
Barometric Pressure Notes
202 9 583 753 758 f202_4_7 29.32 14.40
239 9 770 754 757 f239_4_8 29.32 14.40
Unit 1 6.5 MW 1011 9 554 835 lost 29.32 14.40 not recovered
High forebay: ~634 ft 102 9 977 836 839 29.32 14.40 data stops ~2/3 way thru
244 8 570 842 844 f244_6_5 29.32 14.40
252 9 010 842 858 f252_6_6 29.32 14.40
213 9 340 903 906 f213_6_7 29.32 14.40
248 9 194 904 906 f248_6_8 29.32 14.40
224 9 310 904 909 f224_6_9 29.32 14.40
Unit 1 9.0 MW 1110 9 613 950 955 f1110_h_9_2 29.33 14.41
High forebay: ~634 ft 207 9 536 951 1007 f207_9_3 29.33 14.41
219 9 930 951 955 f219_9_4 29.33 14.41 cracked
266 9 271 959 1001 f266_9_7 29.33 14.41
214 9 770 959 1002 f214_9_6 29.33 14.41
204 9 960 1019 1027 f204_9_5 29.33 14.41
267 9 990 1020 1025 f267_9_9 29.33 14.41
231 9 531 1020 1023 f231_9_8 29.33 14.41
664 9 583 1021 1029 f664_h_9_1 29.33 14.41
5/19/2012 weir High forebay 1106 9 977 1119 1130 f1106_h_w_2 29.33 14.41
Juvenile pipe ~634 ft 722 9 310 1121 1125 f722_h_w_1 29.33 14.41
Water appears low over the weir 1006 8 570 1151 1153 29.32 14.40 no data - strike interrupt
698 9 010 1152 1154 29.32 14.40 no data - strike interrupt
664 9 583 1324 1329 f664_h_w_3 29.28 14.38
115 9 920 1325 1332 f115_h_w_4 29.28 14.38
1106 9 977 1353 1403 f1106_h_w_5 29.28 14.38
722 9 310 1353 1402 29.28 14.38 dead 0000
1110 9 613 1439 1447 f1110_h_w_6 29.27 14.38
699 9 271 1438 1453 f699_h_w_7 29.27 14.38
664 9 583 1509 1518 f664_h_w_8 29.27 14.38
5/20/2012 weir High forebay 115 9 920 803 814 f115_h_w_9 29.25 14.37
Juvenile pipe ~634 ft 231 9 948 803 808 f231_h_w_11 29.25 14.37
Water is over pipe at weir 1106 9 977 830 840 29.25 14.37 broken inside - dead
102 9 536 831 836 f102_h_w_20 29.25 14.37 wet - dried out
1110 9 613 855 905 f1110_h_w_10 29.25 14.37
664 9 583 947 950 f664_h_w_13 29.25 14.37
214 8 161 948 950 f214_h_w_12 29.25 14.37

A.4
Test Date Location Test Condition Fish ID
Tag Number
Deployment Time
Recovery Time File Name
Barometric Pressure Notes
698 9 010 1025 1028 29.25 14.37 no data - interrupt
699 9 271 1026 1032 f699_h_w_14 29.25 14.37
115 9 920 1057 1102 f115_h_w_15 29.25 14.37
1110 9 613 1056 1101 f1110_h_w_16 29.25 14.37
231 9 948 1218 1221 f231_h_w_17 29.25 14.37
664 9 583 1219 1223 f664_h_w_18 29.25 14.37
699 9 271 1251 1256 f699_h_w_19 29.25 14.37
115 9 920 1250 1256 29.25 14.37 tag ripped off - dead
5/21/2012 weir High forebay 1110 9 613 825 826 f1110_h_W_ad
ult1 29.18 14.33
Adult pipe ~634 ft 699 9 271 824 829 f699_H_W_ad
ult2 29.18 14.33
Water is over pipe at weir
weir ~634.6 ft 214 1012 1014 f214 29.15 14.32 On adult - tag ripped off
Adult pipe 250 1022 1031 f250 29.15 14.32 On adult - tag stayed on

Final Report
Appendix B –
Data Summary Tables for Each Sensor Fish Release

Final Report
B.1
Sensor Fish Weir Passage – Low-Forebay Elevation (616 ft MSL)
Significant Events

Final Report
B.3
File Name Number of
Events
Average Magnitude per
Run
Event Magnitude
(g) Time of Event Location Event Type
FB 616 MSL – Juvenile Pipe:
f1006_w_1 12 151.5 256.2 1.084 Impact Collision 249.9 2.003 Spillway Collision 153.9 5.6035 Spillway Collision 148.4 4.6685 Spillway Collision 143.3 3.569 Spillway Collision 140.7 6.0645 Plunge Collision 138.4 4.2135 Spillway Collision 130.5 4.9535 Spillway Collision 125.4 2.2035 Spillway Collision 124.7 3.1315 Spillway Collision 104.8 3.8405 Spillway Collision 102 2.813 Spillway Collision
f664_w_2 2 109.3 113.4 1.19 Impact Collision 105.2 5.5595 Spillway Collision
f1011_w_3 5 113.8 133.8 1.101 Impact Collision 112.4 3.9925 Spillway Collision 111.4 1.793 Spillway Collision 110 2.0825 Spillway Collision 101.5 4.676 Spillway Collision
f1106_w_4 5 126.0 142.8 4.137 Spillway Collision 141.7 1.7945 Spillway Collision 128.5 4.4505 Spillway Collision 114.1 3.536 Spillway Collision 103 5.867 Spillway Collision
f1006_w_5 6 127.8 140 3.254 Spillway Collision 133.4 2.7265 Spillway Collision 128.2 1.1325 Impact Collision 127.8 3.074 Spillway Collision 127 3.5205 Spillway Collision 110.6 5.365 Spillway Collision
f1011_w_6 6 126.6 154.6 4.69 Spillway Collision 150.9 1.068 Impact Collision 134.6 12.475 Tailrace Collision 127.6 1.8265 Spillway Collision 101.3 3.238 Spillway Collision
98.4 4.036 Spillway Collision f1110_w_7 10 124.0 187 3.398 Spillway Collision
132.8 1.092 Impact Shear 129.2 4.105 Spillway Collision 127.1 1.481 Spillway Collision 119.1 6.2035 Plunge Collision 118 4.321 Spillway Collision 117.5 5.8495 Spillway Collision

Final Report
B.4
File Name Number of
Events
Average Magnitude per
Run
Event Magnitude
(g) Time of Event Location Event Type
108.9 9.947 Tailrace Collision 101.2 5.4825 Spillway Collision
99.1 2.2165 Spillway Collision f664_w_8 4 124.3 173.6 1.0505 Impact Collision
113.8 5.2555 Spillway Collision 106.6 5.7015 Spillway Collision 103.2 5.0705 Spillway Collision
f1106_w_9 7 119.0 147.5 1.9875 Spillway Collision 135.4 1.5635 Spillway Collision 132.2 3.9505 Spillway Collision 124.6 2.3465 Spillway Collision
98.5 1.424 Spillway Collision 97.5 2.8475 Spillway Collision 97.3 4.5625 Spillway Collision
f1006_w_11 10 134.2 167.4 2.2045 Spillway Collision 166.6 5.4755 Spillway Collision 162.5 2.77 Spillway Collision 159 2.014 Spillway Collision 137.6 5.7775 Spillway Collision 132.1 2.715 Spillway Collision 109.3 1.3175 Impact Collision 105.8 1.3635 Spillway Collision 102 3.1275 Spillway Collision 100.1 4.1265 Spillway Collision
f1110_w_12 6 123.4 160.1 1.052 Impact Collision 130.7 2.4055 Spillway Collision 125.5 2.17 Spillway Collision 116.6 3.3345 Spillway Collision 110.1 5.978 Plunge Collision
97.5 1.465 Spillway Collision f664_w_13 3 125.9 143.9 1.032 Impact Collision
123.5 5.3425 Spillway Collision 110.4 2.277 Spillway Collision
f1106_w_14 1 132.1 132.1 2.4395 Spillway Collision f1110_w_15 5 128.2 163.4 1.0445 Impact Collision
126.7 2.3845 Spillway Collision 126.2 2.6435 Spillway Collision 119.2 5.8035 Plunge Collision 105.6 2.092 Spillway Collision
f664_w_16 3 120.1 161.8 0.996 Impact Collision 101.9 1.4045 Spillway Collision
96.7 5.505 Spillway Collision

Final Report
B.5
File Name Number of
Events
Average Magnitude per
Run
Event Magnitude
(g) Time of Event Location Event Type
f1011_w_17 3 125.8 144.7 1.986 Spillway Collision 122.4 1.1465 Impact Collision 110.3 4.712 Spillway Collision
Mean 5.5 125.8 Severe 157.6 All 128.5
STDEV 31.79 STDEV 28.19 SE 7.95 SE 3.01
FB 616 MSL – Adult Pipe:
f1006_adult_1* 4 186.1 230.4 1.8945 Spillway Collision 200.4 3.8105 Spillway Collision 160.6 4.975 Spillway Collision 152.8 3.553 Spillway Collision
f1106_adult_2* 1 125.5 125.5 1.4385 Impact Collision
Mean 2.5 155.8 Severe 177.95 All 173.94
STDEV 74.18 STDEV 41.41 SE 52.45 SE 18.52

Final Report
B.7
Sensor Fish Weir Passage – High-Forebay Elevation (634 ft MSL)
Significant Events

Final Report
B.9
File Name Number
of Events
Average Magnitude per
Run Event Magnitude
(g) Time of Event Location
Event Type
FB 634 MSL – Juvenile Pipe:
f722_h_w_1 6 123.2 144 2.371 Spillway Collision 129.8 1.521 Impact Shear 127 2.657 Spillway Collision 118.8 4.302 Spillway Collision 110.2 4.083 Spillway Collision 109.1 2.954 Spillway Collision
f1106_h_w_2 2 130.3 133.4 6.618 Plunge Collision 127.1 1.4545 Impact Collision
f664_h_w_3 3 131.4 134.3 4.9575 Spillway Collision 130.2 1.4575 Impact Collision 129.8 6.062 Spillway Collision
f115_h_w_4 6 156.2 188.1 1.4375 Impact Collision 184.6 3.853 Spillway Collision 176.9 4.786 Spillway Collision 171.9 5.386 Spillway Collision 109.7 5.2235 Spillway Collision 105.7 4.9895 Spillway Collision
f1106_h_w_5 2 106.7 109.6 1.4485 Impact Collision 103.7 4.191 Spillway Collision
f1110_h_w_6 6 146.0 186.2 4.2485 Spillway Collision 160.1 1.7045 Impact Collision 156.1 6.0475 Plunge Collision 138.2 5.262 Spillway Collision 126.6 2.524 Spillway Collision 108.9 5.019 Spillway Collision
f699_h_w_7 1 149.5 149.5 1.5555 Impact Shear f664_h_w_8 5 113.1 152.1 1.494 Impact Collision
112.9 1.9575 Spillway Collision 104.9 2.9245 Spillway Collision
97.9 4.6505 Spillway Collision 97.6 3.5585 Spillway Collision
f115_h_w_9 5 156.3 202.2 3.609 Spillway Collision 197.3 5.7965 Spillway Collision 169.7 1.577 Impact Shear 110.6 3.9875 Spillway Collision 101.7 5.6055 Spillway Collision
f1110_h_w_10 3 131.0 159.9 1.5405 Impact Shear 123.8 5.008 Spillway Collision 109.4 6.046 Spillway Collision
f231_h_w_11 1 122.6 122.623 1.515 Impact Collision f214_h_w_12 2 139.8 157.681 1.68 Impact Collision
121.834 3.155 Spillway Collision

Final Report
B.10
File Name Number
of Events
Average Magnitude per
Run Event Magnitude
(g) Time of Event Location
Event Type
f664_h_w_13 1 156.4 156.4 1.484 Impact Collision f699_h_w_14 3 103.5 108.4 4.6885 Spillway Collision
103 1.948 Spillway Collision 99.1 1.48 Impact Collision
f115_h_w_15 8 132.0 177.7 3.035 Spillway Collision 146.2 1.609 Impact Shear 140.7 4.9465 Spillway Collision 140.5 2.79 Spillway Collision 120.1 4.6515 Spillway Collision 119.2 4.0975 Spillway Collision 107.1 2.2065 Spillway Collision 104.3 4.4825 Spillway Collision
f1110_h_w_16 3 125.1 130.3 2.494 Spillway Collision 129.9 5.1185 Spillway Collision 115 1.445 Impact Shear
f231_h_w_17 1 142.6 142.596 1.14 Impact Collision f664_h_w_18 6 128.2 147.8 1.5275 Spillway Collision
138.9 3.749 Spillway Collision 136.5 1.5085 Impact Shear 121.3 5.0955 Spillway Collision 113.5 5.438 Spillway Collision 111.1 3.498 Spillway Collision
f699_h_w_19 1 130.9 130.9 2.3405 Spillway Collision f102_h_w_20 2 107.3 107.9 1.5765 Spillway Collision
106.6 1.557 Impact Shear
Mean 3.35 131.6 Severe 147.08 All 132.34 STDEV 26.70 STDEV 26.6 SE 5.97 SE 3.25

Final Report
B.11
File Name Number
of Events
Average Magnitude
per Run Event
Magnitude (g) Time of Event Location
Event Type
FB 634 MSL – Adult Pipe:
f1110_h_W_adult1* 5 125.6 146.9 1.2485 Impact Shear 130.1 2.8095 Spillway Collision 128.2 3.9655 Spillway Collision 125.3 5.1215 Spillway Collision
97.5 5.4135 Spillway Collision f699_H_W_adult2* 2 117.5 126 1.4565 Impact Shear
108.9 3.7445 Spillway Collision
Mean 3.5 121.5 Severe 136.45 All 123.27 STDEV 14.8 STDEV 15.87 SE 10.45 SE 6.00
Attached to adult:
f214 6 119.5 151.527 0.95 Spillway Collision fish had a bruise at recapture; fine at 48 h 126.928 0.82 Impact Collision
125.197 0.885 Spillway Collision 112.192 2.04 Spillway Collision 105.19 4.21 Spillway Collision
95.708 3.235 Spillway Collision f250 4 130.1 152.157 1.065 Spillway Collision scrapes on head near eye; fish fine at 48 h 130.365 1.025 Impact Shear
128.684 1.145 Spillway Collision 109.204 1.045 Spillway Collision
Mean 5 124.8 Severe 151.842 All 123.72 STDEV 0.45 STDEV 18.66 SE 0.315 SE 5.90

Final Report
B.13
Sensor Fish Turbine Passage – Low-Forebay Elevation (616 ft MSL)
Significant Events

Final Report
B.15
Test Condition File Name Number of
Events Event
Magnitude (g) Time of Event Location Event Type
2.8 MW – 540 cfs f114_L_2 0 Low Forebay f635_L_3 1 144.5 -0.046 Runner Collision
3.0 MW – 550 cfs f1006_XL_1 1 145 -0.604 Wicket Gate Collision Low Forebay f1110_XL_2 1 145 -0.4945 Wicket Gate Collision
f1006_XL_3 0 f1011_XL_4 0
Avg Events/run 0.50 144.83 Mean With events 0.50 0.289 STDEV
0.167 SE
4.9 MW – 800 cfs F115_L_1 0 Low Forebay f1110_L_2 2 113.1 -0.0565 Runner Collision
100 -0.0835 Wicket Gate Collision F664_L_3 1 135.7 -0.3695 Wicket Gate Collision f1011_L_5 0 f1011_L_6 0 f1006_L_7 1 117.7 -0.459 Wicket Gate Collision f1011_L_8 0 f1006_L_9 4 244.6 -0.303 Wicket Gate Collision
171.5 -0.05 Runner Collision 118.7 -0.021 Runner Collision
95.9 -0.0795 Runner Shear
f1011_L_10 0 152.78 Severe 138.9 All Avg Events/run 0.89 61.99 Stdev 49.4 With events 0.44 30.99 SE 17.5
6.0 MW – 980 cfs f1011_m_1 0 Low Forebay f900_m_2 1 147.6 -0.612 Wicket Gate Collision
f1015_m_3 1 104.8 -0.33 Wicket Gate Collision f901_m_4 0 f900_m_5 1 105 -0.034 Runner Collision f1015_m_6 1 171.5 -0.185 Wicket Gate Collision
Avg Events/run 0.67 132.23 Mean With events 0.67 33.03 STDEV
16.51 SE
7.0 MW – 1150 cfs f1011_H_1 2 120.2 -0.001 Runner Collision Low Forebay 108.4 -0.0475 Runner Collision
f1011_H_3 0 f1011_H_4 0 f1011_H_5 0 f1011_H_6 1 144.9 -0.169 Wicket Gate Collision
Avg Events/run 0.60 132.55 Severe 124.50 All With events 0.40 17.47 STDEV 18.63
12.35 SE 10.75

Final Report
B.17
Sensor Fish Turbine Passage – High-Forebay Elevation (634 ft MSL)
Significant Events

Final Report
B.19
Test Condition File Name Number
of Events
Event Magnitude
(g) Time of Event (s) Location
Event Type
4.9 MW f115_h_4_1 1 106.7 -0.4 Wicket Gate Collision High Forebay f699_h_4_2 1 112 12.052 Draft Tube Collision 650 cfs f223_4_3 1 177.113 -0.095 Runner Collision
f250_4_4 1 108.607 -0.125 Runner Shear f272_4_5 2 144.741 -0.14 Runner Collision
113.884 -0.17 Wicket Gate Collision f221_4_6 2 144.727 -0.11 Runner Shear
136.426 -0.425 Runner Shear f202_4_7 1 101.756 0.015 Runner Collision f239_4_8 3 135.329 0 Runner Collision
122.072 -0.14 Runner Collision 104.086 -0.565 Wicket Gate Collision
Avg Events/run 1.5 128.9 Severe 125.6 All With events 1 26.17 Stdev 22.58
9.25 SE 6.52
6.5 MW f115_h_6-5_1 0 High Forebay f244_h_6_2 0 820 cfs f202_h_6_3 2 106.523 -0.015 runner Collision
96.862 -0.12 runner Shear f244_6_5 0 f252_6_6 1 167.084 -0.035 runner Collision f213_6_7 0 f248_6_8 0 f224_6_9 2 154.895 -0.04 runner Collision
107.457 -0.01 runner Collision
Avg Events/run 0.625 142.8 Severe 126.6 All With events 0.375 32.03 Stdev 31.99
18.49 SE 14.31
9.0 MW f664_h_9_1 1 185.4 -0.037 runner Shear High Forebay f1110_h_9_2 1 115.4 -0.303 wicket gate Collision 1150 cfs f207_9_3 3 172.1 -0.025 runner Collision
165.575 -0.47 wicket gate Collision 137.505 0.035 runner Collision
f266_9_7 1 132.046 -0.03 runner Shear f214_9_6 2 118.694 0.015 runner Collision
113.19 -0.04 runner Collision f204_9_5 0 f267_9_9 1 112.383 -0.135 runner Shear f231_9_8 2 144.867 -0.035 runner Collision
110.301 0.025 runner Collision
Avg Events/run 1.375 140.1 Severe 137.0 All With events 0.875 28.87 Stdev 26.77
10.91 SE 8.07

Final Report
B.21
Sensor Fish Turbine Passage – Pressure Nadir Under the Runner

Final Report
B.23
Test Condition File Name
Forebay Elevation (ft MSL)
Tailwater Elevation (ft MSL)
Turbine MW Nadir (psia)
Low Forebay – 616 ft MSL
2.8 MW – 540 cfs f114_L_2 ~616.5 2.8 21.06
Low Forebay f635_L_3 ~616.5 2.8 20.87
3.0 MW – 550 cfs f1006_XL_1 615.95 529.41 3.0 19.5085
Low Forebay f1110_XL_2 615.95 529.41 3.0 22.26
f1006_XL_3 615.98 529.12 3.0 20.4925
f1011_XL_4 615.98 529.12 3.0 19.32
Mean 20.59
4.9 MW F115_L_1 615.47 529.76 4.9 19.75
Low Forebay f1110_L_2 615.71 530.01 4.9 18.38
650 cfs F664_L_3 616.43 530.34 4.9 19.18
f1002_L_4 616.43 530.34 4.9 18.42
f1011_L_5 616.01 529.77 4.9 19.8
f1011_L_6 615.95 529.64 4.9 19.6
f1006_L_7 615.95 529.59 4.9 19.04
f1011_L_8 615.95 529.43 4.9 18.56
f1006_L_9 615.95 529.42 4.9 17.27
f1011_L_10 615.95 529.42 4.9 19.96
Mean 19.00
6.0 MW f1011_m_1 615.23 529.87 6.0 15.95
Low Forebay f900_m_2 615.38 529.76 6.0 18.85
820 cfs f1015_m_3 615.47 529.76 6.0 17.96
f901_m_4 615.47 529.76 6.0 15.7
f900_m_5 615.44 529.65 6.0 15.66
f1015_m_6 615.65 529.7 6.0 13.74
Mean 16.31
7.0 MW f1011_H_1 616.1 530.13 7.0 17.42
Low Forebay f1011_H_3 616.1 530.1 7.0 16.41
1150 cfs f1011_H_4 616.1 530.09 7.0 13.68
f1011_H_5 616.1 530.12 7.0 13.57
f1011_H_6 616.1 530.07 7.0 14.26
Mean 15.07

Final Report
B.24
Test Condition File Name
Forebay Elevation (ft MSL)
Tailwater Elevation (ft MSL)
Turbine MW
Nadir (psia)
High Forebay – 634 ft MSL
4.9 MW f115_h_4_1 633.59 526.06 4.9 17.66 High forebay f699_h_4_2 633.59 526.06 4.9 17.13 650 cfs f223_4_3 633.59 526.06 4.9 17.907
f250_4_4 633.59 526.06 4.9 19.24 f272_4_5 633.59 526.06 4.9 16.72 f221_4_6 633.59 526.06 4.9 17.92 f202_4_7 633.59 526.06 4.9 16.59 f239_4_8 633.59 526.06 4.9 17.33
Mean 17.56
6.5 MW f115_h_6-5_1 634.13 526.26 6.5 15.84 High forebay f244_h_6_2 634.13 526.26 6.5 16.61 820 cfs f202_h_6_3 634.13 526.26 6.5 18.77
f244_6_5 633.56 526.21 6.5 17.41 f252_6_6 633.56 526.21 6.5 16.59 f213_6_7 633.56 526.21 6.5 16.57 f248_6_8 633.56 526.21 6.5 15.69 f224_6_9 633.56 526.21 6.5 17.36
Mean 16.86
9.0 MW f664_h_9_1 633.62 526.5 9.0 13.71 High forebay f1110_h_9_2 633.62 526.5 9.0 14.33 1150 cfs f207_9_3 633.62 526.5 9.0 14.77
f204_9_5 633.62 526.5 9.0 14.96 f214_9_6 633.62 526.5 9.0 15.046 f266_9_7 633.62 526.5 9.0 15.079 f231_9_8 633.62 526.5 9.0 14.659 f267_9_9 633.62 526.5 9.0 14.868
Mean 14.68

Final Report
B.25
Sensor Fish Turbine Passage – Pressure Rate of Change through the Runner

Final Report
B.27
Test Condition File Name Rate of Change
Pressure at 0.05 s (psia)
Pressure at 0 s (psia)
Forebay – 616 ft MSL
2.8 MW – 540 cfs f114_L_2 -389.6 40.59 21.11 Low Forebay f635_L_3 -512.4 46.74 21.12
3.0 MW – 550 cfs f1006_XL_1 -309.06 34.93 19.48 Low Forebay f1110_XL_2 -455 45.01 22.26
f1006_XL_3 -384.03 39.67 20.47 f1011_XL_4 -422.8 40.58 19.44
Mean -412.15 StDev 69.18 SE 28.24
4.9 MW F115_L_1 -475.2 43.56 19.8 Low Forebay f1110_L_2 -606 48.41 18.11 650 cfs F664_L_3 -502.4 44.57 19.45
f1002_L_4 -542.322 46.33 19.21 f1011_L_5 -499.4 44.51 19.54 f1011_L_6 -451 41.99 19.44 f1006_L_7 -533.46 46.15 19.48 f1011_L_8 -604.2 48.74 18.53 f1006_L_9 -707.88 53.1 17.7 f1011_L_10 -515.4 45.31 19.54
Mean -543.73 StDev 76.27 SE 24.12
6.0 MW f1011_m_1 -582 44.41 15.31 Low Forebay f900_m_2 -455.8 41.96 19.17 820 cfs f1015_m_3 -579.474 45.65 16.68
f901_m_4 -621.4 46.54 15.47 f900_m_5 -607.8 46.36 15.97 f1015_m_6 -624.442 47.39 16.17
Mean -578.49 StDev 63.05 SE 25.74
7.0 MW f1011_H_1 -559.8 45.01 17.02 Low Forebay f1011_H_3 -469.2 39.58 16.12 1150 cfs f1011_H_4 -638.4 45.52 13.6
f1011_H_5 -632.2 45.11 13.5 f1011_H_6 -596.2 44.01 14.2
Mean -579.16 StDev 69.06 SE 30.89

Final Report
B.28
Test Condition File Name Rate of Change
Pressure at -0.05 s (psia)
Pressure at 0 s (psia)
Forebay 634 ft MSL
4.9 MW f115_h_4_1 -661 50.65 17.6 High forebay f699_h_4_2 -662.8 49.98 16.84 650 cfs f223_4_3 -653.42 36.178 3.507
f250_4_4 -323.42 21.01 4.839 f272_4_5 -684.26 36.532 2.319 f221_4_6 -499.04 28.47 3.518 f202_4_7 -690.96 36.738 2.19 f239_4_8 -367.16 24.834 6.476
Mean -567.8 StDev 150.5 SE 53.20
6.5 MW f115_h_6-5_1 -707 50.84 15.49 High forebay f244_h_6_2 -380.84 25.861 6.819 820 cfs f202_h_6_3 -533.32 31.036 4.37
f244_6_5 -641.4 35.081 3.011 f252_6_6 -672.6 35.82 2.19 f213_6_7 -689.16 36.625 2.167 f248_6_8 -678.62 35.223 1.292 f224_6_9 -493.48 27.63 2.956
Mean -599.6 StDev 117.3 SE 41.49
9.0 MW f664_h_9_1 -680 47.86 13.86 High forebay f1110_h_9_2 -599.6 44 14.02 1150 cfs f207_9_3 -589.04 29.815 0.363
f204_9_5 -582.9 29.699 0.554 f214_9_6 -531.76 27.224 0.636 f266_9_7 -531.7 27.254 0.669 f231_9_8 -656.72 33.085 0.249 f267_9_9 -429.88 21.952 0.458
Mean -575.2 StDev 78.7 SE 27.8

Final Report
Appendix C –
Pressure and Acceleration Magnitude Time Histories for Each Sensor Fish Release

Final Report
C.1
Sensor Fish Weir Passage – Low-Forebay Elevation (616 ft MSL)
Juvenile Pipe

Final Report
C.3

Final Report
C.4

Final Report
C.5

Final Report
C.6

Final Report
C.7

Final Report
C.8

Final Report
C.9

Final Report
C.10

Final Report
C.11
Sensor Fish Weir Passage – Low-Forebay Elevation (616 ft MSL)
Adult Pipe

Final Report
C.13

Final Report
C.15
Sensor Fish Weir Passage – High-Forebay Elevation (634 ft MSL)
Juvenile Pipe

Final Report
C.17

Final Report
C.18

Final Report
C.19

Final Report
C.20

Final Report
C.21

Final Report
C.22

Final Report
C.23

Final Report
C.24

Final Report
C.25

Final Report
C.26

Final Report
C.27
Sensor Fish Weir Passage – High-Forebay Elevation (634 ft MSL)
Adult Pipe

Final Report
C.29

Final Report
C.30

Final Report
C.31
Sensor Fish Turbine Passage – Low-Forebay Elevation (616 ft MSL)
2.8/3.0 MW

Final Report
C.33

Final Report
C.34

Final Report
C.35

Final Report
C.37
Sensor Fish Turbine Passage – Low-Forebay Elevation (616 ft MSL)
4.9/5.0 MW

Final Report
C.39

Final Report
C.40

Final Report
C.41

Final Report
C.42

Final Report
C.43

Final Report
C.45
Sensor Fish Turbine Passage – Low-Forebay Elevation (616 ft MSL)
6.0 MW

Final Report
C.47

Final Report
C.48

Final Report
C.49

Final Report
C.51
Sensor Fish Turbine Passage – Low-Forebay Elevation (616 ft MSL)
7.0 MW
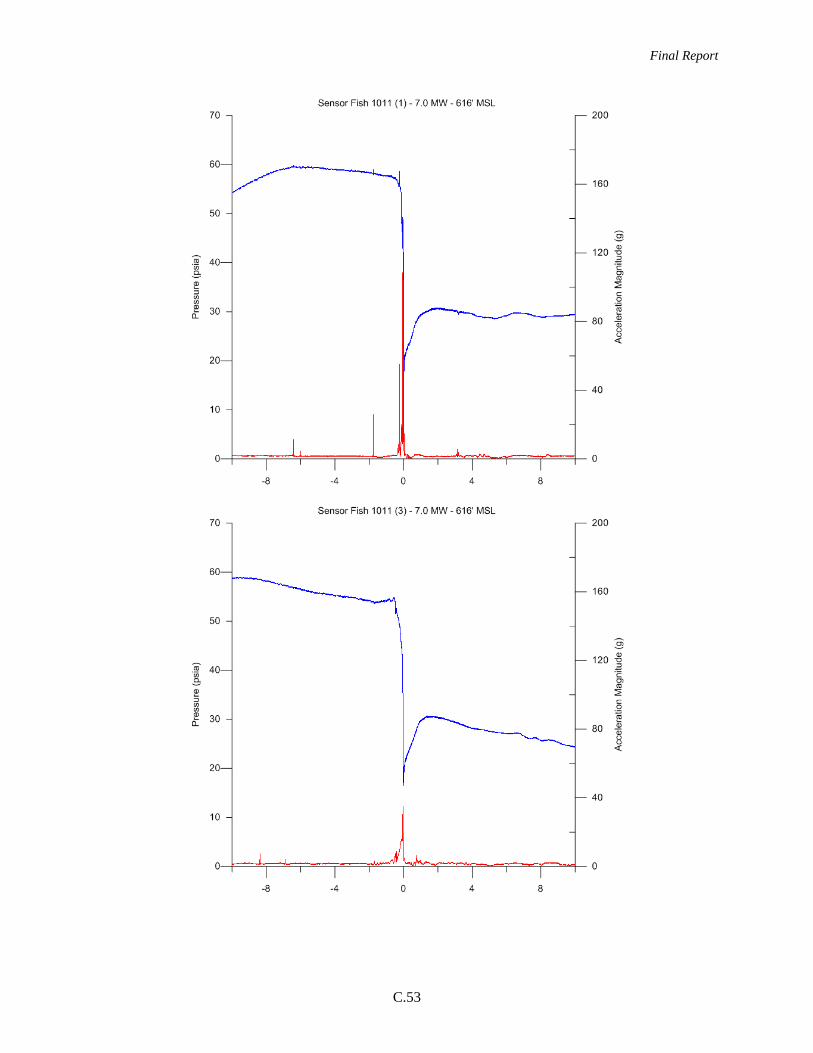
Final Report
C.53

Final Report
C.54

Final Report
C.55

Final Report
C.57
Sensor Fish Turbine Passage – High-Forebay Elevation (634 ft MSL)
4.9/5.0 MW

Final Report
C.59

Final Report
C.60

Final Report
C.61

Final Report
C.62

Final Report
C.63
Sensor Fish Turbine Passage – High-Forebay Elevation (634 ft MSL)
6.5 MW

Final Report
C.65

Final Report
C.66

Final Report
C.67

Final Report
C.68

Final Report
C.69
Sensor Fish Turbine Passage – High-Forebay Elevation (634 ft MSL)
9.0 MW

Final Report
C.71

Final Report
C.72

Final Report
C.73

Final Report
C.74

Final Report
C.75

Appendix D –
Pressure and Angular Rate-of-Change Time Histories of Each Sensor Fish Release

D.1
Sensor Fish Weir Passage – Low-Forebay Elevation (616 ft MSL)
Juvenile Pipe

D.3

D.4

D.5

D.6

D.7

D.8

D.9

D.10

D.11
Sensor Fish Weir Passage – Low-Forebay Elevation (616 ft MSL)
Adult Pipe

D.13

D.15
Sensor Fish Weir Passage – High-Forebay Elevation (634 ft MSL)
Juvenile Pipe

D.17

D.18

D.19

D.20

D.21

D.22

D.23

D.24

D.25
Sensor Fish Weir Passage – High-Forebay Elevation (634 ft MSL)
Adult Pipe

D.27

D.29
Sensor Fish Turbine Passage – Low-Forebay Elevation (616 ft MSL)
2.8/3.0 MW

D.31

D.32

D.33

D.35
Sensor Fish Turbine Passage – Low-Forebay Elevation (616 ft MSL)
4.9/5.0 MW

D.37

D.38

D.39

D.40

D.41

D.43
Sensor Fish Turbine Passage – Low-Forebay Elevation (616 ft MSL)
6.0 MW

D.45

D.46

D.47

D.49
Sensor Fish Turbine Passage – Low-Forebay Elevation (616 ft MSL)
7.0 MW

D.51

D.52

D.53

D.55
Sensor Fish Turbine Passage – High-Forebay Elevation (634 ft MSL)
4.9/5.0 MW

D.57

D.59
Sensor Fish Turbine Passage – High-Forebay Elevation (634 ft MSL)
6.5 MW

D.61

D.63
Sensor Fish Turbine Passage – High-Forebay Elevation (634 ft MSL)
9.0 MW

D.65