Embed Size (px)
Citation preview

The Pennsylvania State University
The Graduate School
The Huck Institute of Life Sciences
CHARACTERIZATION OF FIBRILLIN4 PROTEIN FUNCTION IN
PLANTS
A Dissertation in
Integrative Biosciences
by
Dharmendra Kumar Singh
2011 Dharmendra Kumar Singh
Submitted in Partial Fulfillment
of the Requirements
for the Degree of
Doctor of Philosophy
December 2011

The dissertation of Dharmendra Kumar Singh was reviewed and approved* by the following:
Timothy W. McNellis
Associate Professor of Plant Pathology
Dissertation Co-Advisor
Co-Chair of Committee
Siela N. Maximova
Senior Research Associate and Associate Professor of Horticulture
Dissertation Co-Advisor
Co-Chair of Committee
Seochang Kang
Professor of Plant Pathology
Henry K. Ngugi
Assistant Professor of Plant Pathology
David M. Braun
Associate Professor of Biological Sciences
Peter J. Hudson
Director
Integrative Biosciences Graduate Program
The Huck Institutes of the Life Sciences
*Signatures are on file in the Graduate School

iii
ABSTRACT
Fibrillins are nuclear-encoded, plastid proteins involved in plastoglobule structural
development, chromoplast pigment accumulation, hormonal responses, protection of the
photosynthetic apparatus from photodamage, and plant resistance to a range of biotic and abiotic
stresses. Only two of the 12 sub-families of fibrillins have been characterized genetically or
functionally. This study characterized the fibrillin from sub-family 4, a member of an unstudied
fibrillin protein group. Fibrillin4 (FIB4/FBN4) is found associated with the photosystem II light-
harvesting complex, thylakoids, and plastoglobules, which are chloroplast compartments rich in
lipophilic antioxidants. Plastoglobule osmiophilicity is lower in fib4 knockdown (fib4 KD) apple
tree chloroplasts than in the wild-type. Furthermore, levels of several lipids including
plastoquinone were lower in the plastoglobules from fib4 KD apple trees than in the wild type.
Compared with the wild type, net photosynthetic CO2 fixation in fib4 KD trees was lower at high
light intensity and higher at low light intensity. Apple fib4 KD trees were also more sensitive to
high light intensity, methyl viologen (MV) and had higher superoxide levels during MV
treatment. Arabidopsis fib4 mutants and fib4 KD apples were more susceptible to bacterial
pathogens and were more sensitive to ozone-induced tissue damage. Following ozone stress,
plastoglobule osmiophilicity decreased in wild-type apple and remained low in fib4 KD trees.
FIB4 overexpresser apple plants were more sensitive to ozone, MV, and had fewer osmiophilic
plastoglobules, indicating that excess FBN4 protein might disturb the lipid-protein stoichiometry
of the plastoglobule, resulting in improper localization of plastoglobule osmiophilic lipids,
consequently reducing the plastoglobule‟s osmiophilicity and increasing the plant‟s sensitivity to
oxidative stress. This study suggests that FIB4 is involved in regulating plastoglobule content and
that defective regulation of plastoglobule content leads to broad stress sensitivity and altered
photosynthetic activity.
iv
TABLE OF CONTENTS
List of figures ........................................................................................................................... vii
List of tables ............................................................................................................................. ix
Acknowledgments ................................................................................................................... x
Chapter 1 Fibrillin protein function: the tip of the iceberg? .................................................... 1
Fibrillin history ................................................................................................................ 2 A rose by any other name would smell as sweet ............................................................. 2 A fibrillin family tree ....................................................................................................... 2
Fibrillin gene expression .................................................................................................. 5
Tissue specificity ..................................................................................................... 5
Growth and development ......................................................................................... 5
Hormones ................................................................................................................ 6
Biotic stress ............................................................................................................. 6
Abiotic stress ........................................................................................................... 6
Fibrillin protein localization ............................................................................................. 6
Chromoplasts ........................................................................................................... 6
Chloroplasts ............................................................................................................. 7
Elaioplasts and etioplasts ......................................................................................... 7
Green algal chloroplast eyespot ............................................................................... 7
Fibrillin biological function ............................................................................................. 7
Disease resistance .................................................................................................... 7
Abiotic stress tolerance ............................................................................................ 7
Growth and development ......................................................................................... 9
Hormone signaling .................................................................................................. 9
Fibrillin protein activity ................................................................................................... 9
Conclusion and outlook ................................................................................................... 9
Acknowledgements .......................................................................................................... 10
References ........................................................................................................................ 10
Chapter 2 Fibrillin4 protein function in plastoglobule structure maintenance and
photosynthesis .......................................................................................................................... 12
2.1 Introduction ................................................................................................................ 13
2.2 Materials and Methods ............................................................................................... 15
2.2.1 Plant Material ................................................................................................. 15
2.2.2 RNA Extraction and PCR ............................................................................... 16
2.2.3 Transmission Electron Microscopy ................................................................ 17
2.2.4 Photosynthesis Measurements ........................................................................ 18
2.3 Results........................................................................................................................ 18
2.3.1 Develop FIB4 KD lines in apple trees ............................................................ 18
2.3.2 Plastoglobule Ultrastructure ........................................................................... 20
2.3.3 Photosynthetic CO2 Fixation .......................................................................... 22
2.4 Discussion .................................................................................................................. 25
v
Chapter 3 FIBRILLIN4 Is Required for Stress Resistance in Apple and Arabidopsis ........... 27
3.1 Introduction ................................................................................................................ 28
3.2 Materials and Methods ............................................................................................... 29
3.2.1 Plant Material ................................................................................................. 29
3.2.2 RNA Extraction, DNA Extraction, and PCR. ................................................. 30
3.2.3 Light, O3, and Herbicide Treatments ............................................................. 31
3.2.4 Pigment Analysis. ........................................................................................... 31
3.2.5 Electrolyte Leakage Assays.. .......................................................................... 31
3.2.6 Detection of Superoxide. ................................................................................ 32
3.2.7 Disease Assays ............................................................................................... 32
3.2.8 Transmission Electron Microscopy. ............................................................... 33
3.3 Results ........................................................................................................................ 33
3.3.1 Sensitivity to Increases in Light Intensity. ..................................................... 33
3.3.2 Methyl Viologen Sensitivity. .......................................................................... 36
3.3.3 Susceptibility of Apple to E. amylovora. ........................................................ 38
3.3.4 Pathogenesis- Related (PR) and FIB4 Gene Expression in E. amylovora. .... 39
3.3.5 Susceptibility of Arabidopsis to P. syringae. ................................................. 41
3.3.6 Ozone Sensitivity. ........................................................................................... 44
3.3.7 Plastoglobule Ultrastructure during O3 Stress. .............................................. 47
3.4 Discussion. ................................................................................................................. 51
Chapter 4 FIBRILLIN4 Regulates Plastoquinone Level in Plastoglobules ............................ 56
4.1 Introduction ................................................................................................................ 57
4.2 Materials and Methods ............................................................................................... 59
4.2.1 Plant Material ................................................................................................. 59
4.2.2 Isolation of Intact Chloroplasts and Plastoglobules. ....................................... 59
4.2.3 Transmission Electron Microscopy of Extracted Plastoglobules. .................. 61
4.2.4 Chloroplast Lipid Extraction. ......................................................................... 61
4.2.5 Plastoglobule Lipid Extraction. ...................................................................... 61
4.2.6 Lipid Analysis by LC-MS. ............................................................................. 62
4.2.7 Lipid Characterization by Tandem MS. ......................................................... 62
4.3 Results ........................................................................................................................ 63
4.3.1 Extraction of Chloroplast and Plastoglobule. ................................................. 63
4.3.2 Full-scan LC-MS of Chloroplast and Plastoglobule Lipid Content................ 64
4.3.3 Identification and Comparative Analysis of Plastoquinone ........................... 69
4.3.4 Comparative Analysis of Analyte at m/z 435.36 in. ....................................... 72
4.3.5 Comparative Analysis of Other Analytes in Chloroplast and. ........................ 74
4.4 Discussion. ................................................................................................................. 75
Chapter 5 Characterizing Fibrillin4 Overexpresser Apple and Arabidopsis Plants ................ 80
5.1 Introduction ................................................................................................................ 81
5.2 Materials and Methods ............................................................................................... 83
5.2.1 Plant Material ................................................................................................. 83
5.2.2 RNA Extraction, DNA Extraction, and PCR. ................................................. 84
5.2.3 Transmission Electron Microscopy Analysis. ................................................ 85
5.2.4 O3, and Herbicide Treatments. ........................................................................ 85

vi
5.2.5 Disease Assays. .............................................................................................. 85
5.3 Results ........................................................................................................................ 86
5.3.1 Overexpression of FBN4 Gene in Apple and Arabidopsis. ............................ 86
5.3.2 Susceptibility to Bacterial Pathogens. ............................................................ 88
5.3.3 Sensitivity to Ozone and Methyl Viologen. ................................................... 89
5.3.4 Plastoglobule Ultrastructure. .......................................................................... 91
5.4 Discussion. ................................................................................................................. 92
Chapter 6 Conclusion and future directions ............................................................................ 97
Appendix A Abiotic stress and GA hormone inhibitor induce SAR in apple trees ................ 102
A.1 Introduction ............................................................................................................... 103
A.2 Materials and Methods .............................................................................................. 103
A.2.1 Plant Material ................................................................................................. 103
A.2.2 RNA Extraction and Purification ................................................................. 104
A.2.3 Real- time polymerase chain reaction. ........................................................... 104
A.3 Results ....................................................................................................................... 105
A.4 Discussion. ................................................................................................................ 107
Appendix B Possible function of FBN4 in SNC1, CPN1 regulated defense ......................... 108
B.1 Introduction ............................................................................................................... 109
B.2 Materials and Methods .............................................................................................. 110
B.3 Results and Discussion .............................................................................................. 110
Appendix C Protocols ............................................................................................................. 112
C.1 Relative Ion Leakage ................................................................................................. 113
C.2 Superoxide Quantification ......................................................................................... 113
C.3 Chloroplast Extraction from Apple Leaves ............................................................... 113
C.4 Chloroplast Lipid Extraction ..................................................................................... 114
C.5 Plastoglobule Extraction ............................................................................................ 114
C.6 Plastoglobule Lipid Extraction .................................................................................. 115
C.7 Plastoglobule Protein Quantification ......................................................................... 115
C.8 Transmission Electron Microscopy of Extracted Plastoglobules .............................. 115
References .............................................................................................................................. 116

vii
LIST OF FIGURES
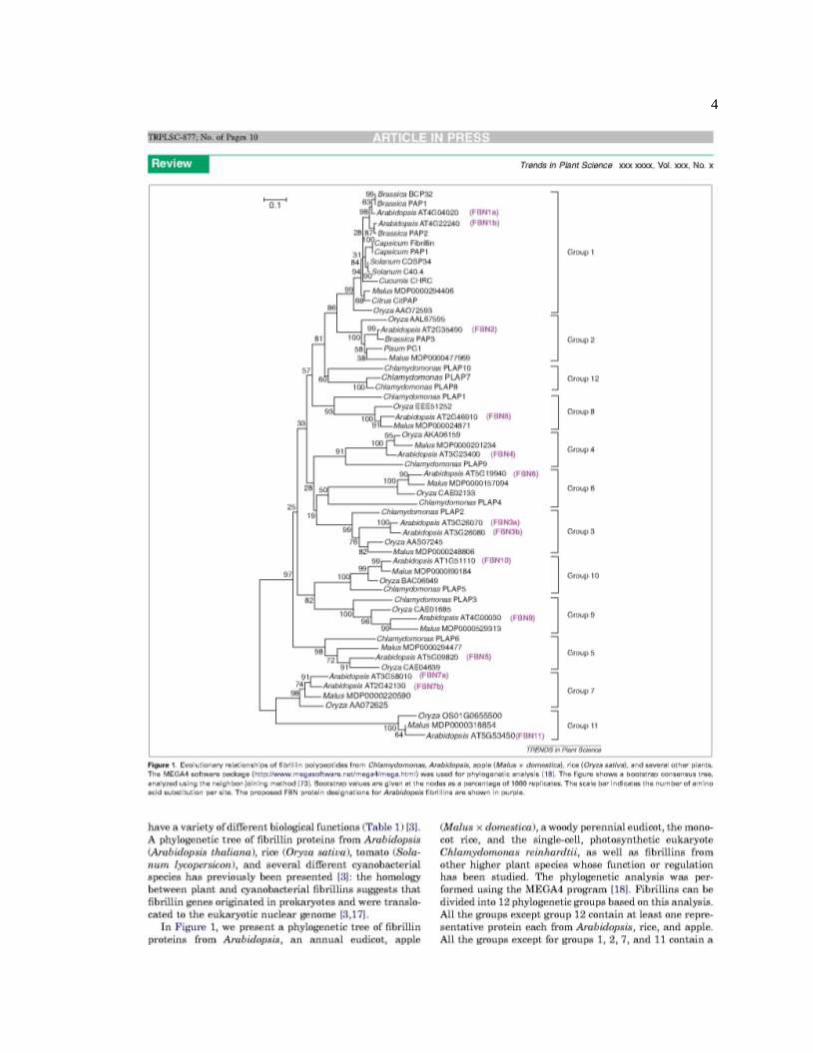
Figure 1: Evolutionary relationships if fibrillin polypeptides. ................................................. 4
Figure 2: Alingments of the 13 Arabidopsis fibrillin protein and FBN4 orthologue. ............ 8
Figure 2-1: Partial alingments of FIB4 from 17 different species. ......................................... 14
Figure 2-2: Development of transgenic apple plants. ............................................................. 15
Figure 2-3: Confirmation of reduced expression of the FIB4 gene in FIB4 KD apple ........... 19
Figure 2-4: Effects of FIB4 knockdown on plastoglobule ultrastructure................................ 21
Figure 2-5: Effects of FIB4 knockdown on apple tree net photosynthetic CO2. .................... 23
Figure 2-6: Internal [CO2] and stomatal conductance of FIB4 KD and WT apple trees. ....... 24
Figure 3-1: Effects of transfer from 90 E m-2 s-1 PAR to 600 E m-2 s-1 PAR for 6 d. ......... 34
Figure 3-2: Effects of FIB4 knockdown on apple tree leaf major pigment levels. .................. 35
Figure 3-3: Knockdown of FIB4 increases apple sensitivity to MV. ..................................... 37
Figure 3-4: Knockdown of FIB4 causes increased susceptibility to bacterial pathogens ....... 39
Figure 3-5: Expression of Pathogenesis Related (PR) genes was induced. ............................ 40
Figure 3-6: Expression of FIB4 in apple leaf infected with E. amylovora. ............................ 40
Figure 3-7: Confirmation of T-DNA insertion in the Arabidopsis FIB4 gene. ....................... 42
Figure 3-8: Mutation of FIB4 causes increased susceptibility to bacterial pathogen ............. 44
Figure 3-9: Knockdown and mutation of FIB4 increases sensitivity to O3. ........................... 45
Figure 3-10: The FIB4-2 is more sensitive to ozone than wild-type Col-0 plants. ................. 47
Figure 3-11: Plastoglobule ultrastructure changes in wild-type and FIB4 KD. ...................... 49
Figure 3-12: Model of FIB4 function. .................................................................................... 55
Figure 4-1: Schematic representation of chloroplast and plastoglobule purification. ............. 60
Figure 4-2: Transmission electron micrographs of extracted plastoglobules of WT. ............. 64

viii
Figure 4-3: Positive ionization Liquid chromatography–mass spectrometry ........................ 65
Figure 4-4: Full-scan LC-MS spectra of plastoglobule and chloroplast extracts. ................... 68
Figure 4-5: Comparative analysis and characterization of plastoquinone in. ......................... 71
Figure 4-6: Comparative analysis and characterization of analyte at m/z 435.36 in. .............. 73
Figure 4-7: Comparative analysis of analyte at m/z 509.9 in chloroplast and. ....................... 74
Figure 5-1: Confirmation of higher expression of the FBN4 gene in. .................................... 87
Figure 5-2: FBN4 overexpresser and wild-type plants have susceptibility to bacterial. ......... 88
Figure 5-3: Overexpression of FBN4 increases sensitivity to O3 in apple. ............................. 90
Figure 5-4: Overexpression of FBN4 increases apple sensitivity to MV. ............................... 91
Figure 5-5: Effects of FBN4 overexpression on plastoglobule ultrastructure. ........................ 92
Figure 5-6: Dual Function of Fibrillin4. ................................................................................. 95
Figure 6-1: Alignment of FBN4 proteins from 5 different plant species, including. .............. 99
Figure A-1: Transcript level of PR genes of apple trees treated with actigard. ...................... 107
ix
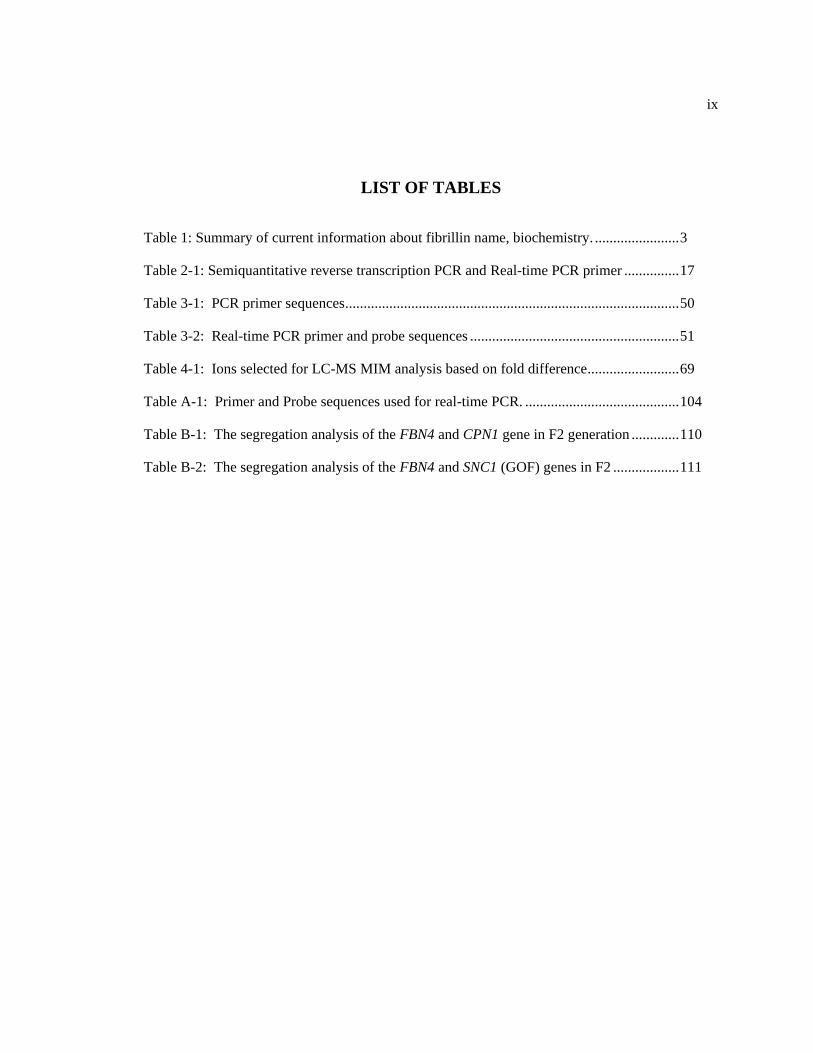
LIST OF TABLES
Table 1: Summary of current information about fibrillin name, biochemistry. ....................... 3
Table 2-1: Semiquantitative reverse transcription PCR and Real-time PCR primer ............... 17
Table 3-1: PCR primer sequences ........................................................................................... 50
Table 3-2: Real-time PCR primer and probe sequences ......................................................... 51
Table 4-1: Ions selected for LC-MS MIM analysis based on fold difference ......................... 69
Table A-1: Primer and Probe sequences used for real-time PCR. .......................................... 104
Table B-1: The segregation analysis of the FBN4 and CPN1 gene in F2 generation ............. 110
Table B-2: The segregation analysis of the FBN4 and SNC1 (GOF) genes in F2 .................. 111

x
ACKNOWLEDGEMENTS
I would like to express my sincere gratitude to my thesis adviser, Dr. Timothy W.
McNellis, and thesis co-adviser, Dr. Siela Maximova, for their constant guidance,
encouragement, financial support, and the freedom they allowed to conduct research during
graduate study. I sincerely thank all my thesis committee members, Dr. Seochang Kang, Dr.
Henry Ngugi, and Dr. David Braun, for valuable discussion and suggestions on my research
project and critical reading of my thesis.
My special thanks to all my former and current lab members, Dr. Tzuu-fen Lee, Judy
Sinn, Steven Lee, Laura Ramos-Sepulveda, and Dr. Philip Jensen, for constructive discussion
during lab meetings and in lab, and for making the lab environment friendly and cheerful. I am
grateful to Judy Sinn for critically reading several of my conference abstracts and manuscripts,
and making valuable suggestions.
I sincerely appreciate the help of undergraduate students Ruby Pandit, Abby Dolinger,
and Sherry Coven, who maintained plants in the growth chamber over the course of my graduate
study in Dr. McNellis‟s lab. I am very thankful to Sharon Pishak, a senior technician in Dr. Mark
Guiltinan‟s and Dr. Siela Maximova‟s lab, for teaching me apple tissue culture and helping me
maintain plants in tissue culture.
I would like to thank Ruth Haldeman, Missy Hazen, and Greg Ning of the Pennsylvania
State University Electron Microscopy Facility at University Park for providing training and
support needed to use the transmission electron microscope. I am thankful to Dr. Deb Grove and
the staff of the Nucleic Acid Facility at University Park for help with real-time PCR and
sequencing. I am grateful to Dr. Tatiana Laremore and Dr. Philip B. Smith of the Proteomics and

xi
Mass Spectrometry Core Facility at University Park for analyzing lipids. I thank Dr. Kajetan
Vogl, Dr. Donald Bryant, Nancy Wenner, and Dr. Gretchen Kuldau for their help with HPLC.
I would like to express my deepest graduate to my parents and family for providing me
with motivation and unconditional love. I wish to express my sincere appreciation to my wife for
being caring and understanding. My parents and brothers gave me the best education and
encouraged me to face challenges, which was instrumental in completing my Ph.D.

1
Chapter 1
Introduction about Fibrillin proteins
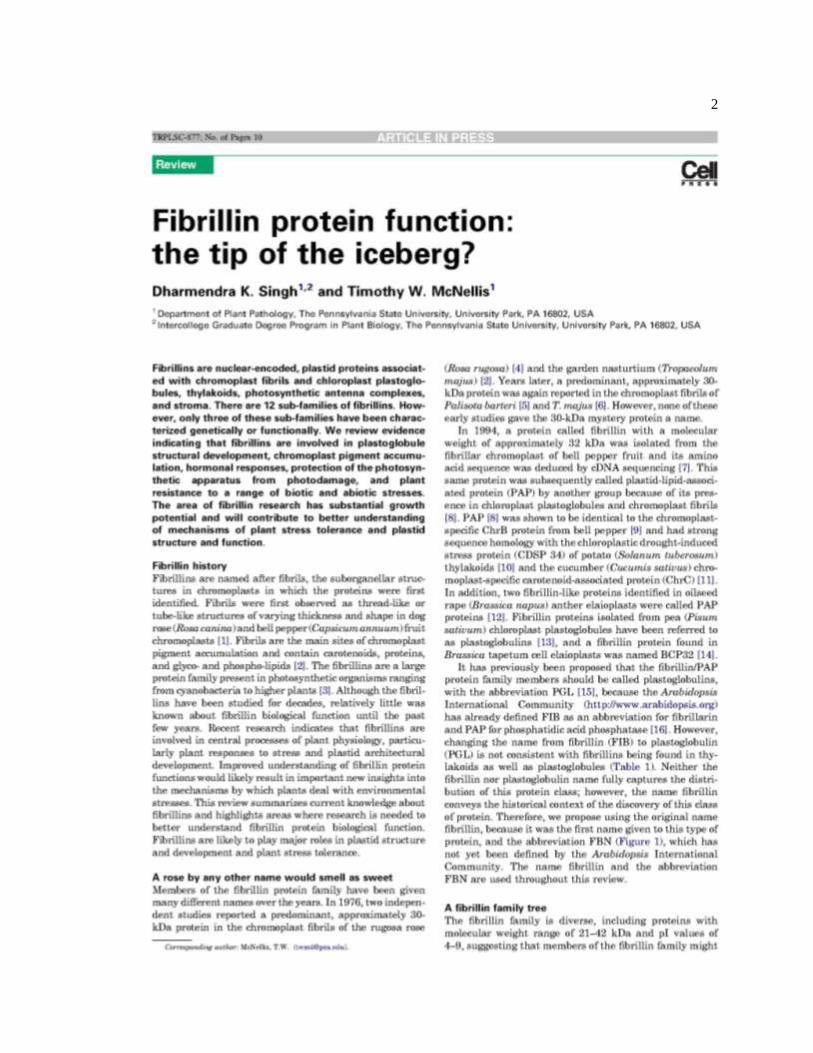
Chapter 1 was published in Trends in Plant Sciences (Singh and McNellis, 2011). The paper is
copied in this Ph.D. dissertation.
2

3
4

5
6
7

8

9

10
11
12
Chapter 2
Fibrillin4 protein function in plastoglobule structure maintenance and
photosynthesis
Note that this was published in part in Singh et al., 2010.

13
2.1 Introduction
Plastoglobules are plastid lipoprotein bodies defined by a single membrane leaflet and
attached to the thylakoids (Austin et al., 2006). Plastoglobules contain at least 34 proteins,
including structural proteins such as fibrillins (Vidi et al., 2006; Ytterberg et al., 2006) and
enzymes such as tocopherol cyclase (Austin et al., 2006). The major lipid contents of
plastoglobules are plastoquinones, plastohydroquinones, tocopherols and triacylglycerides
(Steinmüller and Tevini, 1985; Tevini and Steinmüller, 1985). The osmiophilicity of
plastoglobules is known to change with alteration of their lipid composition (Dahlin and Ryberg,
1986; Kivimaenpaa et al., 2003).
Fibrillins are ubiquitous proteins present from cyanobacteria to plants (Laizet et al.,
2004). Fibrillins maintain plastoglobule structural integrity (Deruère et al., 1994; Pozueta-Romero
et al., 1997; Langenkämper et al., 2001; Vidi et al., 2006; Bréhélin et al., 2007) and stabilize the
photosynthetic apparatus during photooxidative stress (Gillet et al., 1998; Yang et al., 2006;
Youssef et al., 2010), osmotic stress (Gillet et al., 1998), drought (Pruvot et al., 1996; Rey et al.,
2000), and low temperature (Rorat et al., 2001). Fibrillins are involved in abscisic acid-mediated
protection from photoinhibition (Yang et al., 2006), and a subfamily of Arabidopsis fibrillins
(FIB1a, -1b, and -2) conditions jasmonate production during low-temperature, photooxidative
stress (Youssef et al., 2010).
The Arabidopsis fibrillin4 encoded by At3g23400 has received various appellations,
including FIBRILLIN4 (FIB4; Laizet et al., 2004), Harpin-Binding Protein1 (Song et al., 2002),
AtPGL 30.4 (Vidi et al., 2006), and Fibrillin6 (Galetskiy et al., 2008); here, it will be referred to
by its earliest published name, FIB4. FIB4 is found associated with the PSII light-harvesting
complex (Galetskiy et al., 2008). FIB4 has also been detected in plastoglobules (Vidi et al., 2006;
Ytterberg et al., 2006) and thylakoids (Friso et al., 2004; Peltier et al., 2004). The specific
14
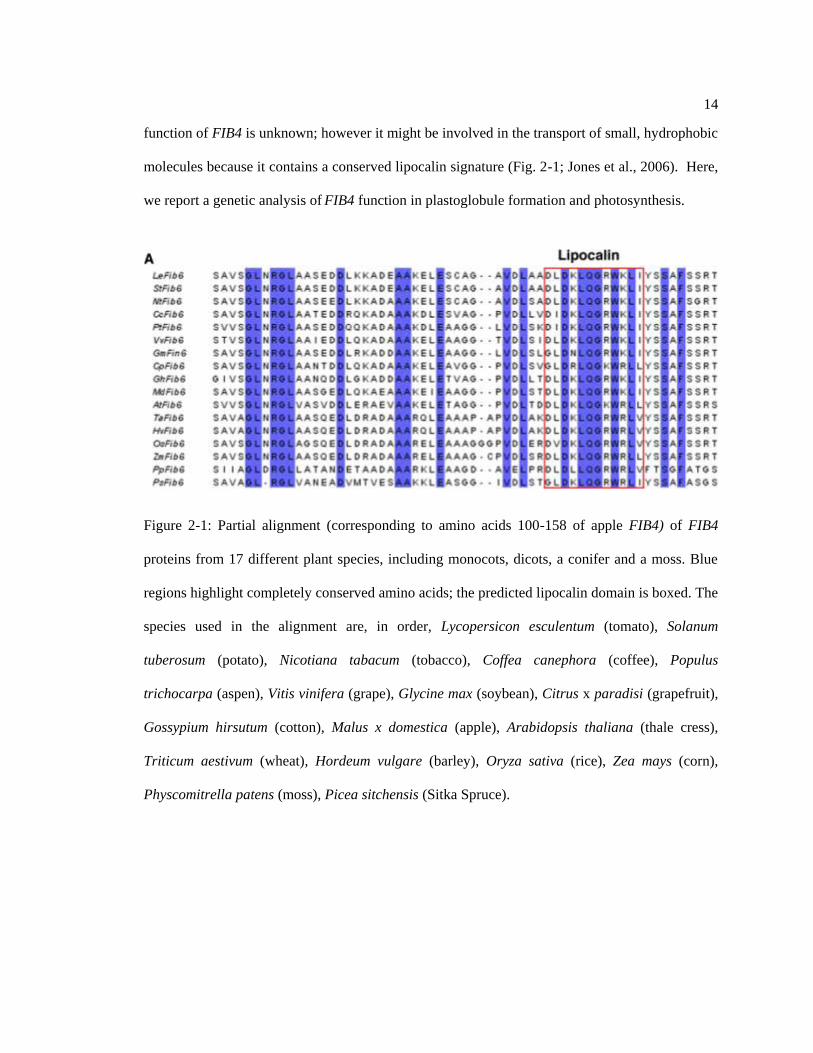
function of FIB4 is unknown; however it might be involved in the transport of small, hydrophobic
molecules because it contains a conserved lipocalin signature (Fig. 2-1; Jones et al., 2006). Here,
we report a genetic analysis of FIB4 function in plastoglobule formation and photosynthesis.
Figure 2-1: Partial alignment (corresponding to amino acids 100-158 of apple FIB4) of FIB4
proteins from 17 different plant species, including monocots, dicots, a conifer and a moss. Blue
regions highlight completely conserved amino acids; the predicted lipocalin domain is boxed. The
species used in the alignment are, in order, Lycopersicon esculentum (tomato), Solanum
tuberosum (potato), Nicotiana tabacum (tobacco), Coffea canephora (coffee), Populus
trichocarpa (aspen), Vitis vinifera (grape), Glycine max (soybean), Citrus x paradisi (grapefruit),
Gossypium hirsutum (cotton), Malus x domestica (apple), Arabidopsis thaliana (thale cress),
Triticum aestivum (wheat), Hordeum vulgare (barley), Oryza sativa (rice), Zea mays (corn),
Physcomitrella patens (moss), Picea sitchensis (Sitka Spruce).

15
2.2 Materials and Methods
2.2.1 Plant Material
Transgenic RNAi and control pGH00.0131-EGFP expressing apple (Malus X domestica)
plants were generated as described previously (Fig. 2-2; Maximova et al., 1998). For details of
vector construction and transformation to generate FIB4 KD apple plants, see Supplemental
Figure S1 and its legend in Singh et al., 2010. In vitro rooted apple plants were transferred to
potting mix (Redi-Earth; Sungro horticulture) and acclimated in a growth chamber under the same
environmental conditions as described for Arabidopsis (Jambunathan et al., 2001).
Figure 2-2: Development of transgenic apple plants. Detailed protocol to develop transgenic
apple plant is described by Maximova et al., (1998). In brief, the apple leaves were infected with
Agrobacterium tumefaciens carrying the desired sequence, enhanced GFP transformation marker
16
(EGFP), and a kanamycin resistance gene. Plasmid used for apple transformation is described in
Singh et al., (2010). The transformed primordia were selected based on growth on kanamycin
containing media and EGFP fluorescence. Selected primordia were allowed to grow in the dark
for couple of weeks to develop shoots then transferred to light. The plantlets were then transferred
to shooting media for shoot development. Individual shoots were transferred to rooting media for
root development. The rooted plants were transferred in to the potting mix and acclimatized to
condition in growth chamber. Experiments were conducted using growth chamber acclimatized
plants.
2.2.2 RNA Extraction and PCR
Total RNA from apple leaves was isolated using an established protocol (Jensen et al.,
2010). Conventional reverse transcription-PCR was performed as described previously (Liu et al.,
2005; for primers, see Table 2-1). Quantitative real-time PCR analyses were performed at the
Pennsylvania State University Genomics Core Facility as described previously (Jensen et al.,
2010; for primers and probes, see Table 2-1.

17
Table 2-1: Semiquantitative reverse transcription PCR and Real-time PCR primer and probe
sequences.
Target Gene Accession
Number
(Gene Bank,
NCBI)
Gene Function
or Experiment
Description
Primer and Probe Sequences Produ
ct Size
(bp)
EGFP - Label - Forward: 5-ccaggagcgcaccatcttct -3
Reverse: 5-ctcgtccatgccgagagtga
-3
426
FIB4 (apple) AY383624 FIB4 Forward: 5- ggacgaggtttctgttctcg -3
Reverse: 5- gcggatatcagcatcaaggt
-3
637
FIB4
(Apple)
AY383624 FIB4 Forward: 5-ctaagttaccggaaggactacga
-3
Reverse: 5-ttgacgttacctaccttgatgctg-
3
Probe: 5ctccgtctaacccaggaagtggtgaa
-3
2.2.3 Transmission Electron Microscopy
For the TEM experiments, leaf discs were collected from fully expanded leaves of 4- to
5-month-old apple plants acclimated in the growth chamber with 90 µE m–2 s–1 light intensity and
a 12-h photoperiod. Tissues were fixed with glutaraldehyde in HEPES buffer, postfixed in OsO4
in the same buffer, and embedded in Spurr‟s resin, according to the method of Owen and
Makaroff (1995), essentially as described by Li et al. (2004). Ultrathin sections (80 nm thick)
were cut using a Reichart-Jung Ultracut E Microtome and stained with uranyl acetate and lead
citrate. Observations of chloroplasts were made with a JEOL 1200 EX II transmission electron
microscope fitted with a high-resolution Tietz F224 digital camera. Chloroplast areas were
measured using ImageJ software (http://rsbweb.nih.gov/ij/). Plastoglobules were counted
independently by two people, and one count was done as a blind experiment.
18
2.2.4 Photosynthesis Measurements
Photosynthesis measurements were carried out on potted FIB4 KD and wild-type trees
maintained at 22°C ± 3°C in a greenhouse. The second, third, and fourth fully expanded leaves on
each of five replicate trees were used for measurements, and the readings were repeated three
times for each of the experiments. Measurements were taken on the center of each leaf. For both
light intensity and intercellular [CO2] experiments, measurements were taken on consecutive days
between 10:00 AM and 2:00 PM on each day. Gas-exchange measurements were taken with a
CIRAS-I infrared gas analyzer equipped with a 2.5-cm2 Parkinson (PLC 6U) leaf cuvette with
light-emitting diode lights (PP Systems). Light at the indicated intensity was applied to the leaves,
and net CO2 assimilation, stomatal conductance, and intercellular [CO2] were measured.
2.3 Results
2.3.1 Develop FIB4 KD lines in Apple Trees
RNA interference technology was used to develop apple FIB4 KD trees (Singh et al.,
2010). Transgenic, vector-only control (VC) plants carrying the transformation marker genes
Neomycin Phosphotransferase II and Enhanced Green Fluorescent Protein (EGFP), but not the
FIB4 RNAi cassette were also generated. Expression of EGFP in VC and FIB4 KD apple plants
suggests successful transformation (Fig. 2-3A). The level of FIB4 transcript in FIB4 KD plantlets
was less than 10% of the wild-type level, indicating successful silencing (Fig. 2-3B). Wild-type,
VC, and FIB4 KD apple trees were phenotypically indistinguishable when grown under normal
laboratory conditions (Fig. 2-3C).

19
Figure 2-3: Confirmation of reduced expression of the FIB4 gene in FIB4 KD apple trees and
phenotype of wild-type and transgenic trees. A, EGFP and 18S transcript accumulation was
assayed in untransformed wild-type (WT) „Royal Gala‟, transgenic vector control (VC), and three
independent FIB4 KD lines using conventional reverse-transcription PCR. Two independent
reactions were performed with RNA samples from two trees of each plant type. The EGFP
transformation marker gene was expressed in VC and FIB4 KD apple trees but not in
untransformed WT trees. EGFP, enhanced GFP transformation marker; 18S, 18S rRNA control
reaction. B, Expression of FIB4 in WT, VC and FIB4 KD trees was analyzed using quantitative
real-time PCR with gene-specific TagMan primers and probes (Table 2-1). C, WT, VC, and

20
FIB4 KD apple trees were phenotypically indistinguishable. Representative plants were
photographed at two months after transfer from tissue culture media to soil.
2.3.2 Plastoglobule Ultrastructure
Since FIB4 is a component of the plastoglobule and is associated with the PSII light-
harvesting complex, we investigated the effects of knockdown of FIB4 expression on chloroplast
and plastoglobule ultrastructure in apple. Leaf sections from FIB4 KD and wild-type apple trees
were stained with osmium tetroxide (OsO4) and observed by transmission electron microscopy
(TEM). Overall, chloroplast morphology appeared normal in FIB4 KD palisade mesophyll cells
(Fig. 2-4A). Strikingly, however, FIB4 KD chloroplasts contained almost exclusively electron-
transparent (nonosmiophilic, or white) plastoglobules, while wild-type chloroplasts contained
many electron-opaque (osmiophilic, or black) plastoglobules (Figure 2-4, A and B).
Plastoglobules are thought to be osmiophilic because the unsaturated lipids they contain reduce
OsO4 (Padham et al., 2007). There were more white plastoglobules in FIB4 KD chloroplasts than
wild-type chloroplasts, although the difference was not statistically significant (Figure 2-4B). The
total number of plastoglobules (electron transparent + electron opaque) was similar in FIB4 KD
and wild-type chloroplasts (Figure 2-4C). Peripheral vesicles were similar in number in FIB4 KD
and wild-type chloroplasts (Figure 2-4D). The peripheral vesicles were electron transparent,
irregularly shaped, located adjacent to the chloroplast inner envelope membrane, and clearly
distinguishable from the round, white plastoglobules (Fig. 2-4E). Black plastoglobules had
varying patterns of electron opacity ranging from partially to fully electron opaque (Fig. 2-4, A, F,
and G). Black and white plastoglobules were often observed in the same chloroplast, sometimes
in juxtaposition (Fig. 2-4H).
21
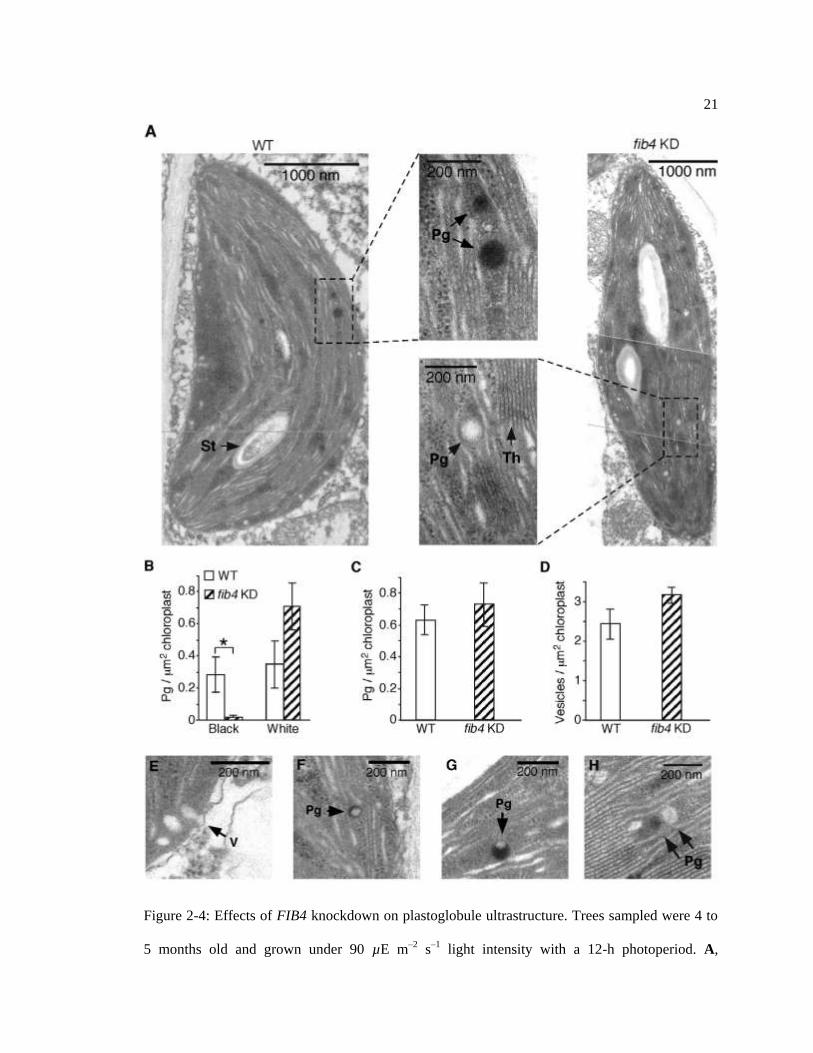
Figure 2-4: Effects of FIB4 knockdown on plastoglobule ultrastructure. Trees sampled were 4 to
5 months old and grown under 90 µE m–2 s–1 light intensity with a 12-h photoperiod. A,
22
Transmission electron micrographs of representative wild-type (WT) and FIB4 KD palisade
mesophyll cell chloroplasts stained with OsO4. Pg, Plastoglobule; St, starch body; Th, thylakoid
membrane. For B, C, and D, 80 chloroplasts from six leaves (two leaves from each of three
plants) were observed for each genotype; data are means ± SE; * P < 0.05 using Student‟s t test.
B, Wild-type chloroplasts had more electron-opaque (black) plastoglobules than FIB4 KD
chloroplasts; the numbers of electron-transparent (white) plastoglobules were not significantly
different between wild-type and FIB4 KD chloroplasts. Partially and completely black
plastoglobules were counted as electron opaque; plastoglobules scored as electron transparent had
no electron-opaque sectors. C, Wild-type and FIB4 KD chloroplasts had similar total numbers of
plastoglobules (electron opaque + electron transparent). D, Wild-type and FIB4 KD chloroplasts
had similar numbers of peripheral vesicles. E, Transmission electron micrograph of peripheral
vesicles (V). F, Electron-opaque plastoglobule in a wild-type chloroplast with less than 50% of its
area appearing black. G, Electron-opaque plastoglobule in a wild-type chloroplast with more than
50% of its area appearing black. H, Adjacent electron-opaque and electron-transparent
plastoglobules in a FIB4 KD chloroplast.
2.3.3 Photosynthetic CO2 Fixation
Since FIB4 KD apple tree plastoglobules exhibited altered ultrastructure, we decided to
determine whether knockdown of FIB4 affected photosynthesis rates. Net photosynthetic CO2
assimilation rates in wild-type and FIB4 KD apple trees were compared under various levels of
incident photosynthetically active radiation (PAR; Fig. 2-5). At midrange levels of PAR (300 and
600 µE m–2 s–1), no significant differences were detected between the net CO2 fixation rates of
wild-type and FIB4 KD trees. Under high levels of PAR (1,000 µE m–2 s–1), however, wild-type
trees had a significantly higher net CO2 fixation rate than FIB4 KD trees. Surprisingly, under low

23
levels of PAR (100 µE m–2 s–1), the situation was reversed, with FIB4 KD trees having a
significantly higher net CO2 fixation rate than wild-type trees. No significant differences in
stomatal conductance were observed between wild-type and FIB4 KD trees; however, differences
in internal [CO2] consistent with differences in net CO2 assimilation rates were observed in FIB4
KD compared with wild-type trees (Fig. 2-6).
Figure 2-5: Effects of FIB4 knockdown on apple tree net photosynthetic CO2 assimilation rates.
Net CO2 assimilation rates (µmol CO2 m–2 s–1) in wild-type (WT) and FIB4 KD apple tree leaves
at various levels of PAR are shown. For each genotype, measurements were taken from three
leaves from each of five plants growing in a greenhouse with natural photoperiod and light
intensity. Data are means ± SE; * P < 0.05 using Student‟s t test.

24
Figure 2-6: Internal [CO2] and stomatal conductance of FIB4 KD and wild-type (WT) apple
trees. Exposure to higher photosynthetically active radiation (PAR) caused reduction of internal
[CO2] and stomatal conductance (Gs) in both FIB4 KD and WT. At 100 µE·m-2·s-1 PAR, internal
[CO2] was slightly, but significantly, lower in FIB4 KD than WT; in contrast, at 1000 µE·m-2·s-1
PAR, internal [CO2] was significantly higher in FIB4 KD than WT. No significant differences in
stomatal conductance were observed between FIB4 KD and WT at any level of PAR tested.
Graphs are from one representative experiment. The experiment was repeated twice with similar
results. For each experiment, three leaves from each of five trees were used to measure internal
25
[CO2] and stomatal conductance. Data are means SEM of 15 replicate leaves; asterisk, p < 0.05
using Student‟s t-test.
2.4 Discussion
This study indicates that FIB4 is involved in plastoglobule development. While FIB4
does not appear to be required for the production of plastoglobules, the dramatic decrease in
plastoglobule osmiophilicity in FIB4 KD apple tree leaf chloroplasts compared with the wild-type
under benign conditions suggests that FIB4 is required for the development of plastoglobule
osmiophilic content. The reactivity of osmium oxides with certain biological materials was noted
upon the discovery of osmium (Tennant, 1804). Some major plastoglobule constituents such as
plastoquinone, carotenoids (Bahr, 1954), and triacylglycerides are expected to contribute to
plastoglobule osmiophilicity because their ethylenic double bonds reduce OsO4, probably
producing stable diester adducts (Wigglesworth, 1957) that scatter electrons due to the high mass
density and atomic number of osmium (Valentine, 1958). In addition, the reducing power of
tocopherols and plastoquinone may contribute to plastoglobule osmiophilicity (Dahlin and
Ryberg, 1986). Under mild conditions, FIB4 appears to play a role in the accumulation of
osmiophilic material within plastoglobules. However, FIB4 cannot be the sole factor required for
plastoglobule osmiophilicity, since osmiophilic plastoglobules were observed in FIB4 KD trees,
albeit much fewer than in wild-type apples.
The presence of FIB4 in the plastoglobule, the PSII light-harvesting complex, and the
thylakoid membrane system, coupled with the presence of a conserved lipocalin signature in FIB4
(Jones et al., 2006), presents a possible mechanism for FIB4 function in plastoglobule
development and oxidative stress. Based on its structural similarity to lipocalins (for review, see
Flower et al., 2000), FIB4 might be hypothesized to interact with one or more plastoglobule lipid
26
components, helping to transport lipophilic antioxidants in and out of the plastoglobule. In
addition, FIB4 could be involved in the delivery of lipophilic antioxidants to particular locations
within the photosynthetic membrane system, such as the PSII light-harvesting complex. Increased
photoinhibition in fib4 KD apple leaves compared with the wild type at high light intensity
suggests a reduced ability to control photooxidative damage of the photosynthetic system in fib4
KD trees. When the amount of FIB4 is greatly reduced, such as in the fib4 KD apple trees, then
lipophilic antioxidants may not be properly loaded into plastoglobules under benign conditions
and may not be dispensed from plastoglobules to locations where they are needed during stress.
This hypothesis would explain the increased sensitivity to high-light intensity photoinhibition and
the alterations in plastoglobule osmiophilicity observed in the fib4 KD apple trees.

27
Chapter 3
FIBRILLIN4 Is Required for Stress Resistance in Apple and Arabidopsis
Note that this was published in part in Singh et al., 2010.

28
3.1 Introduction
Increased production of reactive oxygen species (ROS) is among the first biochemical
responses of plants when challenged by pathogens and harsh environmental conditions (Mehdy,
1994; Lamb and Dixon, 1997; Joo et al., 2005). ROS are implicated in tissue damage during
environmental stress and in the promotion of disease development by necrotrophic and
hemibiotrophic pathogens (Venisse et al., 2001; Apel and Hirt, 2004; Shetty et al., 2008). For
example, ROS production is critical for host colonization and pathogenesis by the bacterium
Erwinia amylovora, which causes fire blight disease in rosaceous plants such as apple (Malus X
domestica) and pear (Pyrus communis; Venisse et al., 2001).
The chloroplast is a site of ROS production during biotic and abiotic stress (Joo et al.,
2005; Liu et al., 2007). The chloroplast has a battery of enzymes such as superoxide dismutase
and ascorbate peroxidase, and antioxidants such as ascorbate, glutathione, and tocopherols, for
protection against ROS (Noctor and Foyer, 1998; Asada, 2006). Plastoglobules are lipoprotein
bodies attached to the thylakoids (Austin et al., 2006) that store lipids, including antioxidants
such as tocopherols, carotenes, and plastoquinones (Steinmuller and Tevini, 1985; Tevini and
Steinmuller, 1985; Kruk et al., 2005; Munné-Bosch, 2005; Kruk and Trebst, 2008; Semchuk et
al., 2009). In addition to antioxidants, plastoglobules contain tocopherol cyclase, which is
involved in γ-tocopherol synthesis (Austin et al., 2006; Vidi et al., 2006). The antioxidant content
of plastoglobules and their apparent involvement in tocopherol biosynthesis imply that they could
play a role in plant responses to oxidative stress. Furthermore, plastoglobules increase in size and
number during biotic and abiotic stresses that trigger chloroplast oxidative stress (Sam et al.,
2003; Hernández et al., 2004; Ljubešić and Britvec, 2006). Increased plastoglobule number in
tomato has been associated with drought tolerance and growth under high light intensity (Rey et
al., 2000). Non-osmiophilic plastoglobules were observed in radish plants following ozone

29
exposure, which could result from unsaturated lipid peroxidation (Miyake et al., 1989) and/or the
export of osmiophilic antioxidants from plastoglobules. These results suggest that plastoglobules
are involved in plant stress resistance, possibly by enhancing their ROS scavenging ability.
Fibrillins maintain plastoglobule structural integrity (Brehelin et al., 2007), composition
(Singh et al., 2010), and stabilize the photosynthetic apparatus during intense light (Yang et al.,
2006). Arabidopsis plants lacking fibrillin (At4g22240) and tomato (Solanum lycopersicum)
plants with suppressed expression of a fibrillin (LeCHRC) are susceptible to Pseudomonas
syringae and Botrytis cinerea, respectively (Cooper et al., 2003; Leitner-Dagan et al., 2006),
indicating that fibrillins play a role in disease resistance.
Several lines of evidence suggest that FIB4 may be involved in plant disease resistance
responses: pathogen-associated molecular patterns trigger its phosphorylation (Jones et al., 2006);
pathogen-associated molecular patterns stimulate the expression of its ortholog in tobacco
(Nicotiana tabacum; Jones et al., 2006; Sanabria and Dubery, 2006); and it can physically interact
with the HrpN (harpin) virulence protein of the fire blight pathogen E. amylovora in a yeast two
hybrid assay, suggesting that it could be a receptor or target of HrpN (Song et al., 2002). Here, we
investigated FIB4 role in plant resistance to biotic and abiotic stresses using FIB4 knock-down
(fib4 KD) apple and fib4 mutant Arabidopsis plants.
3.2 Materials and Methods
3.2.1 Plant Material
Arabidopsis (Arabidopsis thaliana) plants were grown as described previously
(Jambunathan et al., 2001). Arabidopsis T-DNA insertion mutants were obtained from the
Arabidopsis Biological Resource Center, a publicly accessible collection of T-DNA insertion
lines (http://www.biosci.ohio-state.edu/ pcmb/Facilities/abrc/abrchome.htm; Alonso et al., 2003).
30
Transgenic RNAi and control pGH00.0131-EGFP expressing apple (Malus x domestica) plants
were generated as described previously (Maximova et al., 1998). For details of vector
construction and transformation to generate FIB4 KD apple plants, see Supplemental Figure S1
and its legend of Singh et al., (2010). In vitro rooted apple plants were transferred to potting mix
(Redi-Earth) and acclimated in a growth chamber under the same environmental conditions as
described for Arabidopsis (Jambunathan et al., 2001).
3.2.2 RNA Extraction, DNA Extraction, and PCR.
Total RNA from apple leaves was isolated using an established protocol (Jensen et al.,
2010). Total RNA from Arabidopsis leaves was isolated as described previously (Jambunathan et
al., 2001). DNA was eliminated from RNA samples using the DNA-Free kit (Ambion).
Conventional reverse transcription-PCR was performed as described previously (Liu et al., 2005;
for primers, see Table 3-1). Quantitative real-time PCR analyses were performed at the
Pennsylvania State University Genomics Core Facility as described previously (Jensen et al.,
2010). For PR gene expression analyses, apple inoculations with Erwinia amylovora and tissue
collection were done as described by Norelli et al. (2009) using gene-specific primers for each PR
gene (for primers, see Table 3-2). Expression of PR genes in WT and FIB4 KD at 0 h and 48 h
after inoculating leaves by cutting across the midvein with a scissors dipped into a 0.2 OD600nm
suspension of E. amylovora strain Ea581. Tissues with actively progressing infections were
excised as described by Norelli et al., 2009. Quantitative real-time polymerase chain reaction
was performed using primers and probes specific to three apple PR genes: PR2, PR8, and PR10
(see Table 3-2 for primers and probes). The expression of FIB4 was analyzed in the E.
amylovora infected leafs (see Table 3-1 for primers). Genomic DNA was isolated from young
leaves using standard methods (Kasajima et al., 2004). PCR was performed using the Advantage
31
2 PCR enzyme system kit according to the manufacturer‟s instructions (Clontech). The LBb1.3
primer sequence was obtained from http://signal.salk.edu/tdnaprimers.html.
3.2.3 Light, O3, and Herbicide Treatments
Ozone (O3) treatments were performed in a tissue culture chamber (model CU-32L;
Percival Scientific) attached to an O3 generator (model 2000; Jelight Company) and an O3
monitor (model 450; Advanced Pollution Instrumentation). High-light treatment consisted of
exposure to 600 µE m-2 s-1 for 6 d at 21ºC with a 12-h photoperiod and 35% to 45% relative
humidity. For herbicide treatments, apple tree leaf discs were cut with a 1-cm-diameter cork borer
and floated on 20 mL of water or 0.5 mM methyl viologen (MV; Sigma) in a petri dish for 24 h.
Fifteen leaf discs representing two individual plants (seven or eight discs per plant) were used per
sample, and six biological replicates were done for each plant genotype for each treatment.
3.2.4 Pigment Analysis
Anthocyanins, carotenoids, chlorophyll a, and chlorophyll b were extracted from leaves and
measured as described by Sims and Gamon (2002).
3.2.5 Electrolyte Leakage Assays
For the MV experiments, the conductivity of the MV treatment and control solutions (in
µS cm-1) was measured at 24 h after the beginning of the experiment using a Corning 316
conductivity meter and divided by the leaf area used in the sample (in m2). Relative ion leakage
(Joo et al., 2005) was used for the bacterial speck disease and O3 experiments. Apple or
Arabidopsis leaves were collected, rinsed with deionized water, and immersed in 25 mL of

32
deionized water for 4 h with shaking at 100 rpm, and the conductivity (µS cm-1) of the resulting
solution was measured. The samples were then autoclaved, and conductivity was measured again.
Relative ion leakage was calculated by dividing the conductivity of the electrolyte leakage
solution before autoclaving by the conductivity of the electrolyte solution after autoclaving and
multiplying by 100.
3.2.6 Detection of Superoxide
In situ O2– was detected using a NBT staining method essentially as described by
Garmier et al. (2007). In brief, MV-treated leaf discs were vacuum infiltrated with a solution of
0.5 mg mL-1 NBT (Sigma) in 10 mM potassium phosphate buffer (pH 7.8) and kept in dark for 1
h, and then chlorophyll was cleared by immersion in ethanol at 70ºC. Leaf discs were
photographed using a FinePix S9000 digital camera (FujiFilm), and NBT staining intensity was
measured using ImageJ software (Abramoff et al., 2004). Each sample consisted of five leaf
discs, each disc taken from a different tree.
3.2.7 Disease Assays
Pseudomonas syringae infection and population analysis in Arabidopsis was done using a
published protocol (Jambunathan et al., 2001). Apple infection with E. amylovora and disease
severity measurement was done as described previously (Jensen et al., 2003). Bacterial
populations in apple tissue were determined by tissue extraction and serial dilution plating.

33
3.2.8 Transmission Electron Microscopy
For the ozone (O3) TEM experiments, 1- to 2-month-old apple trees growing in a growth
room with 90 µE m-2 s-1 light intensity and a 10-h photoperiod were exposed to 350 nL L-1 O3 for
6 h. Leaf tissues were collected at 2 d after the beginning of the O3 exposure. Tissues were fixed
with glutaraldehyde in HEPES buffer, postfixed in OsO4 in the same buffer, and embedded in
Spurr‟s resin, according to the method of Owen and Makaroff (1995), essentially as described by
Li et al. (2004). Ultrathin sections (80 nm thick) were cut using a Reichart-Jung Ultracut E
Microtome and stained with uranyl acetate and lead citrate. Observations of chloroplasts were
made with a JEOL 1200 EX II transmission electron microscope fitted with a high-resolution
Tietz F224 digital camera. Chloroplast areas were measured using ImageJ software
(http://rsbweb.nih.gov/ij).
3.3 Results
3.3.1 Sensitivity to High-Light Intensity
The results of the photosynthesis measurements suggested that FIB4 KD apple trees were
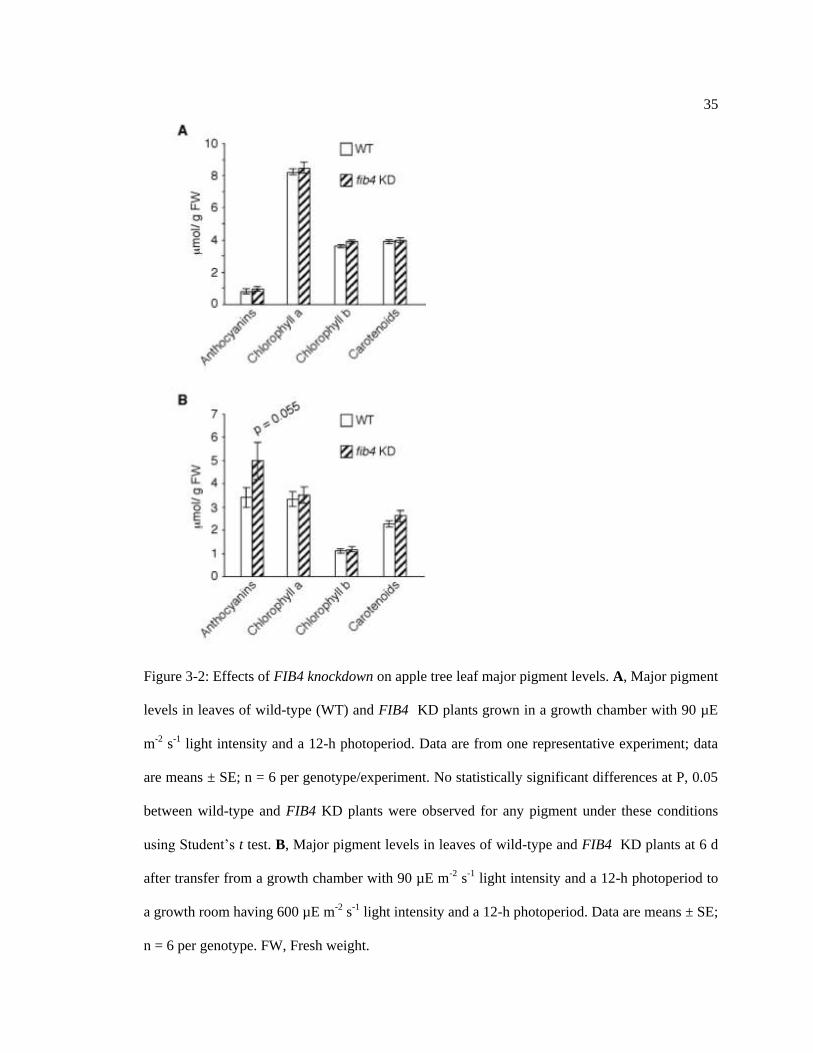
sensitive to high light intensity. Plants typically accumulate anthocyanins in response to high light
stress as photoprotectants (for review, see Steyn et al., 2002). Under a light intensity of 90 µE m-2
s-1 in plant growth chambers with a 12-h photoperiod, the leaves of FIB4 KD and wild-type apple
trees were green and had similar levels of anthocyanins, chlorophyll a, chlorophyll b, and
carotenoids (Fig. 3-1, 3-2A). However, following transfer to 600 µE m-2 s-1 light intensity
conditions with a 12-h photoperiod for 6 d, FIB4 KD tree leaves were visibly darker in color than

34
leaves of wild-type trees (Fig. 3-1) and accumulated higher amounts of anthocyanins than wild-
type tree leaves, while levels of other pigments were similar (Fig. 3-2B).
Figure 3-1: Effects of transfer from 90 E m-2 s-1 PAR to 600 E m-2 s-1 PAR for 6 d on wild-
type (WT) and FIB4 KD plants. Photographs were taken 6 d after transfer to higher light
intensity. Six plants were used for the experiment; representative plants are shown.
35
Figure 3-2: Effects of FIB4 knockdown on apple tree leaf major pigment levels. A, Major pigment
levels in leaves of wild-type (WT) and FIB4 KD plants grown in a growth chamber with 90 µE
m-2 s-1 light intensity and a 12-h photoperiod. Data are from one representative experiment; data
are means ± SE; n = 6 per genotype/experiment. No statistically significant differences at P, 0.05
between wild-type and FIB4 KD plants were observed for any pigment under these conditions
using Student‟s t test. B, Major pigment levels in leaves of wild-type and FIB4 KD plants at 6 d
after transfer from a growth chamber with 90 µE m-2 s-1 light intensity and a 12-h photoperiod to
a growth room having 600 µE m-2 s-1 light intensity and a 12-h photoperiod. Data are means ± SE;
n = 6 per genotype. FW, Fresh weight.
36
3.3.2 Methyl Viologen Sensitivity
The sensitivity of FIB4 KD apple trees to high light and increases in light intensity led us
to suspect that they might be more sensitive to ROS generation in the chloroplast. Therefore, we
tested the sensitivity of FIB4 KD apple trees to methyl viologen (MV). MV generates ROS in
chloroplasts by preferential electron acceptance by MV, rather than by ferredoxin, from the
reaction center of PSI, producing MV radical, whose oxidation by oxygen produces the
superoxide radical O2.– (Izawa, 1980; Ashton and Crafts, 1981; Taiz and Zeiger, 2006), thereby
inducing oxidative damage. When floated on 0.5 mM MV solution for 24 h, leaf discs from FIB4
KD apple trees developed obviously larger areas of brown pigmentation compared with leaf discs
from wild-type and VC trees (Fig. 3-3A). Little or no brown pigmentation was observed on most
of the wild-type and VC leaf discs after MV treatment; in contrast, all FIB4 KD leaf discs
developed extensive brown coloration (Fig. 3-3A). When observed, brown pigmentation in wild-
type and VC leaf discs were generally restricted to limited areas near the disc margins. In
addition, tissue damage as measured by electrolyte leakage was greater in FIB4 KD leaf discs
than wild-type or VC leaf discs at 24 h after the start of MV treatment (Fig. 3-3B). The greater
sensitivity to MV was accompanied by higher levels of superoxide during the course of MV
treatment (Fig. 3-3C), as detected by in situ staining of leaf discs with nitroblue tetrazolium
(NBT) using the method described by Garmier et al. (2007). At 3 h after the start of MV
treatment, leaf discs from FIB4 KD trees exhibited measurably darker NBT staining than leaf
discs from wild-type trees (Fig. 3-3C). This indicates that FIB4 KD trees had higher levels of
superoxide during MV treatment than wild-type trees. Apple showed a high, stable background
signal in the superoxide assay; however, the signal increase in FIB4 KD was clear. These results
suggest that FIB4 KD trees were more sensitive to oxidative stress.

37
Figure 3-3: Knockdown of FIB4 increases apple sensitivity to MV. Leaf discs for each
experiment were taken from plants growing in a growth chamber with 90 µE m-2 s-1 light intensity
and a 12-h photoperiod. A, Wild-type (WT), VC, and FIB4 KD apple tree leaf discs after
exposure to 0.5 mM MV under continuous 50 µE m-2 s-1 light for 24 h. Photographs are from one
representative experiment; the experiment was repeated three times with similar results; n = 15
discs per genotype, two source plants per genotype. B, Electrolyte leakage from wild-type and
FIB4 KD leaf discs after exposure to 0.5 mM MV for 24 h under continuous 50 µE m-2 s-1 light.
Electrolyte leakage was measured at 24 h after the beginning of treatment. Data are means ± SE
of six replicates; * P, 0.05 using Student‟s t test. C, Superoxide radical detection in wild-type and

38
FIB4 KD leaf discs floated on 0.5 mM MV under continuous 50 µE m-2 s-1 light. Leaf discs were
floated on 0.5 mM MV for the indicated times, stained with NBT, and then cleared with ethanol
(Garmier et al., 2007). NBT staining intensity was measured using ImageJ software (Abramoff et
al., 2004). The experiment was performed using leaf discs from five trees per genotype. Statistical
significance was determined using Student‟s t test.
3.3.3 Susceptibility of Apple Trees to E. amylovora
Oxidative damage also plays a role in disease processes, such as fire blight (Venisse et
al., 2001). Therefore, the susceptibility of FIB4 KD apple trees to E. amylovora was tested. One
of the major symptoms of fire blight is a zone of darkened, shriveled, necrotic tissue that develops
and spreads systemically from a point of initial infection. Necrotic region length as a percentage
of total shoot length is a standard, quantitative measure of fire blight disease severity (Lee et al.,
2010). Wild-type, VC, and FIB4 KD apple trees growing on a potting mix in a growth chamber
were inoculated with 108 colony-forming units (cfu) mL-1 E. amylovora strain Ea581a at
wounded shoot tips. Fire blight disease severity was measured once each week for 3 weeks
following inoculation. At each time point, fire blight disease severity was significantly higher in
FIB4 KD apple trees than in either wild-type or VC trees (Fig. 3-4A). In addition, FIB4 KD apple
tree shoots supported significantly larger E. amylovora population sizes than wild-type shoots
(Fig. 3-4B). These results indicated that FIB4 KD apple trees were more susceptible to E.
amylovora than wild-type trees.

39
Figure 3-4: Knockdown of FIB4 causes increased susceptibility to bacterial pathogens in apple.
All plants were maintained under 90 µE m-2 s-1 light intensity, with a 12-h photoperiod, for the
duration of the experiments. A, Fire blight disease severity (necrotic zone size) in wild-type
(WT), VC, and FIB4 KD trees at 7, 14, and 21 dpi with 108 cfu mL-1 E. amylovora. Data are
from one representative experiment; the experiment was repeated four times with similar results.
Data are means ± SE; n = 8 per genotype/experiment; * P, 0.05 using Student‟s t test. B, E.
amylovora population levels in wild-type and FIB4 KD tree stems at 7 dpi. Data are means ± SE;
n = 4 or more per genotype; * P, 0.05 using Student‟s t test.
3.3.4 Pathogenesis- Related (PR) and FIB4 Gene Expression in E. amylovora Infected Apple
Trees
To determine whether plant immune responses were altered in FIB4 KD apple trees
during fire blight infection, we analyzed the expression of Pathogenesis- Related (PR) genes in E.
amylovora-infected apple trees. PR gene expression is induced in apple trees during E. amylovora
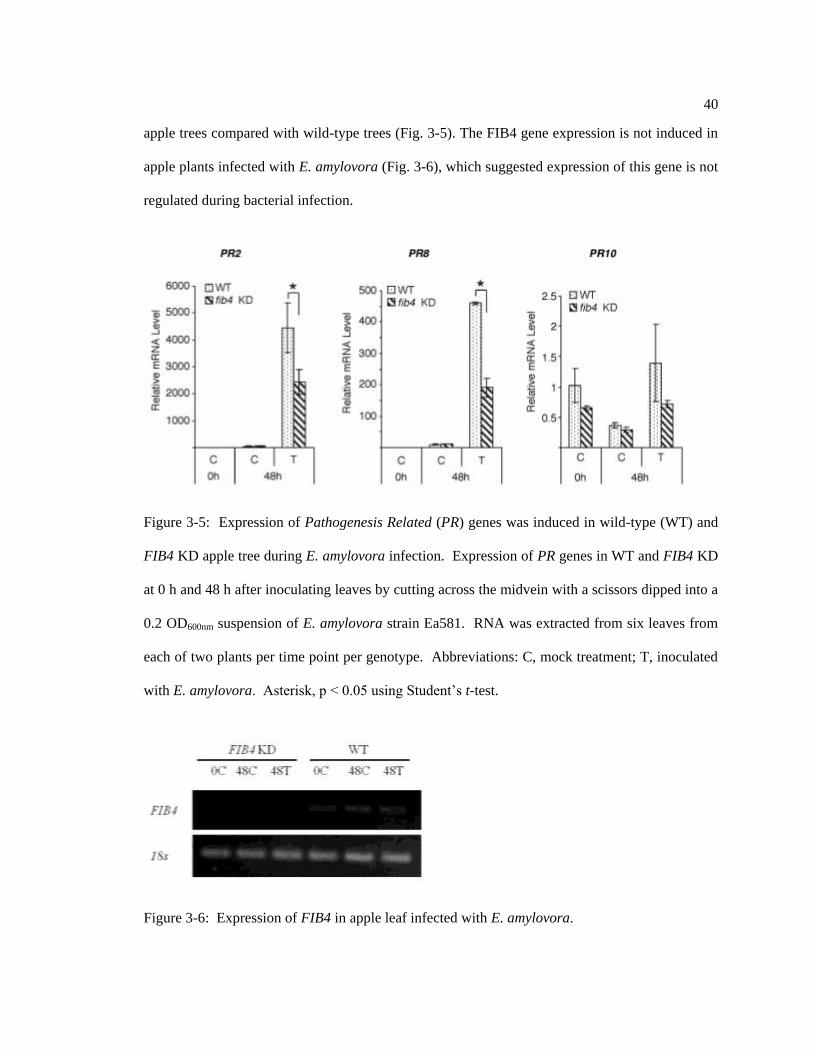
infection (Venisse et al., 2002). Our results indicated that expression of PR2 and PR8 was
induced in wild-type and FIB4 KD plants; however, induction was significantly less in FIB4 KD
40
apple trees compared with wild-type trees (Fig. 3-5). The FIB4 gene expression is not induced in
apple plants infected with E. amylovora (Fig. 3-6), which suggested expression of this gene is not
regulated during bacterial infection.
Figure 3-5: Expression of Pathogenesis Related (PR) genes was induced in wild-type (WT) and
FIB4 KD apple tree during E. amylovora infection. Expression of PR genes in WT and FIB4 KD
at 0 h and 48 h after inoculating leaves by cutting across the midvein with a scissors dipped into a
0.2 OD600nm suspension of E. amylovora strain Ea581. RNA was extracted from six leaves from
each of two plants per time point per genotype. Abbreviations: C, mock treatment; T, inoculated
with E. amylovora. Asterisk, p < 0.05 using Student‟s t-test.
Figure 3-6: Expression of FIB4 in apple leaf infected with E. amylovora.

41
Expression of FIB4 genes in wild-type (WT) and FIB4 KD at 0 h and 48 h after inoculating
leaves by cutting across the midvein with a scissors dipped into a 0.2 OD600nm suspension of E.
amylovora strain Ea581. RNA was extracted from six leaves from each of two plants per time
point per genotype. Abbreviations: C, mock treatment; T, inoculated with E. amylovora.
3.3.5 Susceptibility of Arabidopsis to P. syringae
To further study the role of FIB4 in disease resistance, effects of mutations in the
orthologous Arabidopsis FIB4 gene (At3g23400) on bacterial disease resistance were determined.
Seeds of two Arabidopsis T-DNA insertion mutants in the Columbia-0 (Col-0) genetic
background, FIB4 -1 (SALK_014831) and FIB4 -2 (SALK_122950) were obtained from the
Arabidopsis Biological Resource Center, a publicly accessible collection of T-DNA insertion
lines (http://www.biosci.ohio-state.edu/pcmb/Facilities/abrc/abrchome.htm) (Alonso et al., 2003).
DNA sequencing of the PCR product obtained using genomic DNA from FIB4 -1 and primer pair
LBb1-RP1 showed that the T-DNA left border lay adjacent to nucleotide 1,575 of FIB4 (Fig. 3-
7A). DNA sequencing of the PCR product obtained using genomic DNA from FIB4-2 and
primer pair LBb1-RP2 showed that the T-DNA left border lay adjacent to the 5th nucleotide of
FIB4. The expression of FIB4 transcript in FIB4-1 and FIB4-2 was 13% and 21% of that in Col-
0, respectively when using quantitative real-time PCR amplification region RT2 (Fig. 3-7D)
42
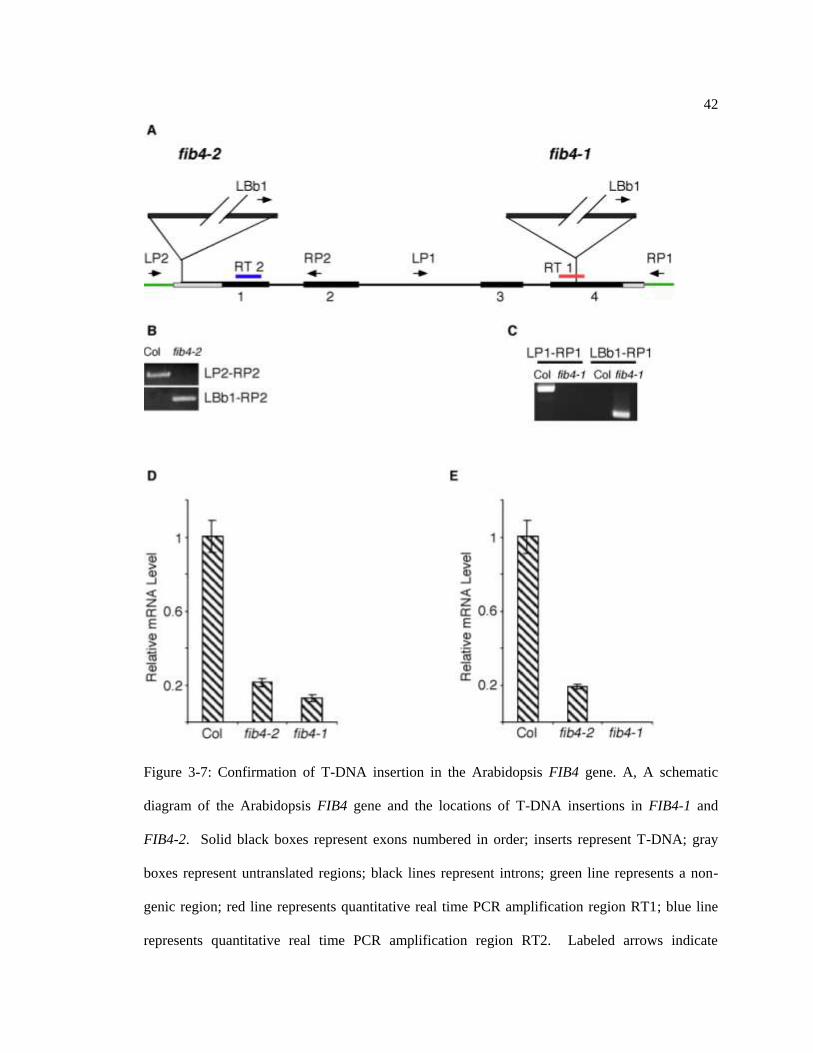
Figure 3-7: Confirmation of T-DNA insertion in the Arabidopsis FIB4 gene. A, A schematic
diagram of the Arabidopsis FIB4 gene and the locations of T-DNA insertions in FIB4-1 and
FIB4-2. Solid black boxes represent exons numbered in order; inserts represent T-DNA; gray
boxes represent untranslated regions; black lines represent introns; green line represents a non-
genic region; red line represents quantitative real time PCR amplification region RT1; blue line
represents quantitative real time PCR amplification region RT2. Labeled arrows indicate
43
locations, directions, and names of conventional PCR primers. The presence of a homozygous T-
DNA insertion in the first exon of FIB4 in SALK_122950 (FIB4-2) (B) and in the fourth exon of
FIB4 in SALK_014831 (FIB4-1) (C) were confirmed by PCR. Primer pairs used are indicated
(A); template was genomic DNA. (D). When using real-time PCR amplification region RT1, the
expression of FIB4 transcript in FIB4-2 was determined to be 19% of that in Col-0, while FIB4
transcript was not detected in FIB4-1, probably because the reverse primer in RT1 overlapped the
T-DNA insertion site in FIB4-1 (E).
Pseudomonas syringae pv tomato (P. s. t.) causes bacterial speck disease in Arabidopsis
(Whalen et al., 1991). Symptoms observed on the leaves of susceptible Arabidopsis plants include
tissue necrosis, watersoaked lesion development, and chlorosis. Wild-type ecotype Columbia-0
(Col-0) and FIB4 -1 mutant plant were challenged with the virulent P. s. t. strain DC3000 by leaf
infiltration, and symptom development and bacterial growth were monitored. Bacterial speck
disease symptoms were visibly more severe on FIB4-1 than Col-0 at 6 d post inoculation (dpi)
with 104 cfu mL-1 P. s. t. (Fig. 3-8A). Significantly greater electrolyte leakage was recorded for
FIB4 -1 than Col-0 at 6 dpi with 104 cfu mL-1 P. s. t. (Fig. 3-8B), indicating more extensive tissue
damage in the mutant. In addition, the P. s. t. population size in FIB4 -1 plant leaves was double
that in Col-0 leaves at 4 dpi with 104 cfu mL-1 bacterium (Fig. 3-8C). These results show that the
Arabidopsis FIB4-1 mutant was more susceptible to bacterial speck disease than wild-type
control plants, although the change in bacterial growth was relatively modest compared with
some other Arabidopsis mutants that support increased P. s. t. growth, such as sid2 (Block et al.,
2005), eds1, and pad4 (Xing and Chen, 2006).

44
Figure 3-8: Mutation of FIB4 causes increased susceptibility to bacterial pathogens in
Arabidopsis. All plants were maintained under 90 µE m-2 s-1 light intensity with10-h photoperiod
for the duration of the experiments. A, Symptom development on Col-0 and FIB4-1 plant leaves
at 6 dpi with 104 cfu mL-1 P. s. t. B, Ion leakage from Col-0 and FIB4-1 leaves at 6 dpi with 104
cfu mL-1 P. s. t. Data are from one representative experiment; the experiment was repeated three
times with similar results. Data are means ± SE; n = 5 per genotype/experiment; * P, 0.05 using
Student‟s t test. C, P. s. t. population levels in Col-0 and FIB4 -1 mutant plant leaves at 4 dpi with
104 cfu mL-1 bacterium. Data are from one representative experiment; the experiment was
repeated three times with similar results. Data are means ± SE; n = 5 per genotype/ experiment; *
P, 0.05 using Student‟s t test.
3.3.6 Ozone Sensitivity
The sensitivity of FIB4 KD trees to MV, high light intensity, and bacterial pathogens
prompted us to test whether FIB4 KD trees were sensitive to ozone (O3), another oxidative stress.
Exposure to O3 triggers tissue necrosis and cell death in sensitive plants (Runeckles and
Chevonne, 1992). Wild-type and FIB4 KD apple trees were exposed to 350 nL L-1 O3 for 6 h. At
6 h after the start of the O3 treatment, none of the apple trees had necrotic lesions. However, at 24
A B C

45
h after the start of O3 treatment, FIB4 KD apple trees developed extensive necrosis, especially in
the older leaves, while wild-type and VC trees displayed little or no necrosis (Fig. 3-9A). Tissue
damage as measured by electrolyte leakage was significantly greater in FIB4 KD apple trees than
in wild-type and VC apple trees at 24 h after the start of the O3 treatment (Fig. 3-9B). These
results indicate that FIB4 KD apple trees were much more sensitive to O3 than control wild-type
and VC trees.
Figure 3-9: Knockdown and mutation of FIB4 increases sensitivity to O3 in apple and

46
Arabidopsis. A and B represent experiments done in apple; C, D, and E represent experiments
done in Arabidopsis. A, Effects of exposure to 350 ± 50 nL L-1 O3 for 6 h under 90 µE m-2 s-1 light
intensity on wild-type (WT), VC, and FIB4 KD plants. Plants were returned to their normal light
conditions (90 µE m-2 s-1, 10-h photoperiod) after O3 treatment; photographs were taken 24 h after
the start of O3 treatment. B, Ion leakage from wildtype, VC, and FIB4 KD leaves caused by
exposure to 350 ± 50 nL L-1 O3 for 6 h under 90 µE m-2 s-1 light intensity. Plants were returned to
their normal light conditions (90 µE m-2 s-1, 10-h photoperiod) after O3 treatment; measurements
were taken at 24 h after the start of O3 treatment. Data are from one representative experiment;
the experiment was repeated three times with similar results. Data are means ± SE; n = 5 per
genotype/experiment; * P, 0.05 using Student‟s t test. C, Effects of exposure to 500 ± 50 nL L-1
O3 for 6 h under 90 µE m-2 s-1 light intensity on Col-0 and FIB4 -1 plants. Plants were returned to
their normal light conditions (90 µE m-2 s-1, 10-h photoperiod) after O3 treatment; photographs
were taken 24 h after the start of O3 treatment. D, Amount of lesion formation in Col-0 and FIB4-
1 plants following exposure to 500 ± 50 nL L-1 O3 for 6 h or 700 ± 50 nL L-1 O3 for 3 h under 90
µE m-2 s-1 light intensity. Plants were returned to their normal light conditions (90 µE m-2 s-1, 10-h
photoperiod) after O3treatment; measurements were taken at 24 h after the start of O3 treatment.
The percentage of plants with the indicated numbers of lesion-bearing leaves is shown. The
number of lesion-bearing leaves per plant ranged from zero to nine. n = 35 plants per genotype
for plants exposed to 500 ± 50 nL L-1 O3; n = 20 plants per genotype for plants exposed to 700 ±
50 nL L-1 O3. E, Ion leakage from Col-0 and FIB4 -1 plant leaves after exposure to 500 ± 50 nL
L-1 O3 for 3 h under 90 µE m-2 s-1 light intensity. Plants were returned to their normal light
conditions (90 µE m-2 s-1, 10-h photoperiod) after O3 treatment; measurements were taken at 6 h
after the start of O3 treatment. Data are means ± SE; n = 5 per genotype; * P, 0.05 using Student‟s
t test.

47
Arabidopsis FIB4 mutants were also more sensitive to O3. Exposure of homozygous
Arabidopsis FIB4-1 mutants and Col-0 control plants to 500 nL L-1 O3 for 6 h or 700 nL L-1 O3
for 3 h resulted in higher numbers of leaves with visible lesions per plant in FIB4-1 than in Col-0
at 24 h after the start of O3 exposure (Fig. 3-9, C and D). Tissue damage as measured by
electrolyte leakage was greater in FIB4-1 and FIB4-2 mutant plants than in Col-0 plants at 6 h
after the start of a 3-h, 500 nL L-1 O3 treatment (Fig. 3-9E and 3-10). These results indicate that
Arabidopsis FIB4-1 and FIB4-2 mutant plants were more sensitive to O3 than Col-0, which was
consistent with the increased O3 sensitivity of FIB4 KD apple trees.
Figure 3-10: The FIB4-2 is more sensitive to ozone than wild-type Col-0 plants. Ozone exposure
at 500 ± 50 ppb for 3 h caused more extensive electrolyte leakage in FIB4-2 leaves than in Col-0
as measured by relative ion leakage at 6 h after the start of ozone treatment. Data are mean
SEM; n = 5/genotype; asterisk, p < 0.05 using Student‟s t-test.
3.3.7 Plastoglobule Ultrastructure during O3 Stress
In order to determine whether O3 stress caused any changes in plastoglobule
ultrastructure, wild-type and FIB4 KD apple trees were exposed to 350 nL L-1
O3 for 6 h, leaf

48
tissue was collected and fixed at 2 d after the beginning of O3 exposure, and plastoglobules in
palisade mesophyll cells were examined by TEM. In wild-type plants, the proportion of electron-
transparent plastoglobules increased from 4% of total plastoglobules before O3 treatment to 43%
of total plastoglobules after O3 treatment (Fig. 3-11, A and B). There were fewer electron-opaque
plastoglobules and more total plastoglobules in wild-type plants after O3 treatment, although the
differences were not statistically significant (Fig. 3-11B). In FIB4 KD plants, electron-opaque
plastoglobules were virtually absent both before and after O3 treatment, as expected; however, the
total number of plastoglobules in FIB4 KD increased by 56% after O3 treatment due to an
increase in the number of electron-transparent plastoglobules (Fig. 3-11, A and C).

49
Figure 3-11: Plastoglobule ultrastructure changes in wild-type and FIB4 KD following O3
exposure. Wild-type (WT) and FIB4 KD apple trees were exposed to 350 nL L-1 O3 for 6 h under

50
90 µE m-2 s-1 light intensity and then returned to their normal growth conditions (90 µE m-2 s-1,
10-h photoperiod). Leaf tissues were collected at 2 d after the beginning of the O3 exposure and
examined by TEM. Data shown are from one experiment; the experiment was performed twice
with similar results each time. A, Transmission electron micrographs of representative
plastoglobules (arrows) in control and O3-treated wild-type and FIB4 KD leaf palisade mesophyll
cell chloroplasts. The scale is the same in all four micrographs. B, Numbers of electron-
transparent plastoglobules (white), electron-opaque plastoglobules (black), and total
plastoglobules (black + white) per mm2 in wild-type chloroplasts before and after O3 exposure.
Plastoglobules were counted in 14 chloroplasts from a control plant and 11 chloroplasts from an
O3-exposed plant. Data are means ± SE; * P, 0.05 using Student‟s t test. C, Numbers of black and
white plastoglobules and total plastoglobules per mm2 in FIB4 KD chloroplasts before and after
O3 exposure. Plastoglobules were counted in 15 chloroplasts from a control plant and 15
chloroplasts from an O3-exposed plant. Data are means ± SE; * P, 0.05 using Student‟s t test.
Table 3-1: PCR primer sequences.
Target Gene Accession
Number
(Gene Bank,
NCBI)
Gene
Function or
Experiment
Description
Primer Sequences Product
Size
(bp)
FIB4 (apple) AY383624 FIB4 Forward: 5-ggacgaggtttctgt
tctcg-3
Reverse: 5-gcggatatcagcatca
aggt-3
637
FIB4 -2
(Arabidopsis)
At3g23400
(Salk_122950)
T-DNA
analysis LP: 5-acggcaaatgttcacgtaatc
-3
RP: 5-ttctttagcagccacttcagc-
3
1202
FIB4 -1
(Arabidopsis)
At3g23400
(Salk_014831)
T-DNA
analysis LP: 5-tcttgcttgagtttgaatggg-3
RP:5-ttgccaatccgttctctctac-3
1070

51
Table 3-2: Semiquantitative reverse transcription PCR and Real-time PCR primer and probe
sequences.
Target Gene Accession
Number
(Gene Bank,
NCBI)
Gene Function
or Experiment
Description
Primer and Probe Sequences
PR2 (apple) AY548364 β-1, 3-
glucanase Forward: 5-tctgcagaggtcgggtctct-3
Reverse: 5-gatttggccttgcagattgg-3
Probe: 5-tgccatccaaaacatccacagtgc a-3
PR8 (apple) DQ318214 Chitinase type
III Forward: 5-ccaggtcactcaaaggacacaa-3
Reverse: 5-tatccgggaacgggcatt-3
Probe:5-cagggaaaaacggtctatttagccgca-
3
PR10 (apple) AY026911 Ribonuclease
like Forward: 5-caccattgagaaggtctcttacga-3
Reverse: 5-tggctgatactcttgatgatgga-3
Probe:5-accaagttggtggcatctggaagtgg-3
FIB4 (Apple) AY383624 FIB4 Forward:5-cctaagttaccggaaggactacga-3
Reverse: 5-ttgacgttacctaccttgatgctg-3
Probe: 5-ctccgtctaacccaggaagtggtgaa-3
FIB4
(Arabidopsis)
At3G23400 FIB4 Forward_1:5-aattcgtctctcgttgaagtatcca-
3
Reverse_1: 5-ctcctcctgatccagatgatgat-3
Probe_1: 5-tggcggagaaagtgacccaccac-
3
Forward_2: 5- tcgcagattcctccgtttg-3
Reverse_2: 5-ttccagggtttgacgatggt-3
Probe_2: 5-tcccgaggcttcccgacagtttc-3
ACTIN 2
(Arabidopsis)
At3g18780.2 ACTIN 2 Forward: 5-gattcagatgcccagaagtcttg-3
Reverse: 5-tctcgtggattccagcagct-3
Probe: 5-ccagccctcgtttgtgggaaagg-3
3.4 Discussion
This study indicates that FIB4 is required for plant resistance to several abiotic stresses
and for resistance to bacterial pathogens. This finding is consistent with the growing body of
evidence linking fibrillins with stress tolerance and disease resistance (Pruvot et al., 1996; Gillet

52
et al., 1998; Rey et al., 2000; Rorat et al., 2001; Cooper et al., 2003; Leitner-Dagan et al., 2006;
Yang et al., 2006; Youssef et al., 2010). It is interesting that FIB4 was found to be required for
resistance to P. s. t., as FIB4 is one of a handful of proteins that is phosphorylated early on during
defense responses against this bacterium, suggesting a role for FIB4 in basal defenses (Jones et
al., 2006). The phenotypic similarities between Arabidopsis FIB4 mutants and FIB4 KD apple
trees indicate that the function of FIB4 is conserved between these two very different species.
This implies that FIB4 may play a basic, conserved role in plant physiology, perhaps as a
contributor to plant stress tolerance and/or photosynthetic acclimatization.
Our finding that plastoglobule osmiophilicity decreased in wild-type apple chloroplasts
following acute O3 stress was consistent with the reduced plastoglobule osmiophilicity observed
in earlier studies of chronic O3 exposure in radish (Raphanus sativus; Miyake et al., 1989) and
Norway spruce (Picea abies; Kivimaenpaa et al., 2003). Decreased plastoglobule osmiophilicity
could reflect oxidation (Miyake et al., 1989) or egress of plastoglobule osmiophilic content
during O3 stress. This suggests that plastoglobules may be dynamic reservoirs of antioxidants that
dispense their contents as needed during O3 stress; FIB4 KD plastoglobules, which contain very
little osmiophilic material to begin with, may be unable to perform this function. This could
account for the increased O3 sensitivity and oxidative stress sensitivity of FIB4 KD trees
compared with wild-type trees. In addition, the increase in total number of plastoglobules in FIB4
KD during O3 stress may represent a physiological compensation for a dearth of osmiophilic
plastoglobules.
The increased sensitivity of FIB4 KD plants to MV implies that they are more sensitive
to oxidative stress, particularly in the chloroplast. The higher photosynthesis rates of FIB4 KD
trees compared with wild-type trees under low-light conditions, which were used for the MV
treatments, would likely have exacerbated oxidative stress due to MV treatment in FIB4 KD
trees. The higher level of superoxide in MV-treated FIB4 KD apple leaves than in wild-type apple

53
leaves is consistent with this scenario. Increases or decreases in chloroplast ROS sensitivity are
known to affect MV sensitivity. For example, when chloroplastic ROS-scavenging capacity is
inhibited by decreasing the expression of thylakoid ascorbate peroxidase (APX), MV sensitivity
increases (Tarantino et al., 2005). Furthermore, increasing chloroplastic ROS-scavenging
capacity by overexpressing chloroplastic APX (Murgia et al., 2004) or overexpressing cytosolic
APX in the chloroplast (Badawi et al., 2004) reduces sensitivity to MV.
Higher anthocyanin accumulation in the leaves of FIB4 KD apple trees than in wild-type
apple trees upon shifting to higher light intensity further supports the notion that FIB4 KD plants
are more sensitive to oxidative stress in the chloroplast. Anthocyanins protect photosynthetic
systems from high light by sunscreen and antioxidant activities (Smillie and Hetherington,
1999; Hughes et al., 2005; Kytridis and Manetas, 2006). Higher anthocyanin accumulation in the
leaves of FIB4 KD apple trees upon shifting to higher light intensity might partially compensate
for a lack of FIB4-mediated control of oxidative stress in the chloroplast. In addition, increased
photoinhibition in FIB4 KD apple leaves compared with the wild-type at high light intensity
suggests a reduced ability to control photooxidative damage of the photosynthetic system in FIB4
KD trees. The increased O3 sensitivity of FIB4 KD apple and FIB4 Arabidopsis plants is also
consistent with FIB4 contributing to chloroplast oxidative damage control, since chloroplastic
ROS production is an early response of plants to O3 exposure (Joo et al., 2005).
Similarly, the increased susceptibility of Arabidopsis FIB4-1 mutant plants to bacterial
speck disease is consistent with increased sensitivity to oxidative damage. P. s. t. induces light-
dependent ROS accumulation in susceptible host tissues via the phytotoxic virulence factor
coronatine (Ishiga et al., 2009). Furthermore, the chloroplast electron transport inhibitor 3-(3,4-
dichlorophenyl)-1,1-dimethylurea, which suppresses chloroplast ROS production (Joo et al.,
2005), blocks bacterial speck disease development in tomato cotyledons (Ishiga et al., 2009). This
suggests that ROS production in chloroplasts is required for bacterial speck disease development

54
(Ishiga et al., 2009). Thus, FIB4 could contribute to bacterial speck disease resistance by
mediating oxidative damage control in the chloroplast.
The increased susceptibility of FIB4 KD apple trees to E. amylovora is consistent with an
increased sensitivity to oxidative damage, although there is currently no clear link between the
chloroplast and fire blight. E. amylovora induces superoxide production in host plants during
infection, resulting in membrane damage and necrosis (Venisse et al., 2001). The production
of superoxide appears to play a role in fire blight disease development, possibly by inducing cell
death processes in the host. In addition, PR gene expression was partially suppressed in FIB4 KD
apple trees during E. amylovora infection. PR gene expression is normally induced in apple trees
during E. amylovora infection (Venisse et al., 2002), and some of these genes could play a role in
reducing apple susceptibility to E. amylovora (Maxson-Stein et al., 2002; Malnoy et al., 2007).
These results indicate that FIB4 KD apple trees had weakened resistance to E. amylovora. In light
of these findings, it is interesting that the E. amylovora secreted virulence protein HrpN (Wei et
al., 1992) can physically associate with FIB4 (Song et al., 2002). Although this interaction has not
been confirmed in vivo, it might make sense if FIB4 were a target of bacterial effector proteins,
since reduction of FIB4 expression triggered disease susceptibility in this study.
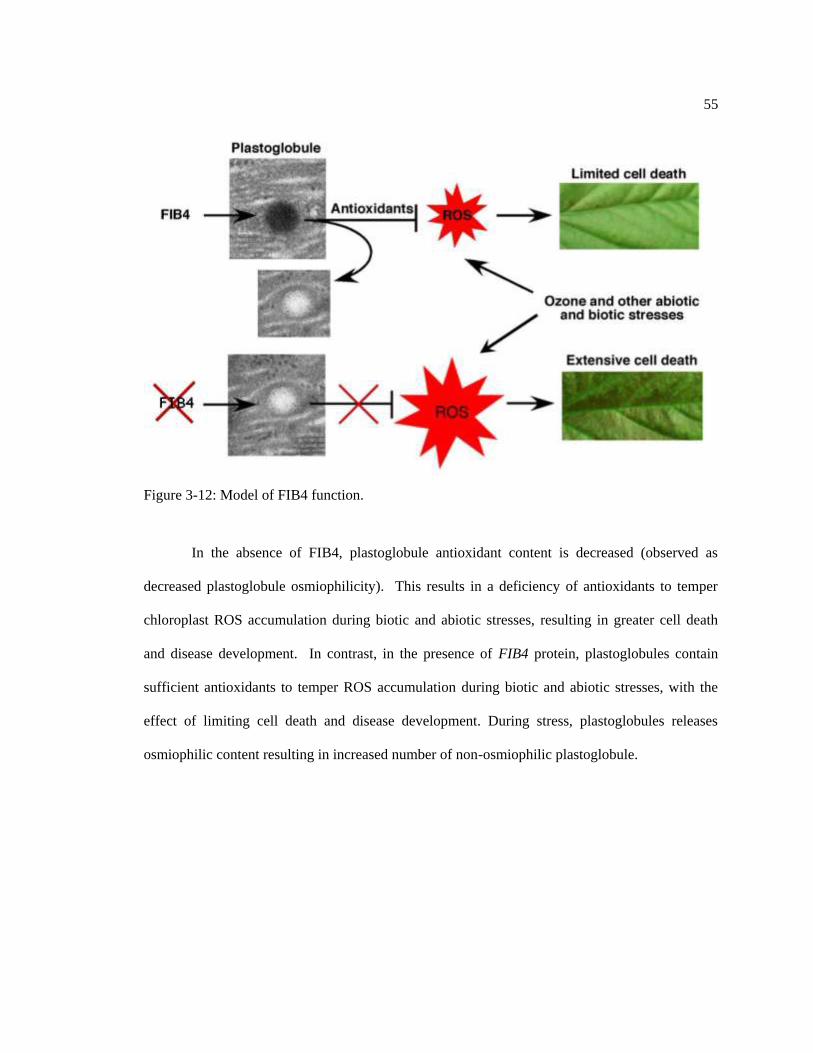
55
Figure 3-12: Model of FIB4 function.
In the absence of FIB4, plastoglobule antioxidant content is decreased (observed as
decreased plastoglobule osmiophilicity). This results in a deficiency of antioxidants to temper
chloroplast ROS accumulation during biotic and abiotic stresses, resulting in greater cell death
and disease development. In contrast, in the presence of FIB4 protein, plastoglobules contain
sufficient antioxidants to temper ROS accumulation during biotic and abiotic stresses, with the
effect of limiting cell death and disease development. During stress, plastoglobules releases
osmiophilic content resulting in increased number of non-osmiophilic plastoglobule.
56
Chapter 4
FIBRILLIN4 Regulates Plastoquinone Level in Plastoglobules

57
4.1 Introduction
Plastoglobules are lipoprotein structures found in chloroplasts, chromoplasts and other
plastid types (Lichtenthaler, 1968). A lipid monolayer and proteins envelop the plastoglobule
(Austin et al., 2006). Out of 34 proteins found in the plastoglobule of Arabidopsis nine are
Fibrillins (Austin et al., 2006; Ytterberg et al., 2006). In chloroplasts, plastoglobules are attached
to thylakoid membranes with a lipid monolayer (Austin et al., 2006). Plastoglobules are probably
formed from the thylakoid membrane by a blistering process (Austin et al., 2006; Kessler and
Vidi, 2007).
The lipids found in plastoglobules include plastoquinone, plastohydroquinone,
phylloquinone K, α-tocopherol, α-tocoquinone, carotenoids, carotenoid esters, triacylglycerols,
free fatty acids, glycolipids, and phospholipids (Tevini and Steinmüller, 1985). The plastoglobule
is a dynamic sub-structure, as its lipid constituent changes with the developmental stage of the
plant. The triacylglycerols decreased while carotenoid and carotenoid ester increased in the
plastoglobules as senescence progressed in Fagus sylvatica (beech; Tevini and Steinmüller,
1985). Plastoglobule lipid composition varies among plant species. For example, triacylglycerols
and carotenoid esters are not detected or are present in very small amounts in spinach and beech
but are found in very high proportion in the plastoglobules of Sarothamnus scoparius
(Steinmüller and Tevini, 1985). Plastoglobules of Vicia faba chloroplasts contain α-tocopherol,
plastoquinone, and triacylglycerols, and are devoid of carotenoids and chlorophyll (Greenwood et
al., 1963). Plastoglobules of Beta vulgaris contained chlorophyll but no β-carotene (Bailey and
Whyborn, 1963; Ytterberg et al., 2006).
Lipids found in plastoglobules are known for their function in reactive oxygen species
(ROS) scavenging and photosynthesis. Phylloquinone and plastoquinone are components of the
electron transport system in chloroplasts (Lohmann et al., 2006). Plastoquinone amount increases
58
during stress (Pshibytko et al., 2003). Along with α-tocopherol, plastoquinone scavenges ROS
generated at photosystem II (PSII), during high-light stress in Chlamydomonas reinhardtii (Kruk
and Trebst, 2008). Plastoquinone has been shown to protect the reaction center protein of PSII,
D1 and D2 (Kruk and Trebst, 2008). A study using a tocopherol synthesis enzyme mutant
suggested that tocopherol protects PSII from photoinactivation (Havaux et al., 2005).
Tocopherols are important membrane lipid peroxidation inhibitors and scavengers of ROS in the
chloroplast (Vidi et al., 2006; Kruk and Trebst, 2008).
Plastoglobules may play roles in plant development and stress tolerance. In broad
bean and rhododendron, significantly larger plastoglobules were observed in older leaves
than in younger leaves (Kessler and Vidi, 2007). During the chloroplast to chromoplast
transition, plastoglobules enlarge and accumulate carotenoids (Kessler and Vidi, 2007).
Enlargement of plastoglobules was observed during ozone treatment in aspen and spruce
trees (Kessler and Vidi, 2007). Plastoglobule size also increases during drought (Eymery
and Rey, 1999) and in plants growing in the presence of heavy metals (Duret et al., 1986;
Panou-Filotheou et al., 2001).
Fibrillin is suggested to be a structural protein involved in plastoglobule structure
maintenance (Deruére et al., 1994). Plastoglobules can be formed in vitro from carotenoids and
Fibrillin protein (Deruére et al., 1994). Fibrillin expression is known to increase during stress (for
review see, Singh and McNellis, 2011). Overexpressing fibrillin genes in tomato and tobacco
resulted in plastoglobule clustering and higher plastoglobule number than in wild-type plants (Ko
et al., 2000; Kessler and Vidi, 2007; Simkin et al., 2007). Higher level of carotenoids and other
constituents of plastoglobule along with high expression of fibrillin might be needed for
plastoglobule formation (Kessler and Vidi, 2007). Interestingly, fbn4 KD apple trees had similar
numbers of plastoglobules as wild-type plants but KD trees had fewer osmiophilic plastoglobules

59
(Singh et al., 2010). Lower osmiophilicity of plastoglobules of fbn4 KD plants indicates a change
in their lipid composition. In this study, plastoglobule lipids of wild-type and fbn4 KD trees were
analyzed to determine the effect of decreased FBN4 protein on the plastoglobules. In this and
following chapters fibrillin4 is abbreviated as FBN4 instead of FIB4. The reason for using FBN4
is described in Singh and McNellis (2011).
4.2 Materials and Methods
4.2.1 Plant Material
Apple (Malus X domestica) plant growth condition and development of fbn4 KD apple is
described previously (Chapter 2 of this thesis).
4.2.2 Isolation of Intact Chloroplasts and Plastoglobules
Mature, green apple leaves (100 g) were washed and homogenized to extract chloroplasts
(Hiltbrunner et al., 2001). To isolate intact chloroplasts, the chloroplast suspension was loaded on
a 40% percoll cushion and centrifuged at 2,500 g at 4ºC for 10 min in a swing-out rotor. The
pellet contained intact chloroplasts. An amount of chloroplasts representing 0.3 mg total
chlorophyll per sample were used for lipid extraction. Total chlorophyll was determined using the
method of Arnon (Arnon, 1949). Rest of the pellet containing intact chloroplasts was used for
extracting plastoglobules. Plastoglobules were isolated from intact chloroplasts as using an
established protocol (Fig. 4-1) (Steinmüller and Tevini, 1985). In brief, the chloroplasts pallets
were suspended in 1mM phosphate buffer with 0.1 mM dithioerythritol subsequently sonicated
for 7 min, followed by 60-min centrifugation at 150,000g using Beckman L8-M ultracentrifuge
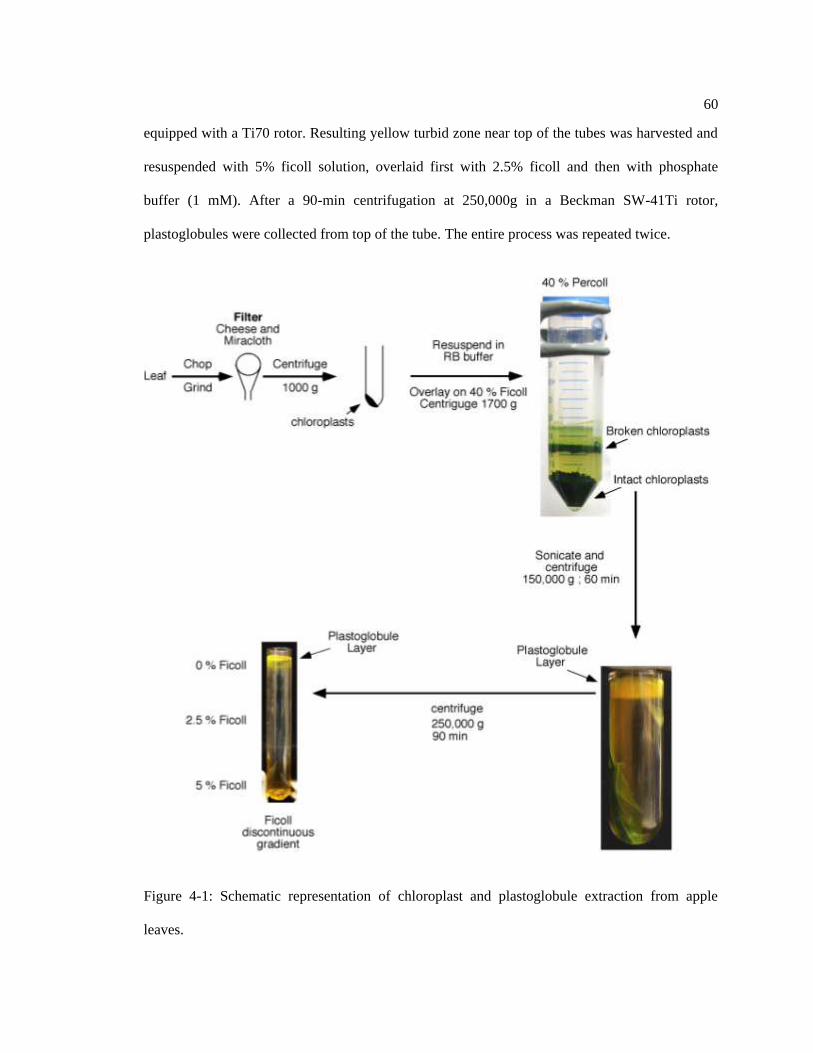
60
equipped with a Ti70 rotor. Resulting yellow turbid zone near top of the tubes was harvested and
resuspended with 5% ficoll solution, overlaid first with 2.5% ficoll and then with phosphate
buffer (1 mM). After a 90-min centrifugation at 250,000g in a Beckman SW-41Ti rotor,
plastoglobules were collected from top of the tube. The entire process was repeated twice.
Figure 4-1: Schematic representation of chloroplast and plastoglobule extraction from apple
leaves.
61
4.2.3 Transmission Electron Microscopy of Extracted Plastoglobules
Extracted plastoglobules from WT and fbn4 KD apple tree were stained with 0.5 % OsO4
and placed on a 200 mesh formvar coated copper grid, stabilized with carbon film (Steinmüller
and Tevini, 1985). Plastoglobules were observed with a JEOL 1200 EX II transmission electron
microscope (TEM) fitted with high-resolution Tietz F224 digital camera.
4.2.4 Chloroplast Lipid Extraction
Chloroplasts representing 0.3 mg total chlorophyll was used to extract lipids. Total
chlorophyll was determined using the method of Arnon (Arnon, 1949). Retinal (Sigma-Aldrich,
St. Louis, MO, 22 USA), which was used as a control to normalize lipid of chloroplast, was
added to the extracted chloroplast. Lipids were extracted from chloroplast by vortexing in 200 µl
cold acetone, briefly sonicated (10 pulse), and then kept in the dark at room temperature for 1 h.
The sample was then centrifuged at 13,000 g for 1 min and the supernatant was collected by
syringae (Restek, Germany). This extraction process was repeated three times. The supernatants
were pooled and filtered through a 0.2 μM pore size PTFE membrane (Whatman International
Ltd., Maldstone, UK) and analyzed using Liquid chromatography–mass spectrometry (LC-MS).
4.2.5 Plastoglobule Lipid Extraction
One third of the purified plastoglobule was used for protein quantification in the sample.
Proteins from the plastoglobules were extracted by established protocol (Ytterberg et al., 2006)
and quantified by Bradford assay following manufacturer instruction (Sigma-Aldrich, St. Louis,
MO, 22 USA). Equal amount of purified plastoglobule of WT and fbn4 KD apple trees based on
protein amount was used for lipid extraction. Retinal (Sigma-Aldrich, St. Louis, MO, 22 USA)
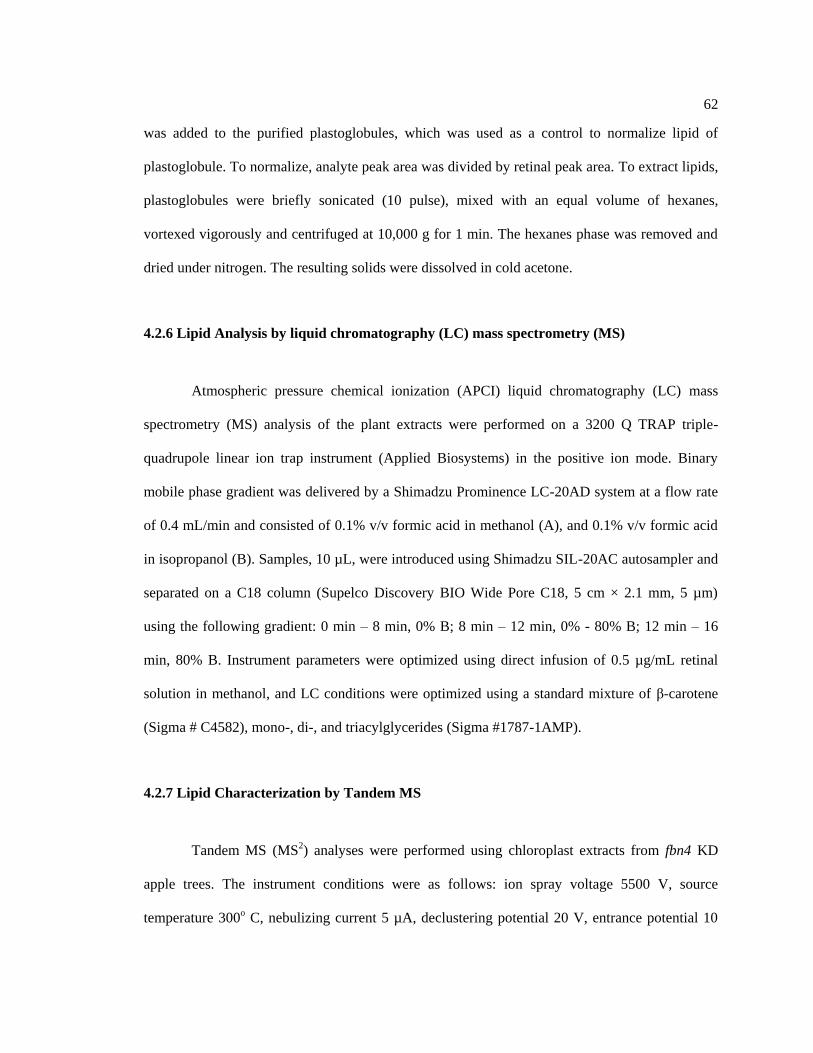
62
was added to the purified plastoglobules, which was used as a control to normalize lipid of
plastoglobule. To normalize, analyte peak area was divided by retinal peak area. To extract lipids,
plastoglobules were briefly sonicated (10 pulse), mixed with an equal volume of hexanes,
vortexed vigorously and centrifuged at 10,000 g for 1 min. The hexanes phase was removed and
dried under nitrogen. The resulting solids were dissolved in cold acetone.
4.2.6 Lipid Analysis by liquid chromatography (LC) mass spectrometry (MS)
Atmospheric pressure chemical ionization (APCI) liquid chromatography (LC) mass
spectrometry (MS) analysis of the plant extracts were performed on a 3200 Q TRAP triple-
quadrupole linear ion trap instrument (Applied Biosystems) in the positive ion mode. Binary
mobile phase gradient was delivered by a Shimadzu Prominence LC-20AD system at a flow rate
of 0.4 mL/min and consisted of 0.1% v/v formic acid in methanol (A), and 0.1% v/v formic acid
in isopropanol (B). Samples, 10 µL, were introduced using Shimadzu SIL-20AC autosampler and
separated on a C18 column (Supelco Discovery BIO Wide Pore C18, 5 cm × 2.1 mm, 5 µm)
using the following gradient: 0 min – 8 min, 0% B; 8 min – 12 min, 0% - 80% B; 12 min – 16
min, 80% B. Instrument parameters were optimized using direct infusion of 0.5 µg/mL retinal
solution in methanol, and LC conditions were optimized using a standard mixture of β-carotene
(Sigma # C4582), mono-, di-, and triacylglycerides (Sigma #1787-1AMP).
4.2.7 Lipid Characterization by Tandem MS
Tandem MS (MS2) analyses were performed using chloroplast extracts from fbn4 KD
apple trees. The instrument conditions were as follows: ion spray voltage 5500 V, source
temperature 300o C, nebulizing current 5 µA, declustering potential 20 V, entrance potential 10
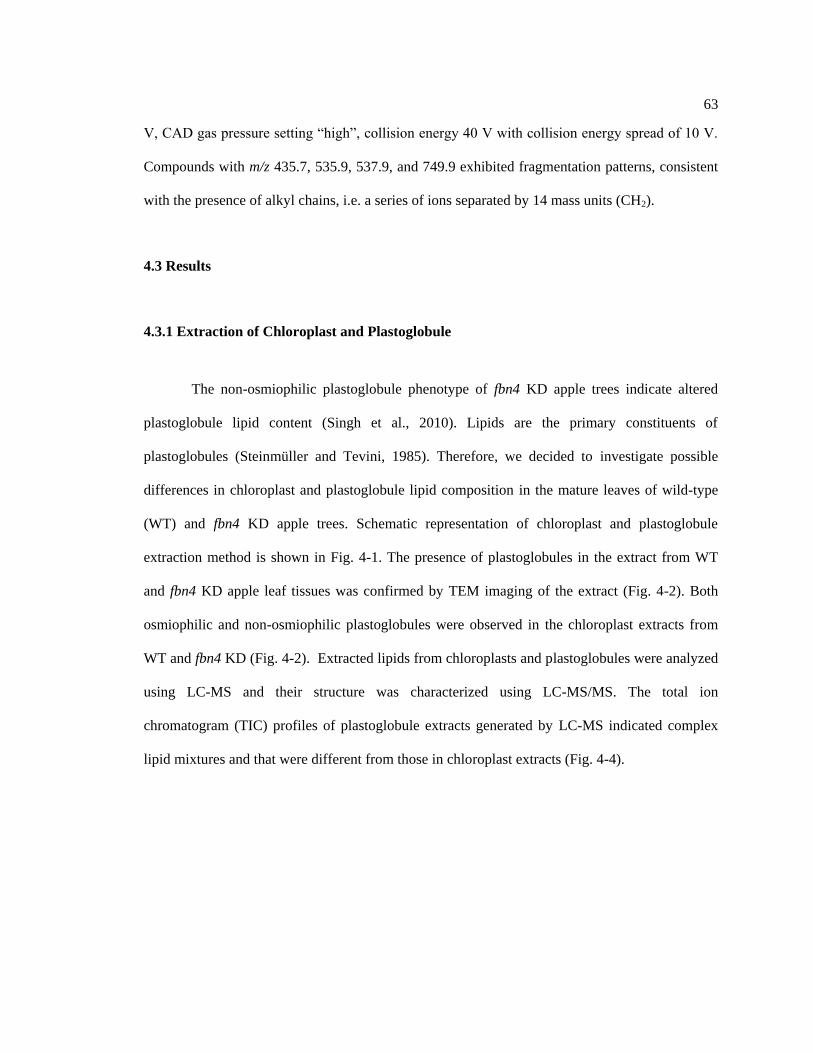
63
V, CAD gas pressure setting “high”, collision energy 40 V with collision energy spread of 10 V.
Compounds with m/z 435.7, 535.9, 537.9, and 749.9 exhibited fragmentation patterns, consistent
with the presence of alkyl chains, i.e. a series of ions separated by 14 mass units (CH2).
4.3 Results
4.3.1 Extraction of Chloroplast and Plastoglobule
The non-osmiophilic plastoglobule phenotype of fbn4 KD apple trees indicate altered
plastoglobule lipid content (Singh et al., 2010). Lipids are the primary constituents of
plastoglobules (Steinmüller and Tevini, 1985). Therefore, we decided to investigate possible
differences in chloroplast and plastoglobule lipid composition in the mature leaves of wild-type
(WT) and fbn4 KD apple trees. Schematic representation of chloroplast and plastoglobule
extraction method is shown in Fig. 4-1. The presence of plastoglobules in the extract from WT
and fbn4 KD apple leaf tissues was confirmed by TEM imaging of the extract (Fig. 4-2). Both
osmiophilic and non-osmiophilic plastoglobules were observed in the chloroplast extracts from
WT and fbn4 KD (Fig. 4-2). Extracted lipids from chloroplasts and plastoglobules were analyzed
using LC-MS and their structure was characterized using LC-MS/MS. The total ion
chromatogram (TIC) profiles of plastoglobule extracts generated by LC-MS indicated complex
lipid mixtures and that were different from those in chloroplast extracts (Fig. 4-4).

64
Figure 4-2: Transmission electron micrographs of plastoglobules extracted from mature leaves of
wild-type (WT) and fbn4 KD apple trees. Leaves were sampled from 4 to 5 months old trees
grown under 90 µE m–2 s–1 light intensity with a 12-h photoperiod. Extracted plastoglobules were
stained with OsO4. Transmission electron micrographs of electron opaque (black) and electron
transparent (white) plastoglobule extracted from wild-type (upper panel) and fbn4 KD (lower
panel). Electron opaque and electron transparent plastoglobules were observed in both WT and
fbn4 KD.
4.3.2 Full-scan LC-MS of chloroplast and plastoglobule lipid content
Full scan LC-MS was applied for comparison of relative lipid levels from plastoglobules
of WT and fbn4 KD apple trees. This provided a broad coverage of relative level of lipids in the
fbn
4
KD
W
T

65
sample; however, the ability to accurately quantitate individual lipids was compromised by the
complexity of the mixture. The objective of full scan LC-MS was to reduce the complexity of
spectra by choosing a small number of lipids for semi-quantitative comparison by applying an
LC-MS method that uses multiple ion monitoring (MIM). Targeted analysis of selected ions using
MIM reduced the chemical noise and increased the sensitivity, and thereby improved the quality
of MS data. The systematic error was reduced by using retinal as an external normalization
control to which the intensity of ions within each run was normalized. Retinal was selected for
this purpose because it was not detected in the plastoglobules and chloroplasts extracts. For
normalization of plastoglobule lipids, a known amount of retinal (MW 284; m/z 285.5, [M+H]+)
was added during extraction of plastoglobules. During the atmospheric pressure chemical
ionization (APCI) process, retinal undergoes in-source fragmentation forming a most prominent
fragment with m/z 269.9 (Fig. 4-3; Breemen et al., 1998). Both intact retinal and its fragment
exhibit the same retention time in TIC (Fig. 3-3).
Figure 4-3: Positive ionization Liquid chromatography–mass spectrometry (LC-MS) spectrum of
retinal. The upper panel is a mass chromatogram showing the retention time of retinal (blue line)
Inte
nsi
ty (
CP
S)
Inte
nsi
ty (
CP
S)

66
and its fragment (red line). The lower panel is mass spectrum of selected peak in mass
chromatogram (light blue; upper panel). The m/z of the retinal is (285.5 [M+H]+) and its fragment
is (269.9 [M+H]+).
Plastoglobules contain a complex mixture of lipids but the relative levels of most of lipids
are similar in WT and fbn4 KD (Fig. 4-4). Seven lipids whose normalized amounts were 35 times
more in the WT than in the fbn4 KD apple tree plastoglobule were selected for further analysis
using LC-MS MIM (Table 4-1). Such a high degree of difference was deemed necessary for
selection of lipids in full-scan LC-MS because the plastoglobule extracts are complex mixtures of
lipids resulting in variation due to chemical noise. Limiting the number of lipids also allows
better quantitation of analyte than full-scan LC-MS. Carotene (MW 536.8) was selected for LC-
MS MIM analysis, even though it was only 17 times as abundant in WT as in fbn4 KD, because
of its antioxidant property.
Inte
nsi
ty (
CP
S)
A
Figure continue to next page
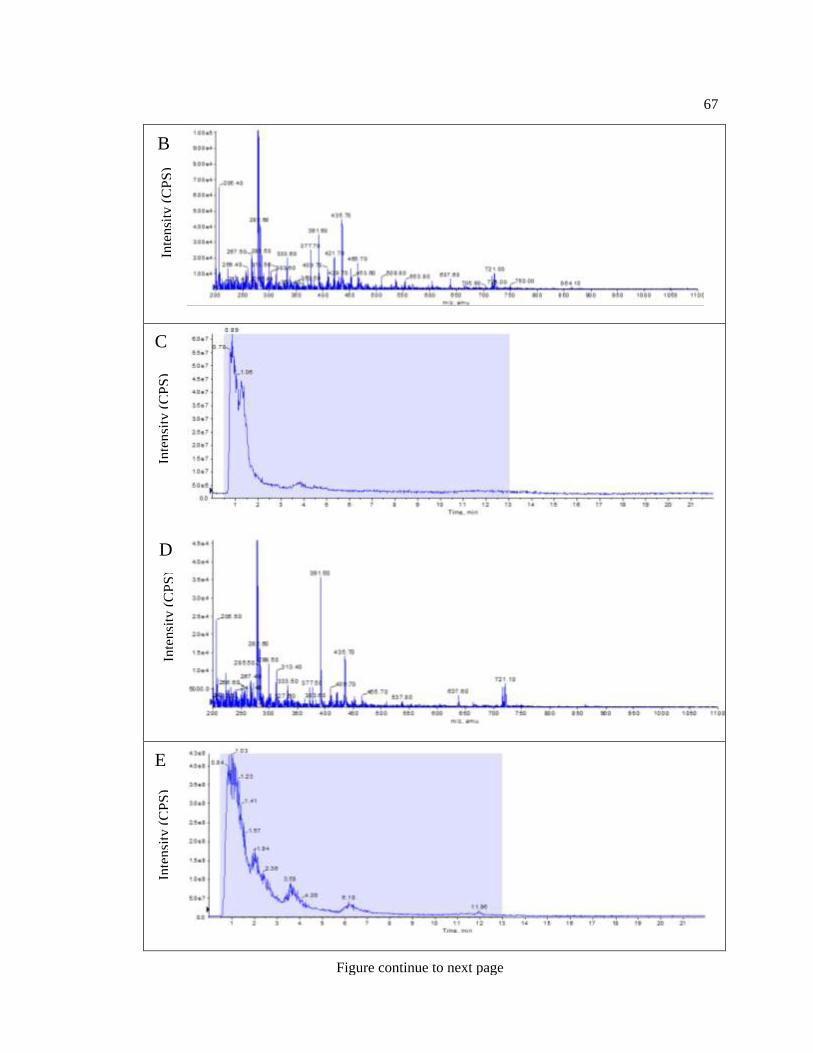
67
C
E
Inte
nsi
ty (
CP
S)
Inte
nsi
ty (
CP
S)
Inte
nsi
ty (
CP
S)
Inte
nsi
ty (
CP
S)
B
D
Figure continue to next page
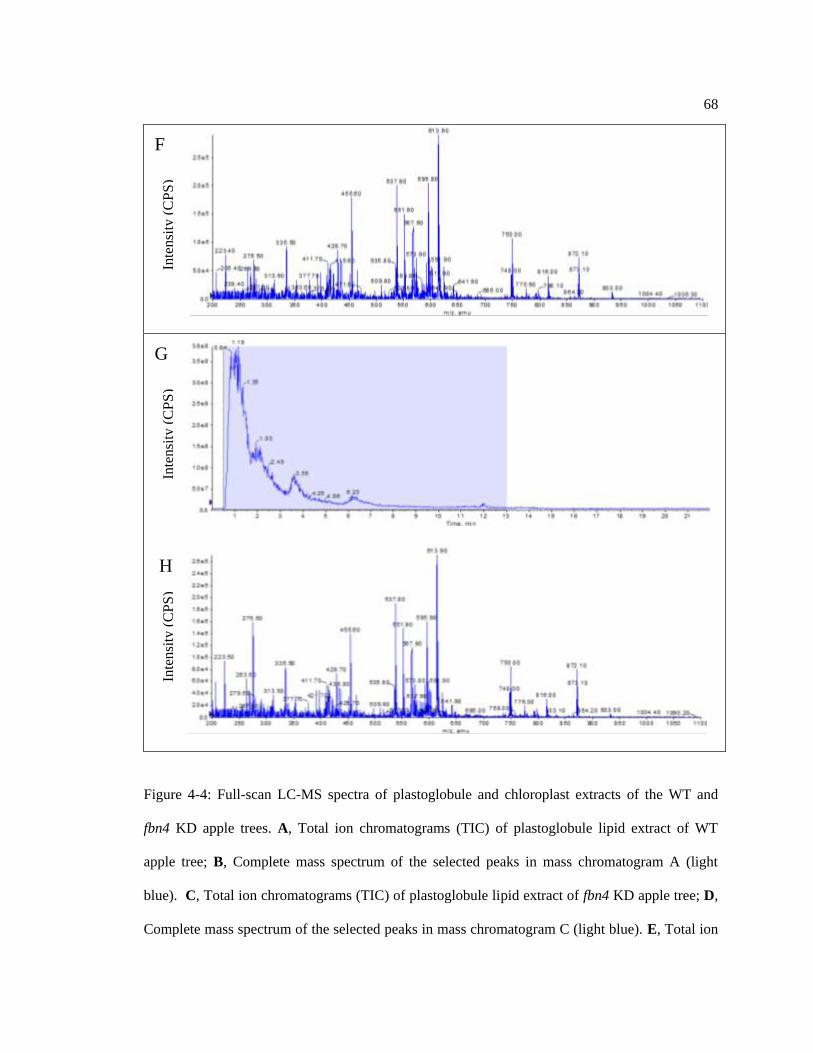
68
Figure 4-4: Full-scan LC-MS spectra of plastoglobule and chloroplast extracts of the WT and
fbn4 KD apple trees. A, Total ion chromatograms (TIC) of plastoglobule lipid extract of WT
apple tree; B, Complete mass spectrum of the selected peaks in mass chromatogram A (light
blue). C, Total ion chromatograms (TIC) of plastoglobule lipid extract of fbn4 KD apple tree; D,
Complete mass spectrum of the selected peaks in mass chromatogram C (light blue). E, Total ion
G
Inte
nsi
ty (
CP
S)
Inte
nsi
ty (
CP
S)
Inte
nsi
ty (
CP
S)
F
H
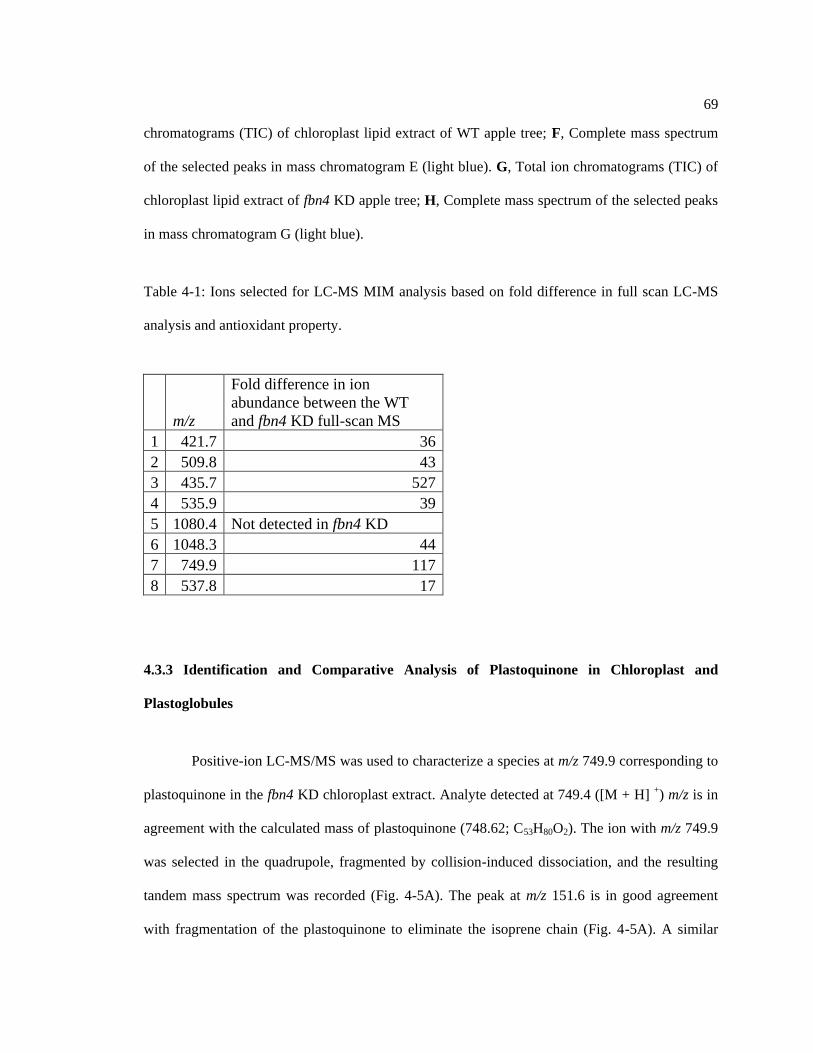
69
chromatograms (TIC) of chloroplast lipid extract of WT apple tree; F, Complete mass spectrum
of the selected peaks in mass chromatogram E (light blue). G, Total ion chromatograms (TIC) of
chloroplast lipid extract of fbn4 KD apple tree; H, Complete mass spectrum of the selected peaks
in mass chromatogram G (light blue).
Table 4-1: Ions selected for LC-MS MIM analysis based on fold difference in full scan LC-MS
analysis and antioxidant property.
m/z
Fold difference in ion
abundance between the WT
and fbn4 KD full-scan MS
1 421.7 36
2 509.8 43
3 435.7 527
4 535.9 39
5 1080.4 Not detected in fbn4 KD
6 1048.3 44
7 749.9 117
8 537.8 17
4.3.3 Identification and Comparative Analysis of Plastoquinone in Chloroplast and
Plastoglobules
Positive-ion LC-MS/MS was used to characterize a species at m/z 749.9 corresponding to
plastoquinone in the fbn4 KD chloroplast extract. Analyte detected at 749.4 ([M + H] +) m/z is in
agreement with the calculated mass of plastoquinone (748.62; C53H80O2). The ion with m/z 749.9
was selected in the quadrupole, fragmented by collision-induced dissociation, and the resulting
tandem mass spectrum was recorded (Fig. 4-5A). The peak at m/z 151.6 is in good agreement
with fragmentation of the plastoquinone to eliminate the isoprene chain (Fig. 4-5A). A similar

70
fragmentation pattern was observed in LC-MS/MS analysis of coenzyme Q, which is a
plastoquinone-related compound (Okamoto et al., 1985; Teshima and Kondo, 2005). This result
indicates that the analyte at 749.4 ([M + H] +) m/z is likely plastoquinone.
LC-MS MIM was applied to analyze plastoquinone level in chloroplasts and
plastoglobules of WT and fbn4 KD apple plant. The objective of MIM is to reduce complexity of
spectra by choosing a limited number of lipids for semi-quantitative comparison. Retinal was
used in LC-MS MIM analysis as a control to normalize the intensity of ions within each run,
similarly to its use in full-scan LC-MS. The plastoquinone level was similar in the leaf
chloroplasts of WT and fbn4 KD apple trees (Fig. 4-5B). However, plastoquinone was
approximately 13 times as abundant in the plastoglobules from the WT apple tree as in the
plastoglobules from fbn4 KD apple trees (Fig. 4-5C). These results suggest that the relative
amount of plastoquinone is lower in the plastoglobules of fbn4 KD trees than WT, but the
amounts of plastoquinone are similar in the chloroplasts of the two plant genotypes.
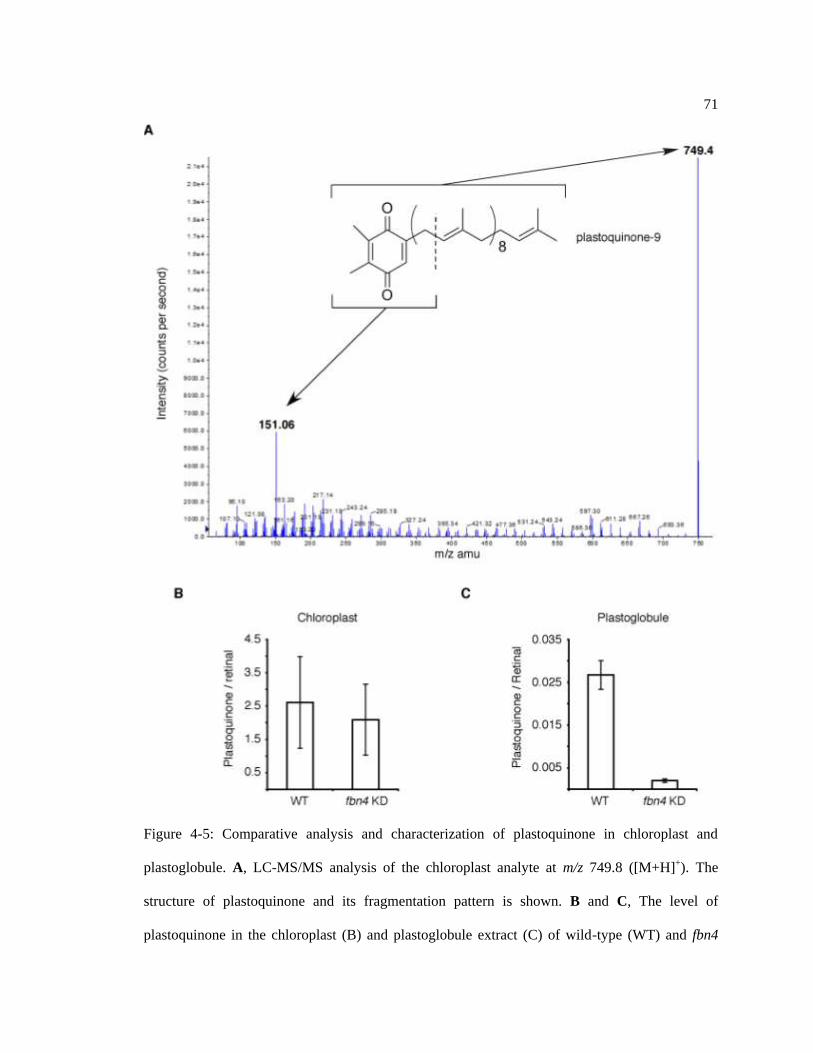
71
Figure 4-5: Comparative analysis and characterization of plastoquinone in chloroplast and
plastoglobule. A, LC-MS/MS analysis of the chloroplast analyte at m/z 749.8 ([M+H]+). The
structure of plastoquinone and its fragmentation pattern is shown. B and C, The level of
plastoquinone in the chloroplast (B) and plastoglobule extract (C) of wild-type (WT) and fbn4

72
KD apple trees was normalized to retinal that was added to the plastoglobules and chloroplast
during extraction process. Data are means ± SD of three measurements; * P < 0.05 using
Student‟s t test. Similar results were obtained in a separate biological experiment.
4.3.4 Comparative Analysis of Analyte at m/z 435.36 in Chloroplast and Plastoglobules
LC-MS/MS was used to further characterize the analyte at m/z 435.36 ([M+H]+). None of
the identified plastoglobule lipids has MW 434.36. However, the plastoglobule lipids have not
been studied comprehensively. LC-MS/MS indicated that this analyte has at least two O atoms
suggested by formation of 417.42 from 435.36 and formation of 389.34 from 407.40 as their mass
difference is 18, the weight of an H2O molecule (Fig. 4-6A). This analyte has an alkyl chain as
several fragments have mass difference of 14, the weight of a CH2 molecule. However, it is
difficult to predict the structure of this analyte based on the molecular weight and fragmentation
pattern using LC-MS/MS.
Analyte at m/z 435.36 ([M+H]+) in chloroplasts and plastoglobules of WT and fbn4 KD
apple trees was analyzed using LC-MS MIM. Level of analyte, normalized to retinal, was similar
in the chloroplasts of WT and fbn4 KD apple trees (Fig. 4-6B). However, in plastoglobules of
WT apple trees there was approximately 1.48 times as much m/z 435.36 ([M+H]+) as in fbn4 KD
(Fig. 4-3C). These results suggest that m/z 435.36 ([M+H]+) is similarly abundant in chloroplast
of WT and fbn4 KD but less in plastoglobule of the fbn4 KD than in WT.

73
Figure 4-6: Comparative analysis and characterization of analyte at m/z 435.36 in chloroplast and
plastoglobule. A, LC-MS/MS analysis of the chloroplast analyte at m/z 435.36 ([M+H]+). B and
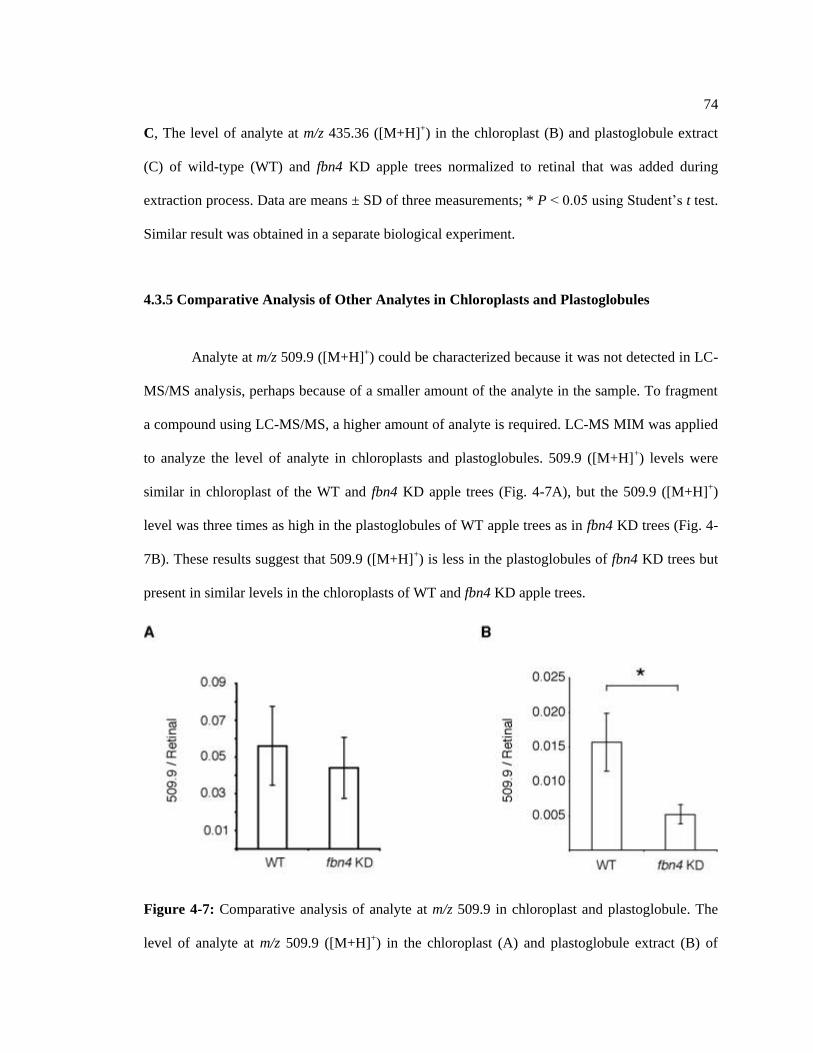
74
C, The level of analyte at m/z 435.36 ([M+H]+) in the chloroplast (B) and plastoglobule extract
(C) of wild-type (WT) and fbn4 KD apple trees normalized to retinal that was added during
extraction process. Data are means ± SD of three measurements; * P < 0.05 using Student‟s t test.
Similar result was obtained in a separate biological experiment.
4.3.5 Comparative Analysis of Other Analytes in Chloroplasts and Plastoglobules
Analyte at m/z 509.9 ([M+H]+) could be characterized because it was not detected in LC-
MS/MS analysis, perhaps because of a smaller amount of the analyte in the sample. To fragment
a compound using LC-MS/MS, a higher amount of analyte is required. LC-MS MIM was applied
to analyze the level of analyte in chloroplasts and plastoglobules. 509.9 ([M+H]+) levels were
similar in chloroplast of the WT and fbn4 KD apple trees (Fig. 4-7A), but the 509.9 ([M+H]+)
level was three times as high in the plastoglobules of WT apple trees as in fbn4 KD trees (Fig. 4-
7B). These results suggest that 509.9 ([M+H]+) is less in the plastoglobules of fbn4 KD trees but
present in similar levels in the chloroplasts of WT and fbn4 KD apple trees.
Figure 4-7: Comparative analysis of analyte at m/z 509.9 in chloroplast and plastoglobule. The
level of analyte at m/z 509.9 ([M+H]+) in the chloroplast (A) and plastoglobule extract (B) of

75
wild-type (WT) and fbn4 KD apple trees normalized to retinal that was added during extraction
process. Data are means ± SD of three measurements; * P < 0.05 using Student‟s t test. Similar
result was obtained in a separate biological experiment.
Other lipids studied were similar in chloroplast of WT and fbn4 KD apple trees. The
levels of these lipids were higher in the plastoglobules of WT than in fbn4 KD apple trees, but
their relative levels were variable in three biological replicates. Variability of the lipids might be
because these lipids are variably unstable.
4.4 Discussion
Lipids have been classified into eight categories by the LIPID MAPS consortium (Sud et
al., 2007). Plastoglobules contain a complex mixture of lipids representing at least three of these
categories: 1) the prenol lipids plastoquinone, α-tocopherol, plastohydroquinone, phylloquinone
K, carotenoids; 2) glycerolipid triacylglycerols; and 3) free fatty acids from the fatty acyl
category. In addition, plastoglobules contain glycolipids and phospholipids (Tevini and
Steinmüller, 1985; Steinmüller and Tevini, 1985), which could not be grouped into any lipids
categories because of insufficient information about these lipids. Despite recent advances in
lipidomic analysis, different categories of lipids cannot be analyzed in one step because of their
different chemical properties, such as functional group and polarity (Shui et al., 2010; reviewed in
Blanksby and Mitchell, 2010). APCI LC-MS was used in this study to analyze the major
plastoglobule lipids such as prenol lipids and glycerolipids.
Interestingly, plastoquinone is approximately 13 times as abundant in the plastoglobules
of WT trees as in fbn4 KD plants, although plastoquinone levels are similar in the chloroplasts of
both genotypes. This result indicates that although plastoquinone levels are similar in the

76
chloroplasts of fbn4 KD and WT leaves, the accumulation of plastoquinone in the plastoglobules
is altered, perhaps due to reduced availability of the FBN4 protein. This could further suggest that
FBN4 protein plays an important role in the accumulation of plastoquinone in the plastoglobules.
Analysis of the FBN4 protein sequence revealed the presence of a conserved lipocalin domain in
the N terminal portion of the protein (Fig. 2-1). Proteins with a lipocalin domain are known to
bind and transport small hydrophobic molecules such as lipids and steroids (Flower, 1996; Flower
et al., 2000). In addition, FBN4 is localized on the thylakoids (Peltier, 2002; Friso, 2004) and
plastoglobules (Vidi, 2006; Ytterberg, 2006). Similarly, plastoquinone, a hydrophobic molecule,
is also localized in the thylakoid and plastoglobules (Trebst, 1978; Kovalenko et al., 2003). FBN4
protein might be involved in the transport of plastoquinone from thylakoids to plastoglobules.
The lower level of plastoquinone in the plastoglobule of fbn4 KD might not be due to a
reduced ability of these plants to transport or accumulate plastoquinone biosynthesis precursors to
the plastoglobule. Plastoquinone is synthesized on the thylakoid and chloroplast membrane (Soll
et al., 1980). Furthermore, known plastoquinone biosynthesis enzymes are not present in
plastoglobules (Vidi et al., 2006; Ytterberg et al., 2006).
It could be proposed that a potential lower level of plastoquinone in the plastoglobules
could lead to a significant reduction in the total plastoquinone in the chloroplasts considering that
the plastoglobules contains a significant proportion (20% to 75%) of the total chloroplast
plastoquinone (Barr, et al., 1967; Bishop, 1971). However, our results demonstrated similar levels
of plastoquinone in the chloroplasts of fbn4 KD and WT leaves which could be explained by
mislocalization of plastoquinone outside the plastoglobules in the chloroplasts of knockdown
plant.
Higher plastoquinone levels in the thylakoids could result in increased photosynthesis
rate of the fbn4 KD apple trees. Plastoquinone performs an obligatory electron carrier function
from photosystem II to photosystem I during photosynthesis (Trebst, 1978). The lower level of

77
plastoquinone in the plastoglobule of fbn4 KD than in WT but similar in the chloroplasts of both
types could result in a higher level of plastoquinone in the thylakoid of fbn4 KD trees. The higher
photosynthesis rate of the fbn4 KD apple trees at 100 µE photosynthetically active radiation
(Singh et al., 2010) could be due to higher plastoquinone level in the thalakoids. Furthermore,
fbn4 KD apple trees have higher level of superoxide radical upon MV treatment (Singh et al.,
2010). Higher plastoquinone level in the thylakoids of fbn4 KD apple trees might increase
photosynthesis electron transport rate leading to higher superoxide radical formation upon MV
treatment in fbn4 KD trees. MV generates ROS in chloroplasts by intercepting electrons between
the bound ferredoxin acceptors and NADP and then reducing oxygen to superoxide (O2–) (Taiz
and Zeiger, 2006).
Plastoquinone performs an obligatory electron carrier function from photosystem II to
photosystem I during photosynthesis (Trebst, 1978). One consequence of the reduced level of
plastoquinone in the plastoglobules of fbn4 KD but not affected total chloroplasts content could
contribute to accumulation of higher levels of plastoquinone along the thylakoids of fbn4 KD
chloroplasts that could potentially cause increased photosynthesis rates in the leaves of fbn4 KD
apple trees. Our data indicated that fbn4 KD apple trees had higher photosynthesis rate of the at
100 µE photosynthetically active radiation compared to WT (Singh et al., 2010) that could be due
to the higher plastoquinone level in the thylakoids. Furthermore, fbn4 KD apple trees had higher
level of superoxide radical accumulation as a result of MV treatment (Singh et al., 2010). MV
generates ROS in chloroplasts by intercepting electrons between the bound ferredoxin acceptors
and NADP and then reducing oxygen to superoxide (O2–) (Taiz and Zeiger, 2006). The higher
superoxide radical accumulation could be a consequence of the increased photosynthesis electron
transport rate leading in fbn4 KD leaves and/or potential reduced ability of the plants to scavenge
the ROS.
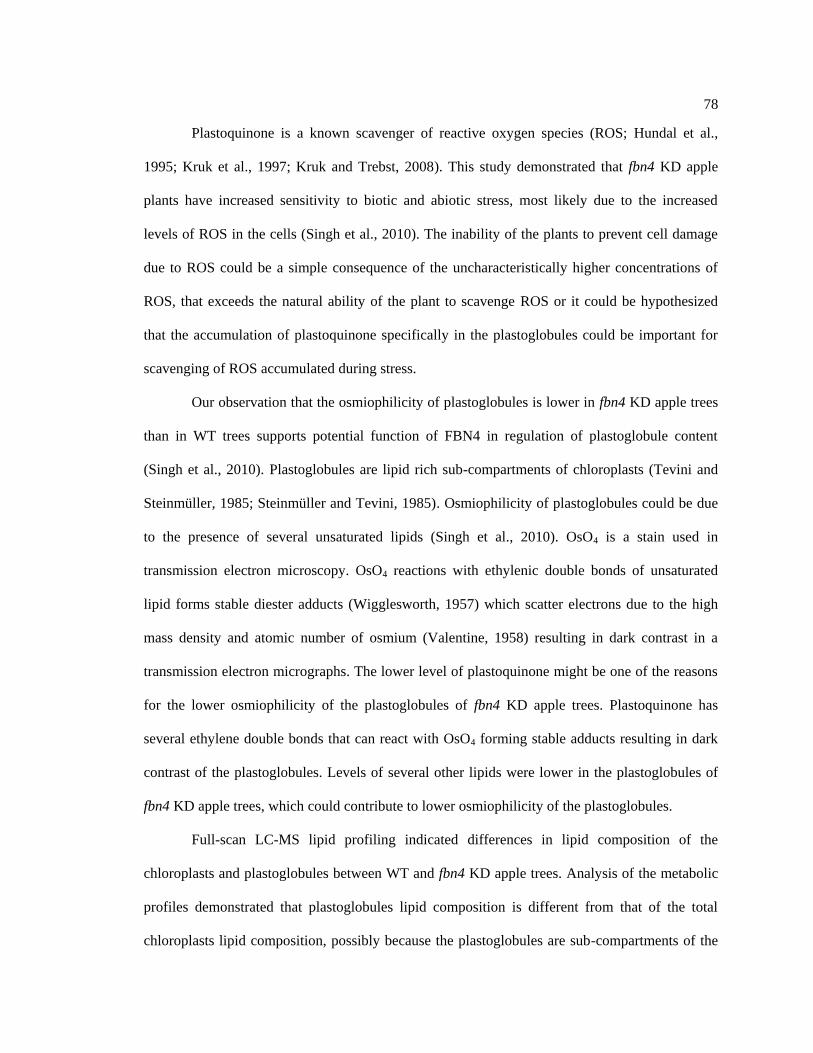
78
Plastoquinone is a known scavenger of reactive oxygen species (ROS; Hundal et al.,
1995; Kruk et al., 1997; Kruk and Trebst, 2008). This study demonstrated that fbn4 KD apple
plants have increased sensitivity to biotic and abiotic stress, most likely due to the increased
levels of ROS in the cells (Singh et al., 2010). The inability of the plants to prevent cell damage
due to ROS could be a simple consequence of the uncharacteristically higher concentrations of
ROS, that exceeds the natural ability of the plant to scavenge ROS or it could be hypothesized
that the accumulation of plastoquinone specifically in the plastoglobules could be important for
scavenging of ROS accumulated during stress.
Our observation that the osmiophilicity of plastoglobules is lower in fbn4 KD apple trees
than in WT trees supports potential function of FBN4 in regulation of plastoglobule content
(Singh et al., 2010). Plastoglobules are lipid rich sub-compartments of chloroplasts (Tevini and
Steinmüller, 1985; Steinmüller and Tevini, 1985). Osmiophilicity of plastoglobules could be due
to the presence of several unsaturated lipids (Singh et al., 2010). OsO4 is a stain used in
transmission electron microscopy. OsO4 reactions with ethylenic double bonds of unsaturated
lipid forms stable diester adducts (Wigglesworth, 1957) which scatter electrons due to the high
mass density and atomic number of osmium (Valentine, 1958) resulting in dark contrast in a
transmission electron micrographs. The lower level of plastoquinone might be one of the reasons
for the lower osmiophilicity of the plastoglobules of fbn4 KD apple trees. Plastoquinone has
several ethylene double bonds that can react with OsO4 forming stable adducts resulting in dark
contrast of the plastoglobules. Levels of several other lipids were lower in the plastoglobules of
fbn4 KD apple trees, which could contribute to lower osmiophilicity of the plastoglobules.
Full-scan LC-MS lipid profiling indicated differences in lipid composition of the
chloroplasts and plastoglobules between WT and fbn4 KD apple trees. Analysis of the metabolic
profiles demonstrated that plastoglobules lipid composition is different from that of the total
chloroplasts lipid composition, possibly because the plastoglobules are sub-compartments of the

79
chloroplasts containing only a subset of the chloroplast lipids. Furthermore, most of the lipids
were similar in the plastoglobules of WT and fbn4 KD plant indicating FBN4 protein functions in
the accumulation of only a specific set of lipids in the plastoglobules The differences between
plastoglobules from the fbn4 KD and WT plants observed by TEM and the recorded susceptibility
of fbn4 KD to biotic and abiotic stress (Singh et al., 2010) could be the cumulative effect of
lower levels of plastoquinone, and the analytes at m/z 509.9 ([M+H]+) and m/z 435.36 ([M+H]+)
in the plastoglobules of fbn4 KD trees.
80
Chapter 5
Characterizing Fibrillin4 Overexpresser Apple and Arabidopsis Plants

81
5.1 Introduction
Fibrillin proteins are found in some prokaryotes, algae and plants (Laizet et al., 2004).
Fibrillin proteins from plants and Chlamydomonas can be divided in 12 sub-families (Singh and
McNellis, 2011). Fibrillins are suggested to function in plastoglobule formation and plastoglobule
lipid content regulation, chromoplast pigment accumulation, hormone regulation, and plant
defense during biotic and abiotic stress (Reviewed in Singh and McNellis, 2011).
Nine of 13 Arabidopsis fibrillin proteins are found in the plastoglobules (Vidi et al.,
2006; Ytterberg et al., 2006). Plastoglobules are lipoprotein sub-compartments found in plastids.
In the chloroplast, plastoglobules are suggested to originate from the thylakoid and remain
attached to it (Austin et al., 2006). Fibrillins are present on the membrane of the plastoglobule
(Pozueta-Romero et al., 1997), where they are suggested to maintain the structures of
plastoglobules and prevent their coalescence (Deruère et al., 1994; Pozueta-Romero et al., 1997;
Langenkämper et al., 2001; Vidi et al., 2006; Bréhélin et al., 2007). Overexpression of FBN1 in
Nicotiana tabacum (tobacco) results in increased number of plastoglobules, but the FBN1 protein
level per plastoglobule remains similar to that seen in wild-type plants (Rey et al., 2000).
Plastoglobules are thought to function during plant development, and during biotic and
abiotic stress. The numbers and osmiophilicity of plastoglobules change during stress (Bréhélin et
al., 2007). Some of the lipids in plastoglobules are plastoquinone, carotenes, and tocopherols,
which are potential reactive oxygen species (ROS) scavengers (Steinmüller and Tevini, 1985;
Tevini and Steinmüller, 1985). Plastoglobules also contain tocopherol cyclase enzyme, which
synthesizes γ-tocopherol (Austin et al., 2006; Vidi et al., 2006). During ozone stress the
plastoglobule osmiophilicity decreases in apple Malus X domestica (Singh et al., 2010), radish
Raphanus sativus (Miyake et al., 1989), and Norway spruce Picea abies (Kivimäenpää et al.,
2003) suggesting that plastoglobules function in abiotic stress.
82
Several studies suggest that fibrillins function in biotic stress. Expression and protein
levels of several fibrillins are differentially regulated in plants challenged by pathogens (reviewed
in Singh and McNellis, 2011). Transgenic RNAi Solanum lycopersicum (tomato) plant with
reduced expression level of fibrillin (LeCHRC) and transgenic RNAi apple trees with reduced
expression of FBN4 were more sensitive to the fungus Botrytis cinerea (Leitner-Dagan et al.,
2006) and bacterium Erwinia amylovora (Singh et al., 2010), respectively. Arabidopsis mutants
fbn1b (At4g22240), fbn4 (At3g23400) were more susceptible to Pseudomonas syringae than
wild-type plants (Cooper et al., 2003; Singh et al., 2010). LeCHRC overexpressing tomato plants
were more tolerant of Botrytis cinerea than wild-type plants (Leitner-Dagan et al., 2006). Another
Fibrillin protein, FBN1a (FIB1a), interacts with a defense-related protein, OsSGT1 (suppressor of
G2 allele of skp1) (Cooper et al., 2003). HarpinN (HrpN), an effector protein secreted by the
necrogenic bacterium E. amylovora, interacts with FBN4 protein of Arabidopsis in yeast-two
hybrid assay (Song et al., 2002). This indicates that FBN4 could be a target or a receptor of HrpN
protein (Song et al., 2002). The FBN4 expression is induced in tobacco plants treated with
lipopolysaccharide from a bacterium Burkholderia cepacia (Sanabria and Dubery, 2006) and
phosphorylated in a pathogen-associated molecular pattern responsive manner in Arabidopsis
(Jones et al., 2006) further indicates FBN4 function in plants during biotic stress.
Evidence from literature and my research supports that fibrillins function in plant
response to abiotic stress. Expression and protein levels of several fibrillins are differentially
regulated in plants during abiotic stress (Singh and McNellis, 2010). fbn4 KD apple trees were
more sensitive to high ozone concentration and high light intensity, and fbn4 mutant Arabidopsis
plants were more sensitive to ozone (Singh et al., 2010). FBN4 KD apple trees might have
reduced ROS scavenging ability: a higher superoxide level was observed in knockdown trees
upon MV treatment (Singh et al., 2010). Reduced expression of the FBN1a gene in Arabidopsis
reduced the plant‟s PSII phototolerance and overexpression of FBN1a enhanced the plant‟s PSII
83
phototolerance (Yang et al., 2006). Reduced expression of FBN1 and FBN2 genes in Arabidopsis
using RNA interference increased the plant‟s sensitivity to photo-inhibition and had a lower level
of reduced ascorbate when exposed to high light and cold, suggesting higher level of oxidative
stress in these plants (Youssef et al., 2010). Mutation of pgl1 and pgl2 fibrillin genes in
cyanobacteria Synechocystis results in increase sensitivity to high light increases photosensitivity
(Cunningham et al., 2010), indicating that the fibrillins function in cyanobacteria as they do in
plants to increase tolerance to oxidative stress.
FBN4 is involved in plant defense during biotic and abiotic stress (Singh et al., 2010).
fbn4 KD apple trees and fbn4 mutant Arabidopsis plants had increased susceptibility to biotic and
abiotic stress (Singh et al., 2010). In addition, fbn4 KD apple trees had increased sensitivity to
methyl viologen (MV) and accumulated a higher level of superoxide radical upon MV treatment
(Singh et al., 2010). Furthermore, fewer osmiophilic plastoglobules and a lower level of
plastoquinone and other lipids were observed in fbn4 KD apple leaves than in the wild type
(Singh et al., 2010; chapter 4 of this thesis). Here, FBN4 overexpresser apple and Arabidopsis
plants were developed to test whether increasing expression of FBN4 increases plant tolerance to
biotic and abiotic stress. Overexpression of FBN4 in transgenic apple and Arabidopsis plants will
allow further understanding of its function during biotic and abiotic stress.
5.2 Materials and Methods
5.2.1 Plant Materials
Arabidopsis (Arabidopsis thaliana) and apple (Malus X domestica) plants were grown in
potting mix (Redi-Earth) as described previously (Singh et al., 2010). Transgenic apple trees
overexpressing FBN4 were generated by transforming „Royal Gala‟ cultivar with p131GH00.131
84
(Maximova et al., 2003) vector containing apple FBN4 cDNA under the control of the E12-35S-
Omega promoter (Mitsuhara et al., 1996) using Agrobacterium-mediated transformation protocol
as described previously (Maximova et al., 1998). FBN4 overexpresser Arabidopsis plants were
generated by transforming Columbia-0 (Col-0) and fbn4-1 T-DNA insertion mutant with pGWB2
vector containing Arabidopsis FBN4 cDNA under the control of the cauliflower mosaic virus
(CaMV) 35S promoter using Agrobacterium. Flower dip method was used to transformation
Arabidopsis plants (Clough and Bent, 1998). Transgenic FBN4 overexpresser Arabidopsis plants
were grown and selected on kanamycin- and hygromycin-containing MSMO media (Sigma-
Aldrich, St. Louis, MO, 22 USA) and genotyped by genomic PCR using transgene specific
primers.
5.2.2 RNA Extraction, DNA Extraction, and PCR
Total RNA extraction from apple and Arabidopsis leaves, primers and methods for
conventional PCR, and quantitative real-time PCR analysis protocols were performed as
previously described (Singh et al., 2010). Overexpression of FBN4 in the transgenic Arabidopsis
plants was confirmed by performing genomic PCR and transgene specific primers. The specific
primers used were: CaMV 35S promoter (5‟GAACTCGCCGTAAAGACTGG3‟) and FBN4
cDNA (5‟CCCGTGTTCTCTCCAAATG3‟). Genomic DNA was extracted from leaf tissue of
Arabidopsis using standard method by (Kasajima et al., 2004). Advantage 2 PCR enzyme system
kit (Clontech) was used to perform PCR per manufacturer‟s instructions.
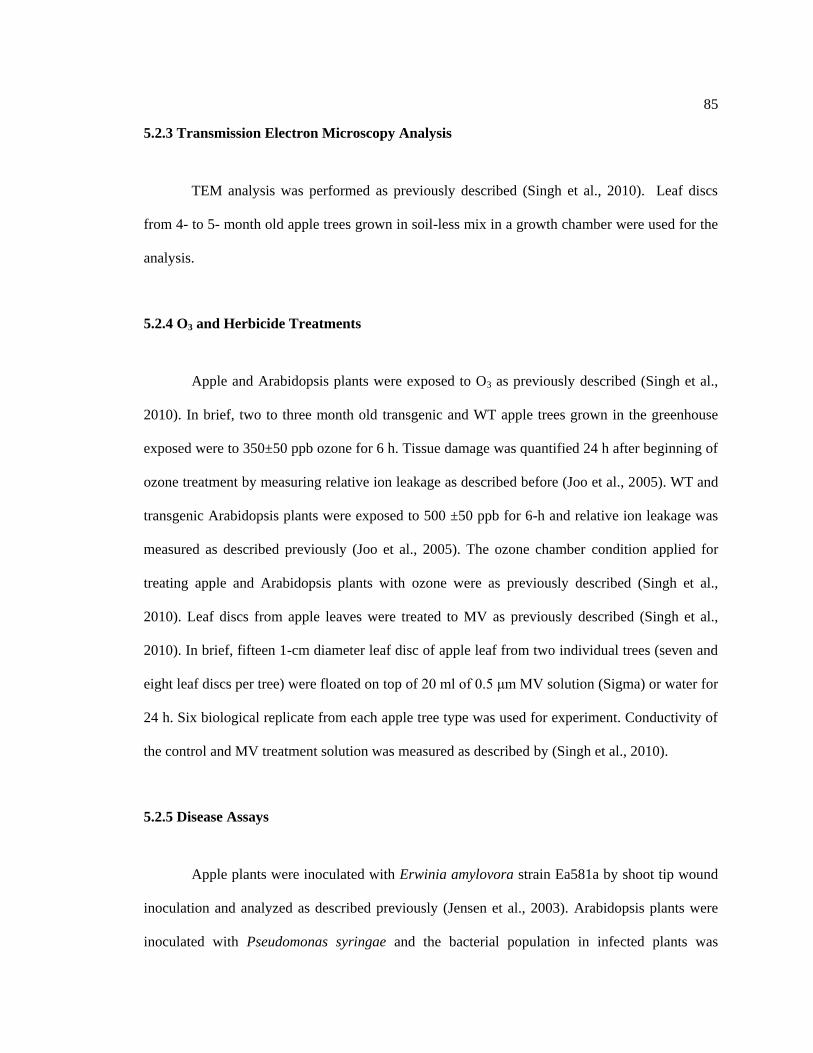
85
5.2.3 Transmission Electron Microscopy Analysis
TEM analysis was performed as previously described (Singh et al., 2010). Leaf discs
from 4- to 5- month old apple trees grown in soil-less mix in a growth chamber were used for the
analysis.
5.2.4 O3 and Herbicide Treatments
Apple and Arabidopsis plants were exposed to O3 as previously described (Singh et al.,
2010). In brief, two to three month old transgenic and WT apple trees grown in the greenhouse
exposed were to 350±50 ppb ozone for 6 h. Tissue damage was quantified 24 h after beginning of
ozone treatment by measuring relative ion leakage as described before (Joo et al., 2005). WT and
transgenic Arabidopsis plants were exposed to 500 ±50 ppb for 6-h and relative ion leakage was
measured as described previously (Joo et al., 2005). The ozone chamber condition applied for
treating apple and Arabidopsis plants with ozone were as previously described (Singh et al.,
2010). Leaf discs from apple leaves were treated to MV as previously described (Singh et al.,
2010). In brief, fifteen 1-cm diameter leaf disc of apple leaf from two individual trees (seven and
eight leaf discs per tree) were floated on top of 20 ml of 0.5 μm MV solution (Sigma) or water for
24 h. Six biological replicate from each apple tree type was used for experiment. Conductivity of
the control and MV treatment solution was measured as described by (Singh et al., 2010).
5.2.5 Disease Assays
Apple plants were inoculated with Erwinia amylovora strain Ea581a by shoot tip wound
inoculation and analyzed as described previously (Jensen et al., 2003). Arabidopsis plants were
inoculated with Pseudomonas syringae and the bacterial population in infected plants was
86
analyzed as previously described (Jambunathan et al., 2001). Relative ion leakage of the infected
plants was measured as describe previously (Singh et al., 2010).
5.3 Results
5.3.1 Overexpression of FBN4 Gene in Apple and Arabidopsis
Repeated attempts to introduce the apple (Malus x domestica) FBN4 cDNA (MdFBN4)
under the control of the E12-Omega promoter (E12Ω::MdFBN4) into apple resulted in the
production of a single E12Ω::MdFBN4 apple transgenic line in the „Royal Gala‟ cultivar. This
apple FBN4 overexpression (FO) line had significantly higher levels of MdFBN4 transcript as
measured by quantitative RT-PCR relative to wild-type „Royal Gala‟ (WT) plants and “empty
vector” transformation control (EV) plants containing the transformation marker genes neomycin
phosphotransferase II (NPTII) and enhanced green fluorescent protein (EGFP), but not the
35S::MdFBN4 cassette (Fig. 5-1A). Under normal laboratory growth conditions, FO apple plants
had a phenotype indistinguishable from WT and transgenic vector control (VC) trees (Fig. 5-1B).
The Arabidopsis FBN4 (AtFBN4) cDNA under the control of the CaMV 35S promoter
(35S::AtFBN4) was introduced into the Arabidopsis Columbia-0 (Col-0) wild-type and fbn4-1
mutant (Singh et al., 2010) genetic backgrounds. The transformants were selected by growing
them on kanamycin/hygromycin containing Murashige & Skoog Medium with Minimal Organics
(MSMO) media. Transformation was confirmed by PCR using genomic DNA from overexpresser
lines and primer pair PGWB2Fwd-501Rev (Fig. 5-1C). Stably transformed Arabidopsis
35S::AtFBN4 transgenic lines had elevated levels of AtFBN4 transcript as measured by RT-PCR
(Fig. 5-1D).
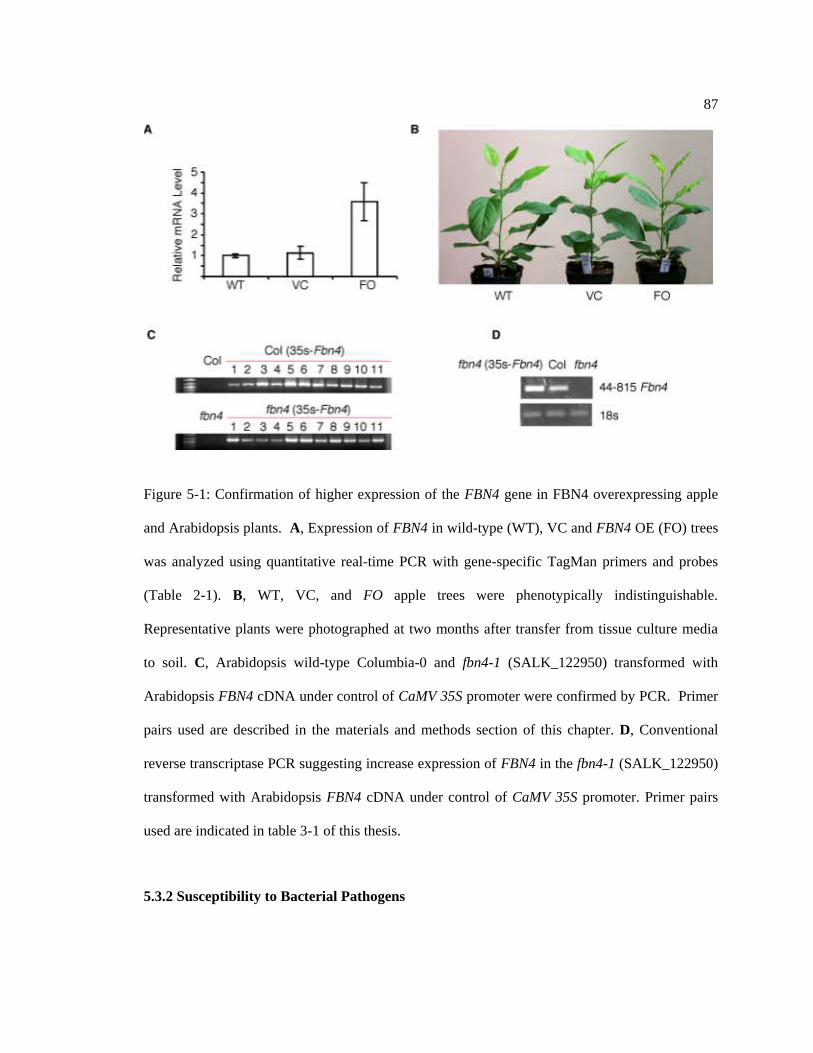
87
Figure 5-1: Confirmation of higher expression of the FBN4 gene in FBN4 overexpressing apple
and Arabidopsis plants. A, Expression of FBN4 in wild-type (WT), VC and FBN4 OE (FO) trees
was analyzed using quantitative real-time PCR with gene-specific TagMan primers and probes
(Table 2-1). B, WT, VC, and FO apple trees were phenotypically indistinguishable.
Representative plants were photographed at two months after transfer from tissue culture media
to soil. C, Arabidopsis wild-type Columbia-0 and fbn4-1 (SALK_122950) transformed with
Arabidopsis FBN4 cDNA under control of CaMV 35S promoter were confirmed by PCR. Primer
pairs used are described in the materials and methods section of this chapter. D, Conventional
reverse transcriptase PCR suggesting increase expression of FBN4 in the fbn4-1 (SALK_122950)
transformed with Arabidopsis FBN4 cDNA under control of CaMV 35S promoter. Primer pairs
used are indicated in table 3-1 of this thesis.
5.3.2 Susceptibility to Bacterial Pathogens

88
Mutation of FBN4 in Arabidopsis and knockdown of FBN4 expression in apple causes
increased susceptibility to the bacterial pathogens Pseudomonas syringae pv. tomato (P. s. t.) and
Erwinia amylovora, respectively (Singh et al., 2010). Therefore, we reasoned that plants
overexpressing FBN4 might be more resistant to those same pathogens. Overexpression of FNB4
cDNA in the fbn4-1 mutant genetic background complemented the increased susceptibility
phenotype of fbn4-1, resulting in bacterial growth levels similar to Col-0 wild-type plants (Fig. 5-
2B).
Susceptibility of WT, EV, and FO apple trees to E. amylovora was tested by inoculating
with 108 colony forming units (cfu) of bacterium at wounded shoot tips, and progression of
necrosis symptoms was measured at one week intervals for three weeks. Shoot necrosis, as a
percentage of total shoot length is a standard, quantitative measure of fire blight disease severity
that correlates well with resistance to natural infection (Parker et al., 1974; Ko et al., 2000; Lee et
al., 2010). Consistent with FBN4 overexpressing Arabidopsis plants, susceptibility to P. s. t., FO
apple trees had no change in resistance to E. amylovora compared to wild-type and
transformation control plants (Figure 5-2A).
Figure 5-2: FBN4 overexpresser Arabidopsis and apple plant susceptibility to bacterial pathogens.
A, Apple plants were maintained under 90 µE m-2 s-1 light intensity, with a 12-h photoperiod, for
A B
89
the duration of the experiments. Fire blight disease severity (necrotic zone size) is shown in wild-
type, VC, and FO trees at 7, 14, and 21 dpi with 108 cfu mL-1 E. amylovora. Data are from one
representative experiment; the experiment was repeated tree times with similar results. Data are
means ± SE; * P, 0.05 using Student‟s t test. B, P. s. t. population levels in Col-0, fbn4-1 (fbn4),
and fbn4-1 transformed with 35S::FBN4 (fbn4-35S::FBN4) Arabidopsis plant leaves at 4 dpi with
104 cfu mL-1 bacterium. Data are means ± SE; n = 5 per genotype/ experiment; * P, 0.05 using
Student‟s t test. Arabidopsis plants were maintained under 90 µE m-2 s-1 light intensity with10-h
photoperiod for the duration of the experiments.
5.3.3 Sensitivity to Ozone and Methyl Viologen
Mutation of FBN4 in Arabidopsis and knockdown of FBN4 expression in apple causes
increased sensitivity to oxidative stresses, such as ozone and the herbicide methyl viologen
(Singh et al., 2010). Therefore, we tested whether overexpression of FBN4 affected plant
sensitivity to these oxidative stresses. Contrary to our expectations, and contrary to results
obtained for disease resistance described above, overexpression of FBN4 caused greater
sensitivity to ozone in apple. The FO apple trees had higher tissue damage as measured by
electrolyte leakage compared to WT and VC trees (Fig. 5-3). These results suggest that the FO
apple trees are more sensitive to O3 compared to wild-type and VC trees.
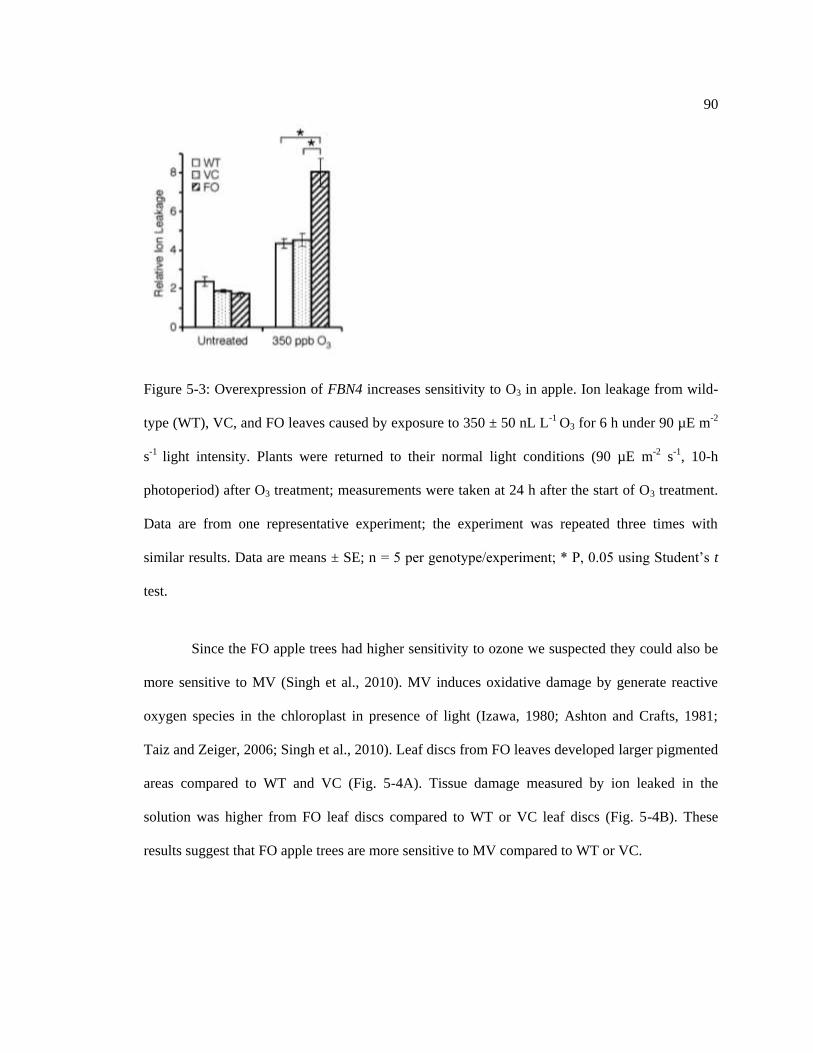
90
Figure 5-3: Overexpression of FBN4 increases sensitivity to O3 in apple. Ion leakage from wild-
type (WT), VC, and FO leaves caused by exposure to 350 ± 50 nL L-1 O3 for 6 h under 90 µE m-2
s-1 light intensity. Plants were returned to their normal light conditions (90 µE m-2 s-1, 10-h
photoperiod) after O3 treatment; measurements were taken at 24 h after the start of O3 treatment.
Data are from one representative experiment; the experiment was repeated three times with
similar results. Data are means ± SE; n = 5 per genotype/experiment; * P, 0.05 using Student‟s t
test.
Since the FO apple trees had higher sensitivity to ozone we suspected they could also be
more sensitive to MV (Singh et al., 2010). MV induces oxidative damage by generate reactive
oxygen species in the chloroplast in presence of light (Izawa, 1980; Ashton and Crafts, 1981;
Taiz and Zeiger, 2006; Singh et al., 2010). Leaf discs from FO leaves developed larger pigmented
areas compared to WT and VC (Fig. 5-4A). Tissue damage measured by ion leaked in the
solution was higher from FO leaf discs compared to WT or VC leaf discs (Fig. 5-4B). These
results suggest that FO apple trees are more sensitive to MV compared to WT or VC.
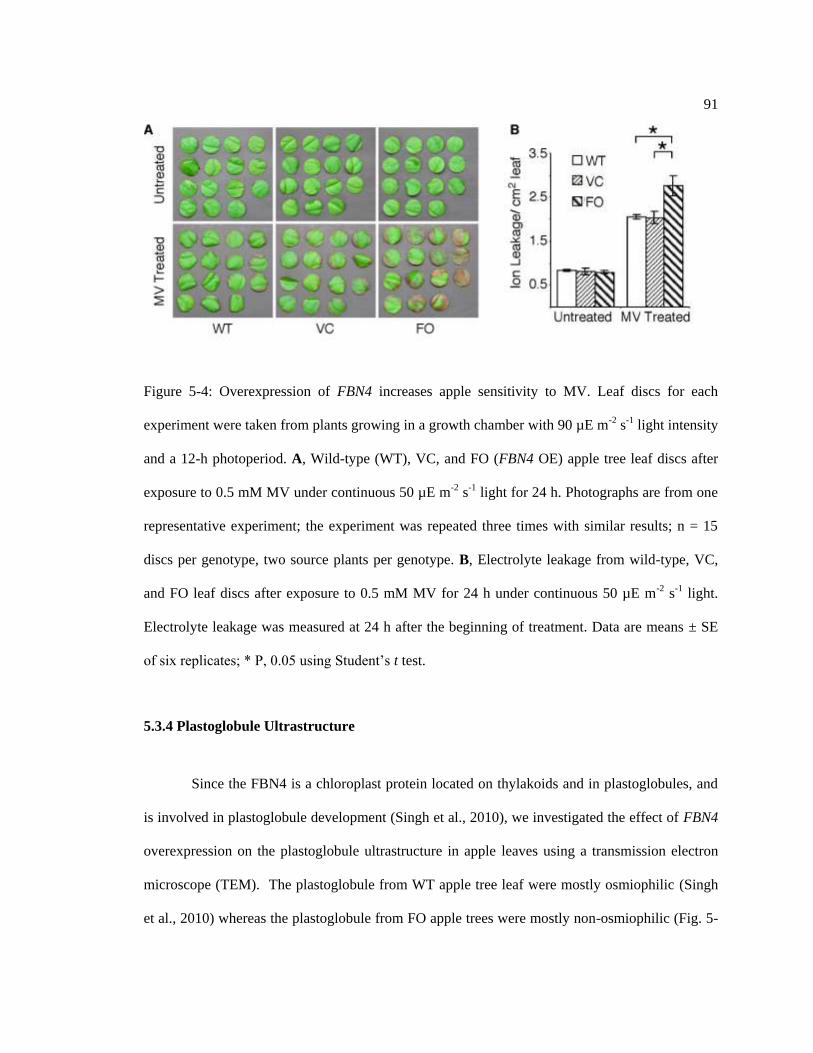
91
Figure 5-4: Overexpression of FBN4 increases apple sensitivity to MV. Leaf discs for each
experiment were taken from plants growing in a growth chamber with 90 µE m-2 s-1 light intensity
and a 12-h photoperiod. A, Wild-type (WT), VC, and FO (FBN4 OE) apple tree leaf discs after
exposure to 0.5 mM MV under continuous 50 µE m-2 s-1 light for 24 h. Photographs are from one
representative experiment; the experiment was repeated three times with similar results; n = 15
discs per genotype, two source plants per genotype. B, Electrolyte leakage from wild-type, VC,
and FO leaf discs after exposure to 0.5 mM MV for 24 h under continuous 50 µE m-2 s-1 light.
Electrolyte leakage was measured at 24 h after the beginning of treatment. Data are means ± SE
of six replicates; * P, 0.05 using Student‟s t test.
5.3.4 Plastoglobule Ultrastructure
Since the FBN4 is a chloroplast protein located on thylakoids and in plastoglobules, and
is involved in plastoglobule development (Singh et al., 2010), we investigated the effect of FBN4
overexpression on the plastoglobule ultrastructure in apple leaves using a transmission electron
microscope (TEM). The plastoglobule from WT apple tree leaf were mostly osmiophilic (Singh
et al., 2010) whereas the plastoglobule from FO apple trees were mostly non-osmiophilic (Fig. 5-
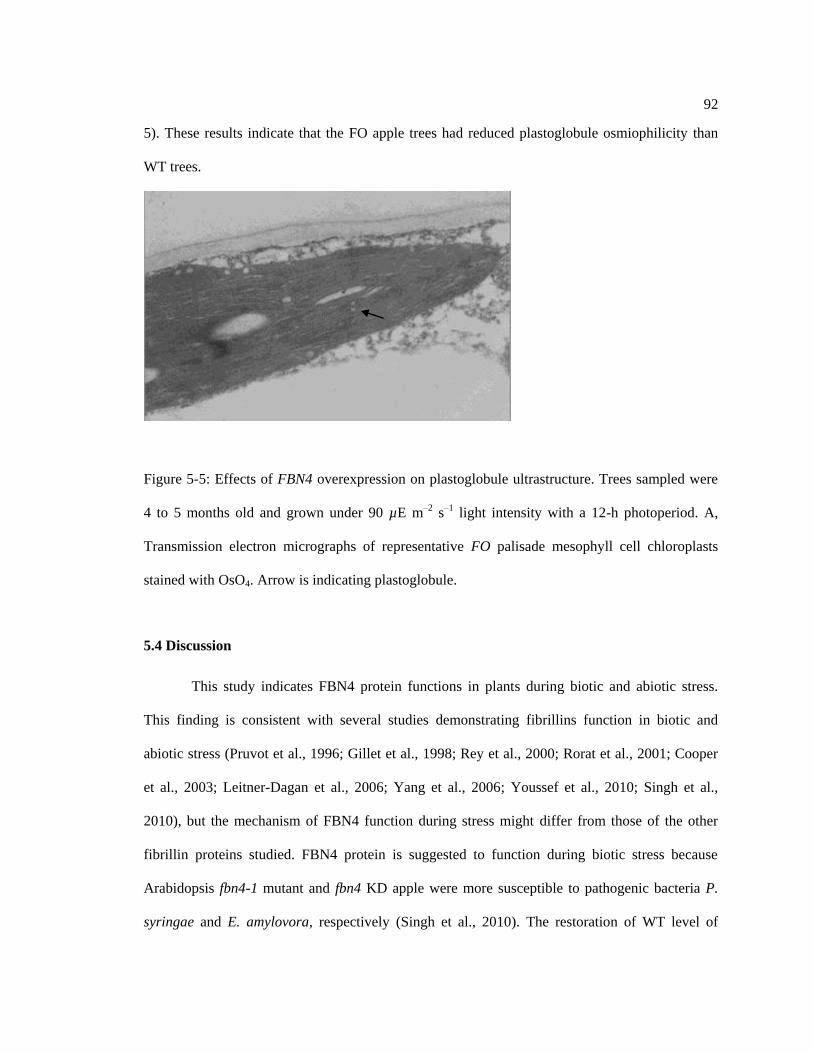
92
5). These results indicate that the FO apple trees had reduced plastoglobule osmiophilicity than
WT trees.
Figure 5-5: Effects of FBN4 overexpression on plastoglobule ultrastructure. Trees sampled were
4 to 5 months old and grown under 90 µE m–2 s–1 light intensity with a 12-h photoperiod. A,
Transmission electron micrographs of representative FO palisade mesophyll cell chloroplasts
stained with OsO4. Arrow is indicating plastoglobule.
5.4 Discussion
This study indicates FBN4 protein functions in plants during biotic and abiotic stress.
This finding is consistent with several studies demonstrating fibrillins function in biotic and
abiotic stress (Pruvot et al., 1996; Gillet et al., 1998; Rey et al., 2000; Rorat et al., 2001; Cooper
et al., 2003; Leitner-Dagan et al., 2006; Yang et al., 2006; Youssef et al., 2010; Singh et al.,
2010), but the mechanism of FBN4 function during stress might differ from those of the other
fibrillin proteins studied. FBN4 protein is suggested to function during biotic stress because
Arabidopsis fbn4-1 mutant and fbn4 KD apple were more susceptible to pathogenic bacteria P.
syringae and E. amylovora, respectively (Singh et al., 2010). The restoration of WT level of

93
disease resistance in the fbn4-1 mutant Arabidopsis plants overexpressing FBN4 cDNA indicates
FBN4 function in plant defense against pathogen bacteria. This result is preliminary as it was
done only once. FBN4 overexpressing apple trees are about as resistant as WT apple trees. This
result indicates that the higher expression of FBN4 does not increased plant resistance to
pathogenic bacteria. Apparently, increase transcript level of FBN4 during disease is not part of an
actual defense mechanism in apple because the transcript level of FBN4 gene is about as much in
uninfected WT as in E. amylovora infected WT apple trees (Fig. 3-6).
FBN4 evidently functions in defense against abiotic stress, because fbn4 KD apple and
fbn4 mutant Arabidopsis plants were more sensitive to ozone than their respective wild types
(Singh et al., 2010). Surprisingly, FO apple plants were also more sensitive to ozone. ROS
production is an early response of plants to O3 exposure (Joo et al., 2005; Kangasjarvi et al.,
2005). Furthermore, attenuation of ROS production in the chloroplast by 3-(3,4-dichlorophenyl)-
1,1-dimethylurea (DCMU) application during O3 exposure reduces the oxidative burst and cell
death (Camp et al., 1994; Joo et al., 2005). This result indicated that higher level of FBN4
expression in plants might result in higher level ROS during ozone exposure. Testing the
sensitivity of the FBN4 overexpresser Arabidopsis plant to ozone will further help determine
whether higher expression of FBN4 results in similar phenotype across species.
Consistent with sensitivity to ozone, FO apple trees are also sensitive to MV, suggesting
these trees might have higher levels of ROS during oxidative stress. Apple trees sensitive to MV
are known to have a higher level of ROS (Singh et al., 2010). Further, ROS scavenging capacity
in the chloroplast correlates to a plant‟s sensitivity to MV. Decreasing the expression of the ROS
scavenging enzyme thylakoid ascorbate peroxidase (APX) increases a plant‟s sensitivity to MV
(Tarantino et al., 2005). Overexpressing chloroplastic APX reduces Arabidopsis sensitivity to
MV (Murgia et al., 2004). FBN4 overexpresser plants might be more sensitive to abiotic stress
because they have higher levels of ROS during oxidative stress.

94
Interestingly, the FO apple trees have reduced plastoglobule osmiophilicity. Lower
osmiophilicity of plastoglobules in the FO plants indicates change in lipid composition of the
plastoglobules. Consistent with hypothesis, fbn4 KD apple trees have reduced plastoglobule
osmiophilicity (Singh et al., 2010), and lower levels of several lipids including plastoquinone in
plastoglobules (chapter 4 of this thesis). Plastoglobule contents include several antioxidants, such
as carotene, tocopherols, and plastoquinone. The greater sensitivity of FO apple trees to O3 and
MV might be due to their lower ability to scavenge ROS due to the lower antioxidant content
such as plastoquinone in their plastoglobules. Likewise, fbn4 KD apple trees that have reduced
plastoglobule osmiophilicity have increase sensitive to O3 and MV and accumulate higher level
ROS upon MV treatment (Singh et al., 2010).
In FO plants, excess FBN4 protein might disturb the lipid-protein stoichiometry of the
plastoglobule, leading to improper localization of the plastoglobule osmiophilic lipids and
consequently reduced plastoglobule osmiophilicity and reduced antioxidant scavenging ability of
the plant. Mechanism of plastoglobule formation and lipid-protein stoichiometry in the
plastoglobules has not been studied. Deruère et al., (1994) studied the lipid-protein stoichiometry
of the fibril of the chromoplast. Fibrils are carotenoids-rich structures which are suggested to
form by plastoglobule elongation during chromoplast differentiation from chloroplast (Deruère et
al., 1994). Fibrillin proteins maintain structure of the fibrils (Deruère et al., 1994). Stoichiometric
ratio of the fibrillin-lipids was critical for assembly of the fibril in vitro which occurred when the
fibrillin-lipids ratio was similar to the chromoplast fibril (Deruère et al., 1994). Similarly,
stoichiometric ratios of FBN4 and osmiophilic lipids might be important for localization of lipids
in the plastoglobules. Higher level of FBN4 protein in the FO apple trees might be disturbing the
stoichiometric ratio of FBN4 and osmiophilic lipids resulting in improper localization of lipids.
FBN4 functions in plant defense is suggested by higher susceptibility of Arabidopsis
fbn4-1 mutant and fbn4 KD apple to pathogenic bacteria P. syringae and E. amylovora,
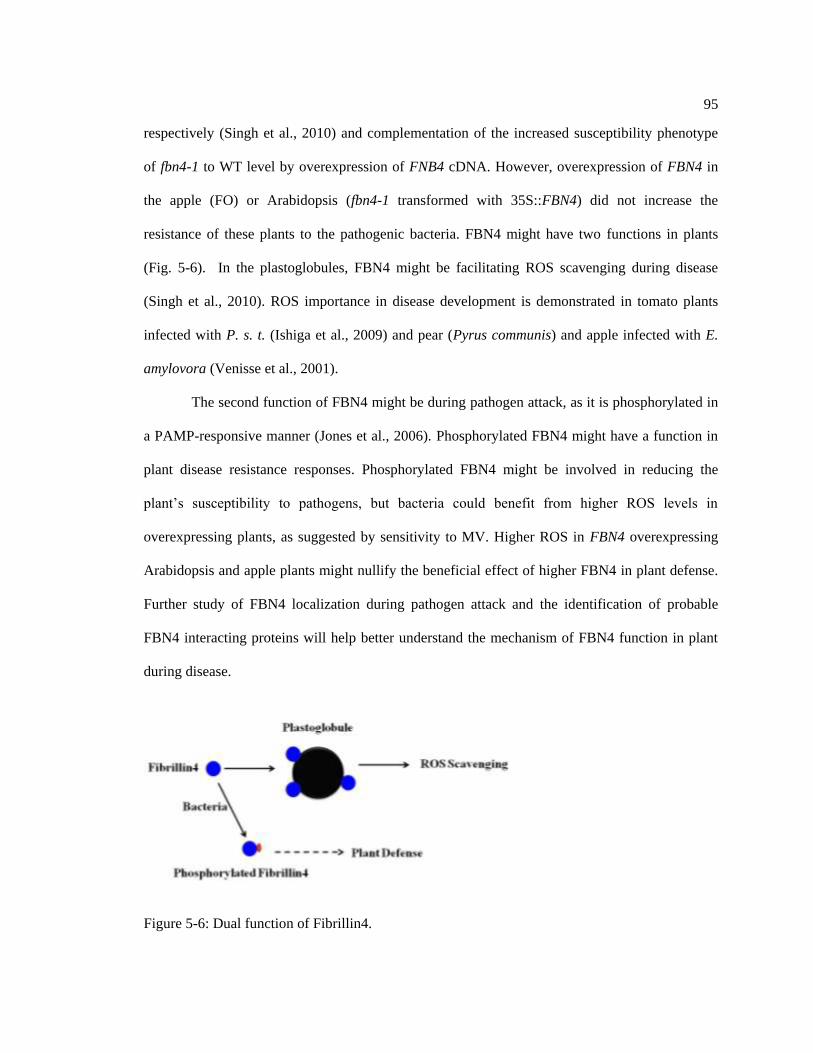
95
respectively (Singh et al., 2010) and complementation of the increased susceptibility phenotype
of fbn4-1 to WT level by overexpression of FNB4 cDNA. However, overexpression of FBN4 in
the apple (FO) or Arabidopsis (fbn4-1 transformed with 35S::FBN4) did not increase the
resistance of these plants to the pathogenic bacteria. FBN4 might have two functions in plants
(Fig. 5-6). In the plastoglobules, FBN4 might be facilitating ROS scavenging during disease
(Singh et al., 2010). ROS importance in disease development is demonstrated in tomato plants
infected with P. s. t. (Ishiga et al., 2009) and pear (Pyrus communis) and apple infected with E.
amylovora (Venisse et al., 2001).
The second function of FBN4 might be during pathogen attack, as it is phosphorylated in
a PAMP-responsive manner (Jones et al., 2006). Phosphorylated FBN4 might have a function in
plant disease resistance responses. Phosphorylated FBN4 might be involved in reducing the
plant‟s susceptibility to pathogens, but bacteria could benefit from higher ROS levels in
overexpressing plants, as suggested by sensitivity to MV. Higher ROS in FBN4 overexpressing
Arabidopsis and apple plants might nullify the beneficial effect of higher FBN4 in plant defense.
Further study of FBN4 localization during pathogen attack and the identification of probable
FBN4 interacting proteins will help better understand the mechanism of FBN4 function in plant
during disease.
Figure 5-6: Dual function of Fibrillin4.
96
In plastoglobule, Fibrillin4 is involved in accumulation of several lipids including
plastoquinone. During stress plastoglobule antioxidants scavenges ROS. Fibrillin4 is
phosphorylated during pathogen attack (Jones et al., 2006). Phosphorylated Fibrillin4 might be
involved in plant defense against pathogen by yet unknown mechanism.
97
Chapter 6
Conclusion and Future Direction

98
These studies characterize the function of FBN4 (FIB4) protein in plants. FBN4 is found
in the plastoglobules (Vidi et al., 2006; Ytterberg et al., 2006), the PSII light-harvesting complex
(Galetskiy et al., 2008) and the thylakoid membrane system (Peltier et al., 2002; Friso et al.,
2004). Our studies suggest FBN4 functions in maintaining plastoglobule osmiophilicity (Singh et
al., 2010) and that FBN4 is not involved in regulating plastoglobule number (Singh et al., 2010).
Presence of the highly conserved lipocalin domain in FBN4 and reduced osmiophilicity of the
plastoglobules in fbn4 KD apple plants suggests that this protein might be involved in lipid
transport to plastoglobules (Singh et al., 2010). Biochemical analysis of plastoglobule lipids
suggests FBN4 protein functions in regulating plastoquinone and other lipid contents of the
plastoglobule. Reduced levels of plastoquinone and other lipids in the plastoglobules of fbn4 KD
apple trees might result from the low plastoglobule osmiophilicity in these plants. These results
support the notion that the FBN4 is involved in binding and/or transport of lipids to
plastoglobules. Further study is needed to conclusively prove a lipid binding and/or transport
ability of the FBN4 protein. The lipocalin region may be found to play an important role in the
binding of plastoquinone and other lipids. Complete lipidome analysis of the plastoglobules of
fbn4 KD and wild-type apple will be helpful in identifying other lipids whose quantity in the
plastoglobule is regulated by FBN4.
Our studies suggest that the FBN4 protein functions in regulating plastoglobule lipid
content in contrast to the earlier assertion that the function of FBN1 protein is to maintain
plastoglobule structure (Rey et al., 2000). Reasons for the different functions of FBN1 and FBN4
proteins are not known. A high degree of similarity is seen in the protein sequences of FBN1 and
FBN4 sub-family proteins from monocots and dicots (Fig. 6-1; alignment of FIB1 and FBN4).
Several conserved domains are present in both FBN1 and FBN4, such as RGD and lipocalin. The
sequence Arg-Gly-Asp (RGD) is important for interaction with cell surface receptor, an integrin,
in animals, and is known to play a role in cell adhesion (Ruoslahti and Pierschbacher, 1987).

99
Proteins with lipocalin are known to bind and/or transport small hydrophobic molecules (for
review, see Flower et al., 2000). Several conserved regions in the FBN1 sub-family are absent in
the FBN4 sub-family (Fig. 6-1). In addition, several domains are conserved in FBN1 and FBN4
proteins from monocots and dicots plants but with different sets of amino acids in the two
proteins (blue box in Fig. 6-1). The difference in amino acid sequences in the conserved regions
of FBN1 and FBN4 might be the cause of functional differences between the two proteins. The
functions of these conserved protein domains are not known. Studies on the conserved protein
domains of FBN1 and FBN4 will be helpful in understanding the molecular functions of these
proteins and might help explain functional differences observed in the two protein sub-families.
Figure 6-1: Alignment of FBN4 proteins from 5 different plant species, including monocots and
dicots. Dark blue regions highlight highly conserved amino acids; the predicted lipocalin and
RGD domain are in red box. Blue region represent highly conserved amino acids of FBN4
proteins. The species used in the alignment are, Oryza sativa (rice), Citrus x paradisi (grapefruit),
Malus x domestica (apple), Solanum tuberosum (potato), and Arabidopsis thaliana (thale cress).
100
Function and regulation of plastoglobule content is not well understood. Plastoglobules
contain at least 34 proteins (Vidi et al., 2006; Ytterberg et al., 2006) and several lipids including
antioxidant. Plastoglobules function is implicated in plant responses to stress. Several studies
have reported increase size and numbers of the plastoglobules in response to biotic and abiotic
stresses that trigger chloroplast oxidative stress (Hernández et al., 2004; Ljubešić and Britvec,
2006; Sam et al., 2003). Plastoglobules contains 20-75% of chloroplast plastoquinone (Bailey and
Whyborn, 1963; Burr, et al., 1967; Bishop, 1971) and 36% of chloroplast tocopherol (Vidi et al.,
2006). Tocopherols and plastoquinones are antioxidants and could contribute to plant stress
tolerance (Kruk et al., 2005; Kruk and Trebst, 2008; Munné-Bosch, 2005; Semchuk et al., 2009).
This study provide evidence that plastoglobules are involved in counteracting oxidative stress in
plants and that FBN4 plays an essential role in accumulation of the plastoquinone in the
plastoglobules.
Only a few of 34 plastoglobule proteins have been characterized. Presence of large
number of proteins indicates their importance in plastoglobule function, or plastoglobules might
be a storage site for these proteins. Characterizing functions of plastoglobule proteins will help
better understand the function of plastoglobules during stress, and might help develop plants with
better stress tolerance. A combination of approach including metabolomics, biochemistry,
molecular and cell biology, and genetics will be needed to elucidate function of plastoglobules in
plants.
Characterizing the functions of unstudied fibrillin sub-families will help us understand
their roles in plastoglobules and the thylakoids. Furthermore, study of several fibrillins using
double or triple mutants will shed light on possible interactions during formation of
plastoglobules and regulation of plastoglobule content. Molecular functions of fibrillin proteins
could be studied in Chlamydomonas. Plastoglobules in Chlamydomonas are carotenoid rich
globule structures organized in 2-4 layers between thylakoid and chloroplast membranes (Boyd et

101
al., 2011). Eight fibrillin proteins are found in the plastoglobules of Chlamydomonas including
FBN4 (Renninger et al., 2006; Schmidt et al., 2006). Chlamydomonas could be a useful tool in
understanding the molecular functions of fibrillin proteins, as it has several fibrillin proteins in
plastoglobules, is easy to grow, has a short life cycle, and produces many plastoglobules.

102
Appendix A
Abiotic stress and GA hormone inhibitor induce SAR in apple trees

103
A.1 Introduction
Fire blight caused by the necrogenic bacterium, Erwinia amylovora is a devastating
disease of rosaceous plants, including apple, pear, raspberry, and quince. During field survey, Dr.
Henry Ngugi group observed that most of the apple plants were severally affected by fire blight
whereas some of the plants were not affected. The plants not affected by fire blight were less
vigor in growth and probably drought stressed. The experiment was repeated in green house
under controlled conditions. The water stressed plants were more resistance Erwinia amylovora
compared to plant grown in water sufficient conditions. Using greenhouse grown apple trees,
here we investigated whether stress-induced systemic acquired resistance (SAR) could induce
resistance to fire blight. We analyzed the expression of five pathogenesis-related (PR) genes in
shoots of the apple trees treated with Acibenzolar-S-methyl (ASM, SAR inducing chemical),
Prohexadione-calcium (ProCa, a gibberellic acid biosynthesis inhibitor), or grown on sand with
little water and no fertilizer (abiotic stress). PR genes are marker of SAR.
A.2 Materials and Methods
A.2.1 Plant material
All experiments were done with Malus x domistica cv. Royal Gala. The plants were
grown in the green house at 21˚C and 12 h light cycle. Experiments were conducted with one-
year-old plants. Leaves were harvested, immediately frozen in liquid nitrogen and stored at -80˚C.
All experiments were done in three replicates, and for each replicate four individual plants were
treated. The RNA was isolated after pooling ground leaf from two individual plants. The leaves
were pulverized a using TissueLyser (Qiagen).
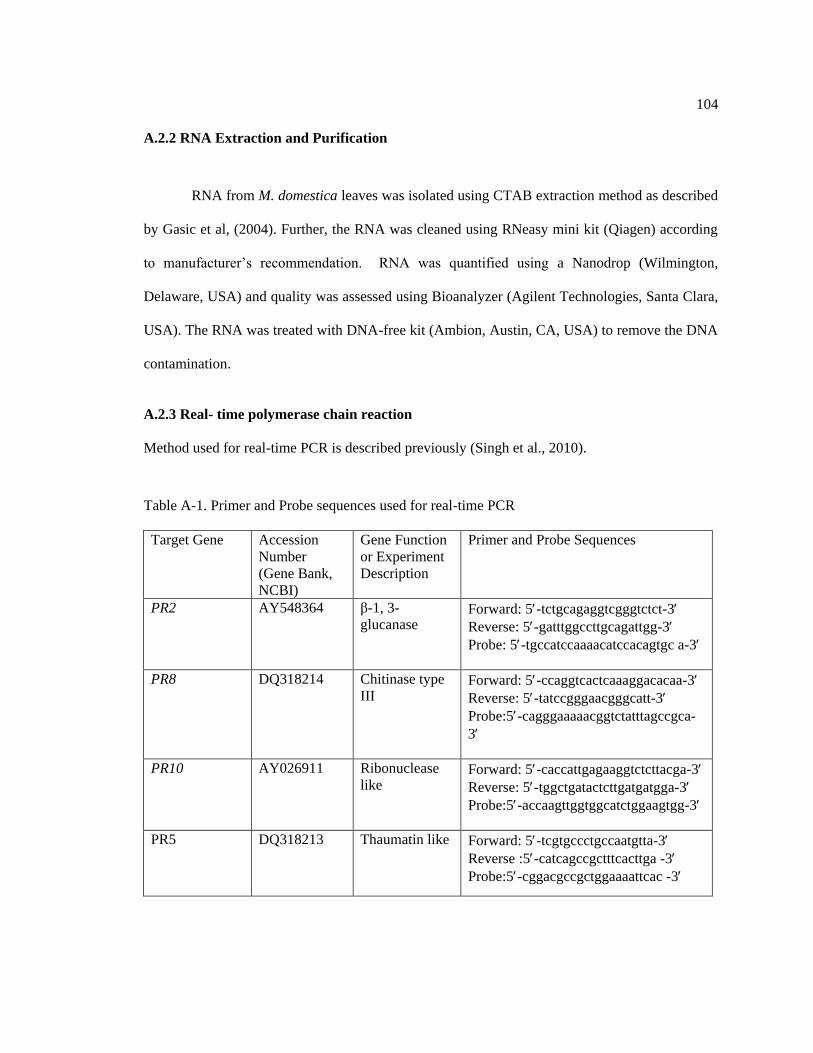
104
A.2.2 RNA Extraction and Purification
RNA from M. domestica leaves was isolated using CTAB extraction method as described
by Gasic et al, (2004). Further, the RNA was cleaned using RNeasy mini kit (Qiagen) according
to manufacturer‟s recommendation. RNA was quantified using a Nanodrop (Wilmington,
Delaware, USA) and quality was assessed using Bioanalyzer (Agilent Technologies, Santa Clara,
USA). The RNA was treated with DNA-free kit (Ambion, Austin, CA, USA) to remove the DNA
contamination.
A.2.3 Real- time polymerase chain reaction
Method used for real-time PCR is described previously (Singh et al., 2010).
Table A-1. Primer and Probe sequences used for real-time PCR
Target Gene Accession
Number
(Gene Bank,
NCBI)
Gene Function
or Experiment
Description
Primer and Probe Sequences
PR2 AY548364 β-1, 3-
glucanase Forward: 5-tctgcagaggtcgggtctct-3
Reverse: 5-gatttggccttgcagattgg-3
Probe: 5-tgccatccaaaacatccacagtgc a-3
PR8 DQ318214 Chitinase type
III Forward: 5-ccaggtcactcaaaggacacaa-3
Reverse: 5-tatccgggaacgggcatt-3
Probe:5-cagggaaaaacggtctatttagccgca-
3
PR10 AY026911 Ribonuclease
like Forward: 5-caccattgagaaggtctcttacga-3
Reverse: 5-tggctgatactcttgatgatgga-3
Probe:5-accaagttggtggcatctggaagtgg-3
PR5 DQ318213 Thaumatin like Forward: 5-tcgtgccctgccaatgtta-3
Reverse :5-catcagccgctttcacttga -3
Probe:5-cggacgccgctggaaaattcac -3

105
A.3 Results
Transcript levels of four PR genes were analyzed in apple trees treated with actigard,
apogee or grown in stressed condition. AC1 (APPLE0F000013486) and AC2
(APPLE0F000004864) were used as internal control to normalize PR genes expression because
they are stably expressed in apple trees in stress conditions (Jensen et al, 2010). The expression of
PR2 and PR10 genes were higher in trees treated with apogee, actigard, or grown in stress
condition than trees grown in control condition. The expression of the PR5 gene was higher in
apogee and actigard treated trees than in control trees. Compared to control, transcript level of
PR5 in stressed trees was lower when AC1 gene transcript was used to normalize transcript level
but similar when AC2 gene transcript was used to normalize transcript level. Transcript level of
PR8 was similar in apogee treated, stressed and control plants. Transcript level of PR8 gene in
actigard trees was similar when AC1 was used to normalize but higher when AC2 gene transcript
was used to normalize.
AC1 AC2
PR2
PR2
0
5
10
15
20
C T1 T2 T3
RN
A L
evel
PR2
0
5
10
15
20
25
C T1 T2 T3
RN
A L
evel
* *
*
* *
*
Figure continue to next page

106
PR5
PR5
0.0
5.0
10.0
15.0
20.0
25.0
C T1 T2 T3
RN
A L
evel
PR5
0.0
5.0
10.0
15.0
20.0
25.0
30.0
C T1 T2 T3
RN
A L
evel
PR8
PR8
0.0
0.5
1.0
1.5
2.0
C T1 T2 T3
RN
A L
evel
PR8
0.0
0.5
1.0
1.5
2.0
2.5
C T1 T2 T3R
NA
Level
PR10
PR10
0.0
2.0
4.0
6.0
8.0
10.0
C T1 T2 T3
RN
A L
evel
PR10
0.0
2.0
4.0
6.0
8.0
10.0
12.0
C T1 T2 T3
RN
A L
evel
Figure A-1: Transcript level of PR genes was measured using real-time PCR in apple trees treated
with actigard, apogee or grown in stressed or control conditions using real-time PCR. C, control;
T1, abiotic stress; T2, actigard treated trees; T3, apogee treated trees. Data are means ± SD. *
indicate significant difference between control and treatment, P, 0.05 using Student‟s t test. AC1
and AC2 columns are showing PR transcript level normalized to the transcript level of AC1 or
AC2, respectively.
*
*
*
*
*
*
*
*
*
*
*
*

107
A.4 Discussion
We analyzed the transcript levels of four PR genes in shoots of the apple trees treated
with ASM (SAR inducing chemical), ProCa (a gibberellic acid biosynthesis inhibitor), or grown
on sand with little water and no fertilizer (abiotic stress). PR genes are markers of SAR.
Compared to the untreated trees, all treatments increased the expression of PR2 and PR10 genes,
suggesting that ASM, ProCa and abiotic stress induce SAR in apple trees. ProCa-treated trees had
highest expression of PR genes. Stressed, ASM- and ProCa-treated trees developed little or no
fire blight symptoms after inoculation of shoots with E. amylovora (personal communication with
Dr. Henry Ngugi). Increased PR gene expression and low fire blight severity in ProCa- and
abiotic stress-treated trees similar to ASM suggest that induction of SAR by these treatments
offers significant protection from fire blight in apple trees.

108
Appendix B
FBN4 in not Involved in SNC1, CPN1 Regulated Defense Mechanism

109
B.1 Introduction
Copines are conserved proteins present in protozoa, plants and animals (Yang et al.,
2006a). They are suggested to have function in membrane trafficking and signal transduction
(Yang et al., 2006a). They have two C2 domains that confers calcium and lipid regulation activity
(Rizo and Sudhof, 1998) and an A domain that is involved in protein-protein interaction
(Williams et al., 1999). Copine gene mutant, bon1/cpn1 was isolated as a temperature-dependent
growth defect and an enhanced disease resistance mutant of Arabidopsis (Hua et al., 2001;
Jambunathan et al., 2001). CPN1 is suggested as repressor of a disease resistance (R) gene (Yang
et al., 2006a). During pathogen invasion, R gene product recognizes the avirulent (avr) gene
product of the bacteria triggering HR in the plant. cpn1 mutant plants in non-permissive condition
(i.e., low humidity and low temperature condition) has activated defense response, as spontaneous
lesion and constitutive activation of the PR1 gene was observed (Jambunathan et al., 2001; Yang
et al., 2006a). Constitutive activation of a defense response in the cpn1 mutant plants can be
suppressed in by SNC1 mutation (a R gene) or PAD or EDS1 mutation or by lowering SA (Yang
et al., 2006a). This suggest that the CPN1 is negative regulator of the R-protein, SNC1 (Yang et
al., 2006a). Possible mechanism of regulation of SNC1 by CPN1 is not known. FBN4 protein of
Arabidopsis was found to physically interact with Copine‟s A domain in yeast two-hybrid
screening and pull-down assay (McNellis‟s Lab). These observations suggest that FBN4 has the
ability to bind with copine, however the significance of this interaction is not known.
Interestingly, FBN4 also binds with HrpN, an effector protein secreted by E. amylovora (Song et
al., 2002).
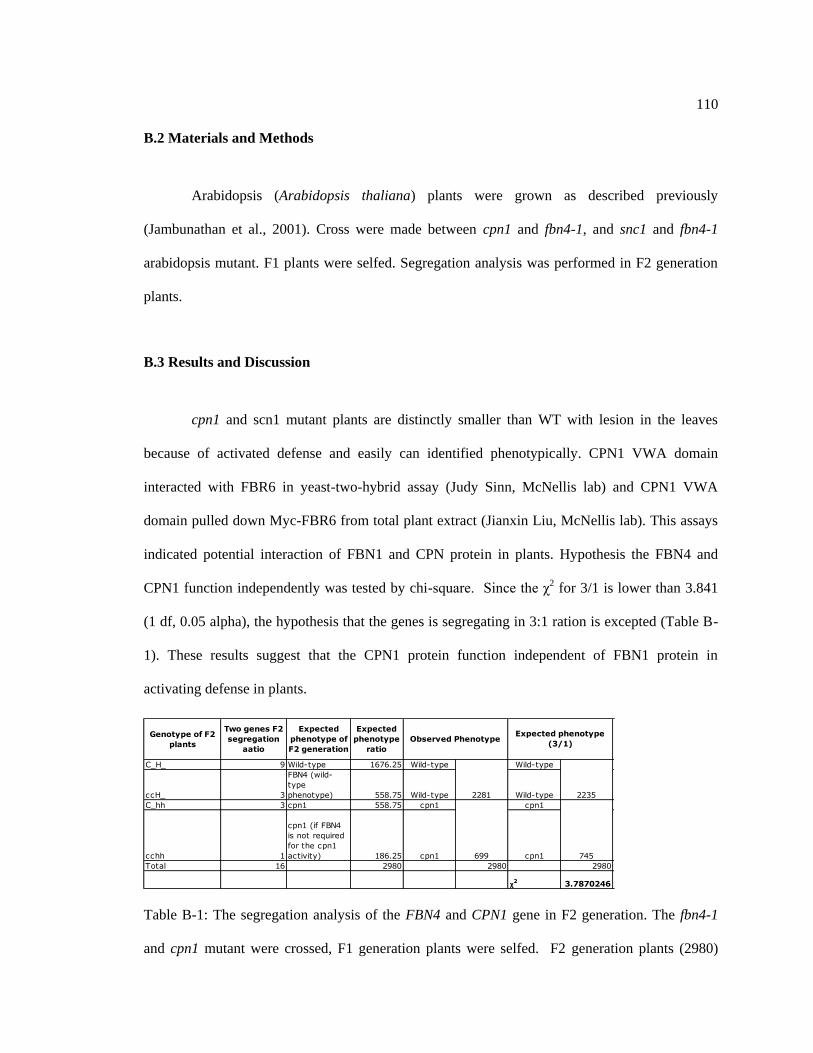
110
B.2 Materials and Methods
Arabidopsis (Arabidopsis thaliana) plants were grown as described previously
(Jambunathan et al., 2001). Cross were made between cpn1 and fbn4-1, and snc1 and fbn4-1
arabidopsis mutant. F1 plants were selfed. Segregation analysis was performed in F2 generation
plants.
B.3 Results and Discussion
cpn1 and scn1 mutant plants are distinctly smaller than WT with lesion in the leaves
because of activated defense and easily can identified phenotypically. CPN1 VWA domain
interacted with FBR6 in yeast-two-hybrid assay (Judy Sinn, McNellis lab) and CPN1 VWA
domain pulled down Myc-FBR6 from total plant extract (Jianxin Liu, McNellis lab). This assays
indicated potential interaction of FBN1 and CPN protein in plants. Hypothesis the FBN4 and
CPN1 function independently was tested by chi-square. Since the χ2 for 3/1 is lower than 3.841
(1 df, 0.05 alpha), the hypothesis that the genes is segregating in 3:1 ration is excepted (Table B-
1). These results suggest that the CPN1 protein function independent of FBN1 protein in
activating defense in plants.
Genotype of F2
plants
Two genes F2
segregation
aatio
Expected
phenotype of
F2 generation
Expected
phenotype
ratio
C_H_ 9 Wild-type 1676.25 Wild-type Wild-type Wild-type 2421.25
ccH_ 3
FBN4 (wild-
type
phenotype) 558.75 Wild-type Wild-type Wild-type
C_hh 3 cpn1 558.75 cpn1 cpn1 cpn1 558.75
cchh 1
cpn1 (if FBN4
is not required
for the cpn1
activity) 186.25 cpn1 cpn1 Wild-type
Total 16 2980 2980 2980
χ2 3.7870246 43.32762
Hypothesized
Phenotype (ccff has
wild type phenotype)
745699
22352281
Expected phenotype
(3/1)Observed Phenotype
Table B-1: The segregation analysis of the FBN4 and CPN1 gene in F2 generation. The fbn4-1
and cpn1 mutant were crossed, F1 generation plants were selfed. F2 generation plants (2980)

111
were scored for the cpn1 and wild-type (WT) plant phenotype. Chi-square suggests gene is
segregating in 3:1 ratio.
Further, possible function of FBN4 protein in SCN1 mediated defense was analyzed by
crossing fbn4-1 and snc1 mutant plants. Since the χ2 for 3/1 is lower than 3.841 (1 df, 0.05 alpha),
the hypothesis that the genes is segregating in 3:1 ration is excepted (Table B-2). These results
suggest that the snc1 (GOF) mutant phenotype is independent of FBN4 protein function. FBN4
protein is not involved in the SNC1 dependent plant defense mechanism.
Genotype of F2
plants
Two genes F2
segregation
ratio
Expected phenotype
of F2 generation
Expected
phenotype ratio
F_S_ 9 Wild-type 125.4375 Wild-type Wild-type Wild-type 181.1875
FFS_ 3
FBN4 (wild-type
phenotype) 41.8125 Wild-type Wild-type Wild-type
F_ss 3 snc1 41.8125 snc1 cpn1 cpn1 41.8125
ffss 1
snc1 (if FBN4 is not
required for the SNC1
mediated defense) 13.9375 snc1 cpn1 Wild-type
Total 16 223 223 223 223
χ2 0.121076 7.7131195
Observed PhenotypeExpected phenotype
(3/1)
Hypothesized
Phenotype (ffss has
wild type phenotype)
167.25
55.75
165
58
Table B-2: The segregation analysis of the FBN4 and SNC1 (GOF) genes in F2 generation. The
fbn4-1 and snc1 (GOF) mutant were crossed, F1 generation plants were selfed. 223 F2
generation plants were scored for the snc1 (GOF) and wild-type (WT) plant phenotype. Chi-
square suggests gene is segregating in 3:1 ratio.

112
Appendix C
Protocols
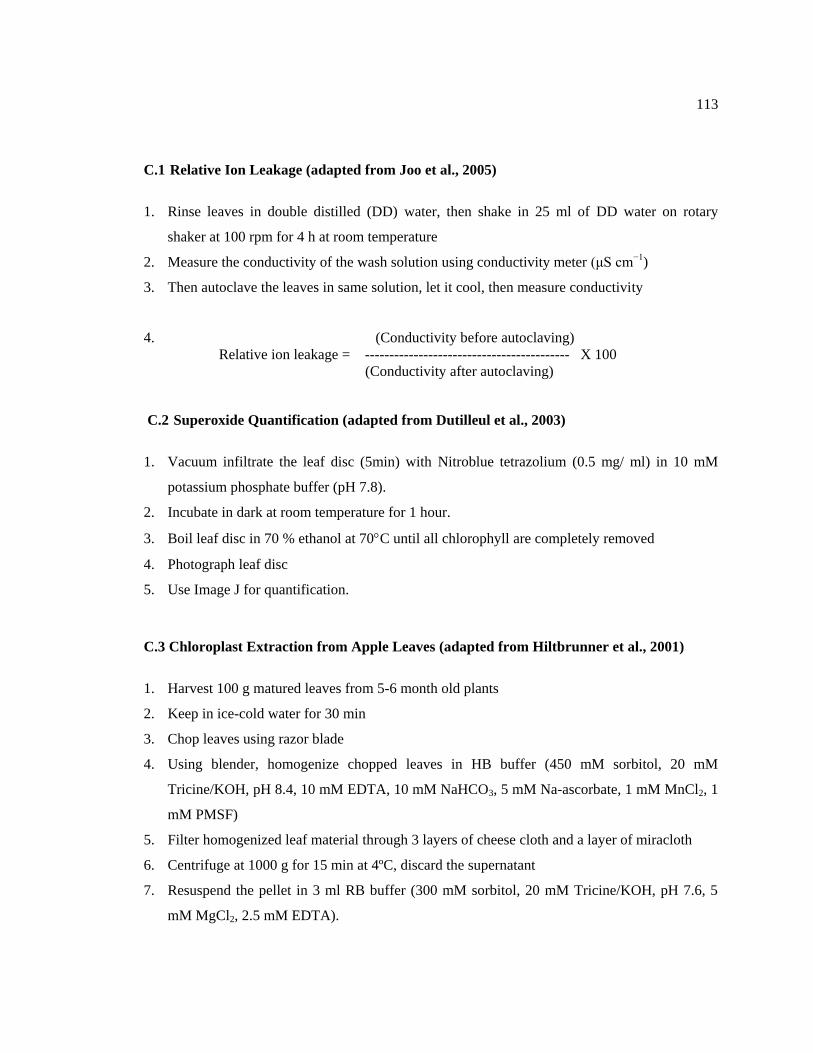
113
C.1 Relative Ion Leakage (adapted from Joo et al., 2005)
1. Rinse leaves in double distilled (DD) water, then shake in 25 ml of DD water on rotary
shaker at 100 rpm for 4 h at room temperature
2. Measure the conductivity of the wash solution using conductivity meter (μS cm−1)
3. Then autoclave the leaves in same solution, let it cool, then measure conductivity
4. (Conductivity before autoclaving)
Relative ion leakage = ------------------------------------------ X 100
(Conductivity after autoclaving)
C.2 Superoxide Quantification (adapted from Dutilleul et al., 2003)
1. Vacuum infiltrate the leaf disc (5min) with Nitroblue tetrazolium (0.5 mg/ ml) in 10 mM
potassium phosphate buffer (pH 7.8).
2. Incubate in dark at room temperature for 1 hour.
3. Boil leaf disc in 70 % ethanol at 70C until all chlorophyll are completely removed
4. Photograph leaf disc
5. Use Image J for quantification.
C.3 Chloroplast Extraction from Apple Leaves (adapted from Hiltbrunner et al., 2001)
1. Harvest 100 g matured leaves from 5-6 month old plants
2. Keep in ice-cold water for 30 min
3. Chop leaves using razor blade
4. Using blender, homogenize chopped leaves in HB buffer (450 mM sorbitol, 20 mM
Tricine/KOH, pH 8.4, 10 mM EDTA, 10 mM NaHCO3, 5 mM Na-ascorbate, 1 mM MnCl2, 1
mM PMSF)
5. Filter homogenized leaf material through 3 layers of cheese cloth and a layer of miracloth
6. Centrifuge at 1000 g for 15 min at 4ºC, discard the supernatant
7. Resuspend the pellet in 3 ml RB buffer (300 mM sorbitol, 20 mM Tricine/KOH, pH 7.6, 5
mM MgCl2, 2.5 mM EDTA).

114
8. Load on 40% percoll (V/V prepared using RB buffer) and centrifuge at 2800 RPM for 15 min
at 4ºC in a swing-out rotor using Sorvall RT7
9. Discard the supernatant, pellet has chloroplast.
C.4 Chloroplast Lipid Extraction
1. Quantify the chloroplast lipid using 5 ul of chloroplast extract using method of Arnon
(Arnon, 1949)
2. Aliquot 0.3 mg chlorophyll equivalent of chloroplast and centrifuge. Keep pellet in -20C. Do
lipid extraction next day. If you have time do it same day.
3. Add 200 ul of acetone and sonicate the extract.
4. Keep at room temperature in dark for 1h.
5. Centrifuge at 13000 rpm for 1 min, pipette out supernatant and keep in another eppendorf.
6. Repeat steps 4 to 6, two more time
7. Mix all supernatant (~600 ul), vortex and use to quantify the lipids.
C.5 Plastoglobule Extraction (Steinmüller and Tevini, 1985)
1. Resuspend chloroplast in 1 mM phosphate buffer with 0.1 mM dithioerythritol
2. Sonicated using Branson Sonifier S-450A (duty cycle 50% and output control 2) for 7
min on ice.
3. Centrifuge suspension at 150,000 g (=38175 rpm) for 60 min using a Beckman L8-M
ultracentrifuge equipped with a Ti70 rotor.
4. Extract a slightly turbid zone of plastoglobules near the cap and an agglomeration on the
inner side of the tube.
5. Removed plastoglobule and make that to 5% Ficoll solution using Ficoll powder.
6. Prepare a discontinuous gradient
a. Top 3 ml phosphate buffer 1mM
b. Middle 7 ml 2.5% Ficoll
c. Bottom 3 ml 5% Ficoll containing plastoglobule
7. Centrifuge at 250,000 g (=38183 rpm) for 90 min using a Beckman SW-41 Ti swinging
bucket rotor

115
8. Remove plastoglobule from the top of tube
9. Repeat steps 3 to 9 (Breaking chloroplast to removing plastoglobules).
10. Pool extracted plastoglobules
C.6 Plastoglobule Lipid Extraction
1. Two third of the extracted plastoglobules were sonicated (10 pulse),
2. Mix with equal volume of hexane and vortex vigorously for one min, centrifuge for 10000 for
1 min.
3. Take out hexane phase
4. Pass nitrogen to dry the lipids, re-dissolve in 100 µl acetone and analyze using LC-MS
C.7 Plastoglobule Protein Quantification (Adapted from Ytterberg et al., 2006)
1. Dissolve plastoglobule in 100% acetone (cool acetone in -20ºC). The final concentration of
acetone ~90%.
2. Keep in -20ºC for 16 h
3. Centrifuge for 10 min at 10000 g, 4ºC.
4. Decant the acetone and wash the pellet in cold (-20C) 80% acetone, 10% methanol, and 0.2
% acetic acid. Keep on ice for 30 min.
5. Centrifuge for 10 min at 10000 g, 4ºC.
6. Decant the solution without disturbing the pellet. Dry the pellet.
7. Dissolve pellet in dimethyl sulfoxide (DMSO).
8. Use Bradford assay to quantify the protein. Use DMSO to adjust the reading.
C.8 Transmission Electron Microscopy of Extracted Plastoglobules
1. Stain with 0.5% OsO4 for 5 min (take 50 ul of 2% OsO4 in 150 ul of plastoglobules)
2. Place 10 ul on the grid
3. Dry with blotting paper
4. Carbon coat the dried grid
5. Observe using TEM

116
References:
Abramoff MD, Magelhaes PJ, Ram SJ (2004) Image processing with ImageJ. Biophotonics Int
11:36
Alonso JM, Stepanova AN, Leisse TJ, Kim CJ, Chen H, Shinn P, Stevenson DK,
Zimmerman J, Barajas P, Cheuk R, Gadrinab C, Heller C, Jeske A, Koesema E,
Meyers CC, Parker H, Prednis L, Ansari Y, Choy N, Deen H, Geralt M, Hazari N,
Hom E, Karnes M, Mulholland C, Ndubaku R, Schmidt I, Guzman P, Aguilar-
Henonin L, Schmid M, Weigel D, Carter DE, Marchand T, Risseeuw E, Brogden D,
Zeko A, Crosby WL, Berry CC, Ecker JR (2003) Genome-wide insertional
mutagenesis of Arabidopsis thaliana. Science 301: 653-657
Apel K, Hirt H (2004) Reactive oxygen species: Metabolism, oxidative stress and signal
transduction. Annu Rev Plant Biol 55: 373-399
Arnon DI (1949) Copper enzymes in isolated chloroplasts. Polyphenoloxidase in Beta vulgaris.
Plant Physiol. 24: 1-15
Asada K (2006) Production and scavenging of reactive oxygen species in chloroplasts and their
functions. Plant Physiol 141: 391-396
Ashton FM, Crafts AS (1981) Mode of action of herbicides, 2nd ed. Wiley, New York
Austin JR II, Frost E, Vidi P-A, Kessler F, Staehelin LA (2006) Plastoglobules are lipoprotein
subcompartments of the chloroplast that are permanently coupled to thylakoid membranes
and contain biosynthetic enzymes. Plant Cell 18: 1693-1703
Badawi GH, Kawano N, Yamauchi Y, Shimada E, Sasaki R, Kubo A, Tanaka K (2004)
Over-expression of ascorbate peroxidase in tobacco chloroplasts enhances the tolerance to
salt stress and water deficit. Physiol Plant 121: 231-238
Bahr GF (1954) Osmium tetroxide and ruthenium tetroxide and their reaction with biologically
important substances. Electron stains III. Exp Cell Res 7: 457-479
Bailey LJ, Whyborn AG (1963) The osmiophilic globules of chloroplasts II. Globules of the
spinach-beet chloroplast. Biochimica et Biophysica Acta 78: 163-174
Barr R, Magree L, Crane FL (1967) Quinone Distribution in Horse-Chestnut Chloroplasts,
Globules and Lamellae. Am J Bot 54: 365-374
Bishop NI (1971) Photosynthesis: The Electron Transport System of Green Plants. Annu Rev
Biochem 40: 197-226
Blanksby SJ, Mitchell TW (2010) Advances in Mass Spectrometry for Lipidomics. Annu Rev
Analytical Chemistry 3: 433-465
Block A, Schmelz E, Jones JB, Klee HJ (2005) Coronatine and salicylic acid: the battle between
Arabidopsis and Pseudomonas for phytohormone control. Mol Plant Pathol 6: 79-83
Breemen R BV, Nikolic D, Xu X, Xiong Y, Lieshout MV, West CE, Schilling AB (1998)
Development of a method for quantitation of retinol and retinyl palmitate in human serum
using high-performance liquid chromatography–atmospheric pressure chemical ionization–
mass spectrometry. Journal Chromatogr A, 794, 245-251
Bréhélin C, Kessler F, van Wijk KJ (2007) Plastoglobules: versatile lipoprotein particles in
plastids. Trends Plant Sci 12: 260-266
Camp, WV, Willekens H, Bowler C, Montagu MV, Inze D, Reupold-Popp P, Sandermann
H, and Langebartels C (1994). Elevated levels of superoxide dismutase protect transgenic
plants against ozone damage. Nat Biotech 12, 165-168.
Clough SJ, Bent AF (1998) Floral dip: a simplified method forAgrobacterium-mediated
transformation ofArabidopsis thaliana. Plant J 16 (6): 735-743
117
Cooper B, Clarke JD, Budworth P, Kreps J, Hutchison D, Park S, Guimil S, Dunn M,
Luginbühl P, Ellero C, Goff SA, Glazebrook J (2003) A network of rice genes associated
with stress response and seed development. Proc Natl Acad Sci USA 100: 4945-4950
Cunningham FX, Jr., Tice AB, Pham C, Gantt E (2010) Inactivation of Genes Encoding
Plastoglobulin-Like Proteins in Synechocystis sp. PCC 6803 Leads to a Light-Sensitive
Phenotype. J. Bacteriol. 192: 1700-1709
Dahlin C, Ryberg H (1986) Accumulation of phytoene in plastoglobuli of SAN-9789
(Norflurazon)-treated dark-grown wheat. Physiol Plant 68: 39-45
Deruère J, Romer S, d'Harlingue A, Backhaus RA, Kuntz M, Camara B (1994) Fibril
assembly and carotenoid overaccumulation in chromoplasts: A model for supramolecular
lipoprotein structures. Plant Cell 6: 119-133
Duret S, Bonaly J, Bariaud A, Vannereau A, Mestre J-C (1986) Cadmium-induced
ultrastructural changes in Euglena cells. Environ Res 39: 96-103
Dutilleul C, Garmier M, Noctor G, Mathieu C, Chétrit P, Foyer CH, Paepe RD (2003) Leaf
mitochondria modulate whole cell redox homeostasis, set antioxidant capacity and
determine stress resistance through altered signaling and diurnal regulation. Plant Cell 15:
1212
Emter O, Falk H, Sitte P (1990) Specific carotenoids and proteins as prerequisites for
chromoplast tubule formation. Protoplasma 157: 128-135
Eymery F, Rey P (1999) Immunocytolocalization of CDSP 32 and CDSP 34, two chloroplastic
drought-induced stress proteins in Solanum tuberosum plants. Plant Physiol Bioch 37: 305-
312
Flower, D.R.(1996)The lipocalin protein family: structure and function. Biochem. J. 318, 1–14
Flower DR, North ACT, Sansom CE (2000) The lipocalin protein family: structure and
sequence overview. Biochim Biophys Acta 1482: 9-24
Friso G, Giacomelli L, Ytterberg AJ, Peltier J-B, Rudella A, Sun Q, van Wijk KJ (2004)
Indepth analysis of the thylakoid membrane proteome of Arabidopsis thaliana chloroplasts:
new proteins, new functions, and a plastid proteome database. Plant Cell 16: 478-499
Galetskiy D, Susnea I, Reiser V, Adamska I, Przybylski M (2008) Structure and dynamics of
photosystem II light-harvesting complex revealed by high-resolution FTICR mass
spectrometric proteome analysis. J Am Soc Mass Spectrom 19: 1004-1013
Garmier M, Priault P, Vidal G, Driscoll S, Djebbar R, Boccara M, Mathieu C, Foyer CH
and Paepe RD (2007) Light and oxygen are not required for harpin-induced cell death J
Biol Chem 282:37556-37566
Gillet B, Beyly A, Peltier G, Rey P (1998) Molecular characterization of CDSP 34, a
chloroplastic protein induced by water deficit in Solanum tuberosum L. plants, and
regulation of CDSP 34 expression by ABA and high illumination. Plant J 16: 257-262
Greenwood AD, Leech RM, Williams JP (1963) The osmiophilic globules of chloroplasts : I.
Osmiophilic globules as a normal component of chloroplasts and their isolation and
composition in Vicia faba L. Biochimica et Biophysica Acta 78: 148-162
Havaux M, Eymery F, Porfirova S, Rey P, Dormann P (2005) Vitamin E Protects against
Photoinhibition and Photooxidative Stress in Arabidopsis thaliana. Plant Cell 17: 3451-
3469
Hiltbrunner A, Bauer J, Vidi PA, Infanger S, Weibel P, Hohwy M, Kessler F (2001)
Targeting of an abundant cytosolic form of the protein import receptor atToc159 to the
outer chloroplast membrane. J Cell Biol 154: 309 – 316
Hua J, Grisafi P, Cheng S-H, Fink GR (2001). Plant growth homeostasis is controlled by the
Arabidopsis BON1 and BAP1 genes. Genes Dev 15, 2263-2272
118
Hughes NM, Neufeld HS, Burkey KO (2005) Functional role of anthocyanins in high-light
winter leaves of the evergreen herb Galax urceolata. New Phytol 168: 575-587
Hundal T, Forsmark-Andrée P, Ernster L, Andersson B (1995) Antioxidant Activity of
Reduced Plastoquinone in Chloroplast Thylakoid Membranes. Arch Biochem Biophys 324:
117-122
Ishiga Y, Uppalapati SR, Ishiga T, Elavarthi S, Martin B, Bender CL (2009) The phytotoxin
coronatine induces light-dependent reactive oxygen species in tomato seedlings. New
Phytol 181: 147-160
Izawa S (1980) Acceptors and donors for chloroplast electron transport. Methods Enzymol 69:
413-434.
Jambunathan N, Siani JM, McNellis TW (2001) A humidity-sensitive Arabidopsis copine
mutant exhibits precocious cell death and increased disease resistance. Plant Cell 13:2225-
2240
Jensen PJ, Rytter J, Detwiler EA, Travis JW, McNellis TW (2003) Rootstock effects on gene
expression patterns in apple tree scions. Plant Mol Biol 53:493-511
Jensen PJ, Makalowska I, Altman N, Fazio G, Praul C, Maximova SN, Crassweller RM,
Travis JW, McNellis TW (2010) Rootstock-regulated gene expression patterns in apple
tree scions. Tree Genet Genomes 6:57-72
Jones AME, Bennett MH, Mansfield JW, Grant M (2006) Analysis of the defence
phosphoproteome of Arabidopsis thaliana using differential mass tagging. Proteomics 6:
4155-4165
Joo JH, Wang S, Chen JG, Jones AM, Fedoroff NV (2005) Different signaling and cell death
roles of heterotrimeric G protein α and β subunits in the Arabidopsis oxidative stress
response to ozone. Plant Cell 17: 957-970
Kangasjarvi, J., Jaspers, P., and Kollist, H. (2005). Signalling and cell death in ozone-exposed
plants. Plant, Cell & Environment 28, 1021-1036.
Kasajima I, Ide Y, Ohkama-Ohtsu N, Hayashi H, Yoneyama T, Fujiwara T. (2004) A
protocol for rapid DNA extraction from Arabidopsis thaliana for PCR analysis. Plant Mol
Biol Rep 22: 49-52
Kessler F, Vidi P-A (2007) Plastoglobule Lipid Bodies: their Functions in Chloroplasts and their
Potential for Applications. In Green Gene Technology, pp 153-172
Kivimäenpää M, Sutinen S, Karlsson PE, Selldén G (2003) Cell structural changes in the
needles of norway spruce exposed to long-term ozone and drought. Ann Bot (Lond)
92:779-793
Knoth R, Hansmann P, Sitte P (1986) Chromoplasts of Palisota barteri, and the molecular
structure of chromoplast tubules. Planta 168: 167-174
Ko K, Norelli JL, Reynoird JP, Boresjza-Wysocka E, Brown SK, Aldwinckle HS (2000)
Effect of untranslated leader sequence of AMV RNA 4 and signal peptide of pathogenesis-
related protein 1b on attacin gene expression, and resistance to fire blight in transgenic
apple. Biotechnol Lett 22: 373-381
Kovalenko IB, Ustini DM, Grachev NE, Krendeleva TE, Kukharskikh GP, Timofeev KN,
Riznichenko GY, Grachev EA, Rubin AB, (2003) Cyclic electron transport around
photosystem I: An experimental and Theoretical study. Biophysics 48 (4): 614-623
Kruk J, Jemiola-Rzeminska M, Strzalka K (1997) Plastoquinol and [alpha]-tocopherol quinol
are more active than ubiquinol and [alpha]-tocopherol in inhibition of lipid peroxidation.
Chem Phys Lipids 87: 73-80
Kruk J, Trebst A (2008) Plastoquinol as a singlet oxygen scavenger in photosystem II. BBA-
Bioenergetics 1777: 154-162

119
Kytridis V-P, Manetas Y (2006) Mesophyll versus epidermal anthocyanins as potential in vivo
antioxidants: evidence linking the putative antioxidant role to the proximity of oxyradical
source. J Exp Bot 57: 2203-2210.
Laizet Y, Pontier D, Mache R, Kuntz M (2004) Subfamily organization and phylogenetic
origin of genes encoding plastid lipid-associated proteins of the fibrillin type. J Genome Sci
Tech 3: 19-28
Lamb C, Dixon RA (1997) The oxidative burst in plant disease resistance. Annu Rev Plant
Physiol Plant Mol Biol 48: 251-275
Langenkämper G, Manac'h N, Broin M, Cuiné S, Becuwe N, Kuntz M, Rey P (2001)
Accumulation of plastid lipid-associated proteins (fibrillin/CDSP34) upon oxidative stress,
ageing and biotic stress in Solanaceae and in response to drought in other species. J Exp
Bot 52: 1545-1554
Lee SA, Ngugi HK, Halbrendt NO, O’Keefe G, Lehman B, Travis JW, Sinn JP, McNellis
TW (2010) Virulence characteristics accounting for fire blight disease severity in apple
trees and seedlings. Phytopathology 100: 539-550
Leitner-Dagan Y, Ovadis M, Shklarman E, Elad Y, David DR, Vainstein A (2006)
Expression and functional analyses of the plastid lipid-associated protein CHRC suggest its
role in chromoplastogenesis and stress. Plant Physiol 142: 233-244
Li W, Chen C, Markmann-Mulisch U, Timofejeva L, Schmelzer E, Ma H, Reiss B (2004)
The Arabidopsis AtRAD51 gene is dispensable for vegetative development but required for
meiosis. Proc Natl Acad Sci 101: 10596-10601
Lichtenthaler HK (1968) Plastoglobuli and the fine structure of plastids. Endeavor 27: 144 - 149
Liu J, Jambunathan N, McNellis TW (2005) Transgenic expression of the von Willebrand A
domain of the BONZAI 1/COPINE 1 protein triggers a lesion-mimic phenotype in
Arabidopsis. Planta 221: 85-94
Liu Y, Ren D, Pike S, Pallardy S, Gassmann W, Zhang S. (2007) Chloroplast-generated
reactive oxygen species are involved in hypersensitive response-like cell death mediated by
a mitogen-activated protein kinase cascade. Plant J 51: 941-954
Lohmann A, Schottler MA, Brehelin C, Kessler F, Bock R, Cahoon EB, Dormann P (2006)
Deficiency in phylloquinone (Vitamin K1) methylation affects prenyl quinone distribution,
photosystem I abundance, and anthocyanin accumulation in the arabidopsis atmenG
mutant. J Biol Chem 281: 40461-40472
Malnoy M, Jin Q, Borejsza-Wysocka EE, He S-Y, Aldwinckle HS (2007) Overexpression of
the apple MpNPR1 gene confers increased disease resistance in Malus x domestica. Mol
Plant Microbe Interact 20: 1568-1580
Maximova SN, Dandekar AM, Guiltinan MJ (1998) Investigation of Agrobacterium-mediated
transformation of apple using green fluorescent protein: high transient expression and low
stable transformation suggest that factors other than T-DNA transfer are rate-limiting. Plant
Mol Biol 37: 549-559
Maximova S, Miller C, Antúnez de Mayolo G, Pishak S, Young A, Guiltinan MJ (2003)
Stable transformation of Theobroma cacao L. and influence of matrix attachment regions
on GFP expression. Plant Cell Rep 21:872-883
Maxson-Stein K, He S-Y, Hammerschmidt R, Jones AL (2002) Effect of treating apple trees
with acibenzolar-S-methyl on fire blight and expression of pathogenesis-related protein
genes. Plant Dis 86: 785-790
Mehdy MC (1994) Active oxygen species in plant defense against pathogens. Plant Physiol 105:
467-472
Mitsuhara I, Ugaki M, Hirochika H, Ohshima M, Murakami T, Gotoh Y, Katayose Y,
Nakamura S, Honkura R, Nishimiya S, Ueno K, Mochizuki A, Tanimoto H, Tsugawa
120
H, Otsuki Y, Ohashi Y (1996) Efficient promoter cassettes for enhanced expression of
foreign genes in dicotyledonous and monocotyledonous plants. Plant Cell Physiol 37:49–59
Miyake H, Matsumura H, Fujinuma Y, Totsuka T (1989) Effects of low concentrations of
ozone on the fine structure of radish leaves. New Phytol 111: 187-195
Murgia I, Delia T, Vannini C, Bracale M, Carravieri S, Soave C (2004) Arabidopsis thaliana
plants overexpressing thylakoidal ascorbate peroxidase show increased resistance to
paraquat-induced photooxidative stress and to nitric oxide-induced cell death. Plant J 38:
940-953
Noctor G, Foyer CH (1998) Ascorbate and glutathione: keeping active oxygen under control.
Annu Rev Plant Physiol Plant Mol Biol 49: 249-279
Norelli JL, Farrell RE Jr, Bassett CL, Baldo AM, Lalli DA, Aldwinckle HS, Wisniewski ME
(2009) Rapid transcriptional response of apple to fire blight disease revealed by cDNA
suppression subtractive hybridization analysis. Tree Genet Genomes 5: 27-40
Owen HA, Makaroff CA (1995) Ultrastructure of microsporogenesis and microgametogenesis
in Arabidopsis thaliana (L.) Heynh. ecotype Wassilewskija (Brassicaceae). Protoplasma
185: 7-21
Okamoto, T., Fukui, K., Nakamoto, M., Kishi, T., Okishio, T. Yamagami, T. Kanamori, N.
Kishi, H and Hiraoka, E. (1985) High-performance liquid chromatography of coenzyme
Q-related compounds and its application to biological materials. Journal of
Chromatography B: Biomedical Sciences and Applications 342, 35-46
Padham AK, Hopkins MT, Wang T-W, McNamara LM, Lo M, Richardson LGL, Smith
MD, Taylor CA, Thompson JE (2007) Characterization of a plastid triacylglycerol lipase
from Arabidopsis. Plant Physiol 143: 1372-1384
Panou-Filotheou H, Bosabalidis AM, Karataglis S (2001) Effects of Copper Toxicity on
Leaves of Oregano (Origanum vulgare subsp. hirtum). Ann Bot 88: 207-214
Parker KG, Leupschen NS, Jones AL (1974) Inoculation trials with Erwinia amylovora to
apple rootstocks. Plant Dis Rep 58: 243–247
Peltier J-B, Ytterberg AJ, Sun Q, van Wijk KJ (2004) New functions of the thylakoid
membrane proteome of Arabidopsis thaliana revealed by a simple, fast, and versatile
fractionation strategy. J Biol Chem 279: 49367-49383
Pozueta-Romero J, Rafia F, Houlné G, Cheniclet C, Carde J-P, Schantz M-L, Schantz R
(1997) A ubiquitous plant housekeeping gene, PAP, encodes a major protein component of
bell pepper chromoplasts. Plant Physiol 115: 1185-1194
Pshibytko NL, Kalitukho LN, Kabashnikova LF (2003) Effects of High Temperature and
Water Deficit on Photosystem II in Hordeum vulgare Leaves of Various Ages. Russ J Plant
Physl+ 50: 44-51
Pruvot G, Cuiné S, Peltier G, Rey P (1996) Characterization of a novel drought-induced 34-
kDa protein located in the thylakoids of Solanum tuberosum L. plants. Planta 198: 471-479
Rey P, Gillet B, Römer S, Eymery F, Massimino J, Peltier G, Kuntz M (2000)
Overexpression of a pepper plastid lipid-associated protein in tobacco leads to changes in
plastid ultrastructure and plant development upon stress. Plant J 21: 483-494
Rizo J, Sudhof TC (1998). C2-domains, Structure and Function of a Universal Ca2+-binding
Domain. J Biol Chem 273, 15879-15882
Rorat T, Havaux M, Irzykowski W, Cuiné S, Becuwe N, Rey P (2001) PSII-S gene
expression, photosynthetic activity and abundance of plastid thioredoxin-related and lipid-
associated proteins during chilling stress in Solanum species differing in freezing
resistance. Physiol Plant 113: 72-78

121
Runeckles VC, Chevonne BI (1992) Crop responses to ozone. In AS Lefohn, ed, Surface level
ozone exposures and their effects on vegetation, Lefohn AS, ed, Lewis Publishers, Chelsea,
MI, pp 189-270
Ruoslahti E, Pierschbacher MD (1987). New perspectives in cell adhesion: RGD and integrins.
Science 238(4826):491-497
Sanabria NM, Dubery IA (2006) Differential display profiling of the Nicotiana response to LPS
reveals elements of plant basal resistance. Biochem Biophys Res Commun 344: 1001-1007
Shetty NP, Jørgensen HJL, Jensen JD, Collinge DB, Shetty HS (2008) Roles of reactive
oxygen species in interactions between plants and pathogens. Eur J Plant Pathol 121: 267-
280
Shui G, Guan XL, Low CP, Chua GH, Goh JSY, Yang H, Wenk MR (2010) Toward one step
analysis of cellular lipidomes using liquid chromatography coupled with mass
spectrometry: application to Saccharomyces cerevisiae and Schizosaccharomyces pombe
lipidomics. Molecular BioSystems 6: 1008-1017
Simkin AJ, Gaffe J, Alcaraz J-P, Carde J-P, Bramley PM, Fraser PD, Kuntz M (2007)
Fibrillin influence on plastid ultrastructure and pigment content in tomato fruit.
Phytochemistry 68: 1545-1556
Sims DA, Gamon JA (2002) Relationships between leaf pigment content and spectral reflectance
across a wide range of species, leaf structures and developmental stages. Remote Sens
Environ 81: 337-354
Singh DK, Maximova SN, Jensen PJ, Lehman BL, Ngugi HK, McNellis TW (2010)
FIBRILLIN4 is required for plastoglobule development and stress resistance in apple and
Arabidopsis. Plant Physiol 154: 1281-1293
Singh DK, McNellis TW (2011) Fibrillin protein function: the tip of the iceberg? Trends plant
sci (doi:10.1016/j.tplants.2011.03.014)
Smillie RM, Hetherington SE (1999) Photoabatement by anthocyanin shields photosynthetic
systems from light stress. Photosynthetica 36: 451-463
Soll J, Kemmerling M, Schultz G (1980) Tocopherol and plastoquinone synthesis in spinach
chloroplasts subfraction1. Arch Biochem Biophys 204 (2): 544-550
Song X, Fan H, Wei Z-M (2002) Receptors for hypersensitive response elicitors and uses thereof
(U.S. Patent Application, Publication No. 20020007501, U.S.A.)
Steinmüller D, Tevini M (1985) Composition and function of plastoglobuli. Planta 163: 201-207
Steyn WJ, Wand SJE, Holcroft DM, Jacobs G (2002) Anthocyanins in vegetative tissues: a
proposed unified function in photoprotection. New Phytol 155: 349-361
Sud M, Fahy E, Cotter D, Brown A, Dennis EA, Glass CK, Merrill AH, Murphy RC, Raetz
CRH, Russell DW, Subramaniam S (2007) LMSD: LIPID MAPS structure database.
Nucleic Acids Res 35: D527-D532
Taiz L, Zeiger E (2006) Plant Physiology, CHAPTER 7, topic 7.10 Mode of Action of Some
Herbicides. (http://4e.plantphys.net/index.php)
Tarantino D, Vannini C, Bracale M, Campa M, Soave C, Murgia I (2005) Antisense
reduction of thylakoidal ascorbate peroxidase in Arabidopsis enhances Paraquat-induced
photooxidative stress and nitric oxide-induced cell death. Planta 221: 757-765
Tennant S (1804) On two metals, found in the black powder remaining after the solution of
platina. Phil Trans Royal Soc London 94: 411-418
Teshima K, Kondo T (2005) Analytical method for uniqinone-9 and ubiquinone-10 in rat
tissues by liquid chromatography/turbo ion spray tandem mass spectrometry with 1-
alkylamine as an additive to the mobile phase. Anal Biochem 338, 12-19
Tevini M, Steinmüller D (1985) Composition and function of plastoglobuli. Planta 163: 91-96

122
Trebst A (1978) Plastoquinones in Photosynthesis. Philosophical Transactions of the Royal
Society of London. Series B, Biological Sciences 284: 591-599
Tuquet C, Newman DW (1980) Aging and regreening in soybean cotyledons .1. ultrastructural-
changes in plastids and plastoglobuli. Cytobios 29: 43-59
Valentine RC (1958) Contrast in the electron microscope image. Nature 181: 832-833
Venisse J-S, Gullner G, Brisset M-N (2001) Evidence for the involvement of an oxidative stress
in the initiation of infection of pear by Erwinia amylovora. Plant Physiol 125: 2164-2172
Venisse J-S, Malnoy M, Faize M, Paulin J-P, Brisset M-N (2002) Modulation of defense
responses of Malus spp. during compatible and incompatible interactions with Erwinia
amylovora. Mol Plant Microbe Interact 15: 1204-1212
Vidi P-A, Kanwischer M, Baginsky S, Austin JR, Csucs G, Dörmann P, Kessler F, Bréhélin
C (2006) Tocopherol cyclase (VTE1) localization and vitamin E accumulation in
chloroplast plastoglobule lipoprotein particles. J Biol Chem 281: 11225-11234
Wei ZM, Laby RJ, Zumoff CH, Bauer DW, He SY, Collmer A, Beer SV (1992) Harpin,
elicitor of the hypersensitive response produced by the plant pathogen Erwinia amylovora.
Science 257: 85-88
Whalen M, Innes RW, Bent AF, Staskawicz BJ (1991) Identification of Pseudomonas syringae
pathogens of Arabidopsis and a bacterial locus determining avirulence on both Arabidopsis
and soybean. Plant Cell 3: 49-59
Wigglesworth VB (1957) The use of osmium in the fixation and staining of tissues. Proc Royal
Soc London Series B Biol Sci 147: 185-199
Williams SC, Hinshelwood J, Perkins SJ, Sim RB (1999). Production and functional activity of
a recombinant von Willebrand factor-A domain from human complement factor B.
Biochem J 342, 625-632
Winkenbach F, Falk H, Liedvogel B, Sitte P (1976) Chromoplasts of Tropaeolum majus L.:
Isolation and characterization of lipoprotein elements. Planta 128: 23-28
Xing D, Chen Z (2006) Effects of mutations and constitutive overexpression of EDS1 and PAD4
on plant resistance to different types of microbial pathogens. Plant Sci 171: 251-262
Yang Y, Sulpice R, Himmelbach A, Meinhard M, Christmann A, Grill E (2006) Fibrillin
expression is regulated by abscisic acid response regulators and is involved in abscisic acid-
mediated photoprotection. Proc Natl Acad Sci USA 103: 6061-6066
Yang S, Yang H, Grisafi P, Sanchatjate S, Fink GR, Sun Q, Hua J (2006). The BON/CPN
gene family represses cell death and promotes cell growth in Arabidopsis. Plant J 45, 166-
179.
Youssef A, Laizet Y, Block MA, Maréchal E, Alcaraz J-P, Larson TR, Pontier D, Gaffé J,
Kuntz M (2010) Plant lipid-associated fibrillin proteins condition jasmonate production
under photosynthetic stress. Plant J 61: 436-445
Ytterberg AJ, Peltier J-B, van Wijk KJ (2006) Protein profiling of plastoglobules in
chloroplasts and chromoplasts. A surprising site for differential accumulation of metabolic
enzymes. Plant Physiol 140: 984-997
VITA
Dharmendra Kumar Singh
EDUCATION
Ph.D. Integrative Bioscience, Pennsylvania State University, University Park 2007-Present
Thesis: Characterization of Fibrillin 4 Function in Apple trees and Arabidopsis plants Advisor: Dr. Timothy McNellis, Co-advisor: Dr. Siela Maximova
M.S. Integrative Bioscience, Pennsylvania State University, UP 2003-2007
Thesis: Cross Talk in Hormone Signaling Upon Ozone Exposure in Arabidopsis
Advisor: Dr. Nina Fedoroff
M.S. Plant Physiology, Indian Agriculture Research Institute (IARI), India 2001-2003
Thesis: Physiological and Molecular Analysis of Salt Stress in Rice
Advisor: Dr. Madan Pal
B.S. Agriculture Sciences, Banaras Hindu University, Banaras, India 1996-2000
(Major in genetics and plant breeding)
Manuscript in Preparation
Dharmendra K. Singh, Siela N. Maximova, Tatiana N. Laremore, and Timothy W. McNellis.
Fibrillin 4 is required for maintaining plastoglobule lipid content in cultivated apple trees.
Dharmendra K. Singh, Judy Sinn, Siela N. Maximova, and Timothy W. McNellis.
Characterization of Fibrillin4 overexpresser apple and Arabidopsis plants
H. K. Ngugi, Dharmendra K. Singh, B. L. Lehman, J. W. Travis, T. W. McNellis. Explaining
the association between apple tree stress and resistance to the fire blight bacterium Erwinia
amylovora
Publications:
Singh DK, McNellis TW. (2011) Fibrillin protein function: the tip of the iceberg? Trends in plant
science. doi:10.1016/j.tplants.2011.03.014
Dharmendra K. Singh, Siela N. Maximova, Philip J. Jensen, Brian L. Lehman, Henry K. Ngugi,
and Timothy W. McNellis. (2010) FIBRILLIN 4 is required for plastoglobule development
and stress resistance in apple and Arabidopsis. Plant Physiology 154: 1281-1293
M. P. Singh, D.K. Singh, M. Rai. (2005) Assessment of growth, physiology and biochemical
parameters and activities of antioxidative enzymes in salinity tolerant and sensitive basmati
rice varieties. J. Agronomy and Crop Science 193:398-412.
Madan Pal, D.K. Singh, L. S. Rao and K. P. Singh. (2004) Photosynthetic characterization and
activity of antioxidant enzyme in salinity tolerant and sensitivity rice cultivars. Indian J.
Plant Physiol. 9(4): 407-412.