Embed Size (px)
Citation preview

1
Characterization of a New Efflorescence Salt on
Calcareous Historic Objects stored in Wood Cabinets:
Ca2(CH3COO)(HCOO)(NO3)2·4H2O
SEBASTIAN BETTEA*, GERHARD EGGERT
B, ANDREA FISCHER
B, JÖRG STELZNER
B, ROBERT E.
DINNEBIERA
aMax-Planck-Institute for Solid State Research, Heisenbergstr. 1 70569 Stuttgart, Germany
E-Mail: [email protected] bState Academy of Art and Design, Am Weißenhof 1, 70191 Stuttgart, Germany
Abstract
White efflorescence crystals grown on the surfaces of a bronze bowl, classical ceramic and ancient wine
jugs were investigated. X-ray powder diffraction (XRPD) revealed that in each case an identical, hitherto
unknown phase was formed. The crystal structure was solved from high resolution XRPD measurements
and revealed a phase composition of Ca2(CH3COO)(HCOO)(NO3)2·4H2O, which is in accordance with
the complementary analysis. The overall structural motif of Ca2(CH3COO)(HCOO)(NO3)2·4H2O, one
dimensional calcium carboxylate zig zag chains in which acetate and formate ions are arranged in an
alternating fashion, is closely related to other naturally occurring or artificial efflorescence salts like
thecotrichite or calclacite.
Keywords: A. ceramics; B. X-ray powder diffraction; B. Raman spectroscopy;
B. SEM; C. atmospheric corrosion; C acid corrosion

2
1. Introduction
Wood, especially oak, emits some formic and acetic acid the latter being ester bound in the wood
polyoses (“hemicellulose”). In situations with limited air exchange as in cupboards or drawers, typically
hundred to thousand ppb can be measured[1]. These pollutants may cause damage on sensitive artefacts
stored for long time in them under such conditions. Acetate containing efflorescence on calcareous
natural history specimen like shells (“Byne’s disease”) has already been reported end of the 19th
century[2]. Calcium acetates, often exhibiting needle like shape, have also been detected occurring on
ceramics. During soil logging, calcareous accretions may be deposited on ceramics. Whether calcium
from the ceramic body itself can also be mobilized to form calcium acetates has not been thoroughly
studied yet, at least some clays are rich in calcium and are used for yellow wares. On fossils and
limestone stored in wooden museum cases, on pottery sherds[3] including classical ceramics from the
Agora of Athens stored in oak drawers and cabinets[4], calcium acetate hemihydrate and calclacite
(Ca(CH3COO)Cl·5H2O) have been detected in efflorescence. The pattern of calclacite could be indexed
with a monoclinic unit cell[3,5] and it’s crystal structure was already solved in 1972[6]. The chloride was
attributed to the former practice of cleaning the ceramic sherds from the calcareous accretions with
hydrochloric acid and directly drying them without prior soaking with water. This must have left
considerable amounts of calcium chloride in the porous ceramic body. Especially on tiles which can take
up migrating soluble salts from walls thecotrichite, a compound also containing nitrate, was detected[7].
Its exact formula, Ca3(CH3COO)3Cl(NO3)2·6H2O, and its crystal structure have recently been
determined[8].
The chemistry and the crystallography of calcium acetate and formate salts are rather complex, as for
anhydrous calcium formate four distinct polymorphs[9,10] and for anhydrous calcium acetate three
distinct polymorphs[11] are known. Crystal structures of calcium acetate formates are unknown so far
although they are reported from molluscs in oak cabinets[12]. A pronounced polymorphism was also
observed for calcium acetate monohydrate. Different polymorphs can be obtained when the phase is
crystallized in pure water[13], water ethanol mixtures[14] or in presence of organic admixtures[15].
Calcium acetate hemihydrate (Ca(CH3COO)2·0.5H2O) was identified as an efflorescence product as
well[4] but it’s crystal structure remains still unknown. This phase occurs as an intermediary product of
the thermal decomposition of calcium acetate monohydrate[16]. In aqueous solution the monohydrate
phase was found to be thermodynamically stable[17]. The occurrence of the hemihydrate phase as an
efflorescence product can be understood from the relative humidity (rH)-temperature diagram for the
calcium acetate phases[4]. At room temperature, the monohydrate transforms to the hemihydrate below
71% rH. The systems Ca(CH3COO)2-CaCl2-H2O and Ca(CH3COO)2-Ca(NO3)2-H2O have been studied
systematically in order to find a thermodynamic explanation for the formation of calclacite and
thecotrichte[4,18]. At 25 °C calclacite was found to crystallize in (3-7) m CaCl2 solutions with a calcium
acetate concentration from 0.1 to 1.4 mol/ kg (H2O). The investigation on the system Ca(CH3COO)2-
Ca(NO3)2-H2O resulted in the discovery and characterization of an additional, artificial efflorescence salt
Ca2(CH3COO)3NO3·2H2O[19]. Despite their occurrence as efflorescence, the system calcium acetate-
calcium formate lacks a systematic study.
As needle like, white efflorescence crystals can be visually easily mistaken for thecotrichite or calclacite,
calcareous efflorescence were sampled in natural history and historic collections in the framework of the

3
RaCoPhInO (“Rare Corrosion Phenomena of Inorganic Objects”) research in the Objects’ Conservation
program of the State Academy of Art and Design Stuttgart. In four cases the same unknown compound
was detected by X-ray powder diffraction (XRPD). One of the samples was evaluated to contain the new
efflorescence phase without any impurities and used for a detailed characterization. As no suitable crystal
for single crystal diffraction was found, the crystal structure was solved from XRPD measurements.
2. Materials and Methods
2.1.Sample Collection
Four samples of white efflorescence crystal were collected from four different objects, which were stored
in three different museums (Table 1) under different conditions (relative humidity, temperature, furniture,
etc.). The first object investigated here is an Anatolian copper alloy bowl from the Rautenstrauch-Joest-
Museum Cologne bought from an antiquities trader in the bazaar of Istanbul and a few hundred years old.
On the surface of the bowl turquoise coloured sections attributed to corrosion of the bronze material can
be found besides white efflorescence crystals having a needle like shape (Fig. 1). Needle like white
efflorescence crystals were found on the inner and outer side of an Attic black figured amphora depicting
a bridal and a warrior procession of the Antikensammlung Munich (Fig. 2), excavated near Vulci (Italy)
and bought in 1831 on behalf of Ludwig I. of Bavaria from the Candelori Collection. Two black figured
Attic wine jugs[20], ca. 500 BCE (Fig. 3) from the National Museum of Antiquities Leiden also exhibit
white efflorescence crystals.
Fig. 1. Anatolian copper alloy bowl (Rautenstrauch-Joest-Museum Cologne) with white efflorescence crystals
(magenta highlighted areas). ©Anke Freud
4
Fig. 2. (a) Attic black figured amphora of the Antikensammlung Munich, high 54 cm, (b) view from above through
the black rim into the amphora; hairy crystals growing from white deposits (magenta cycle), (c) hairy crystals
growing on the outside of the amphora (magenta highlighted area) © Anton Buhl
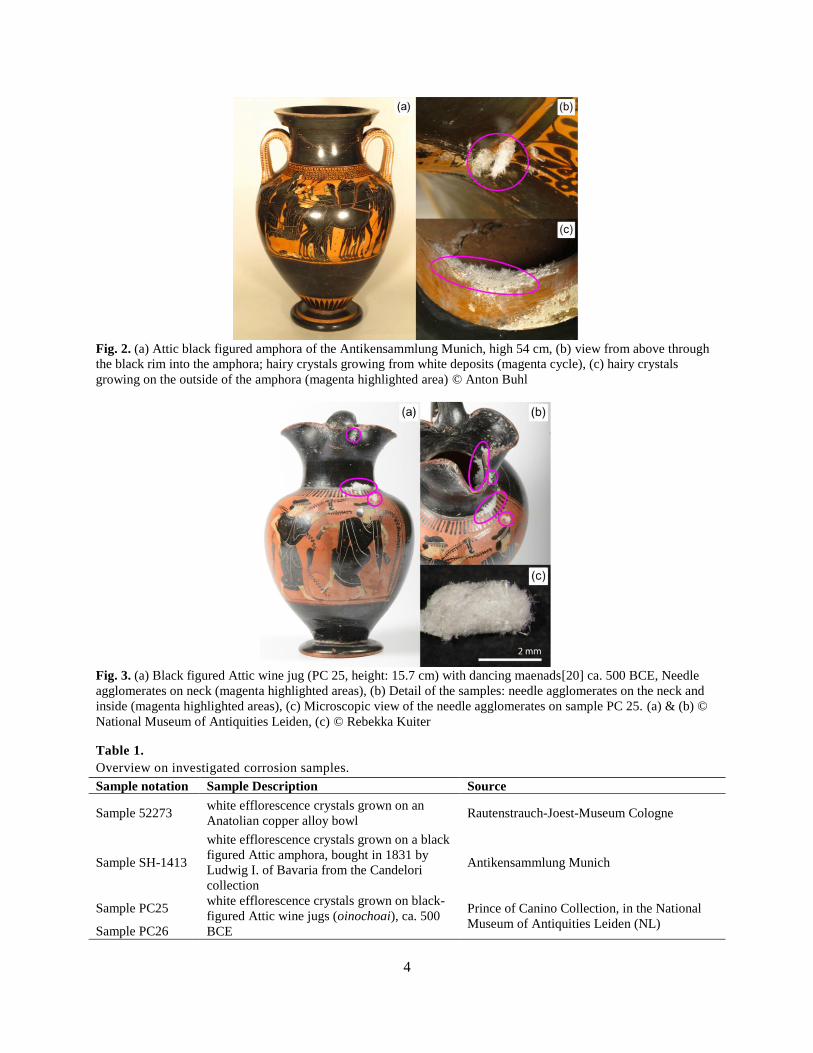
Fig. 3. (a) Black figured Attic wine jug (PC 25, height: 15.7 cm) with dancing maenads[20] ca. 500 BCE, Needle
agglomerates on neck (magenta highlighted areas), (b) Detail of the samples: needle agglomerates on the neck and
inside (magenta highlighted areas), (c) Microscopic view of the needle agglomerates on sample PC 25. (a) & (b) ©
National Museum of Antiquities Leiden, (c) © Rebekka Kuiter
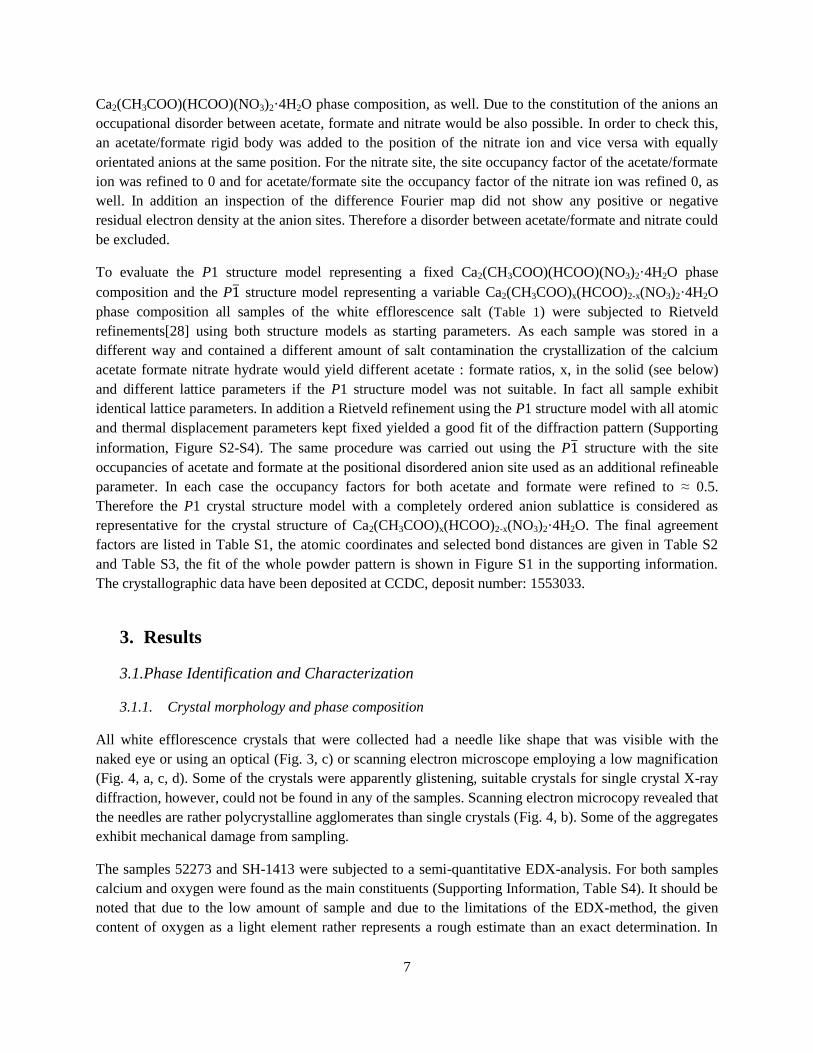
Table 1.
Overview on investigated corrosion samples.
Sample notation Sample Description Source
Sample 52273 white efflorescence crystals grown on an
Anatolian copper alloy bowl Rautenstrauch-Joest-Museum Cologne
Sample SH-1413
white efflorescence crystals grown on a black
figured Attic amphora, bought in 1831 by
Ludwig I. of Bavaria from the Candelori
collection
Antikensammlung Munich
Sample PC25 white efflorescence crystals grown on black-
figured Attic wine jugs (oinochoai), ca. 500
BCE
Prince of Canino Collection, in the National
Museum of Antiquities Leiden (NL) Sample PC26

5
2.2.Phase Characterization
2.2.1. SEM-EDX Analysis
The white efflorescence crystals of samples 52273 and SH-1413 (Table 1) were investigated by scanning
electron microscopy (SEM) and energy dispersive X-ray spectroscopy (EDX) using a Zeiss EVO 60
microprobe and an accelerating Voltage of 20 kV. For the micrographs, the samples have been sputtered
with carbon.
2.2.2. Ion Chromatography
The sample 52273 (Table 1) was analysed using a protocol developed for the analysis of soluble salts
occurring on the surface of historic glasses, for experimental details see[21].
2.2.3. Raman-spectroscopy
µ-Raman spectroscopy of samples 52773 and SH-1413 (Table 1) was conducted using a Renishaw inVia
Raman spectrometer with a Leica DMLM microscope and a RenCam CCD detector. The spectrometer
was equipped with a He-Ne laser operating at 632.8 nm, with power kept below 400 µW on the sample
surface.
2.2.4. Thermal Analysis
Thermal analysis was carried out on sample SH-1413 (Table 1) using a STA 449 F5-Jupiter (Netzsch)
device for TG-measurements. 2.3 mg of the sample were placed in an Al2O3 crucible and heated up from
30 °C to 1000 °C with a heating rate of 2 K/min in a 50 mL/min Ar-stream. An empty Al2O3 crucible was
used as reference material. After cooling down to room temperature in an Ar-stream, the residue of the
thermal decomposition was immediately transferred into a capillary, that was sealed and analysed by ex-
situ X-ray powder diffraction (see below).
2.2.5. Laboratory X-ray powder diffraction
The XRPD patterns of all solids used for quantitative phase analysis and crystal structure solution were
collected at room temperature on a laboratory powder diffractometer in Debye-Scherrer geometry (Stadi
P-Diffraktometer (Stoe), Cu-Kα1 radiation from primary Ge(111)-Johann-type monochromator, Mythen 1
K detector (Dectris)). The samples were sealed in 0.3 mm diameter borosilicate glass capillaries
(Hilgenberg glass No. 14), which were spun during the measurements. Each pattern was measured in a 2
θ range from 5.0° to 90.5° applying a total scan time of 14 h and 17 min.
2.2.6. In- and ex-situ X-ray powder diffraction
Temperature dependent in situ XRPD measurements were carried out on a laboratory powder
diffractometer in Debye-Scherrer geometry (Stadi P-Diffraktometer (Stoe), Mo-Kα1 radiation from
primary Ge(111)-Johann-type monochromator, array of 3 Mythen 2 K detectors (Dectris)) using sample
SH-1413 (Table 1). The sample was sealed in a 0.3 mm diameter borosilicate glass capillary (Hilgenberg
glass No. 14), which was spun during the measurements. The patterns were measured in a 2 θ range from

6
2.0° to 115.0° applying a total scan time of 30 min per measurement. The temperature was adjusted using
an Oxford Cryostream device (Oxford Cryostream 500, Oxford Cryosystems). The sample was heated
form 30 °C to 220 °C in steps of 5 K. During each step a diffraction pattern was collected. Afterwards the
sealed capillary was cooled down to room temperature and stored for four days and then measured again
using a diffractometer and scan parameters described below to check for reversibility of the
decomposition process. The residue after thermal decomposition of sample SH-1413 was investigated
with a similar device that is equipped with one Mythen 1 K detector (Dectris). The pattern was measured
with a 2 θ range from 2.0° to 60.0° applying a total scan time of 10 h.
2.3.Structure Determination
The program TOPAS 6.0[22] was used to determine and refine the crystal structure of
Ca2(CH3COO)(HCOO)(NO3)2·4H2O using sample 52273 (Table 1). Indexing of the phase was carried
out by an iterative use of singular value decomposition (LSI)[23] leading to a primitive triclinic unit cell
with lattice parameters given in the Supporting Information (Table S1) and P1(1) or P1(2) as possible
space groups. The peak profile and the precise lattice parameters were determined by LeBail[24] fits
applying the fundamental parameter approach of TOPAS[25]. The background was modelled by
employing Chebychev polynomials of 6th order and the hump in the background caused by the glass
capillary was modelled by a very broad Lorentzian shaped peak. The refinement converged quickly.
The crystal structure of Ca2(CH3COO)(HCOO)(NO3)2·4H2O was solved by applying the global
optimization method of simulated annealing (SA) in real space as it is implemented in TOPAS[26].
Crystal structure solution was carried out using both space groups, P1(1) and P1(2). Considering the
determined unit cell volume and the packing density of related compounds (see below) the content of the
unit cell was estimated with 2x Ca, 4x A with A = HCOO-, CH3-COO
-, NO3
- and nx H2O. For structure
solution in space group P1 rigid bodies for the formate (HCOO-), the acetate (CH3-COO
-) and nitrate
(NO3-) were defined in z-matrix notation and freely translated and rotated within the unit cell. With
respect to the results of the ion chromatography (see below) and the site multiplicity of P1, one acetate,
one formate and two nitrate units were included in the simulated annealing process. The global
optimization was carried out many times; including different numbers of oxygen sites, representing
hydrate water. Oxygen atoms situated on identical positions were identified by using a merging radius of
0.7 Å[27]. In result the simulated annealing process always yielded identical structural models that were
independent from the starting parameters and represented a phase composition of
Ca2(CH3COO)(HCOO)(NO3)2·4H2O. For the final Rietveld refinement[28], all profile and lattice
parameters were released iteratively and positions of the calcium and oxygen (hydrate water) atoms were
subjected to free unconstrained refinement. The bond lengths and angles of the rigid bodies were refined,
restraining them to reasonable values and the hydrogen positions were omitted due to the limits of the
powder diffraction method. A close inspection of the atomic positions revealed a pronounced pseudo
centrosymmetry which is only broken by the crystallographic non-equivalent formate-acetate pair. In
order to check for centrosymmetry, crystal structure solution was carried out again using space group P1.
Instead of distinct rigid bodies for formate and acetate units a R-COO- unit with R = H and CH3 was
created in z-matrix notation with refineable side occupancies for the hydrogen and the methyl rest to
model an occupationally disordered acetate/formate site. This led to a similar structure model as obtained
using P1 with occupancy factors for both acetate and formate of ≈ 0.5, thus representing a
7
Ca2(CH3COO)(HCOO)(NO3)2·4H2O phase composition, as well. Due to the constitution of the anions an
occupational disorder between acetate, formate and nitrate would be also possible. In order to check this,
an acetate/formate rigid body was added to the position of the nitrate ion and vice versa with equally
orientated anions at the same position. For the nitrate site, the site occupancy factor of the acetate/formate
ion was refined to 0 and for acetate/formate site the occupancy factor of the nitrate ion was refined 0, as
well. In addition an inspection of the difference Fourier map did not show any positive or negative
residual electron density at the anion sites. Therefore a disorder between acetate/formate and nitrate could
be excluded.
To evaluate the P1 structure model representing a fixed Ca2(CH3COO)(HCOO)(NO3)2·4H2O phase
composition and the P1 structure model representing a variable Ca2(CH3COO)x(HCOO)2-x(NO3)2·4H2O
phase composition all samples of the white efflorescence salt (Table 1) were subjected to Rietveld
refinements[28] using both structure models as starting parameters. As each sample was stored in a
different way and contained a different amount of salt contamination the crystallization of the calcium
acetate formate nitrate hydrate would yield different acetate : formate ratios, x, in the solid (see below)
and different lattice parameters if the P1 structure model was not suitable. In fact all sample exhibit
identical lattice parameters. In addition a Rietveld refinement using the P1 structure model with all atomic
and thermal displacement parameters kept fixed yielded a good fit of the diffraction pattern (Supporting
information, Figure S2-S4). The same procedure was carried out using the P1 structure with the site
occupancies of acetate and formate at the positional disordered anion site used as an additional refineable
parameter. In each case the occupancy factors for both acetate and formate were refined to ≈ 0.5.
Therefore the P1 crystal structure model with a completely ordered anion sublattice is considered as
representative for the crystal structure of Ca2(CH3COO)x(HCOO)2-x(NO3)2·4H2O. The final agreement
factors are listed in Table S1, the atomic coordinates and selected bond distances are given in Table S2
and Table S3, the fit of the whole powder pattern is shown in Figure S1 in the supporting information.
The crystallographic data have been deposited at CCDC, deposit number: 1553033.
3. Results
3.1.Phase Identification and Characterization
3.1.1. Crystal morphology and phase composition
All white efflorescence crystals that were collected had a needle like shape that was visible with the
naked eye or using an optical (Fig. 3, c) or scanning electron microscope employing a low magnification
(Fig. 4, a, c, d). Some of the crystals were apparently glistening, suitable crystals for single crystal X-ray
diffraction, however, could not be found in any of the samples. Scanning electron microcopy revealed that
the needles are rather polycrystalline agglomerates than single crystals (Fig. 4, b). Some of the aggregates
exhibit mechanical damage from sampling.
The samples 52273 and SH-1413 were subjected to a semi-quantitative EDX-analysis. For both samples
calcium and oxygen were found as the main constituents (Supporting Information, Table S4). It should be
noted that due to the low amount of sample and due to the limitations of the EDX-method, the given
content of oxygen as a light element rather represents a rough estimate than an exact determination. In

8
addition the contents of carbon and nitrogen were not determined at all. For sample SH-1413 traces of
sulfur, sodium and aluminum (both < 0.5 wt %) were found, as well. Sample 52273 was also analyzed by
ion chromatography. Except for a trace of sodium (possibly contamination from the glass vial) only
calcium was found as cation. Acetate, formate and nitrate were found as anions with a ratio of ca. 1.0
acetate : 1.0 formate : 1.5 nitrate. Crystal structure determination using sample 52273 (see above) was
successfully performed using a phase composition of Ca2(CH3COO)(HCOO)(NO3)2·4H2O.
Fig. 4. SEM-images of white efflorescence crystals of sample 52273 (a), (b) and sample SH-1413 (c), (d).
3.1.2. X-ray powder diffraction
All samples of white efflorescence crystals were investigated by X-ray powder diffraction (XRPD) and
the measured patterns were compared to calculated patterns of calclacite (Ca(CH3COO)Cl·5H2O)[6],
Ca2(CH3COO)3NO3·2H2O[19] and thecotrichite (Ca3(CH3COO)3Cl(NO3)2·6H2O)[8] (Fig. 5, a-c). The
measured patterns are basically identical (Fig. 5, d-g) and they significantly differ from the calculated
ones of the known efflorescence products. In addition, no match of the measured reflection positions to
any entry in the PDF4-database[29] could be found, hence the investigated efflorescence crystals
represent a hitherto unknown phase. A close inspection of the measured diffraction patterns, however,
reveals slight differences. In the pattern of samples SH-1413, PC25 and PC26 an additional weak
reflection is apparent at ca. 11.5°2θ (Fig. 5, e-g, star) that can be assigned to CaSO4·2H2O (gypsum).
Sample PC26 exhibits further reflections (Fig. 5, e, triangles) that can be assigned to CaCO3 (calcite) and
three additional reflections (26.0, 26.6 and 27.0°2 θ, Fig. 5, squares) that cannot be assigned
unambiguously to any known phase. In conclusion sample 52273 can be considered as a pure sample of a

9
new efflorescence product and was therefore used for crystal structure determination (see above). The
other samples were subjected to a quantitative phase analysis (Supporting Information, Figure S 2-4). In
result it could be demonstrated, that the structural model derived from sample 52273 is suitable for all
other samples, as well. Samples SH-1413 and PC25 contain small impurities of gypsum (4.1 and 3.5 wt-
% Table 2), whereas sample PC26 contains a significant amount of calcite.
Fig. 5. Simulated XRPD patterns of (a) calclacite, (b) Ca2(CH3COO)3NO3·2H2O, (c) thecotrichite and measured
XPRD pattens of sample (d) 52273, (e) PC26, (f) PC25 and (g) SH-1413. *In patterns (e-f) the presence of gypsum
is indicated by the appearance of the 020 reflection. ▼In pattern (e) some reflections could be assigned to calcite,
and some additional reflections ■ that cannot be assigned unambiguously.
Table 2
Crystalline components in the samples of white efflorescence crystals according to quantitative phase
analysis (Supporting Information, Figure S2-S4).
Sample Composition according to quantitative phase analysis by XRPD
Sample 52273 pure Ca2(CH3COO)(HCOO)(NO3)2·4H2O
Sample SH-1413 95.9 wt-% Ca2(CH3COO)(HCOO)(NO3)2·4H2O, 4.1 wt-% CaSO4·2H2O
Sample PC25 96.5 wt-% Ca2(CH3COO)(HCOO)(NO3)2·4H2O, 3.5 wt-% CaSO4·2H2O
Sample PC26 90.1 wt-% Ca2(CH3COO)(HCOO)(NO3)2·4H2O, 0.9 wt-% CaSO4·2H2O + 9.0 wt-% CaCO3
(calcite) and a trace of a non-identified phase

10
3.1.3. Raman Spectroscopy
The white efflorescence crystals of samples 52273 and SH-1413 were investigated by Raman
spectroscopy and the measured spectra were compared to the Raman spectrum of thecotrichite
(Ca3(CH3COO)3Cl(NO3)2·6H2O). The complete spectra are presented in the Supporting Information
(Figure S5), in Fig. 6 excerpts of the high- (a) and mid-Raman shift regions (b) are shown. For the band
assignment (Table 3) spectroscopic data of Ca(HCOO)2[30], Ca(CH3COO)2·H2O[31], Ca(CH3COO)2[32],
Ca(NO)3·4H2O[33] as well as the fundamental vibrations of the nitrate ion[34] and the acetate ion[35]
were used. The measured spectra of the two samples of Ca2(CH3COO)(HCOO)(NO3)2·4H2O are identical
in terms of band positions and the number of bands present (Fig. 6, green and violet lines). This is an
additional support of the P1 structure model (see above) that represents a fixed phase composition with a
non-variable anion ratio as complex salts having a variable phase composition exhibit differences in the
band positions and sometimes in the band numbers in the vibrational spectra[36].
Fig. 6. Comparison of the measured Raman spectra of Thecotrichite (Ca3(CH3COO)3Cl(NO3)2·6H2O), sample 52273
and sample SH-1413 (a) in the high- and (b) in the mid-Raman shift region, for band assignment see Table 3.
In the high-Raman shift region (Fig. 6, a) of the spectra of Ca2(CH3COO)(HCOO)(NO3)2·4H2O at least
two very broad band are visible that can be assigned to OH-stretching modes of the hydrate water
molecules present in the crystal structure (Table 3, band no. (1), (2)). Like thecotrichite,
Ca2(CH3COO)(HCOO)(NO3)2·4H2O exhibits acetate related CH-stretching modes at (2925-3000) cm-1
(band no. (3), (4)), but an additional CH-stretching mode present in the Raman-spectra (band no. (5))
cannot be assigned to acetate ions, as it is located clearly below 2900 cm-1
. The occurrence of this band
confirms the presence of formate ions and it can be assigned to the in-plane CH-stretching mode of the
anion. Another confirmation of the presence of formate ions in the white efflorescence phase of samples
52273 and SH-1413 can be found in the region of mid-Raman shifts (Fig. 6, b). Nitrate attributed NO
stretching modes are present in all spectra between 1350 cm-1
and 1500 cm-1
(Table 3, band no. (6), (7)
and (9)). The spectra of samples 52273 and SH-1413 exhibit an additional, sharp band, which is related to
an in-plane deformation mode of the formate ion. Other prominent features of the Raman spectrum of

11
Ca2(CH3COO)(HCOO)(NO3)2·4H2O are the very sharp ν1 stretching mode of the nitrate ions (band no.
11) and the sharp ν4 stretching mode of the acetate ions (band no. 12), which are also present in the
Raman spectrum of thecotrichite.
Table 3 Measured band positions of Ca2(CH3COO)(HCOO)(NO3)2·4H2O (Fig. 6), band assignment according to [30–35].
band
no.
band position/ cm-1
,
shape assignment
band
no.
band position/ cm-1
,
shape assignment
(1) ≈3465 w, br ν(OH)
[hydrate water]
(11) 1034 vs, s ν(NO) [nitrate]
(2) ≈3395 w, br (12) 968 s ν(CO) [acetate]/
(3) 2978 w, br ν(CH)
[acetate]
(13) 800 s γ(CO) [formate]
(4) 2947 m (14) 736 m ν(NO) [Nitrate]
(5) 2871 s ν(CH, in plane)
[formate] (15) 717 w, br
γ(OH)
[hydrate water]
(6) 1475 m, br ν(NO)
[nitrate] (16) 670 m ν(CO) [acetate]
(7) 1458 m
(8) 1393 s γ(CH, in plane)
[formate] (17) ≈190 m, br
lattice vibrations (9) 1355 m ν(CO) [formate]/
ν(NO) [nitrate] (18) ≈140 m, br
(10) 1067 s ν(CH, out of plane)
[formate] (19) 117 s
vs = very strong, m = medium, w = weak, br = broad, s = sharp
3.2.Thermal Decomposition
The thermal behaviour of Ca2(CH3COO)(HCOO)(NO3)2·4H2O was studied by thermogravimetric
analysis covering a temperature range from 30 °C to 1000 °C, ex-situ XRPD of the residue after the
thermal analysis and temperature dependent in-situ XRPD measurements in a sealed capillary covering a
temperature range from 30 °C to 220 °C in which hydrate water is released. In order to check the
dehydration reaction for reversibility the capillary of the in-situ XRPD measurements was cooled down to
room temperature, stored for four days and measured again by XRPD.
3.2.1. Thermal Analysis
Thermal decomposition of Ca2(CH3COO)(HCOO)(NO3)2·4H2O in a dry Ar-gas stream starts at ca. 60 °C
, ends at ca. 710 °C and proceeds as a 4-step process (Fig. 7). The first two steps of the decomposition
process overlap (Fig. 7, inset). As the second decomposition step already ends at ca. 140 °C, these steps
are most likely associated with the release of hydrate water. The step height of the first two steps is almost
equal; hence it can be assumed that in each step two molecules of hydrate water are released. There is a
slight derivation of the measured (21.1 wt-%) to the calculated total mass loss (19.0 wt-%) of the first two
steps (Table 4), which is attributed to adsorbed water as the efflorescence crystals are hygroscopic and to
gypsum, which is present as a small impurity (Table 2). The next decomposition step takes place between
325 °C and 375 °C. According to the measured mass loss, Ca2(CH3COO)(HCOO)(NO3)2 is completely
decomposed into CaCO3 (Table 4). This is seemingly in contradiction to the decomposition mechanism of
Ca(NO3)2·4H2O[37], which first releases all hydrate water molecules upon heating and the decomposition

12
of the nitrate ions above 500 °C yields CaO. The thermal decomposition of carboxylate salts, i.e. acetate
and formate which takes place at ca. 380°C (Ca(CH3COO)2)[38] and 360°C Ca(HCOO)2[10], however
leads to the formation of reactive radical species[39] that react with the nitrate ions and lead to the
conversion of Ca2(CH3COO)(HCOO)(NO3)2 into CaCO3. During the last decomposition step the solid is
decomposed into CaO, which was confirmed by ex-situ XRPD analysis of the residue (Supporting
Information, Figure S6.). The measured total mass loss (70.8 wt-%) is in good according with the
calculated value (70.5 wt-%).
Fig. 7. Thermal analysis of Ca2(CH3COO)(HCOO)(NO3)2·4H2O.
Table 4 Assignment of the observed decomposition steps in the TG-curve.
steps Reaction/ residue total mass loss/ wt-%
calc. meas.
(1) release of ≈ 2.0 mol* hydrate water
19.0 21.1 (2) release of ≈ 2.0 mol* hydrate water
(1)-(2) residue: Ca2(CH3COO)(HCOO)(NO3)2
(3) decomposition of the acetate, formate and nitrate ions residue: 2 CaCO3 47.4 47.2
(4) decomposition of the carbonate ions residue: 2 CaO 70.5 70.8
*estimated from the ratio of step sizes in the TG-curve (Error! Reference source not found., inset)

13
3.2.2. In- and Ex-situ X-ray powder diffraction
In-situ XRPD measurements revealed the occurrence of four different crystalline phases during the
thermal dehydration of Ca2(CH3COO)(HCOO)(NO3)2·4H2O between 30°C and 220°C (Fig. 8). During
this experiment the decomposition of the white efflorescence phase occurred at slightly higher
temperatures than observed during the thermal analysis (atmosphere: dry Ar-gas stream), as the
measurements were carried out in a sealed capillary. With respect to the TG-curve (Fig. 7) XRPD patterns
of the first crystalline decomposition product that were measured between 90 and 130°C (Fig. 8, b) can be
assigned to Ca2(CH3COO)(HCOO)(NO3)2·2H2O. According to the thermal analysis the decomposition of
the dihydrate phase into Ca2(CH3COO)(HCOO)(NO3)2 occurs as a one-step process (Fig. 7), in the in-situ
XRPD patterns, however, the occurrence of a short-lived crystalline intermediate can be observed (Fig. 8,
c, d). This intermediate could be a sub-hydrate, Ca2(CH3COO)(HCOO)(NO3)2·xH2O with x < 2.0 or a
second polymorph of Ca2(CH3COO)(HCOO)(NO3)2. Due to the pronounced polymorphism of anhydrous
Calcium acetate[11] and –formate[9] the occurrence of an α- and β- form of
Ca2(CH3COO)(HCOO)(NO3)2 would not be unexpected.
Fig. 8. Temperature dependent in-situ XRPD measurements (MoKα1 radiation, 0.7093 Å) of
Ca2(CH3COO)(HCOO)(NO3)2·4H2O (a) starting material, (b) Ca2(CH3COO)(HCOO)(NO3)2·2H2O
(c) α-Ca2(CH3COO)(HCOO)(NO3)2 or Ca2(CH3COO)(HCOO)(NO3)2·xH2O with x < 2.0,
(d) ß-Ca2(CH3COO)(HCOO)(NO3)2.
The final product of the dehydration reaction (Fig. 8, d) was cooled down to room temperature and stored
for four days to check for a rehydration of Ca2(CH3COO)(HCOO)(NO3)2 in the water vapor saturated
atmosphere of the capillary. A comparison of the measured powder patterns of the starting material, the

14
intermediates and the product of the dehydration reaction with product of the rehydration is presented in
Fig. 9. It is obvious that Ca2(CH3COO)(HCOO)(NO3)2 (Fig. 9, d) was rehydrated to a mixture of
Ca2(CH3COO)(HCOO)(NO3)2·2H2O (Fig. 9, e, stars) and Ca2(CH3COO)(HCOO)(NO3)2 ·2H2O
(triangles). A complete rehydration, however, seems to be slow, as the reaction is not completed after four
days.
Fig. 9. XRPD patterns of (a) Ca2(CH3COO)(HCOO)(NO3)2·4H2O at 30°C, (b) Ca2(CH3COO)(HCOO)(NO3)2·2H2O
at 115°C (c) α-Ca2(CH3COO)(HCOO)(NO3)2 or Ca2(CH3COO)(HCOO)(NO3)2·xH2O with x < 2.0 at 140°C, (d) ß-
Ca2(CH3COO)(HCOO)(NO3)2 at 220°C (all in-situ data of heating a sealed capillary) and (e) rehydration of ß-
Ca2(CH3COO)(HCOO)(NO3)2 in the sealed capillary yielding a mixture of Ca2(CH3COO)(HCOO)(NO3)2·2H2O (*)
and Ca2(CH3COO)(HCOO)(NO3)2·4H2O ().
3.3.Crystal Structure Description
Ca2(CH3COO)(HCOO)(NO3)2·4H2O crystallizes in a non-centrosymmetric, primitive, triclinic lattice that
contains two calcium sites. Each calcium cation is coordinated by 8 oxygen atoms from which two of
each are donated by acetate-, formate-, nitrate ions and water molecules. The distances between oxygen

15
and calcium were determined to range between 2.15 Å and 2.64 Å (Supporting Information, Table S2),
which is comparable to related compounds[6,8,19]. All oxygen atoms are located within the coordination
sphere of Calcium. One calcium site is coordinated by bidentate nitrate (µ2-NO3) and formate (µ2-
HCOO), monodentate acetate (µ1-CH3-COO) and two water molecules (Fig. 10). The other calcium site
exhibits an almost identical coordination sphere with bidentate acetate (µ2-CH3-COO) and monodentate
formate (µ1-HCOO). The CaO8-polyhedra are bridged by carboxylate ions whereas the water molecules
and the non-coordinating nitrate-oxygen are apical.
Fig. 10. Coordination spheres of cations and anions in the crystal structure of
Ca2(CH3COO)(HCOO)(NO3)2·4H2O. Hydrogen positions were not determined.
The CaO8-polyherdra form infinite zig-zag chains running in a-direction (Fig. 11) in which the two
distinct Ca-sites are repeated alternatingly. The space in-between the chain is filled by the methyl groups
of the acetate ions and the non-coordinating oxygen atoms of the nitrate ion. Comparatively short
distances between water molecules (dO(H2O)-O(H2O) = 2.73(2) Å) and water molecules and nitrate ions
(dO(H2O)-O(NO3) = 3.04(1) Å) of adjacent chains point to strong dipolar interactions or even H-bonds
that mediate the interconnections between the CaO8-polyherdra chains. Due to the limits of the XRPD
method, however, no attempt was made to determine or refine the hydrogen positions. Although a 7-fold
coordination of calcium is present in carboxylate salts like formates[40,41] and acetate hydrates[13–15]
the removal of water molecules from Ca2(CH3COO)(HCOO)(NO3)2·4H2O by heating seems to induce
vast but reversible structural changes (Fig. 9) that will be subject of a separate study.

16
Fig. 11. Packing diagram of Ca2(CH3COO)(HCOO)(NO3)2·4H2O, views along (a) c-, (b) b- and (c) a-direction.
CaO8-polyhedra are displayed in yellow, nitrate ions by green triangles. Hydrogen positions were not determined.
Hydrogen atoms were added to idealized positions to the acetate and formate ions for a clear distinction between
them.

17
4. Discussion
4.1.The formation of Ca2(CH3COO)(HCOO)(NO3)2·4H2O on calcareous heritage objects.
The ceramics were stored in collections for nearly two centuries. For such objects, the treatment on the
excavation site and later in the museums is nearly never documented. On the other hand, corrosion
products can give indications which chemicals have interacted with the objects during storage and
cleaning and, therefore, give hints to the conservation history.
The occurrence of soluble calcium acetates is a major concern for conservation. With fluctuating relative
humidity, solution and crystallization processes in the pores of the ceramic body may cause considerable
salt damage. Aqueous desalination (with prior consolidation, if necessary) is mandatory.
4.1.1. Source of acetate and formate
Pollutants like acetic and formic acid or their precursors acetaldehyde and formaldehyde are interacting
with heritage objects, a major source is wood or wooden products. On glass surfaces, formates
dominate[21]. Consequently, on metals in contact with glass mainly formates are found, most frequent in
glass-induced metal corrosion is a sodium copper formate[42]. On calcareous objects, however, acetates
dominate in deterioration products. Mixed calcium acetate formates (of unknown structure) have only
been reported from mollusks[12]. Here we show for the first time that formate compounds can also form
on calcareous accretions on ceramics and bronze.
4.1.2. Source of nitrate
Nitrate can be formed in the soil by nitrifying bacteria but is very mobile. Therefore, it is rarely detected
in the soluble salts on ceramics from semi-arid climates. A more likely source of nitrates is cleaning with
nitric acid, which is not totally uncommon in ceramics conservation[43]: ‘Encrustations of calcium
carbonate or calcium sulphate …can be removed using acids. The acids most commonly used are
hydrochloric acid and nitric acid and the organic acids oxalic acid, citric acid and acetic acid...Sulphate
deposits require stronger acid solutions for removal. Some writers recommend concentrated nitric or
hydrochloric acid whilst others suggest 20% nitric acid.’ (p.89/91). If not thoroughly soaked in water this
leaves calcium nitrate in the ceramic body reacting over time with traces of acetic and formic acid to the
title compound. Therefore, the use of mineral acids should be completely avoided at all nowadays. If this
is not feasible under exceptionable circumstances, their use has to be followed by thorough aqueous
desalination.
4.2.Crystal chemistry of white efflorescence products and related salts
Naturally occurring efflorescence salts, calclacite (Ca(CH3COO)Cl·5H2O), thecotrichite
(Ca3(CH3COO)3Cl(NO3)2·6H2O) and Ca2(CH3COO)(HCOO)(NO3)2·4H2O, as well as synthetic
compounds, e.g. Ca2(CH3COO)3NO3·2H2O exhibit structural similarities: I. in all crystal structures
calcium is coordinated by 8 oxygen atoms forming polyhedra with a mono-capped bipyramidal shape and
II all crystal structures exhibit one dimensional polymeric Ca-carboxylate ((Ca(µ2-R-COO))n) zig zag

18
chains (Fig. 12). Each link of the chain is connected to neighbouring links by monodentate coordinating
carboxylate ions. Thus four out of eight places in the coordination sphere of calcium are occupied by
carboxylate ions forming the one dimensional polymeric backbone that is closely related to the main
motif of the crystal structure of β-Ca(HCOO)2[41]. Therefore crystal structures of the efflorescence salts
only differ in the occupation of the four remaining ligand positions (Fig. 12, L1-L4) and in the occupation
of voids in-between these chains.
In the crystal structure of calclacite (Ca(CH3COO)Cl·5H2O) all ligand positions from L1 to L4 are occupied
by apical hydrate water (Table 5) resulting in the formation of loosely packed (26.73 ų per non-H atom
of the polymeric chains) one dimensional [Ca(µ2-CH3-COO)(H2O)4]+
n polymeric chains (Fig. 13, a). One
water molecule and one chloride ion per calcium ions are intercalated in between the chains resulting into
a total packing density of 21.87 ų per non-H atom. In the polymeric calcium carboxylate backbone of
Ca2(CH3COO)(HCOO)(NO3)2·4H2O half of the acetate ions are replaced by formate and half of the water
molecules are replaced by a bidentate coordinating nitrate ion (Fig. 13, b). In consequence charge balance
is already maintained within the [(Ca(µ2-CH3-COO)(µ2-NO3)(H2O)2)-(Ca(µ2-HCOO)(µ2-NO3)(H2O)2)]n
polymeric chain. The space in-between the chains is filled by non-coordinating oxygen of the nitrate ions
and by methyl groups of the acetate ions, which results in a high packing density (17.14 ų per non-H
atom). Therefore neither water molecules nor halide ions are intercalated. In the polymeric backbone of
Ca2(CH3COO)3NO3·2H2O an additional water molecule is replaced by a monodentate coordinating
acetate ion (Table 5). In contrast to Ca2(CH3COO)(HCOO)(NO3)2·4H2O (Fig. 13, b) the nitrate ion and
the additional acetate ion act as bridging ligands that connect the one dimensional calcium carboxylate
polymeric chain with neighbouring chains (c) forming a closed packed 3-dimensional network with a
packing density of 17.81 ų per non-H atom. Accordingly no additional molecules or ions are
intercalated. The polymeric backbone of thecotrichite (Ca3(CH3COO)3Cl(NO3)2·6H2O) (Fig. 13, d)
exhibits similarities to the polymeric calcium carboxylate chain in Ca2(CH3COO)(HCOO)(NO3)2·4H2O
(Fig. 13, b). In the coordination spheres of the calcium ions in thecotrichite, two water molecules are also
replaced by bidentate coordinating nitrate ions, but one third of the calcium ions (site Ca(1)) is
coordinated by an additional monodentate coordinating nitrate ion, that replaces a water molecule. In
contrast to Ca2(CH3COO)(HCOO)(NO3)2·4H2O all oxygen atoms of the nitrate ions of thecotrichite are
situated within the coordination sphere of calcium. Hence the nitrate ions connect neighbouring polymeric
chains forming a 3d-network that is much less dense packed (packing density of 19.84 ų per non-H atom
of the polymeric chains) than in Ca2(CH3COO)3NO3·2H2O. Due to intercalation of water molecules and
chloride ions in-between the chains of thecotrichite the charge balance is maintained as well as a total
packing density (18.51 ų per non-H atom) that is comparable with other efflorescence salts.
In summary all discussed efflorescence salt phases seem to belong to an entire structure family of one
dimensional, polymeric calcium carboxylates. According to the variability of the 8-fold coordination
sphere of calcium a huge variety of phases with a distinct composition in terms of the content of hydrate
water, carboxylate and other anions and of intercalated ions and molecules can be expected. Thus
reinvestigation of white efflorescence salts on calcareous objects or a systematic investigation on
synthetic calcium carboxylate salts appears to be worthwhile.

19
Fig. 12. One dimensional, polymeric calcium carboxylate backbone of related calcium acetate formate nitrates
hydrate phases with R = H, CH3 and L = H2O, µ1/µ2-NO3 and R-COO.
Fig. 13. Comparison of the polymeric calcium carboxylate backbones of (a) calclacite (Ca(CH3COO)Cl·5H2O), (b)
Ca2(CH3COO)(HCOO)(NO3)2·4H2O, (c) Ca2(CH3COO)3NO3·2H2O (the structural disorder is not explicitly shown)
and (d) thecotrichite (Ca3(CH3COO)3Cl(NO3)2·6H2O).

20
Table 5 Comparison of polymeric calcium carboxylate backbones and structural motifs of related efflorescence salts.
name Calclacite - - Thecotrichite
formula Ca(CH3COO)Cl·
5H2O
Ca2(CH3COO)
(HCOO)(NO3)2·4H2O
Ca2(CH3COO)3NO3·2
H2O
Ca3(CH3COO)3Cl
(NO3)2·6H2O
illustration Fig. 13 (a) Fig. 13 (b) Fig. 13 (c) Fig. 13 (d)
carboxylate
backbone (Ca(CH3COO))
+n
(Ca(CH3COO)-
Ca(HCOO))2+
n (Ca(CH3COO))
+n (Ca(CH3COO))
+n
n H2O : n Ca2+
5 2 1 2
L1 H2O H2O H2O H2O
L2 H2O } µ2-NO3
- } µ2-NO3
- } µ2-NO3
-
L3 H2O
L4 H2O H2O µ1-CH3COO- 1x µ1-NO3
-/ 2x H2O
structural
motif isolated 1D Ca-carboxylate chains
3D network of inter-connected 1D Ca-
carboxylate chains
intercalated
ions/molecules
per mol Ca2+
1 H2O, 1 Cl- - - ⅓ H2O, ⅓ Cl
-
4.3.Synopsis in a corrosion science related context
In the current study we present the identification and structural characterization of a hitherto unknown
corrosion product. With their ground-breaking study on the crystal structure of β-Fe2Cl(OH)3 Réguer et
al.[44] demonstrated how crystal structure data can be used to understand primary corrosion phenomena
of heritage objects and secondary degradation that takes place after the excavation. These results
promoted the understanding of the corrosion of state-of-the-art steel[45] and the developments of
protections strategies for underwater cultural heritage[46]. The elucidated phase composition and crystal
structure of Ca2(CH3COO)(HCOO)(NO3)2·4H2O can be used in the same way.
4.3.1. Conclusions on the corrosion mechanism of calcareous heritage objects
The identification of Ca2(CH3COO)(HCOO)(NO3)2·4H2O as an efflorescence salt besides calclacite
(Ca(CH3COO)Cl·5H2O) and thecotrichite Ca3(CH3COO)3Cl(NO3)2·6H2O demonstrates that efflorescence
of calcareous objects in a halogenide-free environment not necessarily leads to the formation of pure
Calcium acetate hydrates or calcium formates. Ca2(CH3COO)(HCOO)(NO3)2·4H2O was found on four
different objects from three different museums and collections, where they were stored under different
conditions. This points to a quick and easy crystallization and to a very extended crystallization field of
this phase, which is similar to thecotrichite[18]. This will be subject to a subsequent study. In the crystal
structure of Ca2(CH3COO)(HCOO)(NO3)2·4H2O 50 % of the carboxylate backbone consist of formate
ions, despite most hard- and softwoods emit 3-10 times more acetic acid than formic acid[1]. Hence
aggression by formic acid happens to much higher extent than aggression by acetic acid, which can be
explained by the higher strength of formic acid.
21
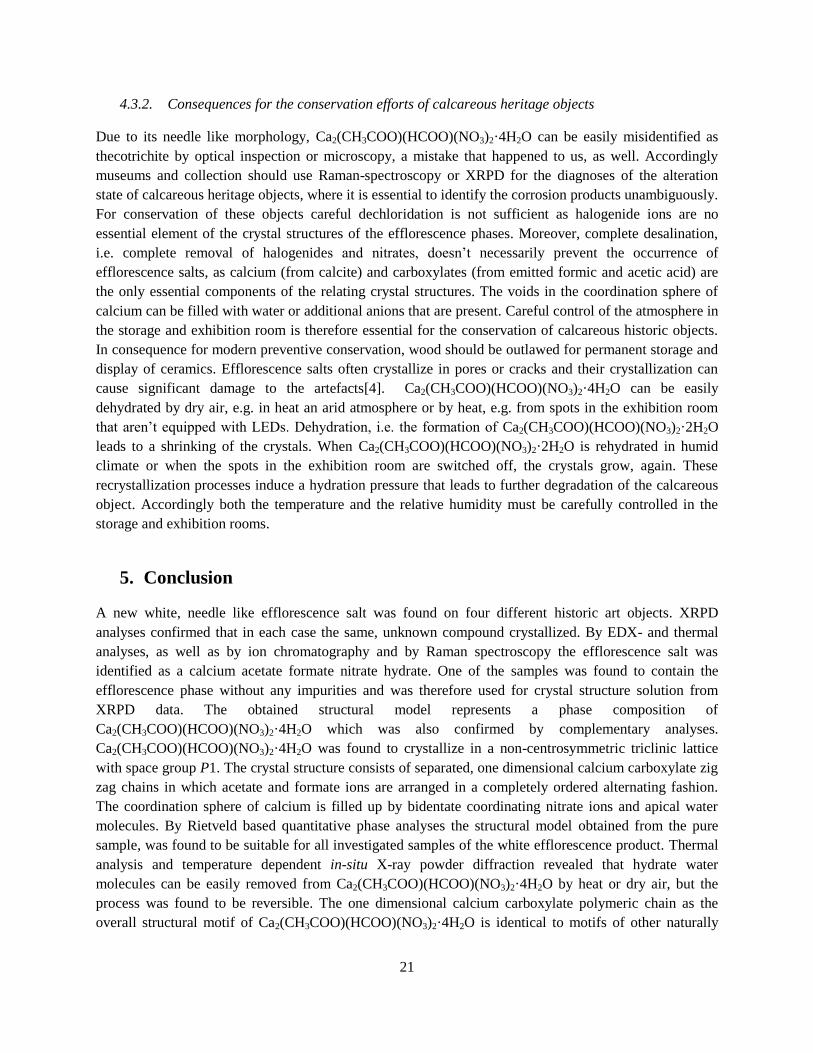
4.3.2. Consequences for the conservation efforts of calcareous heritage objects
Due to its needle like morphology, Ca2(CH3COO)(HCOO)(NO3)2·4H2O can be easily misidentified as
thecotrichite by optical inspection or microscopy, a mistake that happened to us, as well. Accordingly
museums and collection should use Raman-spectroscopy or XRPD for the diagnoses of the alteration
state of calcareous heritage objects, where it is essential to identify the corrosion products unambiguously.
For conservation of these objects careful dechloridation is not sufficient as halogenide ions are no
essential element of the crystal structures of the efflorescence phases. Moreover, complete desalination,
i.e. complete removal of halogenides and nitrates, doesn’t necessarily prevent the occurrence of
efflorescence salts, as calcium (from calcite) and carboxylates (from emitted formic and acetic acid) are
the only essential components of the relating crystal structures. The voids in the coordination sphere of
calcium can be filled with water or additional anions that are present. Careful control of the atmosphere in
the storage and exhibition room is therefore essential for the conservation of calcareous historic objects.
In consequence for modern preventive conservation, wood should be outlawed for permanent storage and
display of ceramics. Efflorescence salts often crystallize in pores or cracks and their crystallization can
cause significant damage to the artefacts[4]. Ca2(CH3COO)(HCOO)(NO3)2·4H2O can be easily
dehydrated by dry air, e.g. in heat an arid atmosphere or by heat, e.g. from spots in the exhibition room
that aren’t equipped with LEDs. Dehydration, i.e. the formation of Ca2(CH3COO)(HCOO)(NO3)2·2H2O
leads to a shrinking of the crystals. When Ca2(CH3COO)(HCOO)(NO3)2·2H2O is rehydrated in humid
climate or when the spots in the exhibition room are switched off, the crystals grow, again. These
recrystallization processes induce a hydration pressure that leads to further degradation of the calcareous
object. Accordingly both the temperature and the relative humidity must be carefully controlled in the
storage and exhibition rooms.
5. Conclusion
A new white, needle like efflorescence salt was found on four different historic art objects. XRPD
analyses confirmed that in each case the same, unknown compound crystallized. By EDX- and thermal
analyses, as well as by ion chromatography and by Raman spectroscopy the efflorescence salt was
identified as a calcium acetate formate nitrate hydrate. One of the samples was found to contain the
efflorescence phase without any impurities and was therefore used for crystal structure solution from
XRPD data. The obtained structural model represents a phase composition of
Ca2(CH3COO)(HCOO)(NO3)2·4H2O which was also confirmed by complementary analyses.
Ca2(CH3COO)(HCOO)(NO3)2·4H2O was found to crystallize in a non-centrosymmetric triclinic lattice
with space group P1. The crystal structure consists of separated, one dimensional calcium carboxylate zig
zag chains in which acetate and formate ions are arranged in a completely ordered alternating fashion.
The coordination sphere of calcium is filled up by bidentate coordinating nitrate ions and apical water
molecules. By Rietveld based quantitative phase analyses the structural model obtained from the pure
sample, was found to be suitable for all investigated samples of the white efflorescence product. Thermal
analysis and temperature dependent in-situ X-ray powder diffraction revealed that hydrate water
molecules can be easily removed from Ca2(CH3COO)(HCOO)(NO3)2·4H2O by heat or dry air, but the
process was found to be reversible. The one dimensional calcium carboxylate polymeric chain as the
overall structural motif of Ca2(CH3COO)(HCOO)(NO3)2·4H2O is identical to motifs of other naturally

22
occurring or artificial efflorescence salts like thecotrichite, calclacite or Ca2(CH3COO)3NO3·2H2O. Thus
the existence of further calcium carboxylate based efflorescence salts can be expected. The presented
structural and spectral data of Ca2(CH3COO)(HCOO)(NO3)2·4H2O can be used as the basis for an easy
identification and quantitative analysis of the white efflorescence salt especially in museums and art
collections worldwide.
Acknowledgement
Mrs. Christine Stefani from the Max-Planck-Institute for Solid State Research is acknowledged for
performing the XRPD measurements for structure determination and Guus Verhaar from University of
Amsterdam for the ion chromatography analysis. Anke Freund (Cologne) drew our attention to the bronze
bowl. Renske Dooijes (National Museum of Antiquities Leiden) detected and sampled the wine jugs in
her collection, Anton Buhl (Antikensammlung München) the classical ceramic.
Funding by DFG for the project „In search of structure“ (grant EG 137/9-1) is gratefully acknowledged.
References
[1] L.T. Gibson, C.M. Watt, Acetic and formic acids emitted from wood samples and their effect on
selected materials in museum environments, Corros. Sci. 52 (2010) 172–178.
doi:10.1016/j.corsci.2009.08.054.
[2] L.F.G. Byne, The corrosion of shells in cabinets, J. Conchol. 9 (1899) 172–178.
[3] R. van Tassel, On the crystallography of calclacite, Ca(CH3COO)Cl.5H2O, Acta Crystallogr. 11
(1958) 745–746. doi:10.1107/s0365110x58002000.
[4] A. Boccia Paterakis, M. Steiger, Salt efflorescence on pottery in the Athenian Agora: A closer
look, Stud. Conserv. 60 (2015) 172–184. doi:10.1179/2047058413y.0000000113.
[5] J.H.L. Voncken, T.W. Verkroost, M.M. Van Tooren, New powder diffraction data on calclacite
(CaClC2H3O2·5H2O), Neues Jahrb. Miner. Monatsh. (2001) 210–220.
[6] G. Giuseppetti, C. Tadini, L. Ungaretti, La struttura cristallina della calclacite/ Crystalline
structure of a triclinic phase of the compound corresponding to calclacite, Ca(CH3COO)Cl.5H2O,
Period. Di Mineral. 41 (1972) 9–21.
[7] A.F. G. Eggert N. Wahlberg, R. E. Dinnebier, T. Runčevski, R. Kuiter, M. Schüch, S. Kampe, E.
Sulzer, A. Wollmann, Efflorescence X? Case Solved: Ca3(CH3COO)3Cl(NO3)2·6H2O! The
Research History, Identification, and Crystal Structure of Thecotrichite, in: L.F. H Roemich (Ed.),
Recent Adv. Glas. Ceram. Conserv. 2016, International Council of Museums – Committee for
Conservation (ICOM-CC), Paris, 2016: pp. 135–144.
[8] N. Wahlberg, T. Runčevski, R.E. Dinnebier, A. Fischer, G. Eggert, B.B. Iversen, Crystal Structure
of Thecotrichite, an Efflorescent Salt on Calcareous Objects Stored in Wooden Cabinets, Cryst.
Growth Des. 15 (2015) 2795–2800. doi:10.1021/acs.cgd.5b00197.
[9] C. Comel, B.F. Mentzen, Comparative study of the polymorphic species of strontium and calcium

23
formates. I. Differential thermal analysis (DTA), J. Solid State Chem. 9 (1974) 210–213.
doi:10.1016/0022-4596(74)90076-0.
[10] B.F. Mentzen, C. Comel, Comparative study of the polymorphic species of strontium and calcium
formates. II. X-Ray diffraction, J. Solid State Chem. 9 (1974) 214–223. doi:10.1016/0022-
4596(74)90077-2.
[11] L. Walter-Levy, J. Laniepce, Varieties of anhydrous calcium acetate, Compt. Rend. 250 (1960)
3320–3322.
[12] N.H. Tennent, T. Baird, The deterioration of Mollusca collections: identification of shell
efflorescence, Stud. Conserv. 30 (2013) 73–85. doi:10.1179/sic.1985.30.2.73.
[13] E.A. Klop, A. Schouten, P. van der Sluis, A.L. Spek, Structure of calcium acetate monohydrate,
Ca(C2H3O2)2.H2O, Acta Crystallogr. Sect. C Cryst. Struct. Commun. 40 (1984) 51–53.
doi:10.1107/s0108270184002985.
[14] P. van der Sluis, A. Schouten, A.L. Spek, Structure of a second polymorph of calcium acetate
monohydrate, Acta Crystallogr. Sect. C Cryst. Struct. Commun. 43 (1987) 1922–1924.
doi:10.1107/s0108270187089601.
[15] R. Helems, L.B. Cole, E.M. Holt, Calcium complexes of mixed ligands: Ca2(acetate)4(HOH)2
and Ca1.5(salicylate)2(acetate)(HOH)2(acetic acid), Inorganica Chim. Acta. 152 (1988) 9–15.
doi:10.1016/s0020-1693(00)90724-2.
[16] J. Panzer, Nature of Calcium Acetate, J. Chem. Eng. Data. 7 (1962) 140–142.
doi:10.1021/je60012a040.
[17] A. Apelblat, E. Manzurola, Solubilities of magnesium, calcium, barium, cobalt, nickel, copper,
and zinc acetates in water fromT= (278.15 to 348.15) K, J. Chem. Thermodyn. 31 (1999) 1347–
1357. doi:10.1006/jcht.1999.0548.
[18] L.T. Gibson, B.G. Cooksey, D. Littlejohn, K. Linnow, M. Steiger, N.H. Tennent, The Mode of
Formation of Thecotrichite, a Widespread Calcium Acetate Chloride Nitrate Efflorescence, Stud.
Conserv. 50 (2005) 284–294. doi:10.1179/sic.2005.50.4.284.
[19] B.G. Cooksey, L.T. Gibson, A.R. Kennedy, D. Littlejohn, L. Stewart, N.H. Tennent, Dicalcium
triacetate nitrate dihydrate, Acta Crystallogr. Sect. C Cryst. Struct. Commun. 55 (1999) 324–326.
doi:10.1107/s0108270198012864.
[20] R.D. Dooijes M., Preserving the Story of Restored Objects: Combining Technical Data with
Historic Sources, in: L.F. H. Roemich (Ed.), Recent Adv. Glas. Ceram. Conserv. 2016.,
International Council of Museums – Committee for Conservation (ICOM-CC), Paris, 2016: pp.
97–107.
[21] M.R. van B. G. Verhaar N. H. Tennent, Weeping Glass: The Identification of Ionic Species on the
Surface of Vessel Glass Using Ion Chromatography, in: L.F. H. Roemich (Ed.), Recent Adv. Glas.
Ceram. Conserv. 2016, Committee for Conservation (ICOM-CC), Paris, 2016: pp. 123–125.
[22] TOPAS , (2017).
[23] A.A. Coelho, Indexing of powder diffraction patterns by iterative use of singular value
decomposition, J. Appl. Crystallogr. 36 (2003) 86–95. doi:10.1107/s0021889802019878.

24
[24] A. Le Bail, H. Duroy, J.L. Fourquet, Ab-initio structure determination of LiSbWO6 by X-ray
powder diffraction, Mater. Res. Bull. 23 (1988) 447–452. doi:10.1016/0025-5408(88)90019-0.
[25] R.W. Cheary, A.A. Coelho, J.P. Cline, Fundamental Parameters Line Profile Fitting in Laboratory
Diffractometers, J Res Natl Inst Stand Technol. 109 (2004) 1–25.
[26] A.A. Coelho, Whole-profile structure solution from powder diffraction data using simulated
annealing, J. Appl. Crystallogr. 33 (2000) 899–908. doi:10.1107/s002188980000248x.
[27] V. Favre-Nicolin, R. Černý, FOX: Modular Approach to Crystal Structure Determination from
Powder Diffraction, Mater. Sci. Forum. 443–444 (2004) 35–38.
doi:10.4028/www.scientific.net/MSF.443-444.35.
[28] H.M. Rietveld, A profile refinement method for nuclear and magnetic structures, J. Appl.
Crystallogr. 2 (1969) 65–71. doi:10.1107/s0021889869006558.
[29] WebPDF-4+2016-Database, (2016).
[30] R.S. Krishnan, P.S. Ramanujam, Raman spectrum of calcium formate, J. Raman Spectrosc. 1
(1973) 533–538. doi:10.1002/jrs.1250010603.
[31] P. Baraldi, G. Fabbri, Study of the bands attributable to crystallization water in hydrated metal
acetates, Spectrochim. Acta Part A Mol. Spectrosc. 37 (1981) 89–92. doi:10.1016/0584-
8539(81)80092-x.
[32] P. Baraldi, Thermal behavior of metal carboxylates: III-metal acetates, Spectrochim. Acta Part A
Mol. Spectrosc. 38 (1982) 51–55. doi:10.1016/0584-8539(82)80176-1.
[33] J. Hetmanczyk, Ł. Hetmanczyk, A. Migdał-Mikuli, E. Mikuli, K. Druzbicki, A. Wesełucha-
Birczynska, L.M. Proniewicz, Vibrations and reorientations of H2O molecules and NO3− anions
in Ca(H2O)4(NO3)2 studied by incoherent inelastic neutron scattering, Raman light scattering,
and infrared absorption spectroscopy, J. Chem. Phys. 131 (2009) 94506. doi:10.1063/1.3202767.
[34] M. Xu, J.P. Larentzos, M. Roshdy, L.J. Criscenti, H.C. Allen, Aqueous divalent metal–nitrate
interactions: hydration versus ion pairing, Phys. Chem. Chem. Phys. 10 (2008) 4793.
doi:10.1039/b807090n.
[35] E. Spinner, 812. The vibration spectra of some substituted acetate ions, J. Chem. Soc. (1964)
4217–4226. doi:10.1039/jr9640004217.
[36] S. Bette, R.E. Dinnebier, R.K. Kremer, D. Freyer, Ni3Cl2+x(OH)4-x·2H2O: Structural, Thermal,
Spectral, and Magnetic Properties in Dependence of the Chloride Content, Eur. J. Inorg. Chem.
2016 (2016) 1875–1885. doi:10.1002/ejic.201600074.
[37] W. Brockner, C. Ehrhardt, M. Gjikaj, Thermal decomposition of nickel nitrate hexahydrate,
Ni(NO3)2·6H2O, in comparison to Co(NO3)2·6H2O and Ca(NO3)2·4H2O, Thermochim. Acta.
456 (2007) 64–68. doi:10.1016/j.tca.2007.01.031.
[38] A.W. Musumeci, R.L. Frost, E.R. Waclawik, A spectroscopic study of the mineral paceite
(calcium acetate), Spectrochim Acta A Mol Biomol Spectrosc. 67 (2007) 649–661.
[39] Z. Lin, D. Han, S. Li, Study on thermal decomposition of copper(II) acetate monohydrate in air, J.
Therm. Anal. Calorim. 107 (2011) 471–475. doi:10.1007/s10973-011-1454-4.

25
[40] M.O. Bargouth, G. Will, Calcium formate Ca(HCOO)2 (neutron), Cryst. Struct. Commun. 9
(1980) 605–613.
[41] M. Matsui, T. Watanabé, N. Kamijo, R.L. Lapp, R.A. Jacobson, The structures of calcium formate
β-Ca(HCOO)2 and δ-Ca(HCOO)2, and the tetragonal mixed crystals Ca(HCOO)2–Sr(HCOO)2,
Acta Crystallogr. Sect. B Struct. Crystallogr. Cryst. Chem. 36 (1980) 1081–1086.
doi:10.1107/s056774088000533x.
[42] R.E. Dinnebier, T. Runčevski, A. Fischer, G. Eggert, Solid-State Structure of a Degradation
Product Frequently Observed on Historic Metal Objects, Inorg. Chem. 54 (2015) 2638–2642.
doi:10.1021/ic5027637.
[43] V.O. S. Buys, No Title, in: Conserv. Restor. Ceram., reprint of, Routledge, London, 2011: p. 89.
[44] S. Reguer, F. Mirambet, C. Remazeilles, D. Vantelon, F. Kergourlay, D. Neff, P. Dillmann, Iron
corrosion in archaeological context: Structural refinement of the ferrous hydroxychloride β-
Fe2(OH)3Cl., Corros. Sci. 100 (2015) 589–598. doi:10.1016/j.corsci.2015.08.035.
[45] M.L. Schlegel, S. Necib, S. Daumas, C. Blanc, E. Foy, N. Trcera, A. Romaine, Microstructural
characterization of carbon steel corrosion in clay borehole water under anoxic and transient acidic
conditions., Corros. Sci. 109 (2016) 126–144. doi:10.1016/j.corsci.2016.03.022.
[46] M. Bethencourt, T. Fernandez-Montblanc, A. Izquierdo, M.M. Gonzalez-Duarte, C. Munoz-Mas,
Study of the influence of physical, chemical and biological conditions that influence the
deterioration and protection of Underwater Cultural Heritage., Sci. Total Environ. 613–614 (2018)
98–114. doi:10.1016/j.scitotenv.2017.09.007.