Embed Size (px)
Citation preview

i | P a g e
CHARACTERIZATION AND STUDY OF ADSORPTION OFMETHYLENE BLUE DYE USING ACTIVATED CARBON
A thesis submitted to the
National Institute of Technology, Rourkela
In partial fulfilment of the requirements of
Bachelor of Technology (Chemical Engineering)
By
Debi Prasad Samal
Roll No. 110CH0108
Under the guidance of
Dr. Susmita Mishra
Department of Chemical Engineering
National Institute of Te lRourkela-

iii | P a g e
National Institute of TechnologyRourkela
CERTIFICATE
This is to certify that the thesis entitled, CHARACTERIZATION & STUDY OF
ADSORPTION OF METHYLENE BLUE DYE USING ACTIVATED CARBON submitted by
Debi Prasad Samal, bearing Roll No.-110CH0108, in partial fulfilments for his requirements for
the award of Bachelor of Technology Degree in Chemical Engineering at National Institute of
Technology, Rourkela is prepared by him under my supervision and guidance.
DATE: Dr. Susmita Mishra
Department of Chemical Engineering
NIT, Rourkela

iv | P a g e
ACKNOWLEDGEMENT
I would like to express my deep sense of gratitude to one and all that helped me
and motivated me during the duration of my project. First of all, I would like to thank the
Department of Chemical Engineering, NIT Rourkela, for being an integral part of it for
the last four years.
Next, I would like to thank Dr. Susmita Mishra for guiding me through the course of
this work and providing me with the valuable inputs during each and every stage of the
project. She always helped me in all the technical and non-technical issues during the
production of this work. Her encouragement and efforts led this project to successful
completion in a timely fashion.
Next, I would like to thank Prof. R.K. Singh and Dr. H.M. Jena for their support
and coordination. I also feel deeply obliged to the entire support staff of the department
for their unconditional cooperation and support. I would also like to thanks Prof (Dr) S.
Paria for his allowance in to his Lab to conduct my experiment.
I am thankful to my friend Smrutirekha Das for her assistance, help and support in
my work. I also thank Adya Madam (PhD student) for her valuable inputs, tips & assisting
me in calculating the concentration of solution using spectrophotometer. Even I am
obliged to other Ph.D. sir & madam who helped me in lending their pH stripper & other
essential commodities for carrying out my experimental work. I am really appreciating Mr
Sushant Sethi for his valuable suggestion for thesis writing.
DEBI PRASAD SAMAL
110CH0108

v | P a g e
TABLE OFCONTENTS
Title Page No.
CertificateAcknowledgment iiList of Figures vList of Tables viNomenclature viiAbstract viii
1. INTRODUCTION 3
1.1 Objective 41.2 Scope 4
2. LITERATURE REVIEW 6
3. MATERIAL AND METHODS 12
3.1 Characterization of raw activated carbon 123.1.1 Proximate Analysis 123.1.2 Scanning Electron Microscope 133.1.3 Iodine No 153.1.4 pH 163.1.5 Methylene Blue Number 163.1.6 BET 163.2 Chemicals 183.3 Instrumentation 183.4 Experimental Work 213.4.1 Contact time study 213.4.2 Effect of pH on the solution 213.4.3 Effect of Adsorbent Dosage 223.4.4 Effect of Concentration of Blue Methylene 223.4.5 Adsorption Isotherm Studies 22
4.RESULTS AND DISCUSSION 24
4.1 Proximate Analysis 244.2 Bulk Density 24

vi | P a g e
4.3 BET Surface Area 244.4 SEM 244.5 pH 244.6 Iodine Number 244.7 Calibration Plot 254.8 Influence of Contact time on dye removal 254.9 Influence of pH on dye removal 284.10 Influence of initial adsorbent dosage on dye removal 294.11 Influence of initial dye concentration on dye removal 304.12 Adsorption Isotherms 334.12.1 Langmuir Isotherm Model 354.12.2 Freundlich Isotherm Model 39
5. CONCLUSION 436. REFERENCES 43

vii | P a g e
LIST OF FIGURES
Figure No Figure Title Page No
1 SEM Image of raw modifiedactivated carbon
14
2 BSM Image of raw modifiedactivated carbon
14
3 The hand shaker used for theexperiment
15
4 Glasswares used to handle thechemicals & carry out theexperiment
15
5. UV Spectrophotometer usedfor determining % adsorbance
20
6. pH meter used to determinethe solution pH
20
7 Calibration plot adsorbance in% (y) vs concentration in mg/l(x)
25
8 % removal of methylene blue(y) vs time in min (x)
26
9 % removal of methylene blue(y) vs pH (x)
28
10 plot of % removal ofmethylene blue vs dosage ofthe adsorbent
30
11 % removal of methylene bluevs different amount of bluemethylene in ppm
32
12 Ce/Qe in g/l (y) vs Ce in mg/l 34
13 Freundlich model 36

viii | P a g e
LIST OF TABLES
Table number Title of table Page number
Table 1 List of raw materials which have been used for theproduction of activated carbon
page 7
Table 2 Proximate analysis of the samples Page 24
Table 3 BET surface area data Page 24
Table 4 Calibration data Page 25
Table 5 Contact time study data for raw sample Page 26
Table 6 Effect of Ph & % removal of blue methylene Page 28
Table 7 Variation of % removal of methylene blue with dosage ofadsorbent
Page 29
Table 8 % removal of blue methylene for different concentrations ofblue methylene
Page 32
Table 9Tabulation for Langmuir Isotherm Page 34
Table 10Log Qe (y) vs log Ce (x) for freundlich isotherm Page 35
Table 11Comparison of different adsorbents for methylene blue dyeadsorptive capacity
Page 37

ix | P a g e
NOMENCLATURE
°C : Degree Celsius
BET : Brunnauer Emett Teller
nm : Nanometer
HCl : Hydrochloric acid
NaOH : Sodium hydroxide
UV : Ultra-violet
ASTM : American Society for Testing and Materials
M : Moisture content
A : Ash content
VM : Volatile matter content
qe : amount of substance adsorbed per unit mass of adsorbent
Co : initial concentration of methylene blue
Ce : equilibrium concentration at time

1 | P a g e
ABSTRACT
Characterization of activated carbon was studied extensively. Proximate
Analysis, SEM, BET, Porosity, pH, Iodine No, solubility were some of the
characterization techniques which was applied minutely on activated carbon prepared
from coconut shell in order to predict its Surface area, Porosity, Surface Topography,
pH etc. .
Activated Carbon are extensively used in the abatement of hazardous
contaminants, treatment of municipal & industrial waste water, as catalyst or catalyst
support in medicine, & the recovery of valuable metals because it is specially treated
to create a highly developed internal pore structure & thus this pore structure is
responsible for the superior performance of activated carbons.
My work focused on removal of methylene blue dye using commercial
activated carbon. Using activated carbon the removal of methylene blue dye was
studied by changing different parameters such as initial pH, initial adsorbent dosage,
initial dye concentration & contact time. Finally the experimental data were fitted into
both Langmuir & Freundlich isotherms.
Thus the given activated carbon prepared from coconut shell could be used
extensively in removal of methylene blue dye from waste water.
Key word: Surface Area, Isotherms, effluents, contact time, pore structure, catalyst.

2 | P a g e
CHAPTER 1
INTRODUCTION

3 | P a g e
1. INTRODUCTION
Presence of industrial dye in the effluent has released a voluminous amount of toxicity
to the water system that has affected the human beings as well as the flora and fauna.
Dyes are used extensively in various industries such as textiles, rubber, plastics, printing,
leather, cosmetics, etc., and also in production of coloured products. About 7 X 10⁵ dyes are
produced annually in the global market. It is estimated that about 2% of these dyes are
discharged into the water system with most of the sources generated from textile industries.
Dyes affect the penetration of sunlight into the water bodies and thus interfere with the growth
of bacteria and hinder photosynthesis in aquatic plant. It poses a serious threat to mankind and
water quality, thereby is a matter of vital concern. It causes acute and chronic effects on
exposure to human skins such as allergic, dermatitis, skin irritation, cancer, mutation etc.
Among the various treatment methods such as photo-catalytic degradation using UV TiO2,
sono-chemical degradation, Fenton biological treatment, biodegradation, integrated chemical –
biological process, electrochemical process, adsorption process, chemical coagulation
flocculation degradation process etc. have been explored to remediate these dyes in the waste
water. Among the various techniques available for its remediation adsorption technique has
been proved to be most effective. Adsorption is preferred over other processes due to possible
regeneration, sludge free operation and recovery of the sorbet.
Adsorption is an unit operation process which refers to attachment of molecules onto the
surface. It is based on the fact that some solids preferentially adsorb other solute from the
solution onto their surfaces. Dyes are particularly removed using various adsorbents. Many such
adsorbents such as orange peel, neem seed, oil cakes, date palm, olive shell, charcoal etc has
been explored for its removal. However activated carbon has shown significant removal
properties with respect to other adsorbents. It is a versatile adsorbent with high porosity and
surface area. Among the various types of dyes removed activated carbon has selectively used for
removal of methylene blue dye which has been extensively used in the textile industry.
Thus the basic objective of our study is to observe the characteristics properties of the
commercial activated carbon and find the influence of process parameters such as pH, adsorbent
dosage, contact time and adsorbate concentration on removal capacity of methylene blue.

4 | P a g e
1.1 OBJECTIVE
The purpose of this project work is:
To study the characteristics property of the activated carbon
To study the influence of various process parameter on the adsorption
phenomena and verify the reported data with different adsorption
isotherms.
1.2 SCOPE
Study the characteristic properties of activated carbon
pH
solubility
bulk density
methylene blue no
BET surface area
Iodine no
Study the effects of various experimental parameters on adsorption like
E f f e c t of contact time
E f f e c t of pH
E f f e c t of adsorbent dose
E f f e c t of initial concentration of methylene blue

5 | P a g e
CHAPTER 2
LITERATURE REVIEW
- 6 - | P a g e
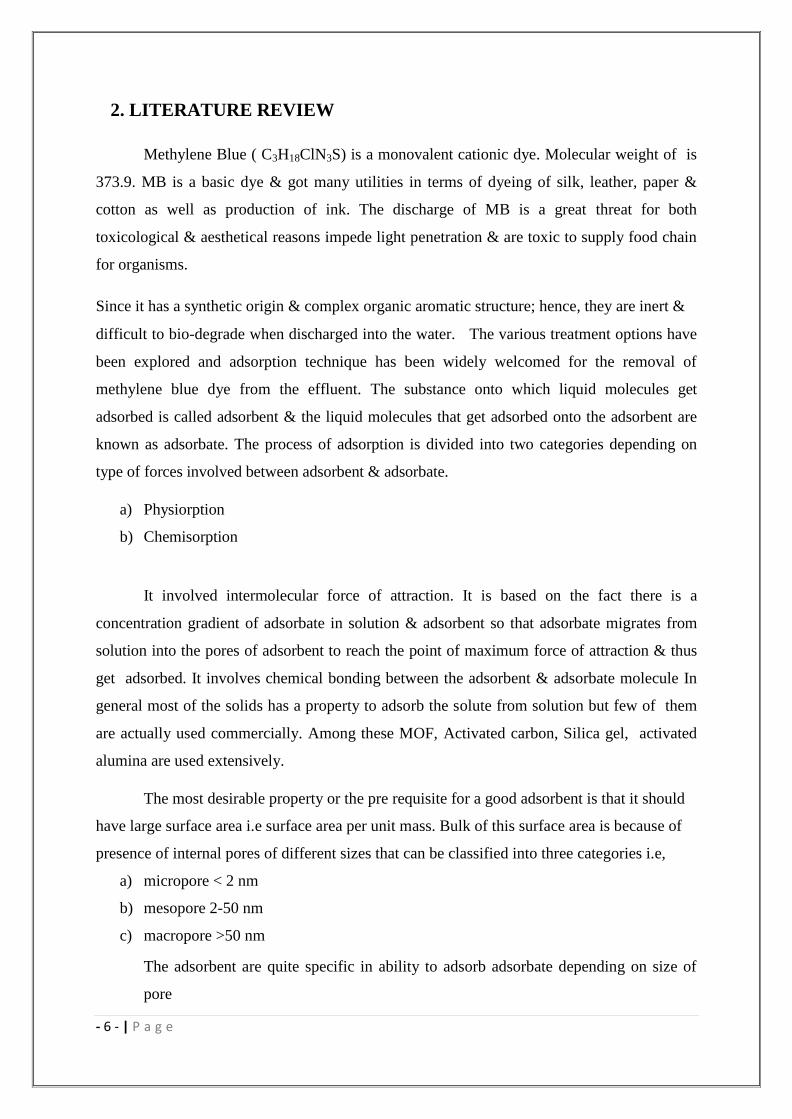
2. LITERATURE REVIEW
Methylene Blue ( C3H18ClN3S) is a monovalent cationic dye. Molecular weight of is
373.9. MB is a basic dye & got many utilities in terms of dyeing of silk, leather, paper &
cotton as well as production of ink. The discharge of MB is a great threat for both
toxicological & aesthetical reasons impede light penetration & are toxic to supply food chain
for organisms.
Since it has a synthetic origin & complex organic aromatic structure; hence, they are inert &
difficult to bio-degrade when discharged into the water. The various treatment options have
been explored and adsorption technique has been widely welcomed for the removal of
methylene blue dye from the effluent. The substance onto which liquid molecules get
adsorbed is called adsorbent & the liquid molecules that get adsorbed onto the adsorbent are
known as adsorbate. The process of adsorption is divided into two categories depending on
type of forces involved between adsorbent & adsorbate.
a) Physiorption
b) Chemisorption
It involved intermolecular force of attraction. It is based on the fact there is a
concentration gradient of adsorbate in solution & adsorbent so that adsorbate migrates from
solution into the pores of adsorbent to reach the point of maximum force of attraction & thus
get adsorbed. It involves chemical bonding between the adsorbent & adsorbate molecule In
general most of the solids has a property to adsorb the solute from solution but few of them
are actually used commercially. Among these MOF, Activated carbon, Silica gel, activated
alumina are used extensively.
The most desirable property or the pre requisite for a good adsorbent is that it should have large surface area i.e surface area per unit mass. Bulk of this surface area is because of presence of internal pores of different sizes that can be classified into three categories i.e,
a) micropore < 2 nm
b) mesopore 2-50 nm
c) macropore >50 nm The adsorbent are quite specific in ability to adsorb adsorbate depending on size of
pore

- 7 - | P a g e
& size of molecules being adsorbed.When an adsorbate comes in contact with adsorbent
adsorption takes place & after a long time it the adsorption process reaches to a equilibrium
state. The adsorption isotherm can have different shape which is based on adsorbent, adsorbate
& adsorbent-adsorbate interaction.
For the production of activated carbon, a wide variety of raw materials have been
used over the years. Extensive studies have been undertaken by various scholars and
researchers for the synthesis and characterization of adsorbents from different
agricultural based precursors.
The following table gives a brief review of the various raw materials that have so
far been used for the production of activated carbons.
Table 1: List of raw materials which have been used for the production of activated
carbon
Raw materials Authors
Walnut shells Aygün A. ,Yenisoy-Karakaş S. [9]
Coir pith Kavitha D. , Namasivayam C. [10]
Apricot stones Aygün A. , Yenisoy-Karakaş S. [9]
Almond shell Aygün A. ,Yenisoy-Karakaş S. [9]
Hazelnut shell Aygün A. ,Yenisoy-Karakaş S. [9]
Silk cotton hull Kadirvelu K., Kavipriya M. [11]
Maize cob Kadirvelu K., Kavipriya M. [11]
Coconut coir dust Macedo J. S., Júnior N. B., Almeida L. E. [12]
Peach stones Caturla F., Molina-Sabio M., Rodríguez-
Reinoso F. [13]
Sugarcane bagasse Girgis B.S., Khalil L.B., Tawfik T.A.M. [14]

- 8 - | P a g e
In 2005 B.H.Hameed, A.T.M.Din and A.L.Ahmad carried out adsorption of
methylene blue by bamboo-based activated carbon. Bamboo was used to make activated
carbon by physiochemical activation with potassium hydroxide and carbon dioxide.
Adsorptiobn models and kinetic studies were also conducted and it was found that pseudo-
second-order model best described the process [7].
In 2007, R.A.Shawabkeh and E.S.M. Abu-Nameh performed study of adsorption of
phenol and Methylene Blue by activated carbon from pecan shells. Activated carbon was
prepared from pecan shells by chemical activation with phosphoric acid. Then it was
treated with sodium dodecyl sulfate to prepare the surface for adsorption. The results
indicated good removal of phenol and Methylene Blue dye by pecan shells.[17]
The removal of methylene blue using treated and untreated activated carbon was
investigated by Yasin, Hussein and Ahmad{yaminuitm}. The effects of various
experimental parameters like contact time, pH of the solution and adsorbent dosage were
studied. It was found that the amount of methylene blue removal increased with the
increase in contact time, solution pH and amount of adsorbent used. The data obtained best
fitted the Langmuir isotherm plot. [18]
The adsorption of methylene blue onto dehydrated wheat bran (DWB) was
investigated by Ozer A and Dursun G., at temperatures (25-45 °C), initial methylene blue
(MB) concentrations (100-500 mg/L) and adsorbent dosage at the given contact time for the
removal of dye. The pseudo first order and pseudo second order kinetic model were applied
to the data and it was found that pseudo second order best described the data obtained.[19]
In another instance, jute fibre was used to prepare activated carbon using phosphoric
acid. It was found that at a fixed carbon concentration, the decrease in particle size
increased the dye uptake and decreased the equilibrium time. The per cent adsorption
decreased with increase in the initial methylene blue concentration, but the actual amount
of methylene blue adsorbed per unit mass of carbon increased with increase in
methylene blue concentration. The Langmuir equation gives an accurate description of
the experimental data.[6]
The adsorption of methylene blue (MB) from aqueous solution using a low-cost

- 9 - | P a g e
adsorbent, rejected tea (RT), was studied by batch adsorption technique. The adsorption
experiments were carried out under different conditions of initial concentration (50-500
mg/L), solution pH 3-12, RT dose (0.05-1g) and temperature (30-50 °C). The equilibrium
data were fitted to Langmuir and Freundlich isotherms and the equilibrium adsorption was
best described by the Langmuir isotherm model with maximum monolayer adsorption
capacities found to be 147, 154 and 156 mg/g at 30, 40 and 50 °C, respectively. . The
results suggested that RT has high potential to be used as effective adsorbent for MB
removal.[7]
Activated carbon prepared from non-wood forest product waste (rattan sawdust) has
been utilized as the adsorbent for the removal of methylene blue dye from an aqueous
solution. The rattan sawdust was collected from a local furniture factory.
Adsorptioisotherm
Adsorption is generally described through isotherms, that are amount of adsorbate on the
adsorbent as a function of pressure (for gases) or concentration (for liquids) at a constant
temperature.
Freundlich
isotherm:
It is an adsorption isotherm which relates concentration of solute on the surface of
the adsorbent to the concentration of the solute in the liquid with which it is in contact.
This model assumes that adsorption takes place on heterogeneous surface.
The linear form can be written
as:
log qe= log kf+(1/n)*log
Ce
Where, kf and n (dimensionless constants) are the Freundlich adsorption isotherm constants,
which indicate the capacity and intensity of the adsorption, respectively.
Langmuir
isotherm:

- 10 - | P a g e
It relates the adsorption of molecules on a solid surface to gas pressure or concentration of a
medium above the solid surface at a fixed temperature. It is based upon the fact
that adsorption process occurs in monolayers.
The linear form of Langmuir
expression:
1/qe=1/Qo+ 1/(bQoCe)
Where Ce is the equilibrium concentration of dye solution (mg/L), qe is the equilibrium
capacity of dye on the adsorbent (mg/g), qo is the monolayer adsorption capacity of the
adsorbent (mg /g), and b is the Langmuir adsorption constant (L/mg) and is related to the
free energy of adsorption.

11 | P a g e
CHAPTER 3
MATERIALS AND
METHODS

12 | P a g e
3. MATERIALS AND METHODS
3.1 Characterization of raw activated carbon
The following characteristic properties of activated carbon were studied
3.1.1 Proximate Analysis-
ASTM defines proximate analysis as the determination by prescribed methods
of moisture, volatile matter, ash & fixed carbon. The proximate analysis of the given
activated carbon sample will be followed by the procedure given below.
a) Moisture Content-
A small amount of the sample was put in a petri-dish or crucible, covered with a lid &
weighed using a weighing balance. The crucible was placed in the hot air oven at 105o
C with
its lid removed & dried for 1.30 hrs. The crucible was taken out, immediately covered with
the lid, cooled in a dessicator & weighed.
M=100(B-F)/(B-G)
Wt of empty petri-dish=42.185 gm=G
Wt of empty petri-dish + Activated carbon sample (before heating)=B=52.185 gm
Wt of empty petri-dish + moisture free sample (after heating)=F=51.263 gm
% of moisture content (M)=9.22
b) Ash content
The crucible was ignited in the muffle furnace at 750+ 25oC for 1.5 hours. The
crucible was placed in the dessicator, cooled to room temperature & weighed. A known
amount of the sample which was dried in the hot air oven at 150 oC for 3 hours was put in
the crucible & the crucible was placed back in the muffle furnace at 750+25 oC for 1.5
hours. The crucible was taken out of the furnace, placed in the dessicator, cooled to room
temperature & weighed.
A=100(F-G)/(B-G)
Wt of empty silica crucible=G=21.433 gm
Wt of empty crucible + activated carbon sample (before heating)=B=22.433 gm
Wt of empty crucible + ash (after heating)=F=21.448 gm

13 | P a g e
% of ash content=1.5
c) Volatile matter content
A known amount of sample was put in the crucible. The crucible was placed in a
muffle furnace at 920+10oC, covered with lid, & placed for exactly 7 minutes. The crucible
was taken out, allowed to cool & weighed.
VM=100(100(B-F)-M(B-G))/((B-G)(100-M)
Wt of empty crucible with lid=G=14.003 gm
Wt of empty crucible + lid + sample(before heating)=B=15.003 gm
Wt of empty crucible + lid + sample (after heating)=F=14.844 gm
M=Moisture content in %
% of volatile matter content=7.358
d) Fixed carbon
% of fixed carbon=100-(M+A+VM) = 81.922
3.1.2 SCANNING ELECTRON MISCROSCOPE
SEM is a type of microscope which uses a beam of highly energetic electrons to scan
a sample. & produce its image. It consists of a electron gun which acts as an source for
electrons. The electron beam is focussed by a pair of condenser lenses made of magnets
which are capable of bending the path of electrons. Sample to be analyses is placed in the
sample chamber. The electron beam strikes the sample gets decelerated & produces a
variety of diffracted backscattered electrons, protons, visible light & heat. The secondary
electrons are picked up by the electrons & produces images of the object’s surface on the
monitor. The entire operation takes place in the a vacuum chamber.
The activated carbon can be analysed in a SEM to visualize the porous
structure. The magnification is analysed & adjusted so as to get a clear picture.

14 | P a g e
Figure-1. a) SEM image of raw modified activated carbon at x 250 zoom
Figure-1 b) SEM image of raw modified activated carbon at x 500 zoom

15 | P a g e
Figure-1. a)BSM image of raw modified activated carbonat x 250 zoom
Figure-1. b)BSM image of raw modified activated carbon at x 500 zoom
3.1.3 IODINE NUMBER
Iodine number is the milligrams of iodine adsorbed by 1 gm of activated
carbon from a 0.1N iodine solution when the equilibrium iodine concentration is exactly
0.02N. Iodine number is a measure micro-pore content of the activated carbon. A higher
iodine number indicates higher micro- porosity of the sample.
ASTM D4607-94(2006) gives the standard procedure for the determination of
the iodine number of the activated carbon. 0.7-2 g of dried activated carbon was mixed with
10 ml of 5% by weight & swirled in a conical flask until the activated carbon was wetted.
The flask was boiled for 30 sec by placing it on a hot plate. The content of the flask was

16 | P a g e
cooled to room temperature & 100 ml of 0.1 N iodine solution was added on it. The flask
was shaken vigorously for 30 sec. The contents were filtered through a filter paper. Initial
20-30 ml of the filtrate was discarded & the remaining filter was collected in a clean beaker.
50 ml of this filtrate was titrated against 0.1 N sodium thio-sulphate solution until yellow
colour just disappeared. 1 ml of starch solution was added & titration was carried out till
blue colour was just disappeared.
The iodine no was found out to be 986 mg/g.
3.1.4 pH
pH was determined using the standard method ASTMD 3838-80, 1g activated
carbon sample was put in a conical flask & 100 ml of distilled solution was added into it.
The mixture was stirred for 1 hour, pH readings are taken out using pH meter.
pH was 10.9 which shows basic in nature.
3.1.5 METHYLENE BLUE NUMBER
Methylene blue number is defined as the milligrams of methylene blue dye
adsorbed by 1g of dried activated carbon. It is a measure of the mesopore content of the
activated carbon.
1200 mg/l methylene blue stock solution was prepared. The sample was diluted to
give solutions of 5 different concentrations. A standard calibration curve was prepared by
measuring the absorbance at 664 nm. A known concentration solution was prepared from the
stock solution and a known amount of activated carbon was put into it. The flask was placed
in a shaker at 25 0C for 24 hours at 115 rpm. The absorbance of the resulting solution was
measured at 664 nm and the concentration was calculated from the calibration plot.
3.1.6 BET SURFACE AREA
The BET surface area is one of the parameters that determine the absorption capacity of
the activated carbon. Higher surface area implies more availability of surface for adsorption
hence better adsorption capacity.

17 | P a g e
BET stands for Brunauer, Emmett and Teller-the men who proposed a theory to
measure the surface area of solid particles like porous powders. The basic principle involved
is the adsorption of gas molecules to the surface of the solid whose surface area is
required. From the area of each molecule, the whole area of the solid can be calculated.
BET theory is based on multilayer adsorption with the following assumptions
1. Gas molecules can be physically adsorbed on the solid surface and form infinite
layers.
2. There is no interaction between the layers
3. Langmuir theory is applied to each layer
The BET equation is given by:
1/v [(P0/P)-1] = (c-1) (P/P
0)/ (vmc) + 1/ (vmc)
P0= Saturation pressure of the adsorbate
P= Equilibrium pressure of the adsorbate
v= Volume of gas adsorbed
vm= Volume of gas adsorbed in the monolayer
c= BET constant given by exp (E1-EL)/RT
E1= Heat of adsorption for the first layer
EL= Heat of adsorption for higher layers
A plot of 1/v [(P0/P)-1] v/s (P/P
0) is obtained from the BET analysis. From the slope and
intercept of the line, vm and c are obtained. Surface area S of the solid sample is given by
S= (vmNs)/ (VX)
N= Avogadro’s number
s= adsorption cross-section of the gas being adsorbed
V= molar volume of the gas being adsorbed
X= mass of the adsorbent
A small amount of the sample was taken in the tube and the tube was placed in a dewar
containing liquid nitrogen. Initially the sample was degasified to remove the impurities and
gases. Then gaseous nitrogen was passed through the sample and based on adsorption of the
gas, the surface area of the sample was calculated.

18 | P a g e
3.2 CHEMICAL
Methylene blue dye, chemical formula, C16H18N3ClS and molecular weight of 319.5 was
used for the initial adsorption experiments. Other chemicals such as NaOh and HCl were
used for preparing solutions of varying pH. The adsorbent taken as activated carbon prepared
from coconut shell. The chemicals & adsorbent were provided by the department laboratory.
3.3 INSTRUMENTION
A hand shaker was used for all the adsorption experiments. A UV-ray spectrophotometer was
used to determine the absorbance. The pH meter was used to measure the pH of solution.
Glass wares & conical flask were used to handle the solutions. A meter balance was used to
weigh the samples. Pipette was taken taken in transferring the solution into the test tube to
record the adsorbance of solution.

19 | P a g e
Figure 3 The hand shaker used for the experiments.

20 | P a g e
Figure 4 glasswares used to handle the chemicals and carryout the experiment

21 | P a g e
Figure 5 the UV-spectrophotometer used for determining the % absorbance.
Figure 6 pH meter used to determine the solution pH

22 | P a g e
3.4 EXPERIMENTAL WORK
3.4.1 CONTACT TIME STUDY
A solution of methylene blue having concentration of 20 mg/l was prepared. 0.6 gm. of
activated carbon sample was taken in a 100 ml conical flask along 100 ml of the prepared
methylene blue solution. This was then kept in a shaker at a temperature of 35° C (room
temperature) and vibrating at 115 rpm.
So 5 samples of above said concentration was prepared in 100 ml taken in 5 different
conical fasks.
The contact time for 5 different conical flasks were taken as 20,30,40,50 & 60 min.
The % absorbance of UV at 664 nm was determined for the samples.
3.4.2 EFFECT OF pH OF THE SOLUTION
Methylene blue solution of concentration of 20 ppm but of pH varying as 1,4,6,8 and
10 were prepared. 0.6 gm of activated carbon was taken as adsorbent dose for the 100 ml
solutions prepared. Contact time taken as 50 min was taken in each of the 5 conical flask of
the above said concentration. The ph was maintained by adding required amount of 1 N
NaOH to maintain basic in nature & 1 N H2SO4 to maintain acidic in nature.
The % absorbance at 664 nm was found out using a UV-spectrophotometer,

23 | P a g e
3.4.3 EFFECT OF ADSORBENT DOSAGE
The various concentration of adsorbent was taken in a 100 ml conical flask. Methylene blue
concentration of 20 ppm was taken in that 100 ml conical flask The flask was put in a shaker
at 115 rpm and 35 °C. Various amounts of concentration of adsorbent was taken inside 5
different conical flasks of 0.2, 0.4, 0.6, 0.8 & 1 gm respectively.
Samples were kept in each conical flask for a period of 40 min. The % absorbance at
664 nm was found out using a UV-spectrophotometer.
3.4.4 EFFECT OF CONCENTRATION OF METHYLENE BLUE
100 ml of Methylene blue solution of concentrations 20 ppm, 40 ppm, 60 ppm, 80 ppm
& 100 ppm were taken in 5 different conical flasks, to which 0.6 gm of raw sample was added
and shaken in a shaker at 115 rpm and 35 °C. The experiment was repeated for 1 gm of
prepared sample.
Samples were collected at regular intervals for 50 minutes. The % absorbance at
670 nm was found out using a UV-spectrophotometer.
3.4.5 ADSORPTION ISOTHERM STUDIES
100 ml of methylene blue solution of concentrations 20 ppm, 40 ppm, 60 ppm, 80 ppm
and 100 pm were prepared. 0.6 gm of the prepared sample was taken in conical flasks
containing the solutions. The flasks were shaken at ph 5, 115 rpm and 35° C for 60 minutes.
At the end of 60 minutes, samples were collected from each flasks and % absorbance of UV
at 664nm was determined using a spectrophotometer.

23 | P a g e
CHAPTER 4
RESULTS AND
DISCUSSIONS

24 | P a g e
4. RESULTS AND DISCUSSIONS
4.1 PROXIMATE ANALYSIS
The proximate analysis of the samples yielded the following results
Table-2 proximate analysis of the samples.
Moisture (%)
9.22
Ash Content (%)
1.50
Volatile Matter Content (%)
7.358
Fixed Carbon
81.922
4.2 BULK DENSITY
The bulk density of the sample was found to be =0.4512 g/ml=451.2 kg/m
3.
4.3 BET SURFACE AREA
Table 3 BET surface area data
Surface Area of raw activated carbon
1000.12 m2/g
4.4 SEM
Already the images were illustrated in fig 1 (a) & (b) & fig 2 (a) & (b) above for both
SEM & BSM for different wavelengths.
4.5 pH
pH was obtained as 10.9 which shows basic in nature.
4.6 IODINE NUMBER
The iodine no was estimated as986 mg/g.

25 | P a g e
4.7 CALIBRATION PLOT
The calibration plot for methylene blue at 664 nm was obtained as follows
Table 4 calibration data
Concentration(x) in mg/l
Absorbance(y) in %
1
0.191
2
0.382
3
0.573
4
0.764
5
0.955
Figure 7 calibration plot Absorbance in % (y) vs concentration in mg/l (x)
From the graph the slope was found to be 0.191. Thus, equilibrium concentration at time ‘t’,
Ce= (absorbance)/(0.191)
4.8 Influence of contact time on dye removal
The dependence of adsorption on contact time was studied using fixed amount (0.6g) of
adsorbent (activated carbon) on 20 ppm methylene blue solution in a fixed volume (100 ml). It
0
0.2
0.4
0.6
0.8
1
1.2
0 1 2 3 4 5 6
lAd
sorb
ance
in %
Concentration in mg/l

26 | P a g e
was observed that adsorption increases with increase in contact time. Initially within first 10
min exponential increase in adsorption was reflected till maximum slope reached in next 10
min. There after a steady state equilibrium was obtained after a very long time.
Table 5-Contact time study data for raw sample
Time in (min)
% adsorption at 664 (nm)
% removal of blue methylene
20 0.78 79.580
30 0.65 82.984
40
0.35 90.838
50 0.191 95.00
60 0.134 96.492
70 0.132 96.54
80 0.131 96.56
0
20
40
60
80
100
120
0 20 40 60 80 100
% r
em
ova
l of
blu
e m
eth
yle
ne
Contact time in mine
study of removal of methylene blue using activated carbon

27 | P a g e
4.9 Influence of Initial pH on dye removal
The effect of variation of pH on adsorption rates were studied from the data and
the graph obtained between % removal of methylene blue(y) vs. pH(x).
Table 6 effect of pH and % removal of methylene blue
pH adsorbance %removal of methylene blue
1 0.31 91.88
4 0.021 99.45
6 0.024 99.37
8 0.38 95.05
10 0.6 94.29
The reason for choosing these pH values were that from the literature it was evident
that the adsorption of methylene blue was highest in the natural range. Lower % removal of
methylene blue at acidic pH was probably due to H+ ions competing with the cationic
charge of dye solution for adsorption on activation sites of activated carbon. Same can be
explained for basic medium. The optimum pH was found to be at 5.
Figure 9 % removal of methylene blue(y) vs pH (x)
90
92
94
96
98
100
102
0 2 4 6 8 10 12
% r
em
ova
l of
blu
e m
eth
yle
ne
pH
study of removal of methylene blue using activated carbon

28 | P a g e
4.10 Influence of initial adsorbent dosage on dye removal
The amount of adsorbent dosage was varied i n t h e g i v e n r a n g e 0.2 gm, 0.4 gm,
0.6 gm, 0 . 8 gm & 1 g m . It was observed from the graphs that increasing the dosage
increases the % removal of methylene blue. As there was no drastic increase in the
adsorption rate on increasing the dosage of adsorbent beyond 0.6 gm of activated carbon,
hence, from economic point of view, 0.6 gm was taken as optimum dosage for removal of
methylene blue.
It can be attributed to the increase in adsorbent sites for more adsorption of the dye at the fixed
20 ppm.
Table 7 variation of % removal of methylene blue with dosage of adsorbent
Dosage of the
sample, gm
adsorbance
% removal of
methylene blue
0.2
1.72
54.97
0.4
0.760
80.105
0.6
0.191
95
0.8
0.178
95.34
1.0
0.113
97.04

29 | P a g e
Figure 10 % removal of methylene blue vs. dosage of the adsorbent
4.11 Influence of initial dye concentration on dye removal
The adsorption of methylene blue onto the activated carbon was studied for different
concentrations 20ppm, 40ppm, 60ppm, 80ppm and 100 ppm of methylene blue solution. The
data obtained are provided in the table 8.The experiment was conducted at optimum condition
0.6 gm adsorbent dosage, 35 °C and 5 pH for contact time of 50 min. Maximum dye removal
occured for low initial concentration of methylene blue that showed gradual reduction when
initial concentration of Methylene blue was raised. It could be ascribed to fixed concentration

30 | P a g e
of adsorbent dosage. With increase in initial dye concentration the adsorption sites were fixed
and achieved saturation at low dye concentration. Hence with increase in dye concentration no
further adsorption could be achieved and resulted in reduced removal of dye with increase in
dye concentration.
Table 8. % removal of blue methylene for different concentrations of MB
Methylene Blue Concentration in (mg/l)
Stock solution Adsorbance ( before Shaking)
Stock solution Adsorbance ( after Shaking)
% removal of Blue Methylene
2
3.82
0.191
95
4
6.74
0.61
90.95
6
9.70
1.227
87.35
8
11.49
2.624
77.163
10
14.20
3.983
71.950

31 | P a g e
Figure 11 % removal of methylene blue vs different amount of blue methylene in ppm 4.12 ADSORPTION ISOTHERMS
Isotherms give an equilibrium relationship between the amounts of adsorbate adsorbed on the
adsorbent surface and its concentration in the solution at a constant temperature. Numerous
adsorption models are available in the literature to fit the experimental adsorption data. In this
study, the data were fitted using Langmuir and Freundlich models. Each of the these models
makes use of a parameter qe (i.e. adsorption capacity per unit mass of the adsorbent at
equilibrium) in mg/g
qe= (C0-Ce)V/X
C0=Initial concentration of solution (mg/l)
Ce=Equilibrium concentration of solution in (mg/l)
V=Volume of solution in l
X=Amount of adsorbent used in g
4.12.1 LANGMUIR ISOTHERM MODEL

32 | P a g e
Isotherms give an equilibrium relationship between the amounts of adsorbate adsorbed on the
adsorbent surface and its concentration in the solution at a constant temperature. Numerous
adsorption models are available in the literature to fit the experimental adsorption data. In this
study, the data were fitted using Langmuir and Freundlich adsorption models. Each of the two
models makes use of a parameter Qe (i.e. adsorption capacity per unit mass of the adsorbent at
equilibrium). Qe= (C0-Ce) V/X
C0=Initial concentration of solution
Ce=Equilibrium concentration of solution
V=Volume of solution
X=Amount of adsorbent used
The linear form of Langmuir expression:
Ce/qe = Ce/Qo + 1/(bQo)
Where Ce is the equilibrium concentration of dye solution (mg/L), qe is the equilibrium
capacity of dye on the adsorbent (mg/g), Qo is the monolayer adsorption capacity of the
adsorbent (mg /g), and b is the Langmuir adsorption constant (L/mg) and is related to the free
energy of adsorption.Langmuir model was fitted to the experimental data as shown in the
figure below.The activated carbon was taken as 0.6 gm for different concentration of
methylene blue. The solution inside the conical flask was maintained around pH 5 & it was
kept in shaker for 60 min.
Concentration in mg/l
absorbance
Before original absorbance
Co in mg/l
Ce in mg/l
Qe in mg/g
Ce/Qe
20
0.093
7.71
48.952
0.590
8.060
0.0732
40
0.315
7.89
50.095
2
8.919
0.224
60
0.48
8.19
52
3.048
9.159
0.;3328
80
0.673
10.1
64.127
4.273
9.976
0.4283

33 | P a g e
100
0.83
10.4
66.032
5.27
10.127
0.521
Table 9 tabulation for Langmuir isotherm
Fig-12 Ce/Qe in g/l (y) vs Ce in mg/l
Form the graph, the slope was found to be 0.7765 which gives us the value of 1/(bQo) .
The equation is y=0.0957*x +0.017
The y-axis intercept gives the 1/Qo= 0.0957
Thus Qo=10.45 mg and b=5.629 l/mg; R2=0.999
4.12.2 FREUNDLICH ISOTHERM MODEL
The Freundlich model is based on the assumption that metal ions are adsorbed on a
heterogeneous surface and is not restricted to formation of monomolecular layer.
The linear form can be written as:
ln qe = lnkf +(1/n)*lnCe
where, kf and n (dimensionless constants ) are the Freundlich adsorption isotherm constants,
which indicates the capacity and intensity of the adsorption, respectively.
0
0.1
0.2
0.3
0.4
0.5
0.6
0 1 2 3 4 5 6
Ce
/Qe
in g
/l
Ce in mg/l

34 | P a g e
The Freundlich model was fitted to the experimental data as shown below
Table 10 log Qe (y) vs log Ce (x) for freundlich isotherm
Log Qe
Log Ce
0.906
-0.229
0.950
0.301
0.962
0.484
0.999
0.631
1.005
0.722

35 | P a g e
Figure 13 Freundlich model
0.88
0.9
0.92
0.94
0.96
0.98
1
1.02
-0.4 -0.2 0 0.2 0.4 0.6 0.8
log
Qe
in g
/l
log Ce in mg/l

36 | P a g e
From the graph the value of n was found to be 9.615 and kf was found to be 8.511
The equation is
y= 0.104*x +0.93 and R2=0.948
Since the R2
are fairly close to 1, thus both the models describe the system well but Langmuir
isotherm model was preferred.
Table 11 Comparision of different adsorbents for methylene blue dye adsorption
capacity
Raw materials Co,initial
concentration, mg/l
qe, mg/g References
Our study( coconut shell activated carbon)
100 10.127 -
Walnut shells 100 3.53 Aygün A. ,Yenisoy-
Karakaş S. [9]
Coir pith 100 5.8 Kavitha D. ,
Namasivayam C. [10]
Apricot stones 100 4.1 Aygün A. , Yenisoy-
Karakaş S. [9]
Almond shell 100 1.3 Aygün A. ,Yenisoy-
Karakaş S. [9]
Hazelnut shell 100 8.82 Aygün A. ,Yenisoy-
Karakaş S. [9]
Silk cotton hull 100 2.40 Kadirvelu K.,
Kavipriya M. [11]
Maize cob 100 5.00 Kadirvelu K.,
Kavipriya M. [11]
Coconut coir dust 100 15.25 Macedo J. S., Júnior
N. B., Almeida L. E.
[12]
Banana pith 100 4.67 Kadirvelu K.,
Kavipriya M. [11]

39 | P a g e
CHAPTER 5
CONCLUSIONS

40 | P a g e
5. CONCLUSION
Here we conducted many characterization techniques like Proximate Analysis, Scanning Electron Microscope (SEM), pH, Porosity, BET surface area, Iodine Number & Methylene Blue
Through pH we were able to predict that the given sample of activated carbon is of basic in nature.
Through SEM we could predict the composition of the given activated carbon.
It is almost made up of pure carbon (99%). Platinum is added as a coating material for SEM
analysis.
From the contact time studies, it was seen that % removal of blue methylene for 1st 10
min increases but for next 10 minutes, the slope gets further increase & thereafter slope gets
decrease for next 10 min & finally attains a steady value after a very long time This trend can be
attributed .to the fact that as the contact time increases more is the adsorbate-adsorbent
interaction & thus leads to more adsorption & hence % removal of MB also gets raised with
respect to increase in contact time.
For pH, % removal of methylene blue remains lowest in both acidic & basic medium & it occurs maximum in neutral medium. This can be accounted because in acidic medium due to high H
+ concentration, there is a repulsion of H
+ ion with cationic charge of dye for which the
adsorption can’t takes place suitably as in comparison to neutral medium. For adsorbent dosage, it was seen that % removal of methylene blue increases with increase in adsorbent dosage. This trend can be attributed because of more dosage, the surface area exposed to dye solutions gets more so that more dye can be adsorbed into the pores of the adsorbent hence more is the % removal of MB. For methylene blue dosage, the % removal of MB start decreasing with respect to increase in concentration of MB. This happens due to fixed amount of adsorbent in increasing
Methylene blue concentration.
For adsorption isotherm we plotted both for Langmuir & Freundlich models & it was observed that regression coefficient came close to 1. So both the models can be fitted for the data that was obtained during experiment. However Langmuir Isotherm is more accurate

41 | P a g e
because regression coefficient was R2=0.99 as comparison to R
2=0.948 for Freundlich Isotherm.
Studying through different graphs of pH, contact time, adsorbent concentration &
Methylene Blue concentration we got optimum values for each case as
pH= 5; Contact time= 5 0 min; Adsorbent dosage= 0.6 gm; Methylene blue concentration= 20
mg/l
Hence after carrying out rigorous experiments we finally came to conclusion that activated carbon prepared from coconut shell can be effectively used for the removal of methylene blue effectively conducted at the optimum process condition.
42 | P a g e
CHAPTER 6
REFERENCES

43 | P a g e
REFERENCES
1. Dash Bibek. Competitive Adsorption of dyes (congo red, methylene blue, malachite
green) on Activated Carbon, B.tech thesis. ethesis.nitrkl.ac.in 2010.
2. Dalia Khalid,et.al, Batch adsorption of basic dye using acid treated kenaf fibre char:
Equilibrium, kinetic and thermodynamic studies,2011.
3. FaradillaBintiLokman. Dye removal from simulated wastewater by using empty fruit
bunch as an adsorbent agent, 2006.
4. Ioannidis et.al, “Agricultural residues as precursors for activated carbon production—
A review “, Renewable and Sustainable Energy Reviews 11 (2007) 1966–2005.
5. Adinata et.al, “Preparation and characterization of activated carbon from palm shell
by chemical activation with K2CO3”, Bioresource Technology, 98, (2007), pp. 145–
149.
6. Senthilkumaar et.al, “Adsorption of methylene blue onto jute fiber carbon: kinetics
and equilibrium studies.”, Journal of Colloid and Interface Science (2005) Volume:
284, Issue: 1, Pages: 78-82
7. Hameedet.al, “Adsorption of basic dye (methylene blue) onto activated carbon
prepared from rattan sawdust” , Dyes and Pigments (2007) Volume: 75, Issue: 1,
Pages: 143-149
8. Hameedet.al, “Adsorption of methylene blue onto bamboo-based activated carbon:
Kinetics and equilibrium studies”, Journal of Hazardous Materials (2007), Volume:
141, Issue: 3, Publisher: Elsevier Science BV, Pages: 819-825
9. A. Aygün, et.al, “Production of granular activated carbon from fruit stones and
nutshellsand evaluation of their physical, chemical and adsorptionproperties,”
Microporous and Mesoporous Materials, vol. 66, no.2-3, pp. 189–195, 2003.
10. D. Kavitha and C. Namasivayam, “Experimental and kineticstudies on methylene
blue adsorption by coir pith carbon,” Bioresource Technology, vol. 98, no. 1, pp. 14–
21, 2007.
11. K. Kadirvelu, et.al, “Utilization of various agricultural wastes for activated carbon
preparation and application for the removal of dyes and metal ions from aqueous
solutions,” Bioresource Technology, vol. 87, no. 1, pp. 129–132, 2003.
12. J. S. Macedo, N. B. Júnior, L. E. Almeida et al., “Kinetic and calorimetric study of the

44 | P a g e
adsorption of dyes on mesoporous activated carbon prepared from coconut coir dust,”
Journal of Colloid and Interface Science, vol. 298, no. 2, pp. 515–522, 2006.

45 | P a g e
13. Caturla F., et.al. Preparation of activated carbon by chemical activation with ZnCl2,
Carbon, 29 (1991): pp. 999-1007.
14. Girgis B.S., et.al. Activated carbon from sugar cane bagasse by carbonization in the
presence of inorganic acids, Journal of Chemical Technology and Biotechnology, 61
(1994): pp. 87-92.
15. Hu Z., Vansant E.F. Synthesis and characterization of a controlled-micropore-size
carbonaceous adsorbent produced from walnut shell, Microporous Materials, 3
(1995): pp. 603-612.
16. Avomj. et.al. Adsorption f methylene blue from an aqueous solution on to activated
carbon from palm-tree cobs.Carbon Volume 35, Issue 3, 1997, Pages 365–369
17. Shawabkeh R. A., et.al. Adsorption of phenol and methylene blue by activated carbon
from pecan shells,2007.
18. Yasin Y. et.al. adsorption of methylene blue onto treated activated carbon.The
Malaysian Journal of Analytical Sciences, Vol 11, No 11 (2007): page 400 – 406
19. Ozer A. et.al, Removal of methylene blue from aqueous solution by dehydrated wheat
bran carbon. J Hazard Mater. 2007 Jul 19;146(1-2):262-9
20. Langmuir, I. The constitution and fundamental properties of solids and liquids. parti.
solids.Journal of the American Chemical Society, 1916, 38 (11): 2221–2295.
21. Parashar C. .Removal of Malachite Green dye by adsorption using char. B.tech thesis
ethesis.nitrkl.ac.in, 2012.
22. Pati S. R..Synthesis and characterisation of activated carbon andits study on Cr (VI)
removal from water. B.tech thesis ethesis.nitrkl.ac.in, 2012.
23. Brunauer S., Emmett P. H., Teller E. Adsorption of Gases in Multimolecular Layers,
Journal of American Chemical Society, 60(1938): pp. 309–319
24. Freundlich H.Z. Over The Adsorption in Solution, Journal of Physical Chemistry,
57(1906): pp. 385-470.
25. Amankwah.K.A.G,Schwarz.J.K., “A modified approach for estimating pseudo-
vapor pressure in the application of the Dubinin-Astakhov equation” Carbon .,33
(1995) :pp
26. . Chakraborty.A, Saha.B.B, Ng.K.C, Koyama.S, Srinivasan .K “Theoretical Insight of
Physical Adsorption for a Single Component Adsorbent +Adsorbate System: I.
Thermodynamic Property Surfaces” Langmuir., 25 (2009) :pp.2204-2211.

46 | P a g e
27. D.D. Do, Nicholson. D, Do. H.D “On the Henry constant and isosteric heat at
zero loading in gas phase adsorption” Journal of Colloid and Interface Science.,324
(2008):pp 15-24.
28. Huang.C.C, Chen.H.M, Chen.C.H “Hydrogen adsorption on modified
activated carbon” International Journal of Hydrogen Energy.,35(2010): pp
2770-2780
29. Keller .J.U ,Staudt.R,Siegen.U ., “Gas adsorption equilibria experimental
method and adsorptive isotherms”. Germany, Springer, 2005
30. . Ming .H.J., “Adsorption evaporative emission control system for
vehicles”. National university of Singapore, PH.D Thesis, 2009
31. Yang, R.T.,Gas separation by adsorption. Boston, Butterworth Publishers, 1987
32. Saha.B.B, Habib.K , Ibrahim.I, Sharkawy.El, Koyama.S “Adsorption
characteristics and heat of adsorption measurements of R-134a on activated carbon”
International journal of refrigeration .,32 (2009) :pp1563-1569.