Embed Size (px)
Citation preview

31-Oct-07
Characterization and Remediation of Diesel in a Fractured Rock Aquifer with a Nutrient-Flushing SystemPresentation by David Thomson and Stefan Humphries

Authors and Collaborators
Presenting Authors– Stefan Humphries and David Thomson
WorleyParsons Komex– M. Brown, J. Armstrong, B. Reiter
University of Calgary– K. McLeish [Ph.D.]– Dr. J. Foght
Environment Canada– P. Bacchus
Outline
SITE BACKGROUND and CONCEPTUAL MODEL
PHYSICAL HYDROGEOLOGY
GEOCHEMICAL AND MICROBIOLOGICAL EVIDENCE OF NATURAL ATTENUATION
NUTRIENT-AMENDED REMEDIATION SYSTEM

Site History
1982 – diesel invert mud used to drill gas well; well kicked mud across lease and adjacent land1996 - diesel impact to groundwater, drilling sump excavated1996-2007 – extensive site characterization, remedial pilot tests

Contaminant characterization
Contaminant characterization
– Residual hydrocarbons from the former drill sump
– Free product and dissolved-phase impacts
– Typically TEH C11 to C27
– PHC F2 (C>10 to C16)
– Negligible salts or metals signature

Site Hydrogeology
Surficial geology: – Thin sand/gravel outwash or till unit (0-3 m)
Bedrock: – Cretaceous fractured sandstone
Upper Groundwater Bearing Zone (UGBZ) – 30 mbgs, within fractured sandstone unit
Complex Groundwater flow – Gradient to NE, fracture control mainly to SE
Dissolved-phase plume stable [approx. 300 m long]Strong indication of ongoing Natural Attenuation

Conceptual Hydrogeology
DUA

Importance and Relevance
Domestic Use Aquifer (DUA) impacted
Multiple landowners with wells
Difficult hydrogeological conditions

Characterization Techniques
Monitoring of 60+ piezometers– Annual groundwater monitoring for routine and MNA parameters– Dissolved gas sampling– Passive Skimmers for product
Characterization– Pilot-scale grid of 12 open boreholes– Aquifer pumping test– Straddle packer tests– Bromide tracer– 4 angled coreholes– Pilot testing – Geophysics– Core fracture mapping

Site Plan

NAPL versus Dissolved-Phase
Lease
Product Plume
Dissolved Plume
Former Sump

Fracture Control –Transport Mainly to Southeast

Background
Fracture-controlled system with offset plume axes
Dissolved-phase and product-phase plumes are spatially and temporally stable
Strong evidence of natural attenuation– Geochemical indicators– Stable plume

Outline
SITE BACKGROUND and CONCEPTUAL MODEL
PHYSICAL HYDROGEOLOGY
GEOCHEMICAL AND MICROBIOLOGICAL EVIDENCE OF NATURAL ATTENUATION
NUTRIENT-AMENDED REMEDIATION SYSTEM

Characterization for Remediation
Pilot-scale grid of 12 open boreholes to investigate complex flow system
Detailed physical characterization via:– Aquifer pumping test– Bromide tracer– Straddle packer tests– Core fracture mapping

Pilot-scale Test Area
– 12 closely spaced boreholes [4 cored]– Oriented along major fracture azimuth
Injection well
Orientation of major fracture azimuth ~130º
Direction of plume transport ~115º

Bedrock Coring – Fracture and Oxidation Halo

Optical Televiewer Images

Fracture characterization
High-angle jointing [>60 degrees]– Orientation approximately 130 degrees
Sub-horizontal bedding planes [<30 degrees]
Matrix Permeability– Permeability, porosity, grain density, pore throat radius– No differences between grey and brown sandstone
Permeability is orders of magnitude less than bulk rock
Pumping Test
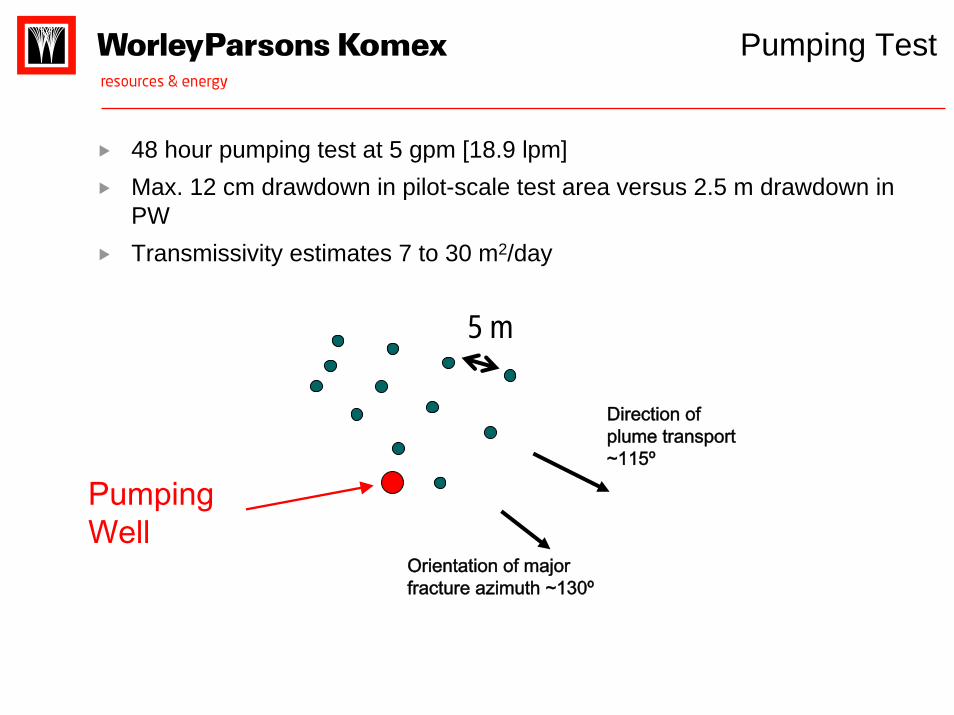
48 hour pumping test at 5 gpm [18.9 lpm]Max. 12 cm drawdown in pilot-scale test area versus 2.5 m drawdown in PWTransmissivity estimates 7 to 30 m2/day
Pumping Well
Orientation of major fracture azimuth ~130º
Direction of plume transport ~115º
5 m

Bromide Tracer Test
Experimental setup
– Injection solution of 900L of formation water containing 325 mg/L bromide
– Tracer injection at 1 gpm
– Injection lasted approx. 90 minutes

Bromide Tracer Test
Define solute transport & fracture interconnection
0
50
100
150
200
0.0 1.0 2.0 3.0 4.0 5.0 6.0 7.0
Time (hours)
Con
cent
ratio
n of
Br- (m
g/L)
Initial Br - concentration = 325 mg/L
10 m5 m
20 m
15 m
Results: 2004 Tracer Test
Fastest bromide travel time approx 5 hours [for one 10m and one 20m borehole]
Apparent tracer velocity 50 m/day
Good results – let’s add nutrient next year
2005 tracer/nutrient injection
Result: We couldn’t find the tracer
Why?– Excess precipitation in 2005 led to several metres increase in
groundwater elevation– Likely that new flowpaths were accessed with higher water table– Variable hydraulic conductivity with depth
Conduct packer tests to determine variability in hydraulic conductivity with depth

Straddle Packer Tests
Experimental setup– One 1.5m screen with two ~1m
packers– Pressure transducers inside
screen and above/below packers
– Constant-head and falling-head tests on 6 open boreholes
SCREEN
TRANSDUCER
LOWER PACKER
UPPER PACKER [not shown]

Straddle Packer Tests

Straddle Packer Results

Straddle Packer Results
More than 4 orders of magnitude change in hydraulic conductivity over small vertical intervals
Upper portion of saturated interval generally more conductive
No definitive correlation with fracture mapping results

OUTLINE
SITE BACKGROUND and CONCEPTUAL MODEL
PHYSICAL HYDROGEOLOGY
GEOCHEMICAL AND MICROBIOLOGICAL EVIDENCE OF NATURAL ATTENUATION
NUTRIENT-AMENDED REMEDIATION SYSTEM

Natural Attenuation Indicators
Aerobic Biodegradation: Oxygen = electron acceptorAnaerobic Biodegradation: Absence of oxygen– Redox Sequence: NO3
-→Mn4+→Fe3+ → SO42-→ CO2
Mitsch and Gosselink (2000)
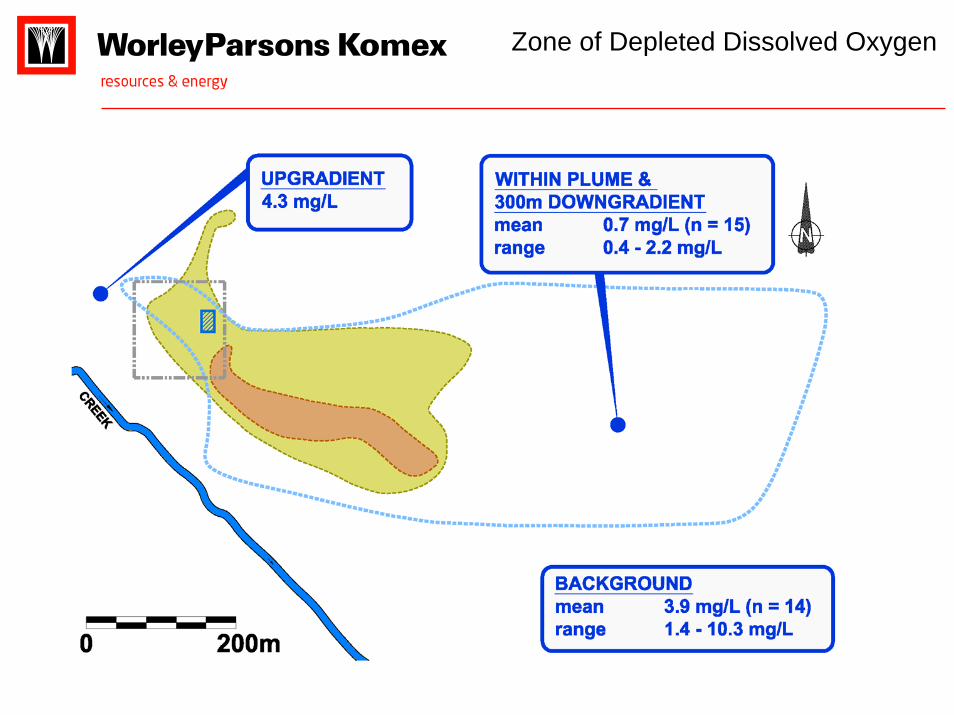
Zone of Depleted Dissolved Oxygen

Zone of Enriched Manganese
Within Plume
Mn2+ 0.05 to 3.24 mg/L
Background:
Mn2+ < 0.05 mg/L
Upgradient:
Mn2+ < 0.05 mg/L

Monitoring Results: Bacterial Populations
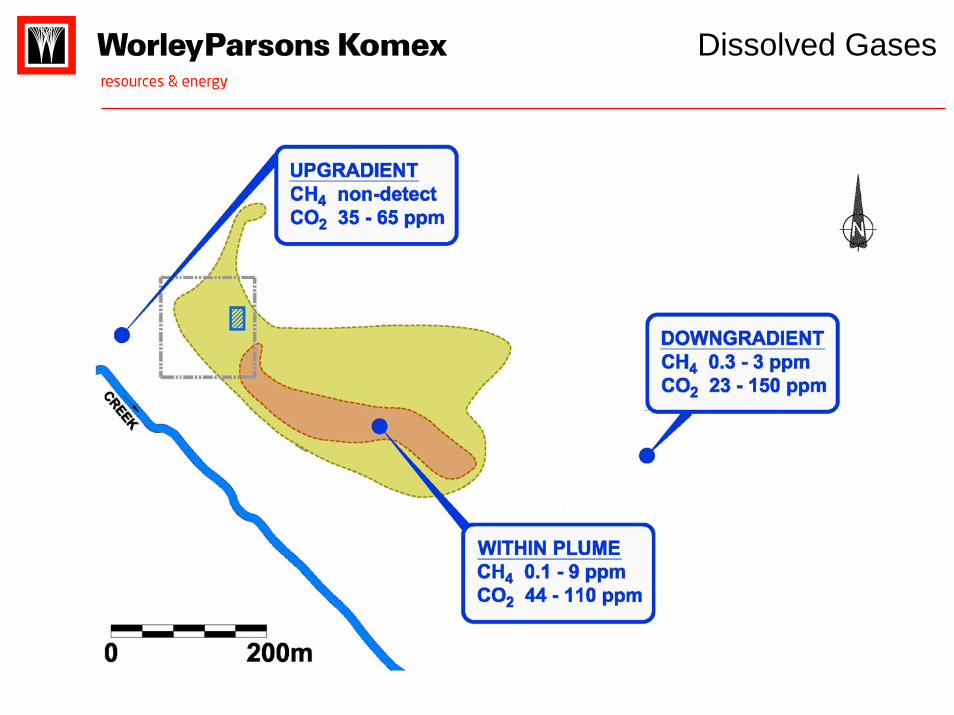
Dissolved Gases

Lines of Evidence (EPA): Natural Attenuation
Historical Geochemical Database Showing Plume Stabilization
Contaminant and Geochemical Analytical Data Showing Biodegradation
– High to very high levels of Fe, Mn, and low levels of NO3 within the plume
Microbiological Laboratory Data– High counts of Fe- and SO4-reducing bacteria within the plume and at
the periphery– ↑ microbiological activity within plume
OUTLINE
SITE BACKGROUND and CONCEPTUAL MODEL
PHYSICAL HYDROGEOLOGY
GEOCHEMICAL AND MICROBIOLOGICAL EVIDENCE OF NATURAL ATTENUATION
NUTRIENT-AMENDED REMEDIATION SYSTEM

Remediation limitations
Traditional hydrocarbon recovery methods limited by:
– Depth of impacts
– Complex fractured media
– Discontinuous distribution of hydrocarbons
– Low volatility of contaminant

Enhanced Biodegradation
Natural biodegradation confirmed in field
Laboratory bench-scale biodegradation experiments– Nutrient amendment experiments at University of Alberta – Cross, Biggar et al. (J. Env. Eng. manuscript)

Lab Scale Microcosms
Anaerobic TEH (C11 to C27) Degradation
Microcosm Temperature (deg C)
Estimated Half-Life (yrs)
No amendment 10 3.8
Sulphate amended 10 3.2
Nitrate amended 10 1.9
Nutrient mix amended 10 1.2

Nutrient Amendment Proposal
Parameter Target (mg/L)
Drinking Water Guideline (mg/L)
Nitrate (NO3 as N) 8 10
Potassium (K) 30 - -
Sulphate (SO4) 200 500
Phosphate (PO4 as P) 3 - -
Ammonium (NH4) 10 - -
Chloride (Cl) 20 250

Nutrient Flush –Planning Steps
Permission from AENV– Several conditions related to input values to DUA – Hydraulic controls to ensure no uncontrolled migration (i.e., forced gradient
best)
Tracer & pilot testing– Confirm flowpaths & velocity by conservative tracer– Ensure quality control of nutrient solution
(i.e., impurities in commercial fertilizers)

Site Plan

Infiltration Gallery

Infiltration
DUA

Site Plan

Site Plan

Well Pairs

Process Design

Collection Network

Pictures from the field

Remediation Summary
Nutrient Amendment works at the lab scale
Modelled estimate 13 wells & 2 infiltration galleries– Outer Perimeter Wells and 2nd infiltration gallery for hydraulic control of
plume– Inner Well Pairs attempt to limit smearing of free phase plume
GW Treatment train– Remove HC & amend with NO3, SO4, micronutrients, dissolved oxygen
Forced gradient nutrient circulation for in-situ treatment of dissolved phase HC
– Concentration gradient will assist with matrix diffusion
Free product skimming near pumped wells

Fractured rock sites require extensive characterization (standard & unconventional)
Detailed hydrogeological model is key
Difficult conditions (non-volatile hydrocarbons, fractures, domestic use aquifer) require innovation
Nutrient amendments a promising alternative for in-situ treatment
Full scale system is currently being constructed
Conclusions

QUESTIONS?

Dissolved Gases