Embed Size (px)
Citation preview

Santanu PaulDepartment of Mechanical Engineering,
Indian Institute of Technology Bombay,
Mumbai, Maharashtra-400076, India
e-mail: [email protected]
Ishank GuptaDepartment of Mechanical Engineering,
Indian Institute of Technology Bombay,
Mumbai, Maharashtra-400076, India
e-mail: [email protected]
Ramesh K. Singh1
Department of Mechanical Engineering,
Indian Institute of Technology Bombay,
Mumbai, Maharashtra-400076, India
e-mail: [email protected]
Characterization and Modelingof Microscale Preplaced PowderCladding Via Fiber LaserLaser cladding (LC) is a material deposition technique, in which a laser beam is used todeposit one or several layers of a certain clad material onto a substrate to improve itswear or corrosion resistance. It can also be used for structural repair. Consequently, it isof interest to characterize the residual stresses and the microstructure along with theclad geometry as a function of process parameters. A 100 W fiber laser and focusingoptics capable of producing very small spot sizes (�10 lm) have been integrated with amicromachining center. This paper focuses on providing a comprehensive metallurgicaland mechanical characterization of microscale LC of preplaced powdered mixture ofcobalt and titanium on IS 2062 (ASTM A36) substrate. Parametric studies were con-ducted by varying the scanning velocity, laser power, and spot size to produce clad layerswell bonded to the substrate. The results show that the width and height of the claddingincreases up to 28% and 36%, respectively, due to the variation in the laser parameters.An increase of up to 85% in the microhardness is observed in the cladded layer with pres-ence of Ti–Co intermetallic compounds at the interface, highlighting the application ofthe process in improving subsurface properties of existing components. The residualstresses obtained in the cladded layer are compressive in nature, indicating the potentialapplication of this technique for repair of structures. In addition, a finite element modelhas been developed for predicting the clad geometry using a moving Gaussian heatsource. Molten region is determined from the thermal model and Tanner’s law has beenused to account for spreading of the molten layer to accurately predict the clad geometry.The model predicts clad geometry with reasonable prediction errors less than 10% formost cases with stronger dependence on scan velocities in comparison to laser power.[DOI: 10.1115/1.4029922]
Keywords: laser cladding, preplaced powder, fiber laser, residual stress, finite elementmodel
1 Introduction
LC is a deposition technique in which a sound interfacial bondis formed without significant dilution of one material into theother. LC has received considerable attention, e.g., in the field ofadditive manufacturing, due to its ability to quickly produce near-net shape parts of complex geometries and flexible compositions.The aim of LC is to obtain a substrate/coating system showing animprovement in surface properties, usually chemical (e.g., corro-sion or high temperature oxidation resistance) and/or mechanical(e.g., wear resistance). Because of the high cooling rates associ-ated with laser processing, as well as the flexibility in defining themelt composition, LC is a procedure that has been used in bothexperimental and theoretical researches in the field of solidifica-tion [1,2]. Experimental investigation to identify the parametersaffecting clad dimensions, dilution, and deposition efficiency hasbeen reported in literature [3–5]. However, the current studieslack significant mathematical or statistical correlations and algo-rithms to detect process anomalies via the monitored process vari-ables [6], for large complex geometries [7]. Moreover, few studieshave been reported on the effect of process parameters on theresidual stresses [8,9]. During LC, a strong interfacial bond isformed between materials of different thermophysical propertiesand different temperature gradients. The effect of difference incoefficients of thermal expansion on residual stresses and
distortion of the final components has been reported in literature[7,10–12]. The appearance of predominantly compressive residualstresses in the components subjected to LC operation have alsohighlighted the potential application of the process for repair/restoration of high cost components [12].
Laser surface cladding being a temperature driven melting andsolidification process, a detailed understanding of the temperatureprofiles in LC is imperative. Some of the earlier models consid-ered only one-dimensional heat transfer in the LC process [3,4].Later studies have used a 2D finite element model for the calcula-tion of the quasi-steady state temperature field [13,14]. However,little work has been carried out with 3D models. Some studieshave used an iterative procedure for obtaining process parameters,such as scanning speed and powder feed rate as a function of laserpower, beam radius, powder jet geometry, and clad height[15,16]. Moreover, lumped-parameter model of the melt pool tocapture height dependent effects on the melt-pool dimensions andtemperature for laser metal deposition have been reported [17].Also, the models have mainly considered a uniform heat distribu-tion and very little work has been reported for models using Gaus-sian heat distribution. As described above, recent theoreticalstudies of LC process are focused on the understanding of thetemperature and/or stress fields generated during the claddingoperation and evolution of clad geometry due to spreading has notbeen accounted for in the studies.
Note that fiber laser has very good beam quality (M2< 1.1),which could be focused to very small spot sizes (�10 lm).However, comprehensive metallurgical and mechanical character-ization of the fiber LC process at the microscale, includinghardness, residual stresses, and crystallographic, elemental and
1Corresponding author.Contributed by the Manufacturing Engineering Division of ASME for publication
in the JOURNAL OF MANUFACTURING SCIENCE AND ENGINEERING. Manuscript receivedAugust 25, 2014; final manuscript received January 25, 2015; published onlineMarch 12, 2015. Assoc. Editor: Hongqiang Chen.
Journal of Manufacturing Science and Engineering JUNE 2015, Vol. 137 / 031019-1Copyright VC 2015 by ASME
Downloaded From: http://manufacturingscience.asmedigitalcollection.asme.org/ on 04/05/2015 Terms of Use: http://asme.org/terms
microstructural analyses, has not been conducted. In addition,very few studies report experimental work with process modeling;this work attempts to provide insight to the process via physicsbased models. This paper presents detailed experimental analysisof laser beam parameters in microscale cladding on the elementalcomposition, crystallography, clad geometry, substrate hardness,and residual stresses. Preplaced LC is utilized to produce a cobaltrich Co–Ti alloy coating on a mild steel substrate. Intermetalliccompounds of Co–Ti system are of interest for their excellent me-chanical strength, high hardness at elevated temperatures, highmelting point, good oxidization and corrosion resistance, andgood phase stability. This technique could potentially be used forrepairing and creating hardened textures. A 3D heat transfermodel is developed for the analysis of temperature field duringlaser material deposition process using the commercial finite ele-ment software ABAQUS
VR
. The molten geometry prediction from thethermal model does not account for the spreading prior to solidifi-cation. Consequently, Tanner’s law has been used to capture thespreading of the molten material to predict the clad geometry.This model can also be used to predict the necessary experimentalparameters needed to obtain a particular clad geometry.
2 Experimental Work
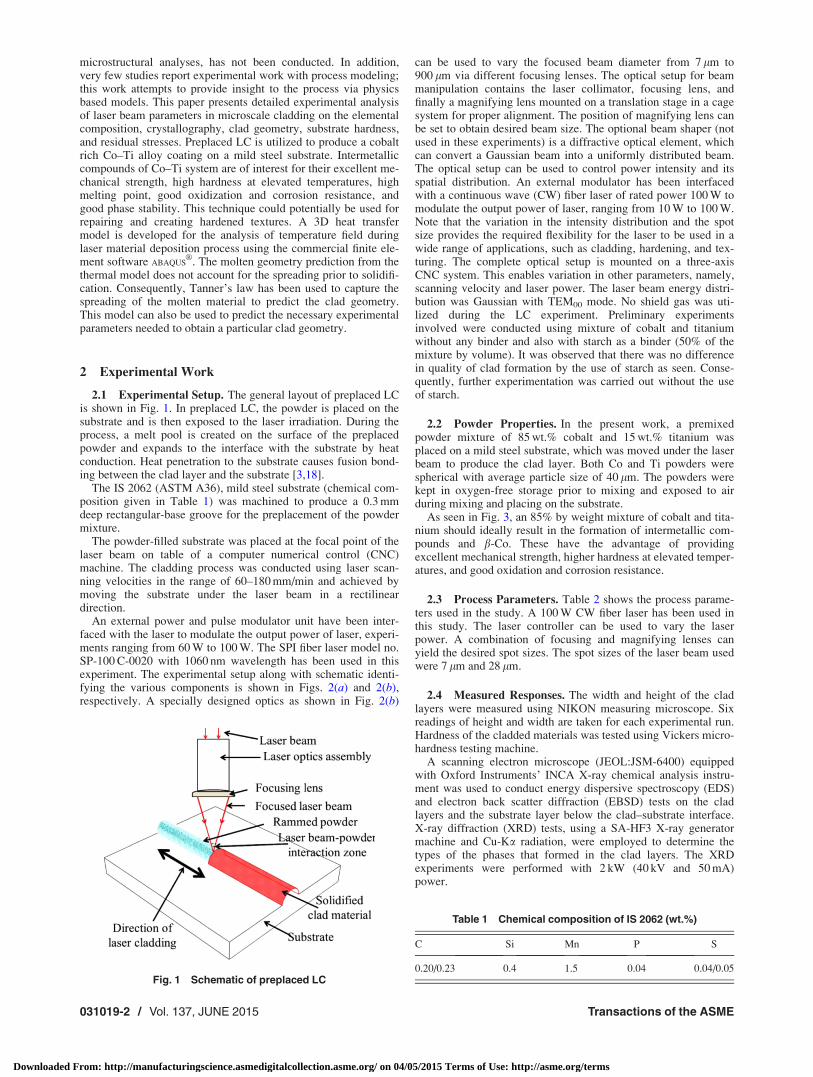
2.1 Experimental Setup. The general layout of preplaced LCis shown in Fig. 1. In preplaced LC, the powder is placed on thesubstrate and is then exposed to the laser irradiation. During theprocess, a melt pool is created on the surface of the preplacedpowder and expands to the interface with the substrate by heatconduction. Heat penetration to the substrate causes fusion bond-ing between the clad layer and the substrate [3,18].
The IS 2062 (ASTM A36), mild steel substrate (chemical com-position given in Table 1) was machined to produce a 0.3 mmdeep rectangular-base groove for the preplacement of the powdermixture.
The powder-filled substrate was placed at the focal point of thelaser beam on table of a computer numerical control (CNC)machine. The cladding process was conducted using laser scan-ning velocities in the range of 60–180 mm/min and achieved bymoving the substrate under the laser beam in a rectilineardirection.
An external power and pulse modulator unit have been inter-faced with the laser to modulate the output power of laser, experi-ments ranging from 60 W to 100 W. The SPI fiber laser model no.SP-100 C-0020 with 1060 nm wavelength has been used in thisexperiment. The experimental setup along with schematic identi-fying the various components is shown in Figs. 2(a) and 2(b),respectively. A specially designed optics as shown in Fig. 2(b)
can be used to vary the focused beam diameter from 7 lm to900 lm via different focusing lenses. The optical setup for beammanipulation contains the laser collimator, focusing lens, andfinally a magnifying lens mounted on a translation stage in a cagesystem for proper alignment. The position of magnifying lens canbe set to obtain desired beam size. The optional beam shaper (notused in these experiments) is a diffractive optical element, whichcan convert a Gaussian beam into a uniformly distributed beam.The optical setup can be used to control power intensity and itsspatial distribution. An external modulator has been interfacedwith a continuous wave (CW) fiber laser of rated power 100 W tomodulate the output power of laser, ranging from 10 W to 100 W.Note that the variation in the intensity distribution and the spotsize provides the required flexibility for the laser to be used in awide range of applications, such as cladding, hardening, and tex-turing. The complete optical setup is mounted on a three-axisCNC system. This enables variation in other parameters, namely,scanning velocity and laser power. The laser beam energy distri-bution was Gaussian with TEM00 mode. No shield gas was uti-lized during the LC experiment. Preliminary experimentsinvolved were conducted using mixture of cobalt and titaniumwithout any binder and also with starch as a binder (50% of themixture by volume). It was observed that there was no differencein quality of clad formation by the use of starch as seen. Conse-quently, further experimentation was carried out without the useof starch.
2.2 Powder Properties. In the present work, a premixedpowder mixture of 85 wt.% cobalt and 15 wt.% titanium wasplaced on a mild steel substrate, which was moved under the laserbeam to produce the clad layer. Both Co and Ti powders werespherical with average particle size of 40 lm. The powders werekept in oxygen-free storage prior to mixing and exposed to airduring mixing and placing on the substrate.
As seen in Fig. 3, an 85% by weight mixture of cobalt and tita-nium should ideally result in the formation of intermetallic com-pounds and b-Co. These have the advantage of providingexcellent mechanical strength, higher hardness at elevated temper-atures, and good oxidation and corrosion resistance.
2.3 Process Parameters. Table 2 shows the process parame-ters used in the study. A 100 W CW fiber laser has been used inthis study. The laser controller can be used to vary the laserpower. A combination of focusing and magnifying lenses canyield the desired spot sizes. The spot sizes of the laser beam usedwere 7 lm and 28 lm.
2.4 Measured Responses. The width and height of the cladlayers were measured using NIKON measuring microscope. Sixreadings of height and width are taken for each experimental run.Hardness of the cladded materials was tested using Vickers micro-hardness testing machine.
A scanning electron microscope (JEOL:JSM-6400) equippedwith Oxford Instruments’ INCA X-ray chemical analysis instru-ment was used to conduct energy dispersive spectroscopy (EDS)and electron back scatter diffraction (EBSD) tests on the cladlayers and the substrate layer below the clad–substrate interface.X-ray diffraction (XRD) tests, using a SA-HF3 X-ray generatormachine and Cu-Ka radiation, were employed to determine thetypes of the phases that formed in the clad layers. The XRDexperiments were performed with 2 kW (40 kV and 50 mA)power.
Fig. 1 Schematic of preplaced LC
Table 1 Chemical composition of IS 2062 (wt.%)
C Si Mn P S
0.20/0.23 0.4 1.5 0.04 0.04/0.05
031019-2 / Vol. 137, JUNE 2015 Transactions of the ASME
Downloaded From: http://manufacturingscience.asmedigitalcollection.asme.org/ on 04/05/2015 Terms of Use: http://asme.org/terms

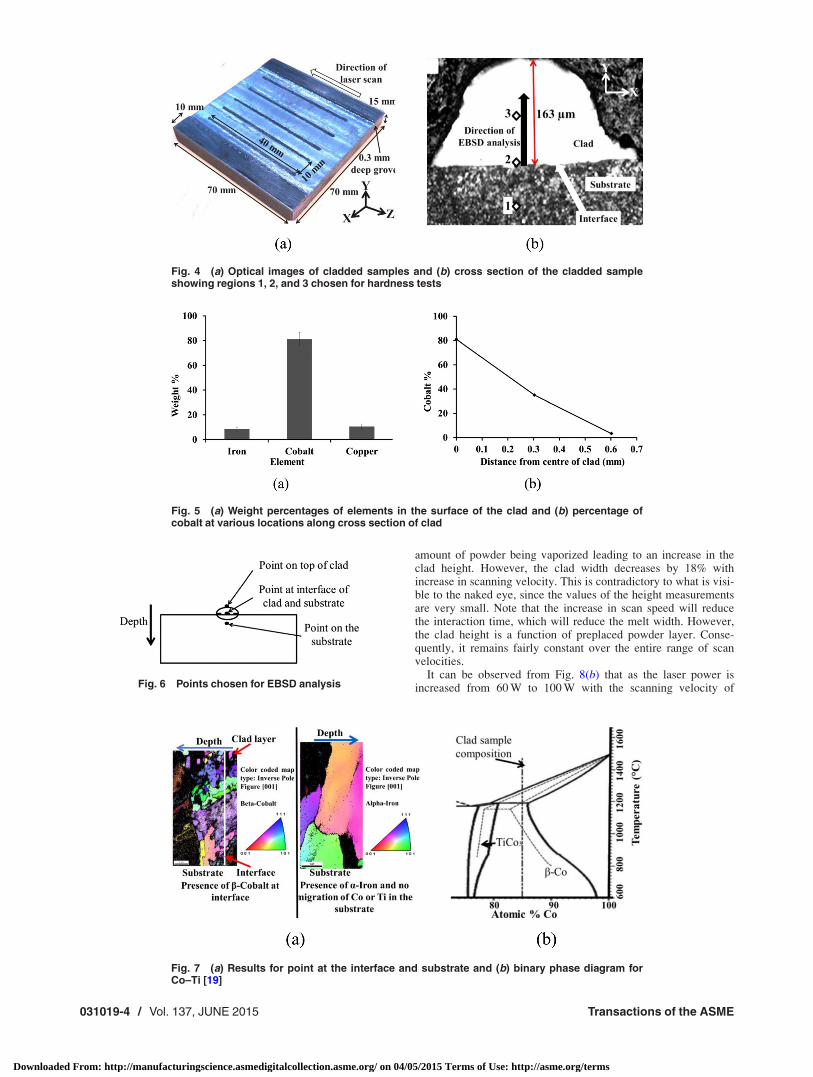
Eight samples were processed, with the lowest and highest laserscanning velocities (i.e., 60 mm/min and 180 mm/min), lowestand highest laser power (i.e., 60 W and 100 W), and lowest andhighest focused laser beam diameter (i.e., 7 lm and 28 lm) forXRD analysis. These measurements were made on the surfacewith the clad layer. Vickers microhardness tests were performedon the cross section of the clad layers using an MHT Series 200LECO tester and a load of 25 g. Only one measurement at eachpoint was taken as the representative of the hardness at that point.Figure 4(a) shows the optical images of cladded samples. Theposition of the interface, the direction of the EBSD test spots, andthe approximate locations at which the microhardness measure-ments were made for a cross section of a cladded sample are dem-onstrated in Fig. 4(b).
3 Metallurgical Characterization
The elemental composition along with the crystallographic in-formation of the clad is found using EDS and EBSD.
3.1 EDS Results. Figure 5(a) shows the weight percentage ofelements in a clad sample for 100 W laser power, 60 mm/min, and7 lm beam diameter. The weight percentage of cobalt at the sur-face can reach �81% along with traces of iron and impurities.Therefore, it can be concluded that cladding is achieved success-fully with the help of fiber laser under laboratory conditions withminimal dilution of iron from the substrate to the clad.
The variation of cobalt percentage at various locations alongthe cross section of the clad and substrate is shown in Fig. 5(b). Atotal of three points were considered on the cross section of theclad for each sample and it was seen that the percentage of cobaltcontent was maximum at the center of the laser beam. The cobaltconcentration varied from 3% at the interface to 81% at the center
of the clad at the surface. The remaining elements were mainlyiron at the interface and impurities at the surface. These impuritieswere present in both the substrate and the powder. It was observedthat at the interface the iron content is high with relatively smallerconcentration of Co and Ti.
3.2 EBSD Results. Figure 6 shows the locations whereEBSD data have been acquired. EBSD image for a point at theinterface of the clad and substrate is shown in Fig. 7(a). As shownin Fig. 7(b), at this composition, one should ideally expect TiCo3
formation. As the limitations in the setup did not allow indexingwith TiCo3, b-Co indexing was carried out. Figure 7(a) clearlyshows the presence of b-cobalt at the interface. The quantity of b-cobalt is lower at the top of the clad. The top of the clad does notshow values of coincidence index> 0.1 for b-cobalt or for a-iron.This could be attributed to the possible formation of Ti–Co inter-metallic, which could not be indexed.
The substrate only shows the presence of a-iron and no migra-tion of Co or Ti has taken place. This clearly implies that thecobalt does not migrate to the substrate during the cladding opera-tion. Also, the portion above the interface toward the top of theclad displayed higher hardness. This indicates a possible presenceof a Ti–Co compound or an alloy [3].
4 Geometrical/Mechanical Characterization
A parametric study of the various process parameters was car-ried out to characterize the clad geometry and the mechanicalproperties of the cladded region.
4.1 Effect of Process Parameters on Clad Geometry. Figure8 shows the variation of clad geometry as a function of variousprocess parameters. The error bars at the data points represent therange of the five readings. It can be seen from Fig. 8(a) that theheight of the clad increases by �20% if the scanning velocity isincreased from 60 mm/min to 180 mm/min at a laser power of100 W and beam diameter of 28 lm. This change can be attributedto the fact that with increase in scanning speed for the same laserpower density, the interaction time between laser beam and pre-placed powder layer decreases, thereby resulting in relatively less
Fig. 2 (a) Experimental setup and (b) schematic of experimental setup
Fig. 3 Binary phase diagram of Co–Ti [19]
Table 2 Parameters used for study
Level
Parameter 1 2 3 4 5
Scanning velocity (mm/min) 60 90 120 150 180Laser power (W) 60 70 80 90 100Beam diameter (lm) 7 28
Journal of Manufacturing Science and Engineering JUNE 2015, Vol. 137 / 031019-3
Downloaded From: http://manufacturingscience.asmedigitalcollection.asme.org/ on 04/05/2015 Terms of Use: http://asme.org/terms
amount of powder being vaporized leading to an increase in theclad height. However, the clad width decreases by 18% withincrease in scanning velocity. This is contradictory to what is visi-ble to the naked eye, since the values of the height measurementsare very small. Note that the increase in scan speed will reducethe interaction time, which will reduce the melt width. However,the clad height is a function of preplaced powder layer. Conse-quently, it remains fairly constant over the entire range of scanvelocities.
It can be observed from Fig. 8(b) that as the laser power isincreased from 60 W to 100 W with the scanning velocity of
Fig. 4 (a) Optical images of cladded samples and (b) cross section of the cladded sampleshowing regions 1, 2, and 3 chosen for hardness tests
Fig. 5 (a) Weight percentages of elements in the surface of the clad and (b) percentage ofcobalt at various locations along cross section of clad
Fig. 6 Points chosen for EBSD analysis
Fig. 7 (a) Results for point at the interface and substrate and (b) binary phase diagram forCo–Ti [19]
031019-4 / Vol. 137, JUNE 2015 Transactions of the ASME
Downloaded From: http://manufacturingscience.asmedigitalcollection.asme.org/ on 04/05/2015 Terms of Use: http://asme.org/terms

100 mm/min and beam diameter of 28 lm, the width and height ofclad increase. Reducing power by 40% reduces the width of theclad by 27% and the height by approximately 22%. The effect ofpower is more pronounced on the clad geometry as compared tothe scanning velocity. This can be said because the width changesby 27% through a 40% change in laser power, but the same effectis seen through a change of �200% in the scanning velocity. Thisincrease in the width can be attributed to increase in the intensity,which in turn governs the temperature rise. Higher power resultsin higher temperature and, therefore, increased width.
Figure 8(c) shows that the width of the clad reduces with anincrease in the beam diameter for 7–28 lm. For a multifoldincrease (�300%) in the beam diameter, the changes observed inheight and width are 36% and 18%, respectively. This implies thateven though the laser beam diameter significantly affects the heatflux, the width and the height of clad are not affected proportion-ately. The rise in temperature is a function of laser intensity, I,which is proportional to P/D2 and interaction time, t, which canbe approximated by D/V. Here, P is the laser power, D is thebeam diameter, and V is the scanning speed. An increase in beamdiameter reduces the intensity but increases the interaction time.Therefore, an increase in the diameter will reduce the temperature,thereby reducing the clad height and width.
Thus, this study on clad geometry revealed that clad width isdependent on the process parameters as opposed to the cladheight, which is relatively constant and primarily depends on thepreplaced layer. The data suggest that the effect of powder vapori-zation and possibly spreading does not affect the clad height assignificantly as the clad width. It may be noted that laser power isthe most influential on the width as suggested by the data obtainedthrough the experiments.
4.2 Effect of Process Parameters on Clad Hardness. Micro-hardness tests were conducted to characterize the hardness varia-tion through the clad and substrate as a function of the processparameters. The load used for the hardness tests was 10 g or
98.07 mN (HV 0.01). The sample was first polished to mirror fin-ish at the cross section. Three regions were analyzed under themicrohardness testing machines, namely, the substrate, theclad–substrate interface, and the clad. Three points were consid-ered at each of these three regions. The average value of the hard-ness thus obtained was used to analyze the trends.
Figures 9(a) and 9(b) give the pictorial representation of thesubstrate region and the clad region, respectively, for a specimengenerated by using laser power 100 W, scanning velocity of100 mm/min, and beam diameter of 28 lm. Under these condi-tions, the hardness of the clad is �82% higher than the substrate.
Figure 10(a) shows a plot of the variation of hardness acrossthe cross section for the base (B), interface (I), and the clad sur-face (C) for two different scanning velocities used during clad-ding. The value of the hardness increases by 35% for 60 mm/minas compared to the 24% increase obtained for the 180 mm/minsample. Also, the rate of increase of hardness from base to inter-face is higher in case of the clad obtained with a lower scanningvelocity. This implies a better quality of the clad formed in theformer case. This increase in hardness is symbolic of the presenceof cobalt and/or Ti–Co intermetallic at the interfacial and thecladded regions.
Figure 10(b) shows the variation of the hardness of differentregions for the two samples, which differed only in the power ofthe laser used during the cladding. It can be seen that higherpower provides a better quality of the clad, and thus provides ahigher percentage increase in the hardness. The clad hardnessincreases by 15%, if the power is increased from 60 W to 100 W.The actual hardness value stands at 186 HV with 100 W laser inthe clad.
Figure 10(c) shows the variation in hardness for two samplescreated with different laser beam diameter. It can be seen thatthere is a close resemblance in the hardness variation; however,the magnitude of the hardness is higher for the lower spot size,which could be attributed to higher intensities.
The hardness analysis leads us to two main conclusions. First,the clad layer has higher value of hardness due to the presence of
Fig. 8 Variation of clad height and width as a function of: (a) scanning velocity, (b) laserpower, and (c) beam diameter (process parameters: laser power 5 100 W, scanning veloci-ty 5 100 mm/min, and beam diameter 5 28 lm)
Journal of Manufacturing Science and Engineering JUNE 2015, Vol. 137 / 031019-5
Downloaded From: http://manufacturingscience.asmedigitalcollection.asme.org/ on 04/05/2015 Terms of Use: http://asme.org/terms
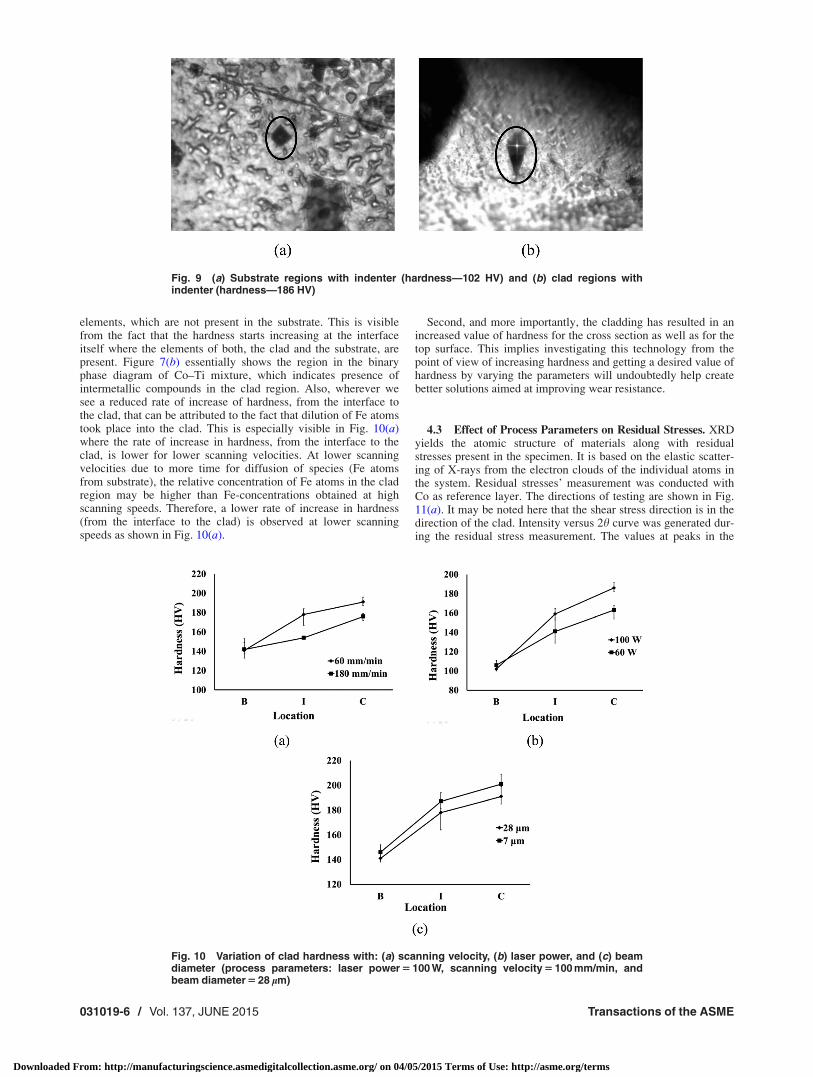
elements, which are not present in the substrate. This is visiblefrom the fact that the hardness starts increasing at the interfaceitself where the elements of both, the clad and the substrate, arepresent. Figure 7(b) essentially shows the region in the binaryphase diagram of Co–Ti mixture, which indicates presence ofintermetallic compounds in the clad region. Also, wherever wesee a reduced rate of increase of hardness, from the interface tothe clad, that can be attributed to the fact that dilution of Fe atomstook place into the clad. This is especially visible in Fig. 10(a)where the rate of increase in hardness, from the interface to theclad, is lower for lower scanning velocities. At lower scanningvelocities due to more time for diffusion of species (Fe atomsfrom substrate), the relative concentration of Fe atoms in the cladregion may be higher than Fe-concentrations obtained at highscanning speeds. Therefore, a lower rate of increase in hardness(from the interface to the clad) is observed at lower scanningspeeds as shown in Fig. 10(a).
Second, and more importantly, the cladding has resulted in anincreased value of hardness for the cross section as well as for thetop surface. This implies investigating this technology from thepoint of view of increasing hardness and getting a desired value ofhardness by varying the parameters will undoubtedly help createbetter solutions aimed at improving wear resistance.
4.3 Effect of Process Parameters on Residual Stresses. XRDyields the atomic structure of materials along with residualstresses present in the specimen. It is based on the elastic scatter-ing of X-rays from the electron clouds of the individual atoms inthe system. Residual stresses’ measurement was conducted withCo as reference layer. The directions of testing are shown in Fig.11(a). It may be noted here that the shear stress direction is in thedirection of the clad. Intensity versus 2h curve was generated dur-ing the residual stress measurement. The values at peaks in the
Fig. 9 (a) Substrate regions with indenter (hardness—102 HV) and (b) clad regions withindenter (hardness—186 HV)
Fig. 10 Variation of clad hardness with: (a) scanning velocity, (b) laser power, and (c) beamdiameter (process parameters: laser power 5 100 W, scanning velocity 5 100 mm/min, andbeam diameter 5 28 lm)
031019-6 / Vol. 137, JUNE 2015 Transactions of the ASME
Downloaded From: http://manufacturingscience.asmedigitalcollection.asme.org/ on 04/05/2015 Terms of Use: http://asme.org/terms
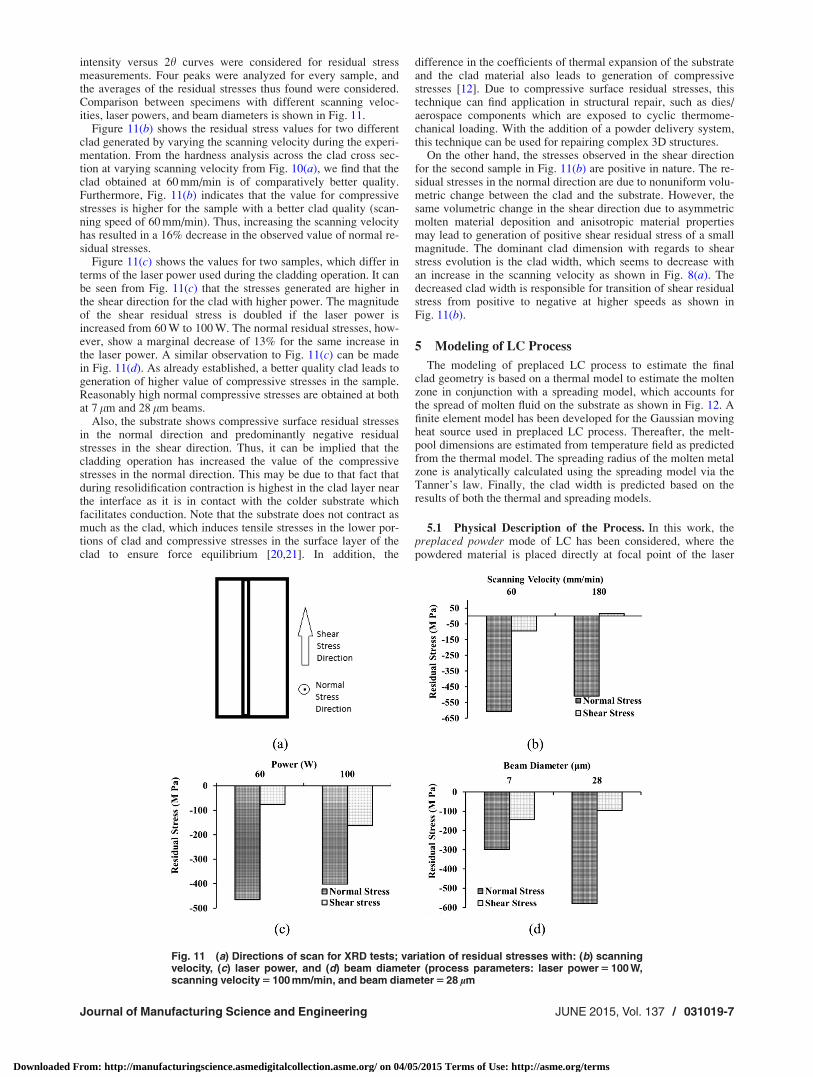
intensity versus 2h curves were considered for residual stressmeasurements. Four peaks were analyzed for every sample, andthe averages of the residual stresses thus found were considered.Comparison between specimens with different scanning veloc-ities, laser powers, and beam diameters is shown in Fig. 11.
Figure 11(b) shows the residual stress values for two differentclad generated by varying the scanning velocity during the experi-mentation. From the hardness analysis across the clad cross sec-tion at varying scanning velocity from Fig. 10(a), we find that theclad obtained at 60 mm/min is of comparatively better quality.Furthermore, Fig. 11(b) indicates that the value for compressivestresses is higher for the sample with a better clad quality (scan-ning speed of 60 mm/min). Thus, increasing the scanning velocityhas resulted in a 16% decrease in the observed value of normal re-sidual stresses.
Figure 11(c) shows the values for two samples, which differ interms of the laser power used during the cladding operation. It canbe seen from Fig. 11(c) that the stresses generated are higher inthe shear direction for the clad with higher power. The magnitudeof the shear residual stress is doubled if the laser power isincreased from 60 W to 100 W. The normal residual stresses, how-ever, show a marginal decrease of 13% for the same increase inthe laser power. A similar observation to Fig. 11(c) can be madein Fig. 11(d). As already established, a better quality clad leads togeneration of higher value of compressive stresses in the sample.Reasonably high normal compressive stresses are obtained at bothat 7 lm and 28 lm beams.
Also, the substrate shows compressive surface residual stressesin the normal direction and predominantly negative residualstresses in the shear direction. Thus, it can be implied that thecladding operation has increased the value of the compressivestresses in the normal direction. This may be due to that fact thatduring resolidification contraction is highest in the clad layer nearthe interface as it is in contact with the colder substrate whichfacilitates conduction. Note that the substrate does not contract asmuch as the clad, which induces tensile stresses in the lower por-tions of clad and compressive stresses in the surface layer of theclad to ensure force equilibrium [20,21]. In addition, the
difference in the coefficients of thermal expansion of the substrateand the clad material also leads to generation of compressivestresses [12]. Due to compressive surface residual stresses, thistechnique can find application in structural repair, such as dies/aerospace components which are exposed to cyclic thermome-chanical loading. With the addition of a powder delivery system,this technique can be used for repairing complex 3D structures.
On the other hand, the stresses observed in the shear directionfor the second sample in Fig. 11(b) are positive in nature. The re-sidual stresses in the normal direction are due to nonuniform volu-metric change between the clad and the substrate. However, thesame volumetric change in the shear direction due to asymmetricmolten material deposition and anisotropic material propertiesmay lead to generation of positive shear residual stress of a smallmagnitude. The dominant clad dimension with regards to shearstress evolution is the clad width, which seems to decrease withan increase in the scanning velocity as shown in Fig. 8(a). Thedecreased clad width is responsible for transition of shear residualstress from positive to negative at higher speeds as shown inFig. 11(b).
5 Modeling of LC Process
The modeling of preplaced LC process to estimate the finalclad geometry is based on a thermal model to estimate the moltenzone in conjunction with a spreading model, which accounts forthe spread of molten fluid on the substrate as shown in Fig. 12. Afinite element model has been developed for the Gaussian movingheat source used in preplaced LC process. Thereafter, the melt-pool dimensions are estimated from temperature field as predictedfrom the thermal model. The spreading radius of the molten metalzone is analytically calculated using the spreading model via theTanner’s law. Finally, the clad width is predicted based on theresults of both the thermal and spreading models.
5.1 Physical Description of the Process. In this work, thepreplaced powder mode of LC has been considered, where thepowdered material is placed directly at focal point of the laser
Fig. 11 (a) Directions of scan for XRD tests; variation of residual stresses with: (b) scanningvelocity, (c) laser power, and (d) beam diameter (process parameters: laser power 5 100 W,scanning velocity 5 100 mm/min, and beam diameter 5 28 lm
Journal of Manufacturing Science and Engineering JUNE 2015, Vol. 137 / 031019-7
Downloaded From: http://manufacturingscience.asmedigitalcollection.asme.org/ on 04/05/2015 Terms of Use: http://asme.org/terms

beam (unless deliberately using defocused beam) over the basematerial. Laser heat causes the powder to melt and results in drop-lets being deposited over the substrate. A rectangular block of size3 mm� 3 mm� 8 mm has been used as the substrate and the ini-tial powder deposition height has been kept at 0.3 mm as used inthe experiments. A laser beam of power, P, moves from left toright along the top edge of the computational domain with a tra-verse velocity of v as shown in Fig. 1. The laser beam energy dis-tribution of the moving heat source is Gaussian (TEM00) mode.
5.2 Thermal Model. A finite element model has been devel-oped to estimate the initial melt-pool dimensions. The step startswith the base material initially at room temperature, T0 (¼300 K).The Gaussian moving heat source (laser beam) has been simulatedby a user defined subroutine in ABAQUS
VR
, DFLUX. A user subrou-tine provides increased functionality of several ABAQUS
VR
capabil-ities for which the usual data input methods alone may be toorestrictive. DFLUX is one such user subroutine in ABAQUS
VR
todefine nonuniform distributed flux in a heat transfer or mass diffu-sion analysis. The DFLUX subroutine calculates the location ofcenter of the laser beam and area over which the nonuniform heatflux is to be applied, at each time increment, as depicted in Fig.13. Temperature dependent thermophysical properties have beenused for the substrate material. At every instant of time, value ofheat flux to be applied at the surface is calculated by the DFLUXsubroutine. Thereafter, the values of temperatures at the nodeswere called/retrieved using utility routine GETVRM in ABAQUS
VR
through the subroutine USDFLD.GETVRM is a utility routine available in ABAQUS
VR
to assist inthe coding of user subroutine, USDFLD. Utility routine GETVRMperforms the predefined function of providing access to materialpoint information for ABAQUS
VR
subroutine USDFLD. Therefore,utility routine GETVRM retrieves the values of temperatures atthe nodes at each integration point in the computational domainduring the analysis. The USDFLD subroutine is used to introducesolution-dependent material properties as functions of predefinedfield variables. Therefore, the nodal temperature values retrievedusing utility routine GETVRM were compared to identify theregions at which the temperature exceeds the vaporization temper-ature of the powder (>3254 K) to identify the burnt-off (vapor-ized) powder during the cladding process. The vaporized and
molten region was specifically identified by assigning values of 0and 1, respectively, to a predefined field variable in USDFLD.
5.2.1 Model Assumptions. In the present work, the followingassumptions were considered for developing the thermal finite ele-ment model of the process:
• Heat transfer in the process was assumed to occur withoutany internal heat generation and a fixed value of free convec-tion coefficient has been used.
• The effect of melt-pool dynamics has not been explicitly con-sidered in the model. However, spreading of the molten metalhas been accounted for post-thermal simulation.
• Vaporization of the powder bed has been considered but thevapor–laser interaction has not been modeled.
• The substrate and the clad material maintain their originalmaterial composition during the process. The transfer of spe-cies due to diffusion or thermocapillary action has not beenconsidered.
5.2.2 Governing Equations and Loading/Boundary Conditions.Transient heat conduction equation is used as the basic governingequation for heat transfer. The governing heat conduction equa-tion in three-dimensional Cartesian coordinates is
@
@xk@T
@x
� �þ @
@yk@T
@y
� �þ @
@zk@T
@z
� �¼ qCp
@T
@tþ qvCp
@T
@x
(1)
where q, Cp, and k refer, respectively, to density, specific heat,and thermal conductivity of substrate material; T and t refer totemperature and time variable, respectively. The first three termson the left side of Eq. (1) refer to the conductive heat transfer in x,y, and z direction, respectively. The term on the right side of Eq.(1) depicts the transient nature of the heat transfer process. Theassociated boundary conditions for three-dimensional thermalanalysis are as follows. The top of the material being added ateach instant is subjected to a specified heat flux qs due to laserbeam irradiation. The rest of the work piece surfaces open toatmosphere are subjected to convective and radiative heat losses.The above boundary condition is stated mathematically as
kn@T
@n� qs þ h T � T0ð Þ þ re T4 � T4
0
� �¼ 0 (2)
where n denotes the direction normal to surface and kn refers tothermal conductivity; h, e; r; and T0 refers to surface heat transfercoefficient, emissivity, Stefan–Boltzmann constant, and ambienttemperature, respectively. The first term represents heat loss dueto conduction from the surface whose unit normal is n. The secondterm qs stands for the imposed surfaced heat flux which depictsthe heat present due the moving laser beam; the third and fourth
Fig. 12 Modeling of preplaced LCFig. 13 Algorithm for thermal model for predicting melt-pooldimensions
031019-8 / Vol. 137, JUNE 2015 Transactions of the ASME
Downloaded From: http://manufacturingscience.asmedigitalcollection.asme.org/ on 04/05/2015 Terms of Use: http://asme.org/terms
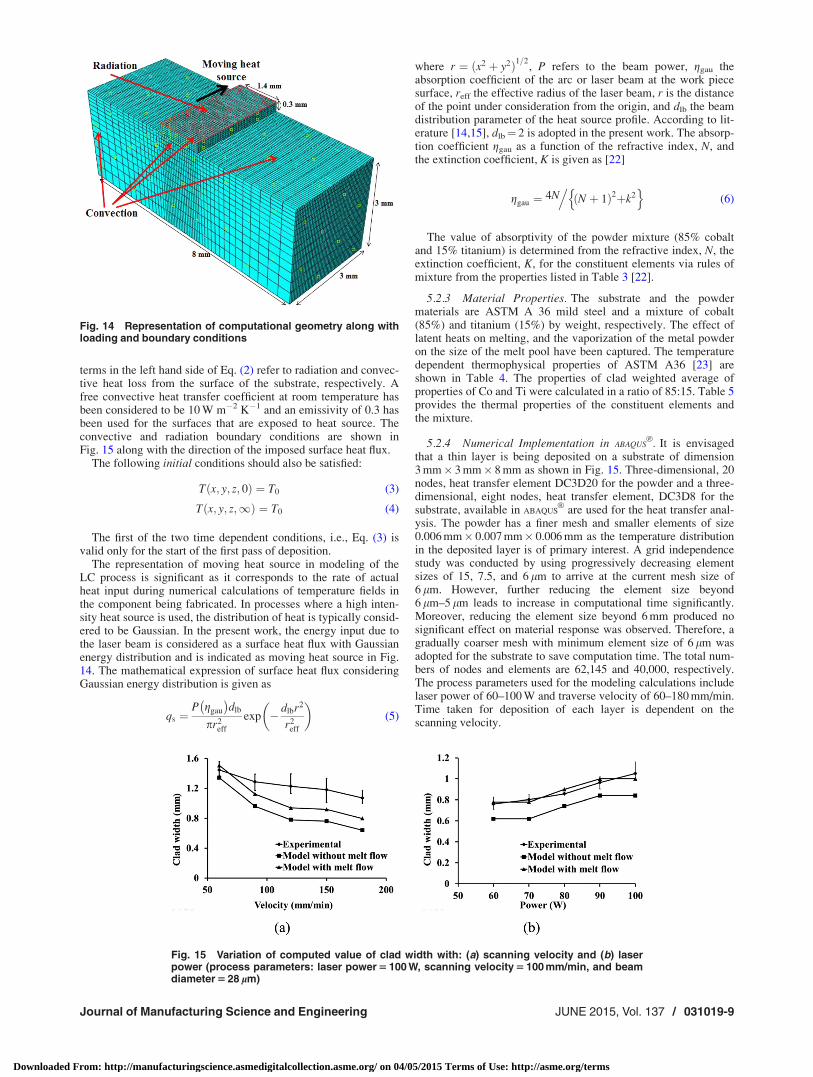
terms in the left hand side of Eq. (2) refer to radiation and convec-tive heat loss from the surface of the substrate, respectively. Afree convective heat transfer coefficient at room temperature hasbeen considered to be 10 W m�2 K�1 and an emissivity of 0.3 hasbeen used for the surfaces that are exposed to heat source. Theconvective and radiation boundary conditions are shown inFig. 15 along with the direction of the imposed surface heat flux.
The following initial conditions should also be satisfied:
T x; y; z; 0ð Þ ¼ T0 (3)
T x; y; z;1ð Þ ¼ T0 (4)
The first of the two time dependent conditions, i.e., Eq. (3) isvalid only for the start of the first pass of deposition.
The representation of moving heat source in modeling of theLC process is significant as it corresponds to the rate of actualheat input during numerical calculations of temperature fields inthe component being fabricated. In processes where a high inten-sity heat source is used, the distribution of heat is typically consid-ered to be Gaussian. In the present work, the energy input due tothe laser beam is considered as a surface heat flux with Gaussianenergy distribution and is indicated as moving heat source in Fig.14. The mathematical expression of surface heat flux consideringGaussian energy distribution is given as
qs ¼P ggau
� �dlb
pr2eff
exp � dlbr2
r2eff
� �(5)
where r ¼ x2 þ y2ð Þ1=2, P refers to the beam power, ggau the
absorption coefficient of the arc or laser beam at the work piecesurface, reff the effective radius of the laser beam, r is the distanceof the point under consideration from the origin, and dlb the beamdistribution parameter of the heat source profile. According to lit-erature [14,15], dlb¼ 2 is adopted in the present work. The absorp-tion coefficient ggau as a function of the refractive index, N, andthe extinction coefficient, K is given as [22]
ggau ¼ 4N ðN þ 1Þ2þk2n o.
(6)
The value of absorptivity of the powder mixture (85% cobaltand 15% titanium) is determined from the refractive index, N, theextinction coefficient, K, for the constituent elements via rules ofmixture from the properties listed in Table 3 [22].
5.2.3 Material Properties. The substrate and the powdermaterials are ASTM A 36 mild steel and a mixture of cobalt(85%) and titanium (15%) by weight, respectively. The effect oflatent heats on melting, and the vaporization of the metal powderon the size of the melt pool have been captured. The temperaturedependent thermophysical properties of ASTM A36 [23] areshown in Table 4. The properties of clad weighted average ofproperties of Co and Ti were calculated in a ratio of 85:15. Table 5provides the thermal properties of the constituent elements andthe mixture.
5.2.4 Numerical Implementation in ABAQUSVR . It is envisaged
that a thin layer is being deposited on a substrate of dimension3 mm� 3 mm� 8 mm as shown in Fig. 15. Three-dimensional, 20nodes, heat transfer element DC3D20 for the powder and a three-dimensional, eight nodes, heat transfer element, DC3D8 for thesubstrate, available in ABAQUS
VR
are used for the heat transfer anal-ysis. The powder has a finer mesh and smaller elements of size0.006 mm� 0.007 mm� 0.006 mm as the temperature distributionin the deposited layer is of primary interest. A grid independencestudy was conducted by using progressively decreasing elementsizes of 15, 7.5, and 6 lm to arrive at the current mesh size of6 lm. However, further reducing the element size beyond6 lm–5 lm leads to increase in computational time significantly.Moreover, reducing the element size beyond 6 mm produced nosignificant effect on material response was observed. Therefore, agradually coarser mesh with minimum element size of 6 lm wasadopted for the substrate to save computation time. The total num-bers of nodes and elements are 62,145 and 40,000, respectively.The process parameters used for the modeling calculations includelaser power of 60–100 W and traverse velocity of 60–180 mm/min.Time taken for deposition of each layer is dependent on thescanning velocity.
Fig. 15 Variation of computed value of clad width with: (a) scanning velocity and (b) laserpower (process parameters: laser power 5 100 W, scanning velocity 5 100 mm/min, and beamdiameter 5 28 lm)
Fig. 14 Representation of computational geometry along withloading and boundary conditions
Journal of Manufacturing Science and Engineering JUNE 2015, Vol. 137 / 031019-9
Downloaded From: http://manufacturingscience.asmedigitalcollection.asme.org/ on 04/05/2015 Terms of Use: http://asme.org/terms

5.3 Spreading Model. The initial melt-pool dimension wasestimated from the thermal model. The initial clad width andheight have been estimated by the region that lies between themelting and the boiling points of the powder mixture. However,as reported by Kim and Peng [25], part of the molten metal flowsbeyond the width of melt pool in the base metal and bonds withthe base metal during cooling. The surface tension driven spread-ing of the molten material in microscale laser can be estimatedusing Tanner’s law [26,27].
According to Tanner’s law for the spreading of a drop over adry flat surface, the relationship between sessile drop spreadingvelocity, U, and apparent contact angle, ha, is given by [26,27]
U ¼ dR
dt� d
lhað Þm (7)
Assuming the shape of the droplet to be close to a sphericalcap, the apparent contact angle, the drop thickness/height, H (t),and the radius, R (t), are related by [27]
H ¼ 1
2Rha (8)
p2
HR2 ¼ X (9)
Then, the spreading velocity can be given as
U ¼ dR
dt� d
lXR3
� �m
(10)
Finally, the radius of spreading, R, for a droplet spreading on aflat surface is given as follows:
ðR
R0
R3dR ¼ðt¼tf
t¼ti
dl
Xmdt (11)
R3mþ1 � R3mþ10 þ ð3mþ 1Þ d
lXmDts (12)
Dts ¼ tf � ti (13)
where R0 is the initial sessile drop radius (considered approxi-mately to be equal to half the initial melt-pool width calculatedfrom the thermal model), X is the molten metal volume, and Dts isthe time the drop reaches the radius R. The time,Dts, is consideredas the solidification time of the molten powder for the calculationof the spreading radius. l and d are the viscosity and surface ten-sion, respectively, of the molten powder. The value of the expo-nent m in Eq. (12) is considered as 3 [27] for the molten metalflow considering dry spreading. The value of l¼ 3.93 mPa s andd¼ 1.93 N/m is considered for liquid cobalt at its melting temper-ature of 1768 K [28,29] for calculation of molten metal spreadingradius. The clad height is recalculated by adjusting the final melt-pool width, R due to spreading and total clad length, L using con-servation of mass as shown in the following equation:
Hfinal ¼X
R� L(14)
6 Model Validation
The computed results from the numerical model are validatedagainst the experimental results. The experiments were carried outusing laser powers varying from 60 to 100 W and the traversevelocity varying from 60 mm/min to 180 mm/min for depositionof preplaced powder.
Figure 15(a) shows the variation in the clad width with scan-ning velocity at fixed power of 100 W and beam diameter of28 lm. It can be seen from Fig. 15(a) that the model which incor-porates molten metal spreading over the substrate is in betteragreement with the experimental data. The prediction errors liebetween 8% and 40% without accounting for the spread whereasif the spread of the molten material is accounted for the predictionerrors vary from 4% to 25%. One interesting thing to note is thatthe prediction error progressively increases with an increase in thevelocity. Note that the sessile drop spreading model does not
Table 3 Refractive index and extinction coefficient of constitu-ent elements [22]
Elements N K ggau ggau mixture
Co 4 5 0.32 0.336918Ti 3.57 3.48 0.432789
Table 4 Thermal properties of ASTM A36 (IS 2062) [23]
Temperature(K)
Conductivity(W m�1K�1)
Density(kg m�3)
Specific heat(J kg�1K�1)
Latent heat offusion (J mol�1)
Solidustemperature (K)
Liquidustemperature (K)
298 72.7 7874 450 13,810 1640 1720473 61 7815 520673 49 7747 601873 38.5 7679 7451073 29.3 7612 9451273 31.5 7605 6201473 35.2 7503 6501673 38.7 7408 7381873 36.2 6977 8242073 38 6805 824
Table 5 Thermal properties of constituent [24]
ElementsDensity
(kg m �3)Conductivity
(W m �1K �1)
Specificheat
(J kg �1K �1)
Latent heat offusion
(kj mol �1)
Meltingtemperature
(K)
Liquiddensity
(kg m �3)
Latent heat ofvaporization(J mol �1)
Vaporizationtemperature
(K)
Co 8900 100 420 16.06 1768 8860 377,000 3200Ti 4506 21.9 540 14.15 1941 4110 425,000 3560Mix 8240.9 88.285 438 15.7735 1793.95 8147.5 384,200 3254
031019-10 / Vol. 137, JUNE 2015 Transactions of the ASME
Downloaded From: http://manufacturingscience.asmedigitalcollection.asme.org/ on 04/05/2015 Terms of Use: http://asme.org/terms

account substrate movement and, hence, it is accurate only atlower velocities. At higher velocities, the inertial effects and melt-pool dynamics affect the prediction results.
Figure 15(b) shows the variation of the clad width as a functionof laser power at fixed scanning velocity of 100 mm/min and abeam diameter of 28 lm. The prediction errors are less than 5% ifmolten metal spreading is considered as opposed to a maximumprediction error 40% without accounting for the spreading. Therelatively low prediction can be attributed to the low scan velocityused in the experiments.
7 Model Based Interpretations
7.1 Melt Pool. Figure 16(a) shows the temperature distribu-tion at 100 W laser power, 100 mm/min scanning velocity, and
28 lm beam diameter. The zone heated above 1794 K representsthe molten weld pool, which is indicated by semicircular blue con-tour within square (see Fig. 16(a)), (color available online). Figure16(b) shows the vaporized (burnt-off) region, which is obtainedfrom utility routine GETVRM via USDFLD user defined subrou-tine (explained in Fig. 13) as the model predicts that �100 lm oftop layer can be vaporized.
7.2 Temperature Distribution. Figure 17(a) shows the nodaltemperature variation along the depth for 100 W laser power and28 lm beam diameter for different scanning velocities. The peaktemperature at the surface and the overall temperature attained inthe substrate region decreases with increase in scanning velocity.The peak temperatures at 60 mm/min and 180 mm/min are�7000 K and �6500 K, respectively, which is a difference of 7%.
Fig. 16 (a) Temperature distribution of layer at 0.6 s and (b) contour of vaporized region andmolten zone
Fig. 17 Temperature distributions across: (a) depth from the clad surface and (b) distancefrom the centerline of clad for 100 W laser power and 28 lm beam diameter
Fig. 18 Temperature distributions across: (a) depth from the clad surface and (b) distancefrom the centerline of clad for 100 mm/min scanning speed and 28 lm beam diameter
Journal of Manufacturing Science and Engineering JUNE 2015, Vol. 137 / 031019-11
Downloaded From: http://manufacturingscience.asmedigitalcollection.asme.org/ on 04/05/2015 Terms of Use: http://asme.org/terms
However, at higher depths, the temperature difference canincrease up to 50%. This can be attributed to the fact that anincrease in the velocity decreases the laser–material interactiontime, thereby reducing the amount of the heat that gets conductedthrough the thickness.
Figure 17(b) shows the temperature profile from the centerlineof the clad (along the width) on the surface for 100 W laser powerand 28 lm beam diameter at different scanning velocities. Asexpected, the nodal temperatures attained decrease by 6% at thecenter of the clad to 51% at the edges if the scanning velocity isincreased from 60 mm/min to 180 mm/min. This shows that peaktemperature variation as a function of velocity is not very pro-nounced, but the velocity affects the temperatures significantly atlocations away from the centerline of the clad. Consequently, theclad geometry will be strongly dependent on the scan velocities.
Figure 18(a) shows the temperature distribution along the depthfor 100 mm/min scanning velocity and 28 lm beam diameter atdifferent laser powers. The peak temperature increases from5600 K to 6600 K if the laser power is increased from 60 W to100 W. Although the intensity is increased significantly, a largefraction is used as latent heat of vaporization during the powdervaporization, which reduces the amount of heat being conductedto the substrate. As expected, the difference between nodal tem-peratures along the depth is not as pronounced as the scan velocitydue to the fact that the interaction times and peak temperaturesare similar in both cases.
Figure 18(b) shows the temperature profile from the centerlineof the clad (along the width) on the surface for 100 mm/min scan-ning velocity and 28 lm beam diameter different laser powers. Asexplained in the case of depth, the temperature difference alongthe width of the clad is inappreciable due to similar interactiontimes and peak temperatures, which result in similar conductionbehavior.
8 Conclusions
This paper is focused on comprehensive metallurgical andmechanical characterization of microscale preplaced LC via afiber laser. In addition, a three-dimensional finite element thermalmodel is developed for the process to simulate Gaussian movinglaser heat source. The thermal model takes into account the vapor-ization of the preplaced powder and estimates the initial moltenmetal pool dimensions from the temperature profile. The finalclad geometry is predicted using Tanner’s law to capture thespreading of the molten material. Following conclusions can bedrawn from this work:
• The elemental analysis of points on the clad showed a signifi-cantly high weight percentage of Co and Ti without any traceof iron. The weight percentage of cobalt in the clad wasfound to be 80% which shows that sound clad of cobalt richmaterial has been obtained.
• The phase analysis indicated the presence of a-Fe in the sub-strate and b-cobalt at the interface region between the cladand the substrate. This indicates minimum dilution from theclad to the substrate and vice versa, which is a prerequisite ofthe cladding process.
• The increase in the hardness of the clad as compared with thesubstrate lies between 30% and 80% which could be attrib-uted to the presence of b-cobalt at the interface and presenceof Ti based intermetallic compounds on top of the clad. Thisfurther supports the claim that deposition of Ti–Co powderover mild steel substrate via preplaced LC can be used forimproving subsurface properties of existing componentsthereby enhancing their life.
• The width of the clad decreases by �18%, if either scanningvelocity is increased from 60 mm/min to 180 mm/min or thebeam diameter is increased from 7 lm to 28 lm. In compari-son, the width is reduced by �27% if the laser power isdecreased from 100 W to 60 W.
• The residual stresses developed in the substrate layer arecompressive in nature which highlights the potential of thistechnique for structural repair applications.
• The thermal model predicts the initial melt-pool dimensionswith prediction errors for most cases are �30%. However, ifthe molten metal spreading is taken into account the predic-tion errors for clad geometry significantly decrease to< 10%.
• Model based interpretations indicate that an increase in thevelocity reduces the amount of the heat conducted below theclad surface. The peak temperature is relatively insensitive tothe velocity; however, it affects the temperatures significantlyat locations away from the centerline of the clad.
Acknowledgment
The authors wish to gratefully acknowledge that this researchwas funded by the Department of Science and Technology,Government of India (No. SR/S3/MERC/016/2009).
Nomenclature
Cp ¼ specific heat (J kg�1 K�1)D ¼ laser beam diameter (mm)
dlb ¼ beam distribution parameter of the heat source profileh ¼ heat transfer coefficient (W m�2 K�1)H ¼ sessile drop thickness/height (mm)
Hfinal ¼ final height of clad incorporating spreading (mm)I ¼ laser intensity (W mm�2)k ¼ thermal conductivity (W m�1 K�1)K ¼ extinction coefficient of laser beamL ¼ total clad length (mm)N ¼ refractive index of surfaceP ¼ laser power (W)qs ¼ heat flux due to laser irradiation at the surface (W m�2)R ¼ final sessile drop radius (mm)
reff ¼ effective radius of the laser beam (mm)R0 ¼ initial sessile drop radius (mm)
t ¼ interaction time (s)T0 ¼ ambient temperature (¼ 300 K)U ¼ sessile drop spreading velocityV ¼ scanning speed (mm min�1)d ¼ surface tension (N m�1)
Dts ¼ solidification time of the molten powder (s)e ¼ emissivity
ggau ¼ absorption coefficient of the arc or laser beam at the workpiece surface
ha ¼ apparent contact anglel ¼ viscosity (mPa s)q ¼ density (kg m�3)r ¼ Stefan–Boltzmann constant (¼ 5.67� 10�8 W m�2 K�4)X ¼ droplet/molten metal volume (mm3)
References[1] McIntyre, R. M., 1983, “Laser Hard Surfacing of Turbine Blade Shroud Inter-
locks,” Proceedings of the 2nd International Conference on Applications ofLasers in Materials Processing, Los Angeles, CA, pp. 230–240.
[2] Rolls-Royce Ltd., 1980, “Laser Application of a Hard Surface Alloy,” UKPatent GB 2052566A.
[3] Agrawal, G., Kar, A., and Mazumder, J., 1993, “Theoretical Studies onExtended Solid Solubility and Non-Equilibrium Phase Diagram for Nb-AlAlloy Formed During Laser Cladding,” Scr. Metall. Mater., 28(11),pp. 1453–1458.
[4] Chrysolurris, G., Zannis, S., Tsirbas, K., and Lalas, C., 2002, “An ExperimentalInvestigation of Laser Cladding,” CIRP Ann.-Manuf. Technol., 51(1),pp. 145–148.
[5] Lee, H. K., 2008, “Effects of the Cladding Parameters on the Deposition Effi-ciency in Pulsed Nd:YAG Laser Cladding,” J. Mater. Process. Technol.,202(1–3), pp. 321–327.
[6] Tapia, G., and Elwany, A., 2014, “A Review of Process Monitoring and Controlin Metal-Based Additive Manufacturing,” ASME J. Manuf. Sci. Eng., 136(6),p. 060801.
031019-12 / Vol. 137, JUNE 2015 Transactions of the ASME
Downloaded From: http://manufacturingscience.asmedigitalcollection.asme.org/ on 04/05/2015 Terms of Use: http://asme.org/terms
[7] Denlinger, E. R., Irwin, J., and Michaleris, P., 2014, “Thermomechanical Mod-eling of Additive Manufacturing Large Parts,” ASME J. Manuf. Sci. Eng.,136(6), p. 061007.
[8] Tabernero, I., Lamikiz, A., Martinez, S., Ukar, E., and Figueras, J., 2011,“Evaluation of the Mechanical Properties of Inconel 718 Components Built byLaser Cladding,” Int. J. Mach. Tools Manuf., 51(6), pp. 465–470.
[9] Deus, A. M., and Mazumder, J., 1996, “Two-Dimensional Thermo-MechanicalFinite Element Model for Laser Cladding,” Proceedings of the ICALEO ‘96,Orlando, FL, pp. B/174–B/183.
[10] Pal, D., Patil, N., Zeng, K., and Stucker, B., 2014, “An Integrated Approach toAdditive Manufacturing Simulations Using Physics Based, Coupled MultiscaleProcess Modeling,” ASME J. Manuf. Sci. Eng., 136(6), p. 061022.
[11] Dai, K., and Shaw, L., 2008, “Thermal and Stress Modeling of Multi-MaterialLaser Processing,” Acta Mater., 49(20), pp. 4171–4181.
[12] Bendeich, P., Alam, N., Brandt, M., Carr, D., Short, K., Blevins, R., Curfs, C.,Kirstein, O., Atkinson, G., Holden, T., and Rogge, R., 2006, “Residual StressMeasurements in Laser Clad Repaired Low Pressure Turbine Blades for thePower Industry,” Mater. Sci. Eng.: A, 437(1), pp. 70–74.
[13] Kar, A., and Mazumder, J., 1998, “One-Dimensional Finite-Medium DiffusionModel for Extended Solid Solution in Laser Cladding of Hf on Nickel,” ActaMetall., 36(3), pp. 701–712.
[14] Hoadley, A. F. A., and Rappaz, M., 1992, “A Thermal Model of Laser Claddingby Powder Injection,” Metall. Trans. B, 23(5), pp. 631–642.
[15] Picasso, M., Marsden, C. F., Wagniere, J. D., Frenk, A., and Rappaz, M., 1994,“A Simple but Realistic Model for Laser Cladding,” Metall. Mater. Trans. B,25(2), pp. 281–291.
[16] Qi, H., and Mazumder, J., 2006, “Numerical Simulation of Heat Transfer andFluid Flow in Coaxial Laser Cladding Process for Direct Metal Deposition,” J.Appl. Phys., 100(2), p. 024903.
[17] Sammons, P. M., Bristow, D. A., and Landers, R. G., 2013, “Height DependentLaser Metal Deposition Process Modeling,” ASME J. Manuf. Sci. Eng., 135(5),p. 054501.
[18] Alemohammad, H., Esmaeili, S., and Toyserkani, E., 2007, “Deposition ofCo–Ti Alloy on Mild Steel Substrate Using Laser Cladding,” Mater. Sci. Eng.:A, 456(1–2), pp. 156–161.
[19] Massalski, T. B., and Okamoto, H., eds., 1990, Binary Alloy Phase Diagrams,2nd ed., ASM International, Materials Park, OH.
[20] Paul, S., Kaunain, A., and Singh, R., 2014, “Residual Stress Modeling of Pow-der Injection Laser Surface Cladding for Die Repair Applications,” ASMEPaper No. MSEC2014-4029.
[21] Paul, S., Singh, R., and Yan, W., 2014, “Thermo-Mechanical Modelling ofLaser Cladding of CPM9V on H13 Tool Steel,” Proceedings of the 5thInternational and 26th All India Manufacturing Technology, Design andResearch Conference (AIMTDR 2014), Guwahati, India, Dec. 12–14, pp.0541–0549.
[22] “Refractive Index,” Accessed Apr. 22, 2014, http://refractiveindex.info/Refractive index database/
[23] Cverna, F., 2005, ASM Ready Reference: Thermal Properties of Metals, ASM,Materials Park, OH.
[24] ASM, 1990, ASM Handbook Volume 2: Properties and Selection: Nonfer-rous Alloys and Special-Purpose Materials, ASM International, Novelty,OH.
[25] Kim, J. D., and Peng, Y., 2000, “Melt Pool Shape and Dilution of LaserCladding With Wire Feeding,” J. Mater. Process. Technol., 104(3), pp.284–293.
[26] Tanner, L. H., 1979, “The Spreading of Silicone Oil Drops on HorizontalSurfaces,” J. Phys. D: Appl. Phys., 12(9), pp. 1473–1484.
[27] de Gennes, P. G., 1985, “Wetting: Statics and Dynamics,” Rev. Mod. Phys.,57(3), pp. 827–863.
[28] Han, X. J., Wang, N., and Wei, B., 2002, “Thermo-Physical Properties ofUnder-Cooled Liquid Cobalt,” Philos. Mag. Lett., 82(8), pp. 451–459.
[29] Yao, W. J., Han, X. J., Chen, M., Wei, B., and Guo, Z. Y., 2002, “Surface Ten-sion of Undercooled Liquid Cobalt,” J. Phys.: Condens. Matter, 14(32), pp.7479–7485.
Journal of Manufacturing Science and Engineering JUNE 2015, Vol. 137 / 031019-13
Downloaded From: http://manufacturingscience.asmedigitalcollection.asme.org/ on 04/05/2015 Terms of Use: http://asme.org/terms