Embed Size (px)
Citation preview
CHARACTERIZATION, ANALYSIS AND SIMULATION OF
FINE COAL FILTRATION
by
Joel Alejandro Mejia
A thesis submitted to the faculty of The University of Utah
in partial fulfillment of the requirements for the degree of
Master of Science
Department of Metallurgical Engineering
The University of Utah
August 2013

Copyright © Joel Alejandro Mejia 2013
All Rights Reserved

The Uni v ers i t y of Utah Graduate School
STATEMENT OF THESIS APPROVAL
The thesis of Joel Alejandro Mejia
has been approved by the following supervisory committee members:
Jan D. Miller Chair June 10, 2013Date Approved
Chen-Luh Lin Member June 10, 2013Date Approved
Raj K. Rajamani Member June 10, 2013Date Approved
and by Jan D. Miller Chair of
the Department of __________________ Metallurgical Engineering
and by Donna M. White, Interim Dean of The Graduate School.
ABSTRACT
Fine coal filtration and dewatering are of great importance to the coal industry
due to the significant impact in the quality, shipping, and handling of clean coal. High
moisture content in the clean coal product reduces its heating value, increases costs, and
reduces the coke yield in the case of metallurgical coal. In this regard, it is of significant
importance to improve our fundamental understanding of water removal from the pore
network structures present in filtration cakes. This thesis research presents the results
obtained from the analysis regarding fluid flow through packed particle beds such as
those occurring during filtration in an effort to expand the studies of particle
characterization and its influence on coal dewatering. The study shows the importance of
high resolution x-ray microtomography (HRXMT) as an important analytical tool for the
three-dimensional study of particle beds.
The multiphase flow and dewatering that occurs during fine coal filtration is
described, and important factors that influence the efficiency of filtration, including the
particle size distribution, pressure drop, shape, and wetting characteristics of the coal
particles are considered. The experiments are designed to simulate the process of coal
filtration using the Lattice-Boltzmann methodology, and identify the conditions that lead
to the improved water removal and moisture reduction. The thesis and research reported

herein demonstrate how HRXMT and the Lattice-Boltzmann Method (LBM) can help in
the short-term prediction and understanding of water removal from the pore network
structures present in coal filtration cakes.
Based on the analysis of HRXMT images, it is shown that the pore network
structure has a significant influence on the retention of water in the filter cake. Narrow
capillaries were found in the filter cakes with hydrophilic particles, while wider
capillaries were mostly found in the filter cakes with hydrophobic particles. In addition,
tests with different pressure drops were performed. Although the pore network structure
analysis showed that the capillaries were narrower at higher initial pressures, the increase
in pressure drop decreased the amount of water retained in the filter cake. The pressure
drop increase helped overcome the capillary forces that retain the water in the filter
cakes.
iv

This project is dedicated to my family whose words of encouragement keep me
going, for their moral support, patience, and understanding. To my professors and
mentors, Dr. Miller and Dr. Lin, for believing in me, for their motivation, and
encouragement to reach my goals.
“Basta un poco de espmtu aventurero para estar siempre satisfechos, pues en esta
vida, gracias a Dios, nada sucede como deseabamos, como suponiamos, ni como
temamos previsto.” - Noel Claraso
“Just a little adventurous spirit is enough to be always satisfied, because in this
life, thank God, nothing happens as we wanted, as we supposed, or as we had planned.” -
Noel Claraso
TABLE OF CONTENTS
ABSTRACT................................................................................................................................ iii
LIST OF TABLES..................................................................................................................vlll
LIST OF FIGURES..................................................................................................................lx
LIST OF SYMBOLS.............................................................................................................. xll
ACKNOWLEDGEMENTS....................................................................................................xv
Chapter
1. INTRODUCTION............................................................................................................ 1
1.1 Review of Literature.................................................................................................... 41.1.1 X-Ray M icrotomography..................................................................................41.1.2 The Lattice-Boltzmann Method (LB M )..........................................................71.1.3 The LBM and Multiphase Sim ulations...........................................................9
1.2 Preliminary Work ..................................................................................................... 111.2.1 Permeability ..................................................................................................... 111.2.2 Capillarity .........................................................................................................131.2.3 Network Simulations ...................................................................................... 15
1.3 Research Objectives .................................................................................................. 21
2. VACUUM FILTRATION............................................................................................. 23
2.1 Vacuum Filtration Equipment ..................................................................................242.1.1 Leaf Test Equipment ....................................................................................... 252.1.2 Leaf Test Procedures....................................................................................... 27
2.2 Coal, Copper Silicate Ore, and Silica Vacuum Filtration Tests ......................... 282.2.1 Particle Size Preparation .................................................................................292.2.2 Density T ests .................................................................................................... 332.2.3 Filtration Tests ................................................................................................. 352.2.4 Test R esu lts ...................................................................................................... 37
2.3 Glass Beads Vacuum Filtration T e s ts .....................................................................392.3.1 Glass Beads Hydrophobization......................................................................402.3.2 Filtration Tests ................................................................................................. 412.3.3 Test R esu lts ...................................................................................................... 41
3. X-RAY MICROTOMOGRAPHY ............................................................................. 45
3.1 High Resolution X-Ray Microtomography (HRXMT)........................................ 463.2 Procedure for HRXMT Image Analysis ................................................................ 48
3.2.1 HRXMT Image Analysis of Coal and Silica ...............................................503.2.2 HRXMT Image Analysis of Hydrophilic Glass B ead s .............................. 533.2.3 HRXMT Image Analysis of Hydrophobic Glass Beads ............................ 56
4. CHARACTERIZATION OF FILTER CAKE STRUCTURE.............................59
4.1 Voxel Counter Analysis.............................................................................................604.2 Medial Axis A nalysis................................................................................................614.3 Pore Network Structures .......................................................................................... 65
5. LATTICE-BOLTZMANN SIMULATIONS............................................................ 68
5.1 The Lattice-Boltzmann Method Equation.............................................................. 685.2 Procedure for LBM and Multiphase Simulation Analysis....................................705.3 LBM and Multiphase Simulations........................................................................... 72
6. CONCLUSION............................................................................................................... 83
APPENDICES
A. SINGLE COMPONENT SINGLE PHASE LBM .......................................................86
B. PHYSICS OF MULTIPHASE FLOW IN POROUS MEDIA.................................. 88
REFERENCES.......................................................................................................................... 93
vii

LIST OF TABLES
Table Page
2.1 Calculated particle size distribution for the copper silicate ore sample................. 30
2.2 Calculated particle size distribution for the coal sam ple......................................... 31
2.3 Calculated particle size distribution for the silica sam ple....................................... 31
2.4 Pycnometer data recorded and calculated density values for coal and copper silicate ore samples........................................................................................................35
2.5 Data collected from the coal, copper silicate ore, and silica vacuum filtration tests .................................................................................................................................38
2.6 Representative filtration test results and data collected from the hydrophilic glass beads tests at different pressures........................................................................42
2.7 Representative filtration test results and data collected from the hydrophobic glass beads te s ts .............................................................................................................44
4.1 Voxel counter and calculated gravimetric results for the water volumepercentage in the filter cakes........................................................................................ 61

LIST OF FIGURES
Figure Page
1.1 Xradia’s High-Resolution X-ray Microtomography (HRXMT), the MicroXMT-400, uses a microfocus x-ray source with 150 kV accelerating voltage................................................................................................................................3
1.2 3D image reconstruction of a packed bed of coal particles (500 x 850 |im )...........7
1.3 3D views of LB simulated flow through a packed bed of coal particles(500 x 850 |im ).............................................................................................................. 12
1.4 Simulations of fluid displacement for increasing differences in pressure controlled by the density at the outlet, which has values from top tobottom: 0.2508, 0.2498, 0.2482, and 0.2466..............................................................14
1.5 Simulations of fluid displacement in a capillary tube with two throats of different radius............................................................................................................... 14
1.6 Lenormand Diagram. (Adapted from Lenormand et al., 1988).............................. 16
1.7 Sequence of simulations of two-phase flow in a packed bed of sandparticles ......................................................................................................................... 18
1.8 Two different simulations for the same density ratio = 3.0 and pressure gradient but different surface tension ......................................................................... 18
1.9 Two different simulations for the same surface tension but inverse densityratio ..................................................................................................................................19
2.1 Schematic of vacuum filtration kit used to perform the filtration te sts ................. 26
2.2 Particle size distribution plot for the copper silicate ore sam ple............................ 32
2.3 Particle size distribution plot for the coal sample..................................................... 32
2.4 Particle size distribution plot for the silica sample................................................... 33
3.1 Three-dimensional (3D) image of a packed particle bed of coal with particlesize of 149 x 250 ^m ..................................................................................................... 47
3.2 Internal features of the Xradia MicroXCT-400.........................................................48
3.3 Representative 3D image reconstructions of the packed bed of coalparticles (149 x 250 |im) with a voxel resolution of 4.63 |im .................................51
3.4 Representative 3D image reconstructions of the packed bed of silica particles (149 x 250 |im) with a voxel resolution of 4.63 |im ................................................. 52
3.5 Representative complete view (left) and cross-sectional (right) 3D image reconstructions of the packed bed of hydrophilic glass beads (200 x 240 |im) tested at an initial vacuum pressure of 15 inHg.........................................................53
3.6 Color-coded reconstructed image of the hydrophilic glass beads filter cake obtained from the filtration tests at an initial vacuum pressure of 15 inHg...........54
3.7 Representative complete view (left) and cross-sectional (right) 3D image reconstructions of the packed bed of hydrophilic glass beads (200 x 240 |im) tested at an initial vacuum pressure of 20 inH g.........................................................55
3.8 Color-coded reconstructed image of the hydrophilic glass beads filter cake obtained from the filtration tests at an initial vacuum pressure of 20 in H g ..........56
3.9 Representative complete view (left) and cross-sectional (right) 3D image reconstructions of the packed bed of hydrophobic glass beads (200 x 240|im) tested at an initial vacuum pressure of 20 inH g................................................57
3.10 Color-coded reconstructed image of the hydrophobic glass beads filter cake obtained from the filtration tests at an initial vacuum pressure of 20 inHg...........58
4.1 Medial axis pore analysis of the coal and silica (149 x 250 |im) filter cakes 63
4.2 Medial axis pore analysis of the hydrophilic glass beads (200 x 240 |im) filter cakes tested at initial vacuum pressure of 20 inHg and 15 inHg, respectively 63
4.3 Medial axis pore analysis of the hydrophilic and hydrophobic glass beads(200 x 240 |im) filter cakes tested at initial vacuum pressure of 20 inH g............65
4.4 Pore network structures of the 1) hydrophilic glass beads filter cake tested at initial vacuum pressure of 15 inHg, 2) hydrophilic glass beads filter cake
x

tested at initial vacuum pressure of 20 inHg, 3) hydrophobic glass bead filter cake, 4) coal filter cake, and 5) silica filter cake ..................................................... 67
5.1 Subset of the 3D image reconstructions of the coal and silica filter cakes with particle sizes of 149 x 250 microns and a voxel resolution of 4.63 ^mused for 3D LBM simulations...................................................................................... 74
5.2 Results of LBM simulations of multiphase flow through a packed bed of coal filter cakes with particle size of 149 x 250 ^m and image size of254 x 254 x 236 voxels................................................................................................. 75
5.3 Results of LBM simulations of multiphase flow through a packed bed of silica filter cakes with particle size of 149 x 250 ^m and image size of254 x 254 x 236 voxels................................................................................................. 76
5.4 Surface of the penetration of fluid front is extracted at 80,000 iterations during LB simulation for coal filter cake with particle size 149x250 ^mand image size of 254 x 254 x 236 voxels................................................................. 78
5.5 Surface of the penetration of fluid front is extracted at 40,000 iterations during LB simulation for silica filter cake with particle size 149x250 ^mand image size of 254 x 254 x 236 voxels................................................................. 79
5.6 Sequence of simulations of two-phase flow in a packed bed of hydrophilicglass beads particles (200 x 240 |im ).......................................................................... 80
5.7 Sequence of simulations of two-phase flow in a packed bed of silica sand particles (particle size 150 x 212 ^m )........................................................................82
B.1 Forces acting on the elementary surface around a point of a curved interfacebetween two immiscible fluids at static equilibrium.................................................90
B.2 Static equilibrium between the three interfacial tensions at the solid surface 91
B.3 Typical capillary pressure curve.................................................................................. 92
xi

LIST OF SYMBOLS
A Cross-sectional area
Bo Bond number
Cd Drag coefficient
Ca Capillary number
D Dimensions of the system
Dp Density parameter used to define contact angle in He model
DdQq Lattice model with d dimensions and q vector velocities
dP/dx Pressure gradient along the x-direction
f Particle distribution function in the direction i of the lattice
f N Particle distribution function with N number of particles
g Gravity
inHg Inches of mercury
k Permeability constant
k Surface tension constant parameter in He model
L Length
lu Lattice units
I Thickness of porous media
M Viscosity ratio
N Number of particles in the distribution function
P* Pore entry pressure
p Fluid pressure
p nw Pressure of the nonwetting fluid
p w Pressure of the wetting fluid
Pc Capillary pressure
Q Volume flow rate
R Radius
Re Reynolds number
r* Radii of curvature
Sw Saturation of the wetting fluid phase
S0w Irreducible wetting fluid saturation
Snw0 Residual nonwetting saturation
U Fluid velocity
u Macroscopic velocity
V Volume of the fluid
vw Characteristic velocity of the wetting fluid
V Unit cell volume
J p Pressure difference
xBody Body force applied in the x-direction
V Interfacial tension
Yig Interfacial tension between liquid and gas phase
xiii

fsg Interfacial tension between solid and gas phase
Ysi Interfacial tension between solid and liquid phase
M Dynamic viscosity of the fluid
Mw Dynamic viscosity of the wetting fluid
Mnw Dynamic viscosity of the nonwetting fluid
v Kinetic fluid viscosity
P Density of the fluid
Pi Density of the liquid
Pg Density of the gas
pw Density of the wetting fluid
p nw Density of the nonwetting fluid
T Relaxation time
Q Collision integral
xiv

ACKNOWLEDGEMENTS
I would like to thank the Center for Advanced Separation Technologies (CAST)
for their financial and technical support. I would also like to express my deepest gratitude
to my advisor, Dr. Jan D. Miller, and my co-advisor, Dr. Chen-Luh Lin, for their
excellent guidance, patience, and for providing me with the tools for doing research.
My sincere thanks also goes to David Lee, Senior Process Engineer at FLSmidth,
and all engineers and managers at FLSmidth’s Mineral Technology Center in Salt Lake
City for their contributions and involvement in the fine coal filtration project.
Also, I would like to thank Dr. Francisco Medina for being a good friend during
this journey. Thank you for helping me and encouraging me. My research would not have
been possible without your help.
Finally, I would like to thank my best friend Daniela Soltero. When we first
talked to each other I knew we would always be friends. You have always been there
cheering me up through the good and the bad times. This is my way of saying thanks.

CHAPTER 1
INTRODUCTION
Fine coal filtration and dewatering are of great importance to the coal industry
due to its significant impact on the quality, shipping and handling of the coal product.
Filtration of fine coal involves filter cake formation and removal of surface moisture by
drawing air through the porous structure. An accurate assessment of the transport
properties in porous media is of major importance in the development of improved
filtration processes (Leonard & Hardinge 1991; Wakeman, & Tarleton 2005; Tien 2006).
Currently, there is limited understanding of the fundamental phenomena involved at the
pore scale level which controls the average behavior of the filtration process.
There are several factors that affect the final moisture content of a coal filter cake,
including cake thickness, pressure drop across the cake, drying time, viscosity of the
liquid, surface tension of the liquid, filter media, particle size distribution, permeability of
the cake, specific gravity of dry solids, inherent moisture of dry solids, type of filter and
construction, and volume of air or gas pulled through the cake per unit of time per unit
area, among others (Leonard & Hardinge, 1991). Other factors may include particle
shape and wetting characteristics (Asmatulu & Yoon, 2012; Yoon et al., 2006).
Understanding each factor and their relationship is necessary to define the optimal
conditions for coal dewatering during the filtration process.

However, such a task is complicated and overwhelming since it entails a large
group of variables, including the complexity of the pore geometry, which is often tedious
to determine experimentally. The approach currently used involves a series of simplified
assumptions in order to obtain a mathematical relationship between a small group of
variables, making the decision and design process simpler. Nonetheless, there is no linear
or nonlinear rule for a combination of the effective physical properties from the
microscopic scale that can be used to predict the macroscopic scale properties. The lack
of fundamental understanding at the pore scale level during the coal filtration process
limits the ability to predict and resolve common operational problems such as cake
cracking and moisture retention. In this regard, it is important to introduce appropriate
experimental techniques and theoretical models to describe in detail at the pore scale
level the flow occurring through a packed bed of coal particles during filtration.
Understanding the fundamental parameters involved in the filtration process is
essential in order to improve the water removal and define the condition for minimum
cake moisture content. To gain better understanding of the complex transport phenomena
that occur in the porous media, the effect of three-dimensional pore geometry on the
effective transport properties of the filter cake is in progress. X-ray microtomography is
being used for the characterization of the complex three-dimensional pore geometry by
direct digitalization of the real pore network structure of the coal cake. The system,
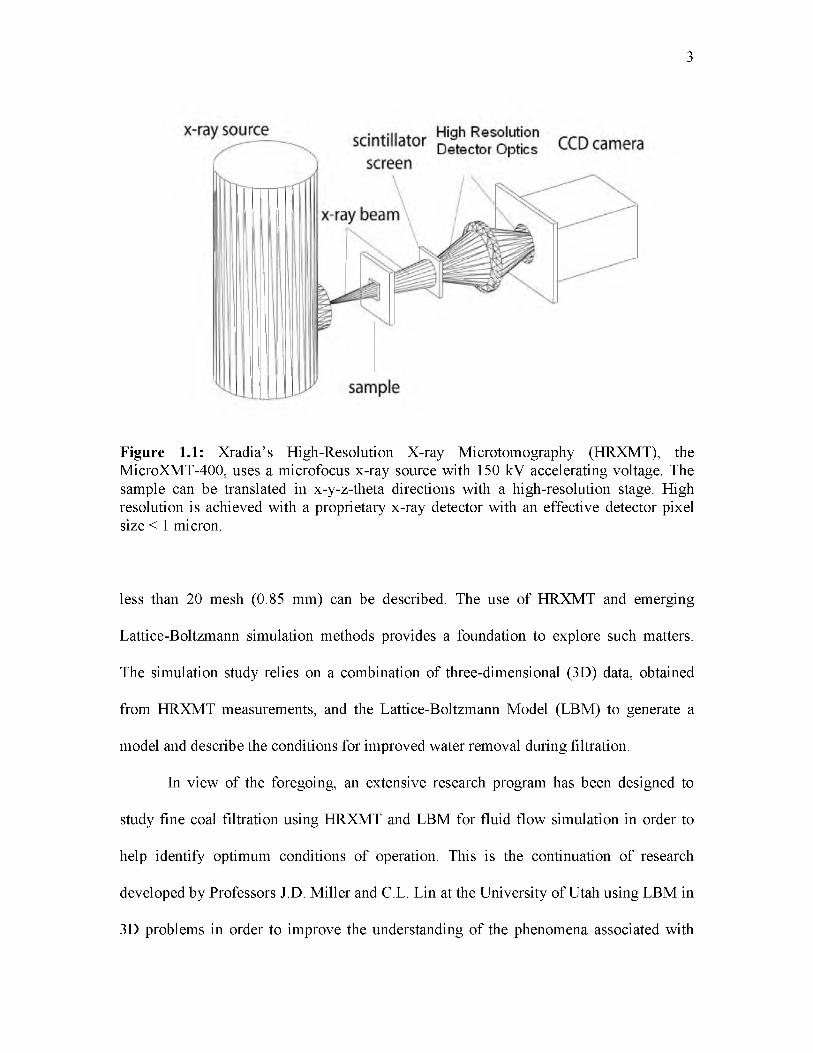
shown in Figure 1.1, is the high resolution x-ray microtomography (HRXMT) from
Xradia (2009), which employs an x-ray detector with submicron resolution combined
with a microfocus x-ray source. In this way, with a voxel resolution of about 1 micron,
the real pore network structure of the coal cake composed of coal particles with a size
2
3
Figure 1.1: Xradia’s High-Resolution X-ray Microtomography (HRXMT), the MicroXMT-400, uses a microfocus x-ray source with 150 kV accelerating voltage. The sample can be translated in x-y-z-theta directions with a high-resolution stage. High resolution is achieved with a proprietary x-ray detector with an effective detector pixel size < 1 micron.
less than 20 mesh (0.85 mm) can be described. The use of HRXMT and emerging
Lattice-Boltzmann simulation methods provides a foundation to explore such matters.
The simulation study relies on a combination of three-dimensional (3D) data, obtained
from HRXMT measurements, and the Lattice-Boltzmann Model (LBM) to generate a
model and describe the conditions for improved water removal during filtration.
In view of the foregoing, an extensive research program has been designed to
study fine coal filtration using HRXMT and LBM for fluid flow simulation in order to
help identify optimum conditions of operation. This is the continuation of research
developed by Professors J.D. Miller and C.L. Lin at the University of Utah using LBM in
3D problems in order to improve the understanding of the phenomena associated with
fluid flow in packed particle beds (Lin et al., 2010). This thesis includes results from a set
of lab experiments under controlled and reproducible conditions that have been carried
out to evaluate the simulation results, and to verify the application of this emerging
technology in the study and analysis of filtration processes.
1.1 Review of Literature
The combination of x-ray microtomography and fluid dynamics modeling can be
of great relevance in mineral processing, and in particular in dewatering processes. X-ray
microtomography has the capabilities of characterizing the complex geometry of the pore
network structure created in the filter cake after filtration. On the other hand, LBM can be
used to model the flow of multiphase fluid mixtures through very complicated
geometries. Both techniques can provide a graphic representation of multiphase
simulations and help determine the conditions to improve water removal during filtration
operations. The 3D porous structures captured by HRXMT analysis are coupled with the
LBM to simulate and to establish a fundamental relationship between pore microstructure
and filtration operation variables.
1.1.1 X-Ray Microtomography
X-ray tomographic imaging is, in general terms, an x-ray-based method by which
radiation of an opaque sample in different directions allows for its 3D reconstruction (Lin
et al., 2010). The development of this noninvasive technique is recent but it has had a
huge impact in several areas of science. In fact, the first device capable of producing true
reconstructed images was developed by G. N. Hounsfield in 1972 at EMI in England
4

called Mark I (Isherwood, 2004). This prototype was based, in part, on mathematical
methods developed by A. M. Cormack (1977) a decade earlier.
The mechanics of x-ray tomography testing is relatively simple. The sample is
located between the x-ray source and the detector (Figure 1.1). Then the sample is
illuminated in different directions, and for each direction the projection of the attenuation
coefficients is measured. When the x-rays interact with the solids in the sample, the
photons may be absorbed, scattered, diffracted, refracted, or simply transmitted through
the medium. As the x-rays pass through the solid particles, the x-rays are attenuated, or
weakened, following the Lambert-Beer’s law (Wildenschild & Sheppard, 2013). When
the attenuation values are high, the x-ray beam is highly “attenuated,” or weakened, as it
passes through highly dense materials. On the other hand, when the material is relatively
less dense, low attenuation numbers are produced indicating that the material is
practically transparent to the beam.
Therefore, it is assumed that those voxels with minimum attenuation values are
the voxels where void spaces are present due to the absence of highly dense particles.
These attenuation coefficients also depend on the beam density, bulk density of the
material, atomic electron density (Wildenschild & Sheppard, 2013). In order to obtain an
accurate description of the material it is necessary to have sufficient variation in the
attenuation coefficients. Because of this, the object or sample must be rotated so that
different radiographic projections can be collected at different angles, obtain a full
distribution of attenuation coefficients, and finally back-calculate those coefficients to
reconstruct the image (Wildenschild & Sheppard, 2013).
5

The reconstruction of the samples is based on a mathematical formalism known as
the Radon transform and its mathematical framework. After processing, the x-ray
computed tomography produces a spatial description of the object under analysis where
the field of view is divided in elemental digital units known as voxels. The voxel, or
volumetric pixel, is a volume element representing a value in a three-dimensional space
(Novelline, 1997). Each voxel is characterized by the attenuation coefficient of the
material of which it is composed. This spatial digital characterization of the sample under
analysis allows for further digital processing of the sample.
Figure 1.2 shows a packed bed of coal particles and its porous network structure
as obtained by the HRXMT system at the University of Utah (Lin et al., 2010). The
particle size is 500 x 850 ^m, the resolution of each voxel is 5.62 ^m in length, and the
size of the image is 400 x 400 x 800 voxels. It is possible to observe how image
processing of the digital data allows for a clear separation between the solid and the air of
the pore network structure due to the distinct difference in attenuation coefficients. This
technique easily obtains the porous network of the packed particle bed. Obtaining these
images is of great importance in order to simulate fluid flow through the porous network
formed by the void space created within the packed bed of particles. During simulation
the fluid flows through this network structure having a specific connectivity with well-
defined pore dimensions not only to determine the local flow but also the overall
permeability of the sample. However, due to the complex geometry of the network
structure, it is important to consider LBM simulations since this method has the ability to
compensate for complex boundaries of arbitrary geometries.
6

7
Figure 1.2: 3D image reconstruction of a packed bed of coal particles (500 x 850 |im). The voxel resolution is 5.62 |im and the image size is 400 x 400 x 800 voxels. (A) shows the cutoff view of the CT reconstructed packed particle bed, (B) shows the complete CT reconstructed packed particle bed, and (C) shows the pore network structure.
1.1.2 The Lattice-Boltzmann Method (LBM)
LBM evolved from the original lattice gas cellular automata model (LGCA), in
which space, time, and particle velocities in the simulation are all discrete. This means
that the model excludes continuously varying quantities and related notions, and includes
objects that have distinct, separated values (Sukop & Thorne, 2006). In the LGCA model,
the space was discretized in a regular arrangement on a lattice and a set of Boolean
variables (having one of two values: true or false) (Frish et al., 1986). Within the lattice,
each algorithmic entity occupies a position and describes the population of particles at
each node and its interaction (described as molecular direction) with its identical
neighbors (Rothman & Zaleski, 1997). However, the use of different, irregular, lattice
geometries led to the development of the LBM since the LGCA showed some difficulties
related to the lack of Galilean invariance, anomalous velocity dependency of the fluid
pressure and statistical noise when using irregular geometries (Succi, 2001). It was
discovered that instead of using a discrete particle, a density distribution could be
beneficial since it eliminated the noisiness and allowed for a more general collision
operator.
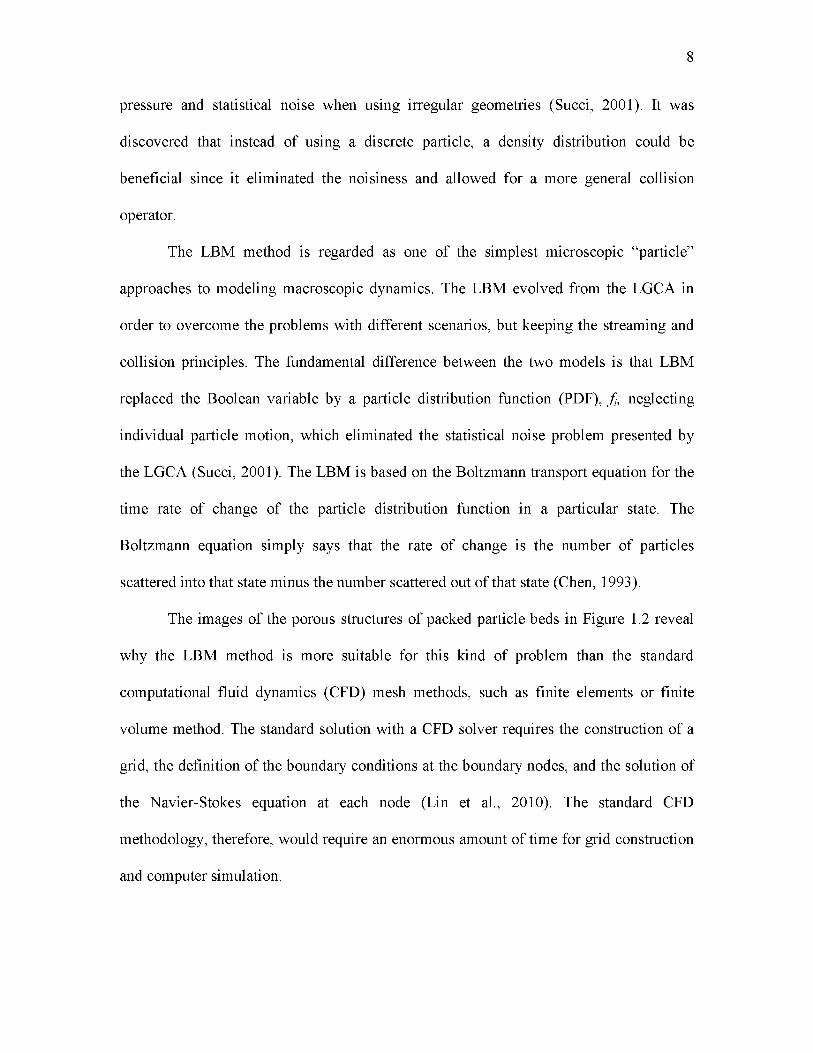
The LBM method is regarded as one of the simplest microscopic “particle”
approaches to modeling macroscopic dynamics. The LBM evolved from the LGCA in
order to overcome the problems with different scenarios, but keeping the streaming and
collision principles. The fundamental difference between the two models is that LBM
replaced the Boolean variable by a particle distribution function (PDF), f neglecting
individual particle motion, which eliminated the statistical noise problem presented by
the LGCA (Succi, 2001). The LBM is based on the Boltzmann transport equation for the
time rate of change of the particle distribution function in a particular state. The
Boltzmann equation simply says that the rate of change is the number of particles
scattered into that state minus the number scattered out of that state (Chen, 1993).
The images of the porous structures of packed particle beds in Figure 1.2 reveal
why the LBM method is more suitable for this kind of problem than the standard
computational fluid dynamics (CFD) mesh methods, such as finite elements or finite
volume method. The standard solution with a CFD solver requires the construction of a
grid, the definition of the boundary conditions at the boundary nodes, and the solution of
the Navier-Stokes equation at each node (Lin et al., 2010). The standard CFD
methodology, therefore, would require an enormous amount of time for grid construction
and computer simulation.
8
1.1.3 The LBM and Multiphase Simulations
The classical approach (Tiller, 1975; Dahlstrom and Silverblatt, 1977;
Svarosvsky, 1990) for filtration analysis is based on Darcy’s law, an empirical equation
that describes one-dimensional fluid flow through uniform incompressible porous media.
Knowledge of cake pore microstructure and its correlation to macroscopic cake
properties is required to model the filtration from a fundamental point of view. The single
component, single phase Lattice-Boltzmann (LB) model has been used as a common tool
to study transport phenomena through pore space (Lin & Miller, 2004 and cited
references; Videla, Lin & Miller, 2007). Moreover, the LBM is a class of computational
fluid dynamics (CFD) used to model the flow of multiphase fluid mixtures through very
complicated geometries. The LB is increasingly attracting researchers in many areas from
turbulence flow to multiphase flow in porous media. Appendix A describes the
permeability derived for the LBM in a single component single-phase simulation, which
is the foundation for multiphase LBM simulations.
In order to improve the water removal and define the condition for minimum cake
moisture content, a multiphase LB fluid flow model is required to investigate the flow
through the porous media. Several Lattice-Boltzmann multiphase fluid flow models have
been introduced in the past years finding applications in different areas of fluid dynamics
such as phase separation (Rothman & Zaleski, 1991), and fingering phenomena in a
channel (Kang et al., 2004) among others. The major advantage claimed for pursuing the
use of LBM instead of standard CFD methods resides in its ability to model complex
solid boundaries in any arbitrary geometry, a scheme suitable for code parallelization and
9
ability to incorporate microscopic force interactions that control the interface dynamics
(Lin et al., 2010).
In general, the LBMs for multiphase flow can be described as single component
or multicomponent models. Single component models describe phase separation by an
equation of state that under the critical temperature automatically segregates phases into
two stable densities, vapor (light density) and liquid (heavy density). In this category we
found the single component Shan and Chen model (1993), single component free-energy
model, and the He-Shan-Doolen model (1998) to be of interest. On the other hand,
multicomponent models use one particle distribution function (PDF) and one evolution
equation to represent each fluid component in the system and segregation is simulated by
interaction between the two independent fluids. For further discussion and comparison of
these methods the reader is referred to the work done by Chen and Doolen (1998) and He
and Doolen (2002).
In his seminal work, He et al. (1999) presents a new multiphase model derived
directly from discretizing the continuous kinetic equation for non-ideal fluids modified
for incompressible flow. As mentioned previously, the He-Chen-Zhang (1999) model is
an extension of the He-Shan-Doolen model (1998). The model has not been used
extensively and is not as popular as the Shan and Chen model. Videla (2009) has applied
the model to 2D and 3D Rayleigh-Taylor instability simulations (He et al., 1999; Zhang
et al., 2000) and compared the data with theoretical values and results from another CFD
simulation showing good qualitative and quantitative agreement.
Unlike the traditional CFD methods that resolve the macroscopic governing
equations using a free boundary surface approximation, the He-Chen-Zhang model
10
(1999) simulates the interfacial dynamics, such as phase segregation and surface tension,
from mesoscopic kinetic equations. In this model the interfacial dynamics are the result
of molecular interactions where two distributions functions are used, one for tracking the
pressure and velocity, and another for tracking only the density. When the molecular
attraction is strong enough, the fluid automatically segregates into two different phases.
One of the major advantages with respect to the Shan and Chen model (1993) is that the
surface tension in the He model can be adjusted beforehand as a free parameter due to its
thermodynamic consistency. Appendix B illustrates the derivation of the physics of
multiphase flow in porous media using single component multiphase LBM for this study.
1.2 Preliminary Work
Some preliminary exploratory work was done using HXRMT and the LBM. The
LBM allows for the quantitative description of fluid flow through a porous network
structure in a packed bed of particles (Lin et al., 2010). The solid-fluid interaction can be
simulated when the pore network structure is provided from the HRXMT data. The
following paragraphs describe preliminary work performed using the principles of
HRXMT and LBM.
1.2.1 Permeability
In a previous study, a team of researchers at the University of Utah performed
different experiments to determine the permeability through a packed bed of particles
using HRXMT and Lattice-Boltzmann simulations (Lin et al, 2010). From the 3D
reconstructed HRXMT image shown in Figure 1.2, the pore structure for the packed bed
11
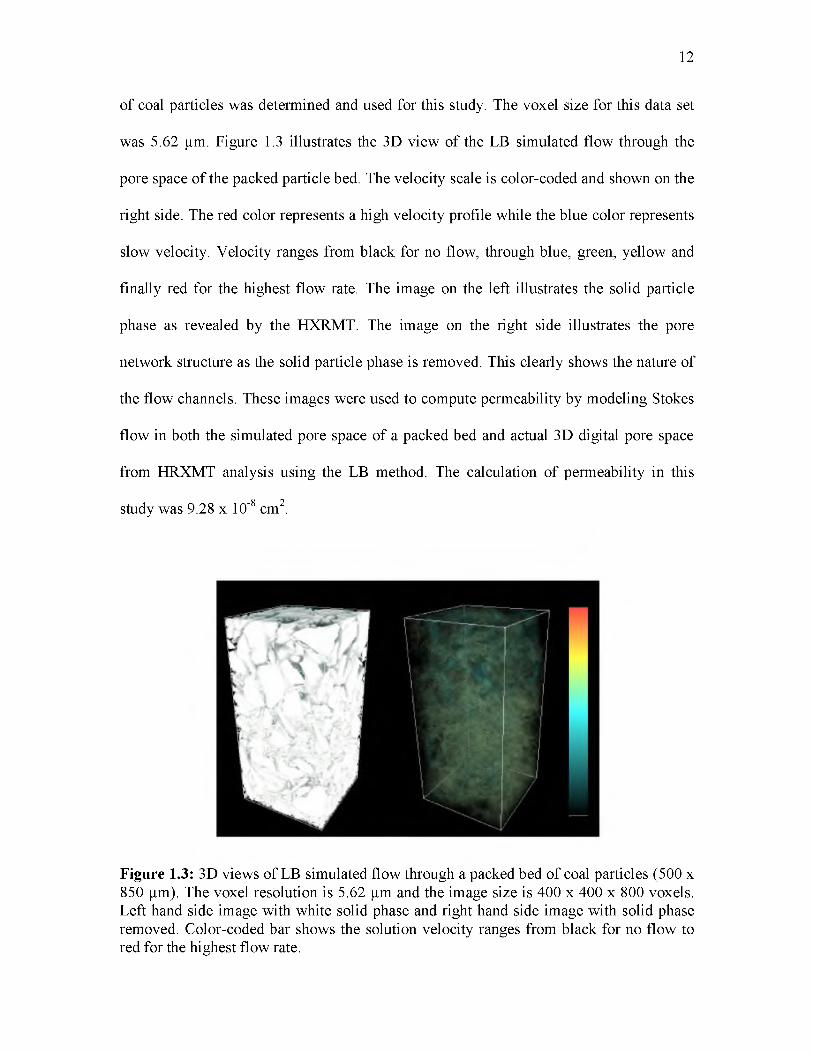
of coal particles was determined and used for this study. The voxel size for this data set
was 5.62 |im. Figure 1.3 illustrates the 3D view of the LB simulated flow through the
pore space of the packed particle bed. The velocity scale is color-coded and shown on the
right side. The red color represents a high velocity profile while the blue color represents
slow velocity. Velocity ranges from black for no flow, through blue, green, yellow and
finally red for the highest flow rate. The image on the left illustrates the solid particle
phase as revealed by the HXRMT. The image on the right side illustrates the pore
network structure as the solid particle phase is removed. This clearly shows the nature of
the flow channels. These images were used to compute permeability by modeling Stokes
flow in both the simulated pore space of a packed bed and actual 3D digital pore space
from HRXMT analysis using the LB method. The calculation of permeability in this
study was 9.28 x 10⁻⁸ cm2.
12
Figure 1.3: 3D views of LB simulated flow through a packed bed of coal particles (500 x 850 |im). The voxel resolution is 5.62 |im and the image size is 400 x 400 x 800 voxels. Left hand side image with white solid phase and right hand side image with solid phase removed. Color-coded bar shows the solution velocity ranges from black for no flow to red for the highest flow rate.
1.2.2 Capillarity
The solid-fluid interaction explained before can be extended to the analysis and
simulation of two-phase flow in complex porous structures. The two-phase flow refers to
the combination of liquid and gaseous phases involved in the simulation. To show this
phenomenon, the behavior of the LBM in simple capillary tubes is illustrated below.
In a capillary tube, there is fluid displacement when the flow is driven by a
difference in pressure strong enough to overcome the capillary pressure. Figure 1.4 shows
LBM simulated results for capillary tubes where the nonwetting fluid displaces the
wetting fluid, also known as drainage process. The figure, from left to right, shows the
nonwetting fluid as it displaces the wetting fluid. This two-phase interaction simulation
was performed at different driving pressures. The LBM simulation was carried out using
a D2Q9 model, which is a 2-dimensional model that contains 8 velocities and 1 rest
particle (Sukop & Thorne, 2006). It is the simplest model that can be implemented on the
concepts of single component, single-phase model. In this case, the size of the lattice was
35 x 130 squared lattice units (lu ).
The previous example shows a simple D2Q9 simulation regarding only one
capillary tube. However, the capillary phenomenon of interest involving the network
microstructure of the filter cake requires two or more capillary tubes (throats) to be
present. Moreover, these capillary tubes must be of different sizes in order to
appropriately represent the network structure in the packed bed of particles. The D2Q9
simulation illustrates in Figure 1.5 shows the simplest case of two-phase flow of two
pores of different diameters under the same pressure difference.
13

14
>E
Figure 1.4: Simulations of fluid displacement for increasing difference in pressure controlled by the density at the outlet, which has values from top to bottom: 0.2508, 0.2498, 0.2482, and 0.2466. D2Q9 lattice of size 35 x 130 lu2. Parameters for simulations are k = 0.1, Dp = 0.99, and pt/p g = 10 .
Figure 1.5. Simulations of fluid displacement in a capillary tube with two throats of different radius. From left to right and top to bottom image: flow after 1,000, 10,000, 20,000, and 30,000 iterations. D2Q9 lattice of size 35 x 130 lu2. Parameters for simulations are k = 0.1, Dp = 0.99, and ptjp g = 10 .
In order to simulate the differences in diameter of the capillary tubes, a new
simulation with different throat sizes was performed using a modified He-Chen-Zhang
model. As Figure 1.5 shows, one of the throats is six times smaller than the other and,
therefore, has a six times higher entry pressure. The pressure across the phases in the
simulation has been set in such a way that the value is higher for the entry pressure at the
bigger diameter throat, but smaller than the entry pressure for the smaller diameter throat.
In Figure 1.5 it is possible to observe the preferential flow that is developed by the
meniscus, which invades the channel with the higher throat radius having a smaller flow
resistance. In conclusion, it is evident that this modified He-Chen-Zhang model has good
qualitative agreement with theory for two-phase flow in porous media (Videla, 2009).
Therefore, it can be applied to a porous network structure such as the one formed by a
packed bed of particles.
1.2.3 Network Simulations
Lenormand et al. (1988) ran numerous network simulations and experiments
performed in transparent etched networks to identify patterns and describe percolation of
a non-wetting fluid when injected into a medium saturated with a wetting fluid (Videla,
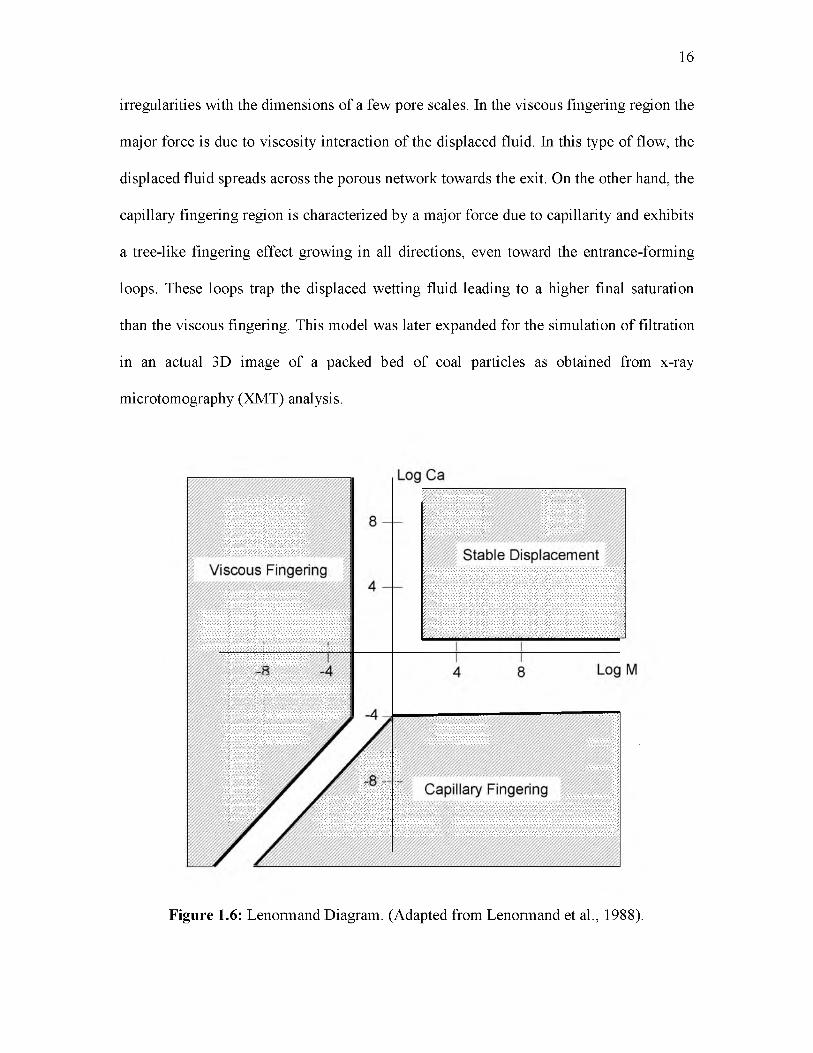
2009; Lin et al., 2010). As an outcome of his research, he proposed a phase diagram for
immiscible displacement characterized by the capillary number (Ca) and the viscosity
ratio (M) as shown in Figure 1.6. The diagram shows the existence of three basic domains
for fluid penetration: stable displacement, viscous fingering, and capillary fingering. In
the stable displacement region, the major force is due to viscosity interaction of the
injected fluid. The flow shows a flat front moving towards the exit with some
15
16
irregularities with the dimensions of a few pore scales. In the viscous fingering region the
major force is due to viscosity interaction of the displaced fluid. In this type of flow, the
displaced fluid spreads across the porous network towards the exit. On the other hand, the
capillary fingering region is characterized by a major force due to capillarity and exhibits
a tree-like fingering effect growing in all directions, even toward the entrance-forming
loops. These loops trap the displaced wetting fluid leading to a higher final saturation
than the viscous fingering. This model was later expanded for the simulation of filtration
in an actual 3D image of a packed bed of coal particles as obtained from x-ray
microtomography (XMT) analysis.
Figure 1.6: Lenormand Diagram. (Adapted from Lenormand et al., 1988).
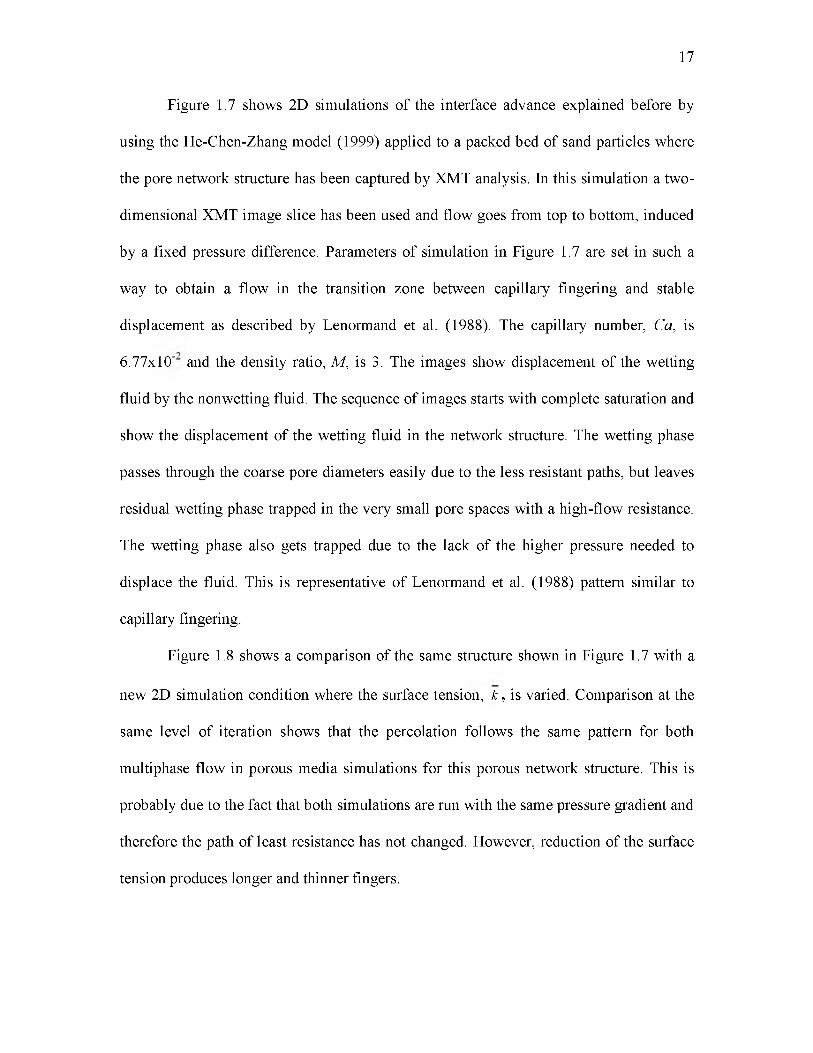
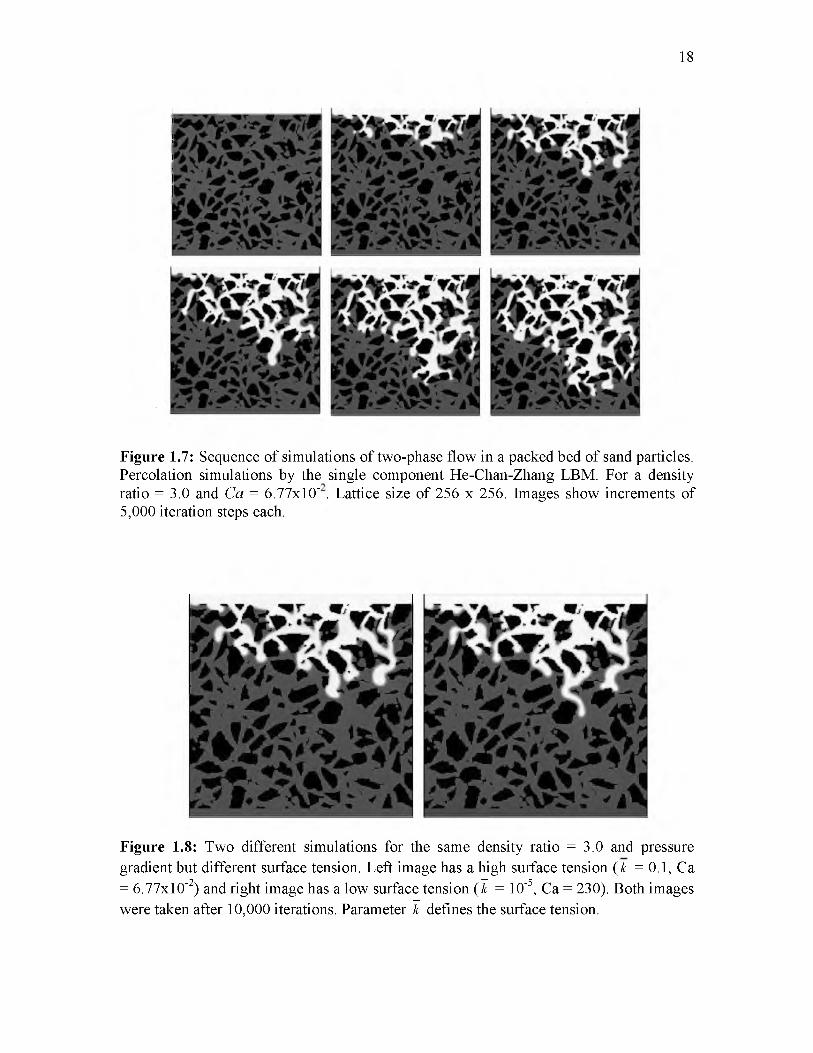
Figure 1.7 shows 2D simulations of the interface advance explained before by
using the He-Chen-Zhang model (1999) applied to a packed bed of sand particles where
the pore network structure has been captured by XMT analysis. In this simulation a two
dimensional XMT image slice has been used and flow goes from top to bottom, induced
by a fixed pressure difference. Parameters of simulation in Figure 1.7 are set in such a
way to obtain a flow in the transition zone between capillary fingering and stable
displacement as described by Lenormand et al. (1988). The capillary number, Ca, is
6.77x10- and the density ratio, M, is 3. The images show displacement of the wetting
fluid by the nonwetting fluid. The sequence of images starts with complete saturation and
show the displacement of the wetting fluid in the network structure. The wetting phase
passes through the coarse pore diameters easily due to the less resistant paths, but leaves
residual wetting phase trapped in the very small pore spaces with a high-flow resistance.
The wetting phase also gets trapped due to the lack of the higher pressure needed to
displace the fluid. This is representative of Lenormand et al. (1988) pattern similar to
capillary fingering.
Figure 1.8 shows a comparison of the same structure shown in Figure 1.7 with a
new 2D simulation condition where the surface tension, k , is varied. Comparison at the
same level of iteration shows that the percolation follows the same pattern for both
multiphase flow in porous media simulations for this porous network structure. This is
probably due to the fact that both simulations are run with the same pressure gradient and
therefore the path of least resistance has not changed. However, reduction of the surface
tension produces longer and thinner fingers.
17
18
Figure 1.7: Sequence of simulations of two-phase flow in a packed bed of sand particles. Percolation simulations by the single component He-Chan-Zhang LBM. For a density ratio = 3.0 and Ca = 6.77x10- . Lattice size of 256 x 256. Images show increments of 5,000 iteration steps each.
Figure 1.8: Two different simulations for the same density ratio = 3.0 and pressuregradient but different surface tension. Left image has a high surface tension ( k = 0.1, Ca
2 . . — ̂ .= 6.77x10- ) and right image has a low surface tension ( k = 10- , Ca = 230). Both imageswere taken after 10,000 iterations. Parameter k defines the surface tension.

Figure 1.9 shows another comparison between the 2D simulations in Figure 1.8
for a simulation where the density ratio has been inverted. The image on the left shows
the control simulation and the image to the right shows the experimental condition. In
this new case, the low-density fluid displaces the heavier fluid and the pattern of flow
changes since the pressure field has changed. According to the Lenormand diagram
(Figure 1.6), a stronger viscous fingering type of flow is expected with more and longer
fingers being formed due to the stronger viscous interaction and interface front
instability. As the comparison shows, fingering is formed in zones of low resistance to
flow and once formed they start growing rapidly towards the exit. In conclusion,
application of the single component multiphase flow LBM known as the He-Chen-Zhang
model (1999), coupled with XMT analysis to define the complex pore geometry, allows
for simulation of flow in porous media.
19
Figure 1.9: Two different simulations for the same surface tension but inverse density9
ratio. Left image has a density ratio = 3/1 and Ca = 6.77x10- . Right image has a density ratio = 1/3 and Ca = 1.32x10⁻¹. Both images were taken after 10,000 iterations.

The model is used for simulation of fluid penetration into porous samples and the
analysis of capillary phenomena. The use of the LBM is not only for velocity profiles or
flow simulations of single components as showed before. The LBM can also be used for
multicomponent, multiphase situations. For these simulations, the LBM algorithm is
changed a little and a new index relevant to the arrays of the lattice and new loops for the
two components is introduced (Lin et al., 2010). The multicomponent simulations have
been of great importance for industry for the past few years. They are, for example, of
significant importance for the oil industry because petroleum is often found with water.
Another important example is that of filtration processes in the mineral processing
industry. In this case, the interaction between air and water is studied and simulated and
its numbers are applied to the filtration process.
In order to gain a better understanding of the complex transport phenomena that
occur in a microscopic scale, the study of the LBM is necessary. The LBM showed that it
effectively integrates different equations and parameters to simulate the fluid flow in
complex and regular geometries. Different examples were presented and proved to be an
excellent tool for the investigation of fluid flow. The implementation of these simulations
showed that changing different parameters changes the behavior of the fluid. These
results are comparable to experimental data that have been already gathered. The LBM is
so diverse and can be applied to different areas of research and it is, indeed, a tool that
makes a lot of processes very economical since the simulation mimics the actual process.
It was demonstrated that simulation results from the LBM are in good quantitative
agreement with experimental results. The LBM can be considered to be an efficient
numerical method for computational fluid dynamics, and a powerful tool for modeling
20

21
new physical phenomena that are not easily described by macroscopic equations (Chen,
1998).
1.3 Research Objectives
High resolution x-ray microtomography (HRXMT) has the advantages of creating
more powerful venues for the 3D characterization of pore network structures in different
filtration cakes. Fine coal filtration and dewatering are of great importance to the coal
industry and it is important to improve our understanding of water removal from filter
cakes. Using HRXMT, with a voxel resolution of less than 1 micron, particles as small as
5 microns can be distinguished and described. Moreover, it is a practical and advanced
tool that would help model the pore network structure of the filter cake.
In order to gain a better understanding of the complex transport phenomena that
occur in a filter cake, a comprehensive study in the effects of three-dimensional pore
geometry on the effective transport properties of the filter cake is necessary. HRXMT and
LBM can be used together to predict and understand water removal from the pore
network structures present in coal filtration cakes. The following have been identified as
the research objectives: (1) HRXMT analysis of coal, silica, and glass beads particle beds
to evaluate the effects of particle properties and pore microstructure on the phenomena
associated with fluid flow in coal particle beds; (2) analyze the pore microstructure to
determine porosity, specific surface area, porous connectivity, shape, wettability, pore
size distribution and homogeneity of the packed bed; and (3) perform fluid flow
simulations using the LBM under current operative conditions practiced by industry.
Regarding particle properties, particle shape and wettability will be analyzed to
determine their influence on the dewatering process. Pore network structures from
images of the particle beds will play an important role in determining how macroscopic
and microscopic characteristics influence water retention during filtration. In addition,
the application of single component multiphase flow for LB simulation of dewatering
will establish parameters and conditions that will lead to improved water removal and
minimum cake moisture content.
Finally, in order to evaluate the actual potential of the LBM to simulate real
multiphase problems, a comparison between experimental data and simulation results
will be performed with the intent of describing conditions that will lead to improved
water removal and minimum cake moisture content. O f course this is a challenging
problem because of the complexity of the physical phenomena involved and the size of
the computing resources required.
22

CHAPTER 2
VACUUM FILTRATION
As has been pointed out by Leonard and Hardinge (1991), there are several factors
that affect the final moisture content of coal filter cake. Among them we have the cake
thickness, pressure drop across the cake, drying time, volume of air or gas pulled through
the cake per unit of time per unit area, viscosity of liquid, surface tension of liquid, filter
media, size distribution of solids, permeability of cake, specific gravity of dry solids,
inherent moisture of dry solids, surface properties of solids, type of filter and
construction, homogeneity of cake formation, temperature of solids and gas, and
interfacial tension of solids, liquids and gas. O f course, a total understanding of each
factor and their relationships will enable us to define conditions for minimum cake
moisture content. However, such a task is overwhelming.
Currently, the methods of analysis utilize macroscopic known variables to obtain
different mathematical relationships between variables that can later be used in the
dewatering decision-making process. The physical laws that govern the fluid flow
through a packed bed of particles during filtration are well-known. Nonetheless, the
complex geometry of the pore network structure makes it very difficult to determine the
relationships between variables at the microscopic level.

There is a need for fundamental filtration research since coal filtration is of great
importance to the coal industry, and residual moisture in the final product is a constant
problem (Ennis et al., 1994; Tien, 2006; Wakeman & Tarleton, 2005). The classical
filtration approach relates the average flow rate through the coal cake with the difference
in pressure and the resistance of the medium and cake itself. But in general, there is no
linear or nonlinear rule for combination of the effective physical properties from the
microscopic scale, which can be used to predict the macroscopic scale properties. This
means that there are no current methods used to predict the variables that would result in
minimum cake moisture and volume percentage of water retained in the cake after
filtration.
This lack of fundamental understanding at the microscopic level during coal
filtration process limits our ability to predict and resolve common operational problems
such as cake cracking, water, and moisture retention. In this regard, it is essential to
introduce appropriate experimental techniques and theoretical models to describe in detail
the flow, which occurs at the pore scale level through a packed bed of coal particles
during filtration.
2.1 Vacuum Filtration Equipment
In order to understand how various types of filters operate, one must look at the
basic functions involved. In its most simplistic form, a filter provides mechanical support
for a filter septum or media, a means for discharging the solids, which collect on the
surface of the septum, drainage passages for removing the filtrate and gas, which pass
through the cake and septum, and a means to control the pressure differential across the
24

deposited cake and septum. The configuration of the filtering surface (drum, disc,
horizontal) dictates the types of operations that may be utilized. The internals of a filter
become a hydraulic design problem, and, generally speaking, there is sufficient flexibility
to provide a wide range of hydraulic capacities.
As mentioned before, there are various types of filtration operations and
equipment. There are fundamental parts of the filter operation that dictate the amount of
moisture retained within the cake. Industrial filtration facilities may be characterized
according to the position of the slurry (the mixture of solids and water), the filter surface,
which can be top feed or bottom feed, the shape of the filter (drum, disc, horizontal belt,
etc.), the means of providing the driving force (vacuum or pressure), and the primary
function of the filtration step, which can vary from drying to dewatering. For the purpose
of this research, a top feed, leaf test vacuum filtration procedure as practiced by
FLSmidth was considered due to the operating ease for a laboratory, bench-scale, setting.
2.1.1 Leaf Test Equipment
2 2The “typical” test leaf is a cylinder with a plane area of 0.1 ft (92.9 cm ) (Figure
2.1). There will be many times when the quantity of sample is limited. While it is best to
2 2use the 0.1 ft (92.9 cm ) area leaf discussed above in order to minimize edge effects and
improve accuracy, when the sample volume is limited, it is much better to have several
data points with a smaller leaf than only one or two using the larger leaf. A number of
tests have been run with leaves having areas of 0.05 ft2 (46.5 cm2) and 0.025 ft2 (23.2
cm ). Data with these smaller units are reasonably accurate and can be used to scale-up to
commercially sized units. For the purpose of this research, the typical plane area of 92.9
25
cm2 was used.
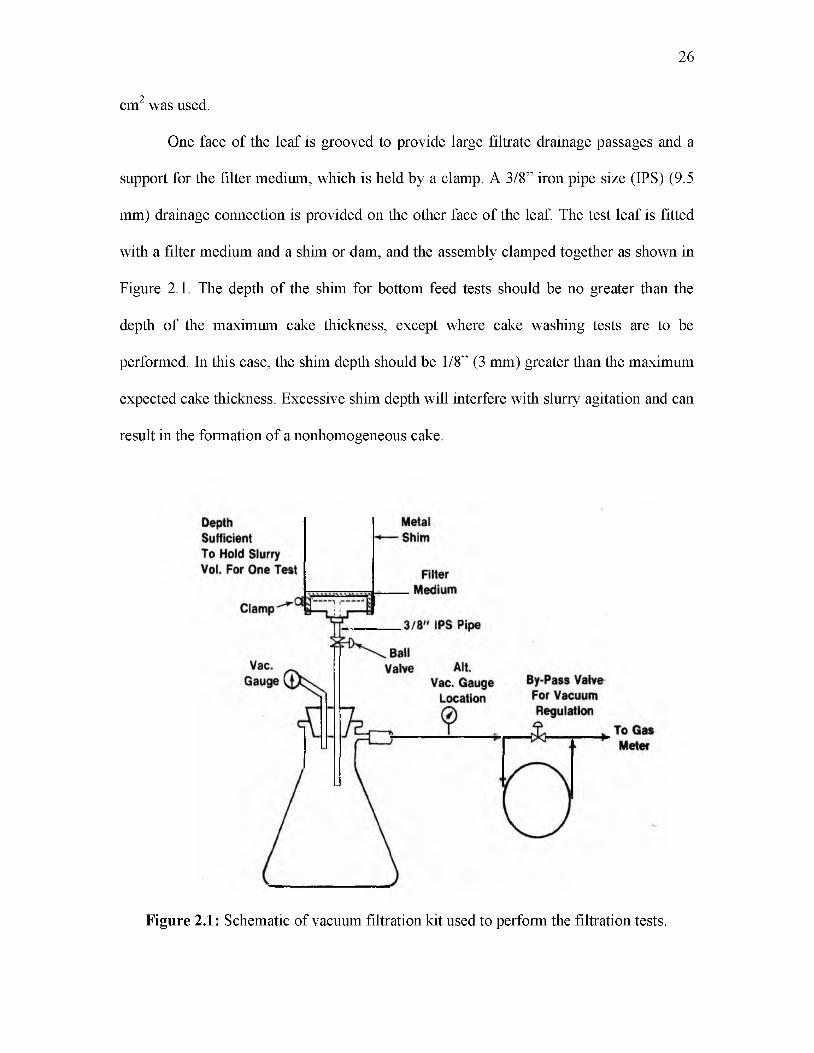
One face of the leaf is grooved to provide large filtrate drainage passages and a
support for the filter medium, which is held by a clamp. A 3/8” iron pipe size (IPS) (9.5
mm) drainage connection is provided on the other face o f the leaf. The test leaf is fitted
with a filter medium and a shim or dam, and the assembly clamped together as shown in
Figure 2.1. The depth of the shim for bottom feed tests should be no greater than the
depth of the maximum cake thickness, except where cake washing tests are to be
performed. In this case, the shim depth should be 1/8” (3 mm) greater than the maximum
expected cake thickness. Excessive shim depth will interfere with slurry agitation and can
result in the formation of a nonhomogeneous cake.
26
Figure 2.1: Schematic of vacuum filtration kit used to perform the filtration tests.
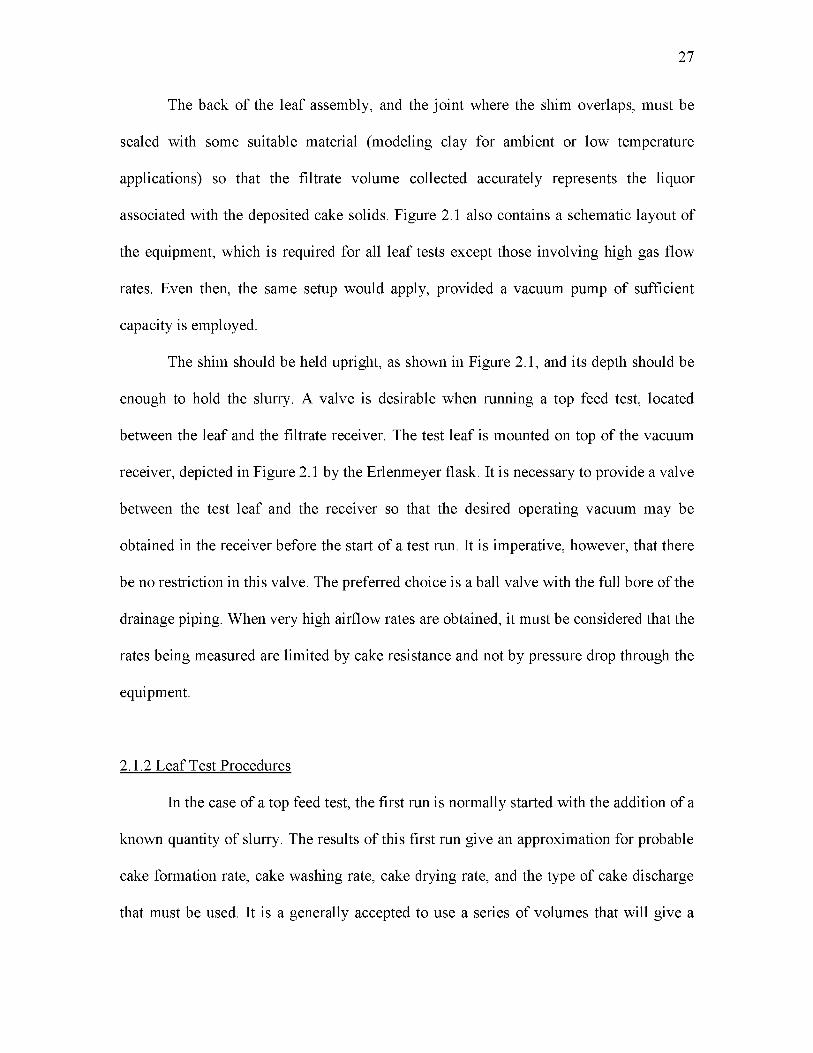
The back of the leaf assembly, and the joint where the shim overlaps, must be
sealed with some suitable material (modeling clay for ambient or low temperature
applications) so that the filtrate volume collected accurately represents the liquor
associated with the deposited cake solids. Figure 2.1 also contains a schematic layout of
the equipment, which is required for all leaf tests except those involving high gas flow
rates. Even then, the same setup would apply, provided a vacuum pump of sufficient
capacity is employed.
The shim should be held upright, as shown in Figure 2.1, and its depth should be
enough to hold the slurry. A valve is desirable when running a top feed test, located
between the leaf and the filtrate receiver. The test leaf is mounted on top of the vacuum
receiver, depicted in Figure 2.1 by the Erlenmeyer flask. It is necessary to provide a valve
between the test leaf and the receiver so that the desired operating vacuum may be
obtained in the receiver before the start of a test run. It is imperative, however, that there
be no restriction in this valve. The preferred choice is a ball valve with the full bore of the
drainage piping. When very high airflow rates are obtained, it must be considered that the
rates being measured are limited by cake resistance and not by pressure drop through the
equipment.
2.1.2 Leaf Test Procedures
In the case of a top feed test, the first run is normally started with the addition of a
known quantity of slurry. The results of this first run give an approximation for probable
cake formation rate, cake washing rate, cake drying rate, and the type of cake discharge
that must be used. It is a generally accepted to use a series of volumes that will give a
27

cake thicknesses of 5 to 20 mm and then to vary the dry time once an optimum cake
thickness has been determined. Dry times should be over the range of 0 to 120 seconds or
longer if necessary, but a zero (0) dry time should always be performed.
In any leaf test program there is always a question as to what vacuum level should
be used. For materials of moderate to low porosity, a good starting vacuum level is 18 -
20 inHg, as the capacity of most vacuum pumps starts to fall off at vacuum levels higher
than 20 inHg. Therefore, unless there is a critical moisture content which requires the use
of higher vacuums or the deposited cake is so impervious that the air rate is extremely
low, it is best to operate at a vacuum level of 20 inHg or less.
When running top feed tests, the vacuum should be applied at the same instant
that the slurry reaches the surface of the filter medium. This is fairly critical when the
solids involved are coarse and fast settling. However, when the feed is a thickened slurry
with very little or no settling tendencies, the vacuum may be turned on at any convenient
time interval after the slurry is on the filter medium.
2.2 Coal, Copper Silicate Ore, and Silica Vacuum Filtration Tests
The following section describes the different filtration tests performed for this
research. Also, different materials were used to perform these tests. Laboratory work
consisted primarily of determining the type of filtration tests required for the research. It
was decided to perform several vacuum filtration tests with coal, copper silicate ore, and
silica samples. Copper silicate ore was used for wettability comparisons due to the
hydrophilic nature o f the copper silicate (chrysocolla) as compared to the hydrophobic
nature of the coal particles. As discussed below, copper silicate ore did not provide the
28
results expected; therefore, silica and glass beads were introduced into the project. The
following sections describe the sample preparation and analysis methods used for the
vacuum filtration tests performed during this study.
2.2.1 Particle Size Preparation
The coal sample (3 kilograms), provided by the Department of Mining and
Minerals at Virginia Tech, was wet and dry screened. Since the particle size was too big
for this research, a specific particle size range was deliberately selected (40 x 200 mesh
size). Samples were first wet screened using a 200-mesh screen. Any particles below the
200-mesh size (less than 74 |im) were discarded from the study. The particles above 200-
mesh were wet screened using screens of mesh size 140, 100, 65, 50, and 40. Any
particles above the 40-mesh size (greater than 400 |im) were also discarded from the
study. Once dried, the samples were dried screened, weighed, and the particle size
distributions obtained. Only 500 grams were under the 40 x 200 mesh size range after
screening was performed. The experimental procedure was therefore limited to the
amount of sample usable for this study. The same particle size distribution and screening
methods were used for all samples in this study.
For the wettability studies (hydrophobicity studies), copper silicate ore and silica
samples were used. The copper silicate ore sample was obtained from the Zaldivar heap
leaching operations in northern Chile, and the silica sample was purchased from U.S.
Silica Company. The copper silicate ore and silica samples were screened following the
same procedure as the coal sample. Copper silicate ore and silica were used due to their
hydrophilic nature, thus making them good wetting indicators. Results obtained from the
29

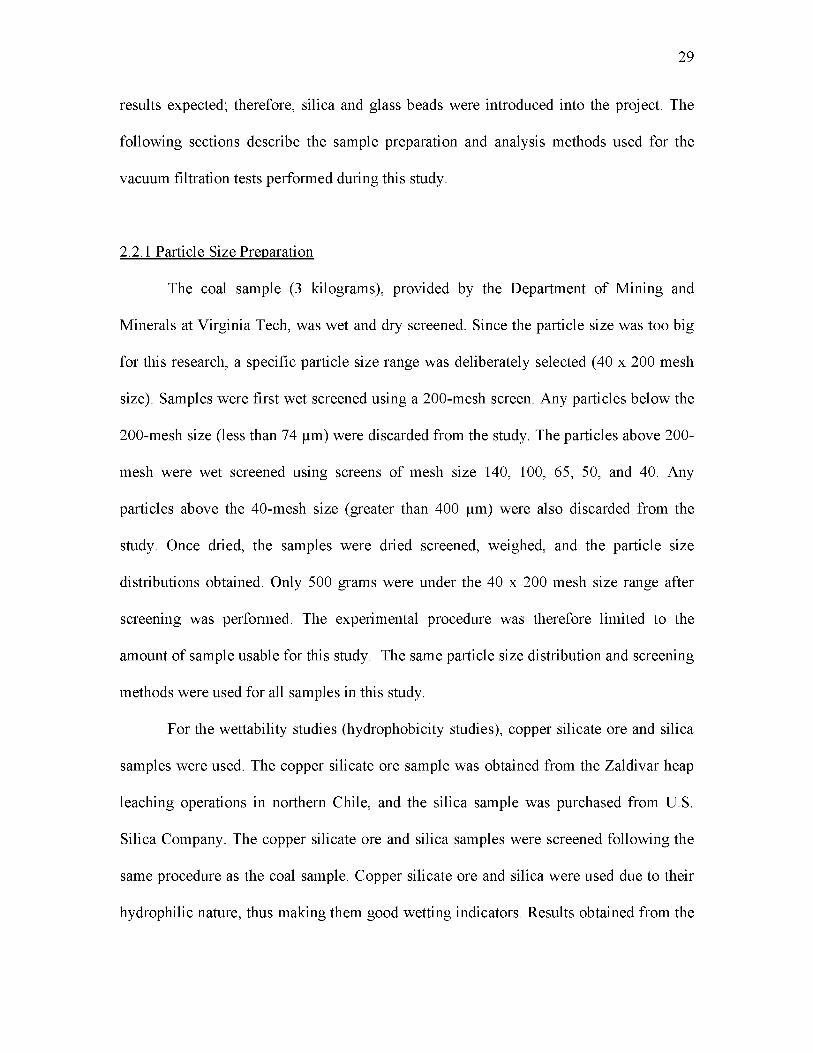
filtration tests are discussed on the next sections. Tables 2.1, 2.2, and 2.3 show the
calculated particle size distributions obtained after the screening of copper silicate ore,
coal, and silica, respectively. Figures 2.2, 2.3, and 2.4 illustrate the particle size
distributions plots obtained from the cumulative passing percentages obtained for copper
silicate ore, coal, and silica, respectively.
Once the samples were screened, only the particles with size range 65x100 mesh
were used for the filtration tests in order to have uniformity throughout the tests. The
same amount of sample (by volume) was used for all experiments in order to have a
consistent cake thickness for all tests and samples.
30
Table 2.1: Calculated particle size distribution for the copper silicate ore sample.
Mesh Mean Mean SizeSize Mesh Size [microns]
MassRetained
[g]% Retained %
Cumulative
40x50
50x65
65x100
100x140
150x200
45
57.5
82.5
120
175
354
250
177
125
88
229.88
248.87
165.02
28.13
18.68
33.29
36.04
23.90
4.07
2.70
100.00
66.71
30.67
6.78
2.70
Total 690.58
31
Table 2.2: Calculated particle size distribution for the coal sample.
MeshSize
Mean Mesh Size
Mean Size [microns]
MassRetained
[g]% Retained %
Cumulative
40x50 45 354 173.19 33.88 100.00
50x65 57.5 250 131.8 25.79 66.12
65x100 82.5 177 83.43 16.32 40.33
100x140 120 125 70.8 13.85 24.01
150x200 175 88 51.9 10.15 10.15
Total 511.12
Table 2.3: Calculated particle size distribution for the silica sample.
MeshSize
Mean Mesh Size
Mean Size [microns]
MassRetained
[g]% Retained %
Cumulative
40x50 45 354 90.4 3.31 100.00
50x65 57.5 250 862 31.56 96.69
65x100 82.5 177 927.4 33.96 65.13
100x140 120 125 632.4 23.15 31.17
150x200 175 88 219 8.02 8.02
Total 2731.2

32
120
100
gnssi 80aevalul
60
uC 40
20
100 200 300Particle Size [microns]
400
Figure 2.2: Particle size distribution plot for the copper silicate ore sample.
00
120
100
80
60
gnisisaPevitialul
u 40 C
20
0100 200 300
Particle Size [microns]400
Figure 2.3: Particle size distribution plot for the coal sample.
0

33
egccS
(U_>oa
13B3O
100
80
60
40
20
0
120
100 200 300Particle Size [microns]
400
Figure 2.4: Particle size distribution plot for the silica sample.
0
2.2.2 Density Tests
The objective on every experiment was to generate cakes with the same cake
thickness; therefore, calculations were made in order to determine how much sample was
needed to obtain a consistent cake thickness. However, due to the physical characteristics
of the particles involved, the density of the samples was needed in order to determine the
amount of particles necessary to create filter cakes with the same volume/thickness. It
was also determined that for this study every test should involve slurries containing 50%
solids by weight. This means that the slurries contained a mixture of the same weight of
particles and water. Nonetheless, in order to determine the weight the density for every
sample was required. The density for the coal and copper silicate ore samples was
measured using a pycnometer. The pycnometer is a device used to determine the density
of a solid by referencing to an appropriate working fluid. In the case of solids, the net

weight of the material is measured (preparation is required in order to eliminate
contaminants or vapors) and placed in a chamber in the pyctometer. The chamber is filled
with a gas of known density (i.e., helium) in which the material is completely insoluble.
There is a change in pressure inside the chamber caused by the presence of the sample.
The difference in pressure represents the volume of the sample. The weight of the
displaced fluid can be determined and hence the specific gravity of the solid. For this
study, a MultiVolume Pycnometer, Model 1305, was used to determine the density of the
solids. The samples were prepared and cleaned prior to measurement of density. Helium
was used for this study since it is a suitable gas that penetrates the smallest pores and
covers all surface irregularities. The pycnometer measured the changing pressures inside
the chamber and a volume values also obtained from the machine. The data were used to
determine the theoretical density of the solid.
The recorded data were used to calculate the volume of the sample first. For this
calculation, the equation VSAMP — VCELL------ — was used, where Vcfu. is the emptyP 1 / P 2 _ 1
volume of the chamber, Vexp is the expansion volume, and P 1 and P2 are the charge
pressure and pressure after expansion respectively. This value was used to calculate the
sample density using the equation p SAMP — - SAM- , where WsamP represents the sampleV SAMP
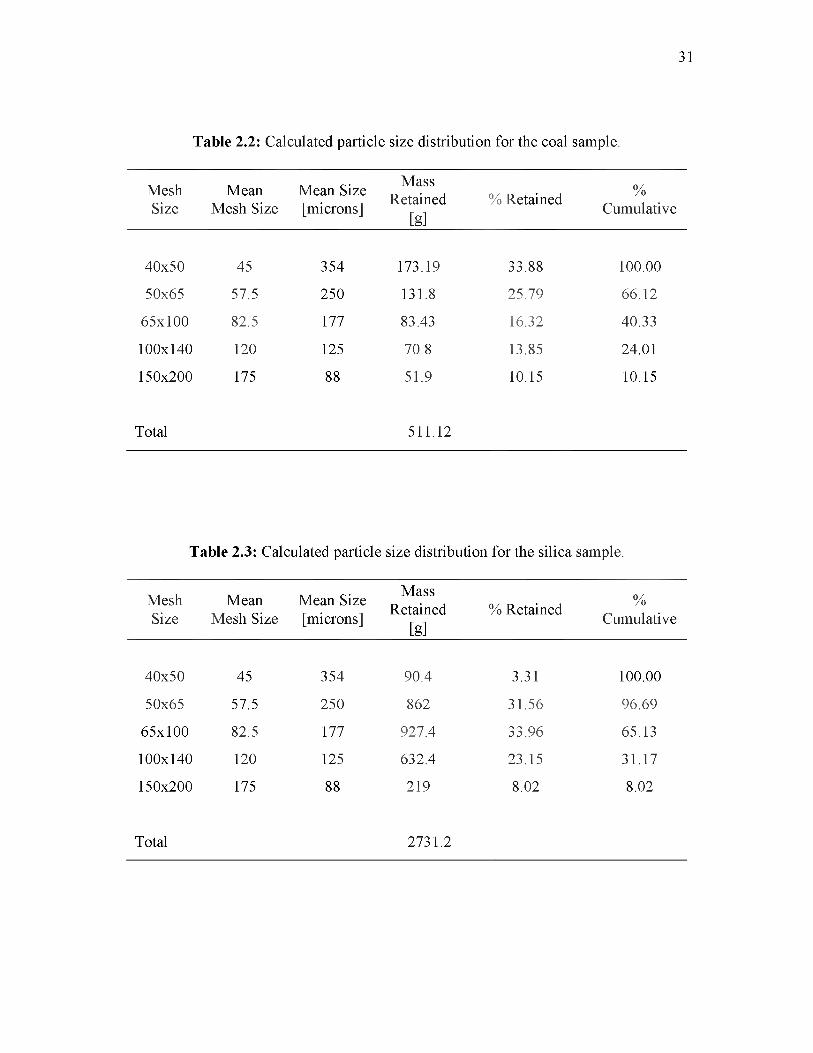
weight and Vsamp is the sample weight. Table 2.4 shows the measured densities for the
3 3copper silicate ore and coal samples (1.25 g/cm and 2.04 g/cm , respectively). The silica
sample density was obtained from the material safety data sheet (MSDS) provided by the
supplier (2.60 g/cm ).
34
35
Table 2.4: Pycnometer data recorded and calculated density values for coal and coppersilicate ore samples.
Coal
Weight(g)
Pi P 2Vcell
(cm3)
xp 3)
>
Vsamp
(cm3)
Density
(g/cm3)
0.4928
0.4928
19.921 11.246
19.779 11.163
7.99654
7.99654
5.86577
5.86577
0.392338
0.396773
1.256
1.242
Copper Silicate Ore
Weight(g) P1 P2
Vcell
(cm3)
xp 3)
>
Vsamp
(cm3)
Density
(g/cm3)
0.473
0.473
19.819 11.290
19.760 11.256
7.99654
7.99654
5.86577
5.86577
0.231908
0.232534
2.040
2.034
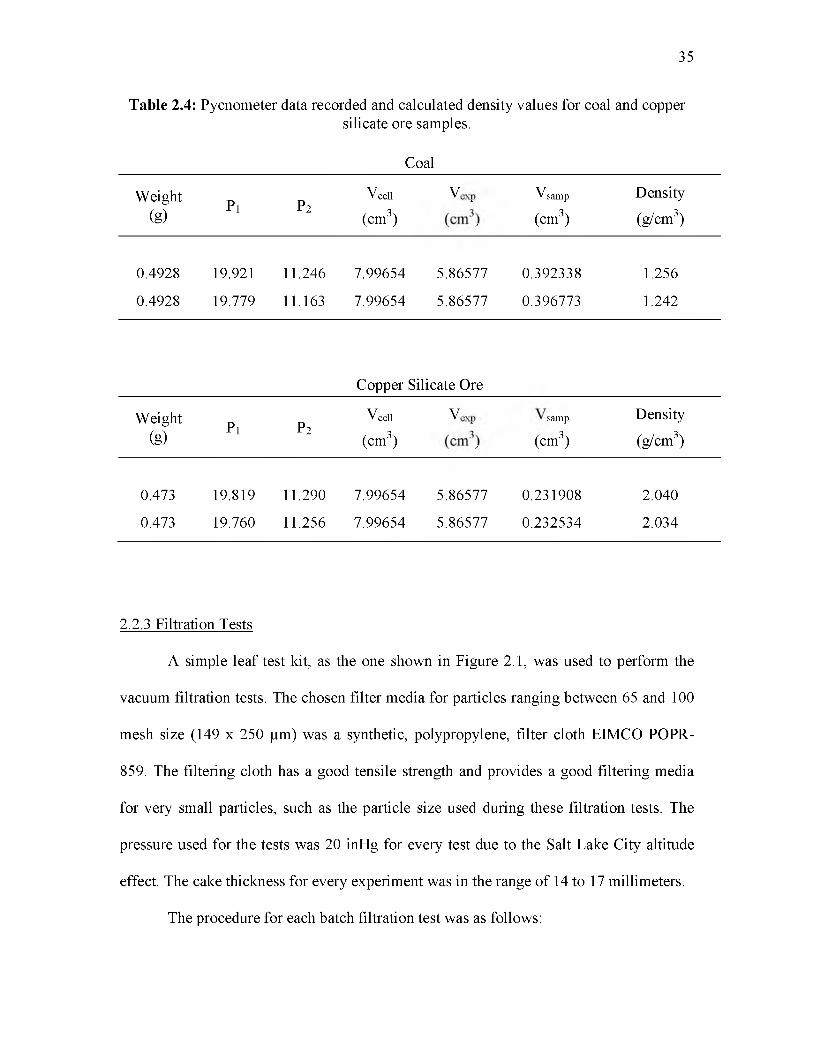
2.2.3 Filtration Tests
A simple leaf test kit, as the one shown in Figure 2.1, was used to perform the
vacuum filtration tests. The chosen filter media for particles ranging between 65 and 100
mesh size (149 x 250 |im) was a synthetic, polypropylene, filter cloth EIMCO POPR-
859. The filtering cloth has a good tensile strength and provides a good filtering media
for very small particles, such as the particle size used during these filtration tests. The
pressure used for the tests was 20 inHg for every test due to the Salt Lake City altitude
effect. The cake thickness for every experiment was in the range of 14 to 17 millimeters.
The procedure for each batch filtration test was as follows:

1. Agitate a known mass or volume of slurry with a mixer or by hand with a
wide spatula to maintain a homogeneous suspension.
2. Transfer the slurry onto the leaf while starting the timer and simultaneously
opening the ball valve.
3. Continue filtration until cake formation is complete and water disappears from
the cake surface. Leave vacuum on after forming for a preselected dry time.
Note whether cake cracks and the time of cracking.
4. If the cake is to be washed, pour on a measured quantity of wash water and
note the time required for free water to disappear from the surface of the cake.
Washing MUST begin before cake cracking occurs.
5. During each of the operations, record all pertinent information such as
vacuum level, temperature, time required for the cake to crack, filtrate
foaming characteristics, if any, air flow rate during the drying periods, etc.
6. At the end of the run, measure and record the filtrate volume (and weight, if
appropriate), cake thickness, final cake temperature, if appropriate, wet cake
weight and cake discharge characteristics (i.e., roll, sticks to media, etc.).
7. For runs involving cake dewatering only, it is usually convenient to dry the
total cake sample either in an oven or under infrared lamps. A portion of the
cake only may be used for moisture determination, but care must be taken to
insure that a representative sample is used.
No flocculant was added to the slurry and no washing cycles were performed.
Also, a back calculation of feed solids was done in order to keep track of the amount of
solids in the feed slurry. The same parameters were used for every filtration test. The
36
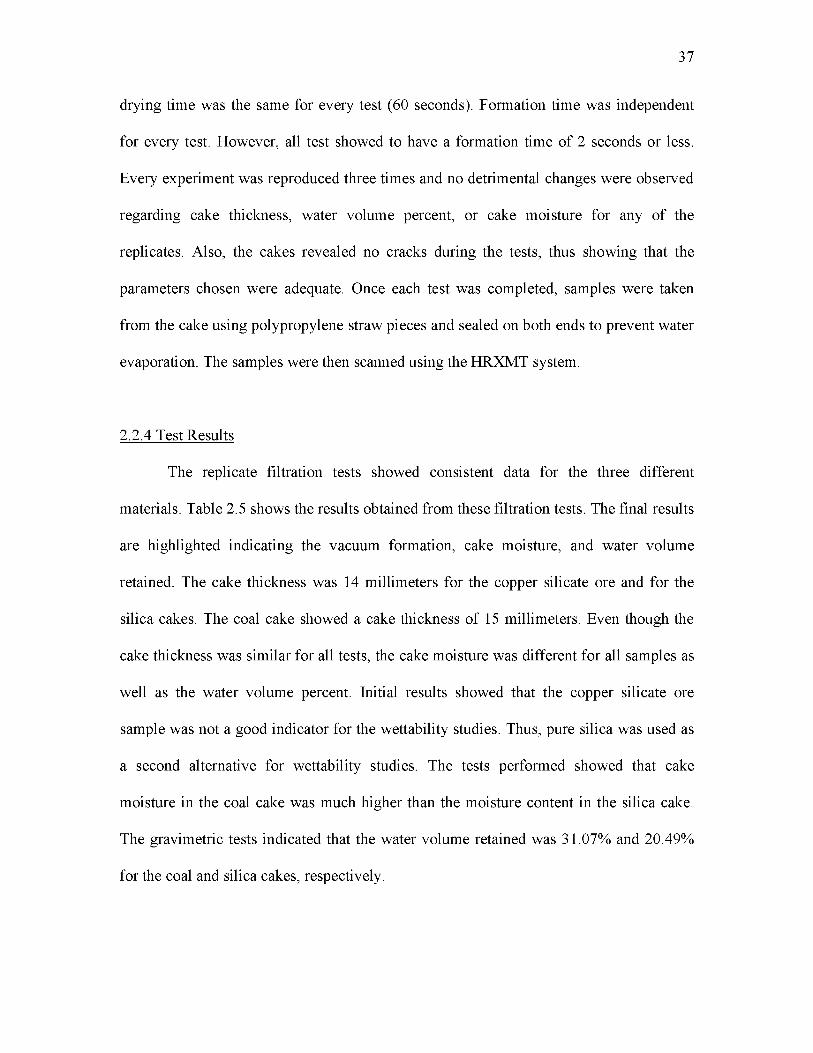
drying time was the same for every test (60 seconds). Formation time was independent
for every test. However, all test showed to have a formation time of 2 seconds or less.
Every experiment was reproduced three times and no detrimental changes were observed
regarding cake thickness, water volume percent, or cake moisture for any o f the
replicates. Also, the cakes revealed no cracks during the tests, thus showing that the
parameters chosen were adequate. Once each test was completed, samples were taken
from the cake using polypropylene straw pieces and sealed on both ends to prevent water
evaporation. The samples were then scanned using the HRXMT system.
2.2.4 Test Results
The replicate filtration tests showed consistent data for the three different
materials. Table 2.5 shows the results obtained from these filtration tests. The final results
are highlighted indicating the vacuum formation, cake moisture, and water volume
retained. The cake thickness was 14 millimeters for the copper silicate ore and for the
silica cakes. The coal cake showed a cake thickness of 15 millimeters. Even though the
cake thickness was similar for all tests, the cake moisture was different for all samples as
well as the water volume percent. Initial results showed that the copper silicate ore
sample was not a good indicator for the wettability studies. Thus, pure silica was used as
a second alternative for wettability studies. The tests performed showed that cake
moisture in the coal cake was much higher than the moisture content in the silica cake.
The gravimetric tests indicated that the water volume retained was 31.07% and 20.49%
for the coal and silica cakes, respectively.
37

38
Table 2.5: Data collected from the coal, copper silicate ore, and silica vacuum filtration tests. The initial pressure, calculated cake moisture, and water retained (vol. %) are highlighted in green.
MATERIAL Coal, Copper Silicate Ore and Silica (149 x 250 microns)FEED SOLIDS % (w/w) ~50%FILTER CLOTH EIMCO POPR-859
TEST NO. Coal Copper Silicate Ore SilicaFeed Slurry (g) 207 319 359Form Vacuum (inHg) 20 20 20Dry Vacuum (inHg) 15 15 15Form Time (sec) 2 2 2Dry Time (sec) 60 60 60Filtrate Vol. (ml) 102 150 178Cake Thickness (mm) 15 14 14Cake Tare Weight (g) 4.3 4.3 4.3Cake Total Wet Weight (g) 104.9 165.4 173Cake Dry Weight (g) 81.4 126.48 161.7Flocculant (g/t) - - -Net Dry Cake Weight (g) 77.1 122.2 157.4Cake Moisture (wt. %) 23.4% 24.2% 6.7%Back Calc Feed Solids (wt. %) 43% 45% 47%Water weight (g) 27.8 43.2 15.6Particle Density (g/cm3) 1.25 2.05 2.6Water (wt. %) 26.50 26.13 9.02Volume solids (cm3) 61.68 59.60 60.54Total volume (cm3) 89.48 102.82 76.14Water (vol. %) 31.07 42.03 20.49

The calculations were performed in terms of water volume percentage due to the
difference in density for the coal and silica particles. The results were consistent and no
significant changes were observed on replicate tests. Even though lower cake moisture
was expected for the coal cake, the results indicated that water retention was not only
dependent on the wettability factor. The difference in cake moisture was attributed to the
shape factor. The shape of the coal particles affected the cake moisture content and water
percent retention because the coal particles form narrow capillaries where water is
retained. It was determined that the shape of the particles plays an important role in the
dewatering process. Thus, hydrophobic and hydrophilic spherical soda lime glass beads
were used during the next phase of the research in order to eliminate the shape factor and
complement the coal filtration results.
2.3 Glass Beads Vacuum Filtration Tests
Differences between the coal and silica particles were observed in the
reconstructed 3D images obtained through the HRXMT. Coal particles showed irregular,
sharp edges, while the silica particles showed more regular, smooth surface. In order to
eliminate the shape factor, and complement the coal filtration results, hydrophobic and
hydrophilic glass beads were used to determine the effects of particle shape in the
dewatering process. With the use of spherical-shaped particles and the elimination of the
shape factor, it was also easier to analyze the effect of pressure on the cake moisture. To
test for the effects of pressure, the initial pressure for these tests was varied. Thus, using
the hydrophilic glass beads, three different initial pressures were used. Once each test
was completed, samples were taken from the cake using polypropylene straw pieces and
39

sealed on both ends to prevent water evaporation, and subsequently scanned using the
HRXMT system.
2.3.1 Glass Beads Hydrophobization
In order to complete and complement the results for coal filtration, hydrophobic
and hydrophilic spherical soda lime glass beads were also used to perform additional
filtration tests. The glass beads (1200 grams) used for the tests were provided by the
Department of Geology at The University of Utah. The size range of the glass beads was
200 x 240 microns. However, the glass beads were hydrophilic in nature; therefore, some
of the glass beads were chemically treated to make their surface hydrophobic.
The glass beads were hydrophobized using octadecyltricholosilane (OTS), an
organic molecule consisting of a long-chain alkyl group (C18H37-) with a polar head
group (SiCl3-). A total of 600 grams of glass beads were hydrophobized. For every 100
grams of glass beads, 500 milliliters of benzene and 2.5 grams of OTS were used. First,
the benzene was poured into a beaker and OTS was added and mixed until the OTS was
dissolved. Then, the glass beads were added to the mixture and placed on a magnetic
stirrer. The beaker was covered to prevent solvent vaporization. It is important that the
glass beads remain in suspension so that the hydrophobization becomes effective. After
24 hours, the particles were filtered, washed with chloroform, and dried at a temperature
of 100°C for 4 hours. Once dried the glass beads were tested for hydrophobicity using
bubble attachment time measurements. The bubble attachment tests revealed the effective
hydrophobization of the glass beads and were subsequently used for the filtration tests.
40

2.3.2 Filtration Tests
A simple vacuum filtration kit was used to perform the filtration experiments.
Figure 2.1 shows a schematic of the kit used. The same procedure used for the silica and
coal samples was used for the glass beads filtration tests. The chosen filter was a
synthetic, polypropylene, filter cloth EIMCO POPR-859. The pressure was varied in
order to determine the pressure effect during the dewatering process. Thus, using the
hydrophilic glass beads, three different initial pressures were used: 20 inHg, 17.5 inHg,
and 15 inHg. For every vacuum filtration test, slurry containing 50% solids by weight
was prepared. The density of the glass beads (2.60 g/cm ) was obtained from the MSDS
provided by the Department of Geology at The University of Utah. No flocculant was
added to the slurry and no washing cycles were performed. The drying time was the same
for every experiment (60 seconds). Once each test was completed, the same procedure
used for the coal and silica samples was followed for image analysis using the HRXMT
system.
2.3.2 Test Results
The filtration results for the tests performed at different initial pressures with the
hydrophilic glass beads are shown on Table 2.6. Every experiment was reproduced three
times and no significant changes were observed between replicates regarding cake
thickness, water volume percent or cake moisture. Also, no cake cracks were observed
during the tests, thus showing that the parameters chosen were adequate. Notice that as
the initial pressure decreases (pressure drop decrease) the cake moisture increases, which
seems to be consistent with literature (Leonard & Hardinge, 1991).
41

42
Table 2.6: Representative filtration test results and data collected from the hydrophilic glass beads tests at different pressures. The initial pressure, calculated cake moisture, and water retained (vol. %) are highlighted in green.
DATE Feb-11MATERIAL Hydrophilic Glass Beads (200 x 240 microns)FEED SOLIDS % w/w 50%FILTER CLOTH EIMCO POPR-859
TEST NO. 1 2 3Feed Slurry (g) 385 387 384Form Vacuum (inHg) 20 17.5 15Dry Vacuum (inHg) 5 4 3Form Time (sec) 1.5 1.5 1.5Dry Time (sec) 60 60 60Filtrate Vol. (ml) 194 185 190Cake Thickness (mm) 17 17 17Cake Tare Weight (g) 2.3 2.3 2.3Cake Total Wet Weight (g) 190.5 190.47 192.6Cake Dry Weight (g) 179.3 178.3 179.2Net Dry Cake Weight (g) 177.0 176.0 176.9Cake Moisture (wt. %) 5.9% 6.5% 7.0%Back Calc Feed Solids (wt. %) 48% 49% 48%Water weight (g) 13.5 14.5 15.7Glass Beads Density (g/cm3) 2.37 2.37 2.37Water (wt. %) 7.09 7.60 8.14Volume solids (cm3) 74.70 74.26 74.65Total volume (cm3) 88.20 88.74 90.33Water (vol. %) 15.31 16.32 17.36

In the case of the hydrophobic glass beads, the tests were performed with initial
vacuum pressure of 20 inHg only. No tests with different initial pressures were carried
out using the hydrophobic glass beads. It was observed that the cakes were not uniform
such as the case for the hydrophilic glass beads. The hydrophobic glass beads
agglomerated in such a way that the distribution of particles within the cake was not
homogeneous. This can be attributed to the high hydrophobicity of the glass beads, which
caused the particles to agglomerate or form clusters and repel the surrounding water.
In addition, the cake moisture was significantly lower than the test with
hydrophilic glass beads at 20 inHg. The calculated cake moisture was 2.5%, with a water
volume percentage of 8.49%, almost half the water volume percentage of the hydrophilic
glass beads test at the same initial vacuum pressure. All other parameters were similar to
the tests with hydrophilic glass beads at 20 inHg, as shown in Table 2.7. Thus, the results
showed that when the shape factor is not a significant variable, the water retention
becomes dependent of the wettability characteristics and pressure drop. As mentioned
before, the shape analysis was only assessed qualitatively and not quantitatively;
therefore, quantitatively analyses are required to support these data.
43
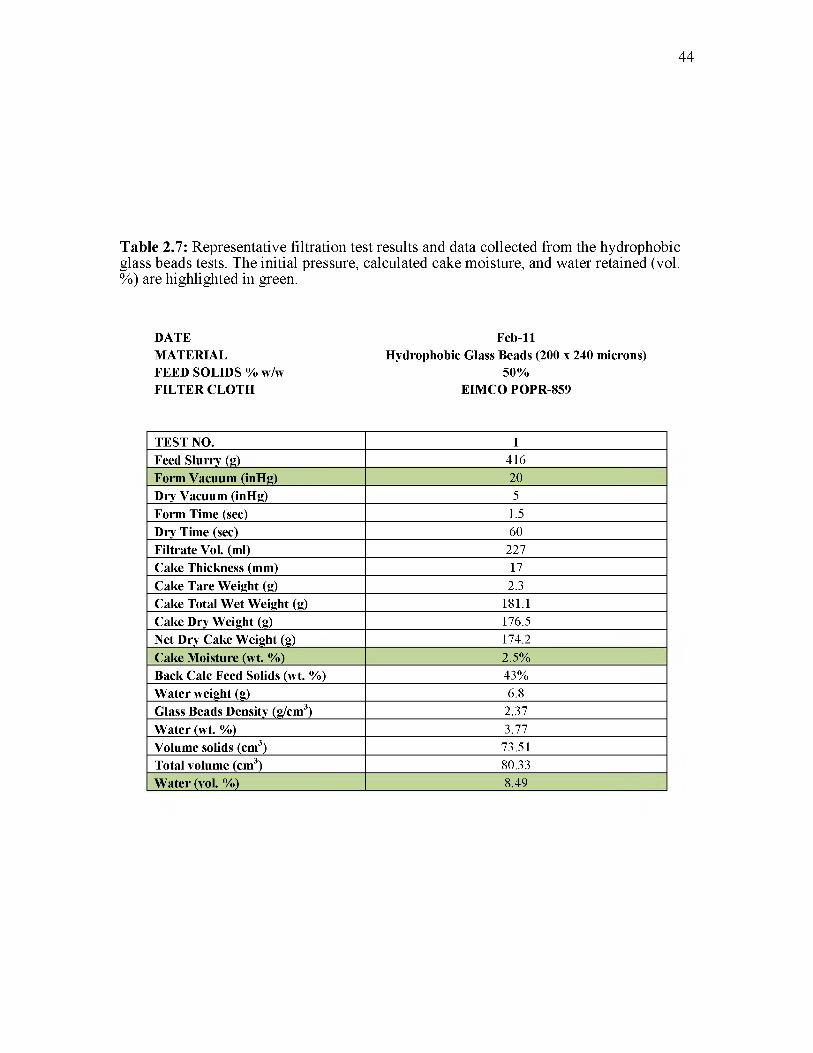
44
Table 2.7: Representative filtration test results and data collected from the hydrophobic glass beads tests. The initial pressure, calculated cake moisture, and water retained (vol. %) are highlighted in green.
DATE Feb-11MATERIAL Hydrophobic Glass Beads (200 x 240 microns)FEED SOLIDS % w/w 50%FILTER CLOTH EIMCO POPR-859
TEST NO. 1Feed Slurry (g) 416Form Vacuum (inHg) 20Dry Vacuum (inHg) 5Form Time (sec) 1.5Dry Time (sec) 60Filtrate Vol. (ml) 227Cake Thickness (mm) 17Cake Tare Weight (g) 2.3Cake Total Wet Weight (g) 181.1Cake Dry Weight (g) 176.5Net Dry Cake Weight (g) 174.2Cake Moisture (wt. %) 2.5%Back Calc Feed Solids (wt. %) 43%Water weight (g) 6.8Glass Beads Density (g/cm3) 2.37Water (wt. %) 3.77Volume solids (cm3) 73.51Total volume (cm3) 80.33Water (vol. %) 8.49

CHAPTER 3
X-RAY MICROTOMOGRAPHY
Understanding the fundamental parameters involved in the filtration process is
essential in order to improve the water removal and define the condition for minimum
cake moisture content. To gain better understanding of the complex transport phenomena
that occur in the porous media, a study of the effect of three-dimensional pore geometry
on the effective transport properties of the filter cake is necessary. X-ray
microtomography was used for the characterization of the complex three-dimensional
(3D) pore geometry by direct digitalization of the real pore network structure of the coal
cake. High resolution x-ray microtomography (HRXMT) (Refer to Figure 1.1) allows for
further advances in the 3D characterization of pore network structures in filtration cakes.
With a voxel resolution of less than 1 micron, particles as small as 10 microns can be
distinguished and described. The use of HRXMT and the emerging Lattice-Boltzmann
Method (LBM) simulation, present a unique opportunity to explore such matters. The
simulation study relied on a combination of 3D data, obtained from HRXMT
measurements, and the LBM to determine the conditions to improve water removal
during filtration operations.

3.1 High Resolution X-Ray Microtomography (HRXMT)
HRXMT is a noninvasive technology used to describe important characteristics of
a body. In this case, HRXMT is used to effectively describe the characteristics of packed
particle beds in 3D detail. This means that HRXMT has the ability to show not only the
particles within the packed bed, but also the void space created by these particles known
as the pore network structure. HRXMT makes use of x-rays to describe the composition
of the material being studied, thus providing considerable information about the sample.
In his research, Hsieh (2012) described the operational procedures for particle
characterization using HRXMT.
The mechanics of x-ray tomography testing is relatively simple. The sample is
located between the x-ray source and the detector (Refer to Figure 1.1). Then, the sample
is irradiated with x-ray photons generated from a point source in different directions as
the sample slowly rotates. As the x-rays pass through the sample, a certain amount of x-
ray photons are absorbed by the sample depending on the atomic number, density, or
thickness of the sample. The x-ray photons that are not absorbed by the sample are
captured by the detector and a two-dimensional (2D) projection is created. These
projections are created from the attenuation coefficients measured by the detector. These
attenuation coefficients depend on the density and effective atomic number of that
portion of the sample being examined. The attenuation coefficients determine the extent
to which the material can be penetrated by the x-ray photons. Therefore, the final product
will consist of several 2D images created from the x-rays passing through the sample.
Finally, a computerized reconstruction is conducted. The reconstruction of the samples is
based on a mathematical formalism known as the Radon transform and its mathematical
46

framework. After processing, the HRXMT produces a spatial description of the object
under analysis where the field of view is divided into 3D elemental digital units known as
voxels. Each voxel is characterized by the attenuation coefficient of the material sampled,
where the attenuation coefficient can be calibrated for phase identification. This spatial
digital characterization of the sample under analysis allows for further digital processing
of the sample.
Figure 3.1 shows a packed bed of coal particles and its porous network structure
as obtained by the micro CT system. The particle size is between 149 and 250 microns
(0.149 to 0.250 mm), the resolution of each voxel is 5 |im and the size of the image is of
300 x 300 x 300 voxels. It is possible to observe how image processing of the digital data
allows a clear separation between the solid particles and the air due to the clear difference
in attenuation coefficients. This technique easily obtains the pore network structure of the
packed particle bed.
47
Figure 3.1: Three-dimensional (3D) image of a packed particle bed of coal with particle size of 149 x 250 |im. The voxel resolution is 5 |im and the image size is 300 x 300 x 300 voxels. The sample was scanned using 4X magnification and 40 kV.
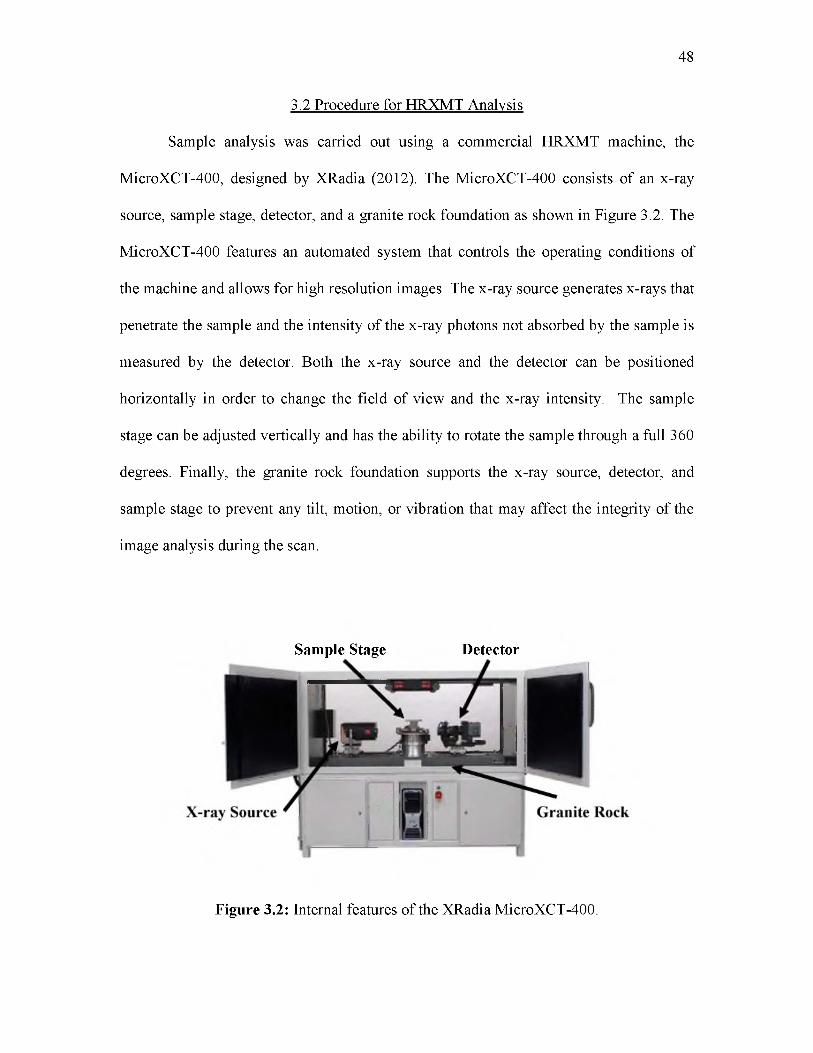
3.2 Procedure for HRXMT Analysis
Sample analysis was carried out using a commercial HRXMT machine, the
MicroXCT-400, designed by XRadia (2012). The MicroXCT-400 consists of an x-ray
source, sample stage, detector, and a granite rock foundation as shown in Figure 3.2. The
MicroXCT-400 features an automated system that controls the operating conditions of
the machine and allows for high resolution images. The x-ray source generates x-rays that
penetrate the sample and the intensity of the x-ray photons not absorbed by the sample is
measured by the detector. Both the x-ray source and the detector can be positioned
horizontally in order to change the field of view and the x-ray intensity. The sample
stage can be adjusted vertically and has the ability to rotate the sample through a full 360
degrees. Finally, the granite rock foundation supports the x-ray source, detector, and
sample stage to prevent any tilt, motion, or vibration that may affect the integrity of the
image analysis during the scan.
48
Sample Stage Detector
Figure 3.2: Internal features of the XRadia MicroXCT-400.
The same procedure for HRXMT analysis used by Hsieh (2012) was considered
for this research. According to Hsieh (2012), “the minimum particle size is required to be
at least five to ten times that of the voxel resolution in order to obtain enough voxels to
distinguish the particle” (p. 18). Particle size and range considerations are very important
since they can affect the mass linear attenuation coefficient of the sample itself (Hsieh,
2012). Because of this, all samples were screened and a representative sample was
obtained for all experiments. In this regard, the samples used for analysis satisfied the
particle size and range requirements.
After filtration, samples were obtained from the filter cakes by inserting
polypropylene straw pieces to the filter cake. The thin wall of the polypropylene straw
pieces does not absorb a high number of x-ray photons and was used because it has a
lower effect on image reconstruction. Once the sample was obtained, both ends of the
polypropylene straw pieces were sealed to prevent water evaporation and to confine the
particles. Scanning took place within a few hours after the samples were obtained. This
method was also used to maintain the integrity of the pore network structure intact and
stabilize the sample during scanning.
As indicated before, all samples were scanned under the same conditions using
the MicroXCT-400. The machine requires a certain amount of “warm up” time, which
usually takes approximately 15 minutes, before it is able to make its first scan. It is
necessary for the machine to reach a temperature of -60°C in order for the x-ray power
source and output to obtain a stable and consistent level for each scan (Hsieh, 2012).
Once the machine is ready for scanning, the appropriate energy level for the source is
applied. The XRadia MicroXCT-400 system is polychromatic and provides energy levels
49

ranging from 40 kV to 150 kV. Material properties of the samples for this research were
considered in order to have an x-ray energy level that could provide high resolution
images. It is important to consider the x-ray source voltage level because it also
determines the attenuation coefficient (Hsieh, 2012).
Due to the low density of the samples, the coal sample was analyzed using a
source voltage of 40 kV and the silica and glass beads samples were evaluated using 60
kV. The magnification for all samples was 4X and an exposure time of 9 seconds. The
scan conditions for the samples were selected according to material properties and
characteristics in order to obtain an accurate representation and high resolution images of
the pore network structure. It is important to mention that scan conditions may vary
according to material properties such as density, mineral composition, and atomic
number.
3.2.1 HRXMT Image Analysis of Coal and Silica
The following sets of images represent the different 3D images obtained from the
packed particle beds obtained after the filtration tests were carried out. Figure 3.3 shows a
packed bed of coal particles (left) and its cross-sectional area (right) showing the void
space formed after filtration, and as obtained by the HRXMT system at the University of
Utah. The particle size was between 149 and 250 ^m, the resolution of each voxel was
4.63 ^m in length, thus providing an image size of 600 x 600 x 600 voxels. The 3D
images were reconstructed using VolSuite (2009), an open source application framework
used for the construction, visualization and analysis of data. The cross-sectional images
50
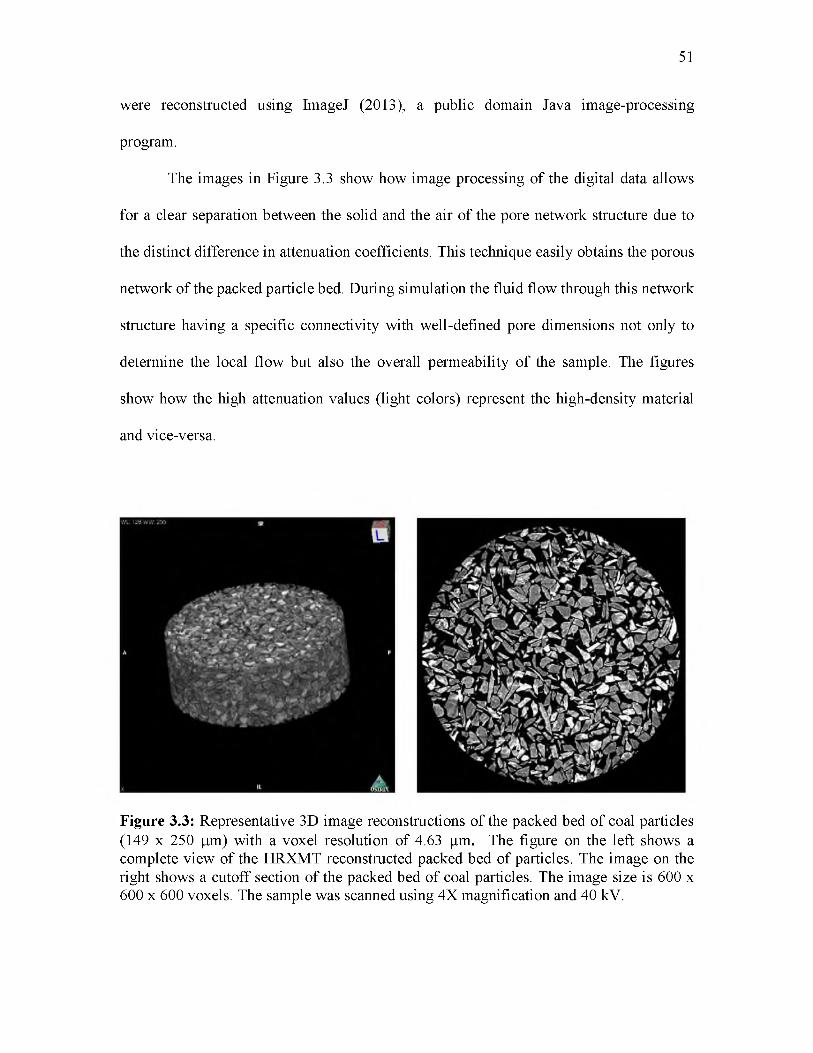
were reconstructed using ImageJ (2013), a public domain Java image-processing
program.
The images in Figure 3.3 show how image processing of the digital data allows
for a clear separation between the solid and the air of the pore network structure due to
the distinct difference in attenuation coefficients. This technique easily obtains the porous
network of the packed particle bed. During simulation the fluid flow through this network
structure having a specific connectivity with well-defined pore dimensions not only to
determine the local flow but also the overall permeability of the sample. The figures
show how the high attenuation values (light colors) represent the high-density material
and vice-versa.
51
Figure 3.3: Representative 3D image reconstructions of the packed bed of coal particles (149 x 250 ^m) with a voxel resolution of 4.63 |im. The figure on the left shows a complete view of the HRXMT reconstructed packed bed of particles. The image on the right shows a cutoff section of the packed bed of coal particles. The image size is 600 x 600 x 600 voxels. The sample was scanned using 4X magnification and 40 kV.
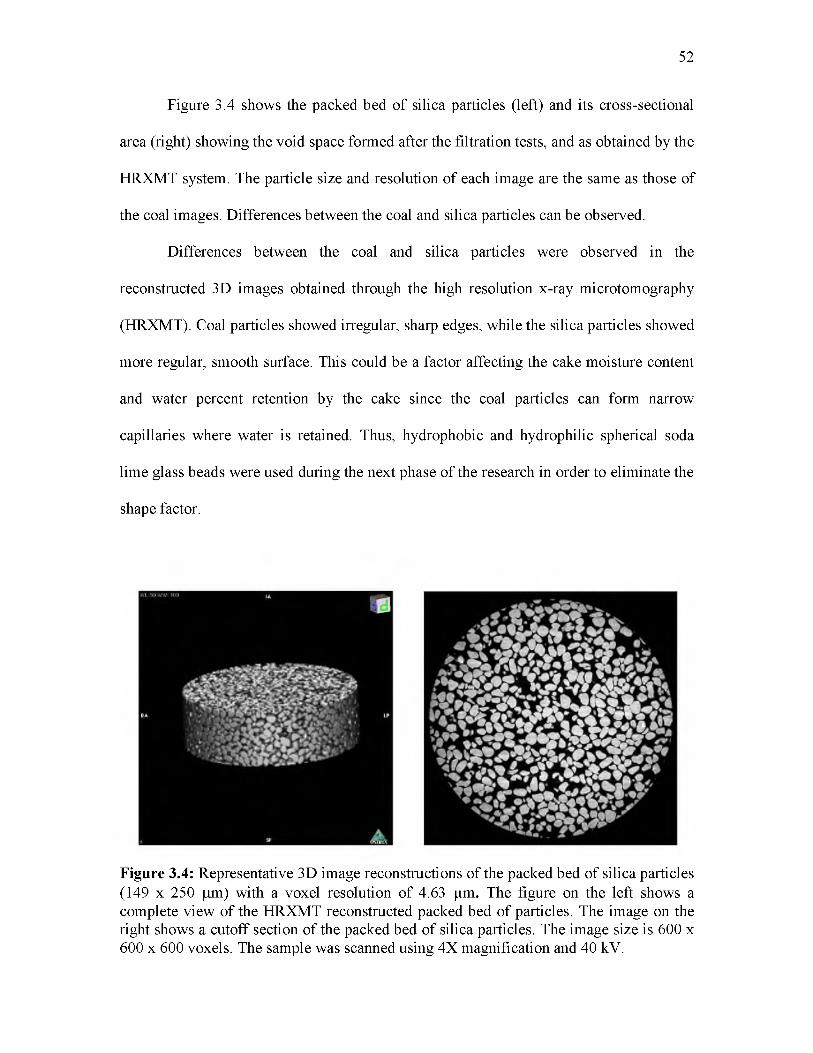
Figure 3.4 shows the packed bed of silica particles (left) and its cross-sectional
area (right) showing the void space formed after the filtration tests, and as obtained by the
HRXMT system. The particle size and resolution of each image are the same as those of
the coal images. Differences between the coal and silica particles can be observed.
Differences between the coal and silica particles were observed in the
reconstructed 3D images obtained through the high resolution x-ray microtomography
(HRXMT). Coal particles showed irregular, sharp edges, while the silica particles showed
more regular, smooth surface. This could be a factor affecting the cake moisture content
and water percent retention by the cake since the coal particles can form narrow
capillaries where water is retained. Thus, hydrophobic and hydrophilic spherical soda
lime glass beads were used during the next phase of the research in order to eliminate the
shape factor.
52
Figure 3.4: Representative 3D image reconstructions of the packed bed of silica particles (149 x 250 ^m) with a voxel resolution of 4.63 |im. The figure on the left shows a complete view of the HRXMT reconstructed packed bed of particles. The image on the right shows a cutoff section of the packed bed of silica particles. The image size is 600 x 600 x 600 voxels. The sample was scanned using 4X magnification and 40 kV.

3.2.2 HRXMT Image Analysis o f Hydrophilic Glass Beads
Two different samples of hydrophilic glass beads were analyzed in order to
observe the effect o f the initial vacuum pressure on the amount of water retained. The
two samples involved the filter cakes obtained after using an initial vacuum pressure of
15 inHg and 20 inHg, respectively. Figure 3.5 shows the representative images o f the
filter cakes for the hydrophilic glass beads at an initial vacuum pressure o f 15 inHg. The
figure shows the packed bed of hydrophilic glass beads (left) and its cross-sectional area
(right) showing the void space formed after the filtration tests as obtained by the HRXMT
system. The images are a reconstruction of the raw image files obtained from HRXMT.
The images shown have a voxel resolution of 4.63 |im in length, and the size o f each
image is 600 x 600 x 600 voxels. Figure 3.6 shows a color-coded reconstructed image of
the hydrophilic glass beads (green) and the water retained (red) in the filter cake formed.
53
Figure 3.5: Representative complete view (left) and cross-sectional (right) 3D image reconstructions o f the packed bed of hydrophilic glass beads (200 x 240 |im) tested at an initial vacuum pressure o f 15 inHg. The image size is 600 x 600 x 600 voxels and the voxel resolution is 4.63 |im. The sample was scanned using 4X magnification and 60 kV.

54
o
Figure 3.6: Color-coded reconstructed image of the hydrophilic glass beads filter cake obtained from the filtration tests at an initial vacuum pressure of 15 inHg. Note the water retained (red) between the hydrophilic glass beads (green) where the capillaries are formed. The cross-section was obtained from the 600 x 600 x 600 voxel 3D reconstructed image. The sample was scanned using 4X magnification, voxel resolution of 4.63 |im, and 60 kV.
Figure 3.7 shows the reconstructed images of filter cakes for the hydrophilic glass
beads cake formed with initial vacuum pressure of 20 inHg. The images shown also have
a voxel resolution of 4.63 |im in length and a size of 600 x 600 x 600 voxels. The image
on the left shows the visualization of the filter cake and the image on the right is a cross
sectional view of the cake. From the images, it can be observed that there are no
detrimental changes when compared to the images obtained from the filter cakes created
at an initial vacuum pressure of 15 inHg. However, the gravimetric analysis of the cake
moisture and volume percentage of water retained indicated that there were changes in
the amount of retained water in the cakes. Therefore, a more thorough analysis of the
capillaries and void space in the filter cakes was necessary. A detailed analysis of the
medial axis calculations and the effect of capillaries formed are discussed in Chapter 4.

55
Figure 3.7: Representative complete view (left) and cross-sectional (right) 3D image reconstructions of the packed bed of hydrophilic glass beads (200 x 240 |im) tested at an initial vacuum pressure of 20 inHg. The image size is 600 x 600 x 600 voxels and the voxel resolution is 4.63 |im. The sample was scanned using 4X magnification and 60 kV.
Figure 3.8 shows a color-coded reconstructed image of the hydrophilic glass
beads and the water retained in the filter cake formed at an initial vacuum pressure of 20
in Hg. The red color in the cross-sectional image shows the water retained (red) between
the glass beads (green) where the capillaries are formed. Figure 3.8, when compared to
Figure 3.6, does not show significant changes in pore network structure. However, the
calculated cake moisture and volume percentage of water retained were different. As
mentioned earlier, this was attributed to the amount of capillaries formed at different
initial vacuum pressures. In order to corroborate such observations, ImageJ voxel counter
plugin (2010), which counts the threshold voxels in a stack and displays the volume
fraction of voxels on that threshold, and medial axis analysis were performed for all tests.
It was found that the percentage of small capillaries was higher at an initial vacuum
pressure of 15 inHg than the number of capillaries formed in the cakes at 20 inHg.
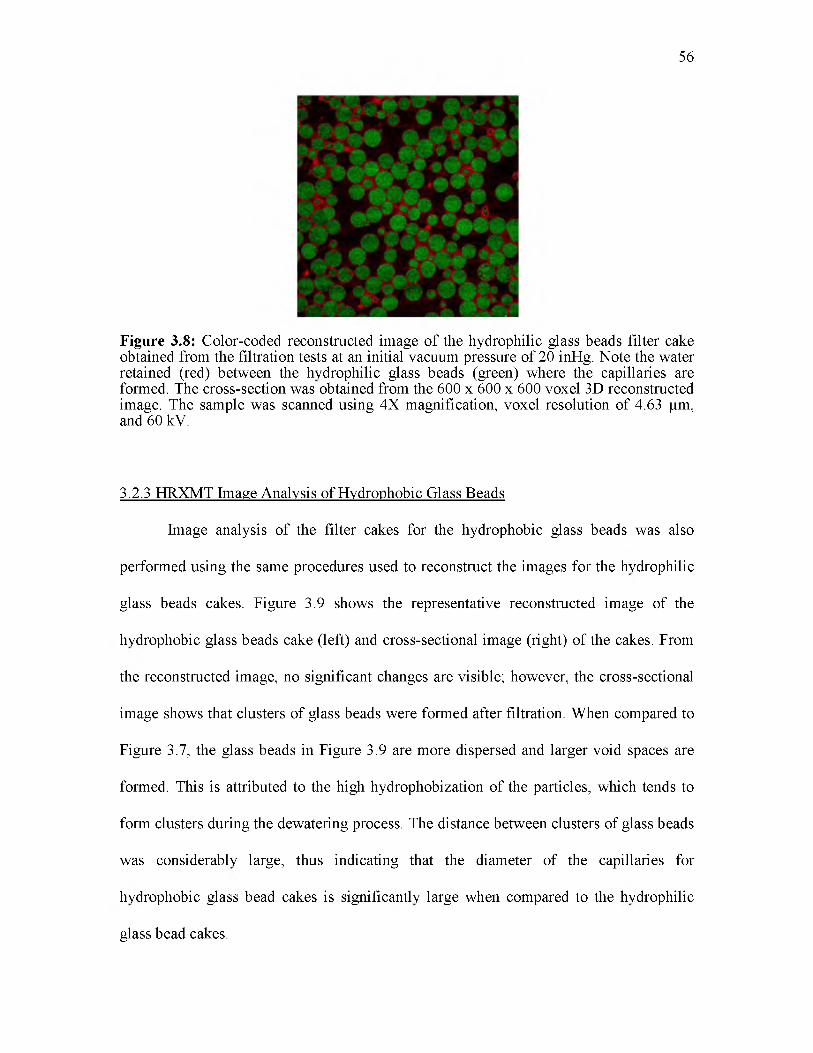
56
Figure 3.8: Color-coded reconstructed image of the hydrophilic glass beads filter cake obtained from the filtration tests at an initial vacuum pressure of 20 inHg. Note the water retained (red) between the hydrophilic glass beads (green) where the capillaries are formed. The cross-section was obtained from the 600 x 600 x 600 voxel 3D reconstructed image. The sample was scanned using 4X magnification, voxel resolution of 4.63 |im, and 60 kV.
3.2.3 HRXMT Image Analysis of Hydrophobic Glass Beads
Image analysis of the filter cakes for the hydrophobic glass beads was also
performed using the same procedures used to reconstruct the images for the hydrophilic
glass beads cakes. Figure 3.9 shows the representative reconstructed image of the
hydrophobic glass beads cake (left) and cross-sectional image (right) of the cakes. From
the reconstructed image, no significant changes are visible; however, the cross-sectional
image shows that clusters of glass beads were formed after filtration. When compared to
Figure 3.7, the glass beads in Figure 3.9 are more dispersed and larger void spaces are
formed. This is attributed to the high hydrophobization of the particles, which tends to
form clusters during the dewatering process. The distance between clusters of glass beads
was considerably large, thus indicating that the diameter of the capillaries for
hydrophobic glass bead cakes is significantly large when compared to the hydrophilic
glass bead cakes.

57
(
Figure 3.9: Representative complete view (left) and cross-sectional (right) 3D image reconstructions of the packed bed of hydrophobic glass beads (200 x 240 |im) tested at an initial vacuum pressure of 20 inHg. The image size is 600 x 600 x 600 voxels and the voxel resolution is 4.63 |im. The sample was scanned using 4X magnification and 60 kV.
In addition, it was observed that water was retained inside the clusters formed by
the hydrophobic glass beads. Figure 3.10 shows a color-coded reconstructed image of the
hydrophobic glass beads and the water retained in the filter cake formed at an initial
vacuum pressure of 20 inHg. Note amount of water retained (red) between the
hydrophobic glass beads (green) and the clusters formed by those glass beads. This is an
indication of why, even though the glass beads are hydrophobic, the cake still has
moisture of 2.5%. A gravimetric and medial axis analysis of the hydrophobic glass beads
was done and it is described in Chapter 4.
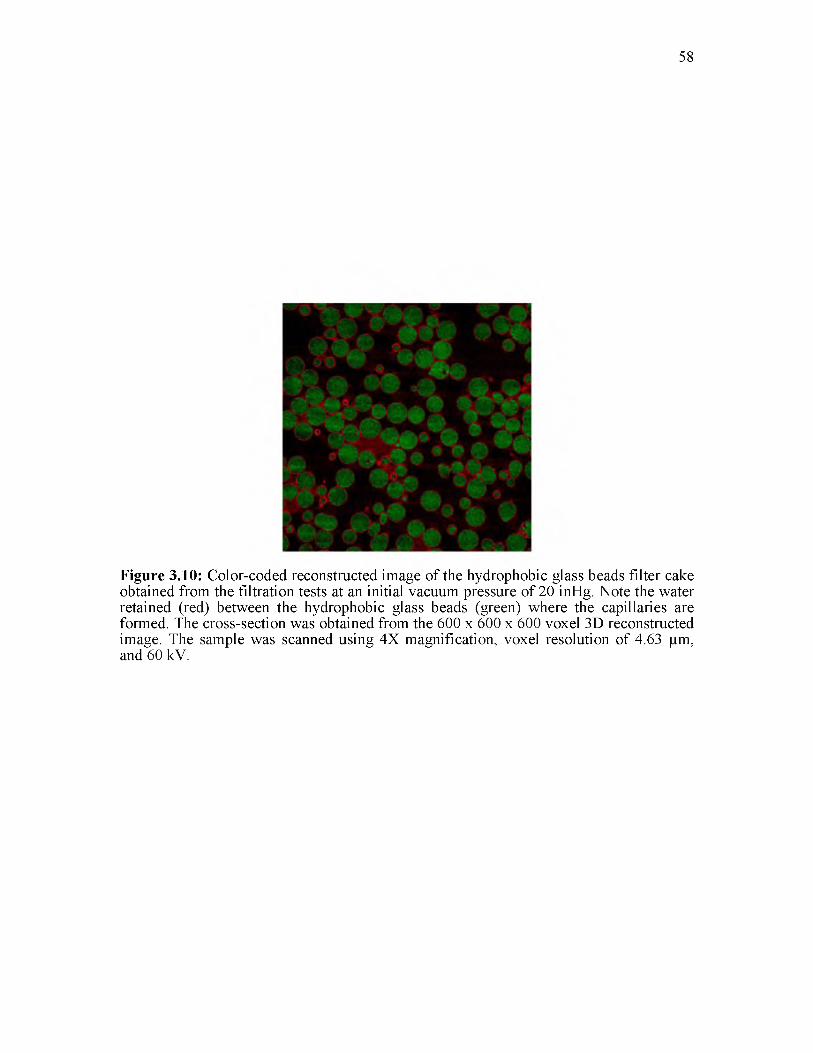
58
Figure 3.10: Color-coded reconstructed image of the hydrophobic glass beads filter cake obtained from the filtration tests at an initial vacuum pressure of 20 inHg. Note the water retained (red) between the hydrophobic glass beads (green) where the capillaries are formed. The cross-section was obtained from the 600 x 600 x 600 voxel 3D reconstructed image. The sample was scanned using 4X magnification, voxel resolution of 4.63 |im, and 60 kV.
CHAPTER 4
CHARACTERIZATION OF FILTER CAKE STRUCTURE
As indicated previously, the images obtained from the HRXMT were not enough
to indicate the different effects of pressure or particle shape on the amount of water
retained in the cakes. Therefore, an image-processing program was necessary to analyze
the formation of capillaries in the pore network structure. Voxel counter (2010), a public-
domain Java plug-in, was used because it determines the ratio of voxels with minimum
attenuation value in a specified volume. When the attenuation values are high, the x-ray
beam is highly “attenuated,” or weakened, as it passes through highly dense materials. On
the other hand, when the material is relatively less dense, low attenuation numbers are
produced indicating that the material is practically transparent to the beam. Therefore, it
is assumed that those voxels with minimum attenuation values are the voxels where
capillaries are present due to the absence of highly dense particles. In addition, medial
axis analysis was used to determine the number of small-diameter capillaries formed in
the filter cakes. Medial axis provides the information necessary to describe the topology
and geometry of a void space. In this case, medial axis was used to analyze the properties
of the capillaries formed in the filter cakes.
4.1 Voxel Counter Analysis
ImageJ (2013), a public domain Java image-processing program, and the voxel
counter plug-in for ImageJ (2010) were used for the voxel counter analysis of every
sample. Voxel counter is a plug-in that counts the threshold voxels in a stack and displays
the volume fraction of voxels on that threshold. This means that the voxel counter plug-in
measures the ratio of threshold voxels (those voxels with minimum intensity or
attenuation value) to all voxels. It is assumed that those voxels with minimum intensity
represent the void space created in the pore network structure formed by the cake.
A predetermined threshold was set for the attenuation coefficient of the water as
obtained from the HRXMT raw files. Thus, using the voxel count for the water threshold
helped identify the volume percentage of water in the samples taken from each cake.
Table 4.1 shows a comparison between the water volume percentage calculated from the
gravimetric analysis and from ImageJ voxel counter analysis. The results show that the
hydrophobic glass beads filter cake has the lowest water retention of all the samples taken
into consideration. Also, it was determined that when the pressure drop is increased, the
water retained in the cake decreases. Although the calculated and voxel counter quantities
are not identical, the trend is the same for both analyses. This could be caused by the fact
that for the voxel counter the volume considered is only a sample of the total filter cake
(it is only the ratio of threshold voxels to all voxels using only a volume fraction of the
reconstructed image), while the calculated values were determined using the whole filter
cake.
60
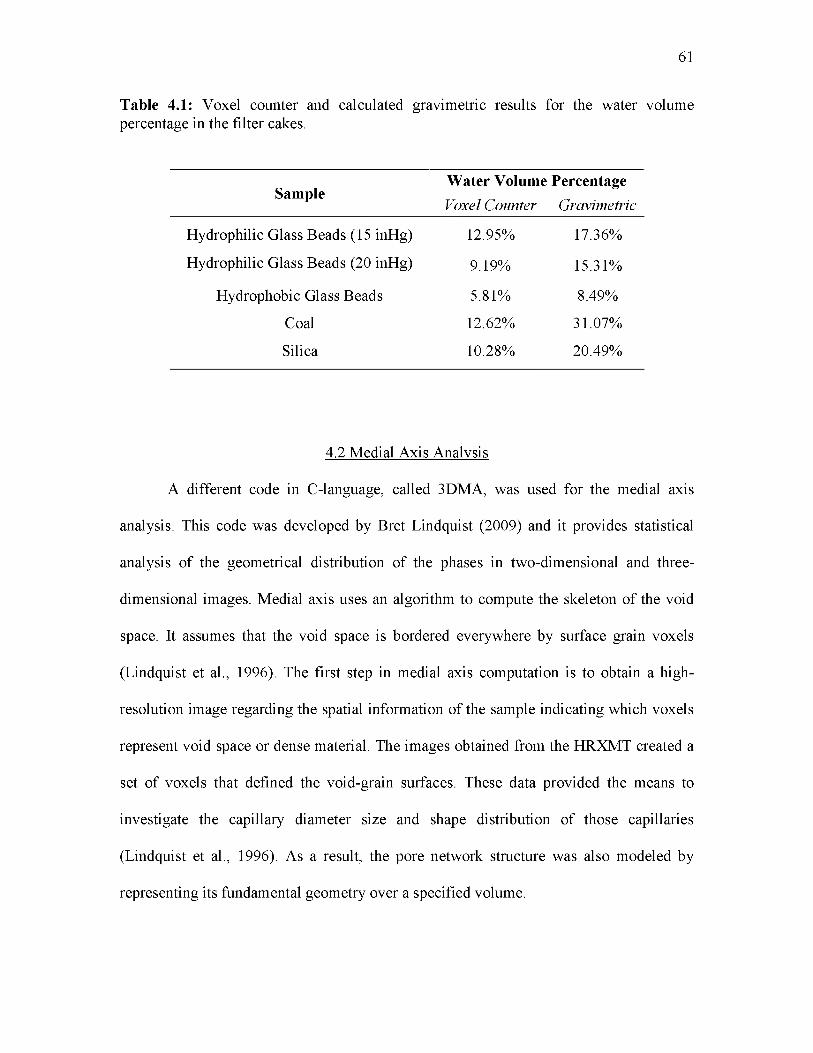
61
Table 4.1: Voxel counter and calculated gravimetric results for the water volume percentage in the filter cakes.
SampleWater Volume PercentageVoxel Counter Gravimetric
Hydrophilic Glass Beads (15 inHg) 12.95% 17.36%
Hydrophilic Glass Beads (20 inHg) 9.19% 15.31%
Hydrophobic Glass Beads 5.81% 8.49%
Coal 12.62% 31.07%
Silica 10.28% 20.49%
4.2 Medial Axis Analysis
A different code in C-language, called 3DMA, was used for the medial axis
analysis. This code was developed by Bret Lindquist (2009) and it provides statistical
analysis of the geometrical distribution of the phases in two-dimensional and three
dimensional images. Medial axis uses an algorithm to compute the skeleton of the void
space. It assumes that the void space is bordered everywhere by surface grain voxels
(Lindquist et al., 1996). The first step in medial axis computation is to obtain a high-
resolution image regarding the spatial information of the sample indicating which voxels
represent void space or dense material. The images obtained from the HRXMT created a
set of voxels that defined the void-grain surfaces. These data provided the means to
investigate the capillary diameter size and shape distribution of those capillaries
(Lindquist et al., 1996). As a result, the pore network structure was also modeled by
representing its fundamental geometry over a specified volume.
The following figures show an approximate number of capillaries according to
diameter size. Figure 4.1 shows a comparison between the coal and silica samples. The
percentage of small diameter capillaries (less than 46 microns in diameter) in coal is
higher than that of silica. The amount of small-diameter capillaries was attributed to the
irregular shape of the coal particles.
It is important to mention the significance of the formation of these small-
diameter capillaries. For instance, the cake moisture volume percentage of water retained
in coal was expected to be lower due to the hydrophobic nature of coal. However,
gravimetric calculations performed after each filtration test showed that the water
retained was higher than anticipated. Therefore, the high volume percentage of water in
the cake was associated to the number of smaller-diameter capillaries. The presence of
water entrapped in these small-diameter capillaries was later revealed by HRXMT image
analysis and voxel counter analysis. The medial axis analysis showed that the formation
of small-diameter capillaries in the coal cake had a significant effect on the amount if
water retained.
On the other hand, Figure 4.2 shows a comparison between the approximate
percentage of capillaries formed in the hydrophilic glass beads at an initial vacuum
pressure of 20 inHg and 15 inHg. The figure shows that the number of large-diameter
capillaries (larger than 46 microns) is more predominant at an initial vacuum pressure of
15 inHg. The presence of narrow capillaries in the glass beads cake filtered at an initial
vacuum pressure of 20 inHg could be attributed to the pressurization of the beads. As the
water is being pushed between the void spaces in the cake, the glass beads rearrange
when the water is being displaced thus creating the narrow capillaries.
62

63
Medial Axis (LKC) Computation
Coal Silica
Boundary Distance/Capillary Diameter (pm)
Figure 4.1: Medial axis pore analysis of the coal and silica (149 x 250 |im) filter cakes.
Medial Axis (LKC) Computation
GB Hydrophilic 20 inHg GB Hydrophilic 15 inHg
Boundary Distance/Capillary Diameter (pm)
Figure 4.2: Medial axis pore analysis of the hydrophilic glass beads (200 x 240 |im) filter cakes tested at initial vacuum pressure of 20 inHg and 15 inHg, respectively.
This shows that not only wettability but also pressure changes will influence the
amount of water retained in the filter cake. The presence of narrow capillaries prevents
the water from filtering, but increasing the pressure drop can overcome the capillary
forces and the water retention decreases. This analysis corroborates the gravimetric and
image analysis results indicating that the volume percentage of water retained in the cake
increases at a lower initial vacuum pressure. This demonstrates that the higher moisture
retention in the hydrophilic filter cake is due not only to the size of the capillaries, but
also to the change in pressure. Thus, the change in pressure affects the number of small-
diameter capillaries formed within the filter cake and, therefore, the amount of water
retained.
Medial axis analysis was also performed for the hydrophobic and hydrophilic
glass beads samples tested at an initial vacuum pressure of 20 inHg, and the results are
shown in Figure 4.3. The results showed that the hydrophobic glass beads filter cake had
a higher percentage of large-diameter capillaries, and a lower percentage of small-
diameter capillaries than the hydrophilic glass beads filter cake. The pore sizes for the
hydrophobic glass beads ranged from 9.26 microns to 416 microns, while the hydrophilic
glass beads had pore sizes ranging from 9.26 microns to 240 microns. The low cake
moisture and volume percentage of water retained was attributed to the wettability factor
and the amount of small-diameter pores in the filter cake. The hydrophobic glass beads
filter cake repelled most of the water during the dewatering process, thus showing that
the wettability plays a considerably important role in the filtration process when pressure
is kept constant.
64

65
Medial Axis (LKC) ComputationHydrophilic Glass Beads (20 in Hg) Hydrophobic Glass Beads (20 in Hg)
Boundary Distance/Capillary Diameter (^m)
Figure 4.3: Medial axis pore analysis of the hydrophilic and hydrophobic glass beads (200 x 240 |im) filter cakes tested at initial vacuum pressure of 20 inHg.
4.3 Pore Network Structures
The medial axis pore computation provided the information necessary to describe
topology and geometry of the void space. This topology and geometry is commonly
known as the pore network structure. The pore network structure can be used to create a
3D visualization of the void space in the sample, and it can subsequently be used for
Lattice-Boltzmann simulations. In this research, the pore network structure was obtained
using the 3DMA code. Through a series of algorithms, the code produces a geometric
analysis of the void-grain surface to describe the geometry and topography of the void
space. Once this analysis is done, an image-processing program can be used to create a
concrete representation of the data obtained through 3DMA.

Figure 4.4 shows the porous network structure as obtained using the 3DMA code
and the image processing program VolSuite (2009) to create the visual representation of
the pore network structures. All images were taken from raw image files of 300 x 300 x
300 voxels after the medial axis was computed to illustrate the difference in the pore
network structures of each sample. The medial axis images have been used since they
represent the skeleton of the void space. The images were color-coded to identify the
diameter of the capillaries. As indicated by the caption in Figure 4.4, the red color
describes 1 radius and the blue color is equal to 5 radii. Each radial unit is equal to 4.63
microns; therefore, the red and blue colors represent 9.26 microns and 46.30 microns in
diameter, respectively.
It can be observed that the presence of the red colored pores in the hydrophobic
glass bead filter cake is not as abundant as in the other samples. This reflects the presence
of larger diameter capillaries and consequently less water retention. In the case of the
silica and coal samples, the coal pore network structure had narrower capillaries than that
of the silica sample, thus indicating a tendency to retain more water.
66

67
’ ‘ £? It4 <s ' 5
MMMMMMMMMMMMMUMMMMJ-iM^MMMMri
Radius Unit = 4.63 micronFigure 4.4: Pore network structures of the 1) hydrophilic glass bead filter cake tested at initial vacuum pressure of 15 inHg, 2) hydrophilic glass bead filter cake tested at initial vacuum pressure of 20 inHg, 3) hydrophobic glass bead filter cake, 4) coal filter cake, and 5) silica filter cake. All images have an image size of 300 x 300 x 300 voxels.

CHAPTER 5
LATTICE-BOLTZMANN SIMULATIONS
This chapter describes the Lattice-Boltzmann Method (LBM) and presents the
simulations performed during this thesis research. The LBM applies numerical
simulations of fluid flow in the real porous structure which leads to the determination of
the local flow conditions for single and multiphase flow in the actual complex pore
structure. In this case, the intent of using the LBM is to describe the conditions that could
lead to improved water removal and minimum cake moisture content during the
dewatering process. The high resolution x-ray microtomography (HRXMT) results
obtained from the medial axis and pore network structure analysis was used to simulate
multiphase dewatering processes. However, this is a challenging problem due to the
complexity of the physical phenomena involved, such as wettability and particle shape,
and the size of the computing resources required.
5.1 The Lattice-Boltzmann Method Equation
The particle distribution function used in LBM was developed from the
Boltzmann equation, which was formulated from kinetic theory. The particle distribution
function is a function of the fluid velocity, density and temperature, and it is chosen in
such a way that its combination with a lattice with enough symmetry recovers the Navier-
Stokes equation for fluid flow (Succi, 2001). It considers a gas with spherical particles
moving at great velocity thus producing elastic collisions between the particles.
Hypothetically, for each particle, it would be possible to know the position vector (x) and
momentum (p) at some instant in time. This would give the exact dynamical state of the
system and predict all future states. Thus, the system can be described as a distribution
function with N number of particles, J(N)(xN,pN,t) (Sukop & Thorne, 2006). This concept
also assumes that collisions are constant and no particles are lost.
The distribution function gives the probability of finding a particular particle with
a given position and momentum. However, when an external force F is introduced, the
position of the particle changes and it can be described by the rate of change in position
and momentum at a particular time t, / 1(x1,p1,t) dxdp (Sukop & Thorne, 2006). This is
known as the streaming process in the model. In addition, the subsequent collision may
result in some points starting at (x,p) arriving at the new (x+dx,p+dp), while others
starting at the same (x,p) positions will not arrive to that location. This is known as the
collision process in the model (Sukop & Thorne, 2006). In order to integrate the scattered
particles in the model, the terms dxdpdt and ]++ dxdpdt are integrated into the model
which indicate the number of particles that do not arrive and arrive, respectively, to the
expected portion of phase space due to the collisions during time dt (Sukop & Thorne,
2006). The expression then becomes f 11(x1,p1,t) dxdp + []++ - dxdpdt, which is an
expression that adds the changes in the particle distribution function due to the collisions.
This expression can be then expanded by Taylor series and obtain the Boltzmann
6f a)equation used in the LBM: v- V + F- V + —— = Q, where F is the external force,
x p dt
69

and Q is the collision integral ( [ r (+) - r (-)]). The fundamental equation for the LBM
(Sukop & Thorne, 2006) is thus established. However, solving this equation analytically
is very challenging and can only be done for special cases. For this, the Lattice-
Boltzmann method uses relevant equations to create the simulation and solve for the
equation. That means that the LBM incorporates several other equations to obtain a final
solution. Hence, the LBM is not just based in one equation, but in microscopic models
and mesoscopic kinetic equations. The fundamental idea of the of the LBM is to
construct simplified kinetic models that incorporate the essential physics of microscopic
and mesoscopic processes so that the macroscopic averaged properties obey the desired
macroscopic equation (Chen, 1998).
The description of fluid motion can be done at different scales. On the other hand,
the microscopic level requires the description of each fluid particle based on Newton’s
Law of motion and the influence of microscopic forces. This level of description has
given origin to the computational branch known as Molecular Dynamics. On the other
hand, we have the macroscopic level of description with computational fluid dynamics
(CFD) which is based on the very well known Navier-Stokes equation and its continuum
description. In between these two scales we find the LBM which belongs to the group of
mesoscopic methods which are based on a statistical mechanics approximation and
describes the fluid motion in terms of distribution functions.
5.2 Procedure for LBM and Multiphase Simulation Analysis
The computational procedure for the LBM simulation followed the same method
indicated by Videla (2009). The samples were scanned under similar conditions and the
70
pore network structure was also obtained. The He-Chen-Zhang model (1999) was used to
simulate the interfacial dynamics from mesoscopic kinetic equations (Videla, 2009).
Simulations were carried out using representative volumes of the samples of 254 x 254 x
256 voxels in size. Even though the images obtained from the HRXMT and the image
analysis software were bigger in size, the representative volume elements used for the
LBM simulations were smaller due to the computer resources available. However, the
scaling is representative of the whole sample and requires less computing requirements
for implementation.
The implemented methods for computation (LBM) were programmed in C-
language, and ParaView (2007), an open source, multiplatform data analysis and
visualization application was used for 3D visualization of the simulations. The LBM was
parallelized in order to reduce the processing time. Parallelization involves the
simultaneous computation of different calculations that are solved concurrently. Through
this process the computation times are reduced significantly. In this process, the LBM
simulation was carried out using a computer with Intel Xeon dual processors, quad core
machine with 2.66 GHz in each processor and a total of 64 GB in RAM memory. Each
simulation was run using different iterations. It was observed during the simulations that
on samples of 254 x 254 x 256 voxels in size or smaller, parallelization running in 4
processors, and for 10,000 iterations, it took approximately 20 hours to complete the
simulation.
The geometry of the pore network structure obtained from the raw data using the
C-language program 3DMA was programmed into the LBM code. Different simulations
conditions were established before the simulation was run such as the number of
71

iterations, the lattice dimensions, and the boundary conditions (Videla, 2009). For each
simulation, the execution time was recorded as well as the number of iterations reached
for breakthrough, and an animation was generated for further image analysis. Once the
simulation was completed, raw data were converted to a form that is viewable and
understandable using ParaView. Visualization with Paraview allowed for a well-defined
representation of the simulation in 3D space. The following section describes the analysis
performed using LBM and Paraview.
5.3 LBM and Multiphase Simulations
The use of the LBM is not only for velocity profiles or flow simulations of single
components as showed before. The LBM can also be used for multicomponent, multi
phase, situations. For these simulations, the LBM algorithm is changed a little and a new
index relevant to the arrays of the lattice and new loops for the two components is
introduced (Succi, 2001; Sukop & Thorne, 2006). In multicomponent simulation, the
phase separation can be thought of as a hydrophobic interaction (Sukop & Thorne, 2006).
During simulation, the fluid flows through the pore network structure having a specific
connectivity with well defined pore dimensions. The simulation not only determines the
local flow patterns but also the overall permeability of the sample.
The multicomponent simulations have been of great importance for industry for
the past few years. They are, for example, of significant importance for the oil industry
because petroleum is often found with water. Another important example is that of
filtration processes in the mineral processing industry. In this case, the interaction
between air and water is studied and simulated and its numbers are applied to the
filtration process.
72
The He-Chen-Zhang model (1999) and the images obtained from the HRXMT
analysis were used to simulate flow in each filtration cake studied. The HRXMT images
provided a digital representation of the pore network structure showing the complex
geometry of the capillaries. On the other hand, the He-Chen-Zhang model (1999)
provides the means for single component multiphase flow using the LBM. It is important
to mention that, although the images analyzed during this research were of sizes 600 x
600 x 600 voxels, the processing and computer capabilities were not sufficient to evaluate
and simulate fluid flow on those images. Therefore, the images were reduced to a smaller
size.
Figure 5.1 shows the reconstructed coal and silica images obtained from the
HRXMT. The particle size range is 149 x 250 |im and the subset images are 254 x 254 x
236 voxels. It is important to indicate that the subset size is significantly small because
the computational capabilities to run the LBM were limited. The medial axis and voxel
counter analysis were also generated and calculated to carry out the LBM simulations.
The results from the LBM simulations run for the coal and silica filter cakes are
shown in Figures 5.2 and 5.3, respectively. Again, due to the computational capabilities
at the University of Utah, only a few iterations were run. This is a time-consuming
process and saturating the computer with a large number of iterations may crash the
program. It is noted that the penetration of the fluid front for silica with 30,000 iterations
is almost the same as the penetration of the fluid front for coal with 60,000 iterations.
73

74
Figure 5.1: Subset of the 3D image reconstructions of the coal and silica filter cakes with particle sizes of 149 x 250 microns and a voxel resolution of 4.63 ^m used for 3D LBM simulations. The image size is 254 x 254 x 236 voxels. The coal sample was scanned using 4X magnification and 40 kV. The silica sample was scanned using 4X magnification and 60 kV.

75
Figure 5.2: Results of LBM simulations of multiphase flow through a packed bed of coal filter cakes with particle size of 149 x 250 ^m and image size of 254 x 254 x 236 voxels. Images show fluid penetration after 60,000 iterations.

76
Figure 5.3: Results of LBM simulations of multiphase flow through a packed bed of silica filter cakes with particle size of 149 x 250 ^m and image size of 254 x 254 x 236 voxels. Images show fluid penetration after 30,000 iterations.

It can be observed in Figures 5.2 and 5.3 that the fluid does not go through
completely from the top to the bottom of the filter cake subset. Evaluating the actual
potential of the LBM to simulate real multiphase problems was challenging not only
because of the complexity of the physical phenomena, but also because of the size of the
computing resources required to run simulations for larger subsets.
Each simulation required an intensive use of computing resources. Running
simulations on large subsets is not very practical since the memory requirements are
extremely large and the processing times are very long. Because of this, sometimes it is
convenient to parallelize the LBM. Through parallelization, many calculations can be
carried out simultaneously and concurrently using multiple processors. This accelerates
the LBM computations and the results are available faster. For this research, the single
component multiphase He-Chen-Zhang model used for the LBM simulations was
parallelized. The simulations were performed using a computer with Intel Xeon dual
processors, quad core machine with 2.66 GHz in each processor, and a total of 64 GB in
RAM memory. A typical simulation for a 256 x 256 x 256 lattice for 10,000 iterations
took approximately 20 hours (parallelization running in 4 processors), and used around
12 GB in RAM memory or 715 bytes/node. Depending on the sample, approximately
100,000 to 200,000 iterations were required for the breakthrough of the whole packed
particle bed (256 layers). Now, graphics processing units (GPU) accelerate and facilitate
the computations for these simulations. GPU computing is continually evolving and the
processing time for this type of analysis is expected to be reduced.
In this regard, breakthrough for the filter cake is the parameter that indicates when
to terminate the simulation and determine the residual moisture content inside the filter
77

cake. The breakthrough for the coal sample required more iterations than that of the silica
sample. Figure 5.4 and Figure 5.5 show the simulated penetration of the fluid front for
coal and silica at different iterations, respectively. The images on the left show the fluid
flow penetration, while the images on the right show the fluid retained in the sample. It
can be observed that at breakthrough points the fluid is completely displaced using the
simulations and image reconstructions. Figure 5.3 also shows the formation of finger-like
capillaries growing in all directions. These capillaries trap the displaced fluid and lead to
a higher moisture content in the sample. This is representative of capillary fingering
described by Lenormand et al. (1988) and Lin et al. (2010), and becomes the dominant
force in the dewatering process. On the other hand, the silica sample (Figure 5.4) exhibits
continuous finger-like that spread across the porous network. In this case, the major force
is due to capillary fingering but with relatively short fingers.
78
Figure 5.4: Surface of the penetration of fluid front is extracted at 80,000 iterations during LB simulation for coal filter cake with particle size 149 x 250 ^m and image size of 254 x 254 x 236 voxels. The image on the left shows the fluid penetration and corresponding breakthrough. The image on the right shows the fluid retained in the sample after 80,000 iterations.

79
Figure 5.5: Surface of the penetration of fluid front is extracted at 40,000 iterations during LB simulation for silica filter cake with particle size 149 x 250 ^m and image size of 254 x 254 x 236 voxels. The image on the left shows the fluid penetration and corresponding breakthrough. The image on the right shows the fluid retained in the sample after 40,000 iterations.
Figure 5.6 shows 3D simulations of the fluid front penetration using the He-Chen-
Zhang model applied to a packed bed of hydrophilic glass beads using the reconstructed
pore network structure from the HRXMT image analysis. In this simulation, the fluid
penetration was induced by a fixed pressure difference using the LBM. The same
procedure used to analyze the fluid penetration for coal and silica was used for this
sample. The density parameter was also established for this simulation so that the low-
density fluid displaces the heavy fluid (density ratio 1 to 3). According to the Lenormand
diagram (Figure 1.6) a stronger viscous fingering type of flow was expected as more and
longer fingers were formed due to the stronger viscous interaction and interface front
instability. As the comparison shows, there is a clear qualitative agreement between
theory and simulations. Fingers are formed in zones of low resistance to flow and once

80
Figure 5.6: Sequence of simulations of two-phase flow in a packed bed of hydrophilic glass beads particles (200 x 240 |im). Percolation simulations by the single component He-Chan-Zhang LBM. (Density ratio = 1/3; Lattice size of 256 x 256 x 256 voxels; Images for 1, 10,000, 30,000 and 50,000 iterations).
formed they start growing rapidly towards the exit. In fact, the lower images (at iterations
of 30,000 and 50,000), 5 to 6 fingers are clearly identified (lower right-side image). The
breakthrough for the filter cake, which depends on the deepest finger tip, is the parameter
to terminate the simulation and determine the residual moisture content inside the filter
cake. In this case the breakthrough value was 50,000 iterations.
Figure 5.7 shows the comparison of the same 3D simulations of the interface
advance shown in Figure 5.6 against a new simulation where packed silica sand (149 x
250 ^m) was used. It can be observed in Figure 5.7 that the simulation starts from
complete saturation (one iteration) and continues to displace the fluid as the number of
iterations is increased. The low-density phase displaces the high-density phase until it
reaches the breakthrough point after 120,000 iterations. As the high-density phase is
being displaced, the low-density phase moves through paths of least resistance (coarse
pore diameters). However, the low-density phase is not able to penetrate and move
through small pores due to the high flow resistance. Therefore, some residual high-
density phase gets trapped in the small-diameter pores. The presence of narrow pores
prevents the high-density phase from moving, and only an increase in pressure drop can
increase the flow of the high-density phase through these narrow pores. According to the
Lenormand diagram (Figure 1.6), the pattern of percolation shows a capillary fingering
type of flow with relatively short fingers. It was noted that the penetration of the fluid
front for complete breakthrough for packed beds of silica sand and hydrophilic glass
beads were 120,000 and 50,000 iterations, respectively.
81

82
Figure 5.7: Sequence of simulations of two-phase flow in a packed bed of silica sand particles (particle size 150 x 212 ^m). Percolation simulations by the single component He-Chan-Zhang LBM. (Density ratio = 1/3; Lattice size of 256 x 256 x 256 voxels; Images in increments of 40,000 iteration steps each).
CHAPTER 6
CONCLUSION
The combination of HRXMT image analysis and LBM simulations demonstrated
the actual potential to simulate real multiphase problems. The analysis obtained from the
simulation results can be compared to experimental data in order to describe the
conditions that can lead to improved water removal and minimum cake moisture content
during the dewatering process. Moreover, the characterization obtained through HRXMT,
with resolution of less than 1 micron, can be used to analyze particles as small as 10
microns. This becomes important especially when very small particles are present in filter
cakes.
The analysis performed on coal and silica filter cakes showed that particle shape
is one of the most important factors in the retention of moisture during filtration when
other characteristics are kept constant, as shown in Chapters 4 and 5. Because of this,
spherical glass beads were used to eliminate the effect of particle shape. In addition, to
incorporate the wettability effect, half of the glass beads were hydrophobized with OTS.
As expected, the vacuum filtration tests (Tables 2.6 and 2.7) showed that, in fact,
hydrophobic particles retain less moisture than the corresponding hydrophilic particles.

In addition, it was observed that the hydrophobic glass beads agglomerated in
such a way that clusters were created trapping water after filtration (Figures 3.9 and
3.10). This was attributed to the high hydrophobicity of the glass beads. The results
showed that when the shape factor is not a significant variable, the water retention
becomes dependent on the wettability characteristics and pressure drop. The wettability
effect of the particles studied in this research is consistent with other studies regarding
wettability effects in the dewatering process (Asmatulu & Yoon, 2012; Yoon et al.,
2006).
Moreover, tests with different pressure drops were performed for the hydrophilic
glass beads. Although the pore network structure analysis showed that the capillaries
were narrower at higher initial vacuum pressures (Figure 4.2), the increase in pressure
drop decreased the amount of water retained in the filter cake. This was corroborated
through gravimetric calculations and voxel counter computations (Table 4.1) that showed
the same trend indicating that the volume percentage of water retained in the cake
increases at a lower initial vacuum pressure. The pressure drop increase helped overcome
the capillary forces that retain the water in the filter cakes.
The HRXMT images were reconstructed using ImageJ in order to visualize the
overall 3D image. Also, the 3DMA code and the open source software VolSuite, ImageJ,
and ParaView were used to reconstruct the pore network structure (Figure 4.4). The
processing programs showed that the pore network structure has a big influence on the
retention of water in the filter cake. After voxel counter and medial axis analysis, narrow
capillaries were found in the filter cakes with hydrophilic particles, while wider
capillaries were mostly found in the filter cakes with hydrophobic particles (Figure 4.3).
84
The hydrophobic glass beads filter cake repelled most of the water during the dewatering
process, thus showing that wettability plays a considerably important role in the filtration
process as indicated by Asmatulu and Yoon (2012). In the case of the coal sample, small-
diameter capillaries (Figure 4.1) were formed due to the presence of irregularly shaped
particles.
The implementation of the 3D software capabilities of parallelization for the LBM
simulation of multiphase fluid flow in porous media was successfully accomplished
(Figures 5.1 through 5.6). The single component multiphase flow He-Chen-Zhang LBM
model was extended to incorporate fluid-solid interaction forces, and was applied to the
simulation of percolation in actual HRXMT images of pore network structures created by
filtration experiments.
The pattern of percolation with viscous fingering type of flow was observed with
more and longer fingers being formed for packed particle beds of hydrophilic glass beads.
The instability was due to the stronger viscous interaction as revealed from 3D flow
simulations. However, the pattern of percolation with capillary fingering type of flow
with relatively short fingers was observed for packed particle beds of silica sand.
Due to the limitations in computing resources, only subsets of specific sizes were
investigated. Improvements in this area are necessary to describe percolation behavior
under different circumstances and larger volume sets. Future research efforts should
include different strategies that allow for the computation of LBM simulations requiring
different computing resources. This could lead to notable improvements in our
understanding of filtration processes and the application of LBM simulations in different
porous media.
85

APPENDIX A
SINGLE COMPONENT SINGLE PHASE LBM
The classical approach (Tiller, 1975; Dahlstrom & Silverblatt, 1977; Svarosvsky,
1990) for filtration analysis is based on Darcy’s law, an empirical equation that describes
one-dimensional fluid flow through uniform incompressible porous media. Knowledge of
cake pore microstructure and its correlation to macroscopic cake properties is required to
model the filtration from a fundamental point of view. Darcy’s law is defined as:
TT Q 1 dV k ApU = ^ = ----- ~ = ^ ~ (A.1)
A A dt ju£
where U is the fluid velocity (m/s), Q is the volume flow rate (m3/s), V is the volume of
3 2the fluid (m ), k is the permeability (m ), ^ the dynamic viscosity of the fluid (Pa s), A
the cross-sectional area (m2) of the one-dimensional sample of length (or thickness of
porous media) I (m), and Ap is the pressure drop (Pa).
The single component, single phase LB model has been used as a common tool to
study transport phenomena through pore space (Lin & Miller, 2004; Videla, Lin &
Miller, 2007). In this regard, permeability was computed by modeling Stokes flow in
both the simulated pore space of a packed bed and actual 3D digital pore space from
HRXMT analysis using the LB method. Calculation of permeability is summarized here
as follows.

87
2For nonoverlapped spheres, the permeability k (unit of length2) is related to the
drag coefficient Cd,
k (A.2)6nRC d
where v is the unit cell volume, and R is the sphere radius.
For Darcy flow,
(A 3)dP / dx
Compared with Equation A.2, u is the fluid velocity, average across an inlet or
outlet face of the unit cell (including solids), j is the dynamic viscosity, and dP/dx is the
pressure gradient along the x-direction. Formally, the LB used in this study is a constant-
pressure model, so the pressure gradient must be related to the body force. To relate the
permeability to units measured in the LB simulation, a force balance was applied:
or (dP/dx) = - xBodyp, where L is the side of the simulation cell (in lattice units), xBody
is the body force, applied in the x-direction, per unit volume in the LB simulation, and p
is the particle density per site specified in the LB simulation. Thus,
xBodypL3 = (Pin - Pou) L2 = -(dP/dx) L3 (A.4)
xBody(A.5)
where v = p/p = ( t -1/2)/3 is the kinematic viscosity specified in the LB simulation as
2shown in Equation A.2. Customarily k/L , normalized permeability, is reported rather
than k to achieve scale-independence.

APPENDIX B
PHYSICS OF MULTIPHASE FLOW IN POROUS MEDIA
The flow of two immiscible fluids sharing simultaneously the complex pore space
in porous medium is governed by the forces acting on the fluids, including pressure
forces, viscous forces, gravity forces, inertia forces and interfacial surface forces (Videla,
2009). The relative importance of these forces is usually characterized by the Reynolds
(Re), Bond (Bo), and Capillary (Ca) numbers, as well as the viscosity ratio (M) and these
parameters are defined in Equations B.1 through B.4, respectively:
Re = — (B.1)
g(p — p )• R2Bo = g \pnw pw)----- (B 2)r
Ca = VwMw (B.3)
M = nw(B.4)
Mw
In general, flow in porous media is dominated by the capillary forces, where
inertia forces are negligible, and pressure forces and viscous forces are proportional to the
rate of flow. Because the pressure forces and viscous forces depend on the flow rate, the
89
capillary forces and gravitational forces become more important when the rate of flow is
slower.
When two immiscible fluids are in contact in the porous medium a discontinuity in
pressure exist across the interface (Videla, 2009). The difference in pressure is called the
capillary pressure. The capillary pressure is defined as the difference between the
pressures of the non-wetting fluid, p , and the wetting fluid, pw , as shown in Equation
Figure B.1 shows a curved interface between two immiscible fluids under static
equilibrium. From the figure it is observed that capillary pressure depends on the
curvature of the interface. In soil science, the negative of the capillary pressure is known
as tension or suction head.
Interfacial shapes in static and quasi-static situations are governed by the Laplace
equation. By applying the condition of mechanical equilibrium of the forces acting on the
interface, Laplace showed that the capillary pressure is proportional to the interfacial
tension and inversely proportional to the curvature of the meniscus. Laplace’s law is
presented in Equation B.6 for a 3D pore structure and is dependent on the interfacial
tension yl2 and the radii of curvature, r*:
B.1 Capillary Pressure
B.5:
p c p nw p w (B 5)
(B 6)
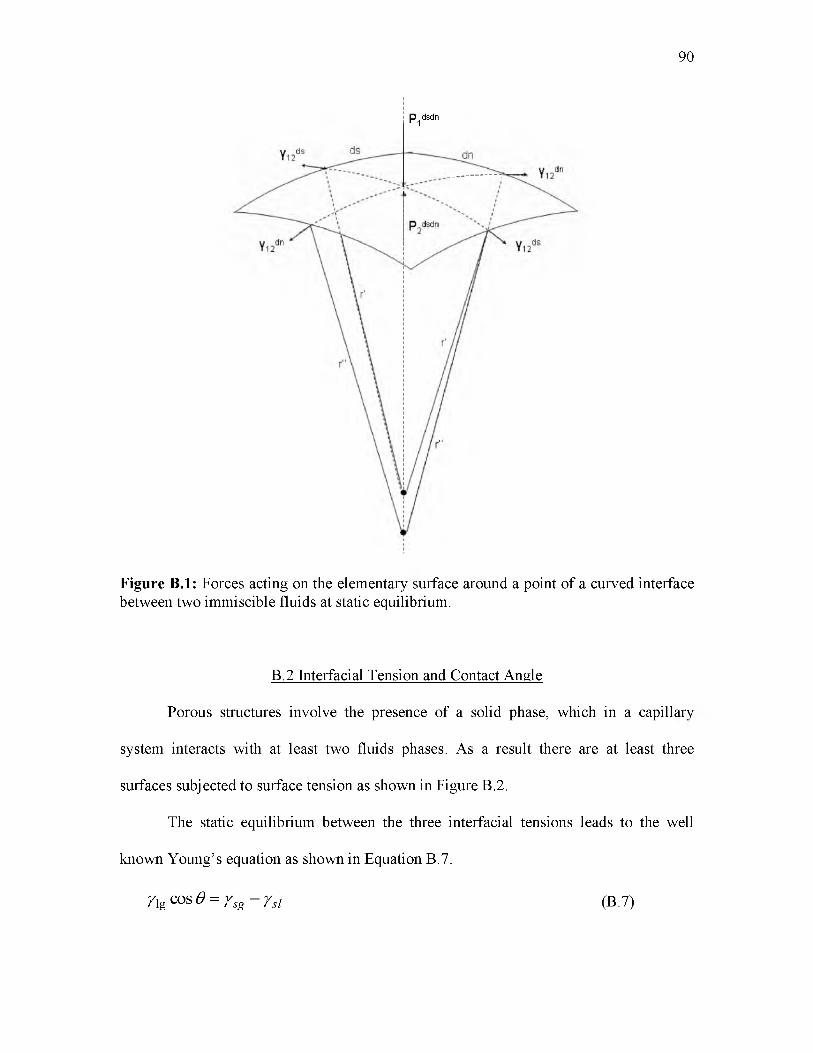
90
p dsdn r 1
Figure B.1: Forces acting on the elementary surface around a point of a curved interface between two immiscible fluids at static equilibrium.
B.2 Interfacial Tension and Contact Angle
Porous structures involve the presence of a solid phase, which in a capillary
system interacts with at least two fluids phases. As a result there are at least three
surfaces subjected to surface tension as shown in Figure B.2.
The static equilibrium between the three interfacial tensions leads to the well
known Young’s equation as shown in Equation B.7:
n g C °s 0 = /sg ~Ysi (B.7)

91
Yig
Ysg
Figure B.2: Static equilibrium between the three interfacial tensions at the solid surface.
The contact angle is normally used to describe the preferential characteristics of
the solid surface to be wet. In some cases, no equilibrium is possible (̂ lg >ysg - y sl) and
the liquid covers the whole surface completely, in such cases the liquid is said to wet the
solid perfectly (Videla, 2009).
B.3 Capillary Pressure Versus Saturation Curves
The capillary pressure depends on the saturation, interfacial tension, wetting
angle, viscosity ratio and Bond number (Marle, 1981). Because the capillary pressure
depends on the contact angle one may expect a hysteresis effect, meaning that different
capillary pressure - saturation curves are obtained depending on the history of the fluid
motion. For example, the capillary pressure - saturation curve may depend on whether a
sample was initially saturated with the wetting or nonwetting fluid component. If the
sample is initially saturated with the wetting fluid an increment of the capillary pressure
produces the displacement of the wetting fluid by the nonwetting fluid in a process
known as drainage. If the sample is initially saturated with the nonwetting fluid, a
decrease in the capillary pressure produces imbibition. Figure B.3 shows a typical curve
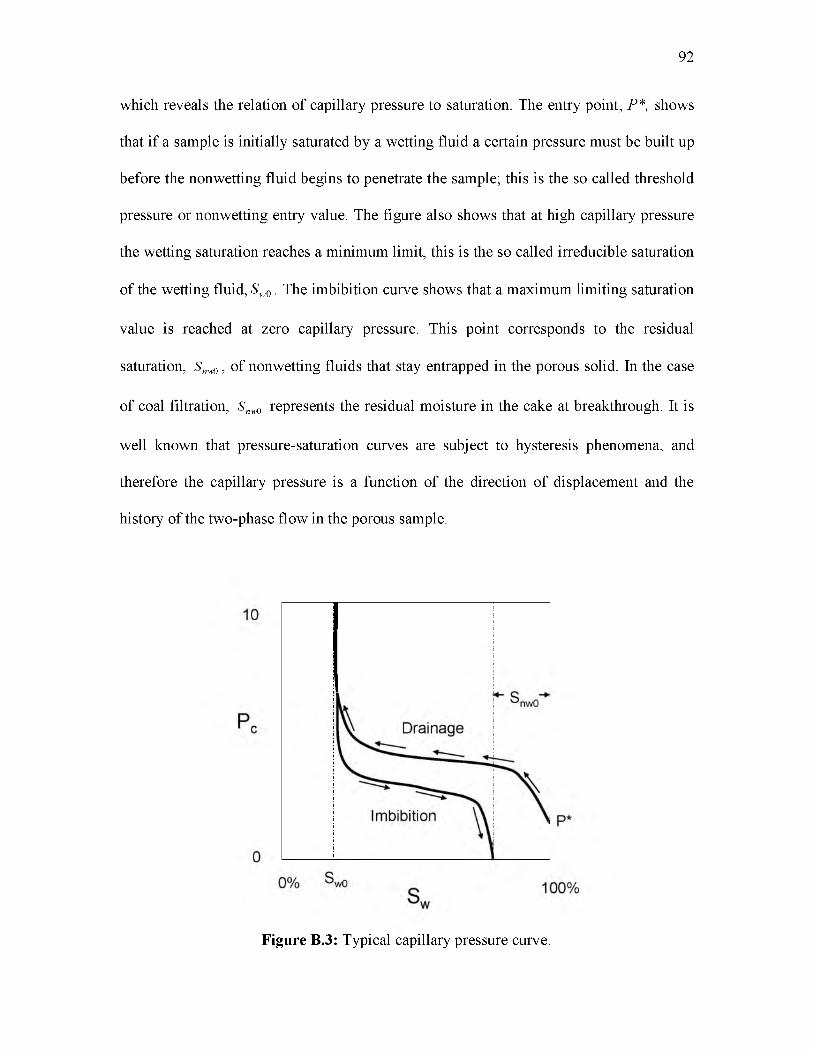
which reveals the relation of capillary pressure to saturation. The entry point, P*, shows
that if a sample is initially saturated by a wetting fluid a certain pressure must be built up
before the nonwetting fluid begins to penetrate the sample; this is the so called threshold
pressure or nonwetting entry value. The figure also shows that at high capillary pressure
the wetting saturation reaches a minimum limit, this is the so called irreducible saturation
of the wetting fluid, Sw0. The imbibition curve shows that a maximum limiting saturation
value is reached at zero capillary pressure. This point corresponds to the residual
saturation, Snw0, of nonwetting fluids that stay entrapped in the porous solid. In the case
of coal filtration, Snw0 represents the residual moisture in the cake at breakthrough. It is
well known that pressure-saturation curves are subject to hysteresis phenomena, and
therefore the capillary pressure is a function of the direction of displacement and the
history of the two-phase flow in the porous sample.
92
Figure B.3: Typical capillary pressure curve.
REFERENCES
Asmatulu, R., & Yoon, R. H. (2012). Effects of surface forces on dewatering of fine particles. Paper presented at the Separation Technologies for Minerals, Coal, and Earth Resources, 95-101.
Chen, H. (1993). Discrete Boltzmann systems and fluid flows. Comput. Physics, 7, 632637.
Chen, S., & Doolen, G. (1998). Lattice-Boltzmann method for fluid flows. Annu. Rev. FluidMech., 30, 329-364.
Cormack, A.M., & Doyle, B.J. (1977). Algorithms for two-dimensional reconstruction. Phys. Med. Biol., 22, 994-997.
Dahlstrom, D.A., & Silverblatt, C.E. (1977). Continuous vacuum and pressure filtration. In D.B. Purchas (Ed.), Solid Liquid Separation and Scale Up. Croydon: Up Lands Press.
Ennis, B., Green, J., & Davis, R. (1994). The legacy of neglect in the U.S. Chemical Engineering Progress, 90, 31-43.
Frish, U., Hasslacher, B., & Pomeau, Y. (1986). Lattice gas automata for the Navier- Stokes equations. Phys. Rev. Lett., 56, 1505-1508.
He, X., Shan, X., and Doolen, G. (1998). Discrete Boltzmann equation model for non ideal gases. Phys. Rev. E., 57, R13.
He, X., & Doolen, G. (2002). Thermodynamics foundations of kinetic theory and Lattice- Boltzmann models for multiphase flow. J. Stat. Phys., 107, 309-328.
He, X., Chen, S., & Zhang, R. (1999). A Lattice-Boltzmann scheme for incompressible multiphase flow and its applications in simulation of Rayleigh-Taylor instability. J. Comput. Phys., 152, 642-663.
Hsieh, C.H. (2012). Procedure and analysis of mineral samples using high resolution x-ray microtomography. (Unpublished master‘s thesis). University of Utah, Salt Lake City.
ImageJ (2013). National Institutes of Health: ImageJ (Version 1.46) [Software].Available from http://rsbweb.nih.gov/ij/download.html.

94
ImageJ Voxel Counter (2010). National Institutes of Health: ImageJ Voxel Counter [Software]. Available from http://rsbweb.nih.gov/ij/plugins/voxel-counter.html.
Isherwood, I. (2004). In memoriam: Sir Godfrey Hounsefield. Radiology, 234(3), 975-976.
Kang, Q., Zhang, D., & Chen, S. (2004). Immiscible displacement in a channel: Simulations of fingering in two dimensions. Advances in Water Resources, 27, 13-22.
Lenormand, R., Touboul, E., & Zarcone, C. (1988). Numerical methods and experiments on immiscible displacements in porous media. J. FluidMech.,189, 165-187.
Leonard, J.W., & Hardinge, B.C. (1991). Coal Preparation, 5th Ed., Littleton, CO:Society for Mining, Metallurgy, and Exploration, Inc.
Lin, C.L., & Miller, J.D. (2004). Pore structure analysis of particle beds for fluid transport simulation during filtration. Int. J. Miner. Process, 73(2-4), 281-294.
Lin, C.L., Miller, J.D., Videla, A. R., & Mejia, J. A. (2010). Fine coal filtration as revealed by 3D Lattice-Boltzmann simulations. International Journal o f Coal Preparation and Utilization, 30, 217-238.
Lindquist, W. B. (2009). 3DMA-Rock: A software package for automated analysis of pore rock structure in 3D computed microtomography images. Retrieved from http://www.ams.sunysb.edu/lindqui s/3dma/3dma_rock/3dma_rock.html.
Lindquist, W.B., Lee, S., Coker, D.A., Jones, K.W., and Spanne, P. (1996). Medial axis analysis of void structure in three-dimensional tomographic images of porous media. Journal o f Geophysical Research, 101(B4), 8297-8310.
Marle, C.M. (1981). Multiphase Flow in Porous Media. Houston: Gulf Publishing Company.
Novelline, R. (1997). Squire's Fundamentals o f Radiology. 5th Edition. Harvard University Press.
ParaView (2007). Kitware, Sandia National Labs and CSimSoft: ParaView (Version 3.0) [Software]. Available from http://paraview.org/paraview/resources/software.php.
Rothman, D.H., & Zaleski, S. (1997). Lattice-gas cellular automata: Simple models of complex hydrodynamics. Cambridge, UK: Cambridge University Press.
Shan, X., & Chen, H. (1993). Lattice-Boltzmann model for simulating flows with multiple phases and components. Phys. Rev. E,. 47, 1815-1819.
Succi, S. (2001). The Lattice-Boltzmann equation for fluid dynamics and beyond. New York: Oxford University Press.
95
Sukop, M.C., & Thorne, D.T. (2006). Lattice-Boltzmann modeling: An introduction for geoscientists and engineers (First Ed.). New York: Springer.
Svarosvsky, L. (1990). Filtration fundamentals. In L. Svarosvsky (Ed.), Solid-liquid separation. London: Butterworths.
Tien, C. (2006). Introduction to Cake Filtration. New York: Elsevier.
Tiller, F.M. (1975). Compressible cake filtration. In K. Ives (Ed.), Scientific Basis o f Filtration, London: Noordhoff.
Videla, A.R. (2009). Explorations in three-dimensional Lattice-Boltzmann simulation for fluid flow in packed particle bed. (Unpublished doctoral dissertation). University of Utah, Salt Lake City.
Videla, A.R., Lin, C.L., & Miller, J.D. (2007). Simulation of saturated fluid flow in packed particle beds: The Lattice-Boltzmann method for the calculation of permeability from XMT images. Journal of the Chinese Institute o f Chemical Engineers, 39, 117-128.
VolSuite (2009). Ohio Supercomputer Center (OSC): VolSuite (Version 3.3.20) [Software]. Available fromhttp://archive.osc.edu/supercomputing/software/apps/volsuite.shtml.
Wakeman, R., & Tarleton, S. (2005). Principles of industrial filtration. New York: Elsevier.
Wildenschild, D., & Sheppard, A. P. (2013). X-ray imaging and analysis techniques for quantifying pore-scale structure and processes in subsurface porous medium systems. Advances In Water Resources, 51, 217-246
Xradia. (2012). Retrieved from http://www.xradia.com.
XRadia. (2012). MicroXCT-200 and MicroXCT-400 User’s Guide. Retrieved from http://www.xradia.com/products/microxct-400.php.
Yoon, R.-H., J. Salomon, M. K. Eraydin, J. Zhang, S. Keles, and G. H. Luttrell. (2006). Development of advanced fine coal dewatering technologies. XV Int. Coal Prep. Cong. Beijing, China, October 17-20, 2006, 1: 575-583.
Zhang, R., He, X., & Chen, H. (2000). Interface and surface tension in incompressible Lattice-Boltzmann multiphase model. Computer Physics Communications, 129, 121-130.