Embed Size (px)
Citation preview

Characteristics of the U.S. Hispanic population: 2015% of the Hispanic population, unless otherwise noted
Population/Hispanic Origin/Nativity/Language Use/Race
Population (#) 56,476,777
Mexican 63.3 %
Foreign born 34.4 %
Speaking English at least very well (ages 5 and older) 69.0 %
White 66.3 %
Age/Gender/Marital Status/Fertility
Median age (in years) 28
Female 49.5 %
Married (ages 18 and older) 45.8
Women ages 15-44 giving birth in past year 6.7
Educational Attainment and Enrollment (highest degree completed, ages 25 and older)
High school graduate or less 61.4 %
Two-year degree/Some college 23.6
Bachelor's degree or more 15.0
Work/Earnings/Income (ages 16 and older)
In labor force (among civilian population) 67.0 %
Median annual personal earnings (in 2015 dollars, among those with earnings) $24,000
Median annual household income (in 2015 dollars) $44,800
Poverty/Government Assitance/ Health Care
Living in Poverty 21.9 %
Uninsured 19.7
Homeownership and Household Characteristics
In family households 90.6 %
Region and Top Five States of Residence
West 40.0 %
California 26.9
South 36.9
Texas 18.9
Florida 8.8
Northeast 14.0
New York 6.6
Midwest 9.1
Illinois 3.8
PEW RESEARCH CENTER
SUMMARY
"Statistical Portrait of Hispanics in the United States, 2015"
Source: Pew Research Center tabulations of 2015 American Community Survey (1% IPUMS).
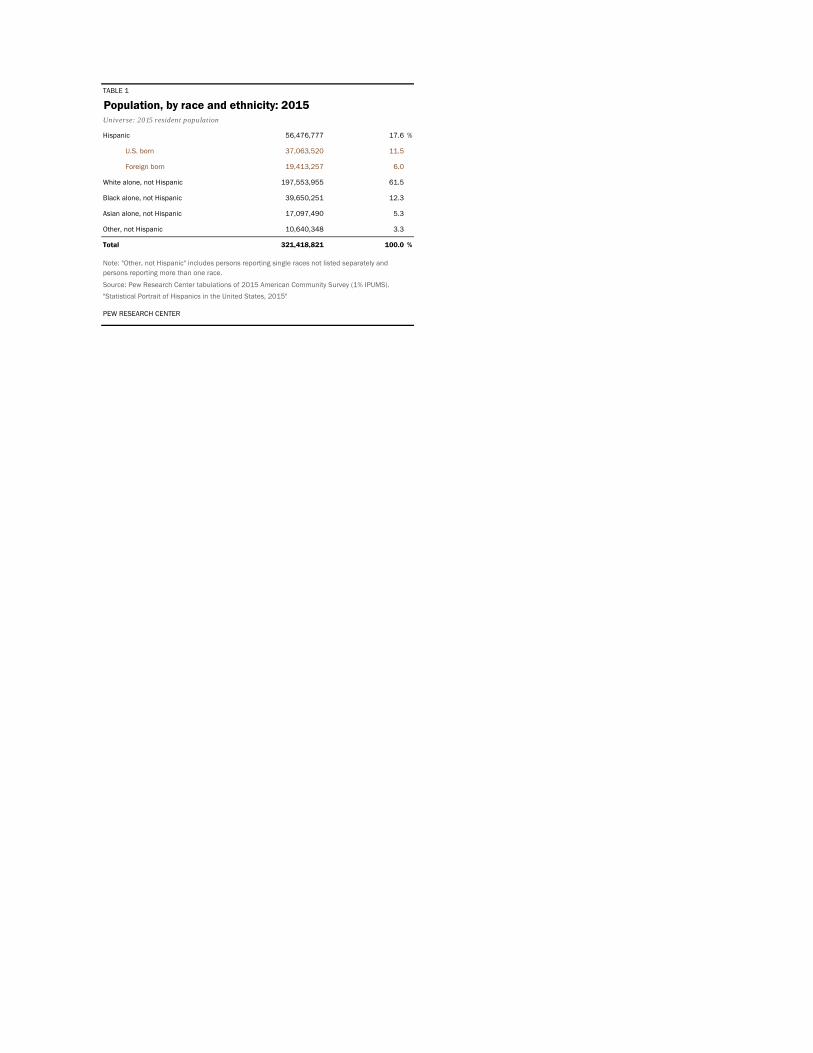
Hispanic 56,476,777 17.6 %
U.S. born 37,063,520 11.5
Foreign born 19,413,257 6.0
White alone, not Hispanic 197,553,955 61.5
Black alone, not Hispanic 39,650,251 12.3
Asian alone, not Hispanic 17,097,490 5.3
Other, not Hispanic 10,640,348 3.3
Total 321,418,821 100.0 %
TABLE 1
Population, by race and ethnicity: 2015Universe: 2015 resident population
Source: Pew Research Center tabulations of 2015 American Community Survey (1% IPUMS). "Statistical Portrait of Hispanics in the United States, 2015"
PEW RESEARCH CENTER
Note: "Other, not Hispanic" includes persons reporting single races not listed separately and persons reporting more than one race.
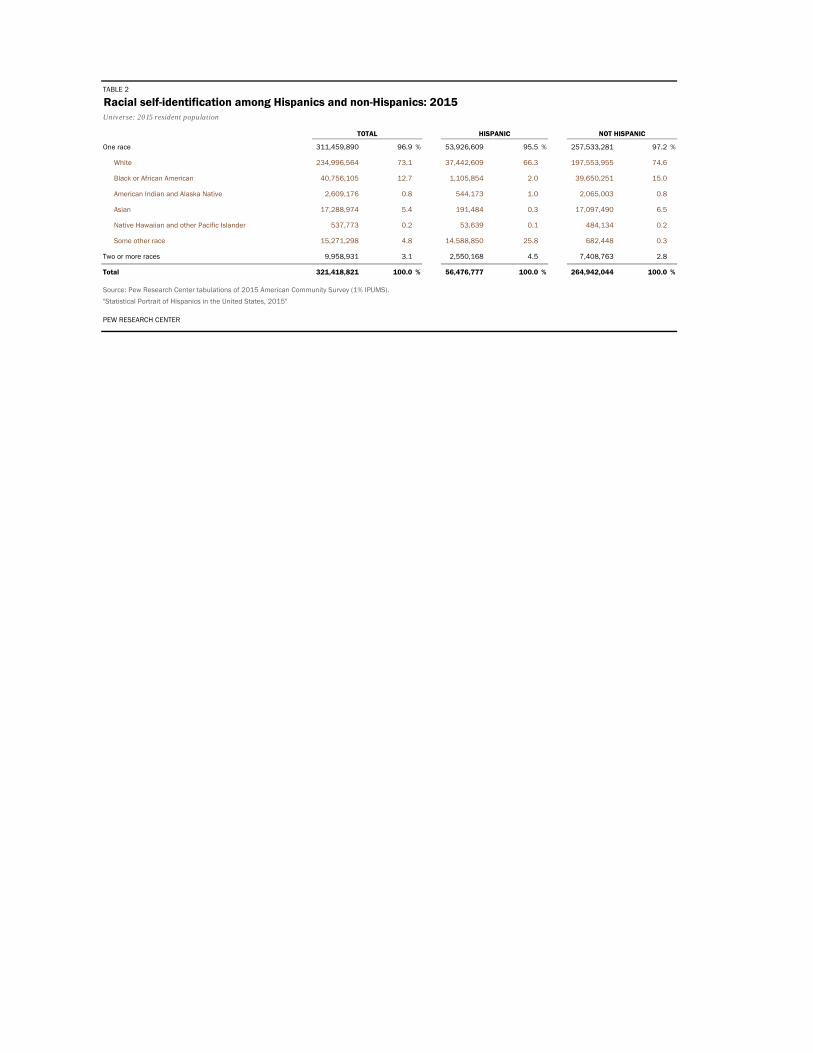
One race 311,459,890 96.9 % 53,926,609 95.5 % 257,533,281 97.2 %
White 234,996,564 73.1 37,442,609 66.3 197,553,955 74.6
Black or African American 40,756,105 12.7 1,105,854 2.0 39,650,251 15.0
American Indian and Alaska Native 2,609,176 0.8 544,173 1.0 2,065,003 0.8
Asian 17,288,974 5.4 191,484 0.3 17,097,490 6.5
Native Hawaiian and other Pacific Islander 537,773 0.2 53,639 0.1 484,134 0.2
Some other race 15,271,298 4.8 14,588,850 25.8 682,448 0.3
Two or more races 9,958,931 3.1 2,550,168 4.5 7,408,763 2.8
Total 321,418,821 100.0 % 56,476,777 100.0 % 264,942,044 100.0 %
PEW RESEARCH CENTER
"Statistical Portrait of Hispanics in the United States, 2015"
HISPANIC NOT HISPANICTOTAL
Source: Pew Research Center tabulations of 2015 American Community Survey (1% IPUMS).
Racial self-identification among Hispanics and non-Hispanics: 2015TABLE 2
Universe: 2015 resident population

U.S. born 37,063,520 65.6 %
Foreign born 19,413,257 34.4
Citizen 6,766,268 12.0
Non-citizen 12,646,989 22.4
Total 56,476,777 100.0 %
"Statistical Portrait of Hispanics in the United States, 2015"
TABLE 3
PEW RESEARCH CENTER
Source: Pew Research Center tabulations of 2015 American Community Survey (1% IPUMS).
Universe: 2015 Hispanic resident population
Hispanic population, by nativity: 2015

Mexican 35,757,893 63.3 %
Puerto Rican 5,371,113 9.5
Salvadoran 2,173,905 3.8
Cuban 2,115,879 3.7
All other Spanish/Hispanic/Latino 1,928,930 3.4
Dominican 1,865,987 3.3
Guatemalan 1,384,403 2.5
Colombian 1,090,777 1.9
Honduran 853,016 1.5
Spaniard 798,628 1.4
Ecuadorian 707,428 1.3
Peruvian 651,128 1.2
Nicaraguan 421,974 0.7
Venezuelan 320,943 0.6
Argentinean 274,480 0.5
Panamanian 204,847 0.4
Chilean 150,041 0.3
Costa Rican 145,711 0.3
Bolivian 116,193 0.2
Uruguayan 55,688 0.1
Other Central American 39,191 0.1
Other South American 27,589 <0.05
Paraguayan 21,033 <0.05
Total 56,476,777 100.0 %
Note: Hispanic populations are listed in descending order of population size. Hispanic origin is based on self-described ancestry, lineage, heritage, nationality group or country of birth.
TABLE 4
Detailed Hispanic origin: 2015Universe: 2015 Hispanic resident population
Source: Pew Research Center tabulations of 2015 American Community Survey (1% IPUMS).
"Statistical Portrait of Hispanics in the United States, 2015"
PEW RESEARCH CENTER

Total population
U.S.-born population
Foreign-born population
Mexican 35,757,893 24,250,184 11,507,709 32.2 %
Puerto Rican 5,371,113 5,274,698 96,415 1.8
Salvadoran 2,173,905 895,041 1,278,864 58.8
Cuban 2,115,879 927,628 1,188,251 56.2
All other Spanish/Hispanic/Latino 1,928,930 1,611,198 317,732 9.0
Dominican 1,865,987 855,532 1,010,455 54.2
Guatemalan 1,384,403 535,427 848,976 61.3
Colombian 1,090,777 425,626 665,151 61.0
Honduran 853,016 317,444 535,572 62.8
Spaniard 798,628 681,619 117,009 14.7
Ecuadorian 707,428 289,180 418,248 59.1
Peruvian 651,128 242,444 408,684 62.8
Nicaraguan 421,974 177,205 244,769 58.0
Venezuelan 320,943 94,424 226,519 70.6
Argentinean 274,480 116,917 157,563 57.4
Panamanian 204,847 121,368 83,479 40.8
Chilean 150,041 63,376 86,665 57.8
Costa Rican 145,711 71,539 74,172 50.9
Bolivian 116,193 50,372 65,821 56.6
Uruguayan 55,688 19,111 36,577 65.7
Other Central American 39,191 19,534 19,657 50.2
Other South American 27,589 15,693 11,896 43.1
Paraguayan 21,033 7,960 13,073 62.2
Total 56,476,777 37,063,520 19,413,257 34.4 %
PEW RESEARCH CENTER
TABLE 5
"Statistical Portrait of Hispanics in the United States, 2015"
Percent foreign born
Nativity, by detailed Hispanic origin: 2015
Source: Pew Research Center tabulations of 2015 American Community Survey (1% IPUMS).
Note: Hispanic populations are listed in descending order of total population size. Hispanic origin is based on self-described ancestry, lineage, heritage, nationality group or country of birth.
Universe: 2015 Hispanic resident population

Total population
U.S.-born population
Foreign-born population
Mexican 23,399,049 12,443,025 10,956,024 46.8 %
Puerto Rican 3,711,574 3,619,616 91,958 2.5
Cuban 1,681,252 545,877 1,135,375 67.5
Salvadoran 1,537,251 334,819 1,202,432 78.2
All other Spanish/Hispanic/Latino 1,358,752 1,060,499 298,253 22.0
Dominican 1,337,214 398,710 938,504 70.2
Guatemalan 954,937 172,275 782,662 82.0
Colombian 848,827 216,004 632,823 74.6
Spaniard 594,636 486,402 108,234 18.2
Honduran 587,057 97,588 489,469 83.4
Ecuadorian 521,974 121,465 400,509 76.7
Peruvian 500,702 109,822 390,880 78.1
Nicaraguan 324,404 90,555 233,849 72.1
Venezuelan 248,002 44,830 203,172 81.9
Argentinean 210,570 59,746 150,824 71.6
Panamanian 154,010 72,796 81,214 52.7
Chilean 112,508 31,152 81,356 72.3
Costa Rican 104,765 34,623 70,142 67.0
Bolivian 84,963 21,512 63,451 74.7
Uruguayan 42,313 7,129 35,184 83.2
Other Central American 27,834 9,590 18,244 65.5
Other South American 20,866 9,196 11,670 55.9
Paraguayan 17,231 4,368 12,863 74.7
Total 38,380,691 19,991,599 18,389,092 47.9 %
PEW RESEARCH CENTER
"Statistical Portrait of Hispanics in the United States, 2015"
TABLE 6
Nativity of adult population, by detailed Hispanic origin: 2015Universe: 2015 Hispanic resident population age 18 and older
Percent foreign born
Note: Hispanic populations are listed in descending order of total population size. Hispanic origin is based on self-described ancestry, lineage, heritage, nationality group or country of birth.
Source: Pew Research Center tabulations of 2015 American Community Survey (1% IPUMS).

Only English spoken at
home
English spoken
very well
English spoken less
than very well Total
English spoken
very well
English spoken less
than very well Total
Hispanic 4,990,090 6,472,150 1,560,546 13,022,786 8,832,049 15,182,679 14,365,963 38,380,691
U.S. born 4,936,530 5,908,389 1,246,365 12,091,284 8,012,570 9,932,102 2,046,927 19,991,599
Foreign born 53,560 563,761 314,181 931,502 819,479 5,250,577 12,319,036 18,389,092
White alone, not Hispanic 26,375,576 1,267,328 307,159 27,950,063 151,040,532 6,106,575 2,618,732 159,765,839
Black alone, not Hispanic 6,905,452 362,517 84,024 7,351,993 27,244,549 1,573,847 836,224 29,654,620
Asian alone, not Hispanic 1,044,675 1,115,673 362,201 2,522,549 2,897,457 5,574,670 5,202,924 13,675,051
Other, not Hispanic 2,639,614 270,549 51,532 2,961,695 5,169,566 879,595 351,105 6,400,266
Total 41,955,407 9,488,217 2,365,462 53,809,086 195,184,153 29,317,366 23,374,948 247,876,467
Hispanic 38.3 % 49.7 % 12.0 % 100.0 % 23.0 % 39.6 % 37.4 % 100.0 %
U.S. born 40.8 48.9 10.3 100.0 40.1 49.7 10.2 100.0
Foreign born 5.7 60.5 33.7 100.0 4.5 28.6 67.0 100.0
White alone, not Hispanic 94.4 4.5 1.1 100.0 94.5 3.8 1.6 100.0
Black alone, not Hispanic 93.9 4.9 1.1 100.0 91.9 5.3 2.8 100.0
Asian alone, not Hispanic 41.4 44.2 14.4 100.0 21.2 40.8 38.0 100.0
Other, not Hispanic 89.1 9.1 1.7 100.0 80.8 13.7 5.5 100.0
All 78.0 % 17.6 % 4.4 % 100.0 % 78.7 % 11.8 % 9.4 % 100.0 %
TABLE 7
"Statistical Portrait of Hispanics in the United States, 2015"
Source: Pew Research Center tabulations of 2015 American Community Survey (1% IPUMS).
Only English spoken at
home
PERCENT DISTRIBUTION
Note: "Other, not Hispanic" includes persons reporting single races not listed separately and persons reporting more than one race.
LANGUAGE OTHER THAN ONLY ENGLISH AT HOME
LANGUAGE OTHER THAN ONLY ENGLISH AT HOME
PEW RESEARCH CENTER
18 AND OLDER5 TO 17
Language spoken at home and English-speaking ability, by age, race and ethnicity: 2015Universe: 2015 resident population ages 5 and older

Years in the U.S.
English spoken
very well
English spoken less
than very well Total
English spoken
very well
English spoken less
than very well Total
0 to 5 years 10,509 147,151 214,365 372,025 61,597 288,307 1,293,094 1,642,998
6 to 10 years 21,803 201,188 58,991 281,982 65,470 421,201 1,638,569 2,125,240
11 to 15 years 18,249 186,900 37,347 242,496 97,462 849,701 2,357,156 3,304,319
16 to 20 years 2,999 28,522 3,478 34,999 95,154 867,889 1,906,331 2,869,374
Over 20 years N/A N/A N/A N/A 499,796 2,823,479 5,123,886 8,447,161
Total 53,560 563,761 314,181 931,502 819,479 5,250,577 12,319,036 18,389,092
0 to 5 years 2.8 % 39.6 % 57.6 % 100.0 % 3.7 % 17.5 % 78.7 % 100.0 %
6 to 10 years 7.7 71.3 20.9 100.0 3.1 19.8 77.1 100.0
11 to 15 years 7.5 77.1 15.4 100.0 2.9 25.7 71.3 100.0
16 to 20 years 8.6 81.5 9.9 100.0 3.3 30.2 66.4 100.0
Over 20 years N/A N/A N/A N/A 5.9 33.4 60.7 100.0
All 5.7 % 60.5 % 33.7 % 100.0 % 4.5 % 28.6 % 67.0 % 100.0 %
TABLE 8
PEW RESEARCH CENTER
Language spoken at home and English-speaking ability among foreign-born Hispanics, by years in the U.S. and age: 2015 Universe: 2015 foreign-born Hispanic resident population ages 5 and older
5 TO 17 18 AND OLDER
Source: Pew Research Center tabulations of 2015 American Community Survey (1% IPUMS).
Only English spoken at
home
Only English spoken at
home
PERCENT DISTRIBUTION
LANGUAGE OTHER THAN ONLY ENGLISH AT HOME
LANGUAGE OTHER THAN ONLY ENGLISH AT HOME
"Statistical Portrait of Hispanics in the United States, 2015"

Total Male Female
Hispanic 28 28 29
U.S. born 19 19 20
Foreign born 42 41 43
White alone, not Hispanic 43 41 44
Black alone, not Hispanic 34 32 35
Asian alone, not Hispanic 36 35 38
Other, not Hispanic 23 22 24
All 37 36 39
PEW RESEARCH CENTER
"Statistical Portrait of Hispanics in the United States, 2015"
TABLE 9
Universe: 2015 resident population
Note: "Other, not Hispanic" includes persons reporting single races not listed separately and persons reporting more than one race.
Median age in years, by sex, race and ethnicity: 2015
Source: Pew Research Center tabulations of 2015 American Community Survey (1% IPUMS).

Younger Adult Millennial Gen X Boomer Silent/Greatest
than 18 (ages 18-34) (ages 35-50) (ages 51-69) (ages 70 and older) Total
Hispanic 18,096,086 15,584,361 12,487,296 7,919,642 2,389,392 56,476,777
U.S. born 17,071,921 10,349,205 5,161,565 3,405,007 1,075,822 37,063,520
Foreign born 1,024,165 5,235,156 7,325,731 4,514,635 1,313,570 19,413,257
White alone, not Hispanic 37,788,116 41,856,175 39,523,083 53,493,510 24,893,071 197,553,955
Black alone, not Hispanic 9,995,631 10,336,761 8,407,215 8,266,731 2,643,913 39,650,251
Asian alone, not Hispanic 3,422,439 4,598,271 4,299,826 3,510,883 1,266,071 17,097,490
Other, not Hispanic 4,240,082 2,794,695 1,724,067 1,459,205 422,299 10,640,348
Total 73,542,354 75,170,263 66,441,487 74,649,971 31,614,746 321,418,821
Hispanic 32.0 % 27.6 % 22.1 % 14.0 % 4.2 % 100.0 %
U.S. born 46.1 27.9 13.9 9.2 2.9 100.0
Foreign born 5.3 27.0 37.7 23.3 6.8 100.0
White alone, not Hispanic 19.1 21.2 20.0 27.1 12.6 100.0
Black alone, not Hispanic 25.2 26.1 21.2 20.8 6.7 100.0
Asian alone, not Hispanic 20.0 26.9 25.1 20.5 7.4 100.0
Other, not Hispanic 39.8 26.3 16.2 13.7 4.0 100.0
All 22.9 % 23.4 % 20.7 % 23.2 % 9.8 % 100.0 %
PEW RESEARCH CENTER
TABLE 10
"Statistical Portrait of Hispanics in the United States, 2015"Source: Pew Research Center tabulations of 2015 American Community Survey (1% IPUMS).
Generations, by race and ethnicity: 2015
PERCENT DISTRIBUTION
Universe: 2015 resident population
Note: No chronological end point has been set for Millennials. For the purposes of following a cleanly defined group, Millennials are defined as those ages 18 to 34 in 2015. "Other, not Hispanic" includes persons reporting single races not listed separately and persons reporting more than one race.

Age (years) Male Female Male Female
Younger than 18 9,231,940 16.3 % 8,864,146 15.7 % 19,402,555 9.8 % 18,385,561 9.3 %
18 and older 19,263,940 34.1 19,116,751 33.8 77,986,777 39.5 81,779,062 41.4
Younger than 5 2,588,453 4.6 2,484,847 4.4 5,052,474 2.6 4,785,579 2.4
5 to 9 2,667,589 4.7 2,531,508 4.5 5,310,432 2.7 5,077,439 2.6
10 to 14 2,535,972 4.5 2,465,297 4.4 5,535,985 2.8 5,226,523 2.6
15 to 19 2,420,437 4.3 2,308,451 4.1 5,902,488 3.0 5,589,342 2.8
20 to 24 2,500,175 4.4 2,316,348 4.1 6,353,785 3.2 5,999,395 3.0
25 to 29 2,332,053 4.1 2,128,832 3.8 6,369,204 3.2 6,177,800 3.1
30 to 34 2,287,523 4.1 2,112,962 3.7 6,194,218 3.1 6,069,627 3.1
35 to 39 2,203,550 3.9 2,106,615 3.7 5,869,649 3.0 5,787,790 2.9
40 to 44 2,030,821 3.6 1,961,432 3.5 5,966,496 3.0 5,896,986 3.0
45 to 49 1,757,171 3.1 1,711,097 3.0 6,535,056 3.3 6,519,458 3.3
50 to 54 1,509,558 2.7 1,511,414 2.7 7,407,210 3.7 7,547,341 3.8
55 to 59 1,170,226 2.1 1,220,322 2.2 7,454,203 3.8 7,737,925 3.9
60 to 64 882,399 1.6 986,514 1.7 6,839,583 3.5 7,247,344 3.7
65 to 69 628,957 1.1 726,862 1.3 5,857,003 3.0 6,350,549 3.2
70 to 74 407,746 0.7 520,299 0.9 4,166,381 2.1 4,709,699 2.4
75 to 79 261,969 0.5 370,364 0.7 2,887,555 1.5 3,475,552 1.8
80 to 84 170,552 0.3 267,026 0.5 1,946,771 1.0 2,659,543 1.3
85 to 89 91,530 0.2 154,198 0.3 1,163,969 0.6 1,922,544 1.0
90 and older 49,199 0.1 96,509 0.2 576,870 0.3 1,384,187 0.7
Total 28,495,880 50.5 % 27,980,897 49.5 % 97,389,332 49.3 % 100,164,623 50.7 %
Percent of all white
non-Hispanics
Percent of all white
non-Hispanics
WHITE ALONE, NOT HISPANIC
PEW RESEARCH CENTER
TABLE 11
Race and ethnicity, by sex and age: 2015
HISPANIC
Universe: 2015 resident population
Source: Pew Research Center tabulations of 2015 American Community Survey (1% IPUMS).
"Statistical Portrait of Hispanics in the United States, 2015"
Percent of all Hispanics
Percent of all Hispanics

Age (years) Male Female Male Female
Younger than 18 523,487 2.7 % 500,678 2.6 % 8,708,453 23.5 % 8,363,468 22.6 %
18 and older 9,342,452 48.1 9,046,640 46.6 9,921,488 26.8 10,070,111 27.2
Younger than 5 49,502 0.3 43,161 0.2 2,538,951 6.9 2,441,686 6.6
5 to 9 91,222 0.5 85,683 0.4 2,576,367 7.0 2,445,825 6.6
10 to 14 180,303 0.9 177,099 0.9 2,355,669 6.4 2,288,198 6.2
15 to 19 377,864 1.9 348,477 1.8 2,042,573 5.5 1,959,974 5.3
20 to 24 600,812 3.1 505,239 2.6 1,899,363 5.1 1,811,109 4.9
25 to 29 919,899 4.7 763,352 3.9 1,412,154 3.8 1,365,480 3.7
30 to 34 1,145,213 5.9 971,495 5.0 1,142,310 3.1 1,141,467 3.1
35 to 39 1,235,759 6.4 1,141,792 5.9 967,791 2.6 964,823 2.6
40 to 44 1,220,025 6.3 1,158,455 6.0 810,796 2.2 802,977 2.2
45 to 49 1,093,311 5.6 1,038,503 5.3 663,860 1.8 672,594 1.8
50 to 54 912,976 4.7 885,399 4.6 596,582 1.6 626,015 1.7
55 to 59 671,143 3.5 687,134 3.5 499,083 1.3 533,188 1.4
60 to 64 500,887 2.6 558,964 2.9 381,512 1.0 427,550 1.2
65 to 69 341,838 1.8 394,180 2.0 287,119 0.8 332,682 0.9
70 to 74 219,932 1.1 289,073 1.5 187,814 0.5 231,226 0.6
75 to 79 144,241 0.7 214,496 1.1 117,728 0.3 155,868 0.4
80 to 84 89,352 0.5 149,283 0.8 81,200 0.2 117,743 0.3
85 to 89 46,795 0.2 84,080 0.4 44,735 0.1 70,118 0.2
90 and older 24,865 0.1 51,453 0.3 24,334 0.1 45,056 0.1
Total 9,865,939 50.8 % 9,547,318 49.2 % 18,629,941 50.3 % 18,433,579 49.7 %
TABLE 12
Hispanic nativity groups, by sex and age: 2015Universe: 2015 Hispanic resident population
FOREIGN BORN U.S. BORN
PEW RESEARCH CENTER
Percent of all Hispanics
Percent of all Hispanics
Percent of all Hispanics
Percent of all Hispanics
Source: Pew Research Center tabulations of 2015 American Community Survey (1% IPUMS).
"Statistical Portrait of Hispanics in the United States, 2015"

Age (years)
Age (years) Foreign-born Hispanic Age (years) U.S.-born Hispanic
TABLE 13
Age and gender distributions for race, ethnicity and nativity groups: 2015Universe: 2015 resident population
Hispanic Age (years) White alone, not Hispanic
Source: Pew Research Center tabulations of 2015 American Community Survey (1% IPUMS).
"Statistical Portrait of Hispanics in the United States, 2015"
PEW RESEARCH CENTER
10 8 6 4 2 0 2 4 6 8 10
Younger than 55 to 9
10 to 1415 to 1920 to 2425 to 2930 to 3435 to 3940 to 4445 to 4950 to 5455 to 5960 to 6465 to 6970 to 7475 to 7980 to 8485 to 89
90 and older
Percent
Females Males
10 8 6 4 2 0 2 4 6 8 10
Younger than 55 to 9
10 to 1415 to 1920 to 2425 to 2930 to 3435 to 3940 to 4445 to 4950 to 5455 to 5960 to 6465 to 6970 to 7475 to 7980 to 8485 to 89
90 and older
Percent
Females Males
10 8 6 4 2 0 2 4 6 8 10
Younger than 55 to 9
10 to 1415 to 1920 to 2425 to 2930 to 3435 to 3940 to 4445 to 4950 to 5455 to 5960 to 6465 to 6970 to 7475 to 7980 to 8485 to 89
90 and older
Percent
Females Males
10 8 6 4 2 0 2 4 6 8 10
Younger than 55 to 9
10 to 1415 to 1920 to 2425 to 2930 to 3435 to 3940 to 4445 to 4950 to 5455 to 5960 to 6465 to 6970 to 7475 to 7980 to 8485 to 89
90 and older
Percent
Females Males

Now married Separated Divorced Widowed Never married Total
Hispanic 17,593,512 1,327,648 3,478,057 1,406,555 14,574,919 38,380,691
U.S. born 7,291,035 535,161 1,917,886 613,230 9,634,287 19,991,599
Foreign born 10,302,477 792,487 1,560,171 793,325 4,940,632 18,389,092
White alone, not Hispanic 86,508,175 2,491,934 19,900,694 11,074,226 39,790,810 159,765,839
Black alone, not Hispanic 8,954,951 1,174,051 3,821,900 1,772,796 13,930,922 29,654,620
Asian alone, not Hispanic 8,273,540 163,192 729,061 654,218 3,855,040 13,675,051
Other, not Hispanic 2,443,786 155,184 777,793 284,313 2,739,190 6,400,266
Total 123,773,964 5,312,009 28,707,505 15,192,108 74,890,881 247,876,467
Hispanic 45.8 % 3.5 % 9.1 % 3.7 % 38.0 % 100.0 %
U.S. born 36.5 2.7 9.6 3.1 48.2 100.0
Foreign born 56.0 4.3 8.5 4.3 26.9 100.0
White alone, not Hispanic 54.1 1.6 12.5 6.9 24.9 100.0
Black alone, not Hispanic 30.2 4.0 12.9 6.0 47.0 100.0
Asian alone, not Hispanic 60.5 1.2 5.3 4.8 28.2 100.0
Other, not Hispanic 38.2 2.4 12.2 4.4 42.8 100.0
All 49.9 % 2.1 % 11.6 % 6.1 % 30.2 % 100.0 %
PEW RESEARCH CENTER
PERCENT DISTRIBUTION
"Statistical Portrait of Hispanics in the United States, 2015"
Note: "Other, not Hispanic" includes persons reporting single races not listed separately and persons reporting more than one race.
Marital status, by race and ethnicity: 2015 TABLE 14
Source: Pew Research Center tabulations of 2015 American Community Survey (1% IPUMS).
Universe: 2015 resident population ages 18 and older

Women giving birth
in past year
Hispanic 868,322 6.7 % 22.5 %
U.S. born 493,704 6.1 12.8
Foreign born 374,618 7.7 9.7
White alone, not Hispanic 2,081,374 5.9 53.8
Black alone, not Hispanic 536,181 6.0 13.9
Asian alone, not Hispanic 240,026 5.8 6.2
Other, not Hispanic 139,457 6.1 3.6
Total 3,865,360 6.1 % 100.0 %
PEW RESEARCH CENTER
"Statistical Portrait of Hispanics in the United States, 2015"
TABLE 15
Universe: 2015 resident population defined for women ages 15 to 44
Fertility in the past year, by race and ethnicity: 2015
Share of total births
in past year
% of women giving birth in past year
Note: "Other, not Hispanic" includes persons reporting single races not listed separately and persons reporting more than one race.
Source: Pew Research Center tabulations of 2015 American Community Survey (1% IPUMS).

All Unmarried
Hispanic 868,322 408,507 47.0 %
U.S. born 493,704 262,786 53.2
Foreign born 374,618 145,721 38.9
White alone, not Hispanic 2,081,374 574,355 27.6
Black alone, not Hispanic 536,181 371,499 69.3
Asian alone, not Hispanic 240,026 30,224 12.6
Other, not Hispanic 139,457 69,681 50.0
Total 3,865,360 1,454,266 37.6 %
PEW RESEARCH CENTER
TABLE 16
Universe: 2015 resident population defined for women ages 15 to 44 giving birth in the last 12 months
"Statistical Portrait of Hispanics in the United States, 2015"
Fertility in the past year, by marital status, race and ethnicity: 2015
Percent unmarried
Note: Unmarried women includes those who were never married or are divorced, separated or widowed. "Other, not Hispanic" includes persons reporting single races not listed separately and persons reporting more than one race.
Source: Pew Research Center tabulations of 2015 American Community Survey (1% IPUMS).

Less than 9th grade
9th to 12th grade
High school graduate
Two-year degree/Some college
Bachelor's degree or more Total
Hispanic 6,354,354 4,390,020 8,702,779 7,467,175 4,743,372 31,657,700
U.S. born 1,015,239 1,680,294 4,370,288 4,805,913 2,832,071 14,703,805
Foreign born 5,339,115 2,709,726 4,332,491 2,661,262 1,911,301 16,953,895
White alone, not Hispanic 3,345,447 7,689,163 39,843,999 42,983,302 48,858,602 142,720,513
Black alone, not Hispanic 1,053,715 2,740,639 7,894,415 8,311,111 5,063,477 25,063,357
Asian alone, not Hispanic 984,313 621,912 1,856,567 2,229,726 6,306,296 11,998,814
Other, not Hispanic 206,578 391,946 1,298,805 1,789,777 1,403,182 5,090,288
Total 11,944,407 15,833,680 59,596,565 62,781,091 66,374,929 216,530,672
Hispanic 20.1 % 13.9 % 27.5 % 23.6 % 15.0 % 100.0 %
U.S. born 6.9 11.4 29.7 32.7 19.3 100.0
Foreign born 31.5 16.0 25.6 15.7 11.3 100.0
White alone, not Hispanic 2.3 5.4 27.9 30.1 34.2 100.0
Black alone, not Hispanic 4.2 10.9 31.5 33.2 20.2 100.0
Asian alone, not Hispanic 8.2 5.2 15.5 18.6 52.6 100.0
Other, not Hispanic 4.1 7.7 25.5 35.2 27.6 100.0
All 5.5 % 7.3 % 27.5 % 29.0 % 30.7 % 100.0 %
PEW RESEARCH CENTER
Source: Pew Research Center tabulations of 2015 American Community Survey (1% IPUMS).
"Statistical Portrait of Hispanics in the United States, 2015"
TABLE 17
Educational attainment, by race and ethnicity: 2015
PERCENT DISTRIBUTION
Universe: 2015 resident population ages 25 and older
Note: "High school graduate" includes persons who have attained a high school diploma or its equivalent, such as a General Educational Development (GED) certificate. "Other, not Hispanic" includes persons reporting single races not listed separately and persons reporting more than one race.

Less than 9th grade 5,339,115 31.5 %
9th to 12th grade 2,709,726 16.0
High school graduate 4,332,491 25.6
Two-year degree/Some college 2,661,262 15.7
Bachelor's degree or more 1,911,301 11.3
Total 16,953,895 100.0 %
PEW RESEARCH CENTER
TABLE 18
Educational attainment of foreign-born Hispanics: 2015Universe: 2015 foreign-born Hispanic resident population ages 25 and older
Source: Pew Research Center tabulations of 2015 American Community Survey (1% IPUMS).
"Statistical Portrait of Hispanics in the United States, 2015"
Note: "High school graduate" includes persons who have attained a high school diploma or its equivalent, such as a General Educational Development (GED) certificate.
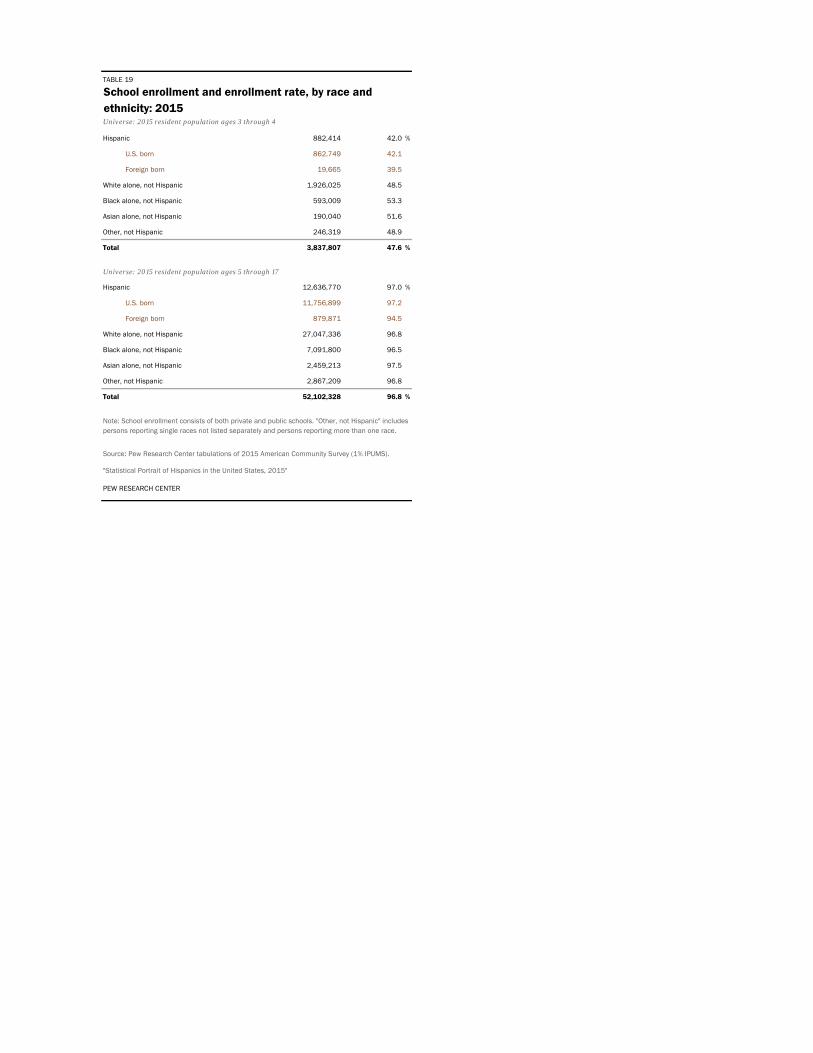
Hispanic 882,414 42.0 %
U.S. born 862,749 42.1
Foreign born 19,665 39.5
White alone, not Hispanic 1,926,025 48.5
Black alone, not Hispanic 593,009 53.3
Asian alone, not Hispanic 190,040 51.6
Other, not Hispanic 246,319 48.9
Total 3,837,807 47.6 %
Hispanic 12,636,770 97.0 %
U.S. born 11,756,899 97.2
Foreign born 879,871 94.5
White alone, not Hispanic 27,047,336 96.8
Black alone, not Hispanic 7,091,800 96.5
Asian alone, not Hispanic 2,459,213 97.5
Other, not Hispanic 2,867,209 96.8
Total 52,102,328 96.8 %
Universe: 2015 resident population ages 3 through 4
School enrollment and enrollment rate, by race and ethnicity: 2015
PEW RESEARCH CENTER
TABLE 19
"Statistical Portrait of Hispanics in the United States, 2015"
Universe: 2015 resident population ages 5 through 17
Source: Pew Research Center tabulations of 2015 American Community Survey (1% IPUMS).
Note: School enrollment consists of both private and public schools. "Other, not Hispanic" includes persons reporting single races not listed separately and persons reporting more than one race.

Hispanic 209,240 5.6 %
U.S. born 149,266 4.7
Foreign born 59,974 9.9
White alone, not Hispanic 311,095 3.4
Black alone, not Hispanic 113,385 4.7
Asian alone, not Hispanic 12,632 1.5
Other, not Hispanic 37,469 4.6
Total 683,821 4.0 %
PEW RESEARCH CENTER
"Statistical Portrait of Hispanics in the United States, 2015"
TABLE 20
High school dropouts and dropout rate, by nativity and region of birth: 2015Universe: 2015 resident population ages 16 through 19
Note: Dropouts are people not enrolled in school and who have not attained a high school diploma or an equivalent credential, such as a General Education Development (GED) certificate. "Other, not Hispanic" includes persons reporting single races not listed separately and persons reporting more than one race.
Source: Pew Research Center tabulations of 2015 American Community Survey (1% IPUMS).

Hispanic 2,420,255 36.0 % Hispanic 1,414,031 4.5 %
U.S. born 2,041,252 38.6 U.S. born 948,537 6.5
Foreign born 379,003 26.4 Foreign born 465,494 2.7
White alone, not Hispanic 7,579,425 44.5 White alone, not Hispanic 5,167,366 3.6
Black alone, not Hispanic 1,658,490 36.1 Black alone, not Hispanic 1,620,993 6.5
Asian alone, not Hispanic 1,119,267 66.8 Asian alone, not Hispanic 762,301 6.4
Other, not Hispanic 530,102 40.5 Other, not Hispanic 351,573 6.9
Total 13,307,539 42.5 % Total 9,316,264 4.3 %
PEW RESEARCH CENTER
TABLE 21
College enrollment and enrollment rate, by race and ethnicity: 2015 Universe: 2015 resident population
AGES 18 TO 24 AGES 25 AND OLDER
"Statistical Portrait of Hispanics in the United States, 2015"
Note: "Enrolled in college" includes persons who are currently attending undergraduate, graduate or professional school. "Other, not Hispanic" includes persons reporting single races not listed separately and persons reporting more than one race.
Source: Pew Research Center tabulations of 2015 American Community Survey (1% IPUMS).
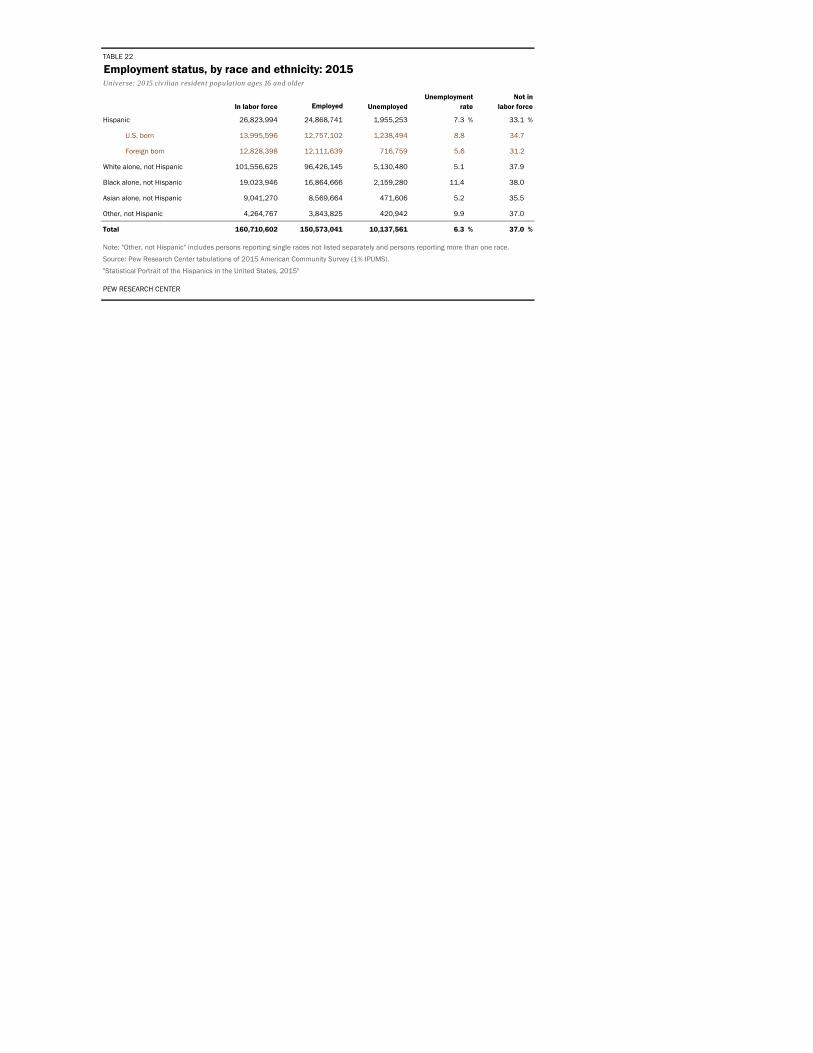
In labor force Employed Unemployed
Hispanic 26,823,994 24,868,741 1,955,253 7.3 % 33.1 %
U.S. born 13,995,596 12,757,102 1,238,494 8.8 34.7
Foreign born 12,828,398 12,111,639 716,759 5.6 31.2
White alone, not Hispanic 101,556,625 96,426,145 5,130,480 5.1 37.9
Black alone, not Hispanic 19,023,946 16,864,666 2,159,280 11.4 38.0
Asian alone, not Hispanic 9,041,270 8,569,664 471,606 5.2 35.5
Other, not Hispanic 4,264,767 3,843,825 420,942 9.9 37.0
Total 160,710,602 150,573,041 10,137,561 6.3 % 37.0 %
PEW RESEARCH CENTER
TABLE 22
Unemployment rate
Not in labor force
Employment status, by race and ethnicity: 2015
Source: Pew Research Center tabulations of 2015 American Community Survey (1% IPUMS).
Universe: 2015 civilian resident population ages 16 and older
"Statistical Portrait of the Hispanics in the United States, 2015"
Note: "Other, not Hispanic" includes persons reporting single races not listed separately and persons reporting more than one race.

Occupation Group Total U.S. born Foreign born White alone Black alone Asian alone Other Total
Management and business 2,408,530 1,529,083 879,447 19,643,121 2,107,938 1,697,386 592,021 26,448,996
Science and engineering 696,156 463,079 233,077 6,457,585 588,434 1,475,448 244,034 9,461,657
Legal, community and social services 511,222 376,805 134,417 3,528,967 670,329 192,471 130,673 5,033,662
Education, arts and media 1,501,249 1,036,463 464,786 11,059,905 1,266,982 800,017 377,399 15,005,552
Health care 1,525,845 1,029,247 496,598 9,312,735 2,152,740 1,112,749 367,706 14,471,775
Food preparation and serving 2,675,857 1,277,473 1,398,384 6,392,524 1,526,251 674,265 430,477 11,699,374
Building and grounds cleaning and maintenance
2,571,821 695,036 1,876,785 3,652,996 1,124,360 228,412 211,378 7,788,967
Other services 1,757,132 1,101,228 655,904 6,770,104 1,836,457 649,941 369,543 11,383,177
Sales 2,994,154 1,991,849 1,002,305 13,446,595 2,196,005 1,049,717 569,638 20,256,109
Office and administrative support 3,660,579 2,564,818 1,095,761 16,040,040 3,293,806 1,074,783 695,341 24,764,549
Farming, fishing and forestry 731,905 137,154 594,751 691,647 65,835 24,675 37,613 1,551,675
Construction and extraction 2,811,834 854,190 1,957,644 5,875,414 683,012 128,107 241,904 9,740,271
Installation, repair and production 3,296,531 1,405,594 1,890,937 10,490,669 1,885,951 771,230 389,113 16,833,494
Transportation and material moving 2,521,093 1,234,683 1,286,410 6,910,604 2,139,971 362,115 323,231 12,257,014
Military 88,501 79,728 8,773 381,066 85,108 20,121 31,812 606,608
Unemployed, no work experiencein past five years
508,595 332,652 175,943 842,091 564,925 120,943 97,320 2,133,874
Total 30,261,004 16,109,082 14,151,922 121,496,063 22,188,104 10,382,380 5,109,203 189,436,754
PERCENT DISTRIBUTION
Management and business 8.0 % 9.5 % 6.2 % 16.2 % 9.5 % 16.3 % 11.6 % 14.0 %
Science and engineering 2.3 2.9 1.6 5.3 2.7 14.2 4.8 5.0
Legal, community and social services 1.7 2.3 0.9 2.9 3.0 1.9 2.6 2.7
Education, arts and media 5.0 6.4 3.3 9.1 5.7 7.7 7.4 7.9
Health care 5.0 6.4 3.5 7.7 9.7 10.7 7.2 7.6
Food preparation and serving 8.8 7.9 9.9 5.3 6.9 6.5 8.4 6.2
Building and grounds cleaning and maintenance
8.5 4.3 13.3 3.0 5.1 2.2 4.1 4.1
Other services 5.8 6.8 4.6 5.6 8.3 6.3 7.2 6.0
Sales 9.9 12.4 7.1 11.1 9.9 10.1 11.1 10.7
Office and administrative support 12.1 15.9 7.7 13.2 14.8 10.4 13.6 13.1
Farming, fishing and forestry 2.4 0.9 4.2 0.6 0.3 0.2 0.7 0.8
Construction and extraction 9.3 5.3 13.8 4.8 3.1 1.2 4.7 5.1
Installation, repair and production 10.9 8.7 13.4 8.6 8.5 7.4 7.6 8.9
Transportation and material moving 8.3 7.7 9.1 5.7 9.6 3.5 6.3 6.5
Military 0.3 0.5 0.1 0.3 0.4 0.2 0.6 0.3
Unemployed, no work experience in past five years
1.7 2.1 1.2 0.7 2.5 1.2 1.9 1.1
All 100.0 % 100.0 % 100.0 % 100.0 % 100.0 % 100.0 % 100.0 % 100.0 %
PEW RESEARCH CENTER
TABLE 23
Source: Pew Research Center tabulations of 2015 American Community Survey (1% IPUMS).
"Statistical Portrait of Hispanics in the United States, 2015"
Occupation, by race and ethnicity: 2015Universe: 2015 resident population ages 16 and older who worked in the past five years
HISPANIC NON-HISPANIC

Occupation Group Total U.S. born Foreign born White alone Black alone Asian alone Other Total
Management 1,664,838 1,017,241 647,597 13,530,758 1,325,419 1,027,618 394,101 17,942,734
Business operations 423,417 298,779 124,638 3,329,140 450,641 307,474 119,599 4,630,271
Financial 320,275 213,063 107,212 2,783,223 331,878 362,294 78,321 3,875,991
Computer and mathematical 331,524 232,952 98,572 3,087,152 351,889 896,951 130,581 4,798,097
Architecture and engineering 243,429 150,723 92,706 2,270,704 151,779 359,154 70,605 3,095,671
Life, physical and social sciences
121,203 79,404 41,799 1,099,729 84,766 219,343 42,848 1,567,889
Community and social services 345,247 250,641 94,606 1,983,535 555,100 104,858 88,711 3,077,451
Legal 165,975 126,164 39,811 1,545,432 115,229 87,613 41,962 1,956,211
Education, training and library 1,081,819 768,984 312,835 8,196,782 1,027,838 584,250 264,597 11,155,286
Arts, design, entertainment, sports and media
419,430 267,479 151,951 2,863,123 239,144 215,767 112,802 3,850,266
Health care practitioners and technical 786,047 562,616 223,431 7,045,131 1,074,969 892,047 234,608 10,032,802
Health care support 739,798 466,631 273,167 2,267,604 1,077,771 220,702 133,098 4,438,973
Protective service 547,828 441,942 105,886 2,474,446 743,508 91,257 130,118 3,987,157
Food preparation and serving 2,675,857 1,277,473 1,398,384 6,392,524 1,526,251 674,265 430,477 11,699,374
Building and grounds cleaningand maintenance
2,571,821 695,036 1,876,785 3,652,996 1,124,360 228,412 211,378 7,788,967
Personal care and service 1,209,304 659,286 550,018 4,295,658 1,092,949 558,684 239,425 7,396,020
Sales 2,994,154 1,991,849 1,002,305 13,446,595 2,196,005 1,049,717 569,638 20,256,109
Office and administrative support
3,660,579 2,564,818 1,095,761 16,040,040 3,293,806 1,074,783 695,341 24,764,549
Farming, fishing and forestry 731,905 137,154 594,751 691,647 65,835 24,675 37,613 1,551,675
Construction trades 2,753,889 821,526 1,932,363 5,678,806 666,610 126,278 234,187 9,459,770
Extraction workers 57,945 32,664 25,281 196,608 16,402 1,829 7,717 280,501
Installation, maintenance and repair workers
967,476 507,987 459,489 3,997,724 456,178 157,787 139,251 5,718,416
Production 2,329,055 897,607 1,431,448 6,492,945 1,429,773 613,443 249,862 11,115,078
Transportation and material moving
2,521,093 1,234,683 1,286,410 6,910,604 2,139,971 362,115 323,231 12,257,014
Military 88,501 79,728 8,773 381,066 85,108 20,121 31,812 606,608
Unemployed, no work experience in past five years
508,595 332,652 175,943 842,091 564,925 120,943 97,320 2,133,874
Total 30,261,004 16,109,082 14,151,922 121,496,063 22,188,104 10,382,380 5,109,203 189,436,754
PERCENT DISTRIBUTION
Management 5.5 % 6.3 % 4.6 % 11.1 % 6.0 % 9.9 % 7.7 % 9.5 %
Business operations 1.4 1.9 0.9 2.7 2.0 3.0 2.3 2.4
Financial 1.1 1.3 0.8 2.3 1.5 3.5 1.5 2.0
Computer and mathematical 1.1 1.4 0.7 2.5 1.6 8.6 2.6 2.5
Architecture and engineering 0.8 0.9 0.7 1.9 0.7 3.5 1.4 1.6
Life, physical and social sciences
0.4 0.5 0.3 0.9 0.4 2.1 0.8 0.8
Community and social services 1.1 1.6 0.7 1.6 2.5 1.0 1.7 1.6
Legal 0.5 0.8 0.3 1.3 0.5 0.8 0.8 1.0
Education, training and library 3.6 4.8 2.2 6.7 4.6 5.6 5.2 5.9
Arts, design, entertainment, sports and media
1.4 1.7 1.1 2.4 1.1 2.1 2.2 2.0
Health care practitioners and technical 2.6 3.5 1.6 5.8 4.8 8.6 4.6 5.3
Health care support 2.4 2.9 1.9 1.9 4.9 2.1 2.6 2.3
Protective service 1.8 2.7 0.7 2.0 3.4 0.9 2.5 2.1
Food preparation and serving 8.8 7.9 9.9 5.3 6.9 6.5 8.4 6.2
Building and grounds cleaning and maintenance
8.5 4.3 13.3 3.0 5.1 2.2 4.1 4.1
Personal care and service 4.0 4.1 3.9 3.5 4.9 5.4 4.7 3.9
Sales 9.9 12.4 7.1 11.1 9.9 10.1 11.1 10.7
Office and administrative support
12.1 15.9 7.7 13.2 14.8 10.4 13.6 13.1
Farming, fishing and forestry 2.4 0.9 4.2 0.6 0.3 0.2 0.7 0.8
Construction trades 9.1 5.1 13.7 4.7 3.0 1.2 4.6 5.0
Extraction workers 0.2 0.2 0.2 0.2 0.1 <0.05 0.2 0.1
Installation, maintenance and repair workers
3.2 3.2 3.2 3.3 2.1 1.5 2.7 3.0
Production 7.7 5.6 10.1 5.3 6.4 5.9 4.9 5.9
Transportation and material moving
8.3 7.7 9.1 5.7 9.6 3.5 6.3 6.5
Military 0.3 0.5 0.1 0.3 0.4 0.2 0.6 0.3
Unemployed, no work experience in past five years
1.7 2.1 1.2 0.7 2.5 1.2 1.9 1.1
All 100.0 % 100.0 % 100.0 % 100.0 % 100.0 % 100.0 % 100.0 % 100.0 %
PEW RESEARCH CENTER
"Statistical Portrait of Hispanics in the United States, 2015"
Detailed occupation, by race and ethnicity: 2015Universe: 2015 resident population ages 16 and older who worked in the past five years
TABLE 24
Source: Pew Research Center tabulations of 2015 American Community Survey (1% IPUMS).
HISPANIC NON-HISPANIC

Industry Total U.S. born Foreign born White alone Black alone Asian alone Other Total
Agriculture, forestry, fishing and mining
1,037,493 306,022 731,471 2,479,942 144,436 63,553 82,957 3,808,381
Utilities 150,776 109,220 41,556 1,103,402 135,844 42,268 36,847 1,469,137
Construction 3,053,116 982,056 2,071,060 7,690,051 752,040 197,261 287,409 11,979,877
Manufacturing - durable and nondurable goods
2,890,044 1,250,621 1,639,423 12,266,596 1,858,217 1,191,418 361,685 18,567,960
Wholesale and retail trade,transportation, warehousing
5,644,561 3,390,360 2,254,201 21,946,304 4,351,822 1,719,183 961,243 34,623,113
Information and communications 417,704 292,942 124,762 2,625,595 417,097 251,863 106,004 3,818,263
Finance, insurance, real estate, and rental and leasing
1,355,923 866,211 489,712 8,111,025 1,112,761 707,585 252,765 11,540,059
Business services 3,282,020 1,574,377 1,707,643 13,542,131 2,219,521 1,498,208 514,367 21,056,247
Educational, health and social services 4,963,183 3,264,181 1,699,002 27,624,595 5,829,483 2,452,801 1,087,862 41,957,924
Arts, entertainment, recreation, accommodations, food services
4,123,167 2,114,462 2,008,705 11,275,490 2,381,954 1,196,605 744,146 19,721,362
Other services (except public administration)
1,679,579 706,476 973,103 5,806,975 888,919 568,284 224,195 9,167,952
Public administration 977,382 760,689 216,693 5,444,226 1,363,509 335,618 295,886 8,416,621
Active-duty military 177,461 158,813 18,648 737,640 167,576 36,790 56,517 1,175,984
Unemployed, no work experience in past five years
508,595 332,652 175,943 842,091 564,925 120,943 97,320 2,133,874
Total 30,261,004 16,109,082 14,151,922 121,496,063 22,188,104 10,382,380 5,109,203 189,436,754
Agriculture, forestry, fishing and mining
3.4 % 1.9 % 5.2 % 2.0 % 0.7 % 0.6 % 1.6 % 2.0 %
Utilities 0.5 0.7 0.3 0.9 0.6 0.4 0.7 0.8
Construction 10.1 6.1 14.6 6.3 3.4 1.9 5.6 6.3
Manufacturing - durable and nondurable goods
9.6 7.8 11.6 10.1 8.4 11.5 7.1 9.8
Wholesale and retail trade,transportation, warehousing
18.7 21.0 15.9 18.1 19.6 16.6 18.8 18.3
Information and communications 1.4 1.8 0.9 2.2 1.9 2.4 2.1 2.0
Finance, insurance, real estate, and rental and leasing
4.5 5.4 3.5 6.7 5.0 6.8 4.9 6.1
Business services 10.8 9.8 12.1 11.1 10.0 14.4 10.1 11.1
Educational, health and social services 16.4 20.3 12.0 22.7 26.3 23.6 21.3 22.1
Arts, entertainment, recreation, accommodations, food services
13.6 13.1 14.2 9.3 10.7 11.5 14.6 10.4
Other services (except public administration)
5.6 4.4 6.9 4.8 4.0 5.5 4.4 4.8
Public administration 3.2 4.7 1.5 4.5 6.1 3.2 5.8 4.4
Active-duty military 0.6 1.0 0.1 0.6 0.8 0.4 1.1 0.6
Unemployed, no work experience in past five years
1.7 2.1 1.2 0.7 2.5 1.2 1.9 1.1
All 100.0 % 100.0 % 100.0 % 100.0 % 100.0 % 100.0 % 100.0 % 100.0 %
PEW RESEARCH CENTER
HISPANIC NON-HISPANIC
"Statistical Portrait of Hispanics in the United States, 2015"
PERCENT DISTRIBUTION
Source: Pew Research Center tabulations of 2015 American Community Survey (1% IPUMS).
Industry, by race and ethnicity: 2015Universe: 2015 resident population ages 16 and older who worked in the past five years
TABLE 25

TABLE 26
Industry Total U.S. born Foreign born White alone Black alone Asian alone Other Total
Agriculture, forestry, fishing and hunting
851,301 181,276 670,025 1,681,466 88,382 38,400 56,995 2,716,544
Mining 186,192 124,746 61,446 798,476 56,054 25,153 25,962 1,091,837
Utilities 150,776 109,220 41,556 1,103,402 135,844 42,268 36,847 1,469,137
Construction 3,053,116 982,056 2,071,060 7,690,051 752,040 197,261 287,409 11,979,877
Manufacturing - nondurable goods 1,398,622 551,114 847,508 4,511,898 839,807 407,873 137,106 7,295,306
Manufacturing - durable goods 1,491,422 699,507 791,915 7,754,698 1,018,410 783,545 224,579 11,272,654
Wholesale trade 839,989 413,522 426,467 3,253,211 371,220 259,634 107,766 4,831,820
Retail trade 3,501,543 2,281,142 1,220,401 14,212,850 2,544,641 1,110,698 651,675 22,021,407
Transportation and warehousing 1,303,029 695,696 607,333 4,480,243 1,435,961 348,851 201,802 7,769,886
Information and communications 417,704 292,942 124,762 2,625,595 417,097 251,863 106,004 3,818,263
Finance, insurance, real estate, and rental and leasing
1,355,923 866,211 489,712 8,111,025 1,112,761 707,585 252,765 11,540,059
Professional, scientific, management, administrative, waste management services
3,282,020 1,574,377 1,707,643 13,542,131 2,219,521 1,498,208 514,367 21,056,247
Educational, health and social services 4,963,183 3,264,181 1,699,002 27,624,595 5,829,483 2,452,801 1,087,862 41,957,924
Arts, entertainment, recreation, accommodations, and food services
4,123,167 2,114,462 2,008,705 11,275,490 2,381,954 1,196,605 744,146 19,721,362
Other services (except public administration)
1,679,579 706,476 973,103 5,806,975 888,919 568,284 224,195 9,167,952
Public administration 977,382 760,689 216,693 5,444,226 1,363,509 335,618 295,886 8,416,621
Active-duty military 177,461 158,813 18,648 737,640 167,576 36,790 56,517 1,175,984
Unemployed, no work experience in past five years
508,595 332,652 175,943 842,091 564,925 120,943 97,320 2,133,874
Total 30,261,004 16,109,082 14,151,922 121,496,063 22,188,104 10,382,380 5,109,203 189,436,754
PERCENT DISTRIBUTION
Agriculture, forestry, fishing and hunting
2.8 % 1.1 % 4.7 % 1.4 % 0.4 % 0.4 % 1.1 % 1.4 %
Mining 0.6 0.8 0.4 0.7 0.3 0.2 0.5 0.6
Utilities 0.5 0.7 0.3 0.9 0.6 0.4 0.7 0.8
Construction 10.1 6.1 14.6 6.3 3.4 1.9 5.6 6.3
Manufacturing - nondurable goods 4.6 3.4 6.0 3.7 3.8 3.9 2.7 3.9
Manufacturing - durable goods 4.9 4.3 5.6 6.4 4.6 7.5 4.4 6.0
Wholesale trade 2.8 2.6 3.0 2.7 1.7 2.5 2.1 2.6
Retail trade 11.6 14.2 8.6 11.7 11.5 10.7 12.8 11.6
Transportation and warehousing 4.3 4.3 4.3 3.7 6.5 3.4 3.9 4.1
Information and communications 1.4 1.8 0.9 2.2 1.9 2.4 2.1 2.0
Finance, insurance, real estate, and rental and leasing
4.5 5.4 3.5 6.7 5.0 6.8 4.9 6.1
Professional, scientific, management, administrative, waste management services
10.8 9.8 12.1 11.1 10.0 14.4 10.1 11.1
Educational, health and social services 16.4 20.3 12.0 22.7 26.3 23.6 21.3 22.1
Arts, entertainment, recreation, accommodations, and food services
13.6 13.1 14.2 9.3 10.7 11.5 14.6 10.4
Other services (except public administration)
5.6 4.4 6.9 4.8 4.0 5.5 4.4 4.8
Public administration 3.2 4.7 1.5 4.5 6.1 3.2 5.8 4.4
Active-duty military 0.6 1.0 0.1 0.6 0.8 0.4 1.1 0.6
Unemployed, no work experience in past five years
1.7 2.1 1.2 0.7 2.5 1.2 1.9 1.1
All 100.0 % 100.0 % 100.0 % 100.0 % 100.0 % 100.0 % 100.0 % 100.0 %
PEW RESEARCH CENTER
Detailed industry, by race and ethnicity: 2015
NON-HISPANIC
Source: Pew Research Center tabulations of 2015 American Community Survey (1% IPUMS).
"Statistical Portrait of Hispanics in the United States, 2015"
Universe: 2015 resident population ages 16 and older who worked in the past five years
HISPANIC

Less than $20,000 $20,000 to $49,999 $50,000 or more Total
Hispanic 11,105,793 11,385,515 4,817,645 27,308,953
U.S. born 5,854,382 5,530,560 2,964,290 14,349,232
Foreign born 5,251,411 5,854,955 1,853,355 12,959,721
White alone, not Hispanic 31,843,799 36,628,969 38,521,027 106,993,795
Black alone, not Hispanic 7,445,532 7,581,267 4,087,056 19,113,855
Asian alone, not Hispanic 2,635,131 2,846,632 3,812,474 9,294,237
Other, not Hispanic 1,801,875 1,541,355 1,112,682 4,455,912
Total 54,832,130 59,983,738 52,350,884 167,166,752
Hispanic 40.7 % 41.7 % 17.6 % 100.0 %
U.S. born 40.8 38.5 20.7 100.0
Foreign born 40.5 45.2 14.3 100.0
White alone, not Hispanic 29.8 34.2 36.0 100.0
Black alone, not Hispanic 39.0 39.7 21.4 100.0
Asian alone, not Hispanic 28.4 30.6 41.0 100.0
Other, not Hispanic 40.4 34.6 25.0 100.0
All 32.8 % 35.9 % 31.3 % 100.0 %
PEW RESEARCH CENTER
TABLE 27
Universe: 2015 resident population ages 16 and older with positive earnings
"Statistical Portrait of Hispanics in the United States, 2015"
Persons, by personal earnings, race and ethnicity: 2015
PERCENT DISTRIBUTION
Source: Pew Research Center tabulations of 2015 American Community Survey (1% IPUMS).
Note: Due to the way in which the IPUMS adjusts annual incomes, these data will differ from those that might be provided by the U.S. Census Bureau. "Other, not Hispanic" includes persons reporting single races not listed separately and persons reporting more than one race.

Hispanic $ 24,000
U.S. born 24,000
Foreign born 23,000
White alone, not Hispanic 35,000
Black alone, not Hispanic 25,000
Asian alone, not Hispanic 38,000
Other, not Hispanic 25,000
All $ 30,000
PEW RESEARCH CENTER
Table 28
Median personal earnings, by race and ethnicity: 2015 Universe: 2015 resident population ages 16 and older with positive earnings
"Statistical Portrait of Hispanics in the United States, 2015"
Note: Due to the way in which the IPUMS adjusts annual incomes, these data will differ from those that might be provided by the U.S. Census Bureau. "Other, not Hispanic" includes persons reporting single races not listed separately and persons reporting more than one race.
Source: Pew Research Center tabulations of 2015 American Community Survey (1% IPUMS).

Less than $20,000 $20,000 to $49,999 $50,000 or more Total
Hispanic 3,609,512 9,664,008 4,458,325 17,731,845
U.S. born 1,452,167 4,634,626 2,737,310 8,824,103
Foreign born 2,157,345 5,029,382 1,721,015 8,907,742
White alone, not Hispanic 5,880,865 28,850,262 35,107,228 69,838,355
Black alone, not Hispanic 1,953,039 6,362,761 3,789,598 12,105,398
Asian alone, not Hispanic 621,662 2,191,534 3,471,581 6,284,777
Other, not Hispanic 338,355 1,219,341 1,017,892 2,575,588
Total 12,403,433 48,287,906 47,844,624 108,535,963
Hispanic 20.4 % 54.5 % 25.1 % 100.0 %
U.S. born 16.5 52.5 31.0 100.0
Foreign born 24.2 56.5 19.3 100.0
White alone, not Hispanic 8.4 41.3 50.3 100.0
Black alone, not Hispanic 16.1 52.6 31.3 100.0
Asian alone, not Hispanic 9.9 34.9 55.2 100.0
Other, not Hispanic 13.1 47.3 39.5 100.0
All 11.4 % 44.5 % 44.1 % 100.0 %
PEW RESEARCH CENTER
"Statistical Portrait of Hispanics in the United States, 2015"
PERCENT DISTRIBUTION
TABLE 29
Source: Pew Research Center tabulations of 2015 American Community Survey (1% IPUMS).
Full-time, year-round workers, by personal earnings, race and ethnicity: 2015Universe: 2015 resident population ages 16 and older defined for persons who worked at least 35 hours per week and at least 48 weeks in the past year
Note: Due to the way in which the IPUMS adjusts annual incomes, these data will differ from those that might be provided by the U.S. Census Bureau. "Other, not Hispanic" includes persons reporting single races not listed separately and persons reporting more than one race.

Hispanic $ 30,000
U.S. born 35,000
Foreign born 28,000
White alone, not Hispanic 50,000
Black alone, not Hispanic 35,000
Asian alone, not Hispanic 54,000
Other, not Hispanic 40,000
All $ 44,000
PEW RESEARCH CENTER
"Statistical Portrait of Hispanics in the United States, 2015"
TABLE 30
Median personal earnings for full-time, year-round workers, by race and ethnicity: 2015Universe: 2015 resident population ages 16 and older defined for persons who worked at least 35 hours per week and at least 48 weeks in the past year
Note: Due to the way in which the IPUMS adjusts annual incomes, these data will differ from those that might be provided by the U.S. Census Bureau. "Other, not Hispanic" includes persons reporting single races not listed separately and persons reporting more than one race.
Source: Pew Research Center tabulations of 2015 American Community Survey (1% IPUMS).

1st quintile 2nd quintile 3rd quintile 4th quintile 5th quintile(Up to $22,900) ($22,901–$43,400) ($43,401–$70,000) ($70,001–$112,260) ($112,261+) Total
Hispanic 3,634,920 3,739,705 3,336,465 2,563,575 1,793,138 15,067,803
U.S. born 1,725,309 1,630,951 1,609,876 1,394,557 1,088,902 7,449,595
Foreign born 1,909,611 2,108,754 1,726,589 1,169,018 704,236 7,618,208
White alone, not Hispanic 13,748,269 15,184,127 16,647,877 16,932,580 18,267,165 80,780,018
Black alone, not Hispanic 4,742,159 3,381,906 2,705,619 2,040,512 1,366,073 14,236,269
Asian alone, not Hispanic 850,272 737,714 891,921 1,110,783 1,753,155 5,343,845
Other, not Hispanic 715,452 551,551 543,272 508,273 461,729 2,780,277
Total 23,691,072 23,595,003 24,125,154 23,155,723 23,641,260 118,208,212
Hispanic 24.1 % 24.8 % 22.1 % 17.0 % 11.9 % 100.0 %
U.S. born 23.2 21.9 21.6 18.7 14.6 100.0
Foreign born 25.1 27.7 22.7 15.3 9.2 100.0
White alone, not Hispanic 17.0 18.8 20.6 21.0 22.6 100.0
Black alone, not Hispanic 33.3 23.8 19.0 14.3 9.6 100.0
Asian alone, not Hispanic 15.9 13.8 16.7 20.8 32.8 100.0
Other, not Hispanic 25.7 19.8 19.5 18.3 16.6 100.0
All 20.0 % 20.0 % 20.4 % 19.6 % 20.0 % 100.0 %
PEW RESEARCH CENTER
"Statistical Portrait of Hispanics in the United States, 2015"
Households, by income, race and ethnicity: 2015
PERCENT DISTRIBUTION
TABLE 31
Universe: 2015 households
Source: Pew Research Center tabulations of 2015 American Community Survey (1% IPUMS).
Note: Quintiles are based upon 2015 total household income distribution. Due to the way in which the IPUMS adjusts annual incomes, these data will differ from those that might be provided by the U.S. Census Bureau. "Other, not Hispanic" includes persons reporting single races not listed separately and persons reporting more than one race. The household population excludes persons living in institutions, college dormitories and other group quarters. Households are classified by the race or ethnicity of the household head.

Universe: 2015 households
Hispanic $ 44,800
U.S. born 49,004
Foreign born 41,000
White alone, not Hispanic 61,000
Black alone, not Hispanic 36,000
Asian alone, not Hispanic 77,000
Other, not Hispanic 49,100
All $ 55,300
PEW RESEARCH CENTER
"Statistical Portrait of Hispanics in the United States, 2015"
TABLE 32
Median household income, by race and ethnicity: 2015
Note: Due to the way in which the IPUMS adjusts annual incomes, these data will differ from those that might be provided by the U.S. Census Bureau. "Other, not Hispanic" includes persons reporting single races not listed separately and persons reporting more than one race. The household population excludes persons living in institutions, college dormitories and other group quarters. Households are classified by the race or ethnicity of the household head.
Source: Pew Research Center tabulations of 2015 American Community Survey (1% IPUMS).

Total
Hispanic 5,467,599 6,055,713 650,086 12,173,398
U.S. born 5,110,575 2,806,678 243,448 8,160,701
Foreign born 357,024 3,249,035 406,638 4,012,697
White alone, not Hispanic 4,723,953 11,912,818 2,396,600 19,033,371
Black alone, not Hispanic 3,594,876 5,171,272 651,969 9,418,117
Asian alone, not Hispanic 405,849 1,282,497 237,713 1,926,059
Other, not Hispanic 893,852 970,110 86,497 1,950,459
Total 15,086,129 25,392,410 4,022,865 44,501,404
Total
Hispanic 30.5 % 17.9 % 17.7 % 21.9 %
U.S. born 30.2 15.9 14.7 22.5
Foreign born 35.2 20.1 20.1 20.9
White alone, not Hispanic 12.6 9.9 6.6 9.8
Black alone, not Hispanic 36.5 21.4 16.2 24.7
Asian alone, not Hispanic 11.9 11.2 12.1 11.5
Other, not Hispanic 21.3 17.7 12.9 18.9
All 20.7 % 13.0 % 8.7 % 14.2 %
"Statistical Portrait of Hispanics in the United States, 2015"
PEW RESEARCH CENTER
Younger than 18 18 to 64 65 and older
Source: Pew Research Center tabulations of 2015 American Community Survey (1% IPUMS).
POVERTY RATE (%)
Note: *Poverty status is determined for individuals in housing units and noninstitutional group quarters. The poverty universe excludes children under age 15 who are not related to the householder, people living in institutional group quarters and people living in college dormitories or military barracks. Due to the way in which the IPUMS adjusts annual incomes, these data will differ from those that might be provided by the U.S. Census Bureau. "Other, not Hispanic" includes persons reporting single races not listed separately and persons reporting more than one race.
TABLE 33
Based on 2015 poverty universe*
Younger than 18
Poverty, by age, race and ethnicity: 2015
PERSONS IN POVERTY
18 to 64 65 and older
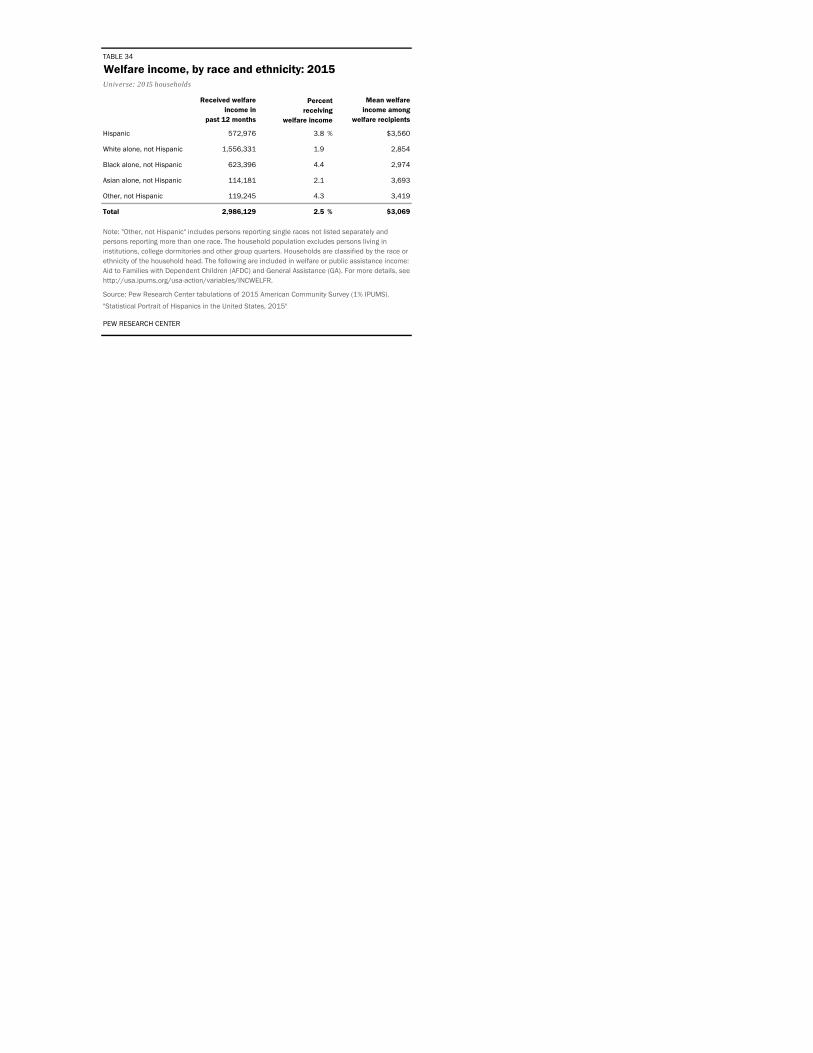
Received welfare income in
past 12 months
Mean welfare income among
welfare recipients
Hispanic 572,976 3.8 % $3,560
White alone, not Hispanic 1,556,331 1.9 2,854
Black alone, not Hispanic 623,396 4.4 2,974
Asian alone, not Hispanic 114,181 2.1 3,693
Other, not Hispanic 119,245 4.3 3,419
Total 2,986,129 2.5 % $3,069
Source: Pew Research Center tabulations of 2015 American Community Survey (1% IPUMS).
"Statistical Portrait of Hispanics in the United States, 2015"
PEW RESEARCH CENTER
TABLE 34
Welfare income, by race and ethnicity: 2015Universe: 2015 households
Percent receiving
welfare income
Note: "Other, not Hispanic" includes persons reporting single races not listed separately and persons reporting more than one race. The household population excludes persons living in institutions, college dormitories and other group quarters. Households are classified by the race or ethnicity of the household head. The following are included in welfare or public assistance income: Aid to Families with Dependent Children (AFDC) and General Assistance (GA). For more details, see http://usa.ipums.org/usa-action/variables/INCWELFR.

Received food stamps in past 12 months
Hispanic 3,314,026 22.0 %
White alone, not Hispanic 7,005,944 8.7
Black alone, not Hispanic 3,860,952 27.1
Asian alone, not Hispanic 390,227 7.3
Other, not Hispanic 564,046 20.3
Total 15,135,195 12.8 %
"Statistical Portrait of Hispanics in the United States, 2015"
PEW RESEARCH CENTER
TABLE 35
Food stamp recipiency, by race and ethnicity: 2015Universe: 2015 households
Percent receiving food stamps
Note: The household population excludes persons living in institutions, college dormitories and other group quarters. Households are classified by the race or ethnicity of the household head. Includes all households that received food stamps or a food stamp benefit card, and includes benefits from the Supplemental Nutritional Assistance Program (SNAP) but does not include benefits from the Special Supplemental Nutrition Program for Women, Infants, and Children (WIC) or the National School Lunch Program. For more details, see http://usa.ipums.org/usa-action/variables/FOODSTMP. "Other, not Hispanic" includes persons reporting single races not listed separately and persons reporting more than one race.
Source: Pew Research Center tabulations of 2015 American Community Survey (1% IPUMS).

Younger than 18 18 to 64 65 and older Total
Hispanic 1,364,253 9,599,207 157,312 11,120,772
U.S. born 1,002,512 3,086,818 13,406 4,102,736
Foreign born 361,741 6,512,389 143,906 7,018,036
White alone, not Hispanic 1,433,833 11,267,487 114,432 12,815,752
Black alone, not Hispanic 419,773 4,276,152 49,932 4,745,857
Asian alone, not Hispanic 140,862 1,130,746 69,180 1,340,788
Other, not Hispanic 213,323 934,071 12,243 1,159,637
Total 3,572,044 27,207,663 403,099 31,182,806
Total
Hispanic 7.5 % 27.7 % 4.2 % 19.7 %
U.S. born 5.9 16.9 0.8 11.1
Foreign born 35.3 39.9 7.0 36.2
White alone, not Hispanic 3.8 9.2 0.3 6.5
Black alone, not Hispanic 4.2 16.8 1.2 12.0
Asian alone, not Hispanic 4.1 9.7 3.5 7.8
Other, not Hispanic 5.0 16.4 1.8 10.9
All 4.9 % 13.6 % 0.8 % 9.7 %
TABLE 36
PEW RESEARCH CENTER
Source: Pew Research Center tabulations of 2015 American Community Survey (1% IPUMS).
Persons without health insurance, by age, race and ethnicity: 2015Universe: 2015 resident population
"Statistical Portrait of Hispanics in the United States, 2015"
PERSONS WITHOUT HEALTH INSURANCE
UNINSURED RATE (%)
Younger than 18 18 to 64 65 and older
Note: These data reflect insurance coverage prior to the implementation of the employer insurance mandate of the Affordable Care Act. "Other, not Hispanic" includes persons reporting single races not listed separately and persons reporting more than one race.

Private health care coverage
Public health care coverage
Both private and public No coverage
Hispanic 23,927,765 18,806,785 2,621,455 11,120,772
U.S. born 16,786,926 14,226,141 1,947,717 4,102,736
Foreign born 7,140,839 4,580,644 673,738 7,018,036
White alone, not Hispanic 119,456,251 36,030,144 29,251,808 12,815,752
Black alone, not Hispanic 17,716,507 13,676,935 3,510,952 4,745,857
Asian alone, not Hispanic 11,358,810 3,318,954 1,078,938 1,340,788
Other, not Hispanic 5,645,148 3,071,855 763,708 1,159,637
Total 178,104,481 74,904,673 37,226,861 31,182,806
Hispanic 42.4 % 33.3 % 4.6 % 19.7 %
U.S. born 45.3 38.4 5.3 11.1
Foreign born 36.8 23.6 3.5 36.2
White alone, not Hispanic 60.5 18.2 14.8 6.5
Black alone, not Hispanic 44.7 34.5 8.9 12.0
Asian alone, not Hispanic 66.4 19.4 6.3 7.8
Other, not Hispanic 53.1 28.9 7.2 10.9
All 55.4 % 23.3 % 11.6 % 9.7 %
Note: These data reflect insurance coverage prior to the implementation of the employer insurance mandate of the Affordable Care Act. Private health insurance includes employer-provided insurance, union-provided insurance, plans purchased by individuals from private insurance companies and TRICARE or other military health care. Public health insurance includes the federal insurance programs Medicare, Medicaid and Department of Veterans Affairs insurance. For more details, see https://usa.ipums.org/usa-action/variables/HCOVPUB#description_section. "Other, not Hispanic" includes persons reporting single races not listed separately and persons reporting more than one race.
"Statistical Portrait of Hispanics in the United States, 2015"
PEW RESEARCH CENTER
Source: Pew Research Center tabulations of 2015 American Community Survey (1% IPUMS).
TABLE 37
Type of health insurance, by race and ethnicity: 2015Universe: 2015 resident population
PERCENT DISTRIBUTIONPrivate health care coverage
Public health care coverage
Both private and public No coverage

Owner-occupied Renter-occupied
Hispanic 6,824,272 8,243,531 45.3 %
U.S. born 3,512,518 3,937,077 47.2
Foreign born 3,311,754 4,306,454 43.5
White alone, not Hispanic 57,435,522 23,344,496 71.1
Black alone, not Hispanic 5,870,963 8,365,306 41.2
Asian alone, not Hispanic 3,101,663 2,242,182 58.0
Other, not Hispanic 1,405,446 1,374,831 50.6
Total 74,637,866 43,570,346 63.1 %
Note: The household population excludes persons living in institutions, college dormitories and other group quarters. Households are classified by the race or ethnicity of the household head. "Other, not Hispanic" includes persons reporting single races not listed separately and persons reporting more than one race.
"Statistical Portrait of Hispanics in the United States, 2015"
PEW RESEARCH CENTER
TABLE 38
Housing tenure, by race and ethnicity: 2015Universe: 2015 households
Source: Pew Research Center tabulations of 2015 American Community Survey (1% IPUMS).
Percent owner-occupied

Household heads
Number of homeowners
0 to 5 years 400,501 69,569 17.4 %
6 to 10 years 698,980 146,208 20.9
11 to 15 years 1,218,156 342,465 28.1
16 to 20 years 1,180,450 441,283 37.4
Over 20 years 4,120,121 2,312,229 56.1
Total 7,618,208 3,311,754 43.5 %
TABLE 39
Percent owning home
Source: Pew Research Center tabulations of 2015 American Community Survey (1% IPUMS).
PEW RESEARCH CENTER
"Statistical Portrait of Hispanics in the United States, 2015"
Universe: 2015 foreign-born Hispanic heads of households
Homeownership among foreign-born Hispanic heads of households, by years in U.S.: 2015
Note: The household population excludes persons living in institutions, college dormitories and other group quarters.
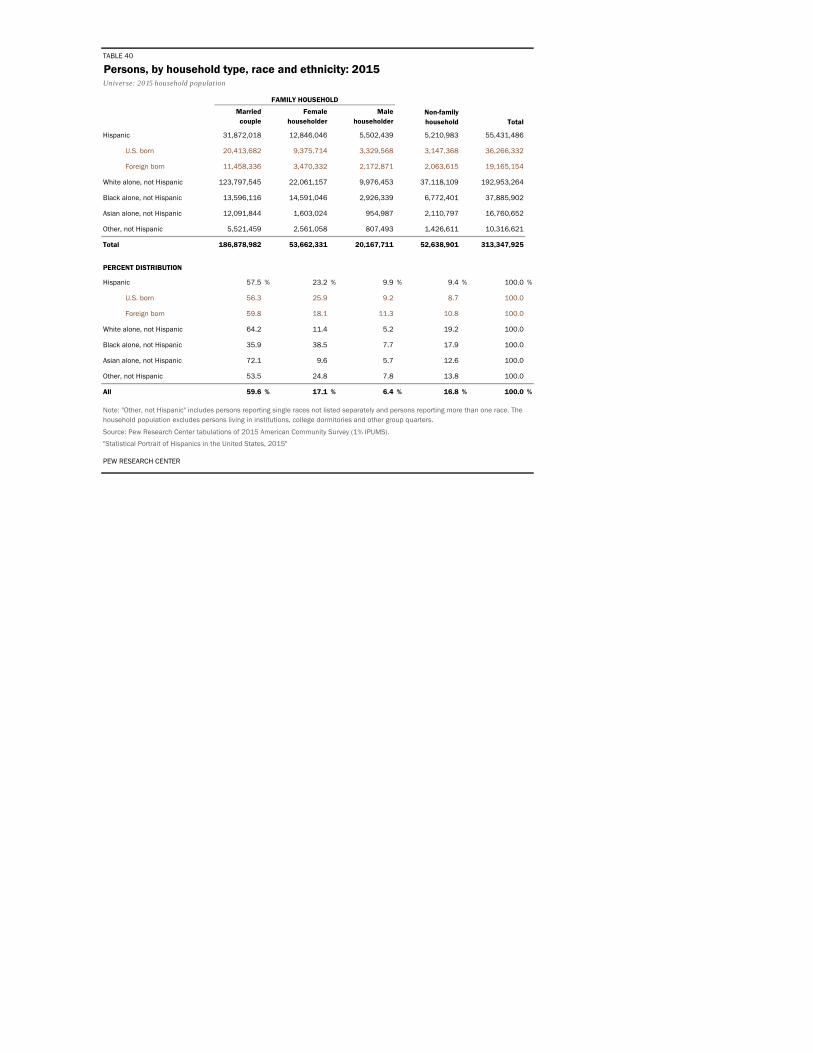
TABLE 40
Married couple
Female householder
Male householder
Hispanic 31,872,018 12,846,046 5,502,439 5,210,983 55,431,486
U.S. born 20,413,682 9,375,714 3,329,568 3,147,368 36,266,332
Foreign born 11,458,336 3,470,332 2,172,871 2,063,615 19,165,154
White alone, not Hispanic 123,797,545 22,061,157 9,976,453 37,118,109 192,953,264
Black alone, not Hispanic 13,596,116 14,591,046 2,926,339 6,772,401 37,885,902
Asian alone, not Hispanic 12,091,844 1,603,024 954,987 2,110,797 16,760,652
Other, not Hispanic 5,521,459 2,561,058 807,493 1,426,611 10,316,621
Total 186,878,982 53,662,331 20,167,711 52,638,901 313,347,925
Hispanic 57.5 % 23.2 % 9.9 % 9.4 % 100.0 %
U.S. born 56.3 25.9 9.2 8.7 100.0
Foreign born 59.8 18.1 11.3 10.8 100.0
White alone, not Hispanic 64.2 11.4 5.2 19.2 100.0
Black alone, not Hispanic 35.9 38.5 7.7 17.9 100.0
Asian alone, not Hispanic 72.1 9.6 5.7 12.6 100.0
Other, not Hispanic 53.5 24.8 7.8 13.8 100.0
All 59.6 % 17.1 % 6.4 % 16.8 % 100.0 %
PEW RESEARCH CENTER
Persons, by household type, race and ethnicity: 2015
"Statistical Portrait of Hispanics in the United States, 2015"
FAMILY HOUSEHOLD
Non-family household Total
PERCENT DISTRIBUTION
Universe: 2015 household population
Source: Pew Research Center tabulations of 2015 American Community Survey (1% IPUMS).
Note: "Other, not Hispanic" includes persons reporting single races not listed separately and persons reporting more than one race. The household population excludes persons living in institutions, college dormitories and other group quarters.

Two-person families
Three- or four- person families
Five-person families or more Total
Hispanic 3,259,926 5,344,521 2,914,322 11,518,769
U.S. born 1,803,275 2,425,700 1,040,597 5,269,572
Foreign born 1,456,651 2,918,821 1,873,725 6,249,197
White alone, not Hispanic 27,281,579 19,246,384 5,141,672 51,669,635
Black alone, not Hispanic 3,660,001 3,805,565 1,219,926 8,685,492
Asian alone, not Hispanic 1,278,297 2,002,308 682,221 3,962,826
Other, not Hispanic 709,116 757,854 288,746 1,755,716
Total 36,188,919 31,156,632 10,246,887 77,592,438
Hispanic 28.3 % 46.4 % 25.3 % 100.0 %
U.S. born 34.2 46.0 19.7 100.0
Foreign born 23.3 46.7 30.0 100.0
White alone, not Hispanic 52.8 37.2 10.0 100.0
Black alone, not Hispanic 42.1 43.8 14.0 100.0
Asian alone, not Hispanic 32.3 50.5 17.2 100.0
Other, not Hispanic 40.4 43.2 16.4 100.0
All 46.6 % 40.2 % 13.2 % 100.0 %
TABLE 41
Households, by family size, race and ethnicity: 2015
PEW RESEARCH CENTER
Universe: 2015 family households
"Statistical Portrait of Hispanics in United States, 2015"
PERCENT DISTRIBUTION
Source: Pew Research Center tabulations of 2015 American Community Survey (1% IPUMS).
Note: "Other, not Hispanic" includes persons reporting single races not listed separately and persons reporting more than one race. The household population excludes persons living in institutions, college dormitories and other group quarters. Households are classified by the race or ethnicity of the household head.

Parent householder
Grandparent householder Other Total
Hispanic 15,395,367 1,652,941 1,047,778 18,096,086
U.S. born 14,572,644 1,590,214 909,063 17,071,921
Foreign born 822,723 62,727 138,715 1,024,165
White alone, not Hispanic 34,292,852 2,305,749 1,189,515 37,788,116
Black alone, not Hispanic 8,044,311 1,327,216 624,104 9,995,631
Asian alone, not Hispanic 3,117,400 149,074 155,965 3,422,439
Other, not Hispanic 3,586,998 448,157 204,927 4,240,082
Total 64,436,928 5,883,137 3,222,289 73,542,354
Hispanic 85.1 % 9.1 % 5.8 % 100.0 %
U.S. born 85.4 9.3 5.3 100.0
Foreign born 80.3 6.1 13.5 100.0
White alone, not Hispanic 90.8 6.1 3.1 100.0
Black alone, not Hispanic 80.5 13.3 6.2 100.0
Asian alone, not Hispanic 91.1 4.4 4.6 100.0
Other, not Hispanic 84.6 10.6 4.8 100.0
All 87.6 % 8.0 % 4.4 % 100.0 %
TABLE 42
Living arrangements of children, by race and ethnicity: 2015
Source: Pew Research Center tabulations of 2015 American Community Survey (1% IPUMS).
PEW RESEARCH CENTER
PERCENT DISTRIBUTION
Universe: 2015 resident population ages 17 and younger
"Statistical Portrait of Hispanics in the United States, 2015"
Note: "Other, not Hispanic" includes persons reporting single races not listed separately and persons reporting more than one race. The household population excludes persons living in institutions, college dormitories and other group quarters.

Hispanic population
Total population
Northeast 7,891,872 56,283,891 14.0 %
Midwest 5,164,639 67,907,404 7.6
South 20,853,647 121,182,847 17.2
West 22,566,619 76,044,679 29.7
Total 56,476,777 321,418,821 17.6 %
PEW RESEARCH CENTER
Table 43
"Statistical Portrait of Hispanics in the United States, 2015"
Hispanic population, by region: 2015Universe: 2015 resident population
Percent Hispanic
Source: Pew Research Center tabulations of 2015 American Community Survey (1% IPUMS).
Note: For details on the states included in each region, see https://usa.ipums.org/usa-action/variables/REGION#description_section.

TABLE 44
Hispanic population
Total population
California 15,184,905 39,144,818 38.8 %
Texas 10,669,240 27,469,114 38.8
Florida 4,961,905 20,271,272 24.5
New York 3,722,097 19,795,791 18.8
Illinois 2,171,133 12,859,995 16.9
Arizona 2,098,511 6,828,065 30.7
New Jersey 1,762,984 8,958,013 19.7
Colorado 1,165,546 5,456,574 21.4
New Mexico 1,002,409 2,085,109 48.1
Georgia 950,471 10,214,860 9.3
North Carolina 912,609 10,042,802 9.1
Washington 886,521 7,170,351 12.4
Pennsylvania 867,095 12,802,503 6.8
Nevada 812,952 2,890,845 28.1
Massachusetts 757,059 6,794,422 11.1
Virginia 753,718 8,382,993 9.0
Maryland 572,526 6,006,401 9.5
Connecticut 554,361 3,590,886 15.4
Oregon 511,475 4,028,977 12.7
Michigan 487,335 9,922,576 4.9
Indiana 437,508 6,619,680 6.6
Utah 409,228 2,995,919 13.7
Ohio 408,057 11,613,423 3.5
Oklahoma 396,307 3,911,338 10.1
Wisconsin 380,548 5,771,337 6.6
Kansas 336,479 2,911,641 11.6
Tennessee 334,083 6,600,299 5.1
Minnesota 279,277 5,489,594 5.1
South Carolina 261,580 4,896,146 5.3
Missouri 238,070 6,083,672 3.9
Louisiana 227,388 4,670,724 4.9
Arkansas 207,590 2,978,204 7.0
Idaho 199,912 1,654,930 12.1
Nebraska 196,460 1,896,190 10.4
Alabama 191,944 4,858,979 4.0
Iowa 174,068 3,123,899 5.6
Rhode Island 152,605 1,056,298 14.4
Hawaii 148,457 1,431,603 10.4
Kentucky 145,175 4,425,092 3.3
Mississippi 85,625 2,992,333 2.9
Delaware 85,152 945,934 9.0
District of Columbia 71,453 672,228 10.6
Wyoming 57,801 586,107 9.9
Alaska 51,719 738,432 7.0
New Hampshire 44,321 1,330,608 3.3
Montana 37,183 1,032,949 3.6
South Dakota 29,828 858,469 3.5
West Virginia 26,881 1,844,128 1.5
North Dakota 25,876 756,928 3.4
Maine 20,677 1,329,328 1.6
Vermont 10,673 626,042 1.7
Total 56,476,777 321,418,821 17.6 %
PEW RESEARCH CENTER
Universe: 2015 resident population
Note: States and D.C. are listed in descending order of number of Hispanic residents in 2015.
Hispanic population, by state: 2015
Source: Pew Research Center tabulations of 2015 American Community Survey (1% IPUMS).
"Statistical Portrait of Hispanics in the United States, 2015"
Percent Hispanic

California 26.9 %
Texas 18.9
Florida 8.8
New York 6.6
Illinois 3.8
Arizona 3.7
New Jersey 3.1
Colorado 2.1
New Mexico 1.8
Georgia 1.7
Other states 22.6
All 100.0 %
PEW RESEARCH CENTER
TABLE 45
Distribution of Hispanics across states: 2015Universe: 2015 Hispanic resident population
Source: Pew Research Center tabulations of 2015 American Community Survey (1% IPUMS).
"Statistical Portrait of Hispanics in the United States, 2015"
Note: Top 10 states are listed in descending order of their schare of the Hispanic population in 2015.