Embed Size (px)
Citation preview

UNIVERSITY OF KENTUCKYCollege of Engineering
KENTUCKY TRANSPORTATION CENTER
��������������� � �������� �� ������� � ���
� �� � �� ����� � ������� � �� ��������
�������� ������ �������������������

We provide services to the transportation community
through research, technology transfer and education.
We create and participate in partnerships
to promote safe and effective
transportation systems.
OUR MISSION
OUR VALUES
Teamwork
Listening and communicating along with
courtesy and respect for others.
Honesty and Ethical Behavior
Delivering the highest quality
products and services.
Continuous Improvement
In all that we do.

Research Report
KTC- 06-13/SPR 270-03-1F
Characteristics and Engineering Properties of the Soft Soil Layer in Highway Soil Subgrades
by Tommy C. Hopkins Tony L. Beckham Liecheng Sun Program Manager and Former Research Geologist Senior Research Engineer Chief Research Engineer
Kentucky Transportation Center
College of Engineering University of Kentucky
In cooperation with the
Kentucky Transportation Cabinet The Commonwealth of Kentucky
and Federal Highway Administration
The contents of this report reflect the views of the authors, who are responsible for the facts and accuracy of the data herein. The contents do not necessarily reflect the official views or policies of the University of Kentucky, Kentucky Transportation Cabinet, nor the Federal Highway Administration. This report does not constitute a standard, specification, or regulation.
June 2006

Abstract iii
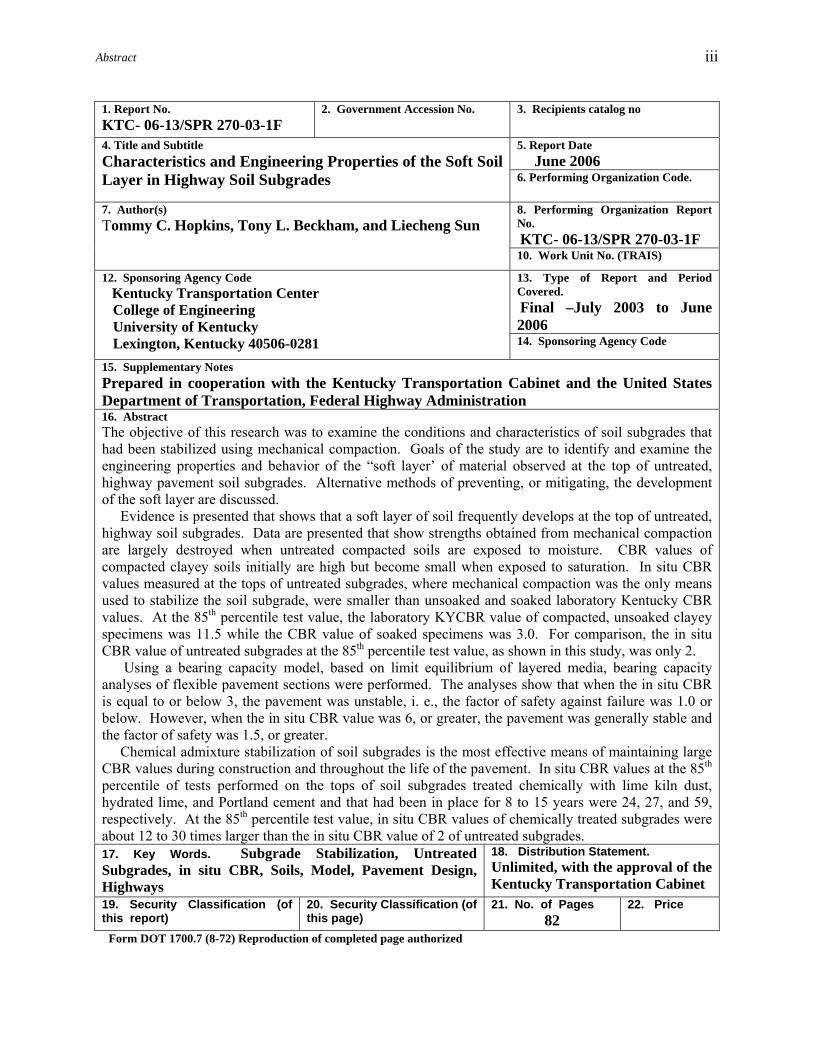
1. Report No. KTC- 06-13/SPR 270-03-1F
2. Government Accession No. 3. Recipients catalog no
5. Report Date June 2006
4. Title and Subtitle Characteristics and Engineering Properties of the Soft Soil Layer in Highway Soil Subgrades 6. Performing Organization Code.
8. Performing Organization Report No. KTC- 06-13/SPR 270-03-1F
7. Author(s) Tommy C. Hopkins, Tony L. Beckham, and Liecheng Sun 10. Work Unit No. (TRAIS)
13. Type of Report and Period Covered. Final –July 2003 to June 2006
12. Sponsoring Agency Code Kentucky Transportation Center College of Engineering University of Kentucky Lexington, Kentucky 40506-0281 14. Sponsoring Agency Code 15. Supplementary Notes Prepared in cooperation with the Kentucky Transportation Cabinet and the United States Department of Transportation, Federal Highway Administration 16. Abstract The objective of this research was to examine the conditions and characteristics of soil subgrades that had been stabilized using mechanical compaction. Goals of the study are to identify and examine the engineering properties and behavior of the “soft layer’ of material observed at the top of untreated, highway pavement soil subgrades. Alternative methods of preventing, or mitigating, the development of the soft layer are discussed. Evidence is presented that shows that a soft layer of soil frequently develops at the top of untreated, highway soil subgrades. Data are presented that show strengths obtained from mechanical compaction are largely destroyed when untreated compacted soils are exposed to moisture. CBR values of compacted clayey soils initially are high but become small when exposed to saturation. In situ CBR values measured at the tops of untreated subgrades, where mechanical compaction was the only means used to stabilize the soil subgrade, were smaller than unsoaked and soaked laboratory Kentucky CBR values. At the 85th percentile test value, the laboratory KYCBR value of compacted, unsoaked clayey specimens was 11.5 while the CBR value of soaked specimens was 3.0. For comparison, the in situ CBR value of untreated subgrades at the 85th percentile test value, as shown in this study, was only 2. Using a bearing capacity model, based on limit equilibrium of layered media, bearing capacity analyses of flexible pavement sections were performed. The analyses show that when the in situ CBR is equal to or below 3, the pavement was unstable, i. e., the factor of safety against failure was 1.0 or below. However, when the in situ CBR value was 6, or greater, the pavement was generally stable and the factor of safety was 1.5, or greater. Chemical admixture stabilization of soil subgrades is the most effective means of maintaining large CBR values during construction and throughout the life of the pavement. In situ CBR values at the 85th percentile of tests performed on the tops of soil subgrades treated chemically with lime kiln dust, hydrated lime, and Portland cement and that had been in place for 8 to 15 years were 24, 27, and 59, respectively. At the 85th percentile test value, in situ CBR values of chemically treated subgrades were about 12 to 30 times larger than the in situ CBR value of 2 of untreated subgrades. 17. Key Words. Subgrade Stabilization, Untreated Subgrades, in situ CBR, Soils, Model, Pavement Design, Highways
18. Distribution Statement. Unlimited, with the approval of the Kentucky Transportation Cabinet
19. Security Classification (of this report) 20. Security Classification (of
this page) 21. No. of Pages 82
22. Price Form DOT 1700.7 (8-72) Reproduction of completed page authorized

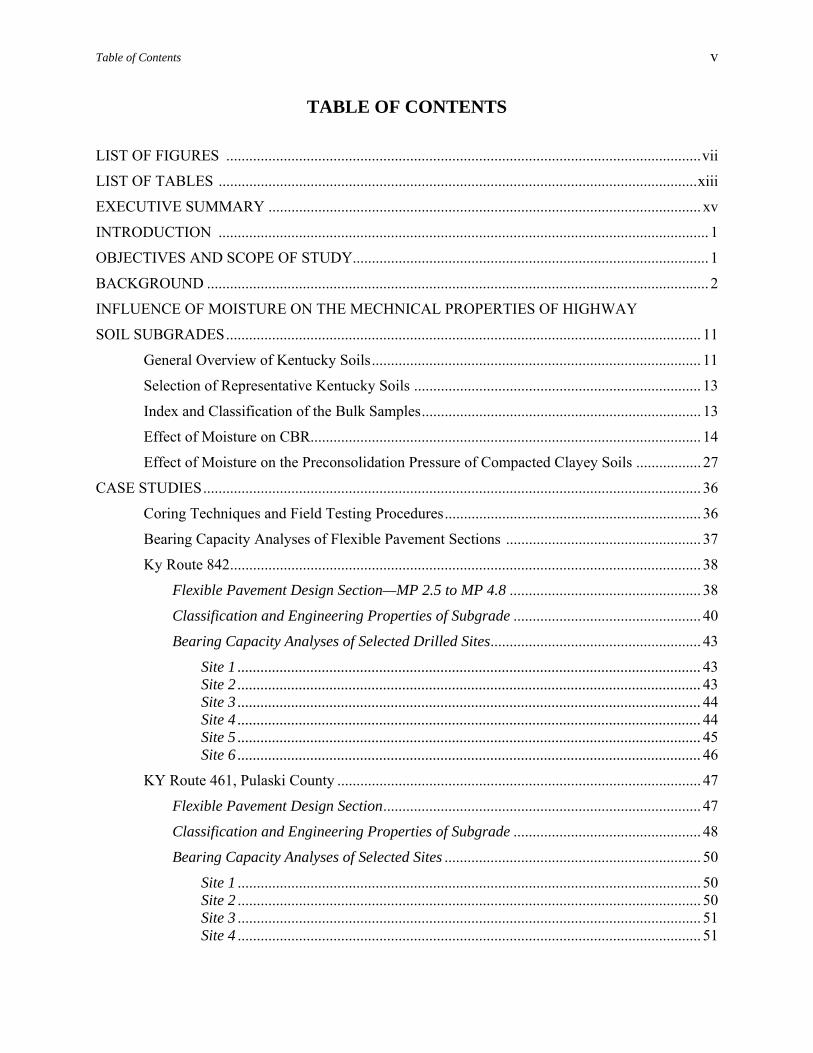
Table of Contents v
TABLE OF CONTENTS
LIST OF FIGURES ............................................................................................................................vii
LIST OF TABLES .............................................................................................................................xiii
EXECUTIVE SUMMARY ................................................................................................................. xv
INTRODUCTION ................................................................................................................................ 1
OBJECTIVES AND SCOPE OF STUDY............................................................................................. 1
BACKGROUND ................................................................................................................................... 2
INFLUENCE OF MOISTURE ON THE MECHNICAL PROPERTIES OF HIGHWAY
SOIL SUBGRADES............................................................................................................................ 11
General Overview of Kentucky Soils...................................................................................... 11
Selection of Representative Kentucky Soils ........................................................................... 13
Index and Classification of the Bulk Samples......................................................................... 13
Effect of Moisture on CBR...................................................................................................... 14
Effect of Moisture on the Preconsolidation Pressure of Compacted Clayey Soils ................. 27
CASE STUDIES.................................................................................................................................. 36
Coring Techniques and Field Testing Procedures................................................................... 36
Bearing Capacity Analyses of Flexible Pavement Sections ................................................... 37
Ky Route 842........................................................................................................................... 38
Flexible Pavement Design Section—MP 2.5 to MP 4.8 .................................................. 38
Classification and Engineering Properties of Subgrade ................................................. 40
Bearing Capacity Analyses of Selected Drilled Sites....................................................... 43
Site 1 .........................................................................................................................43 Site 2 .........................................................................................................................43 Site 3 .........................................................................................................................44 Site 4 .........................................................................................................................44 Site 5 .........................................................................................................................45 Site 6 .........................................................................................................................46
KY Route 461, Pulaski County ............................................................................................... 47
Flexible Pavement Design Section................................................................................... 47
Classification and Engineering Properties of Subgrade ................................................. 48
Bearing Capacity Analyses of Selected Sites ................................................................... 50
Site 1 ......................................................................................................................... 50 Site 2 ......................................................................................................................... 50 Site 3 ......................................................................................................................... 51 Site 4 ......................................................................................................................... 51
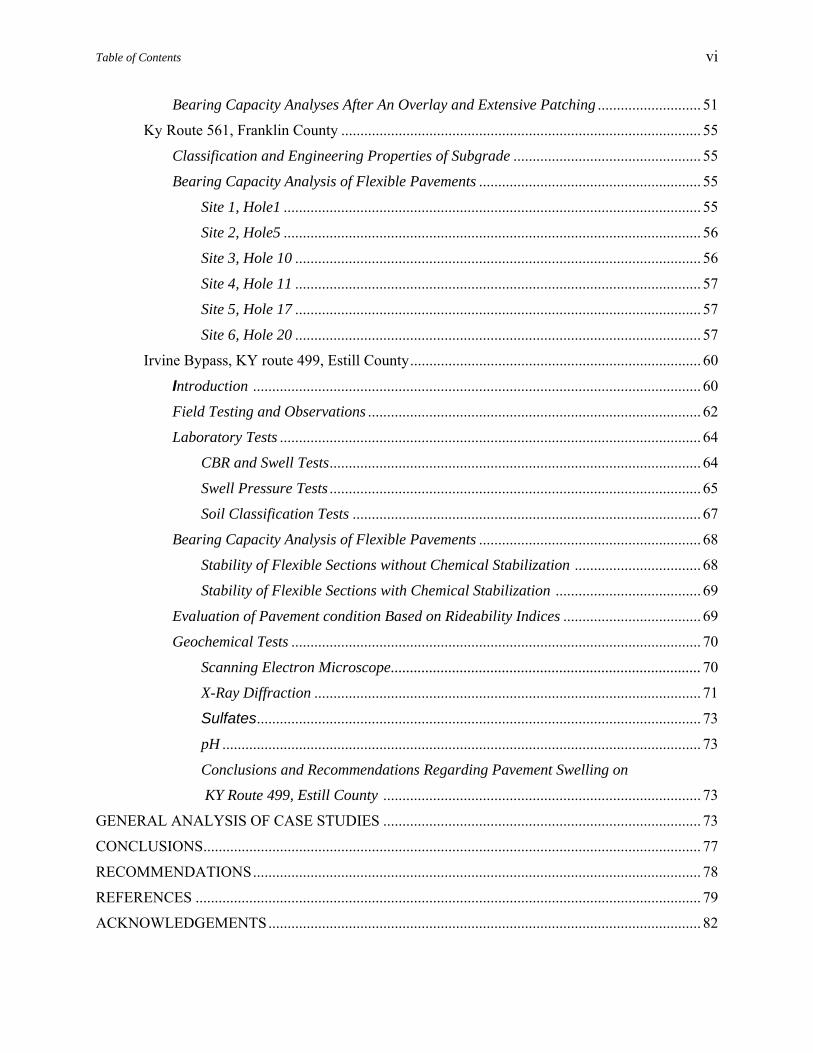
Table of Contents vi
Bearing Capacity Analyses After An Overlay and Extensive Patching ........................... 51
Ky Route 561, Franklin County .............................................................................................. 55
Classification and Engineering Properties of Subgrade ................................................. 55
Bearing Capacity Analysis of Flexible Pavements .......................................................... 55
Site 1, Hole1 ............................................................................................................. 55
Site 2, Hole5 ............................................................................................................. 56
Site 3, Hole 10 .......................................................................................................... 56
Site 4, Hole 11 .......................................................................................................... 57
Site 5, Hole 17 .......................................................................................................... 57
Site 6, Hole 20 .......................................................................................................... 57
Irvine Bypass, KY route 499, Estill County............................................................................ 60
Introduction ..................................................................................................................... 60
Field Testing and Observations ....................................................................................... 62
Laboratory Tests .............................................................................................................. 64
CBR and Swell Tests................................................................................................. 64
Swell Pressure Tests ................................................................................................. 65
Soil Classification Tests ........................................................................................... 67
Bearing Capacity Analysis of Flexible Pavements .......................................................... 68
Stability of Flexible Sections without Chemical Stabilization ................................. 68
Stability of Flexible Sections with Chemical Stabilization ...................................... 69
Evaluation of Pavement condition Based on Rideability Indices .................................... 69
Geochemical Tests ........................................................................................................... 70
Scanning Electron Microscope.................................................................................70
X-Ray Diffraction ..................................................................................................... 71
Sulfates.................................................................................................................... 73
pH ............................................................................................................................. 73
Conclusions and Recommendations Regarding Pavement Swelling on
KY Route 499, Estill County ................................................................................... 73
GENERAL ANALYSIS OF CASE STUDIES ................................................................................... 73
CONCLUSIONS.................................................................................................................................. 77
RECOMMENDATIONS..................................................................................................................... 78
REFERENCES .................................................................................................................................... 79
ACKNOWLEDGEMENTS................................................................................................................. 82

List of Figures vii
LIST OF FIGURES
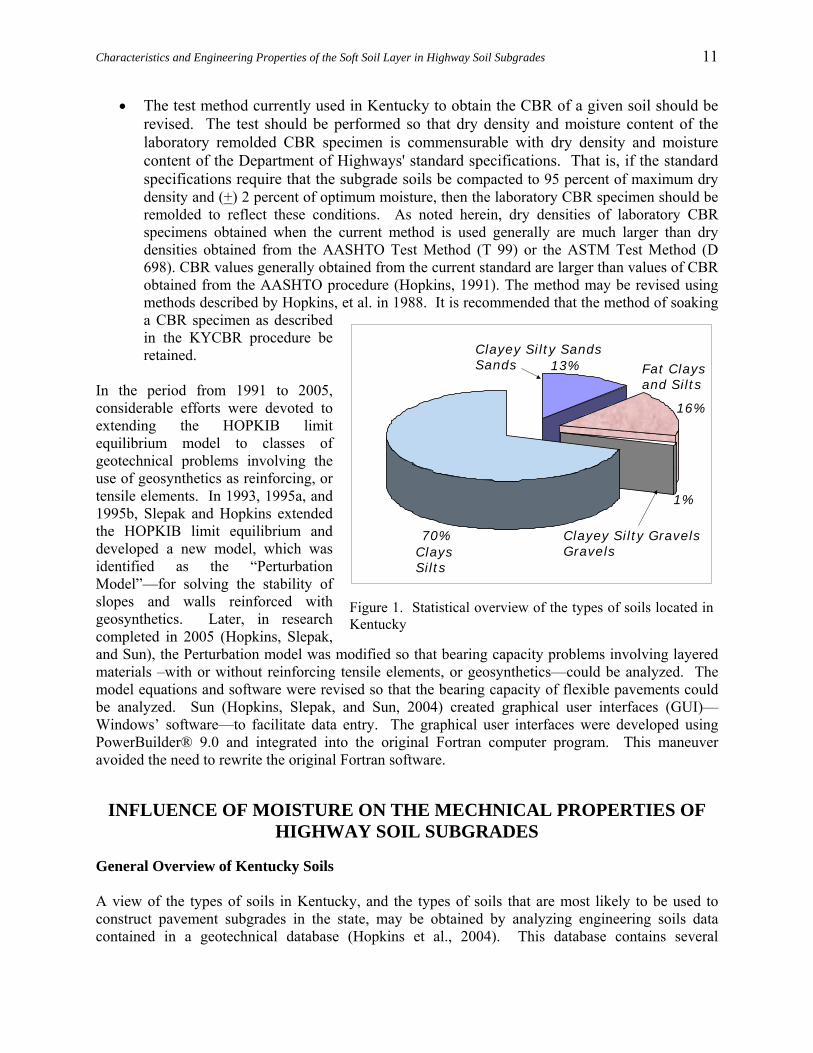
Figure 1. Statistical overview of the types of soils located in Kentucky ............................................ 11
Figure 2. General locations of samples obtained from different physiographical regions of
Kentucky ............................................................................................................................. 12
Figure 3. Angle of internal friction, ,'φ as a function of cohesion, c’ ............................................... 14
Figure 4. Comparison of values of KYCBR in unsoaked and soaked conditions ............................. 16
Figure 5. Comparison of values of AASHTO CBR in unsoaked and soaked conditions.................. 17
Figure 6. Comparison of CBR values of specimens treated chemically, as compacted, and
soaked (untreated,) specimens. .......................................................................................... 17
Figure 7. CBR as function of dry density for a residual clay from Fayette County, Kentucky ........ 18
Figure 8. CBR as a function of moisture content for a residual clay from Fayette County.............. 19
Figure 9. Total pavement thickness obtained from the 1981 Kentucky Flexible Pavement
Design Curves as a function of factor of safety. Example based on an assumed ESAL
value of 3.5 million and values of KYCBR ranging from 1 to 6 .................................... 19
Figure 10. Relationship between AASHTO CBR and the KYCBR .................................................. 20
Figure 11. KYCBR as function of soaking period in days ................................................................ 20
Figure 12. Flexible pavement design thicknesses obtained from the 1981 flexible design curves
for different values of KYCBR. ....................................................................................... 20
Figure 13. Factor of safety against failure obtained from the Hopkins limit equilibrium flexible
pavement model (1991) as a function of KYCBR........................................................... 21
Figure 14. Percentile test value as function of soaked and unsoaked values of KYCBR
(688 clayey specimens) obtained from laboratory tests.................................................... 21
Figure 15. Factor safety as a function of ESAL values at the 85th percentile test value. KYCBR
equals 3.0 and the estimated value of AASHTO CBR is 1.9. Tire contact stress equals
80 psi. ................................................................................................................................ 23
Figure 16. Factor safety as a function of ESAL values at the 85th percentile test value.
KYCBR equals 11.0 and the estimated value of AASHTO CBR is 8.8. Tire contact stress
equals 80 psi...................................................................................................................... 23
Figure 17. Variation of the factor of safety with the value of ESAL and tire contact stress, Tc......... 24
Figure 18. Comparison of in situ CBR data with laboratory soaked and unsoaked CBR data........... 25
Figure 19. Flexible pavement thicknesses for different percentages of asphalt of the total
pavement thickness and assuming a subgrade CBR of 11................................................ 26
Figure 20. Factors of safety based on a subgrade CBR value of 3.0 ................................................ 26

List of Figures viii
Figure 21. Pavement sections based on a design CBR of 3.0. ............................................................ 26
Figure 22. Sections adjusted to the same value of structural number, SN equal 6.25 ........................ 26
Figure 23. Factors of safety of pavement sections obtained for an assumed CBR value of 2.0
and an ESAL value of 3.5 million..................................................................................... 27
Figure 24. Increase in stress at a point in the top of the subgrade due to an applied stress ................. 27
Figure 25. Void ratio of a compacted clayey soil as a function of stress.......................................... 29
Figure 26. Void ratio as a function of stress for soaked and unsoaked, compacted specimens ......... 32
Figure 27. Potential rutting and differential settlements created when a soft layer soil develops
below a flexible pavement ................................................................................................ 32
Figure 28. Void ratio as a function of stress for soaked and unsoaked, compacted specimens ......... 33
Figure 29. Void ratio as a function of stress for soaked and unsoaked, compacted specimens ......... 34
Figure 30. Void ratio as a function of stress for soaked and unsoaked, compacted specimens ......... 34
Figure 31. Void ratio as a function of stress for soaked and unsoaked, compacted specimens ......... 35
Figure 32. Void ratio as a function of stress for soaked and unsoaked, compacted specimens.......... 35
Figure 33. Field testing sequence and sample recovery ..................................................................... 36
Figure 34. Main GUI displaying data for a selected stored stability problem example and a
menu of options for editing the stored data. The screen shown is the “Problem
Control” GUI screen containing drop down boxes (after Hopkins, Slepak,
and Sun, 2000) .................................................................................................................. 37
Figure 35. Study section of Ky 842, which contains an untreated subgrade, begins at
MP 2.5 and ends at MP 4.8 ................................................................................................ 38
Figure 36. Original design alternatives for KY Route 842 ................................................................. 38
Figure 37. Main menu of 1981 flexible pavement design curves (after Southgate et al) and
computer software (after Sun, Hopkins, and Ni, 2004) ..................................................... 39
Figure 38. Computer software for using the 1981 Kentucky flexible pavement design curves ......... 39
Figure 39. Percentile test value as function of CBR for an adjacent roadway section ....................... 40
Figure 40. Percentile test value as function of CBR for an adjacent roadway section ....................... 40
Figure 41. Different pavement thicknesses obtained from the 1981 flexible pavement curves
(after Southgate et al) using different values of CBR....................................................... 40
Figure 42. Revised and observed sections compared to the design alternative sections .................... 41
Figure 43. Void ratio as a function of stress for a specimen obtained at the top
(depth equal 0 to 3 inches) of the subgrade at site 1 .......................................................... 41
Figure 44. Resilient modulus of a specimen of soil from the top of the subgrade of a
section of Ky 842, MP 2.8 to Mp 4.8 –site 1, hole 3 ........................................................ 42

List of Figures ix
Figure 45. Typical graph of the resilient modulus of an unsoaked, compacted clayey specimen ...... 42
Figure 46. Measured thicknesses of asphalt pavement and DGA (Dense Graded
Aggregate), a moisture content profile of the top inches of subgrade, and in situ
value of CBR...................................................................................................................... 43
Figure 47. Measured thicknesses of asphalt pavement and DGA (Dense Graded
Aggregate), a moisture content profile of the top inches of subgrade, and in situ
value of CBR.................................................................................................................... 44
Figure 48. Measured thicknesses of asphalt pavement and DGA (Dense Graded
Aggregate) and in situ value of CBR................................................................................ 44
Figure 49. Measured thicknesses of asphalt pavement and DGA (Dense Graded
Aggregate), a moisture content profile of the top inches of subgrade, and in situ
value of CBR...................................................................................................................... 45
Figure 50. In situ CBR as a function of in place moisture content ..................................................... 45
Figure 51. Measured thicknesses of asphalt pavement and DGA (Dense Graded
Aggregate), a moisture content profile of the top inches of subgrade, and in
situ value of CBR............................................................................................................... 46
Figure 52. Measured thicknesses of asphalt pavement and DGA (Dense Graded
Aggregate), a moisture content profile of the top inches of subgrade, and in
situ value of CBR.............................................................................................................. 46
Figure 53. Factor of safety as a function of in situ CBR, KY Route 842, Boone County .................. 46
Figure 54. Original full-depth design section compared to the overlay and patching sections .......... 47
Figure 55. Original flexible pavement design section for KY Route 461 and a view of water
and red clay from the subgrade that have flowed upward to the surface of the
pavement ........................................................................................................................... 47
Figure 56. Cross sectional view of fabric wrapped panel drains ........................................................ 48
Figure 57. Drilled hole with standing water ...................................................................................... 49
Figure 58. View of headwall and “Bleeder” drain installed by maintenance personnel
of the Kentucky Transportation Cabinet on KY Route 461............................................... 49
Figure 59. Cross section of pavement and a profile of moisture contents in the top of the
subgrade at Site 1 ............................................................................................................... 50
Figure 60. Cross section of pavement and a profile of moisture contents in the top of the
subgrade at Site 2 .............................................................................................................. 51
Figure 61. Cross section of pavement and a profile of moisture contents in the top of the
subgrade at Site 3 .............................................................................................................. 51

List of Figures x
Figure 62. Asphalt core sample completely fell apart during recovery .............................................. 52
Figure 63. Cross section of pavement and a profile of moisture contents in the top of the
subgrade at Site 4 .............................................................................................................. 52
Figure 64. In situ CBR as a function of moisture content.................................................................... 52
Figure 65. Factor of Safety as a function of in situ CBR.................................................................... 52
Figure 66. Comparison of the factor of safety of the original design section and the factor
of safety of the asphalt layer resting on a soil-hydrated lime ............................................ 54
Figure 67. Factors of Safety of the original full-depth flexible pavement section and a hypothetical
design section using 12 inches of soil-hydrated lime subgrade ......................................... 54
Figure 68. A view of KY Route 561 in Franklin County ................................................................... 55
Figure 69. Pavement profile at site 1 and Holes 3 and 1 .................................................................... 56
Figure 70. Conditions at site 2 and hole 5 and 6................................................................................. 57
Figure 71. Conditions at site 3 and holes 8, 9, and 10 ........................................................................ 58
Figure 72. View of pavement conditions at site 4 and Holes 11 and 14............................................. 58
Figure 73. Conditions at site 5 and Holes 15, 16, and 17 ................................................................... 58
Figure 74. Conditions at site 6 and holes 18, 19, and 20 ..................................................................... 58
Figure 75. In situ CBR as a function of the moisture content at the top of the subgrade .................. 59
Figure 76. Factor of safety as a function of in situ CBR ..................................................................... 59
Figure 77. Site Map (from Kentucky Transportation Cabinet Division of Planning Interactive
Mapping Web Site) ........................................................................................................... 60
Figure 78. CBR Values from Geotechnical Report ............................................................................. 61
Figure 79. Percentile Test Value as a Function of CBR Values from the Geotechnical Report ........ 61
Figure 80. Photographs of Observed Swell ........................................................................................ 62
Figure 81. Pavement sections and in place CBR values and moisture contents ................................. 63
Figure 82. Photograph of phenolphthalein indicator applied to hydrated lime stabilized soil ........... 64
Figure 83. Swell versus time, KY CBR test samples.......................................................................... 65
Figure 84. Swell (in percent) as a function of the logarithm of time .................................................. 65
Figure 85. Photograph of swell pressure apparatus, before and during soaking................................. 66
Figure 86. Schematic of swell pressure apparatus .............................................................................. 66
Figure 87. Swell pressure as function of time..................................................................................... 67
Figure 88. In situ and laboratory CBR as a function of moisture contents of Crab Orchard shale .... 68
Figure 89. Factor of safety as a function of in situ and lab values of CBR ........................................ 68
Figure 90. Pavement sections, In Situ CBR values, and corresponding moisture contents ................ 69
Figure 91. Factor of safety as a function of the percentile test value................................................ 69
List of Figures xi
Figure 92. Factors of safety of the flexible pavements constructed on soil and soil-shale subgrades
treated chemically with hydrated lime .............................................................................. 70
Figure 93. Rideability Index as a function of the average annual daily traffic and
condition of pavement....................................................................................................... 70
Figure 94. Rideability index data for the roadway section ................................................................. 70
Figure 95. Rideability Index as a function of years after construction ............................................... 71
Figure 96. Results from scanning electron microscope tests .............................................................. 71
Figure 97. Results from X-Ray diffraction tests of specimen obtained below soil-hydrated
lime stabilized layer .......................................................................................................... 72
Figure 98. Results from X-Ray diffraction tests, compacted lime stabilized .................................... 73
Figure 99. Amount of Sulfates detected in the hydrated lime stabilized and shale only subgrades ... 74
Figure 100. Factors of safety as a function of in situ CBR values measured at the tops of
subgrades at the four study highway sections................................................................. 75
Figure 101. Factors of safety as a function of in situ CBR values measured at the tops of
subgrades at the four study highway sections................................................................. 75
Figure 102. Percentile test value as a function of the factor of safety obtained from the Perturbation
limit equilibrium method ................................................................................................ 76


List of Tables
xiii
LIST OF TABLES
Table 1. Listing of test methods.......................................................................................................... 13
Table 2. Engineering properties of bulk soil samples ......................................................................... 15
Table 3. Effect of moisture on CBR, pavement stability, and factor of safety ................................... 22
Table 4. Comparison of the estimated preconsolidation pressures of soaked and unsoaked compacted
Specimens ........................................................................................................................... 33
Table 5. Index and classification data, KY 461, Pulaski County........................................................ 50
Table 6. Summary of subgrade bearing strengths, pavement thicknesses and factors of safety
against failure for four sites on KY 461, Pulaski County ..................................................... 53
Table 7. Summary of index properties of subgrade soils of KY route 561 ........................................ 55
Table 8. Summary of subgrade bearing strengths, pavement thicknesses and factors of
safety against failure for four sites on KY Route 561, Franklin county .............................. 59
Table 9. Soil classification test results ................................................................................................ 67
Table 10. Comparison of In situ (field) and laboratory CBR values at the 85th
percentile test value ........................................................................................................... 76


Executive Summary
xv
EXECUTIVE SUMMARY Most pavements in Kentucky are constructed on compacted fine-grained, clays, silty clays, and silts, which have poor engineering properties. Some 85 percent of soils used in subgrades in Kentucky consist of clays and silts. The majority of highway subgrades are constructed with clays. Mechanical compaction is the most commonly used technique to stabilize soil subgrades. When first compacted, clayey soils usually have sizeable bearing strengths. CBR (California Bearing Ratio) strengths of soil subgrades immediately after compaction, typically, range from 10 to 40. However, shortly after the pavement is placed and the clayey subgrade is exposed to moisture, CBR strengths decrease to a range of about 1 to 5. Obviously, the loss of bearing strength of the soil subgrade affects pavement performance. A major problem that affects pavement performance is a decrease in bearing strength of the top portion of clayey subgrades. Although aggregate bases can drain water from the pavement during wet seasons, water flowing outward also drains downward into the top of the subgrade. During those periods, the tops of clayey subgrades absorb water, swell, decrease in dry density, increase in moisture content, and loss strength. With a loss of strength the pavement structure is weakened. The objective of this research was to examine the conditions and characteristics of soil subgrades that had been stabilized using only mechanical compaction. Significant findings and conclusions of this study are as follows:
• A soft layer of soil frequently develops at the top of untreated, highway soil subgrades. This situation develops because compacted clayey soils absorb moisture and swell. As swelling occurs, the unit weight of the compacted clayey soil decreases and bearing, or shear strength, decreases. The loss in strength is irreversible. On the basis of percentile test value, moisture contents measured at the very top of untreated subgrades were some 3-4 percent larger than moisture contents measured at points below the tops of the subgrades.
• There was direct correlation between in situ CBR and the moisture content of the soil (untreated) subgrade. As the moisture content of the soil subgrade increases, the value of in situ CBR decreases. This loss of strength during, or after paving, directly affects pavement stability, as demonstrated by results obtained from a bearing capacity model developed by the authors. Analysis using this mathematical model (referred to as the Perturbation limit equilibrium model) showed that when the in situ value of CBR decreased to about 3, or smaller, flexible pavements generally became unstable. However, when the insitu CBR was about 6, or greater, the flexible pavements were in fairly good condition and were generally stable. The factor of safety obtained from the limit equilibrium analysis was equal to 1.5.
• In situ CBR values measured in the field were significantly smaller than CBR strengths of laboratory compacted soil specimens that had been tested in the soaked and unsoaked state. The Kentucky CBR procedure generally yields CBR values that are larger than in situ CBR values measured in the field.
• Mechanical compaction generally creates, initially, large values of preconsolidation pressure of clayey soils. However, exposure to saturation significantly reduces the preconsolidation pressure of a compacted soil, as demonstrated by laboratory consolidation tests. This process is not reversal. With a decrease in preconsolidation pressure due to the absorption of water and swelling, a compacted soil subgrade is more prone to differential deflection, or compression under wheel loadings. Consequently, pavements resting on soften subgades are subject to larger deflections and potential cracking than subgrade soils that retain their original preconsolidation pressures.
• Based on this study, as well as past studies, the minimum value of CBR required to construct a flexible pavement should generally be equal to about 6. Construction of a flexible pavement becomes difficult when the in situ value of CBR decreases below 6.
• Small values of factor of safety are obtained for certain combinations of thickness (obtained from the 1981 Kentucky Flexible Pavement Curves) and ESAL when the subgrade CBR is less than six.

Executive Summary
xvi
Based on a limited number of cases analyzed in this report, certain design thicknesses may be obtained from the design curves that may be unstable during construction or after construction when the in situ CBR value falls below 3.
The following recommendations and comments are offered, as follows:
• Chemical admixtures should be considered as the first choice for stabilizing permanently highway soil subgrades in Kentucky. Chemical admixture stabilization is the most effective means of maintaining large CBR values (greater than 24 at the 85th percentile test value) during construction and throughout the life of the pavement. In comparison, the in situ CBR value of untreated subgrades at the 85th percentile test value in this study was only 2.
• The soft zone of material at the top of soil subgrades does not develop when chemical stabilization is used. Chemical admixtures that have been used successfully in Kentucky and retain large values of long-term CBR strengths include Portland cement, hydrated lime, and lime kiln dust.
• The concept of using “Full Depth Asphalt Pavement” placed directly on untreated soil subgrades should not be used. However, this concept appears workable, based on the performance of one site observed in a previous research study, when the full depth pavement design is constructed on a chemically stabilized subgrade.
• The test method, KM–64-501-95 currently used in Kentucky to determine CBR of a given type of soil should be revised. The test should be performed so that dry density and moisture content of the laboratory remolded CBR specimen is commensurable with dry density and moisture content of the Kentucky Transportation Cabinet’s Highways' standard specifications. That is, if the standard specifications require that the subgrade soils be compacted to a minimum value of 95 percent of maximum dry density and (+) 2 percent of optimum moisture, then the laboratory CBR specimen should be remolded to reflect those specification conditions.
• A thorough analysis of the 1981 Flexible Pavement Design Curves and the AASHTO Flexible pavement design curves using the Perturbation limit equilibrium method is recommended. The purpose of this analysis is an effort to identify flexible pavement thickness designs that may be unstable, or those that have very low values of factors of safety. Those analyses could help identify flexible pavement designs that potentially may fail during or after construction.
• The Kentucky Transportation Cabinet1 has indicated that the curing time for chemical stabilized soil subgrades has been revised to three days from 7 days. It is suggested that further study be undertaken to document the change and offer any other suggestions on the curing time for chemical stabilized soil subgrades. As a minimum, selected projects should be added to the long term monitoring program to validate the impact of the reduced curing time.
• The Kentucky Transportation Cabinet has indicated that they have also used subgrade stabilization techniques consisting of wrapping No. 2 stone (also No. 3's and No. 23's) with geotextile fabric as a means of mitigating the soft soil layer problem. While not a part of this specific study, forensic investigations by University of Kentucky Transportation Center staff on other projects2, have discovered that fines continue to migrate into the fabric wrapped stone matrix. The problems noted to date have been on PCC pavements and investigations continue to see if the same problem is occurring on flexible pavements. It would appear that further study is warranted on the technique of wrapping stone with geotextile materials in order to determine the effectiveness of this approach and to offer future recommendations for improvements.
1 Private communication with Bill Broyles, Branch Manager of the Geotechnical Section, Division of Structural Design, Kentucky Transportation Cabinet, notes that they have reduced the specified curing time from seven to three days. 2 Private communication with David Allen and Clark Graves, research engineers of the Pavement Section of the University of Kentucky Transportation Center, regarding observations during forensic studies.

INTRODUCTION Past research studies that have focused on soil subgrades have frequently shown the presence of a “soft layer” of soil located at the top of the subgrade and situated directly below the aggregate base (Hopkins et al, 1985, 1986a,b, 1987, 1988, 1991, 1994, 1994a,b,c,d, 1995, 2002, and 2005). For instance, in a recently completed study (Hopkins et al, 2002) of many highway sites, moisture contents near the surface of the soil subgrades were consistently greater, by some 3 percent, than the moisture contents measured at some depth below the surface of the subgrade. Data demonstrated that a soft, weak layer of material is frequently present near the surface of soil subgrades. The presence and prevalence of a soft layer of soil located at the top of the soil subgrade has great engineering significance in the design and performance of highway pavements. The presence of such a zone can cause cracking of the pavement and influence future pavement performance. This weak zone of material directly affects the amount of thickness needed to prevent pavement failure.
OBJECTIVES AND SCOPE Major objectives of this research study were to identify and examine the engineering properties and behavior of the “soft layer’ of material that has frequently been observed at the top of highway pavement soil subgrades. This study is intended to determine the general occurrence of this weak layer of material in pavement subgrades. The study focuses on determining the causes and engineering properties of the weak layer at numerous sites. Alternative methods of preventing, or mitigating, the development of the soft layer discussed. The means of minimizing the effects of this soft zone of soil on pavement performance is examined. What needs to be known is how prevalent and the general depth of this layer of soft soil. Since strength of the subgrade determines the thickness of a pavement, the presence of this zone of weak soil greatly influences the performance, service life, future maintenance requirements and costs of the pavement. Findings of this study could lead to great economical benefits to the Cabinet and provide new improved methods of designing pavements and soil subgrades. In the first part of the study, the effects of moisture on the mechanical properties of compacted clayey soils commonly used in Kentucky to construct highway subgrades are examined. CBR tests and consolidation tests are performed on unsoaked and soaked, compacted specimens. These compacted states represent the condition that is encountered when a subgrade is initially compacted and the condition of the subgrade after paving and exposure to moisture. In situ CBR test values obtained in this study and in situ CBR tests obtained from past studies are combined and compared to laboratory CBR values of soaked and unsoaked compacted specimens. To examine the effects of moisture on deformation characteristics of compacted soil subgrades, consolidation tests were performed on unsoaked and soaked compacted specimens. Preconsolidation pressures obtained from the soaked and unsoaked compacted specimens are compared. In the second portion of the study, and to gain a better understanding of the development and effect of the soft layer in the top of the soil subgrade, four flexible pavement highway sections were selected for detailed study. Several holes were cored and in situ CBR tests were performed on the tops of the subgrades. A moisture-depth profile of the top portion of the soil subgrade was developed for each cored location. Finally, using the measured thicknesses of flexible pavement and aggregate bases, bearing capacity analysis was performed for each coring location to determine the factor of safety against failure. The bearing capacity models used in the analyses are based on limit equilibrium and ultimate strengths (Hopkins, 1991, and Slepak and Hopkins 1993, 1995a,b). Factors of safety at each core location are compared to the general state of the pavement at that location.
Characteristics and Engineering Properties of the Soft Soil Layer in Highway Soil Subgrades
2
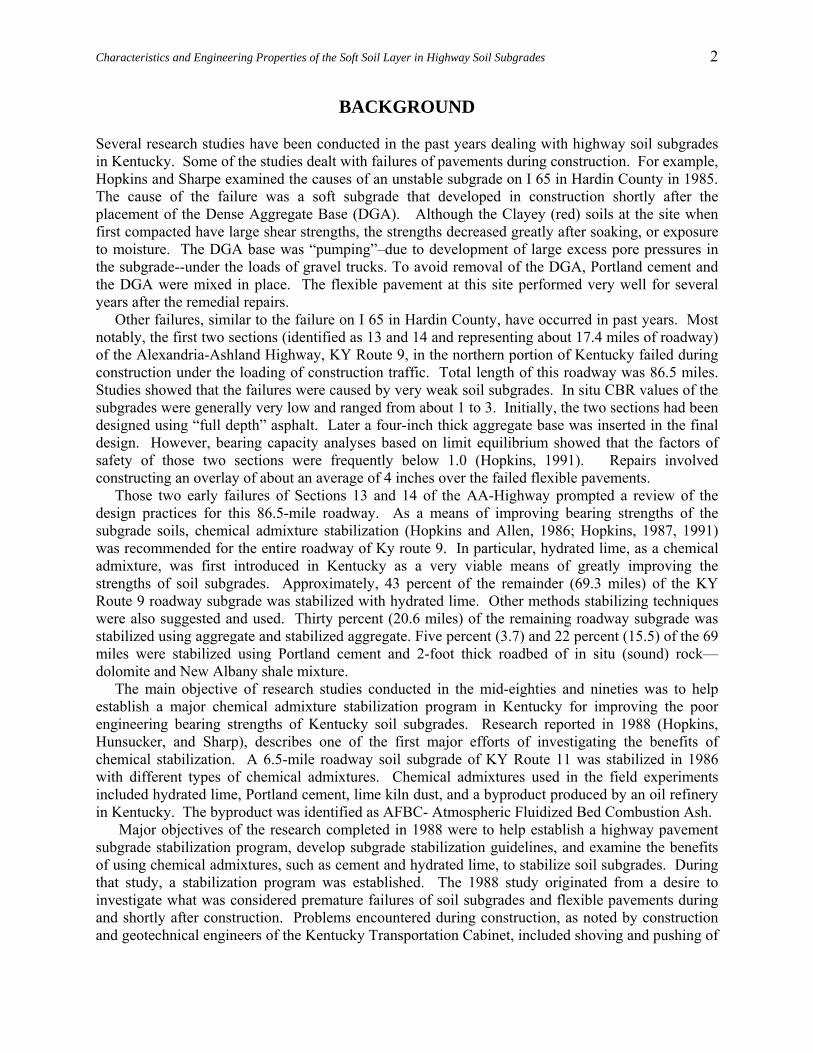
BACKGROUND Several research studies have been conducted in the past years dealing with highway soil subgrades in Kentucky. Some of the studies dealt with failures of pavements during construction. For example, Hopkins and Sharpe examined the causes of an unstable subgrade on I 65 in Hardin County in 1985. The cause of the failure was a soft subgrade that developed in construction shortly after the placement of the Dense Aggregate Base (DGA). Although the Clayey (red) soils at the site when first compacted have large shear strengths, the strengths decreased greatly after soaking, or exposure to moisture. The DGA base was “pumping”–due to development of large excess pore pressures in the subgrade--under the loads of gravel trucks. To avoid removal of the DGA, Portland cement and the DGA were mixed in place. The flexible pavement at this site performed very well for several years after the remedial repairs. Other failures, similar to the failure on I 65 in Hardin County, have occurred in past years. Most notably, the first two sections (identified as 13 and 14 and representing about 17.4 miles of roadway) of the Alexandria-Ashland Highway, KY Route 9, in the northern portion of Kentucky failed during construction under the loading of construction traffic. Total length of this roadway was 86.5 miles. Studies showed that the failures were caused by very weak soil subgrades. In situ CBR values of the subgrades were generally very low and ranged from about 1 to 3. Initially, the two sections had been designed using “full depth” asphalt. Later a four-inch thick aggregate base was inserted in the final design. However, bearing capacity analyses based on limit equilibrium showed that the factors of safety of those two sections were frequently below 1.0 (Hopkins, 1991). Repairs involved constructing an overlay of about an average of 4 inches over the failed flexible pavements. Those two early failures of Sections 13 and 14 of the AA-Highway prompted a review of the design practices for this 86.5-mile roadway. As a means of improving bearing strengths of the subgrade soils, chemical admixture stabilization (Hopkins and Allen, 1986; Hopkins, 1987, 1991) was recommended for the entire roadway of Ky route 9. In particular, hydrated lime, as a chemical admixture, was first introduced in Kentucky as a very viable means of greatly improving the strengths of soil subgrades. Approximately, 43 percent of the remainder (69.3 miles) of the KY Route 9 roadway subgrade was stabilized with hydrated lime. Other methods stabilizing techniques were also suggested and used. Thirty percent (20.6 miles) of the remaining roadway subgrade was stabilized using aggregate and stabilized aggregate. Five percent (3.7) and 22 percent (15.5) of the 69 miles were stabilized using Portland cement and 2-foot thick roadbed of in situ (sound) rock—dolomite and New Albany shale mixture. The main objective of research studies conducted in the mid-eighties and nineties was to help establish a major chemical admixture stabilization program in Kentucky for improving the poor engineering bearing strengths of Kentucky soil subgrades. Research reported in 1988 (Hopkins, Hunsucker, and Sharp), describes one of the first major efforts of investigating the benefits of chemical stabilization. A 6.5-mile roadway soil subgrade of KY Route 11 was stabilized in 1986 with different types of chemical admixtures. Chemical admixtures used in the field experiments included hydrated lime, Portland cement, lime kiln dust, and a byproduct produced by an oil refinery in Kentucky. The byproduct was identified as AFBC- Atmospheric Fluidized Bed Combustion Ash. Major objectives of the research completed in 1988 were to help establish a highway pavement subgrade stabilization program, develop subgrade stabilization guidelines, and examine the benefits of using chemical admixtures, such as cement and hydrated lime, to stabilize soil subgrades. During that study, a stabilization program was established. The 1988 study originated from a desire to investigate what was considered premature failures of soil subgrades and flexible pavements during and shortly after construction. Problems encountered during construction, as noted by construction and geotechnical engineers of the Kentucky Transportation Cabinet, included shoving and pushing of

Characteristics and Engineering Properties of the Soft Soil Layer in Highway Soil Subgrades
3
clayey subgrades under construction traffic loadings, the lack of a firm working subgrade platform for constructing and compacting base and asphalt paving materials, and a loss of subgrade bearing strength during and after construction. To establish and implement a subgrade stabilization policy and program, many issues needed to be considered and resolved. These issues, which were summarized and discussed in the 1988 report, as well as other published papers, included the following:
• Factors that affect and influence the short-and long-term behaviors of untreated pavement subgrades (Hopkins and Beckham, 2002).
• Minimum subgrade strength required to provide good support of construction traffic loadings
and to prevent bearing capacity failures of the subgrade during paving operations (Hopkins, 1991; Hopkins et al, 1994c; Hopkins et al, 1994d).
• Use of laboratory strengths to predict long-term field strength of subgrades.
• Method of selecting design strengths of untreated and treated subgrades (Hopkins et , 994b)
• Types of stabilization methods.
• Method of determining the optimum percentage of a chemical admixture when chemical
stabilization is used (Hopkins and Beckham, 1993).
• Depth of chemical admixture treatment of the soil subgrade required to provide good support of construction traffic loadings and to prevent deep rutting, or failure (Hopkins, 1991).
• Comparison of the long-term strengths of treated subgrades to the long-term strengths of
untreated subgrades Hopkins and Beckham, 2002, 2005)
• Effect of wetting-drying behavior on strengths of untreated and chemically stabilized subgrades.
• Longevities of subgrades treated with hydrated lime and cement (Hopkins and Hunsucker,
1994a; Hopkins and Beckham, 2002)
• Rapid methods for the assessment of the overall bearing strengths of untreated and treated subgrades.
• General performances of flexible pavements constructed on chemically treated subgrades and
the potential for reducing maintenance.
• Cost of chemical admixture stabilization (Hopkins and Beckham, 2002).
• Soil subgrade conditions where hydrated lime and cement should not be used (Hopkins 1991).
Since the mid-eighties chemical admixtures have been used extensively in Kentucky to improve bearing strengths of soil subgrades. Although short-term observations showed that chemical
Characteristics and Engineering Properties of the Soft Soil Layer in Highway Soil Subgrades
4
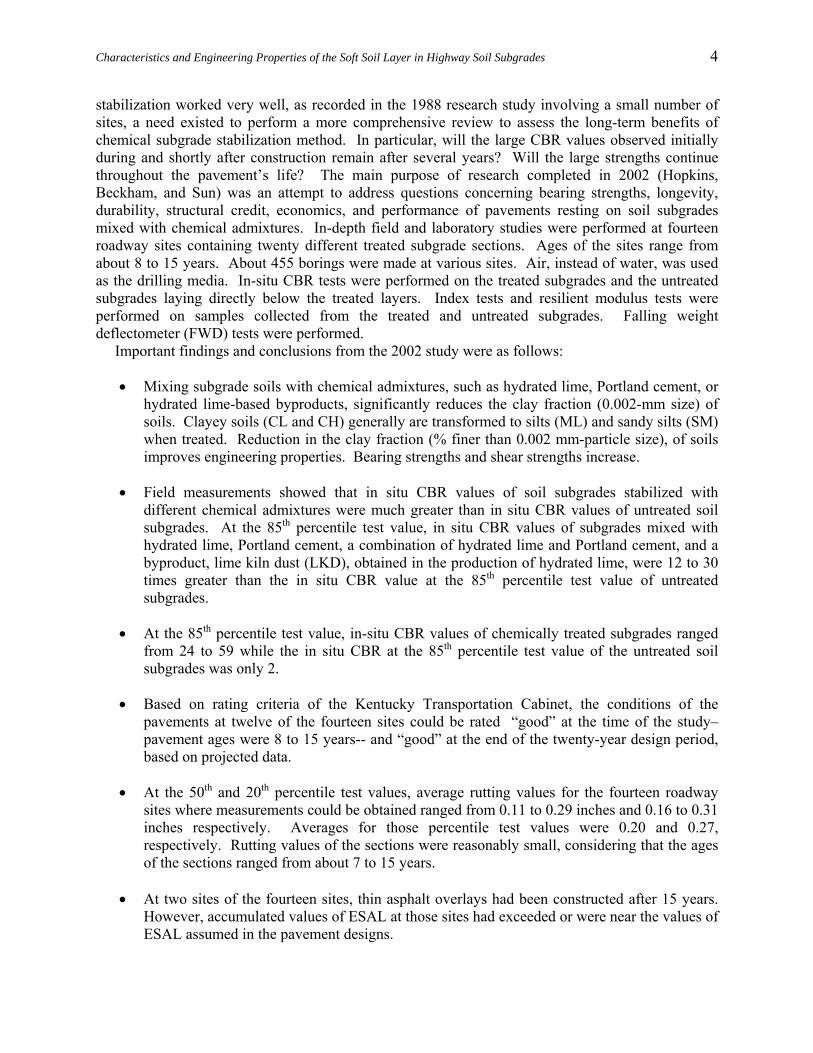
stabilization worked very well, as recorded in the 1988 research study involving a small number of sites, a need existed to perform a more comprehensive review to assess the long-term benefits of chemical subgrade stabilization method. In particular, will the large CBR values observed initially during and shortly after construction remain after several years? Will the large strengths continue throughout the pavement’s life? The main purpose of research completed in 2002 (Hopkins, Beckham, and Sun) was an attempt to address questions concerning bearing strengths, longevity, durability, structural credit, economics, and performance of pavements resting on soil subgrades mixed with chemical admixtures. In-depth field and laboratory studies were performed at fourteen roadway sites containing twenty different treated subgrade sections. Ages of the sites range from about 8 to 15 years. About 455 borings were made at various sites. Air, instead of water, was used as the drilling media. In-situ CBR tests were performed on the treated subgrades and the untreated subgrades laying directly below the treated layers. Index tests and resilient modulus tests were performed on samples collected from the treated and untreated subgrades. Falling weight deflectometer (FWD) tests were performed. Important findings and conclusions from the 2002 study were as follows:
• Mixing subgrade soils with chemical admixtures, such as hydrated lime, Portland cement, or hydrated lime-based byproducts, significantly reduces the clay fraction (0.002-mm size) of soils. Clayey soils (CL and CH) generally are transformed to silts (ML) and sandy silts (SM) when treated. Reduction in the clay fraction (% finer than 0.002 mm-particle size), of soils improves engineering properties. Bearing strengths and shear strengths increase.
• Field measurements showed that in situ CBR values of soil subgrades stabilized with
different chemical admixtures were much greater than in situ CBR values of untreated soil subgrades. At the 85th percentile test value, in situ CBR values of subgrades mixed with hydrated lime, Portland cement, a combination of hydrated lime and Portland cement, and a byproduct, lime kiln dust (LKD), obtained in the production of hydrated lime, were 12 to 30 times greater than the in situ CBR value at the 85th percentile test value of untreated subgrades.
• At the 85th percentile test value, in-situ CBR values of chemically treated subgrades ranged
from 24 to 59 while the in situ CBR at the 85th percentile test value of the untreated soil subgrades was only 2.
• Based on rating criteria of the Kentucky Transportation Cabinet, the conditions of the
pavements at twelve of the fourteen sites could be rated “good” at the time of the study–pavement ages were 8 to 15 years-- and “good” at the end of the twenty-year design period, based on projected data.
• At the 50th and 20th percentile test values, average rutting values for the fourteen roadway
sites where measurements could be obtained ranged from 0.11 to 0.29 inches and 0.16 to 0.31 inches respectively. Averages for those percentile test values were 0.20 and 0.27, respectively. Rutting values of the sections were reasonably small, considering that the ages of the sections ranged from about 7 to 15 years.
• At two sites of the fourteen sites, thin asphalt overlays had been constructed after 15 years.
However, accumulated values of ESAL at those sites had exceeded or were near the values of ESAL assumed in the pavement designs.
Characteristics and Engineering Properties of the Soft Soil Layer in Highway Soil Subgrades
5
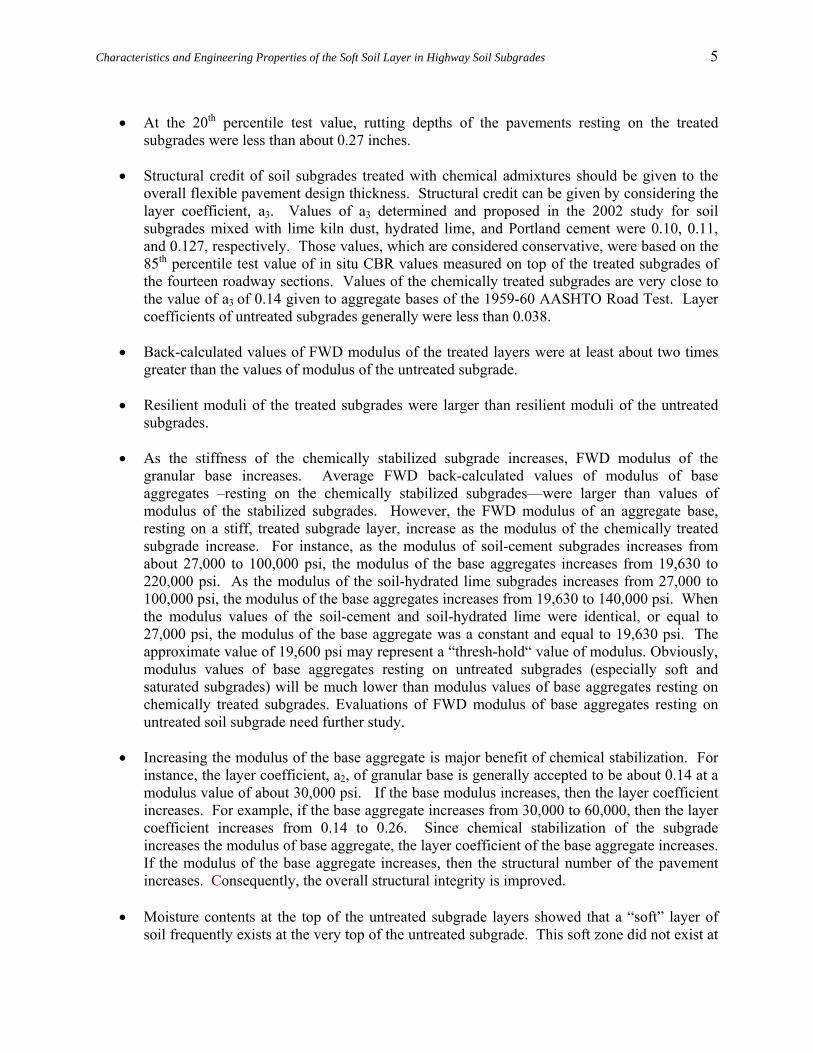
• At the 20th percentile test value, rutting depths of the pavements resting on the treated
subgrades were less than about 0.27 inches.
• Structural credit of soil subgrades treated with chemical admixtures should be given to the overall flexible pavement design thickness. Structural credit can be given by considering the layer coefficient, a3. Values of a3 determined and proposed in the 2002 study for soil subgrades mixed with lime kiln dust, hydrated lime, and Portland cement were 0.10, 0.11, and 0.127, respectively. Those values, which are considered conservative, were based on the 85th percentile test value of in situ CBR values measured on top of the treated subgrades of the fourteen roadway sections. Values of the chemically treated subgrades are very close to the value of a3 of 0.14 given to aggregate bases of the 1959-60 AASHTO Road Test. Layer coefficients of untreated subgrades generally were less than 0.038.
• Back-calculated values of FWD modulus of the treated layers were at least about two times
greater than the values of modulus of the untreated subgrade.
• Resilient moduli of the treated subgrades were larger than resilient moduli of the untreated subgrades.
• As the stiffness of the chemically stabilized subgrade increases, FWD modulus of the
granular base increases. Average FWD back-calculated values of modulus of base aggregates –resting on the chemically stabilized subgrades—were larger than values of modulus of the stabilized subgrades. However, the FWD modulus of an aggregate base, resting on a stiff, treated subgrade layer, increase as the modulus of the chemically treated subgrade increase. For instance, as the modulus of soil-cement subgrades increases from about 27,000 to 100,000 psi, the modulus of the base aggregates increases from 19,630 to 220,000 psi. As the modulus of the soil-hydrated lime subgrades increases from 27,000 to 100,000 psi, the modulus of the base aggregates increases from 19,630 to 140,000 psi. When the modulus values of the soil-cement and soil-hydrated lime were identical, or equal to 27,000 psi, the modulus of the base aggregate was a constant and equal to 19,630 psi. The approximate value of 19,600 psi may represent a “thresh-hold“ value of modulus. Obviously, modulus values of base aggregates resting on untreated subgrades (especially soft and saturated subgrades) will be much lower than modulus values of base aggregates resting on chemically treated subgrades. Evaluations of FWD modulus of base aggregates resting on untreated soil subgrade need further study.
• Increasing the modulus of the base aggregate is major benefit of chemical stabilization. For
instance, the layer coefficient, a2, of granular base is generally accepted to be about 0.14 at a modulus value of about 30,000 psi. If the base modulus increases, then the layer coefficient increases. For example, if the base aggregate increases from 30,000 to 60,000, then the layer coefficient increases from 0.14 to 0.26. Since chemical stabilization of the subgrade increases the modulus of base aggregate, the layer coefficient of the base aggregate increases. If the modulus of the base aggregate increases, then the structural number of the pavement increases. Consequently, the overall structural integrity is improved.
• Moisture contents at the top of the untreated subgrade layers showed that a “soft” layer of
soil frequently exists at the very top of the untreated subgrade. This soft zone did not exist at

Characteristics and Engineering Properties of the Soft Soil Layer in Highway Soil Subgrades
6
the top of chemically treated layers. On the basis of percentile test value, moisture contents measured at the very top of untreated subgrades were some 3-4 percent larger than moisture contents measured at points below the top of the subgrades. This is a significant finding and has major engineering implications. By using chemical subgrade stabilization, the effects of the “ soft zone” on pavements are eliminated, or mitigated, because the soft zone is positioned at a lower level in the subgrade where traffic stresses, and the effects of traffic stresses, are much less. This discovery has significant engineering implications. Future research should focus attention on an in-depth examination of this weak layer of soil.
• Chemical admixture stabilization is a good, durable and economical technique for improving
subgrade strengths. Chemical stabilization represents a very durable and economical means of improving the poor engineering strengths of Kentucky soils. Moreover, the thickness of a pavement resting on a treated subgrade can be thinner than the thickness of a pavement resting on an untreated subgrade. For two pavement sections with equivalent structural numbers, SN, the cost of a pavement section resting on an untreated subgrade is greater than the cost of a pavement resting on a treated subgrade.
• Based on a survey, 26 states of 38 states responding to the survey used chemical admixtures
to improve the bearing strengths of soil subgrades. All respondents noted that chemical stabilization was very beneficial. The most frequently used chemical admixtures were hydrated lime and Portland cement.
Over the past three decades, research has focused on the development of mathematical bearing capacity model based on limit equilibrium and the ultimate strengths of paving materials. The first working model capable of solving bearing capacity problems involving non-circular shear surfaces was developed in 1991 (Hopkins). In the early nineties, a generalized, mathematical bearing capacity model and computer program (Hopkins, 1991) were developed for analyzing the mechanical behavior of pavements. The mathematical model and computer program may be used to analyze the bearing capacity of subgrades and flexible pavements containing multiple layers. The mathematical model is based on limit equilibrium and the theory of plasticity. The model is unique concerning pavement models currently in use since the factor of safety against failure of a flexible pavement consisting of multiple layers of different materials may be calculated. Additionally, the shear strength parameters, φ and c, obtained from triaxial tests are used in the mathematical bearing capacity model to define the shear strength of each layer of a pavement. Both total stress and effective stress analyses may be performed to determine the factor of safety against failure. The mathematical algorithms were programmed for the IBM 3091 computer (mainframe) and the PC® Computer using the FORTRAN Language (referred to as HOPK1). Derivations of the theoretical equations and a full description of the solution of these equations were presented in the 1991 study. A Prandtl-type shear surface is used in the mathematical model to simulate the failure pattern of a pavement under tire loads. The potential failure mass is assumed to consist of a Rankine active wedge, a Prandtl central wedge (logarithmic spiral), and a Rankine passive wedge. A large portion of that study was devoted to establishing credibility of the new pavement bearing capacity model. Important points concerning credibility of the bearing capacity model, were as follows:
• The credibility and reasonableness of solutions obtained from the HOPKIB bearing capacity model and computer program were established by solving three classes of bearing capacity problems. Solutions obtained from the proposed model of these problems were compared to

Characteristics and Engineering Properties of the Soft Soil Layer in Highway Soil Subgrades
7
theoretical and semi-theoretical solutions obtained from other mathematical or empirical models. These classes of problems included:
- subgrade problems involving one homogeneous bearing medium, - pavement construction problems involving two different layers of materials, and - case studies of actual pavement failures that occurred during or after construction that
involved multiple layers of materials.
• Bearing capacity factors, cN and qN , calculated from the HOPKIB model compared very
well with values of cN and qN , obtained from equations developed by Prandtl (1921). The
ratio of cN factors obtained from the proposed model to cN factors proposed by Prandtl ranged from about 96 to 75 percent for φ values ranging from zero to 45 degrees. When values of cN from Prandtl's equation are inserted into the HOPKIB model, factors of safety ranging from about 0.98 to 0.94 were obtained for values of φ ranging from zero to 45 degrees. Similar results were obtained when qN factors obtained from the proposed model
were compared to qN factors obtained from Prandlt's classical bearing capacity equation.
• Values of Nγ , the bearing capacity factor, obtained from the HOPKIB model generally
ranged from 116 to 146 percent higher than values of Nγ proposed by Vesic' (c.f.
Winterhorn and Fang 1975). However, the Nγ values obtained from the proposed model are
in much better agreement with Nγ factors determined from experimental model footing tests
reported by de Beer and Ladanyi and Vesic' than Nγ values proposed by Vesic', Terzaghi, Caquot and Kerisel, Feda, and de Mello.
• Although a pavement may be designed, the issue of whether the pavement may be
constructed has often been ignored. Usually, the subgrade is the weakest structural member of a pavement. Ignoring this fact leads to premature pavement failures and failures during construction. Minimum CBR strengths required to avoid failure during construction were established from the HOPKIB model. At a factor of safety of 1.0 and for a tire contact stress of 68 psi, the minimum CBR strength of the subgrade should be 5.6. At a factor of 1.5, the CBR strength should be 8.3. Therefore, to avoid failure during construction, the minimum CBR strength should be equal to or greater than 5.6 - 8.3. For higher values of tire stresses, minimum CBR strengths may be obtained from relationships presented herein. These conclusions are supported by field data published by Thompson (1988), which showed that CBR strengths should be on the order of 5.3 to 8.5 for tire inflation pressures ranging from 50 to 80 pounds per square inch. These CBR values limit tire sinkage to about 0.25 inches.
• Minimum undrained shear strength, c, or uS , of a soil subgrade required to support
anticipated contact stresses of construction traffic may be obtained from the HOPKIB model. Minimum strengths required to prevent failures, as determined from the HOPKIB model using a tire contact stress of 68 psi, ranges from about 1,662 pounds per square foot (factor of safety equal to 1.0) to 2,527 pounds per square foot (factor of safety equal to 1.5). For other contact stresses, the strengths required to avoid failure may be obtained from relationships presented in the 1991 report.
Characteristics and Engineering Properties of the Soft Soil Layer in Highway Soil Subgrades
8
• A relationship between the undrained shear strength and CBR was developed. The
correlation was developed from theoretical considerations of conditions in the CBR test -- that is, values of undrained shear strength may be calculated from the CBR test and correlated to CBR values. That correlation was verified by comparing this theoretical correlation with a field correlation published by Thompson (1988). Additionally, unconfined compression tests and CBR tests were performed on typical clays; the data were compared to the proposed correlation. Good agreement among the data, obtained in three different manners, was obtained.
• Bearing capacity analyses of two-layered problems were analyzed. The first situation
involved a granular base resting on a clayey subgrade. Comparisons of thicknesses obtained from the HOPKIB model and thicknesses obtained from a method proposed by Vesic' (c.f. Winterhorn and Fang 1975) show that similar results are obtained from the two different approaches for CBR values ranging from one to six. Both approaches show that for very low values of CBR (<3) granular thicknesses must be some 17 to 60 inches to avoid failure under typical construction traffic loadings. The second situation involved construction of a chemically-treated layer on an untreated layer. For subgrade CBR values ranging from one to six, the thickness of the treated layer should be approximately 17-23 inches (CBR = 1) to about seven to 8 inches (CBR = 6), respectively, to withstand typical construction traffic and to prevent undesirable deformations and subgrade shoving and pushing. Thickness of the treated layer should be designed using the methods presented herein. The third situation involves the construction of "full-depth®" asphalt on a soil subgrade. Results of the HOPKIB analysis of this situation emphasize the need to analyze placement temperatures of asphalt lifts and CBR values of the subgrade at the time of construction of the first lift of asphalt pavement to insure safe and stable construction. The analyses show that when the asphalt temperature approaches 140 o F (surface temperature) and when the subgrade CBR is less than six, the factor of safety against failure of the first lift of asphalt pavement is less than or equal to 1.0 -- a failure condition. At a factor of safety of 1.5 and an asphalt pavement temperature of 140 o F, the subgrade CBR must be about nine to insure stable construction.
• Analyses of the 1981 Kentucky flexible pavement design curves were performed using the
newly proposed bearing capacity model. CBR curves ranging from two to 12 were analyzed. Results of the analyses show that for low-bearing soils (CBR equal to two or 3), factors of safety equal to or less than 1.0 were obtained. For example, when the CBR of the subgrade is equal to two and values of ESAL (Equivalent Single Axle Load) range from 103 to t x 105, the factors of safety range from 0.30 to 1.07, respectively, for pavement thicknesses ranging from six to 23 inches. Other low values of factor of safety are obtained for certain combinations of thickness and values of EAL are obtained when the subgrade CBR is less than six. The situation is more critical when the tire contact stress increases from 80 psi to 105 psi. Based on these analyses, certain design thicknesses may be obtained from the design curves that may be unstable if constructed. This situation is not trivial since hundreds of miles of highways in Kentucky exist on soil subgrades that have CBR strengths of two or three.
• An approximate relationship between (weighted) 18-kip equivalent single-axle load
applications (ESAL) and factor of safety obtained from the HOPKIB bearing capacity computer program was established by analyzing several pavement sections of the AASHO Road Test (1962). The slope of this relationship rises sharply up to a factor of safety of about

Characteristics and Engineering Properties of the Soft Soil Layer in Highway Soil Subgrades
9
1.3 (ESAL = one million) and tends to flatten when the ESAL value exceeds one million. At a factor of safety of 1.5 or greater, the value of ESAL generally was eight million or greater. These analyses indicate that flexible pavements should not be designed for a factor of safety below about 1.2 or 1.3 no matter how small the value of ESAL may be.
• In cases where the subgrade CBR value is below about six, slight decreases in the bearing
strength may cause a large decrease in the factor of safety against failure and the life of the pavement. For example, the average CBR strength of the AASHO Roadbed soils (loop 4, lane 1) recorded in the spring of 1960 was 3.6. During the summer of 1957, the CBR strength was 5.7. Based on an analysis using the HOPKIB model, the average factor of safety of loop 4 (lane 1) pavement sections was 1.64 when a CBR value of 5.7 was used for the roadbed. When a CBR value of 3.6 was used in the analyses, the average factor of safety was 1.21 -- a difference of some 27 percent. Based on Equations 262, which relates values of ESAL and factor of safety, the average value of ESAL obtained when the factor of safety (CBR - 3.6) is inserted into this Equation is 295, 262. Using the average factor of safety of 1.65 (CBR - 5.7), the average predicted ESAL value of the sections of loop 4 (lane 1) is 6,728,755 -- some 23 times larger than the average ESAL value when the CBR of the subgrade soils is equal to 3.6. Increasing the strength of the subgrade results in an increase in the factor of safety and extends pavement life.
• Increasing the tire contact stress from 68 psi to 105 psi causes significant decreases in the
values of ESAL that a pavement may sustain. That is, the life of the pavement decreases significantly. Decreasing the tire contact stress from 67.5 psi to 50 psi causes an increase in the values of ESAL and therefore increases significantly the life of pavements.
• For small values of ESAL ( ≈≤ 100,000) and weak soil subgrades, the AASHO Road Test
equation, as developed in the 195-1959 AASHO Road Test, may yield pavement thicknesses that have factors of safety near 1.0 or lower.
• Two case studies involving failures of partially completed flexible pavements were analyzed
extensively using the HOPKIB computer model. Results generally show that the model yields factors of safety near or below 1.0. Moreover, in these cases, the factors of safety of the planned pavement sections were frequently near or below 1.0. The HOPKIB model appears to be a good predictor of the stability of a flexible pavement.
• The principle of effective stress as proposed is Terzaghi (1943) is very useful in
visualizing and explaining the mechanical behavior of soil subgrades and pavements. The proposed mathematical model described herein embraces this very important principle.
• Minimum values of dynamic subgrade modulus of elasticity were established from the
HOPKIB model. At a ground contact stress of 68 psi and for a factor of safety of 1.0, the dynamic elastic modulus is about 11,700 psi. At a factor of safety of 1.5, the dynamic modulus is about 16,679 psi. To avoid failure of the subgrade, the dynamic modulus of elasticity must be equal to or greater than about 12,000 -17,000 psi.
• The dynamic cone penetrometer is a useful and simple means of characterizing the bearing
strengths of newly constructed subgrades. Minimum dynamic cone penetrometer values were established from the HOPKIB model. For a contact tire stress of 68 psi and a factor of safety

Characteristics and Engineering Properties of the Soft Soil Layer in Highway Soil Subgrades
10
equal 1.0, the maximum dynamic cone penetrometer (DCP) value is 41 mm per blow. If the DCP value is greater than 41 mm per blow, then the subgrade is unstable. At a factor of safety of 1.5, the DCP value is 29. To be stable, the DCP value of a soil subgrade should be less than about 29-41 mm per blow. For other contact tire stresses, values of DCP necessary to insure subgrade stability may be obtained from relationships presented herein.
The following recommendations and suggestions were offered in the 1991 research study:
• The concept of designing a pavement should involve more than merely obtaining "the total thickness of the pavement" and the thicknesses of individual layers. The issue of constructability should be addressed during the design phase. For example, the stability of the subgrade subjected to the maximum anticipated construction traffic stresses should be analyzed to avoid failure of the subgrade during construction. Bearing capacity failures during construction build in weakened shear zones that may lead to premature pavement failures after construction. The stability of each lift of pavement (especially during the construction of the first lift of the pavement structure) should be analyzed to insure that each structural lift will not fail and to insure that each structural lift can be adequately compacted (note: This recommendation was partially implemented during this study). The proposed model (HOPKIB) may be used conveniently to analyze the different construction stages. The computer program requires nominal training for others to use.
• When the value of CBR of the subgrade soils is less than six, the subgrade should either be
modified or stabilized to increase its bearing strength (Hopkins 1987-note: this recommendation has been carried out). The CBR value should be increased to a minimum value of about nine to 10, or greater. The thickness of the modified or stabilized layer should be designed. Both the shear strengths (or bearing strengths) of the treated and untreated layers must be considered in the analysis. The HOPKIB computer model can conveniently be used for this design analysis. Construction of "full-depth®" asphalt pavements or granular bases on soil subgrades should not be permitted when the CBR value of the subgrade is less than about nine. Preferably, the soil subgrade CBR should be 9-10, or greater, to avoid failure or serious deformations.
• Flexible pavement thicknesses obtained from the 1981 Kentucky design curves should
receive a critical review when the factor of safety is less than about 1.3 (as determined from the HOPKIB model), or when the subgrade is below a CBR value of six (Hopkins and Slepak, 1998). Consideration should be given to revising the design curves for CBR values below six. To insure the factor of safety of a given pavement design is not below 1.3 or near 1.0, the design should be checked using the model proposed herein.
• Tire contact stresses, or unit stresses of tires, at the AASHO Road Test (1962) averaged
about 68 psi, although different types of loaded vehicles were used in the test. Consideration should be given to studying the tire contact stresses of vehicles currently operating on highways since significant changes may have occurred in the design of tires from 1962 to 1991. These data are needed to assess current design practices and policies and to assess likely damage to a given pavement.
Characteristics and Engineering Properties of the Soft Soil Layer in Highway Soil Subgrades
11
• The test method currently used in Kentucky to obtain the CBR of a given soil should be revised. The test should be performed so that dry density and moisture content of the laboratory remolded CBR specimen is commensurable with dry density and moisture content of the Department of Highways' standard specifications. That is, if the standard specifications require that the subgrade soils be compacted to 95 percent of maximum dry density and (+) 2 percent of optimum moisture, then the laboratory CBR specimen should be remolded to reflect these conditions. As noted herein, dry densities of laboratory CBR specimens obtained when the current method is used generally are much larger than dry densities obtained from the AASHTO Test Method (T 99) or the ASTM Test Method (D 698). CBR values generally obtained from the current standard are larger than values of CBR obtained from the AASHTO procedure (Hopkins, 1991). The method may be revised using methods described by Hopkins, et al. in 1988. It is recommended that the method of soaking a CBR specimen as described in the KYCBR procedure be retained.
In the period from 1991 to 2005, considerable efforts were devoted to extending the HOPKIB limit equilibrium model to classes of geotechnical problems involving the use of geosynthetics as reinforcing, or tensile elements. In 1993, 1995a, and 1995b, Slepak and Hopkins extended the HOPKIB limit equilibrium and developed a new model, which was identified as the “Perturbation Model”—for solving the stability of slopes and walls reinforced with geosynthetics. Later, in research completed in 2005 (Hopkins, Slepak, and Sun), the Perturbation model was modified so that bearing capacity problems involving layered materials –with or without reinforcing tensile elements, or geosynthetics—could be analyzed. The model equations and software were revised so that the bearing capacity of flexible pavements could be analyzed. Sun (Hopkins, Slepak, and Sun, 2004) created graphical user interfaces (GUI)—Windows’ software—to facilitate data entry. The graphical user interfaces were developed using PowerBuilder® 9.0 and integrated into the original Fortran computer program. This maneuver avoided the need to rewrite the original Fortran software.
INFLUENCE OF MOISTURE ON THE MECHNICAL PROPERTIES OF HIGHWAY SOIL SUBGRADES
General Overview of Kentucky Soils A view of the types of soils in Kentucky, and the types of soils that are most likely to be used to construct pavement subgrades in the state, may be obtained by analyzing engineering soils data contained in a geotechnical database (Hopkins et al., 2004). This database contains several
ClaysSilts
70%
13%
1%
16%
Clayey Silty GravelsGravels
Clayey Silty SandsSands Fat Clays
and Silts
Figure 1. Statistical overview of the types of soils located inKentucky
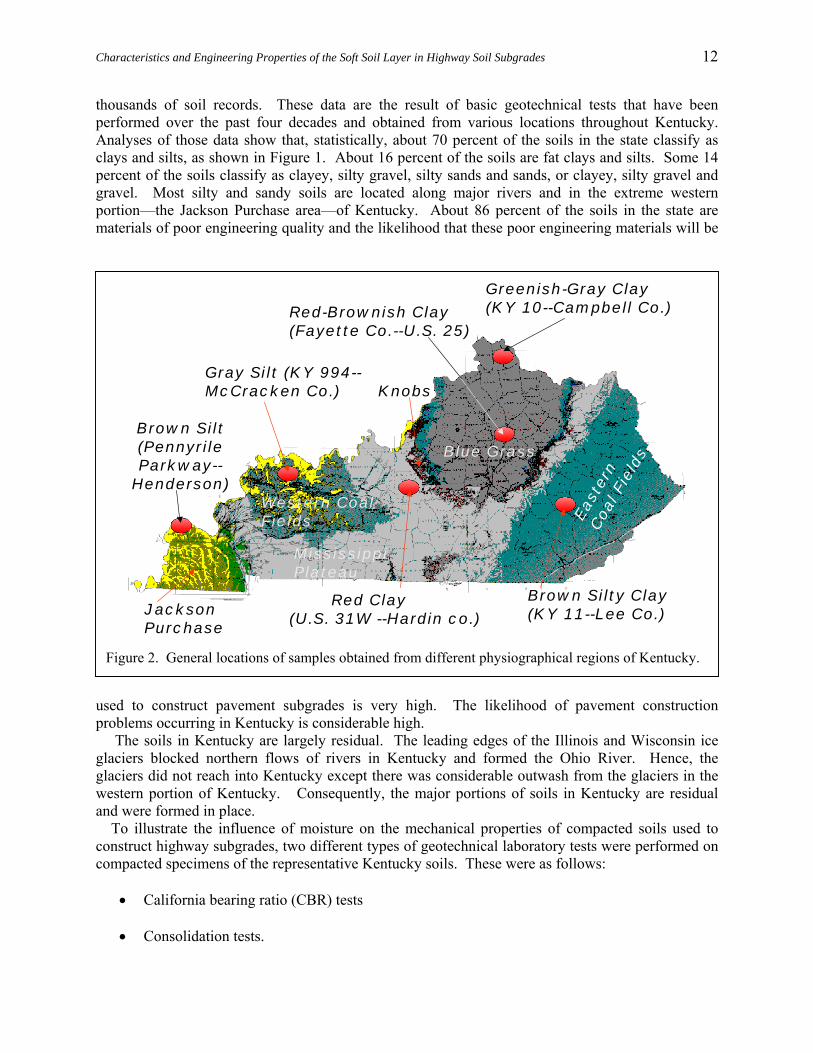
Characteristics and Engineering Properties of the Soft Soil Layer in Highway Soil Subgrades
12
thousands of soil records. These data are the result of basic geotechnical tests that have been performed over the past four decades and obtained from various locations throughout Kentucky. Analyses of those data show that, statistically, about 70 percent of the soils in the state classify as clays and silts, as shown in Figure 1. About 16 percent of the soils are fat clays and silts. Some 14 percent of the soils classify as clayey, silty gravel, silty sands and sands, or clayey, silty gravel and gravel. Most silty and sandy soils are located along major rivers and in the extreme western portion—the Jackson Purchase area—of Kentucky. About 86 percent of the soils in the state are materials of poor engineering quality and the likelihood that these poor engineering materials will be
used to construct pavement subgrades is very high. The likelihood of pavement construction problems occurring in Kentucky is considerable high. The soils in Kentucky are largely residual. The leading edges of the Illinois and Wisconsin ice glaciers blocked northern flows of rivers in Kentucky and formed the Ohio River. Hence, the glaciers did not reach into Kentucky except there was considerable outwash from the glaciers in the western portion of Kentucky. Consequently, the major portions of soils in Kentucky are residual and were formed in place. To illustrate the influence of moisture on the mechanical properties of compacted soils used to construct highway subgrades, two different types of geotechnical laboratory tests were performed on compacted specimens of the representative Kentucky soils. These were as follows:
• California bearing ratio (CBR) tests
• Consolidation tests.
Red-Brownish Clay (Fayette Co.--U.S. 25)
Red Clay
Blue Grass
Eas
tern
Coa
l Fie
lds
Jackson Purchase
Mississippi Plateau
Western Coal Fields
Greenish-Gray Clay (KY 10--Campbell Co.)
Gray Silt (KY 994--McCracken Co.)
Brown Silty Clay (KY 11--Lee Co.)
Brown Silt (Pennyrile Parkway--
Henderson)
Knobs
(U.S. 31W --Hardin co.)
Figure 2. General locations of samples obtained from different physiographical regions of Kentucky.
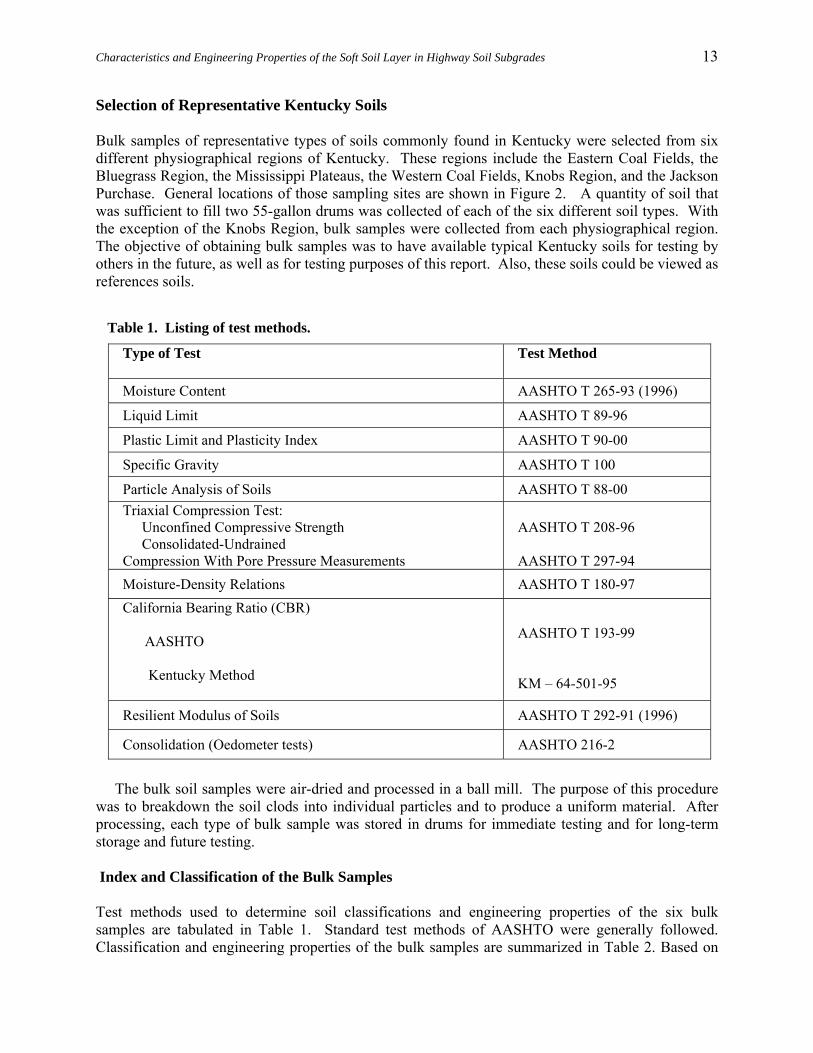
Characteristics and Engineering Properties of the Soft Soil Layer in Highway Soil Subgrades
13
Selection of Representative Kentucky Soils Bulk samples of representative types of soils commonly found in Kentucky were selected from six different physiographical regions of Kentucky. These regions include the Eastern Coal Fields, the Bluegrass Region, the Mississippi Plateaus, the Western Coal Fields, Knobs Region, and the Jackson Purchase. General locations of those sampling sites are shown in Figure 2. A quantity of soil that was sufficient to fill two 55-gallon drums was collected of each of the six different soil types. With the exception of the Knobs Region, bulk samples were collected from each physiographical region. The objective of obtaining bulk samples was to have available typical Kentucky soils for testing by others in the future, as well as for testing purposes of this report. Also, these soils could be viewed as references soils.
The bulk soil samples were air-dried and processed in a ball mill. The purpose of this procedure was to breakdown the soil clods into individual particles and to produce a uniform material. After processing, each type of bulk sample was stored in drums for immediate testing and for long-term storage and future testing. Index and Classification of the Bulk Samples Test methods used to determine soil classifications and engineering properties of the six bulk samples are tabulated in Table 1. Standard test methods of AASHTO were generally followed. Classification and engineering properties of the bulk samples are summarized in Table 2. Based on
Table 1. Listing of test methods.
Type of Test
Test Method
Moisture Content AASHTO T 265-93 (1996)
Liquid Limit AASHTO T 89-96
Plastic Limit and Plasticity Index AASHTO T 90-00
Specific Gravity AASHTO T 100
Particle Analysis of Soils AASHTO T 88-00 Triaxial Compression Test:
Unconfined Compressive Strength Consolidated-Undrained
Compression With Pore Pressure Measurements
AASHTO T 208-96 AASHTO T 297-94
Moisture-Density Relations AASHTO T 180-97 California Bearing Ratio (CBR) AASHTO Kentucky Method
AASHTO T 193-99 KM – 64-501-95
Resilient Modulus of Soils AASHTO T 292-91 (1996)
Consolidation (Oedometer tests) AASHTO 216-2
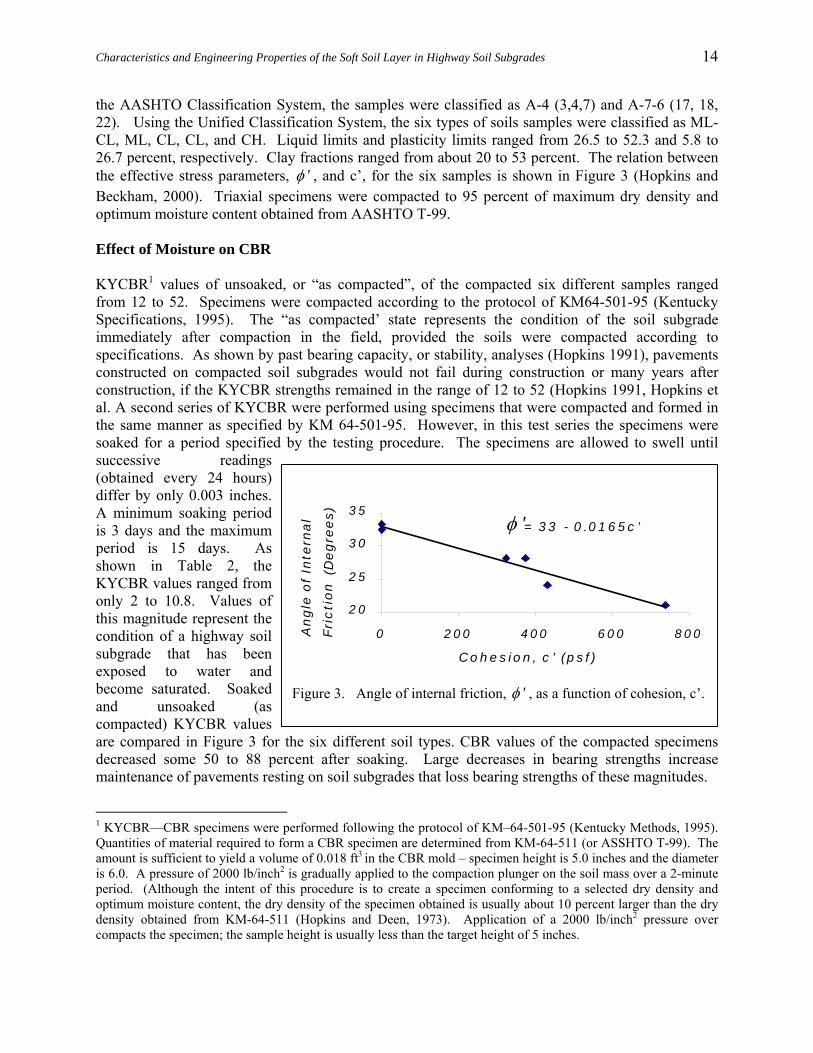
Characteristics and Engineering Properties of the Soft Soil Layer in Highway Soil Subgrades
14
the AASHTO Classification System, the samples were classified as A-4 (3,4,7) and A-7-6 (17, 18, 22). Using the Unified Classification System, the six types of soils samples were classified as ML-CL, ML, CL, CL, and CH. Liquid limits and plasticity limits ranged from 26.5 to 52.3 and 5.8 to 26.7 percent, respectively. Clay fractions ranged from about 20 to 53 percent. The relation between the effective stress parameters, 'φ , and c’, for the six samples is shown in Figure 3 (Hopkins and Beckham, 2000). Triaxial specimens were compacted to 95 percent of maximum dry density and optimum moisture content obtained from AASHTO T-99. Effect of Moisture on CBR KYCBR1 values of unsoaked, or “as compacted”, of the compacted six different samples ranged from 12 to 52. Specimens were compacted according to the protocol of KM64-501-95 (Kentucky Specifications, 1995). The “as compacted’ state represents the condition of the soil subgrade immediately after compaction in the field, provided the soils were compacted according to specifications. As shown by past bearing capacity, or stability, analyses (Hopkins 1991), pavements constructed on compacted soil subgrades would not fail during construction or many years after construction, if the KYCBR strengths remained in the range of 12 to 52 (Hopkins 1991, Hopkins et al. A second series of KYCBR were performed using specimens that were compacted and formed in the same manner as specified by KM 64-501-95. However, in this test series the specimens were soaked for a period specified by the testing procedure. The specimens are allowed to swell until successive readings (obtained every 24 hours) differ by only 0.003 inches. A minimum soaking period is 3 days and the maximum period is 15 days. As shown in Table 2, the KYCBR values ranged from only 2 to 10.8. Values of this magnitude represent the condition of a highway soil subgrade that has been exposed to water and become saturated. Soaked and unsoaked (as compacted) KYCBR values are compared in Figure 3 for the six different soil types. CBR values of the compacted specimens decreased some 50 to 88 percent after soaking. Large decreases in bearing strengths increase maintenance of pavements resting on soil subgrades that loss bearing strengths of these magnitudes.
1 KYCBR—CBR specimens were performed following the protocol of KM–64-501-95 (Kentucky Methods, 1995). Quantities of material required to form a CBR specimen are determined from KM-64-511 (or ASSHTO T-99). The amount is sufficient to yield a volume of 0.018 ft3 in the CBR mold – specimen height is 5.0 inches and the diameter is 6.0. A pressure of 2000 lb/inch2 is gradually applied to the compaction plunger on the soil mass over a 2-minute period. (Although the intent of this procedure is to create a specimen conforming to a selected dry density and optimum moisture content, the dry density of the specimen obtained is usually about 10 percent larger than the dry density obtained from KM-64-511 (Hopkins and Deen, 1973). Application of a 2000 lb/inch2 pressure over compacts the specimen; the sample height is usually less than the target height of 5 inches.
20
25
30
35
0 200 400 600 800
Cohesion, c’ (psf)
An
gle
of
Inte
rnal
Fri
cti
on
(Degre
es)
= 33 - 0.0165c’'φ
20
25
30
35
0 200 400 600 800
20
25
30
35
0 200 400 600 800
Cohesion, c’ (psf)
An
gle
of
Inte
rnal
Fri
cti
on
(Degre
es)
= 33 - 0.0165c’'φ
Figure 3. Angle of internal friction, 'φ , as a function of cohesion, c’.

Characteristics and Engineering Properties of the Soft Soil Layer in Highway Soil Subgrades
15
Table 2. Engineering properties of bulk soil samples
Route Ky 994 Ky 11 Pennyrile Parkway
Ky 10 U.S. 25 U.S.31W
County McCracken
Lee Henderson Campbell Fayette Hardin
Soil Description Gray Silt Brown Silty Clay
Brown Silt Greenish-gray Clay
Red-Brownish Clay
Red Clay
Liquid Limit (%) 26.5 34.4 28.2 41.1 47.7 52.3 Plasticity Index (%) 5.8 7.6 8.5 18.9 19.0 26.7 Specific Gravity 2.64 2.76 2.69 2.76 2.89 2.73 Percent Finer (%): No. 10 sieve No. 200 sieve 0.002mm
98.5 80.3 21.8
90.6 70.1 21.2
100.0 99.4 20.0
95.9 91.4 40.8
96.4 83.7 50.5
95.1 79.7 52.8
Classification: AASHTO Unified
A-4(3)
ML-CL
A-4(4)
ML
A-4(7)
CL
A-7-6(18)
CL
A-7-6(17)
CL
A-7-6(22)
CH
32.4
28.1
33.4
24.1
28.1
21.0
CUw/PP1: Effective Stress Parameter, 'φ (deg.) Effective Stress Parameter, c’ (psf)
0
372.8
0
431.2
324.4
737.3
KYCBR2-as compacted 27.3
12.1 22.1 17.1 51.8 12.3
KYCBR3—soaked according to standard
3.9
3.6 10.8 2.0 6.6 4.6
KYCBR4—soaked until swell ceases
6.9 3.9 8.2 1.9 1.0 5.4
AASHTO5-as compacted
17.9 30.6 12.5 11.6 20.0 11.1
AASHTO3-soaked according to standard
4.2 2.9 9.1 1.6 1.3 1.2
AASHTO4-soaked until swell ceases
7.1 3.1 11.2 0.4 1.2 1.3
AASHTO--5 % Hydrated Lime
21.0 9.6 22.5 30.3
AASHTO—10 % Cement
71.5 18.6
1. Consolidated-undrained triaxial compression tests with pore pressure measurements. Specimens compacted to 95 % of maximum dry density and optimum moisture content obtained from AAHTO T-99. 2. CBR test performed on the “as compacted” Specimen. 3. CBR specimen allowed to soak and swell according to criteria specified by the Ky CBR method and the AASHTO method, T-193-99. 4. CBR specimens allowed to swell until swelling ceased.
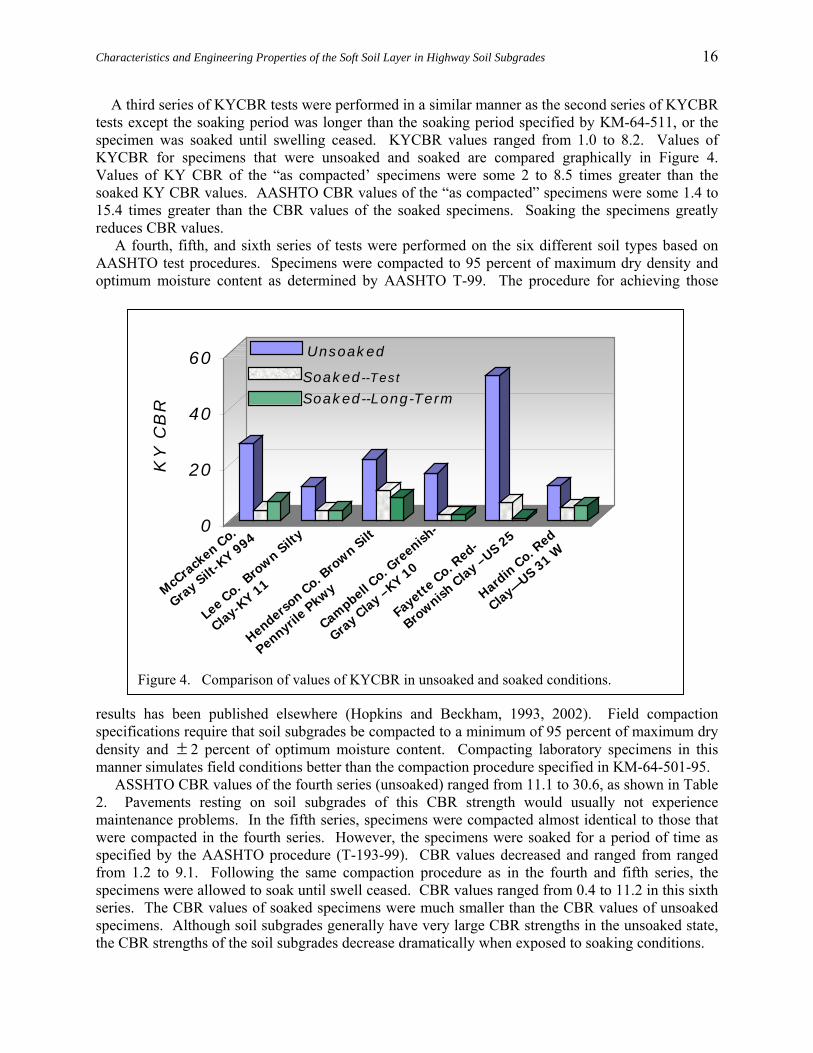
Characteristics and Engineering Properties of the Soft Soil Layer in Highway Soil Subgrades
16
A third series of KYCBR tests were performed in a similar manner as the second series of KYCBR tests except the soaking period was longer than the soaking period specified by KM-64-511, or the specimen was soaked until swelling ceased. KYCBR values ranged from 1.0 to 8.2. Values of KYCBR for specimens that were unsoaked and soaked are compared graphically in Figure 4. Values of KY CBR of the “as compacted’ specimens were some 2 to 8.5 times greater than the soaked KY CBR values. AASHTO CBR values of the “as compacted” specimens were some 1.4 to 15.4 times greater than the CBR values of the soaked specimens. Soaking the specimens greatly reduces CBR values. A fourth, fifth, and sixth series of tests were performed on the six different soil types based on AASHTO test procedures. Specimens were compacted to 95 percent of maximum dry density and optimum moisture content as determined by AASHTO T-99. The procedure for achieving those
results has been published elsewhere (Hopkins and Beckham, 1993, 2002). Field compaction specifications require that soil subgrades be compacted to a minimum of 95 percent of maximum dry density and ± 2 percent of optimum moisture content. Compacting laboratory specimens in this manner simulates field conditions better than the compaction procedure specified in KM-64-501-95. ASSHTO CBR values of the fourth series (unsoaked) ranged from 11.1 to 30.6, as shown in Table 2. Pavements resting on soil subgrades of this CBR strength would usually not experience maintenance problems. In the fifth series, specimens were compacted almost identical to those that were compacted in the fourth series. However, the specimens were soaked for a period of time as specified by the AASHTO procedure (T-193-99). CBR values decreased and ranged from ranged from 1.2 to 9.1. Following the same compaction procedure as in the fourth and fifth series, the specimens were allowed to soak until swell ceased. CBR values ranged from 0.4 to 11.2 in this sixth series. The CBR values of soaked specimens were much smaller than the CBR values of unsoaked specimens. Although soil subgrades generally have very large CBR strengths in the unsoaked state, the CBR strengths of the soil subgrades decrease dramatically when exposed to soaking conditions.
0
20
40
60
KY
CB
R
Unsoaked
Soaked--Test
Soaked--Long-Term
McCra
cken Co.
Gray Silt
-KY 994
Lee Co. B
rown Silt
y
Clay-KY 11
Henderson Co. B
rown Silt
Pennyrile
Pkwy
Campbell Co. G
reenish
-
Gray Clay –KY 10
Fayette
Co. Red-
Brownish
Clay –US 25
Hardin Co. R
ed
Clay—US 31 W
Figure 4. Comparison of values of KYCBR in unsoaked and soaked conditions.
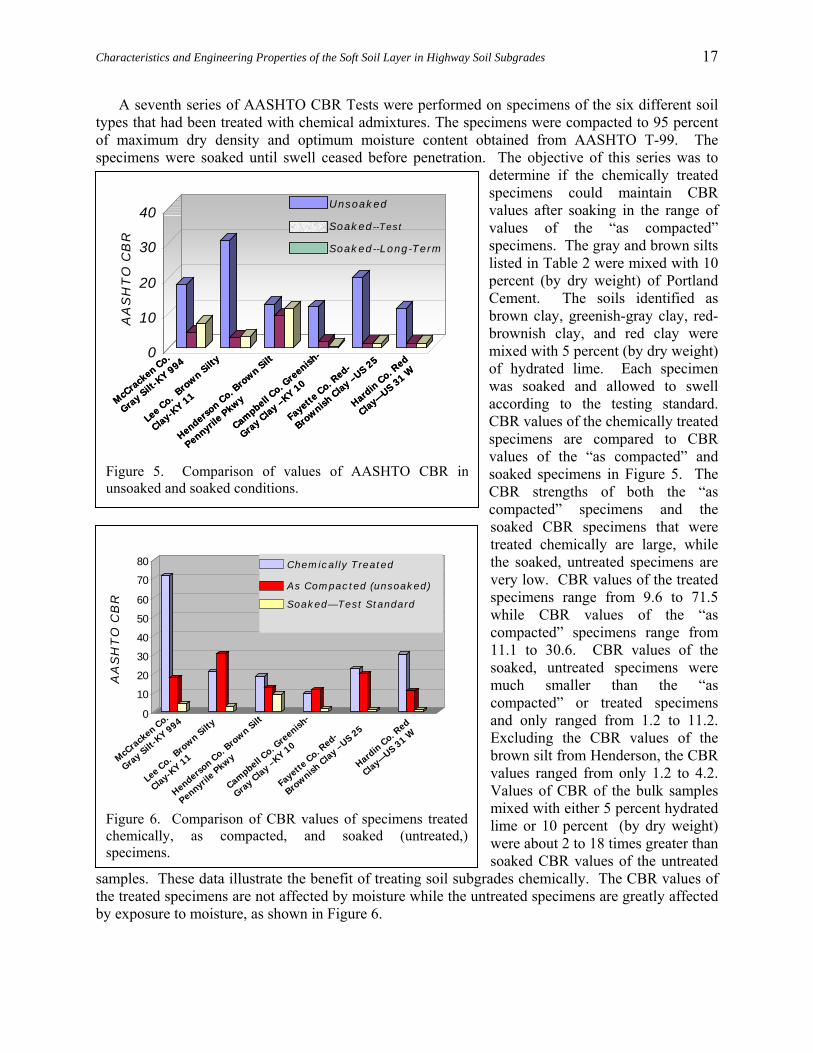
Characteristics and Engineering Properties of the Soft Soil Layer in Highway Soil Subgrades
17
A seventh series of AASHTO CBR Tests were performed on specimens of the six different soil types that had been treated with chemical admixtures. The specimens were compacted to 95 percent of maximum dry density and optimum moisture content obtained from AASHTO T-99. The specimens were soaked until swell ceased before penetration. The objective of this series was to
determine if the chemically treated specimens could maintain CBR values after soaking in the range of values of the “as compacted” specimens. The gray and brown silts listed in Table 2 were mixed with 10 percent (by dry weight) of Portland Cement. The soils identified as brown clay, greenish-gray clay, red-brownish clay, and red clay were mixed with 5 percent (by dry weight) of hydrated lime. Each specimen was soaked and allowed to swell according to the testing standard. CBR values of the chemically treated specimens are compared to CBR values of the “as compacted” and soaked specimens in Figure 5. The CBR strengths of both the “as compacted” specimens and the soaked CBR specimens that were treated chemically are large, while the soaked, untreated specimens are very low. CBR values of the treated specimens range from 9.6 to 71.5 while CBR values of the “as compacted” specimens range from 11.1 to 30.6. CBR values of the soaked, untreated specimens were much smaller than the “as compacted” or treated specimens and only ranged from 1.2 to 11.2. Excluding the CBR values of the brown silt from Henderson, the CBR values ranged from only 1.2 to 4.2. Values of CBR of the bulk samples mixed with either 5 percent hydrated lime or 10 percent (by dry weight) were about 2 to 18 times greater than soaked CBR values of the untreated
samples. These data illustrate the benefit of treating soil subgrades chemically. The CBR values of the treated specimens are not affected by moisture while the untreated specimens are greatly affected by exposure to moisture, as shown in Figure 6.
0
10
20
30
40
AA
SH
TO
CB
R
Unsoaked
Soaked--Test
Soaked--Long-Term
McCra
cken Co.
Gray Silt
-KY 994
Lee Co. B
rown Silt
y
Clay-KY 11
Henderson Co. B
rown Silt
Pennyrile
Pkwy
Campbell Co. G
reenish
-
Gray C
lay –KY 10
Fayette
Co. Red-
Brownish
Clay –US 25
Hardin Co. R
ed
Clay—US 31 W
McCra
cken Co.
Gray Silt
-KY 994
Lee Co. B
rown Silt
y
Clay-KY 11
Henderson Co. B
rown Silt
Pennyrile
Pkwy
Campbell Co. G
reenish
-
Gray C
lay –KY 10
Fayette
Co. Red-
Brownish
Clay –US 25
Hardin Co. R
ed
Clay—US 31 W
Figure 5. Comparison of values of AASHTO CBR inunsoaked and soaked conditions.
0
10
20
30
40
50
60
70
80
AA
SH
TO
CB
R
McCra
cken Co.
Gray Silt
-KY 994
Lee Co. B
rown Silt
y
Clay-KY 11
Henderson Co. B
rown Silt
Pennyrile
Pkwy
Campbell Co. G
reenish
-
Gray C
lay –KY 10
Faye
tte Co. R
ed-
Brownish
Clay –US 25
Hardin Co. R
ed
Clay—US 31 W
As Compacted (unsoaked)
Chemically Treated
Soaked—Test Standard
Figure 6. Comparison of CBR values of specimens treatedchemically, as compacted, and soaked (untreated,)specimens.

Characteristics and Engineering Properties of the Soft Soil Layer in Highway Soil Subgrades
18
Variation of CBR values obtained for soaked and unsoaked compacted specimens of a clay soil from Fayette County with dry density is illustrated in Figure 7. The effect of moisture on the value of CBR for this clay changes greatly with soaking condition, as illustrated in Figure 8. As the specimens absorb water and swell, the dry density decreases and the CBR values decrease. For
example, the KYCBR decreases from a value of 51.8 for the “as compacted” specimen to 6.1 for the specimen soaked according to the standard soaking procedure. If the specimen is soaked until swelling has essentially ceased (a soaking period requiring several weeks), then the CBR decreases to a very low value of 1.0. Moisture of these Kentucky specimens increases from an initial value of 21.2 to 24.7 percent. The moisture content increases to 32.6 percent when the Kentucky specimen is soaked long-term. Similarly, the AASHTO CBR specimens increase from 21.5 to 31.2 and 31.5 percent, respectively. Hence, when the moisture content of the compacted clay increases to a value above a value of about 25 percent and the dry density decreases to values smaller than 97 lbs/ft2, CBR values of the compacted clay become very small. Hence, soaking of the compacted clay in the field would behave in a similar manner. Based on the 1981 Kentucky flexible pavement design curves, assuming an ESAL value of 3.5, assuming that 50 percent of the total design thickness is asphalt, and using a KYCBR value of 6.1 (KYCBR1), the total pavement thickness is 18.4 inches, or total pavement thickness consists of 9.2 inches of asphalt and 9.2 inches of aggregate base. This CBR value corresponds to an undrained shear strength of about 1838 lbs/ft2. The factor of safety of this design is 1.76. Assuming the CBR value decreases to 1.0, the total design thickness obtained from the 1981 curves is about 24.8 inches. However, the factor of safety is less than 0.99—a failure condition. To increase the factor safety of this pavement to 1.5 would require a total thickness of pavement of about 38.5 inches, or 19.3 inches of asphalt and 19.3 inches of aggregate base. Based on these analyses, a low CBR value of less than 1.5 requires a large increase in pavement thickness to maintain reasonable stability. The relationship
CBR vs Dry Density
0
10
20
30
40
50
60
84 86 88 90 92 94 96 98 100 102 104 106 108 110
Dry Density (lbs/ft3)
CB
R (%
)
( as compacted )KYCBR
( as compacted )AASHTO1KYCBR
2KYCBR1AASHTO
2AASHTO
( Stabilized Soaked )AASHTO −
Fayette County Clay
Figure 7. CBR as function of dry density for a residual clay from Fayette County, Kentucky
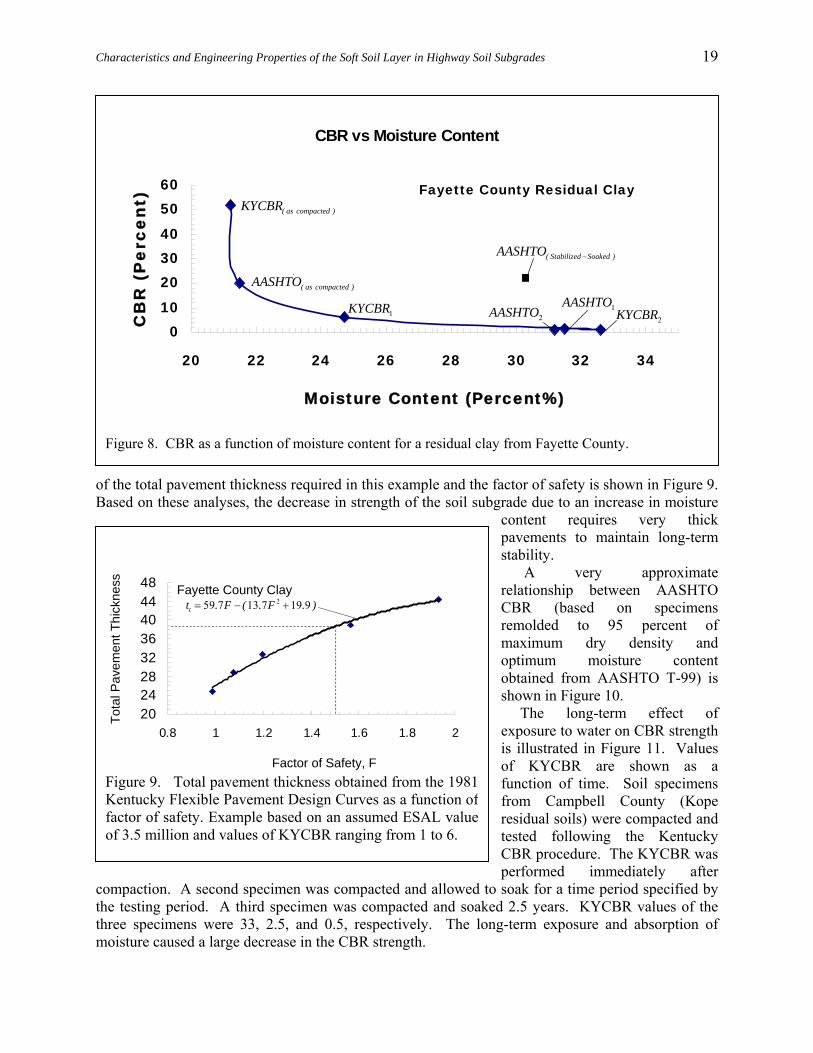
Characteristics and Engineering Properties of the Soft Soil Layer in Highway Soil Subgrades
19
of the total pavement thickness required in this example and the factor of safety is shown in Figure 9. Based on these analyses, the decrease in strength of the soil subgrade due to an increase in moisture
content requires very thick pavements to maintain long-term stability. A very approximate relationship between AASHTO CBR (based on specimens remolded to 95 percent of maximum dry density and optimum moisture content obtained from AASHTO T-99) is shown in Figure 10. The long-term effect of exposure to water on CBR strength is illustrated in Figure 11. Values of KYCBR are shown as a function of time. Soil specimens from Campbell County (Kope residual soils) were compacted and tested following the Kentucky CBR procedure. The KYCBR was performed immediately after
compaction. A second specimen was compacted and allowed to soak for a time period specified by the testing period. A third specimen was compacted and soaked 2.5 years. KYCBR values of the three specimens were 33, 2.5, and 0.5, respectively. The long-term exposure and absorption of moisture caused a large decrease in the CBR strength.
CBR vs Moisture Content
010
203040
5060
20 22 24 26 28 30 32 34
Moisture Content (Percent%)
CB
R (
Pe
rce
nt)
( as compacted )KYCBR
( as compacted )AASHTO
1KYCBR2KYCBR
1AASHTO2AASHTO
( Stabilized Soaked )AASHTO −
Fayette County Residual Clay
Figure 8. CBR as a function of moisture content for a residual clay from Fayette County.
2024283236404448
0.8 1 1.2 1.4 1.6 1.8 2
Tota
l Pav
emen
t Thi
ckne
ss
Factor of Safety, F
259 7 13 7 19 9tt . F ( . F . )= − +Fayette County Clay
Figure 9. Total pavement thickness obtained from the 1981Kentucky Flexible Pavement Design Curves as a function offactor of safety. Example based on an assumed ESAL valueof 3.5 million and values of KYCBR ranging from 1 to 6.

Characteristics and Engineering Properties of the Soft Soil Layer in Highway Soil Subgrades
20
The change in moisture and large decrease in CBR strength of this compacted clay from northern Kentucky greatly affects the stability of flexible pavements and leads to failure. Using the three different values of KYCBR, assuming an ESAL value of 3.5 million, and using the 1981 flexible pavement design curves, thicknesses of the flexible pavements were calculated corresponding to the three different strengths. Assuming that 50 percent of the total design pavement thickness is asphalt concrete, thicknesses obtained from the 1981 Kentucky flexible pavement design curves (Southgate
et al, 1981) are shown in Figure 12. Stability analyses of the pavement sections were performed using the mathematical models developed by Hopkins, 1991, and Slepak and Hopkins, 1993, 1995a,b. Total pavement thickness obtained from the 1981 for CBR values equal to 11, 2.5, and 0.5 were 16, 22, 26 inches, respectively, as shown in Figure 8. Normally the largest KYCBR design curve is 11, the value of 33 was not used in the stability analyses. Rather a lower value of 11 was used1. Using this value and a thickness of 16 inches (8 inches of asphalt and 8 inches of base aggregate), a very large factor of safety of 2.42 was obtained. This condition represents the case if the subgrade remained unsoaked. However, if the compacted subgrade is soaked
according to the soaking period specified by the standard procedure, and using the corresponding CBR value of 2.5, a factor of safety of only 1.23 is obtained – the stability of the flexible pavement is approaching a failure state. Using the KYCBR value (0.5) obtained from the long-term soaking period (2.5 years), the factor of safety was much less than 1.0. At a CBR of 1.0, the factor of safety is only 0.85—a failure condition. The relationship between the factor of safety and (soaked) KYCBR for this clayey soil is shown graphically in Figure 13 and is, as follows,
1 Values of CBR were converted to undrained shear strengths, Su, using the approximate relationship;
0 9792 173 .S . CBRu = (See Hopkins, 1991).
0
2
4
6
8
10
0 1 2 3 4 5 6 7 8 9 10
Kentucky CBR
AA
SHTO
CB
R0 898 0 57AASHTO KYCBR . CBR .= −
Figure 10. Relationship between AASHTOCBR and the KYCBR.
0.1
1
10
100
0 1 10 100 1000
Time (Days)
KY
CB
R
31 70 35 .KYCBR .t
= +
Figure 11. KYCBR as function of soaking period in days
CBR = 11
CBR = 2.5
CBR = 0.5
Asphalt
Aggregate
Base
Soil
Subgrade
8 in.
8 in.
11 in.
11 in.
13 in.
13 in.
F=1.23F=2.42 F=0.85@CBR =1.0
Figure 12. Flexible pavement design thicknessesobtained from the 1981 flexible design curves fordifferent values of KYCBR.
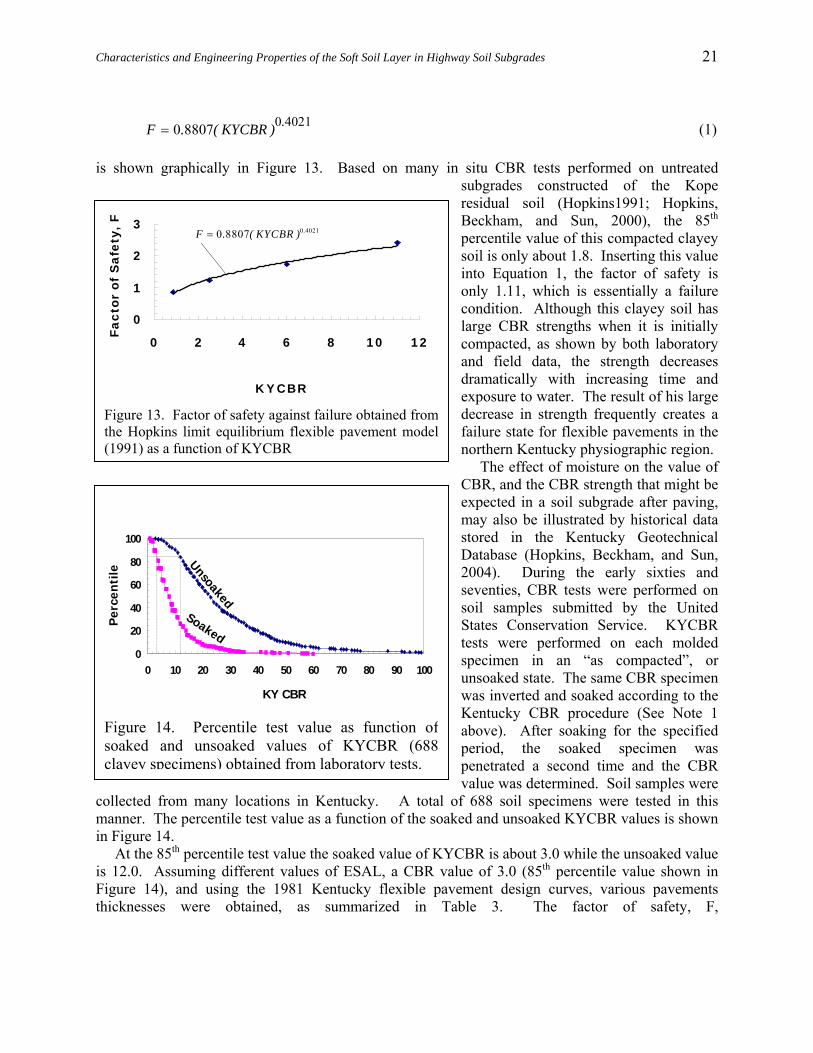
Characteristics and Engineering Properties of the Soft Soil Layer in Highway Soil Subgrades
21
0 40210 8807 .F . ( KYCBR )= (1)
is shown graphically in Figure 13. Based on many in situ CBR tests performed on untreated
subgrades constructed of the Kope residual soil (Hopkins1991; Hopkins, Beckham, and Sun, 2000), the 85th percentile value of this compacted clayey soil is only about 1.8. Inserting this value into Equation 1, the factor of safety is only 1.11, which is essentially a failure condition. Although this clayey soil has large CBR strengths when it is initially compacted, as shown by both laboratory and field data, the strength decreases dramatically with increasing time and exposure to water. The result of his large decrease in strength frequently creates a failure state for flexible pavements in the northern Kentucky physiographic region. The effect of moisture on the value of CBR, and the CBR strength that might be expected in a soil subgrade after paving, may also be illustrated by historical data stored in the Kentucky Geotechnical Database (Hopkins, Beckham, and Sun, 2004). During the early sixties and seventies, CBR tests were performed on soil samples submitted by the United States Conservation Service. KYCBR tests were performed on each molded specimen in an “as compacted”, or unsoaked state. The same CBR specimen was inverted and soaked according to the Kentucky CBR procedure (See Note 1 above). After soaking for the specified period, the soaked specimen was penetrated a second time and the CBR value was determined. Soil samples were
collected from many locations in Kentucky. A total of 688 soil specimens were tested in this manner. The percentile test value as a function of the soaked and unsoaked KYCBR values is shown in Figure 14. At the 85th percentile test value the soaked value of KYCBR is about 3.0 while the unsoaked value is 12.0. Assuming different values of ESAL, a CBR value of 3.0 (85th percentile value shown in Figure 14), and using the 1981 Kentucky flexible pavement design curves, various pavements thicknesses were obtained, as summarized in Table 3. The factor of safety, F,
0
1
2
3
0 2 4 6 8 10 12
Fact
or o
f S
afet
y, F
KYCBR
0 40210 8807 .F . ( KYCBR )=
Figure 13. Factor of safety against failure obtained fromthe Hopkins limit equilibrium flexible pavement model(1991) as a function of KYCBR
0
20
40
60
80
100
0 10 20 30 40 50 60 70 80 90 100
Per
cen
tile
KY CBR
SoakedUnsoaked
Figure 14. Percentile test value as function ofsoaked and unsoaked values of KYCBR (688clayey specimens) obtained from laboratory tests.

Characteristics and Engineering Properties of the Soft Soil Layer in Highway Soil Subgrades
22
Table 3. Effect of moisture on CBR, pavement stability, and factor of safety. Thickness of
Flexible Pavement1
(inches)
Subgrade Strengths Factor of Safety, F, Against Failure5
Undrained Shear Strength
(Soaked Case)4
(psf)
Undrained Shear Strength
(Unsoaked Case)4
(psf)
UnskKYCBRF
UnskAASHTOCBRF
Design ESAL (Mil.)
Asph.
Agg.
Soaked KYCBR2
(%)
Unsoaked KYCBR2
(%)
Estimated AASHTO
Soaked CBR3
(%)
Estimated AASHTO
Soaked CBR3
(%)
From KY
CBR
From AASHTO
CBR
From KY
CBR
From AASHTO
CBR
SkKYCBRF
SkAASHTOCBRF
0.5 8.4 8.4 3.0 11.0 1.9 8.8 568 917 2362 3273 1.09 <<1.0 2.50 2.12 1.0 9.2 9.2 3.0 11.0 1.9 8.8 568 917 2362 3273 1.15 <<1.0 2.62 2.23 2.0 9.8 9.8 3.0 11.0 1.9 8.8 568 917 2362 3273 1.22 0.99 2.75 2.39 3.5 10.6 10.6 3.0 11.0 1.9 8.8 568 917 2362 3273 1.29 1.05 2.89 2.46
10.0 12.0 12.0 3.0 11.0 1.9 8.8 568 917 2362 3273 1.39 1.13 3.18 2.71 30.0 13.4 13.4 3.0 11.0 1.9 8.8 568 917 2362 3273 1.52 1.22 3.53 2.99
1. Thicknesses obtained from the 1981 Kentucky flexible pavement curves (after Southgate, et al) based on an assumed design ESAL value and a value of KYCBR at the 85th percentile test value—see Figure 14. It was assumed in the analyses that 50 percent of the total pavement thickness was asphalt.
2. Soaked and unsoaked values at the 85th percentile test value based on the KYCBR procedure –see footnote page xx on Page 14 and Figure 14. 3. Value of AASHTO CBR estimated from the following relationship:
5 29 3 91CBR . Ln( CBR ) .KYAASHTO = − . Specimens in the AASHTO procedure were compacted at optimum moisture and 95 percent of maximum dry density as determined from AASHTO T-99. 4. Undrained shear strengths estimated from the following relationship:
0 979312 9 .S . ( CBR ) ( psf )u = .
5. Bearing capacity analyses performed using a limit equilibrium method (Hopkins, 1991; Hopkins, Slepak, and Sun 2000). Dual- wheel tires with a stress of
80 psi was assumed in the analyses.
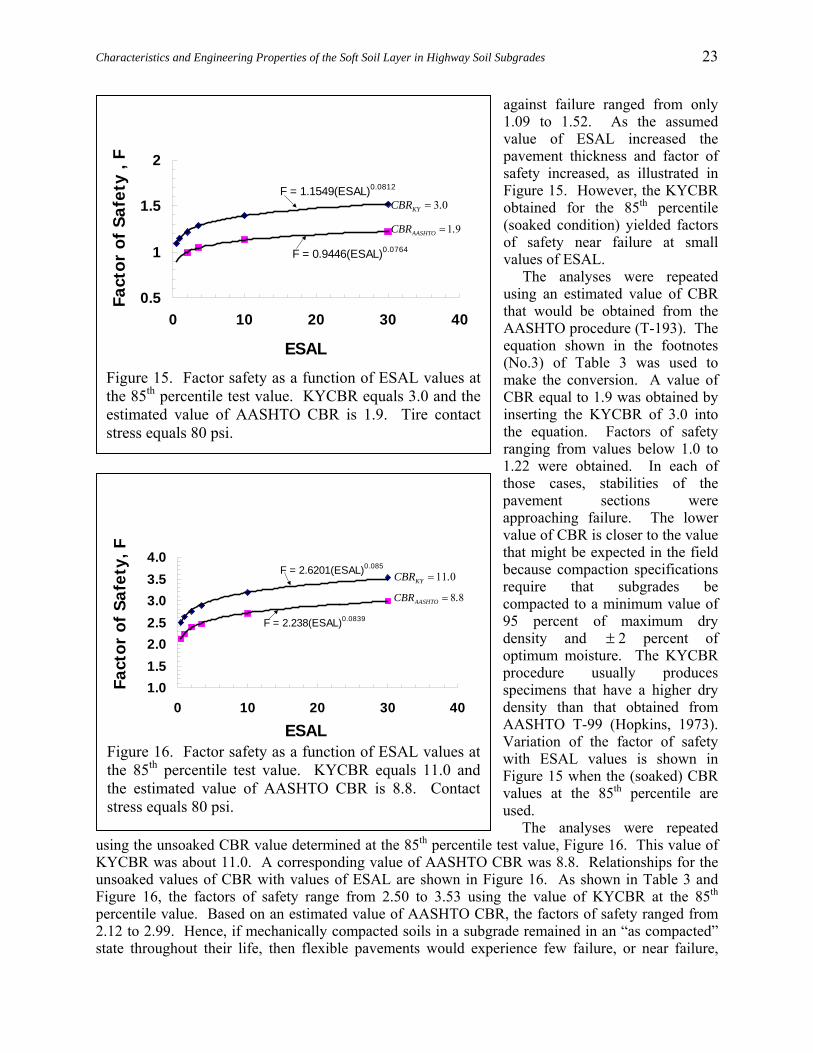
Characteristics and Engineering Properties of the Soft Soil Layer in Highway Soil Subgrades
23
against failure ranged from only 1.09 to 1.52. As the assumed value of ESAL increased the pavement thickness and factor of safety increased, as illustrated in Figure 15. However, the KYCBR obtained for the 85th percentile (soaked condition) yielded factors of safety near failure at small values of ESAL. The analyses were repeated using an estimated value of CBR that would be obtained from the AASHTO procedure (T-193). The equation shown in the footnotes (No.3) of Table 3 was used to make the conversion. A value of CBR equal to 1.9 was obtained by inserting the KYCBR of 3.0 into the equation. Factors of safety ranging from values below 1.0 to 1.22 were obtained. In each of those cases, stabilities of the pavement sections were approaching failure. The lower value of CBR is closer to the value that might be expected in the field because compaction specifications require that subgrades be compacted to a minimum value of 95 percent of maximum dry density and ± 2 percent of optimum moisture. The KYCBR procedure usually produces specimens that have a higher dry density than that obtained from AASHTO T-99 (Hopkins, 1973). Variation of the factor of safety with ESAL values is shown in Figure 15 when the (soaked) CBR values at the 85th percentile are used. The analyses were repeated
using the unsoaked CBR value determined at the 85th percentile test value, Figure 16. This value of KYCBR was about 11.0. A corresponding value of AASHTO CBR was 8.8. Relationships for the unsoaked values of CBR with values of ESAL are shown in Figure 16. As shown in Table 3 and Figure 16, the factors of safety range from 2.50 to 3.53 using the value of KYCBR at the 85th percentile value. Based on an estimated value of AASHTO CBR, the factors of safety ranged from 2.12 to 2.99. Hence, if mechanically compacted soils in a subgrade remained in an “as compacted” state throughout their life, then flexible pavements would experience few failure, or near failure,
F = 1.1549(ESAL)0.0812
F = 0.9446(ESAL)0.0764
0.5
1
1.5
2
0 10 20 30 40
3 0KYCBR .=
1 9AASHTOCBR .=
ESAL
Fact
or o
f Sa
fety
, F
Figure 15. Factor safety as a function of ESAL values atthe 85th percentile test value. KYCBR equals 3.0 and theestimated value of AASHTO CBR is 1.9. Tire contactstress equals 80 psi.
F = 2.6201(ESAL)0.085
F = 2.238(ESAL)0.0839
1.01.52.02.53.03.54.0
0 10 20 30 40
ESAL
Fact
or o
f Sa
fety
, F
11 0KYCBR .=
8 8AASHTOCBR .=
Figure 16. Factor safety as a function of ESAL values atthe 85th percentile test value. KYCBR equals 11.0 andthe estimated value of AASHTO CBR is 8.8. Contactstress equals 80 psi.

Characteristics and Engineering Properties of the Soft Soil Layer in Highway Soil Subgrades
24
conditions due to weak subgrades. However, as shown in Figure 15, very low factors of safety were obtained at small values of ESAL and for the case when clayey soils are exposed to soaking conditions. Hopkins (1991) has shown that the factor of safety of a flexible pavement section under a dual-wheel loading of 70 psi should be about 1.5, or greater. At larger wheel stress loadings, the pavement sections must be thicker to achieve a factor of safety of 1.5. The analyses in Table 3 were based on the dual-wheel loadings exerting a contact stress of 80 psi. Analyses show that as the contact tire stress increases the factor of safety decreases. This is illustrated in Figure 17. In these bearing capacity analyses, the CBR strength of the subgrade was held constant at a value of 3 (85th
percentile test value shown in Figure 14). The corresponding undrained shear strength of the soil subgrade was estimated to be 917 lbs/ft2. The tire contact stress and value of ESAL was varied in the analyses. Based on a tire contact stress (dual wheels) of 80 psi, the factor of safety ranged from 1.09 (close to a failure condition) to 1.52 as the value of ESAL ranged from 0.5 to 30 million. When the contact stress was increased to 100 psi, the factor of safety ranged from 0.94 (failure) to 1.27 as the value ranged from 0.5 to 30 million. Using a tire contact stress of 120 psi, the factor of safety ranged from 0.82 (failure) to only
1.10 (near failure). Although the factor of safety increased as the value of ESAL increases, it decreases as the tire contact stress increases. At a tire contact stress of 120 psi, all of the pavement sections fail or they are very close to failure ( 1 10F .≤ ). Hence, as shown by these analyses, if the clayey subgrade is soaked and the design value of ESAL is small, then the Kentucky design may yield pavement thicknesses that are too thin and prone to failure, especially when the thin pavement sections are subjected to large wheel contact stresses. Although many pavement design systems assume that failure only occurs after many wheel load applications, pavement failures, or pavement distress, may occur if wheel stresses are of a certain magnitude, or they are at a “threshold stress level.” The threshold stress will depend on the pavement thickness, the applied wheel contact stress, and the compaction condition of the soil subgrade. As shown in Figure 14, large differences occur between values of CBR of specimens in an unsoaked state and values of CBR of the same specimens that have been soaked and exposed to moisture. The percentile test value as a function of in situ CBR values obtained at numerous soil subgrades located throughout the state during this study and previous studies (Hopkins, Beckham, and Sun 2000) are compared to the KYCBR values of soaked and unsoaked laboratory specimens (688 specimens) shown in Figure 18. Additionally, percentile test values as a function of CBR values of 3,765 soaked specimens are compared to the other curves. Percentile test values as a function of in situ of CBR values represent approximately 103 tests conducted at several locations soil subgrade throughout Kentucky and were collected during this study and in a previous study (Hopkins, Beckham, and Sun). The in situ CBR-percentile curve is situated to the left of the laboratory soaked and unsoaked CBR-percentile curves. That is, the in situ values of CBR are less
0.8
1.0
1.2
1.4
1.6
0 10 20 30 40
0 08161 154 .F . ( ESAL )=
0 07430 986 .F . ( ESAL )=
ESAL
Fact
or o
f Sa
fety
, F
0 0720 863 .F . ( ESAL )=
80cT psi=
100cT psi=
120cT psi=
23 85 917thuKYCBR ( Percentile ); S lbs / ft= ≈
Soil Subgrade Strength:
Figure 17. Variation of the factor of safety with the value ofESAL and tire contact stress, Tc.

Characteristics and Engineering Properties of the Soft Soil Layer in Highway Soil Subgrades
25
than the values obtained from laboratory soaked CBR values. The laboratory unsoaked CBR-percentile curve is located much to the right of the in situ or laboratory soaked curves. At the 85th percentile test value, the CBR value of the in situ CBR-Percentile curve is 2.0 while the soaked KYCBR value is about 3.5. The value of CBR at the 85th percentile value of the curve representing CBR values of 3,765 soaked specimens from the Kentucky Geotechnical is about 3.0. The unsoaked KYCBR value at the 85th percentile test value is about 11, or 12. This illustrates that initially when clayey soils are mechanically compacted large values of CBR are usually obtained. But after exposure to moisture, compacted clayey soils of the subgrade or laboratory specimens, experience large decreases in bearing strengths. As shown by Hopkins in 1973 and Hopkins, Beckham, and Sun in 2000, the KYCBR is larger than the value of CBR obtained from the AASHTO procedure (based on molding the specimen to 95 percent of maximum dry density and optimum content) because the KYCBR procedure creates a specimen that has a larger dry density than that obtained from the AASHTO procedure (see the relationship in Figure 6). The large decrease in bearing strength in the field greatly affects pavement stability. This is illustrated in Figures 19 and 20. Using a subgrade value of CBR equal to 11 at the 85th percentile test value, assuming a value of ESAL of 3.5 million, and using the 1981 Kentucky flexible pavement design curves, thicknesses of pavement are obtained for four different asphalt percentages. In these analyses, the assumed values of percentages of asphalt to the total thickness of pavement were 25, 50, 75, and 100. Converting the CBR value to undrained strength, bearing capacity analyses were performed on the four different pavement sections. Factors of safety ranged from 2.40 for the full depth section (100 percent of asphalt) to 2.72 (25 percent of the total pavement thickness). The factor of safety decreases when the same subgrade soils are exposed to moisture. Analyzing the same pavement sections shown in Figure 20, but assuming the CBR value of the subgrade soils has decreased from 11 to the soaked value of 3.0 at the 85th percentile tests value, the factors of safety show failure. They range from 0.97 to 1.10. Hence, the decrease in bearing strength is very significant.
0
10
20
30
40
50
60
70
80
90
100
0 10 20 30 40 50 60 70 80 90 100
CBR
Per
cen
tile
Tes
t V
alu
e
Ky Geo Database (3,765 Tests)
SCS Unsoaked (668 Tests)
SCS Soaked (668 Tests)
In Situ (103 Tests)
0
10
20
30
40
50
60
70
80
90
100
0 10 20 30 40 50 60 70 80 90 100
CBR
Per
cen
tile
Tes
t V
alu
e
Ky Geo Database (3,765 Tests)
SCS Unsoaked (668 Tests)
SCS Soaked (668 Tests)
In Situ (103 Tests)
Figure 18. Comparison of in situ, or field, subgrade CBR values with values of CBR of soakedand unsoaked compacted specimens.

Characteristics and Engineering Properties of the Soft Soil Layer in Highway Soil Subgrades
26
Assuming a design CBR value of 3.0 and an ESAL value of 3.5 million, and using the 1981 Kentucky flexible pavement design curves, design thicknesses shown in Figure 21 are obtained. Bearing capacity analyses of those sections yield low values of factors of safety, which range from 1.34 (25 percent asphalt) to 1.16 (100%). Slightly different structural numbers, SN, for the sections in Figure 21 are obtained. The SN-values of the sections were slightly different and were 6.26 (25 Percent), 6.15, 6.03, and 5.72 (100 percent), respectively After adjusting the SN–values of the other sections to correspond to the SN-value of the section containing 25 percent asphalt, factors of safety of 1.34, 1.31, 1.25, and 1.23 were obtained-- Figure 22). Finally, bearing capacity analyses were performed on pavement sections obtained from the 1981 curves based on an assumed value of ESAL equal 3.5 and an assumed CBR value of 2 (at the 85th percentile test value from Figure) 18. As shown in Figure 23, the stability of each section is near
13.3 In.10.6 In.
Subgrade
KYCBR =3.0
5.3 In.
4.1 In.21.8 In.
Asp.
Agg. 10.6 In.
12.4 In.
Subgrade
25% Asp.
50% Asp.
75% Asp.
100% Asp.
F=1.34 F=1.29 F=1.20 F=1.16
Figure 21. Pavement sections based on a designCBR of 3.0.
14.2 In.10.7 In.
Subgrade
KYCBR =3.0
7.3 In.
4.1 In.21.8 In.
Asp.
Agg. 11.0 in.
12.4 In.
Subgrade
25% Asp.
50% Asp.
75% Asp.
100% Asp.
F=1.34 F=1.31 F=1.25 F=1.23
Figure 22. Sections adjusted to the same valueof structural number, SN equal 6.25
10.4 In.7.8 In.
Subgrade
KYCBR =11.0
5.1 In.
3.1 In.15.4 In.
Asp.
Agg.
7.8 In.
9.4 In.
Subgrade
25% Asp.
50% Asp.
75% Asp.
100% Asp.
F=2.72 F=2.48 F=2.40 F=2.24
Figure 19. Flexible pavement thicknesses fordifferent percentages of asphalt of the totalpavement thickness and assuming a subgradeCBR of 11.
10.4 In.7.8 In.
Subgrade
KYCBR =3.0
5.1 In.
3.1 In.15.4 In.
Asp.
Agg.
7.8 In.
9.4 In.
Subgrade
25% Asp.
50% Asp.
75% Asp.
100% Asp.
F=1.10 F=1.10 F=1.04 F=0.973
Figure 20. Factors of safety based on asubgrade CBR value of 3.0

Characteristics and Engineering Properties of the Soft Soil Layer in Highway Soil Subgrades
27
failure. Very low values of factors of safety were obtained from the bearing capacity analyses. Values were 1.12, 1.12, 1.07, and 1.03, respectively, for the sections in Figure 23. Effect of Moisture on the Preconsolidation Pressure of Compacted Clayey Soils Preconsolidation pressure is the most important factor related to the mechanical behavior of clayey soil. It is defined as the greatest effective stress to which a soil has been subjected. In the case of compacted clayey soils, the compaction energy, or effort, creates a certain preconsolidation pressure. As the compactive effort increases the preconsolidation pressure increases. Preconsolidation pressure is a fundamental characteristic of clayey soil for geotechnical design and for determining the behavior of structures on clayey soils. When a geotechnical structure is built on a soil layer, the stress applied to the surface of the layer causes an increase in stress at some depth. In the case of flexible pavements constructed on compacted soil subgrades, the preconsolidation pressure of the subgrade greatly influences the short-term and long-term performance of the pavement. By compacting a clayey soil, a preconsolidation pressure is created. The magnitude of
the preconsolidation pressure is dependent on the compaction energy and the type of soil. Compacted soils, either in the laboratory or in the field subgrade, are initially in an “undisturbed” state. If a compacted clayey soil retained its initial preconsolidation pressure, as created by standard compaction (AASHTO T –99) or modified compaction (AASHTO T-180), throughout the life of a pavement, then few problems would arise. Unfortunately, this is usually not the case. When a wheel loading is applied at the surface of the pavement there is a stress increase, wheelσΔ , at some point, say “a” (Figure 24), in the soil subgrade. The total
Soil Subgrade
Asphalt aspt
aggtAggregate
Soft Zone
soilt
Wheel Loading
a
wheelσ
0a wheelσ σ σ= + Δ
0a wheelσ σ σ= + Δ
Soil Subgrade
Asphalt aspt
aggtAggregate
Soft Zone
soilt
Wheel Loading
a
wheelσ
0a wheelσ σ σ= + Δ
0a wheelσ σ σ= + Δ
W. T.
Figure 24. Increase in stress at a point in the top of thesubgrade due to an applied stress.
14.2 In.11.5 In.
Subgrade
KYCBR =2.0
7.8 In.
4.4 In.23.38 In.
Asp.
Agg. 11.5 in.
13.1 In.
Subgrade
25% Asp.
50% Asp.
75% Asp.
100% Asp.
F=1.12 F=1.12 F=1.07 F=1.03
Figure 23. Factors of safety of pavement sections obtainedfor an assumed CBR value of 2.0 and an ESAL value of 3.5million.

Characteristics and Engineering Properties of the Soft Soil Layer in Highway Soil Subgrades
28
stress, aσ , at a selected point a in the soil subgrade is equal to the initial stress, 0σ , existing before
load application and the change in stress, 0σΔ , due to a wheel load application, or
a o wheelσ σ σ= + Δ , (2) and the initial stress (in the example, Figure 24), 0σ , may be calculated as
0 asp asp agg aggsat w soil soilsat wt ( ) t ( ) t ( )σ γ γ γ γ γ= + − + − . (3)
Where
asp agg soilt ,t ,t = thicknesses of the asphalt, aggregate, and soil layers, respectively, and
asp aggsat soilsat, ,γ γ γ = unit weight of the asphalt layer, saturated unit weight of the aggregate base layer, and the saturated unit weight of soil.
The total stress at point “a” in the example in Figure 24 is
a asp asp agg aggsat w soil soilsat w wheel( t ( ) t ( ) t ( ))σ γ γ γ γ γ σ= + − + − + Δ . (4) The magnitude of the total stress existing at a selected point, “a,” in the soil subgrade and the preconsolidation pressure of the compacted soil are critical and greatly influences the mechanical behavior and performance of a flexible pavement. Deformation that occurs in the soil subgrade is dependent on the stress induced by the wheel loads at a point in the subgrade. The magnitude of the deformation in the subgrade (and pavement) is dependent on the magnitude of stress induced in the subgrade by the wheel loads, the time durations of the load applications, and the preconsolidation pressure of the compacted soil. To illustrate this condition, and as a means of examining the potential effects of moisture on compacted soils, oedometer tests (AASHTO 216-2) were performed on compacted specimens of the six typical soils obtained from different locations in Kentucky. The tests were performed on unsoaked and soaked compacted specimens. In both cases, the oedometer specimens were initially compacted to 95 percent of maximum dry density and optimum moisture content in an attempt to simulate the values of dry density and moisture that are required when soils subgrades are initially compacted in the field.

Characteristics and Engineering Properties of the Soft Soil Layer in Highway Soil Subgrades
29
Figure 25 shows the relationship between void ratio and logarithm of stress obtained from an oedometer test performed on a clayey specimen from Campbell County, Kentucky. Void ratio, e, is defined as the ratio of the volume of voids to the void of solids in the soil matrix, or
v
s
Ve .V
= (5)
Where
vV = Volume of voids in the soil matrix and
sV = Volume of solids voids in the soil matrix. This specimen was tested in an unsoaked condition, or in “as compacted” condition. Numerous pavement problems in northern Kentucky are associated with this residual clay. Deformation of a
0.4
0.5
0.6
0.7
0.8
0.9
1 10 100 1000
Stress (psi)
Void
Rat
io
0σ Pc(As Compacted) = 41.0 psi
ce
0e
fefσ
wheelσΔ
rC rC (Virgin Slope)(Recompression Slope)
0σ Pc(As Compacted) = 41.0 psi
ce
0e
fefσ
wheelσΔ
rC rC (Virgin Slope)(Recompression Slope)
Figure 25. Void ratio of a compacted clayey soil as a function of stress.
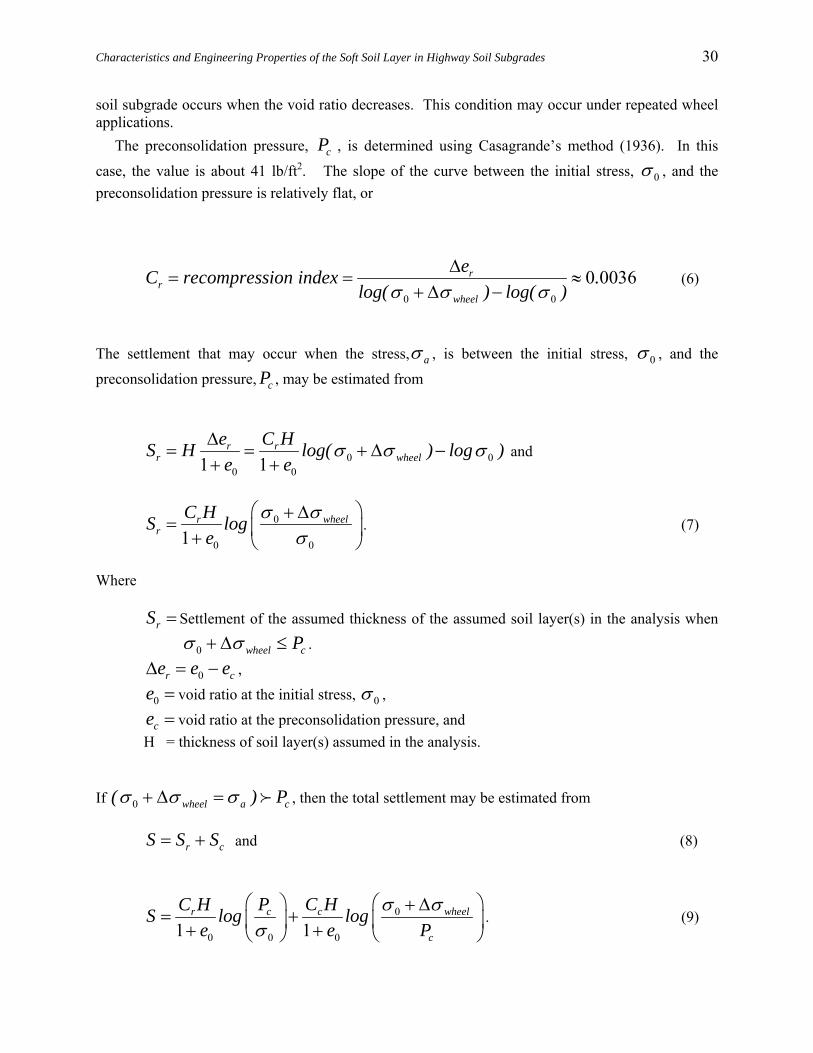
Characteristics and Engineering Properties of the Soft Soil Layer in Highway Soil Subgrades
30
soil subgrade occurs when the void ratio decreases. This condition may occur under repeated wheel applications. The preconsolidation pressure, cP , is determined using Casagrande’s method (1936). In this
case, the value is about 41 lb/ft2. The slope of the curve between the initial stress, 0σ , and the preconsolidation pressure is relatively flat, or
0 0
0 0036rr
wheel
eC recompression index .log( ) log( )σ σ σ
Δ= = ≈
+ Δ − (6)
The settlement that may occur when the stress, aσ , is between the initial stress, 0σ , and the
preconsolidation pressure, cP , may be estimated from
0 00 01 1
r rr wheel
e C HS H log( ) log )e e
σ σ σΔ= = + Δ −
+ + and
0
0 01wheelr
rC HS log
eσ σ
σ⎛ ⎞+ Δ
= ⎜ ⎟+ ⎝ ⎠. (7)
Where
rS = Settlement of the assumed thickness of the assumed soil layer(s) in the analysis when
0 wheel cPσ σ+ Δ ≤ .
0r ce e eΔ = − ,
0e = void ratio at the initial stress, 0σ ,
ce = void ratio at the preconsolidation pressure, and H = thickness of soil layer(s) assumed in the analysis.
If 0 wheel a c( ) Pσ σ σ+ Δ = , then the total settlement may be estimated from
r cS S S= + and (8)
0
0 0 01 1c c wheelr
c
P C HC HS log loge e P
σ σσ
⎛ ⎞ ⎛ ⎞+ Δ= +⎜ ⎟ ⎜ ⎟+ +⎝ ⎠ ⎝ ⎠
. (9)

Characteristics and Engineering Properties of the Soft Soil Layer in Highway Soil Subgrades
31
Where
cC = compression index = the slope of the virgin curve between the preconsolidation stress,
Pc, and the final stress, fσ , or
0
0cc
wheel c
eC .log( ) log( P )σ σ
Δ= ≈
+ Δ −1710 and
c c fe e eΔ = − ,
ce = void ratio at the preconsolidation pressure, cP , and
fe = void ratio at the last test pressure on the virgin compression curve, Figure 25. When a cPσ ≺ , settlement is relatively small since the decrease in void ratio is relatively small.
However, when a cPσ , settlement can become sizeable since the void ratio is decreasing at a much faster rate then the rate that occurs below the preconsolidation pressure. When the compacted clay is exposed to moisture for some period of time the mechanical properties of the material are altered. To examine this aspect, a specimen of the clay soil from Campbell County was compacted to the same dry density and moisture content as the unsoaked specimen. However, the specimen was allowed to swell in the oedometer until swelling ceased. After swelling, the specimen was loaded in the same pattern as the unsoaked specimen. The relationship of the void ratio and the logarithm of stress obtained for the soaked specimen is compared to the unsoaked relationship in Figure 26. Soaking the compacted clayey specimen completely alters the relationship between the void ratio and the logarithm of stress. Essentially, the void ratio of the soaked specimen becomes larger than the void ratio of the unsoaked specimen. The preconsolidation pressure decreases from 41.0 (unsoaked specimen) to 10.5 lbs/ft2, or a decrease of
about 74 percent. Moreover, the recompression index, Cr, increases from a value of 0.0035 to 0.1075, or some 3000 percent. The compression index, Cc, increases slightly from 0.2096 to 0.2096, or an increase of about 22 percent. It is quite evident that when a cPσ ≺ , settlement of the soaked clay layer is much more than settlement of the unsoaked clay layer when a cP ( unsoaked )σ ≺ . The settlement becomes even much larger for the soaked clay layer when a cPσ . As shown in Figure 27, the actual potential damage to a flexible pavement occurs because the settlements (in the wheel paths) occurring in the soft zone beneath the wheel paths are differential, that is, the settlements are not uniform across the clay layer. The differential settlements created by this situation can cause cracking of the pavements, especially in very thin pavements. Oedometer tests were performed on the other five Kentucky soils. Both unsoaked and soaked compacted specimens were tested. Void ratio as a function of the logarithm of stress for these compacted specimens are shown in Figures 28 through 32. Preconsolidation pressures of the unsoaked and soaked specimens are compared in Table 4. In each case, the preconsolidation pressures of the “as compacted” specimens were lowered. The decreases ranged from 23 to 74 percent after soaking. The recompression indexes also became larger after soaking. Increases in Cr ranged from 20 to 2886 percent. Compression indices only increased in a range of –20 to 28 percent. Hence, soaking conditions in the field would cause the same effects and make the top portion of compacted soils much more susceptible to consolidation under traffic loadings.
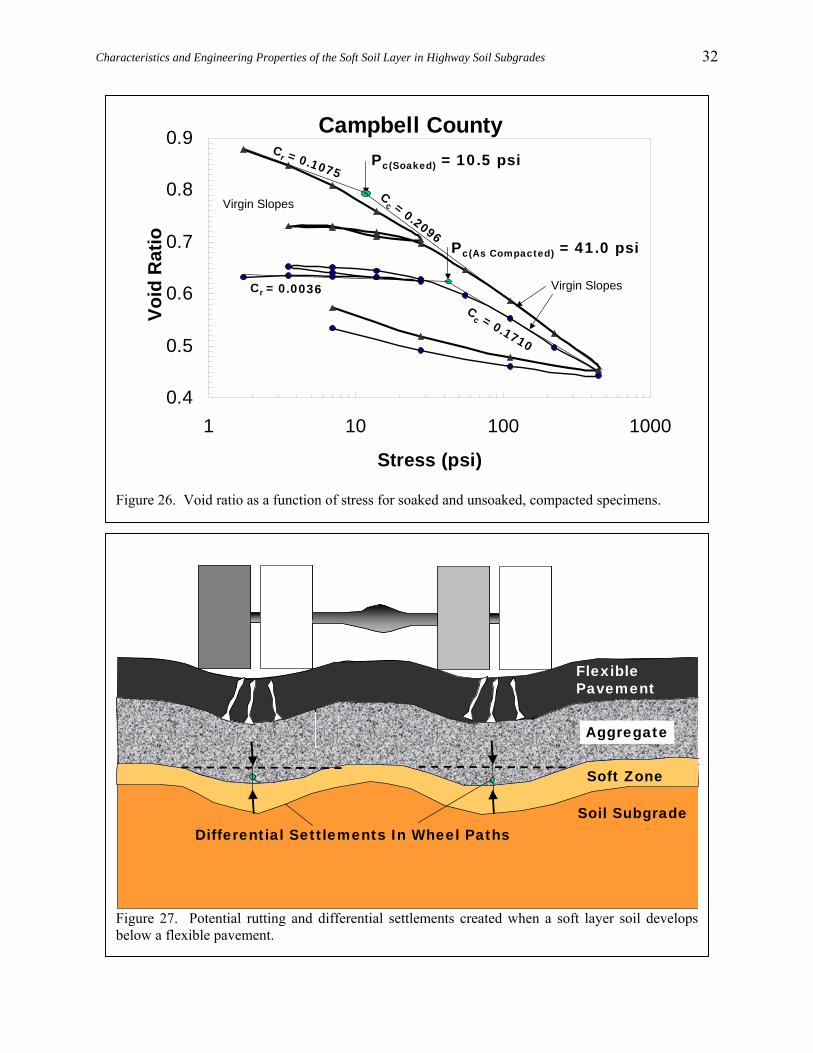
Characteristics and Engineering Properties of the Soft Soil Layer in Highway Soil Subgrades
32
Campbell County
0.4
0.5
0.6
0.7
0.8
0.9
1 10 100 1000
Stress (psi)
Void
Rat
ioPc(Soaked) = 10.5 psi
Pc(As Compacted) = 41.0 psi
Virgin Slopes
Virgin Slopes
Cr = 0.1075
Cc = 0.2096
Cr = 0.0036C
c = 0.1710
Figure 26. Void ratio as a function of stress for soaked and unsoaked, compacted specimens.
Differential Settlements In Wheel Paths
Soft Zone
Soil Subgrade
Aggregate
Flexible Pavement
Figure 27. Potential rutting and differential settlements created when a soft layer soil develops below a flexible pavement.

Characteristics and Engineering Properties of the Soft Soil Layer in Highway Soil Subgrades
33
Fayette County
0.6
0.7
0.8
0.9
1
1.1
1 10 100 1000
Stress (psi)
Void
Rat
io
Pc(Soaked) = 13.0 psi
Pc(As Compacted) = 33.0 psi
Cr = 0.0806
Cc = 0.2282
Cc = 0.2116
Cr = 0.0189
Figure 28. Void ratio as a function of stress for soaked and unsoaked, compacted specimens.
Table 4. Comparison of the estimated preconsolidation pressures of soaked and unsoaked compacted specimens.
Recompression Index
Cr
Compression Index
Cc
Preconsolidation Pressure
(psi)
Unsoaked Soaked Unsoaked Soaked As Compacted
Soaked
Campbell KY 10 0.0036 0.1075 0.1710 0.2096 41.0 10.5
Fayette Co. US 25 0.0189 0.0806 0.2116 0.2282 33.0 13.0
Lee Co. KY 11 0.0328 0.0459 0.1623 0.1624 44.0 15.0
Hardin Co. US 31W 0.0330 0.0394 0.1903 0.2438 30.4 8.4
Paducah KY 994 0.0228 0.0372 0.1249 0.1005 73.0 40.9
Henderson 0.0130 0.0438 0.0626 0.0779 43.0 33.0

Characteristics and Engineering Properties of the Soft Soil Layer in Highway Soil Subgrades
34
Hardin County
0.4
0.5
0.6
0.7
0.8
0.9
1 10 100 1000
Stress (psi)
Void
Rat
io
Cr = 0.0394
Cc = 0.2438
Pc(As Compacted) = 30.4 psi
Pc(Soaked) = 8.4 psi
Cr = 0.0330
Cc = 0.1903
Figure 30. Void ratio as a function of stress for soaked and unsoaked, compacted specimens.
Lee County
0.4
0.5
0.6
0.7
0.8
1 10 100 1000
Stress (psi)
Void
Rat
io
Pc(Soaked) = 15.0 psiCr = 0.0459
Cc = 0.1624
Pc(As Compacted) 44.0= psi Cc = 0.1623
Cr = 0.0328
Figure 29. Void ratio as a function of stress for soaked and unsoaked, compacted specimens.
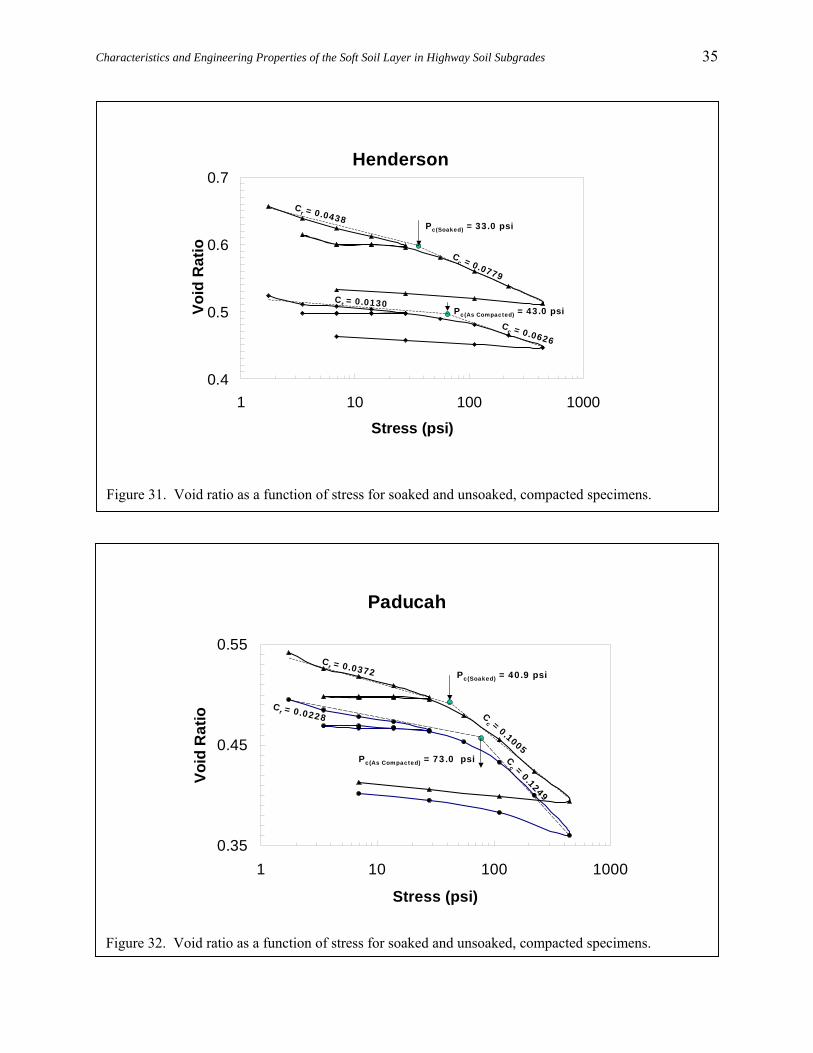
Characteristics and Engineering Properties of the Soft Soil Layer in Highway Soil Subgrades
35
Paducah
0.35
0.45
0.55
1 10 100 1000
Stress (psi)
Void
Rat
io
Pc(Soaked) = 40.9 psi
Pc(As Compacted) = 73.0 psi
Cr = 0.0372
Cc = 0.1005
Cc = 0.1249
Cr = 0.0228
Figure 32. Void ratio as a function of stress for soaked and unsoaked, compacted specimens.
Henderson
0.4
0.5
0.6
0.7
1 10 100 1000
Stress (psi)
Void
Rat
ioPc(Soaked) = 33.0 psi
Pc(As Compacted) = 43.0 psi
Cr = 0.0438
Cc = 0.0779
Cr = 0.0130
Cc = 0.0626
Figure 31. Void ratio as a function of stress for soaked and unsoaked, compacted specimens.

Characteristics and Engineering Properties of the Soft Soil Layer in Highway Soil Subgrades
36
CASE STUDIES To gain a better understanding of the development of the soft layer in the top of clayey subgrades, four flexible pavement highway sections were selected for detailed study. Several holes were cored and in situ CBR tests were performed on tops of the subgrades. Thin-walled tube samples were obtained from the top portion of the subgrade. The extracted column of soil from the thin-walled tube sampler was thinly sliced at selected depths. Moisture contents of the thinly sliced specimens of the soil subgrade were determined. At each coring location of each highway roadway section, moisture content-depth profiles were developed. Finally, using the measured thicknesses of flexible pavement and aggregate bases, bearing capacity analysis was performed for each coring location to determine the factor of safety against failure. The factor of safety at each site was compared to the pavement conditions generally observed at each site. Details of the four roadway sections selected for study and details at each location within each roadway are described below. Coring Techniques and Field Testing Procedures Core holes were drilled approximately every tenth of a mile within roadway study section. Special coring techniques were developed to avoid using water. Compressed air, instead of water, was used to advance the core barrel down to the top of the subgrade of each section. By using compressed air
as the drilling media, soaking and softening of the top of the subgrade at each hole was prevented. Hence, the subgrade as it exists in its natural setting was preserved and undisturbed. Typically, three or four holes were drilled at each location. The first core hole was drilled to measure the thicknesses of the asphalt and aggregate base layers of the flexible pavement section. After removing and measuring the thickness of the asphalt core, the base aggregate was removed by hand to expose the top of the stabilized subgrade (or in some cases the top of the untreated subgrade). The depth, or thickness,
of the aggregate base was noted. Then a standard penetration test (SPT) was performed on the stabilized subgrade to obtain a split spoon specimen of the stabilized subgrade. At the same location, a second hole was drilled. After auguring through the flexible pavement and aggregate base and exposing the top of the stabilized subgrade, an in situ CBR test was performed, as shown in Figure 33. After completing the CBR test, a moisture content specimen was obtained at the top of the stabilized subgrade. A third hole was advanced through the asphalt layer and aggregate base and a thin-walled, undisturbed sample, or a core specimen was obtained of the stabilized subgrade. Latitudes and longitudes of each section and borings within each section were determined using mapping-grade, GPS (Global Positioning System) equipment. Accuracy of the locations of holes was within a sub meter of the true location.
Aggregate
Untreated Soil Subgrade
Asphalt Pavement
H-2
H-1
In Situ CBR
Measure
CB
R
Tube Sample
Geogrid (at two locations)
H-3
GeofabricSoft Zone
SP
T S
am
ple
r
Thin
-wall
Tube S
am
ple
Figure 33. Field testing sequence and sample recovery.
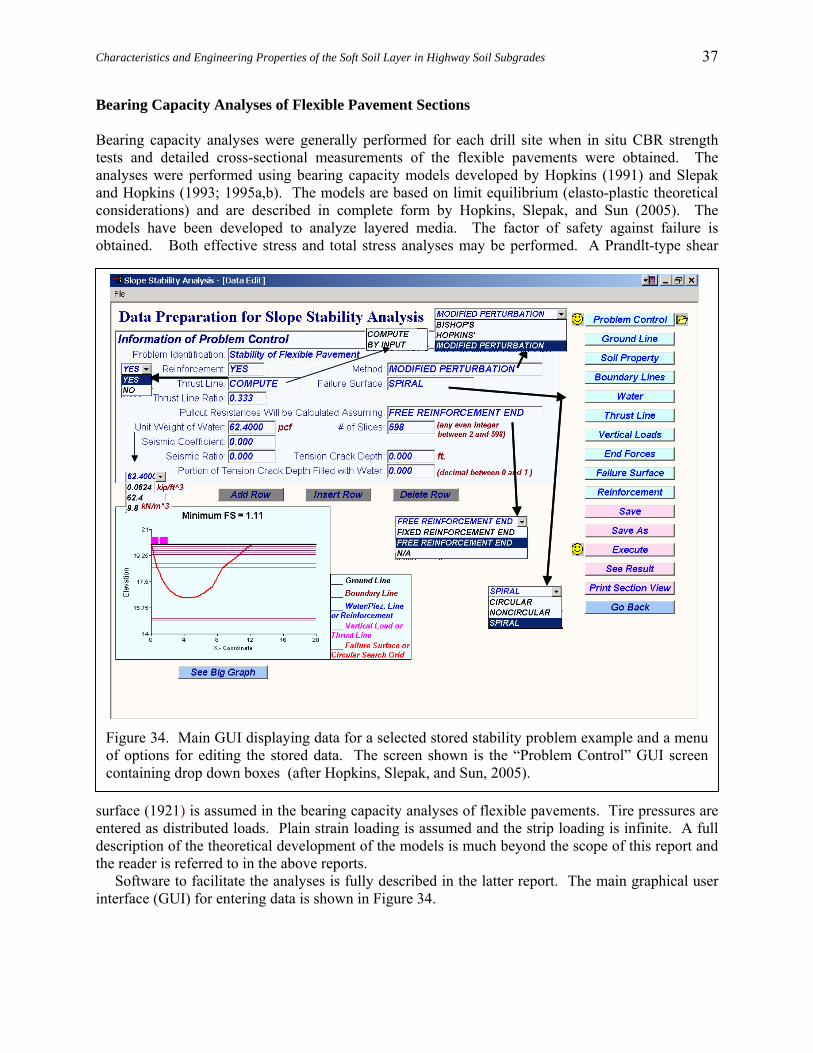
Characteristics and Engineering Properties of the Soft Soil Layer in Highway Soil Subgrades
37
Bearing Capacity Analyses of Flexible Pavement Sections Bearing capacity analyses were generally performed for each drill site when in situ CBR strength tests and detailed cross-sectional measurements of the flexible pavements were obtained. The analyses were performed using bearing capacity models developed by Hopkins (1991) and Slepak and Hopkins (1993; 1995a,b). The models are based on limit equilibrium (elasto-plastic theoretical considerations) and are described in complete form by Hopkins, Slepak, and Sun (2005). The models have been developed to analyze layered media. The factor of safety against failure is obtained. Both effective stress and total stress analyses may be performed. A Prandlt-type shear
surface (1921) is assumed in the bearing capacity analyses of flexible pavements. Tire pressures are entered as distributed loads. Plain strain loading is assumed and the strip loading is infinite. A full description of the theoretical development of the models is much beyond the scope of this report and the reader is referred to in the above reports. Software to facilitate the analyses is fully described in the latter report. The main graphical user interface (GUI) for entering data is shown in Figure 34.
Figure 34. Main GUI displaying data for a selected stored stability problem example and a menuof options for editing the stored data. The screen shown is the “Problem Control” GUI screencontaining drop down boxes (after Hopkins, Slepak, and Sun, 2005).

Characteristics and Engineering Properties of the Soft Soil Layer in Highway Soil Subgrades
38
Ky Route 842 Flexible Pavement Design Section—MP 2.5 to MP 4.8 During construction of a flexible asphalt pavement section on a portion of KY Route 842 in Boone County, problems were encountered at a several locations. This roadway section, which contains an untreated subgrade, begins at Mile Point 2.5 and ends at Mile Point 4.8 (See Figure 35). In some areas of this section, additional aggregate was added during construction while in other areas patching was required shortly after construction. Six drill-hole sites were selected for a detailed study. Two design alternatives for this roadway section are shown in Figure 36.
Boone County, KY 842 Design Alternates
Boone County, KY 842 Design Alternates
11” DGA
8.0” Asphalt
8.0” MechanicallyModified Soil Roadbed
Tensile Element Grid
Design 1 Design 2
Figure 36. Original design alternatives for KY Route842.
MP0.0
US 42 to KY 18MP 2.5 – 4.8Constructed 1996Problems
US 25 to US 42 StabilizedMP 0.0 - 2.5Constructed 1986Overlay 1999
KY 18 to KY 1017 MP 4.8 –6.1 Stabilized—Hydrated LimeConstructed 1992—No Overlays
Figure 35. Study section of Ky 842, which contains an untreated subgrade, begins at MP 2.5 and ends at MP 4.8.
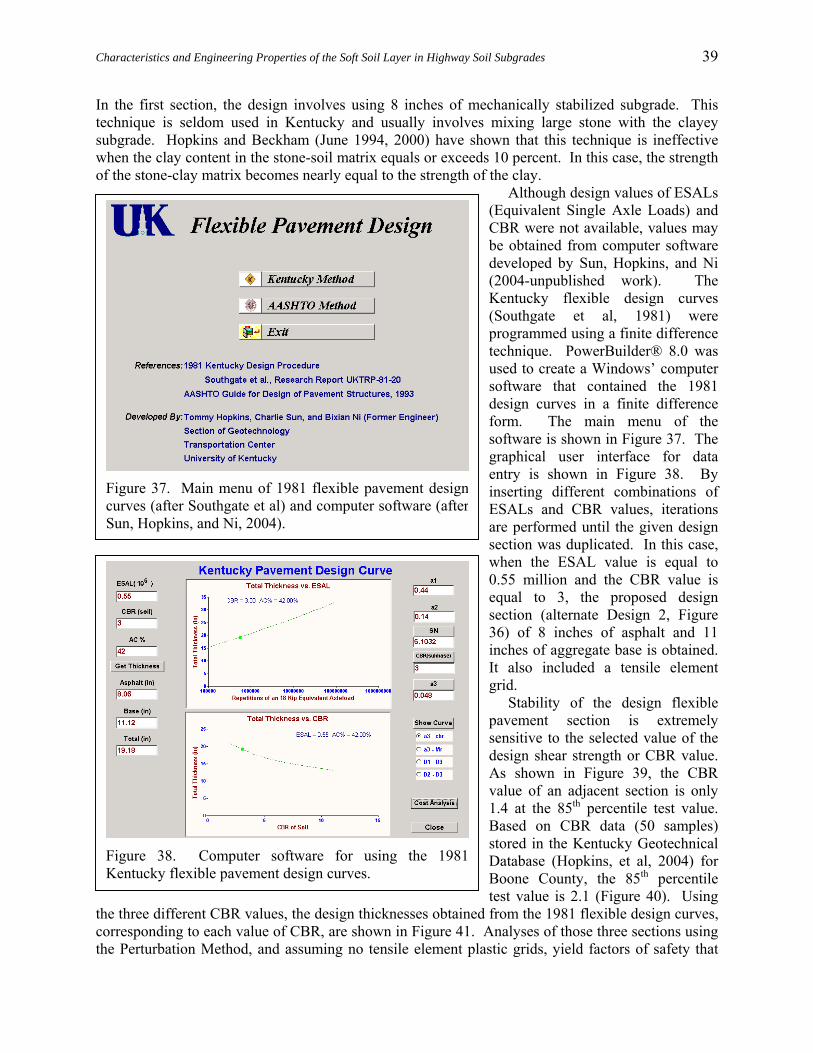
Characteristics and Engineering Properties of the Soft Soil Layer in Highway Soil Subgrades
39
In the first section, the design involves using 8 inches of mechanically stabilized subgrade. This technique is seldom used in Kentucky and usually involves mixing large stone with the clayey subgrade. Hopkins and Beckham (June 1994, 2000) have shown that this technique is ineffective when the clay content in the stone-soil matrix equals or exceeds 10 percent. In this case, the strength of the stone-clay matrix becomes nearly equal to the strength of the clay.
Although design values of ESALs (Equivalent Single Axle Loads) and CBR were not available, values may be obtained from computer software developed by Sun, Hopkins, and Ni (2004-unpublished work). The Kentucky flexible design curves (Southgate et al, 1981) were programmed using a finite difference technique. PowerBuilder® 8.0 was used to create a Windows’ computer software that contained the 1981 design curves in a finite difference form. The main menu of the software is shown in Figure 37. The graphical user interface for data entry is shown in Figure 38. By inserting different combinations of ESALs and CBR values, iterations are performed until the given design section was duplicated. In this case, when the ESAL value is equal to 0.55 million and the CBR value is equal to 3, the proposed design section (alternate Design 2, Figure 36) of 8 inches of asphalt and 11 inches of aggregate base is obtained. It also included a tensile element grid. Stability of the design flexible pavement section is extremely sensitive to the selected value of the design shear strength or CBR value. As shown in Figure 39, the CBR value of an adjacent section is only 1.4 at the 85th percentile test value. Based on CBR data (50 samples) stored in the Kentucky Geotechnical Database (Hopkins, et al, 2004) for Boone County, the 85th percentile test value is 2.1 (Figure 40). Using
the three different CBR values, the design thicknesses obtained from the 1981 flexible design curves, corresponding to each value of CBR, are shown in Figure 41. Analyses of those three sections using the Perturbation Method, and assuming no tensile element plastic grids, yield factors of safety that
Figure 37. Main menu of 1981 flexible pavement designcurves (after Southgate et al) and computer software (afterSun, Hopkins, and Ni, 2004).
Figure 38. Computer software for using the 1981Kentucky flexible pavement design curves.

Characteristics and Engineering Properties of the Soft Soil Layer in Highway Soil Subgrades
40
are much less than 1.0, 1.01, and 1.15, respectively—essentially a failure condition. Assuming a CBR strength of 3.0 (or an undrained shear strength of Su equal to 917 lbs/ft2) of the soil subgrade and the strengths of the tensile element plastic grids equal to 450, 920, and 1340 lbs/ft, which correspond to strains (in percent) of 2, 5, and ultimate, respectively, factors of safety obtained were equal to 1.18, 1.22, and 1.25, respectively. Assuming the same conditions but using a CBR value of the subgrade equal to 2.0 (Su equal to 617 lbs/ft2), the factors of safety obtained from the Perturbation method are 1.01 (no tensile elements), 1.04, 1.08, and 1.10, respectively. Stability of the subgrade is very sensitive to the strength of the
subgrade and the choice of the design CBR, or undrained shear strength, is very critical in obtaining a stable situation during and after construction. Problems were encountered in this portion of KY 842. In some instances, aggregate was added to certain areas during construction. Revised sections are depicted in Figure 42 and compared to the original design sections and the section actually measured in situ. Classification and Engineering Properties of Subgrade The subgrade soils of this roadway were classified as CL and A-6 (9) by the Unified Soil Classification System and the AASHTO Soil Classification System, respectively. About 81 percent of the soil passed a No. 200 sieve. About 25 percent of the soil particles were finer than the 0.002 mm particle size. Liquid and plastic limits were 31.6 and 19.6, percent respectively. Specific gravity was 2.78. A consolidation test was performed on a specimen obtained from boring 3 of site 1. The
Boone County (50 samples)Boone County (50 samples)
0
20
40
60
80
100
0 2 4 6 8 10
Perc
entil
e Te
st v
alue
CBR
CBR 85th = 2.1
Boone County (50 samples)Boone County (50 samples)
0
20
40
60
80
100
0 2 4 6 8 10
Perc
entil
e Te
st v
alue
CBR
Boone County (50 samples)Boone County (50 samples)
0
20
40
60
80
100
0 2 4 6 8 10
Perc
entil
e Te
st v
alue
CBR
Boone County (50 samples)Boone County (50 samples)
0
20
40
60
80
100
0 2 4 6 8 10
Boone County (50 samples)Boone County (50 samples)
0
20
40
60
80
100
0 2 4 6 8 10
Perc
entil
e Te
st v
alue
CBR
CBR 85th = 2.1
Figure 40. Percentile test value as function ofCBR for an adjacent roadway section.
0
5
10
15
20
25
1 2 3CBR = 1.4 CBR = 2.0 CBR = 3.0
F << 1.0 F = 1.01
9.1”
12.6”
8.7”
12.0” 11.0”
8.0”
(Need 14 in. more of agg. To get F = 1.20)
≈F = 1.15
Factor of Safety strongly controlled by value of CBR or undrained shear strength
Figure 41. Different pavement thicknesses obtainedfrom the 1981 flexible pavement curves (afterSouthgate et al) using different values of CBR.
0
20
40
60
80
100
0 2 4 6 8CBR
Perc
entil
e Te
st v
alue
Adjacent Roadway SectionAdjacent Roadway Section
CBR 85th = 1.4
0
20
40
60
80
100
0 2 4 6 8CBR
Perc
entil
e Te
st v
alue
Adjacent Roadway SectionAdjacent Roadway Section
0
20
40
60
80
100
0 2 4 6 8CBR
Perc
entil
e Te
st v
alue
Adjacent Roadway SectionAdjacent Roadway Section
0
20
40
60
80
100
0 2 4 6 8CBR
Perc
entil
e Te
st v
alue
Adjacent Roadway SectionAdjacent Roadway Section
CBR 85th = 1.4
Figure 39. Percentile test value as function ofCBR for an adjacent roadway section.

Characteristics and Engineering Properties of the Soft Soil Layer in Highway Soil Subgrades
41
specimen was obtained from the top of the subgrade using a thin wall tube sampler. Void ratio as a function of stress loading is shown in Figure 43. The preconsolidation pressure of the compacted specimen was estimated to be 22 lbs/in2. The shape of the curve in Figure 43 is characteristic of a curve of compacted specimen that has swelled, as shown in Figure 26 and Figures 28 through 32. The in situ moisture of the consolidation specimen was 18.2 percent at the beginning of the test. A resilient modulus test was performed on a specimen obtained from a thin wall tube sampler retrieved from the top portion of the subgrade at boring 3, drill site 1. Moisture content of this specimen was 19.4 percent. Resilient modulus of this specimen, as a function of confining stress, 3σ , and the deviator
stress, dσ , is shown in Figure 44. Three different models (Hopkins et al. 2001, 2005a; Ni et al. 2002) used to fit all data points of the test. However, the R2-values of each of the three models were very low (less than 0.1). Data fits of this type, shown in Figure 44, are typical of the types usually obtained for soaked specimens, as shown by Hopkins et a. 2001. For example, R2-values of 91 percent of sixty tests performed on clayey soil that were compacted to optimum moisture and 95 percent of maximum dry density obtained from AASHTO T-99 and tested immediately unsoaked were greater than or equal to 0.87. However,
only 35 percent of the R2-values of tests performed on soaked specimens that had initially been compacted to the same dry densities and moistures as the unsoaked samples were equal to are greater than 0.87. R2-values of sixty five percent of those specimens ranged from 0.3 to 0.87. Several of the soaked clayey specimens failed under repeated loadings because of the build-up of excess pore pressures during testing. Many of those specimens exhibited the erratic behavior as exhibited by the specimen in Figure 44. Typical behavior of the resilient modulus of unsoaked and “as compacted” specimens is illustrated in Figure 45. The R2-value of the fit of data points to the surface plane was 0.993.
Boone County, KY 842
11” DGA
8.0” Asphalt
8.0” MechanicallyModified Soil Roadbed
Grid
2 Design Alternatives
Fabric
Observed
8.0- 9.0” Asphalt
10” DGA
Grid2-3”
6” DGA
6” #2 Stone Grid
Fabric
Revised Design
Soil Subgrade
Figure 42. Revised and observed sections compared to the design alternative sections.
0.400
0.500
0.600
1 10 100 1000
Voi
d R
atio
Stress (psi)
Pc = 22 psi
Figure 43. Void ratio as a function of stress for aspecimen obtained at the top (depth equal 0 to 3 inches)of the subgrade at site 1.
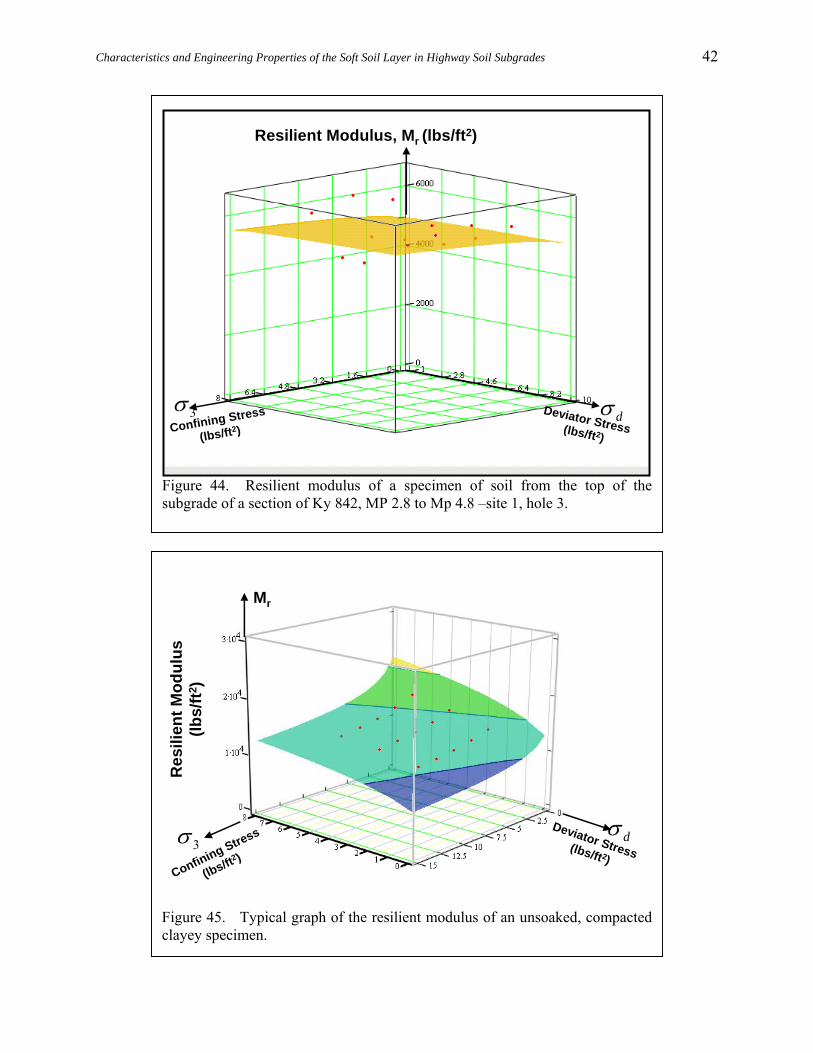
Characteristics and Engineering Properties of the Soft Soil Layer in Highway Soil Subgrades
42
Resilient Modulus, Mr (lbs/ft2)
3σdσ
Confining Stress
(lbs/ft2)
Deviator Stress (lbs/ft2)
Figure 44. Resilient modulus of a specimen of soil from the top of thesubgrade of a section of Ky 842, MP 2.8 to Mp 4.8 –site 1, hole 3.
Res
ilien
t Mod
ulus
(lb
s/ft2
)
3σ dσ
Confining Stress
(lbs/ft2 )
Deviator Stress (lbs/ft2)
Mr
Figure 45. Typical graph of the resilient modulus of an unsoaked, compactedclayey specimen.

Characteristics and Engineering Properties of the Soft Soil Layer in Highway Soil Subgrades
43
Unconfined compressive strength of a specimen collected from the top 9 inches of the subgrade that was recovered at the same location as the resilient modulus specimen was 33.82 lbs/in2. The undrained shear strength was 16.9 lbs/in2. Moisture content of the unconfined compressive specimen was 20.0 percent. The in situ CBR at this location was 6.4 and the moisture content was 15.9 percent. The moisture content of the resilient modulus specimen was higher, or 19.4 percent. Bearing Capacity Analyses of Selected Drilled Sites Site 1 Values of in situ CBR, a moisture content profile of the upper reaches of the soil subgrade, and measured thicknesses of asphalt pavement and DGA (Dense Graded Aggregate) base are shown for Site 1 in Figure 46. At site 1, no tensile elements were found during drilling. Using the temperature model by Southgate (1981), the asphalt layer was divided into four layers and equations appearing in Figures 23 and 24 were used to define the shear strength parameters, φ , and c, for each layer of the asphalt pavement. Values of φ and c, of the DGA base were (assumed) 43 degrees and zero, respectively. The in situ CBR value for this site was 6.4. Tire contact pressure of 80 psi was assumed in the analyses (and subsequent analyses described below). A dual wheel arrangement illustrated in Figure 65 was also used. Using Equation 190, the undrained shear of the soil subgrade was 1926 lbs/ft2. The factor of safety against failure obtained from the Perturbation Method for this site was 1.90. No tensile element was found during drilling at this site. Pavement problems were not observed at this site. Site 2 Conditions found at site 2 are displayed in Figure 47. Moisture content of the top few inches of the subgrade was larger in value than the moisture content of the subgrade located below the top portion. A dry shale zone was located in the subgrade as shown in Figure 47. The CBR value of the subgrade was 1.5—an extremely soft subgrade. The flexible pavement and DGA thicknesses were 8.5 and 12 inches, respectively. Bearing capacity analysis of the flexible pavement section yielded a factor of safety much less than 1.0. Even using a slightly larger value of CBR (equal to 2.0) yielded a factor of safety of only 0.98. As noted in Figure 47, some DGA had to be added during construction at this location. Pavement problems were very visible at this site. No tensile elements were found at this location.
Boone County, KY 842 Site 1
12” DGA
8.5” Asphalt
CBR = 6.4, M.C = 15.91
Boone County KY 842 Site 1
-24-20-16-12
-8-40
14 16 18 20 22
Moisture Content (%)
Subg
rade
Dep
th (i
n.)
F = 1.90
Figure 46. Measured thicknesses of asphalt pavement andDGA (Dense Graded Aggregate), a moisture content profileof the top inches of subgrade, and in situ value of CBR.

Characteristics and Engineering Properties of the Soft Soil Layer in Highway Soil Subgrades
44
Site 3 Figure 48 shows the conditions encountered at site 3. The in situ CBR was 6.0. Converting this value to undrained shear strength using Equation 190, the factor of safety against failure obtained from the Perturbation bearing capacity model was 1.75. No pavement problems were observed at this location. Tensile elements were not observed during the drilling problem. However, a fabric (separator) was located at the top of the subgrade. Inserting a small strength of 200 lbs/ft into the analyses increases the factor of safety to 1.76. However, analyses of the flexible pavement at this location show that the stability should be very adequate unless the subgrade CBR starts to decrease substantially. Site 4. At site 4, Figure 49, a tensile element layer was located about 2 inches above the bottom of the aggregate base. Additionally, a fabric separator was located at the bottom of the aggregate base to prevent intrusion of clay particles into the base. Thickness of the flexible pavement was about 7 inches. This thickness was slightly less then the thickness observed at other locations. The aggregate base measured some 12 inches. Value of the in situ CBR of the subgrade was 3.9. Analyses of the flexible pavement section at this location yielded a factor of safety against failure of 1.28. Using published strength values of one brand of tensile elements, at 2, 5, and ultimate strains (in percent), factors of safety, denoted F2%, F5%, and Fu, of 1.31, 1.35, and 1.38, respectively, were obtained from the Perturbation model. Strength values used in the
12” DGA some added during constructiondue to rutting?
8.5” Asphalt
CBR = 1.5, M.C = 26.12
Boone County KY 842 Site 2 H-1
-18-16-14-12-10
-8-6-4-20
0 2 4 6 8 10 12 14 16 18 20 22 24 26 28
Moisture Content (%)
Subg
rade
Dep
th (i
n.)
F << 1.0 @ CBR = 1.5
Boone County, KY 842 Site 2
F = 0.98 @ CBR =2.0
Figure 47. Measured thicknesses of asphalt pavement andDGA (Dense Graded Aggregate), a moisture contentprofile of the top inches of subgrade, and in situ value ofCBR.
10” DGA
9.0” Asphalt
CBR = 6.0, M.C = 21.75Clay ShaleLimestone Bedrock
Fabric
F = 1.76
Boone County, KY 842 Site 3
Figure 48. Measured thicknesses of asphalt pavement andDGA (Dense Graded Aggregate) and in situ value of CBR.
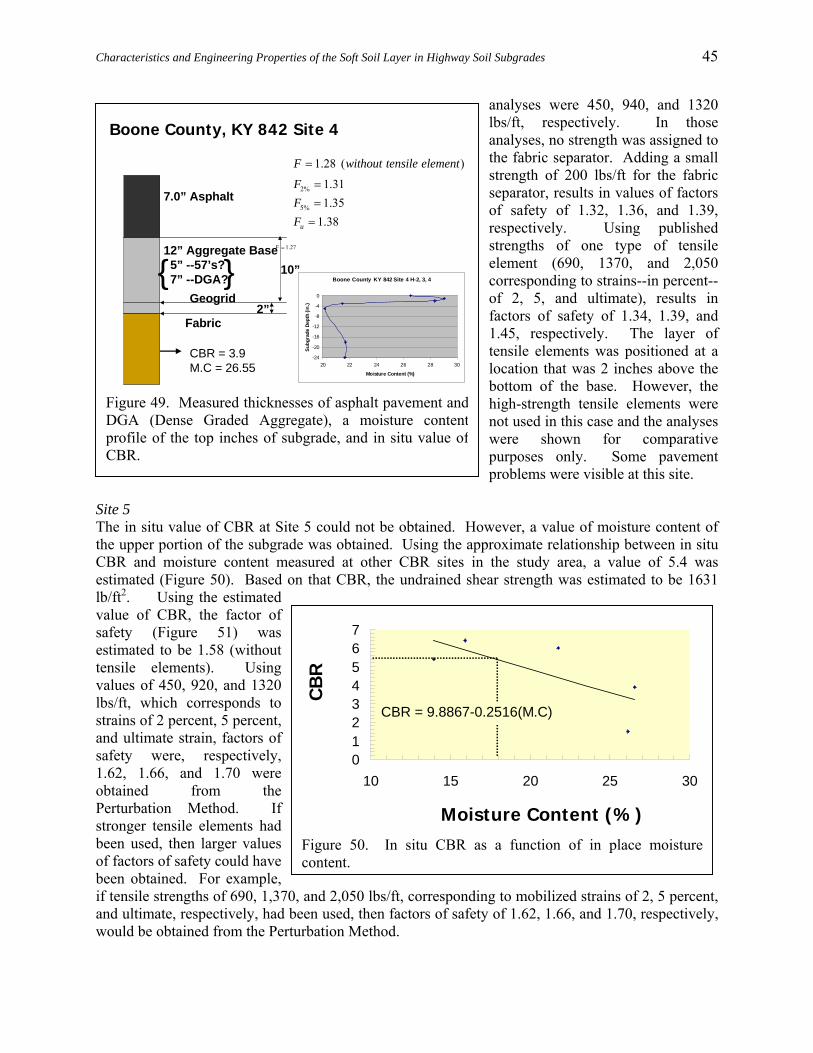
Characteristics and Engineering Properties of the Soft Soil Layer in Highway Soil Subgrades
45
analyses were 450, 940, and 1320 lbs/ft, respectively. In those analyses, no strength was assigned to the fabric separator. Adding a small strength of 200 lbs/ft for the fabric separator, results in values of factors of safety of 1.32, 1.36, and 1.39, respectively. Using published strengths of one type of tensile element (690, 1370, and 2,050 corresponding to strains--in percent-- of 2, 5, and ultimate), results in factors of safety of 1.34, 1.39, and 1.45, respectively. The layer of tensile elements was positioned at a location that was 2 inches above the bottom of the base. However, the high-strength tensile elements were not used in this case and the analyses were shown for comparative purposes only. Some pavement problems were visible at this site.
Site 5 The in situ value of CBR at Site 5 could not be obtained. However, a value of moisture content of the upper portion of the subgrade was obtained. Using the approximate relationship between in situ CBR and moisture content measured at other CBR sites in the study area, a value of 5.4 was estimated (Figure 50). Based on that CBR, the undrained shear strength was estimated to be 1631 lb/ft2. Using the estimated value of CBR, the factor of safety (Figure 51) was estimated to be 1.58 (without tensile elements). Using values of 450, 920, and 1320 lbs/ft, which corresponds to strains of 2 percent, 5 percent, and ultimate strain, factors of safety were, respectively, 1.62, 1.66, and 1.70 were obtained from the Perturbation Method. If stronger tensile elements had been used, then larger values of factors of safety could have been obtained. For example, if tensile strengths of 690, 1,370, and 2,050 lbs/ft, corresponding to mobilized strains of 2, 5 percent, and ultimate, respectively, had been used, then factors of safety of 1.62, 1.66, and 1.70, respectively, would be obtained from the Perturbation Method.
12” Aggregate Base5” --57’s?7” --DGA?
7.0” Asphalt
CBR = 3.9 M.C = 26.55
Fabric
Geogrid
10”
2”
Boone County KY 842 Site 4 H-2, 3, 4
-24
-20
-16
-12
-8
-4
0
20 22 24 26 28 30
Moisture Content (%)
Subg
rade
Dep
th (i
n.)
Boone County, KY 842 Site 4
{ }1.27F =
2%
5%
1.28 ( )
1.311.35
1.38u
F without tensile element
FFF
=
==
=
Figure 49. Measured thicknesses of asphalt pavement andDGA (Dense Graded Aggregate), a moisture contentprofile of the top inches of subgrade, and in situ value ofCBR.
CB
R
Moisture Content (%)
CBR = 9.8867-0.2516(M.C)
01234567
10 15 20 25 30
Figure 50. In situ CBR as a function of in place moisturecontent.
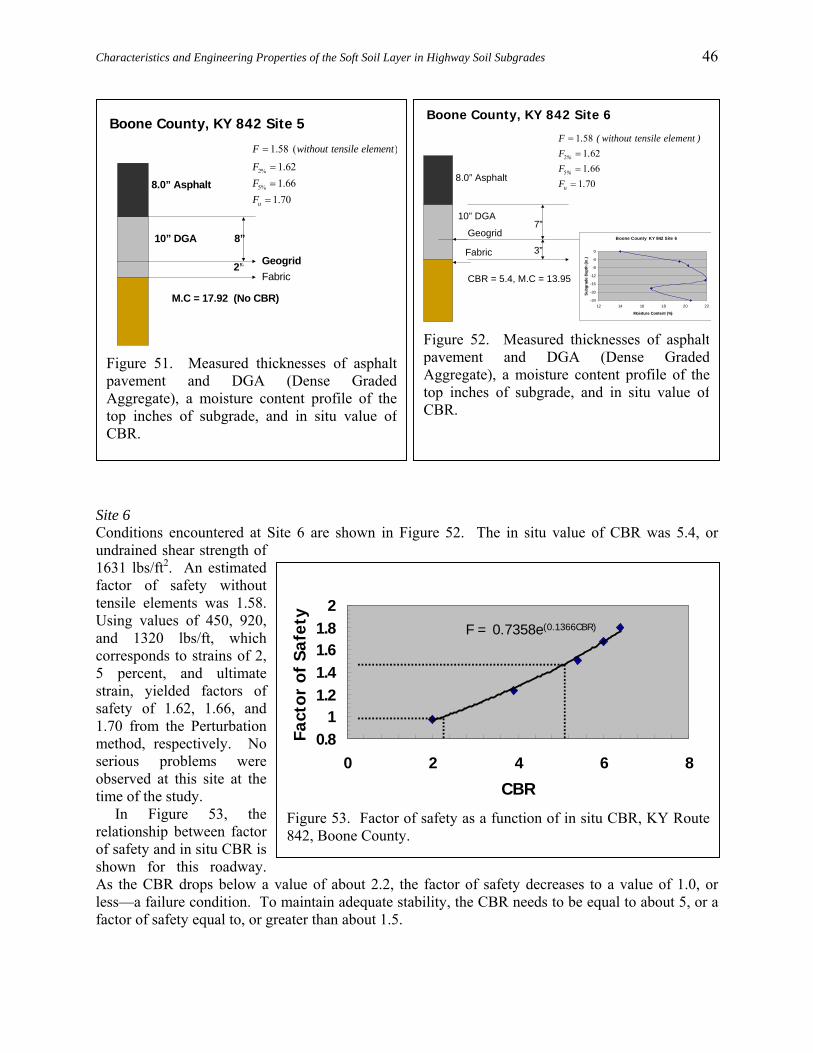
Characteristics and Engineering Properties of the Soft Soil Layer in Highway Soil Subgrades
46
Site 6 Conditions encountered at Site 6 are shown in Figure 52. The in situ value of CBR was 5.4, or undrained shear strength of 1631 lbs/ft2. An estimated factor of safety without tensile elements was 1.58. Using values of 450, 920, and 1320 lbs/ft, which corresponds to strains of 2, 5 percent, and ultimate strain, yielded factors of safety of 1.62, 1.66, and 1.70 from the Perturbation method, respectively. No serious problems were observed at this site at the time of the study. In Figure 53, the relationship between factor of safety and in situ CBR is shown for this roadway. As the CBR drops below a value of about 2.2, the factor of safety decreases to a value of 1.0, or less—a failure condition. To maintain adequate stability, the CBR needs to be equal to about 5, or a factor of safety equal to, or greater than about 1.5.
10” DGA
8.0” Asphalt
M.C = 17.92 (No CBR)
FabricGeogrid
8”
2”
Boone County, KY 842 Site 5
2%
5%
1.58 ( )
1.621.66
1.70u
F without tensile element
FFF
=
=
==
Figure 51. Measured thicknesses of asphaltpavement and DGA (Dense GradedAggregate), a moisture content profile of thetop inches of subgrade, and in situ value ofCBR.
0.81
1.21.41.61.8
2
0 2 4 6 8CBR
Fact
or o
f Sa
fety
F = 0.7358e(0.1366CBR)
Figure 53. Factor of safety as a function of in situ CBR, KY Route842, Boone County.
10” DGA
8.0” Asphalt
CBR = 5.4, M.C = 13.95
Fabric
Geogrid7”
3”Boone County KY 842 Site 6
-24
-20
-16
-12
-8
-4
0
12 14 16 18 20 22
Moisture Content (%)
Subg
rade
Dep
th (i
n.)
Boone County, KY 842 Site 6
2
5
1 581 621 66
1 70
%
%
u
F . ( without tensile element )F .F .F .
===
=
Figure 52. Measured thicknesses of asphaltpavement and DGA (Dense GradedAggregate), a moisture content profile of thetop inches of subgrade, and in situ value ofCBR.

Characteristics and Engineering Properties of the Soft Soil Layer in Highway Soil Subgrades
47
KY Route 461, Pulaski County Flexible Pavement Design Section
State Primary Route 461 was constructed in 1989. The study section begins at Mile Point 0.549 and ends at 5.409. The original design of the flexible pavement consisted of 10 inches of asphalt. The asphalt layer was constructed directly on top of a red clay subgrade without an aggregate base, as shown in Figure 54. This technique has been described as “full depth” construction. Maintenance problems on this stretch of roadway began about one year after construction. An asphalt overlay was constructed in 1997, or about 8 years later. Extensive contract patching was performed in 2004 or about 7 years after the construction of the overlay. This roadway has required continuous maintenance since it was constructed.
11.5” Asphalt
Overlay 1997
Constructed 1989
10.0” Asphalt
Contract Patching
2004
13.0” Asphalt
Pulaski County, KY 461
Untreated Subgrade
Figure 54. Original full-depth design sectioncompared to the overlay and patching sections.
10.0”Asphalt
State PrimaryConstructed 1989Overlay 1997Contract Patching 2004
Continuous Maintenance
Pulaski County, KY 461MP 3.0 -5.5
Red Clay Subgrade
Original Design
Figure 55. Original flexible pavement design section for KY Route 461 and a view of water andred clay from the subgrade that have flowed upward to the surface of the pavement.

Characteristics and Engineering Properties of the Soft Soil Layer in Highway Soil Subgrades
48
As shown in Figure 55, water and red clay from the subgrade have flowed upward due to the build-up of excess pore water pressure in the clayey subgrade as a result of traffic loadings and water flow. A cross sectional view of the fabric wrapped edge drains located at the site is shown in Figure 56. A close-up view of water standing in a ill hole is shown in Figure 57. Edge drains and “bleeder” drains, Figure 58, were constructed later at the site by maintenance personnel of the Kentucky Transportation Cabinet in attempt to dewater the pavement and soil subgrade. However, the flow upward of the red clayey subgrade materials and water were not redirected by the edge
drains as evident in Figures 55 through 58. Water was standing in the edge drains during this study.
Classification and Engineering Properties of Subgrade Subgrade soils were classified as clays and fat clays at this roadway section, as shown in Table 5. Based on the AASHTO Classification System, the soils were classified as A-6 (14) and A-7-6 (25-27). Based on the Unified Soil classification System (USCS), the soils were classified as CL and CH. The clay fraction of the subgrade soils, or the percent finer than the 0.002 mm size, ranged from 29 to 46 percent. Liquid and plasticity index ranged from about 40 to 57 and 22 to 34 percent, respectively. Specific gravity of the soils ranged from 2.64 to 2.79. Values of activity ranged from 0.6 to 1.0. Compacted soils of this classification are very subject to large decreases in bearing strengths when exposed to moisture strength.
Pulaski County, KY 461Patched in 2004
13.0” AC 9.0” AC
ShoulderMainline Water
Patch
Fabric WrappedPanel Drain
Figure 56. Cross sectional view of fabric wrapped panel drains.

Characteristics and Engineering Properties of the Soft Soil Layer in Highway Soil Subgrades
49
“Bleeder” Installed by Maintenance“Bleeder” Installed by Maintenance
Headwall for Edge DrainHeadwall for Edge Drain
Pulaski County, KY 461
Figure 58. View of headwall and “Bleeder” drain installed by maintenance personnel of the Kentucky Transportation Cabinet on KY Route 461.
13.0” AC 9.0” AC
ShoulderMainline Water
Red Clay Subgrade (Untreated)
Constructed 1989Overlay 1997Contract Patching 2004
Pulaski County, KY 461 Site 3 Patched in 2004
Figure 57. Drilled hole with standing water.

Characteristics and Engineering Properties of the Soft Soil Layer in Highway Soil Subgrades
50
Bearing Capacity Analyses of Selected Sites Site 1 Cross section of the flexible pavement at site 1 is shown in Figure 59. Pavement thickness ranged from about 11.5 to 12 inches. Water stains was observed at the cracking between the mainline and shoulder. The factor of safety at this location was about 1.21 for the section containing the overlay. Based on the in situ value of CBR of 3.8, the factor of safety of the original section of 10 inches was only 1.12–close to a failure condition when the pavement was constructed. Even with the overlay the pavement is near a failure state as indicated by the stability analyses. Moisture content of the subgrade ranged from 18.6 percent to slightly below 16 percent in the top 8 inches of the subgrade, as shown by a moisture content profile in Figure 59. Site 2 Conditions encountered at Site 2 are shown in Figure 60. Measured thickness of the pavement at the time of drilling was 13 inches. This included the overlay and the patching. The in situ CBR was 7.7. Moisture content of the upper 16 inches of the subgrade ranged from about 15 to 17.5 percent. Factor of safety at this location was 1.95. The moisture content of the top 4 inches of the subgrade, as shown by the moisture profile in Figure 60, ranges from about 17 to 19 percent. From a depth of 4 inches to about 12 inches, the
Pulaski County KY 461 Site 1 H-2
-8-7-6-5-4-3-2-10
15 16 17 18 19
Moisture Content (%)
Subg
rade
Dep
th (i
n.)
Constructed 1989Overlay 1997Contract Patching 2004
Pulaski County, KY 461 Site 1 (Not Patched in 2004)
11.5” Asphalt
CBR = 3.8, M.C = 18.64
F = 1.12 (Original Section)
F = 1.21
Figure 59. Cross section of pavement and a profile ofmoisture contents in the top of the subgrade at Site 1.
Table 5. Index and classification data, KY 461. Pulaski County.
Atterberg Limits
Classification Site and Hole No.
Liquid Limit
Plasticity Index
Clay Fraction
Percent
finer than 0.002
mm size
AASHTO USCS1
Specific Gravity
Activity
S1 H2 39.6 22.2 30 A-6 (14) CL 2.68 0.7 S3 H4 56.5 34.1 39 A-7-6 (27) CH 2.64 0.9 S4 H1 50.2 26.9 46 A-7-6 (25) CH 2.79 0.6 S4 H2 47.9 29.0 29.0 A-7-6 (25) CL 2.56 1.0
1. Unified classification System

Characteristics and Engineering Properties of the Soft Soil Layer in Highway Soil Subgrades
51
moisture content ranges from about 17 to 15 percent. From a depth of 12 inches to 18 inches the moisture content increases to 26 percent. The factor of safety of the initial depth of 10 inches of asphalt was 1.78. Site 3 The in situ value of CBR at site 3 was 3.2. As shown in the right-hand portion of Figure 61, the upper potion of the top 14 inches of the subgrade ranges from 25.8 at zero depth to about 12.0 percent at a depth of about 114 inches. Bearing capacity analysis at this site yielded a factor of safety of 1.03, based on the original pavement thickness of 10 inches. As shown in Figure 62, an intact asphalt core was not obtained during drilling. The core specimen completely fell apart during recovery. This condition was attributed to excessive amounts of water in the pavement (and large excess pore pressure buildup under heavy traffic loadings). Site 4 The in situ value of CBR at site 4 was 3.0. The moisture content profile is shown in Figure 63. The moisture content in the top 12 inches of the subgrade at site 4 ranged from about 22.4 percent to 23.6 percent. From a depth of 12 inches to 18 inches the moisture content increased from 22.4 percent to 31.3 percent. Bearing capacity analysis of the pavement using the original thickness of 10 inches was only 0.99. Based on this analysis, the pavement was near a state of failure when it was first constructed. Bearing Capacity Analysis After An Overlay and Extensive Patching The relationship between the in situ CBR and moisture content at the top of the subgrade is shown in Figure 64. As the moisture content of the top of the subgrade increases, the in situ CBR decreases. A summary of the subgrade CBR strengths, estimated undrained shear strengths, and factors of safety of the original pavement thickness, the pavement with the overlay, and the original pavement including the overlay and patching is presented in Table 6. The analyses were also performed assuming two different tire stresses (dual wheels) and assuming that a 12-inch layer of soil-hydrated lime had been used. In figure 65, the factors of safety of the original pavement thickness of 10
Pulaski County KY 461 Site 2 H-1
-18-16-14-12-10-8-6-4-20
0 5 10 15 20 25 30
Moisture Content (%)
Subg
rade
Dep
th (i
n.)
Constructed 1989Overlay 1997Contract Patching 2004
13.0” Asphalt
Pulaski County, KY 461 Site 2 Patched in 2004
CBR = 7.7, M.C = 17.5
F=1.95
Figure 60. Cross section of pavement and a profile ofmoisture contents in the top of the subgrade at Site 2.
13.0” AC
Constructed 1989Overlay 1997Contract Patching 2004
9.0” AC
Red Clay Subgrade(Untreated)
Pulaski County, KY 461 Site 3 Patched in 2004
Pulaski County KY 461 Site 3 H-4
-18-16-14-12-10
-8-6-4-20
10 15 20 25 30
Moisture Content (%)
Subg
rade
Dep
th (i
n.)
F=1.03
CBR = 3.2, M.C = 25.8
Figure 61. Cross section of pavement and a profile ofmoisture contents in the top of the subgrade at Site 3.

Characteristics and Engineering Properties of the Soft Soil Layer in Highway Soil Subgrades
52
0
2
4
6
8
10
15 20 25 30
Pulaski KY 461
In Situ Moisture Content (Percent)
In S
it u C
BR
Figure 64. In situ CBR as a function of moisturecontent.
F = 0.1543CBR + 0.5321
0.8
1
1.2
1.4
1.6
1.8
0 2 4 6 8 10
In Situ CBR
Fact
or o
f Saf
e ty,
F
Pulaski KY 461Original Full-Depth Design Thickness equals 11 inches
Figure 65. Factor of Safety as a function of in situ CBR.
13.0” Asphalt
CBR = 3.0, M.C = 23.1 CBR = 3.0, M.C = 23.1
Constructed 1989Overlay 1997Contract Patching 2004
Pulaski County KY 461 Site 4 H-2
-18-16-14-12-10
-8-6-4-20
22 24 26 28 30 32
Moisture Content (% )
Sub
grad
e D
epth
(in.
)
Pulaski County, KY 461, Site 4, Patched in 2004
F = 1.19
Figure 63. Cross section of pavement and a profile ofmoisture contents in the top of the subgrade at Site 4.
13.0” AC
Pulaski County, KY 461 Site 3 Patched in 2004
Difficult to obtain intact Asphalt Core
Figure 62. Asphalt core sample completely fell apartduring recovery.
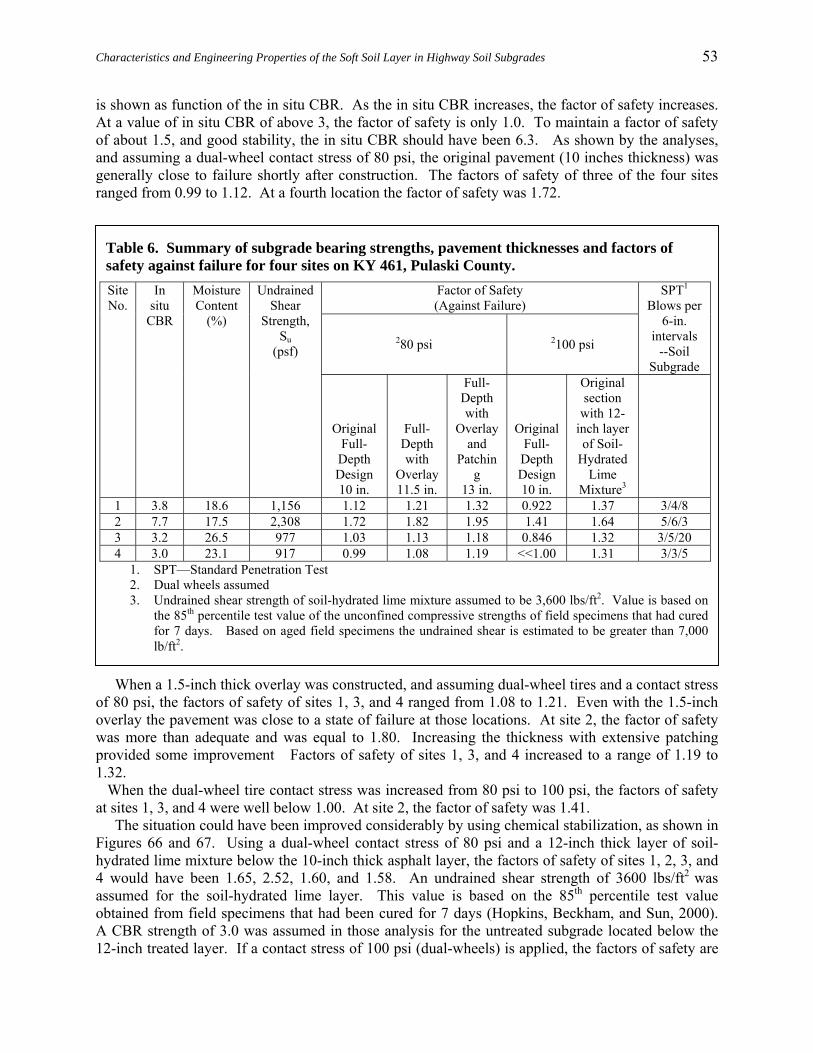
Characteristics and Engineering Properties of the Soft Soil Layer in Highway Soil Subgrades
53
is shown as function of the in situ CBR. As the in situ CBR increases, the factor of safety increases. At a value of in situ CBR of above 3, the factor of safety is only 1.0. To maintain a factor of safety of about 1.5, and good stability, the in situ CBR should have been 6.3. As shown by the analyses, and assuming a dual-wheel contact stress of 80 psi, the original pavement (10 inches thickness) was generally close to failure shortly after construction. The factors of safety of three of the four sites ranged from 0.99 to 1.12. At a fourth location the factor of safety was 1.72.
When a 1.5-inch thick overlay was constructed, and assuming dual-wheel tires and a contact stress of 80 psi, the factors of safety of sites 1, 3, and 4 ranged from 1.08 to 1.21. Even with the 1.5-inch overlay the pavement was close to a state of failure at those locations. At site 2, the factor of safety was more than adequate and was equal to 1.80. Increasing the thickness with extensive patching provided some improvement Factors of safety of sites 1, 3, and 4 increased to a range of 1.19 to 1.32. When the dual-wheel tire contact stress was increased from 80 psi to 100 psi, the factors of safety at sites 1, 3, and 4 were well below 1.00. At site 2, the factor of safety was 1.41. The situation could have been improved considerably by using chemical stabilization, as shown in Figures 66 and 67. Using a dual-wheel contact stress of 80 psi and a 12-inch thick layer of soil-hydrated lime mixture below the 10-inch thick asphalt layer, the factors of safety of sites 1, 2, 3, and 4 would have been 1.65, 2.52, 1.60, and 1.58. An undrained shear strength of 3600 lbs/ft2 was assumed for the soil-hydrated lime layer. This value is based on the 85th percentile test value obtained from field specimens that had been cured for 7 days (Hopkins, Beckham, and Sun, 2000). A CBR strength of 3.0 was assumed in those analysis for the untreated subgrade located below the 12-inch treated layer. If a contact stress of 100 psi (dual-wheels) is applied, the factors of safety are
Table 6. Summary of subgrade bearing strengths, pavement thicknesses and factors of safety against failure for four sites on KY 461, Pulaski County.
Factor of Safety (Against Failure)
280 psi 2100 psi
SPT1 Blows per
6-in. intervals
--Soil Subgrade
Site No.
In situ
CBR
Moisture Content
(%)
Undrained Shear
Strength, Su
(psf)
Original Full-
Depth Design 10 in.
Full-Depth with
Overlay 11.5 in.
Full-Depth with
Overlay and
Patching
13 in.
Original Full-
Depth Design 10 in.
Original section
with 12- inch layer of Soil-
Hydrated Lime
Mixture3
1 3.8 18.6 1,156 1.12 1.21 1.32 0.922 1.37 3/4/8 2 7.7 17.5 2,308 1.72 1.82 1.95 1.41 1.64 5/6/3 3 3.2 26.5 977 1.03 1.13 1.18 0.846 1.32 3/5/20 4 3.0 23.1 917 0.99 1.08 1.19 <<1.00 1.31 3/3/5
1. SPT—Standard Penetration Test 2. Dual wheels assumed 3. Undrained shear strength of soil-hydrated lime mixture assumed to be 3,600 lbs/ft2. Value is based on
the 85th percentile test value of the unconfined compressive strengths of field specimens that had cured for 7 days. Based on aged field specimens the undrained shear is estimated to be greater than 7,000 lb/ft2.

Characteristics and Engineering Properties of the Soft Soil Layer in Highway Soil Subgrades
54
1.37, 1.64, 1.32, and 1.31, respectively. Hence, initially, and based on the seven-day strength of the treated subgrade, the pavement would have been stable even when the tire stress is 100 psi. In Figure 66, the factors of safety of two different pavement sections are compared. The section on the left-hand portion of the figure is the original design and consists of 10-inches of bituminous pavement resting on the clayey subgrade. A CBR value of 3 was assumed for the untreated clayey layer. The calculated factor of safety of the original design (“full-depth”) was 0.99—a failure condition. The section in the right-hand portion of the figure is hypothetical and assumes that the original 10-inch asphalt layer had been constructed on a 12-inch layer of soil-hydrated lime subgrade. The 7-day undrained shear strength at the 85th percentile test value (Hopkins 1991) of soil-hydrated lime subgrades is about 3456 lbs/ft2 (Hopkins, Beckham, and Hunsucker, 1995). Based on this value, the minimum factor of safety of the section in the right-hand portion of figure was 1.58. In situ CBR measurements of highway soil- hydrated lime subgrades that had aged from 8 to 15 years showed that the CBR at the 85th percentile test was 27. Converting this value to undrained strength, the treated subgrade has an estimated value of about 7800 lbs/ft2. The factor of safety is 2.52. Bearing capacity analysis was also performed to examine the hypothetical situation of using an asphalt thickness of less than the original 10 inches constructed on 12-iches of soil-hydrated lime subgrade. As shown in Figure 67, the factor of safety of the section on the right-hand portion of the figure, which consists of only 7 inches of bituminous asphalt resting on 12 inches of soil-hydrated lime subgrade, ranges from 1.45 to 2.45 and is much greater than the original design. That section consists is 3 inches less than the original design of 3 inches. It is 6 inches less than the thickness of 13 inches which includes the two overlays. Hence, the section consisting of 7 inches of asphalt resting on 12 inches of treated subgrade is much more economical.
10.0” Asphalt
10.0” Asphalt
12.0” Soil-Hydrated
Lime
F = 0.99 F = 1.58—2.52
CBR = 27
CBR = 3
Pulaski County, KY 461
10.0” Asphalt
10.0” Asphalt
12.0” Soil-Hydrated
Lime
F = 0.99 F = 1.58—2.52
CBR = 27
CBR = 3
Pulaski County, KY 461
Untreated Soil SubgradeO
rigi n
al D
esig
n
Figure 66. Comparison of the factor of safety of theoriginal design section and the factor of safety of theasphalt layer resting on a soil-hydrated lime.
Orig
inal
Des
i gn 10.0” Asphalt
F = 0.99 F = 1.45-2.45
7.0” Asphalt
12.0” Soil-Hydrated
Lime
Untreated Soil SubgradeCBR = 3
7.0” Asphalt
12.0” Soil-Hydrated
Lime
Untreated Soil SubgradeCBR = 3
Pulaski County, KY 461
CBR = 11.5 to 27
Figure 67. Factors of Safety of the original full-depthflexible pavement section and a hypothetical designsection using 12 inches of soil-hydrated lime subgrade.

Characteristics and Engineering Properties of the Soft Soil Layer in Highway Soil Subgrades
55
KY Route 561, Franklin County This study section, Figure 68, is located in Franklin County on KY Route 561. The section extends from Mile Point 0 to Mile Point 0.5. An overlay was constructed in 1996 and the section has required continuous maintenance to make the roadway passable. Although an overlay was placed in 1996, the roadway contains numerous “punching” failures, especially along centerline. In situ CBR tests were performed on the clayey subgrade.
Classification and Engineering Properties of Subgrade Index properties of subgrade soils of KY route 561 are summarized in Table 7. Subgrade soils of this roadway were classified as CH and A-6 (10-41) using the Unified and AASHTO Soil Classification Systems, respectively. The clay size fraction of the soils (percent finer than the 0.002 mm particle size) ranged from 25 to 53 percent. Liquid and plasticity index of the subgrade soils ranged from about 60 to 76 and 35 to 45 percent, respectively. Specific gravity ranged from 2.68 to 2.82. The engineering properties of this highway section were very poor.
Bearing Capacity Analyses of Selected Sites
Site 1, Hole 3 This section of pavement at this hole is depicted in Figure 69 and consisted of 5 inches of asphalt pavement resting on about 5 inches of DGA. The top of the clayey subgrade had intruded into the bottom of the DGA layer. The in situ CBR at this hole was 6.8. The factor of safety obtained from
Rural SecondaryOverlay 1996Lot of Maintenance
Franklin County, KY 561MP 0 – to 0.5
Figure 68. A view of KY Route 561 in Franklin County.
Table 7. Summary of index properties of subgrade soils of KY Route 561.
Sample ID LL (%)
PL (%)
PI (%)
Percent
Classification
Gravel Sand Silt Clay AASHTO (GI)
Unified
Hole 1 60.3 25.7 34.6 9 28 16 47 A-7-6(20) CH Hole 7 65.4 29.7 35.7 2 23 25 50 A-7-6(29) CH Hole 9 69.1 26.9 42.3 2 14 31 53 A-7-6(39) CH
Hole 11 59.5 24.1 35.4 0 5 42 53 A-7-6(41) CH Hole 12 73.2 28.7 44.6 31 29 14 25 A-7-6(10) CH
Holes 15, 16 76.0 37.5 38.5 7 31 22 40 A-7-6 (28) CH

Characteristics and Engineering Properties of the Soft Soil Layer in Highway Soil Subgrades
56
the Perturbation bearing capacity analysis was 1.56. Hole 3 (as well as holes 1 and 2) is located adjacent to a failed area near centerline of the northbound lane. Site 2, Hole 5 Conditions encountered at site 2 and Hole 5 are shown in Figure 70. This hole and holes 4 and 6 were drilled in a failed area and only 4 inches of asphalt was measured at this location. No rock base –DGA—was observed. The in situ CBR was very low and the value was 2.0. The factor of safety was much less than 1.0. Even if the in situ value of CBR had been 4.3, the factor of safety would
have only been 0.99. As shown in the right-hand portion of Figure 70 the top of the subgrade is very wet and the moisture content in the top 4 inches ranges from about 28 percent to only about 2 percent (DGA was mixed with the clay). At this location, a lot of maintenance has been required. Site 3, Hole 10 Core Holes 8, 9, and 10 were generally in a good area of the pavement. Moisture content increased from a value of slightly more than about 25.4 percent at the top of the subgrade to about 30 percent some 7 inches below the top of the subgrade (Figure 71). The asphalt layer at this location measured about 10 inches. The DGA layer was 4 inches. However, the in situ CBR measured in Hole 10 was only 1.5. The factor of safety was less than 1.0, although the pavement appeared to be stable. If the in situ CBR value had been 2.5, then the factor of safety would have been 1.07.
7.0” Asphalt
CBR =6.8, M.C = 28.1%(DGA embedded in top inch of soil subgrade)SPT:2/3/7
Hole 3 Good Area(Adjacent to failed area at centerline)
5” DGA
F = 1.56
-18-16-14-12-10-8-6-4-20
25 26 27 28 29 30 31 32
Dep
th (i
nche
s)
Moisture Content (%)
Hole-1
Franklin County, KY 561—Rural Secondary
Figure 69. Pavement profile at site 1 and Holes 3 and 1.

Characteristics and Engineering Properties of the Soft Soil Layer in Highway Soil Subgrades
57
Site 4, Hole 11 Hole 11 was drilled in a failed area of the pavement. The asphalt layer measured about 8-10 inches (Figure 72). The top of the subgrade in this area was very wet. In an adjacent hole (12) the top of subgrade consisted of very wet, green clay while the bottom portion was very wet, brown clay. Values of moisture contents of a hole nearby (14) of the subgrade ranged from about 29.5 to 33.3 percent. Values of SPT in nearby holes, 13 and 14, were 5/1/2 and 0/1/3, respectively. In the latter hole, the hammer sunk under its weight. Factor of safety obtained from the Perturbation Method was only 0.86 or less. Site 5, Hole 17 Drill holes at this site were located in a failed area of the pavement. The asphalt layer at this site measured about 4 inches (Figure 73). The DGA base aggregate measured 6 inches. The in situ CBR of the soil subgrade in Hole 17 was 3.7. The moisture content of the top of the subgrade was 24.5 percent. The in situ CBR of the top of the subgrade was 3.7. The factor of safety was 0.98. Site 6, Hole 20 Drill holes at this site were drilled in a good portion of the flexible pavement. The in situ value of CBR was 5.3 and the moisture content of the top portion the soil subgrade was 20.9, which was lower than moisture contents observed at other sites of the study section (Figure 74). The factor of safety of this location was 1.25.
4.0” Asphalt BrokenCBR = 2.0, M.C = 27.7
Hole 5 Failed Area
Franklin County KY 561 H-6
-18-16-14-12-10
-8-6-4-20
0 5 10 15 20 25 30
Moisture Content (%)
Dept
hn (i
n.) gravel
Franklin County, KY 561—Rural Secondary
Failed Area
Overlay 1996Required a Lot of Maintenance
F <<<< =1.0 @ In Situ CBR = 2.0F =0.99 @ CBR = 4.3
No DGA to 4”; Pushed into subgrade?
Figure 70. Conditions at site 2 and holes 5 and 6.

Characteristics and Engineering Properties of the Soft Soil Layer in Highway Soil Subgrades
58
8-10” Asphalt
CBR = 3.2, M.C = 24.5%(No DGA)
Rural SecondaryOverlay 1996
Hole 11 Failed AreaF =0.86 to F<0.86
-12
-10
-8
-6
-4
-2
0
29 30 31 32 33 34
H-14
Dep
th (i
n.)
Moisture Content (%)
Franklin County, KY 561
Figure 72. View of pavement conditions at site 4 andHoles 11 and 14.
10.0” Asphalt
CBR = 1.5, M.C = 25.4%
Rural SecondaryOverlay 1996
Hole 10 Good Area
4” DGA
Franklin County KY 561 H-8
-7
-6
-5
-4
-3
-2
-1
0
25 26 27 28 29 30 31
Moisture Content (%)
Dep
thn
(in.)
Franklin County, KY 561
F < 1.0
Figure 71. Conditions at site 3 and holes 8, 9, and 10.
5.0” Asphalt, Broken
CBR = 5.3, M.C = 20.9%
Rural SecondaryOverlay 1996
Hole 20 Good Area
7” DGA
F=1.25
Franklin County, KY 561
-14-12-10
-8-6-4-2
0
20 22 24 26 28 30 32 34
H-19 --SPT: 7/2/3
Dep
th (i
n.)
Moisture Content (%)
Figure 74. Conditions at site 6 and holes 18, 19, and 20.
6.0” Asphalt, Broken
CBR = 3.7, M.C = 24.4%
Rural SecondaryOverlay 1996
Hole 17 Failed Area
4” DGA
Franklin County KY 561 H-15
-18-16-14-12-10
-8-6-4-20
24 26 28 30 32
Moisture Content (%)
Dep
thn
(in.)
F= 0.98
Franklin County, KY 561
Figure 73. Conditions at site 5 and Holes 15, 16, and 17.
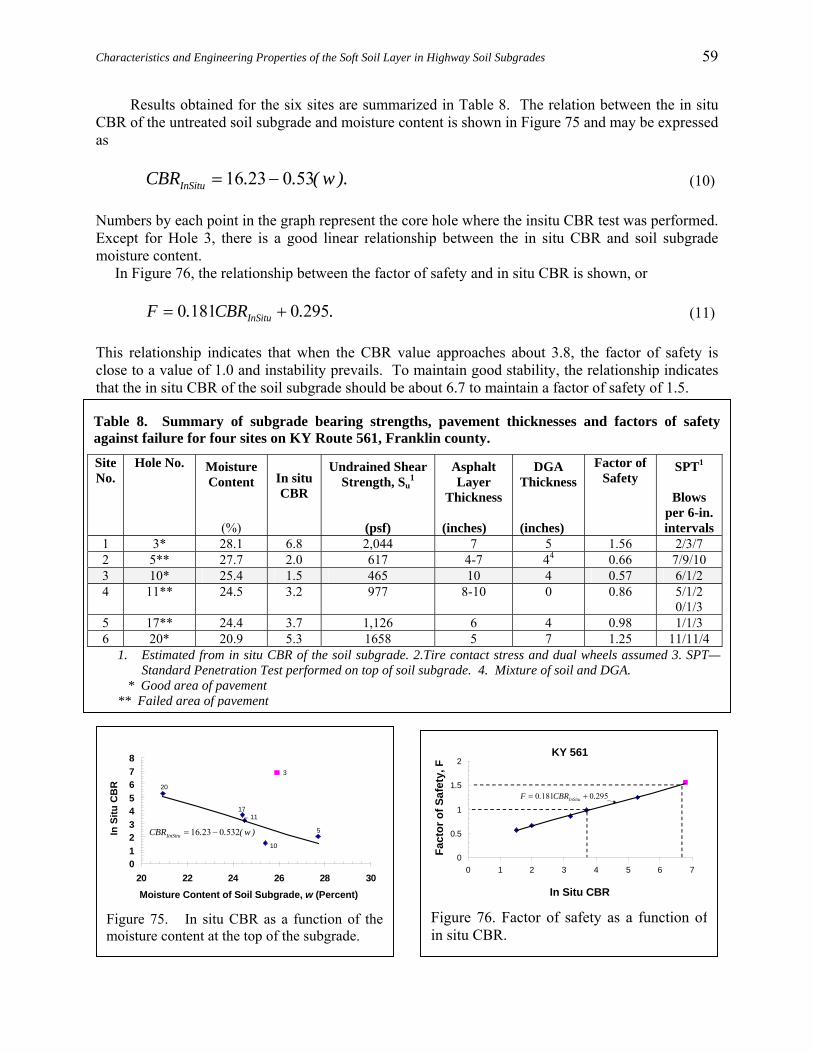
Characteristics and Engineering Properties of the Soft Soil Layer in Highway Soil Subgrades
59
Results obtained for the six sites are summarized in Table 8. The relation between the in situ CBR of the untreated soil subgrade and moisture content is shown in Figure 75 and may be expressed as
16 23 0 53InSituCBR . . ( w ).= − (10)
Numbers by each point in the graph represent the core hole where the insitu CBR test was performed. Except for Hole 3, there is a good linear relationship between the in situ CBR and soil subgrade moisture content. In Figure 76, the relationship between the factor of safety and in situ CBR is shown, or
0 181 0 295InSituF . CBR . .= + (11)
This relationship indicates that when the CBR value approaches about 3.8, the factor of safety is close to a value of 1.0 and instability prevails. To maintain good stability, the relationship indicates that the in situ CBR of the soil subgrade should be about 6.7 to maintain a factor of safety of 1.5.
Table 8. Summary of subgrade bearing strengths, pavement thicknesses and factors of safety against failure for four sites on KY Route 561, Franklin county.
Site No.
Hole No. Moisture Content
(%)
In situ CBR
Undrained Shear Strength, Su
1
(psf)
Asphalt Layer
Thickness (inches)
DGA Thickness (inches)
Factor of Safety
SPT1
Blows per 6-in. intervals
1 3* 28.1 6.8 2,044 7 5 1.56 2/3/7 2 5** 27.7 2.0 617 4-7 44 0.66 7/9/10 3 10* 25.4 1.5 465 10 4 0.57 6/1/2 4 11** 24.5 3.2 977 8-10 0 0.86 5/1/2
0/1/3 5 17** 24.4 3.7 1,126 6 4 0.98 1/1/3 6 20* 20.9 5.3 1658 5 7 1.25 11/11/4
1. Estimated from in situ CBR of the soil subgrade. 2.Tire contact stress and dual wheels assumed 3. SPT—Standard Penetration Test performed on top of soil subgrade. 4. Mixture of soil and DGA.
* Good area of pavement ** Failed area of pavement
012345678
20 22 24 26 28 30
16 23 0 532IinSituCBR . . ( w )= −In S
itu C
BR
ω
Moisture Content of Soil Subgrade, w (Percent)
3
5
10
1711
20
Figure 75. In situ CBR as a function of themoisture content at the top of the subgrade.
0
0.5
1
1.5
2
0 1 2 3 4 5 6 7
0 181 0 295InSituF . CBR .= +
In Situ CBR
Fact
or o
f Saf
ety,
F
KY 561
Figure 76. Factor of safety as a function ofin situ CBR.

Characteristics and Engineering Properties of the Soft Soil Layer in Highway Soil Subgrades
60
Irvine Bypass, KY route 499, Estill County Introduction Construction of the Irvine Bypass in Estill County, an extension of existing KY Route 499, was completed in September 2000. The route is a connector between KY Routes 52 and 89 (Mile Point 7.741 to 9.215) northwest of Irvine as shown in Figure 77. The resident engineer and construction inspectors with the Kentucky Transportation Cabinet, indicated pavement swell (or heave) was observed during construction and has continued since. One pavement section on the northeast end was rebuilt due to swell before construction was complete. The Kentucky Transportation Cabinet requested that the Kentucky Transportation Center investigate the swelling pavement as a part of an ongoing research study examining the effect of saturated subgrades on pavement quality.
The roadway was constructed in areas where the Crab Orchard shale formation is the predominant bedrock. This formation is notorious for causing highway problems such as excessive embankment
Test Areas
Figure 77. Site Map (from Kentucky Transportation Cabinet Division of Planning InteractiveMapping Web Site)

Characteristics and Engineering Properties of the Soft Soil Layer in Highway Soil Subgrades
61
settlement, cut and fill slope failures, and swelling when exposed to moisture. Swelling problems associated with Crab Orchard shale had occurred before on I-64 in Bath County (Hopkins, et al 1973) and KY 9 in Lewis County. The pavement was removed and the shale fill and subgrade were excavated and replaced with several feet of crushed stone at the I-64 site. Embankment and cut slope problems have been reported in highways constructed where Crab Orchard shale is present. Soils formed from the Crab Orchard shale have very poor engineering properties. Cut slope problems and pavement swelling are also occurring on I-265 in Jefferson County where the New Providence shale formation is the predominant bedrock. The New Providence shale is similar to the Crab Orchard shale and both types of clay shales exhibit very poor engineering properties. The geotechnical report prepared for the project and issued by the Kentucky Transportation Cabinet’s Division of Materials Geotechnical Branch (Molen 1997) recommended subgrade lime stabilization because of the low CBR (soaked) values associated with the soils. Five out of eight CBR samples tested had CBR values of 1 percent or less, six out of eight had two percent or less, and 7 of 8 had 3 or less. Only one CBR sample was greater than 3 and that value was only 5 percent. Hydrated lime stabilization was used on most of the project. . Initial results from laboratory CBR tests are shown in Figure 78. The percentile test value as a function of CBR laboratory tests is shown in Figure 79. At the 85th percentile test value the CBR value is only 1. Normally the 85th percentile test value is an acceptable selection for pavement design. Past research (Hopkins 1991) has recommended using chemical stabilization to improve CBR strength when the CBR value is less than about 6. The use of chemical stabilization (hydrated lime) was fully justified in this case. Lime and other types of chemical stabilization have been used to improve the bearing capacity of highway subgrades for many years. The roadway was constructed through an area where the Crab Orchard Shale formation, shale with very poor engineering properties, is the predominant bedrock type. The New Albany shale is also present. Both of these formations contain pyrite, but the New Albany shale contains more pyrite, and possibly, other sulfur bearing minerals than the Crab Orchard Shale. Oxidation of the sulfur compounds may produce sulfates that can react with calcium, which is present in the hydrated lime, and cause swelling.
CBR Percentile KY 499 Estill County
020406080
100
0 1 2 3 4 5
Perc
entil
e Te
st v
alue
CBR
Figure 79. Percentile test value as a function of CBRvalues from the geotechnical report
0
1
2
3
4
0.6 1 2 3 5N
umbe
r of T
ests
CBR
Figure 78. CBR values from geotechnical report.

Characteristics and Engineering Properties of the Soft Soil Layer in Highway Soil Subgrades
62
Portland cement was used to stabilize the subgrade where KY 89 was relocated to intersect the new route, and on a small reconstructed section on the northeast end of KY 499. Lime kiln dust was used for subgrade stabilization at both bridge approaches Field Testing and Observations Field and laboratory investigations were performed to determine the cause of the pavement swelling. There was some concern that swelling may be caused by a reaction of sulfates in the bedrock with calcium in the hydrated lime admixture. Pavement swelling has occurred in the past when byproducts containing sulfates and hydrated lime were used as a subgrade chemical stabilizer. Swelling problems have been reported in other states where hydrated lime was used to stabilize soils containing sulfates. It was also believed the swell may also be due to the poor engineering properties of the Crab Orchard shale, or a combination of both. Field-testing was performed in cut sections where most of the swelling was observed during the initial field reconnaissance. The areas of pavement swelling were humps that measured a few inches in height. Generally, the humped areas occurred perpendicular to the roadway alignment in cut sections. Swelling was also noticed in cut sections parallel to the roadway at the shoulder drainage ditch interface (right side of photo in Figure 80). Standing water was observed in drainage ditches on both sides of the road at the central test site. The ditch was not effective due to slumping of the cut slopes and swelling from the shoulders. Drainage was better at the other two sites (the two on each end). These drainage ditches were on steeper grades and constructed with channel lining. After completion of field-testing by the University of Kentucky Transportation Center (UKTC)
Pavement swell perpendicular to roadway
Swell parallel to roadwayalong edge of shoulder
Figure 80. Photographs of observed swell.

Characteristics and Engineering Properties of the Soft Soil Layer in Highway Soil Subgrades
63
personnel in December of 2004, the pavement was milled in areas where swelling was observed to be the most severe. Field investigations consisted of obtaining cores of the asphalt pavement to determine actual thickness. Standard penetration tests were performed to determine the thickness of the aggregate base and stabilized subgrade. In situ field California Bearing Ratio (CBR) tests were performed near the top of the hydrated lime stabilized subgrades and on the soil below the stabilized layer. Testing was performed at three locations. Two of the locations were north of the Kentucky River, in cut sections, where swelling was large. The third location was in a cut section south of the Kentucky River, where swelling was observed, but did not appear to be as large as observed in the northern locations. The approximate test locations are shown in Figure 77. Subgrade samples were obtained for laboratory testing and chemical analysis. The lowest field CBR values obtained on top of the soil-hydrated lime subgrade were 47.1 and 50.6 percent at the two locations north of the Kentucky River. A CBR test conducted on the subgrade below the stabilized layer was only 2.2 percent. The stabilized subgrade and layer below the stabilized subgrade at the site south of the Kentucky River were 24.2 and 2.0 percent, respectively. At all locations, the in situ CBR tests show that hydrated lime stabilization was very effective in improving the subgrade bearing capacity. CBR values of the stabilized subgrade were some 12 to 23 times larger than the untreated subgrade. Results from field CBR tests are shown in Figure 81. It should be noted that both the untreated shales and the treated subgrade were exposed to the same moisture conditions and time. However, the CBR values of the treated layer are about 12 to 25 times greater than the CBR value of the untreated layer of shale and soil located below the treated layer. Pavement thickness was determined from asphalt cores and standard penetration tests. Thickness of the asphalt concrete pavement north of the Kentucky River was 11.5 inches. The Dense Graded Aggregate (DGA) base was 3.5 to 4 inches thick, and the hydrated lime stabilized subgrade was 12 inches thick. The subgrade north of the river was constructed with green shale. At the site located south of the river, the asphalt and DGA thicknesses were the same as north of the river. The stabilized subgrade was thinner, about eight inches thick. Pavement sections are summarized in Figure 81. Thickness of the stabilized subgrade was determined by applying phenolphthalein solution to standard penetration test samples immediately after they were obtained. Phenolphthalein is a clear liquid indicator that turns red or pink in a high pH environment, which is the case for hydrated lime stabilized subgrades. A view of a split spoon specimen after application of the phenolphthalein solution and coloration of soil-hydrated lime core specimen is shown in Figure 82.
11.5” Asphalt
Average CBR = 49.8%M.C = 15.6%
North Side of KY River 2 Test Locations
3.5- 4.0” DGA
12.0” Stabilized Subgrade
CBR = 2.2%M.C = 22.3%
Shale
11.5” Asphalt
CBR = 24.2%M.C = 14.0%
South Side of KY River 1 Test Location
3.5 – 4.0” DGA
8.0” Stabilized Subgrade
CBR = 2.0%M.C = 23.1%
Soil-Shale
Pavement Sections: Estill County, KY 499
Figure 81. Pavement sections and in place CBR values andmoisture contents.

Characteristics and Engineering Properties of the Soft Soil Layer in Highway Soil Subgrades
64
Settlement points were established at the three test locations after the pavement was milled. Points were set at one-foot intervals across the roadway, perpendicular to the alignment. Elevations will be obtained periodically to determine the rate of swelling. Initial elevations and some subsequent data has been obtained but is not sufficient to predict swell rates. Changes in elevations are being monitored with conventional surveying methods and with survey grade global positioning system (GPS) equipment. No swelling patterns have been established to date. Hopefully, the point locations can be reestablished using the GPS equipment if they are destroyed by pavement milling or patching. Laboratory Tests CBR and Swell Tests Moisture-density relations and CBR tests were performed on disturbed samples of the shale and on a shale sample mixed with five percent (by dry mass) hydrated lime. The tests were performed following procedures used by the Kentucky Transportation Cabinet, Division of Materials, Geotechnical Branch, except the soaking periods of the CBR specimens were longer than specified by their CBR standard testing procedure. CBR tests were allowed to soak longer than the time specified by the standard procedure for two reasons:
1. The specimen, which was only shale, continued swelling beyond the 14-day maximum soaking period specified by the standard procedure, and
2. Any delay in swelling, which may occur (especially in the shale-hydrated lime sample),
needed to be measured.
There was some concern that the shale-hydrated lime sample may have a delayed time period of swelling due to sulfates in the soil reacting with calcium present in the hydrated lime. Previous research (Hopkins et al. 1988, Hunsucker et al. 1993) has shown a delayed swell period occurs when soil is mixed with hydrated lime and materials containing sulfates.
Compacted Crab Orchard
ShaleSoil-Hydrated Lime Subgrade
Top of Treated layer
SPT Split-Spoon SamplerPhenolphthalein Solution Indicator
12 inches ≈ 12 inches ≈
Figure 82. Photograph of phenolphthalein indicator applied tohydrated lime stabilized soil.

Characteristics and Engineering Properties of the Soft Soil Layer in Highway Soil Subgrades
65
Both CBR specimens were soaked for a total of 18 days--the time required for the non-stabilized sample to stop swelling. Values obtained from the (soaked) CBR tests were 0.8 and 20.6 percent for the shale and shale-hydrated lime mixture, respectively. Those test values confirmed CBR measurements in the field. In situ values of CBR obtained for the hydrated-lime-compacted shale subgrade were 24.2, 47.1, and 50.6. In situ values of the compacted shale were only 2.0 and 2.2. Chemical stabilization using hydrated lime vastly improved the bearing strength of the clayey shale subgrade. Swell of the compacted shale sample was almost 20 percent of the original sample height while swell of the compacted shale-hydrated lime sample was only about three percent, as shown in Figure 83.
Both samples had the same surcharge mass during soaking (17.8 lbs.) which created a surcharge pressure of 0.63 psi on both samples. Swell was plotted against the log of time in hours to determine when primary swell had stopped for the two samples (Figure 84). Primary swell stopped after about (7 days) for the compacted shale specimen, as shown in Figure 84. Primary swell in the compacted shale-hydrated lime specimen occurred in less than about 1.5
days and was very small (about 3 percent). However, secondary swell of the compacted shale specimen continued after primary swell while the secondary swell of the compacted shale-hydrated lime ceased after completion of primary swell, that is, secondary swell was zero.
Swell Pressure Tests Swell pressure tests were also performed on the compacted shale and shale-hydrated lime mixture. The procedures used to perform these tests are described here because it is not a standard referenced procedure. The samples were mixed and compacted to 95 percent of maximum dry density at optimum moisture content to simulate initial compaction. Field compaction specifications require a minimum of ninety five percent maximum dry density and ± two percent of optimum moisture content. The specimens were compacted in a CBR mold with a perforated bottom to allow moisture penetration. A load cell was placed between the swell plate and a metal beam attached to a frame holding the mold containing the compacted soil sample. Two of the swell pressure tests were placed
Swell versus Time
0
5
10
15
20
0 5 10 15 20Sw
ell (
Per
cent
)
Time (Days)
Compacted Hydrated lime-Shale Mixture
Compacted Shale
Figure 83. Swell versus time, KY CBR test samples.
Swell versus Time
00.20.40.60.8
1
0.001 0.01 0.1 1 10 100
Swel
l (in
ches
)
Time (Hours)
Secondary Swell
Primary Swell
Shale
Shale-Lime
Figure 84. Swell (in percent) as a function of thelogarithm of time
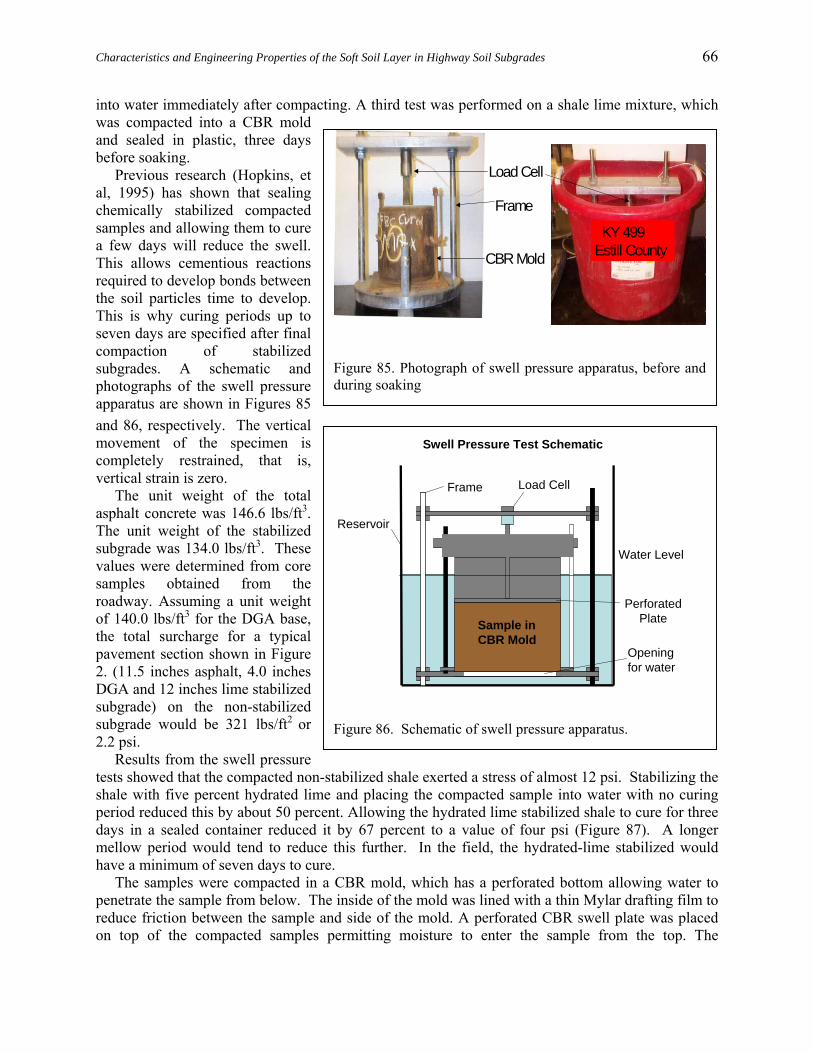
Characteristics and Engineering Properties of the Soft Soil Layer in Highway Soil Subgrades
66
into water immediately after compacting. A third test was performed on a shale lime mixture, which was compacted into a CBR mold and sealed in plastic, three days before soaking. Previous research (Hopkins, et al, 1995) has shown that sealing chemically stabilized compacted samples and allowing them to cure a few days will reduce the swell. This allows cementious reactions required to develop bonds between the soil particles time to develop. This is why curing periods up to seven days are specified after final compaction of stabilized subgrades. A schematic and photographs of the swell pressure apparatus are shown in Figures 85 and 86, respectively. The vertical movement of the specimen is completely restrained, that is, vertical strain is zero. The unit weight of the total asphalt concrete was 146.6 lbs/ft3. The unit weight of the stabilized subgrade was 134.0 lbs/ft3. These values were determined from core samples obtained from the roadway. Assuming a unit weight of 140.0 lbs/ft3 for the DGA base, the total surcharge for a typical pavement section shown in Figure 2. (11.5 inches asphalt, 4.0 inches DGA and 12 inches lime stabilized subgrade) on the non-stabilized subgrade would be 321 lbs/ft2 or 2.2 psi. Results from the swell pressure tests showed that the compacted non-stabilized shale exerted a stress of almost 12 psi. Stabilizing the shale with five percent hydrated lime and placing the compacted sample into water with no curing period reduced this by about 50 percent. Allowing the hydrated lime stabilized shale to cure for three days in a sealed container reduced it by 67 percent to a value of four psi (Figure 87). A longer mellow period would tend to reduce this further. In the field, the hydrated-lime stabilized would have a minimum of seven days to cure. The samples were compacted in a CBR mold, which has a perforated bottom allowing water to penetrate the sample from below. The inside of the mold was lined with a thin Mylar drafting film to reduce friction between the sample and side of the mold. A perforated CBR swell plate was placed on top of the compacted samples permitting moisture to enter the sample from the top. The
Load Cell
CBR Mold
Frame
KY 499 Estill County
Figure 85. Photograph of swell pressure apparatus, before andduring soaking
Load CellFrame
Perforated Plate
Water Level
Reservoir
Opening for water
Swell Pressure Test Schematic
Sample in CBR Mold
Figure 86. Schematic of swell pressure apparatus.
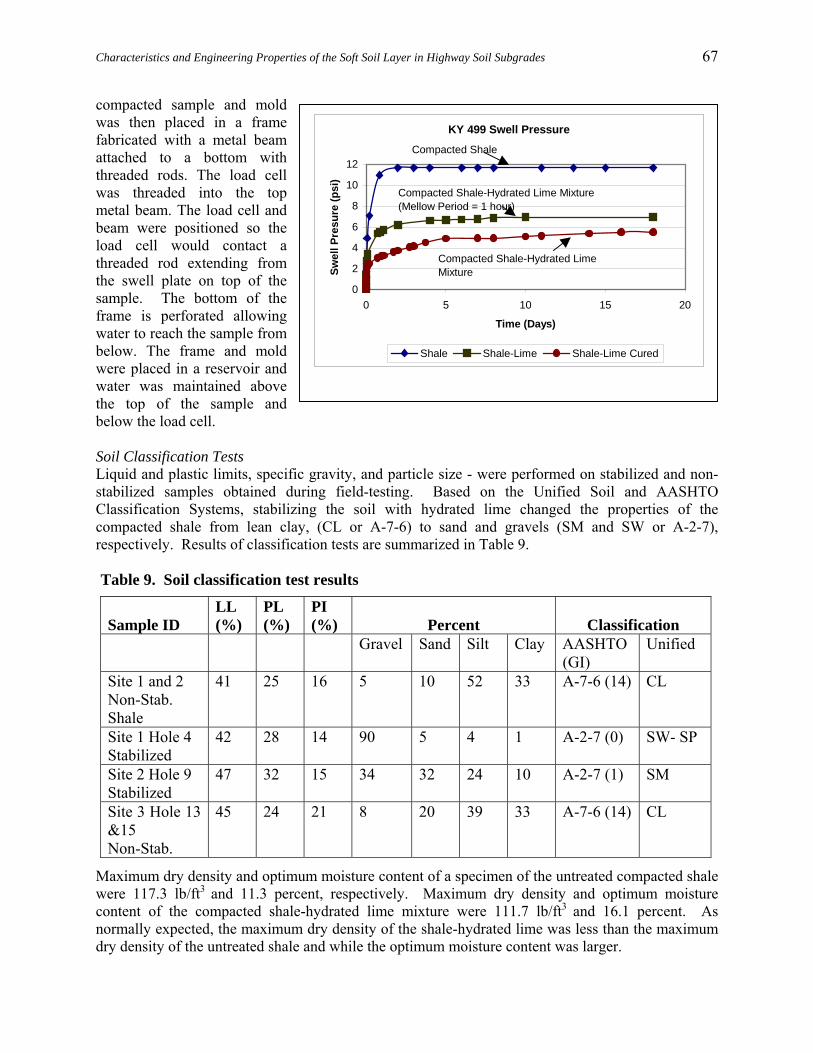
Characteristics and Engineering Properties of the Soft Soil Layer in Highway Soil Subgrades
67
compacted sample and mold was then placed in a frame fabricated with a metal beam attached to a bottom with threaded rods. The load cell was threaded into the top metal beam. The load cell and beam were positioned so the load cell would contact a threaded rod extending from the swell plate on top of the sample. The bottom of the frame is perforated allowing water to reach the sample from below. The frame and mold were placed in a reservoir and water was maintained above the top of the sample and below the load cell. Soil Classification Tests Liquid and plastic limits, specific gravity, and particle size - were performed on stabilized and non- stabilized samples obtained during field-testing. Based on the Unified Soil and AASHTO Classification Systems, stabilizing the soil with hydrated lime changed the properties of the compacted shale from lean clay, (CL or A-7-6) to sand and gravels (SM and SW or A-2-7), respectively. Results of classification tests are summarized in Table 9.
Maximum dry density and optimum moisture content of a specimen of the untreated compacted shale were 117.3 lb/ft3 and 11.3 percent, respectively. Maximum dry density and optimum moisture content of the compacted shale-hydrated lime mixture were 111.7 lb/ft3 and 16.1 percent. As normally expected, the maximum dry density of the shale-hydrated lime was less than the maximum dry density of the untreated shale and while the optimum moisture content was larger.
Table 9. Soil classification test results
Sample ID
LL (%)
PL (%)
PI (%)
Percent
Classification
Gravel Sand Silt Clay AASHTO (GI)
Unified
Site 1 and 2 Non-Stab. Shale
41 25 16 5 10 52 33 A-7-6 (14) CL
Site 1 Hole 4 Stabilized
42 28 14 90 5 4 1 A-2-7 (0) SW- SP
Site 2 Hole 9 Stabilized
47 32 15 34 32 24 10 A-2-7 (1) SM
Site 3 Hole 13 &15 Non-Stab.
45 24 21 8 20 39 33 A-7-6 (14) CL
KY 499 Swell Pressure
0
2
4
6
8
10
12
0 5 10 15 20
Time (Days)Sw
ell P
resu
re (p
si)
Shale Shale-Lime Shale-Lime Cured
Compacted Shale
Compacted Shale-Hydrated Lime Mixture(Mellow Period = 1 hour)
Compacted Shale-Hydrated Lime Mixture

Characteristics and Engineering Properties of the Soft Soil Layer in Highway Soil Subgrades
68
Bearing Capacity Analysis of Flexible Pavements Stability of Flexible Sections without Chemical Stabilization The relationship between moisture content and CBR obtained from field and laboratory tests for the untreated Crab Orchard shale is shown in Figure 88 and may be approximately expressed as:
8 3 0 269CBR . . mcω= − . (13) As the moisture content of the compacted shale increases (both in the field and laboratory specimens), the CBR value decreases. In situ CBR values obtained on top of the untreated shale (below the soil-hydrated layer) were only 2.2 and 2.0 at moisture contents of 22.3 and 23.1 percent, respectively. Laboratory CBR values of two specimens were 1.9 and 0.8 at moisture contents of 27.6 and 24.6 percent, respectively. At optimum moisture content, as determined from AASHTO T-99, an estimated value from Equation 13 of CBR of the unsoaked, untreated shale would be about 5.3. Stability analysis of the flexible pavement sections that occur on the north and south sides of the Kentucky River were performed based on the assumption that the soil-hydrated subgrades did not exist and that the asphalt and aggregate layers of the sections rested directly on the untreated soil subgrades. CBR values cited above of the untreated subgrades of shale were used in the analyses. Pavement sections used in the analyses are shown in Figure 90. Based on the assumption that treated subgrades were not used, and using in situ values of CBR of 2.2 and 2.0, the corresponding factors of safety of 1.00 and 0.96 were obtained and show that if the sections had been built without the benefit of stabilization, then the pavement would have failed during construction (if the shale had absorbed moisture during construction) or shortly after construction when the subgrade had been subjected to moisture.
0123456
10 15 20 25 30
CB
R
Moisture Content, (Percent)mcω
8 3 0 269 mcCBR . . ω= −
In Situ
Lab
Figure 88. In situ and laboratory CBR as a function ofmoisture contents of Crab Orchard shale.
0.0
0.5
1.0
1.5
2.0
0 2 4 6
Fact
or o
f Saf
ety
CBR
0 1460 724 . CBRF . e=
Figure 89. Factor of safety as a function of in situ and labvalues of CBR.

Characteristics and Engineering Properties of the Soft Soil Layer in Highway Soil Subgrades
69
Using the estimated value (5.3) of CBR from Equation 13, at optimum moisture content, the factor of safety is 1.53. Hence, initially, the sections would not have failed but would have failed later when the shale absorbed water and lost CBR strength (or shear strength). Factor of safety as a function of CBR of the shale is shown in Figure 89. As shown in that figure and Figure 90, the stability of the pavement is precarious and, essentially, it depends on the moisture content of the shale at any given time. When the CBR approaches a value of 2.0 the pavement would become very unstable and fail. Stability analysis was also performed using the sections in Figure 90 and the laboratory values listed in the geotechnical report by the Kentucky Transportation Cabinet (Figures 78 and 79). Factors of safety based on laboratory CBR values, and assuming stabilization had not been used, are shown in Figure 91 as a function of percentile test value. At a factor of safety of one, the percentile test value is only about 32. This indicates that the majority of the pavement would have failed. Stability of flexible sections with chemical stabilization As shown in Figure 5, the subgrades at
this bypass were constructed with chemical stabilization. The pavement section on the north side of the river contained a 12-inch layer of soil-hydrated mixture while on the south side of the river an 8-inch layer of soil-hydrated lime was constructed. Stability analyses were performed using the actual pavement layers that were constructed, as shown in Figure 92. Values of CBR of the untreated shales located below the stabilized layers were used in the analyses. Based on the in situ CBR values actually measured on top of the soil-hydrated lime layers, the factor of safety of the pavement section on the north and south sides of the river were 3.67 and 1.80, respectively. Based on inspections, rutting of the pavements was not visually observed. Evaluation of Pavement Condition Based on Rideability Indices Evaluation of the pavement condition of Ky 499 makes use of rideability indices, or RI values. Based on past experience, the RI-index provides a general means of evaluating the general condition
11.5” Asphalt
North Side of KY River (2 Test Locations)
3.5- 4.0” DGA CBR = 2.2%M.C = 22.3%
Shale Subgrade
11.5” Asphalt
South Side of KY River (1 Test Location)
3.5 – 4.0” DGA
CBR = 2.0%M.C = 23.1%
Soil-Shale Subgrade
Pavement Sections: Estill County, KY 499
F = 1.00 F = 0.96
Figure 90. Pavement sections, In Situ CBR values,and corresponding moisture contents.
0
20
40
60
80
100
0.6 0.8 1.0 1.2 1.4 1.6
Perc
entil
e Te
st V
alue
Factor of Safety, F
Figure 91. Factor of safety as a function of the percentiletest value.

Characteristics and Engineering Properties of the Soft Soil Layer in Highway Soil Subgrades
70
of a pavement. Relationships between critical RI-values, traffic volumes, and pavement conditions are defined in Figure 93 (Burchett, 2001). Rideability Index data was obtained from the Kentucky Transportation Cabinet’s Pavement Management Branch. Data was available for the years 2001, 2002, and 2003. The RI has decreased each year as shown in Figure 94. The average RI for the section of roadway was 2.95 in 2001, 2.52 in 2002, and 2.21 in 2003 (Figure 95). The annual average daily traffic (AADT) for the year 2003 was 5020 (the only value available). Based on the value of AADT and RI-values, the general pavement condition (Burchett 2001) after one year of construction was between “good” and “fair.” By 2002, the condition of the pavement had decreased to “fair.” The pavement condition decreased more by 2003 to “Poor,” as shown in Figure 93.
Geochemical Tests Scanning Electron Microscope Scanning electron microscope tests were performed by personnel of the University of Kentucky’s Scanning Electron Microscope Facility on two standard penetration test samples each from the stabilized and non-stabilized subgrades. The most noticeable difference between the hydrated-lime stabilized subgrade samples and non-stabilized samples obtained directly below the stabilized laver was the presence of calcium (Ca) in the stabilized subgrade, as shown in Figure 96. This is expected because calcium is a principal component of hydrated lime, Ca(OH)2. Small amounts of sulfur (S) and iron (Fe) were detected in samples from both layers. The presence of sulfur is significant because sulfates could form when the sulfur is oxidized. If the sulfate quantity is large enough, and calcium is present in a basic high pH environment,
1 .5
2
2 .5
3
3 .5
4
0 5000 10000 1 5000A ve ra ge D a ily T ra ff ic (A D T )
Rid
ea
bilit
y I
nd
ex
(R
I)
P ave m e ntC o n d itio n
G o o d
F a irP oo r
2001
2003
2002
1 .5
2
2 .5
3
3 .5
4
0 5000 10000 1 5000A ve ra ge D a ily T ra ff ic (A D T )
Rid
ea
bilit
y I
nd
ex
(R
I)
P ave m e ntC o n d itio n
G o o d
F a irP oo r
2001
2003
2002
2001
2003
2002
Figure 93. Rideability Index as a function of theaverage annual daily traffic and condition ofpavement
Rideabilty Index
1.01.52.02.53.03.54.0
7.5 8 8.5 9 9.5Mile Point
RI I
ndex
2001
2003
2002
Figure 94. Rideability index data for the roadwaysection
11.5” Asphalt
Average CBR = 49.8%M.C = 15.6%
North Side of KY River (2 Test Locations)
3.5- 4.0” DGA
12.0” Stabilized Subgrade
CBR = 2.2%M.C = 22.3%
Shale Subgrade
11.5” Asphalt
CBR = 24.2%M.C = 14.0%
South Side of KY River (1 Test Location)
3.5 – 4.0” DGA
8.0” Stabilized Subgrade
CBR = 2.0%M.C = 23.1%
Soil-Shale Subgrade
Pavement Sections: Estill County, KY 499
F = 3.67 F = 1.80
Figure 92. Factors of safety of the flexible pavementsconstructed on soil and soil-shale subgrades treatedchemically with hydrated lime.

Characteristics and Engineering Properties of the Soft Soil Layer in Highway Soil Subgrades
71
gypsum and other calcium-sulfur based minerals such as ettringite, can form. These minerals form large crystals in the voids that are present in the soil structure and absorb water, which causes swelling. Iron and sulfur can form pyrite (FeS). The oxidation of pyrite has been a factor in the swelling in building subgrades, where crushed limestone has been placed between a concrete slab and fill material containing pyrite, such as New Albany and Chattanooga shale formations. X-Ray Diffraction X-Ray Diffraction tests were performed
by the University of Kentucky’s Center for Applied Energy Research on two standard penetration test samples each from the stabilized and non- stabilized subgrades. The diffraction patterns from these tests indicated that the major crystalline phases present are quartz, dolomite, and montmorillonite clay. No significant differences were observed in the hydrated-lime stabilized shale and the non-stabilized shale sample as shown by results in Figures 97 and 98. Gypsum, ettringite, and pyrite were not detected. Absence of calcium sulfate-type minerals (mainly gypsum and ettringite) indicates that no calcium sulfate reactions occurred in the subgrade and caused swelling. Pyrite was not detected. This finding rules out the possibility that pyrite oxidation occurred and contributed to pavement swelling.
y = -0.37x + 3.3
0
1
2
3
4
0 1 2 3 4Ave
rage
Rid
eabi
lity
inde
x (R
I)
Years after ConstructionFigure 95. Rideability Index as a function of yearsafter construction
Test Site 1Hydrated Lime
Stabilized Subgrade
Test Site 1Shale Only
Calcium from Hydrated Lime
Scanning Electron Microscope Results
Figure 96. Results from scanning electron microscope tests.

Characteristics and Engineering Properties of the Soft Soil Layer in Highway Soil Subgrades
72
Montmorillonite was detected. Montmorillonite is an aluminum silicate clay mineral that will absorb water and swell. Based on these results and swell tests, swelling of the compacted subgrade shale and intact shale below the stabilized subgrade is the major cause of pavement swelling. Sulfates Analysis of a soil sample for sulfates by the University of Kentucky’s Environmental Research Training Laboratory average sulfate levels of 667 parts per million (ppm) in the non stabilized shale and 1,319 in the stabilized shale. Sulfate levels in the DGA base were 20 ppm. Typical results from tests performed on the hydrated-stabilized soil and the non-stabilized shale are shown in Figure 99. The threshold amount of sulfates required to cause damaging reactions with calcium and form gypsum or ettringite is not known. Some research has shown that sulfate levels in soils from Texas, below 3,000 ppm, will not cause significant swelling in hydrated-lime stabilized soils (Harris, et al 2003). Based on that study, sufficient sulfate levels were not present.
MontmorilloniteMontmorillonite
MontmorilloniteQuartz
Quartz
Dolomite
X-Ray DiffractionShale Only
Figure. 97. Results from X-Ray diffraction tests of specimen obtained below soil-hydrated limestabilized layer.

Characteristics and Engineering Properties of the Soft Soil Layer in Highway Soil Subgrade
73
pH Laboratory pH tests were performed on samples of the hydrated-lime stabilized subgrade and on the shale only subgrade. The pH of the shale with hydrated-lime was 12.2. This range is acceptable for cementious chemical reactions to occur between the shale and hydrated-lime. The pH of the shale was only 7.5.
Conclusions and Recommendations Regarding Pavement Swelling on KY Route 499, Estill County Excessive pavement swelling was due to compacted and in situ Crab Orchard Shale being exposed to moisture. X-ray diffraction tests detected montmorillonite in the clay shale. Montmorillonite is known to absorb available moisture and swell. The swell pressure exerted from the swelling clay located below the pavement and stabilized subgrade was greater than the combined overburden pressure from the asphalt, gravel base and stabilized subgrade. Lime stabilization reduced swelling of the compacted shale. Allowing compacted shale lime mixtures to cure, before being exposed to moisture sources, reduces swelling further. No gypsum, ettringite, or other calcium sulfate based minerals were found in the hydrated lime stabilized subgrade. Sulfates were detected but may be too low for sulfate calcium reactions to occur and contribute to the swelling. Further research is needed to determine acceptable levels of sulfates. Drainage ditches should be reconstructed at the central test site. The pavement humps will require periodic milling. Temporary patches will also have to be used. Periodic measurements of
Quartz
Montmorillonite
Montmorillonite
MontmorilloniteQuartz
Quartz
Dolomite
X-Ray DiffractionShale-Hydrated Lime Only
Figure 98. Results from X-Ray diffraction tests, compacted lime stabilized
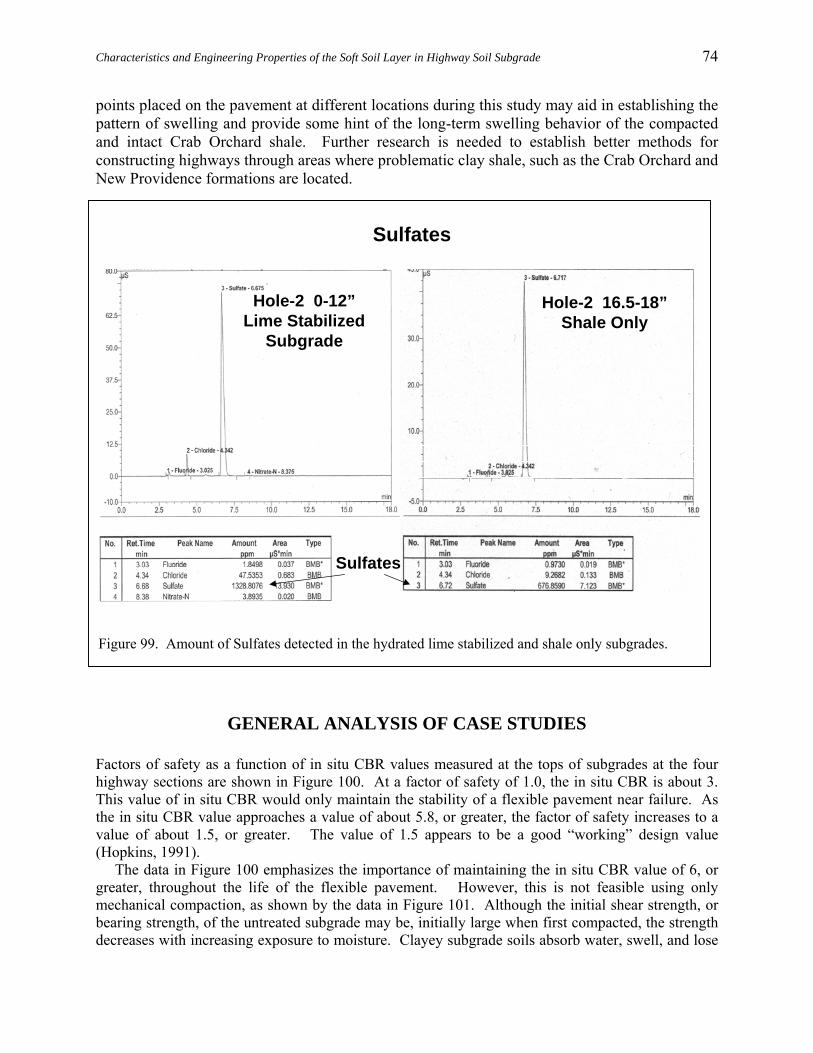
Characteristics and Engineering Properties of the Soft Soil Layer in Highway Soil Subgrade
74
points placed on the pavement at different locations during this study may aid in establishing the pattern of swelling and provide some hint of the long-term swelling behavior of the compacted and intact Crab Orchard shale. Further research is needed to establish better methods for constructing highways through areas where problematic clay shale, such as the Crab Orchard and New Providence formations are located.
GENERAL ANALYSIS OF CASE STUDIES
Factors of safety as a function of in situ CBR values measured at the tops of subgrades at the four highway sections are shown in Figure 100. At a factor of safety of 1.0, the in situ CBR is about 3. This value of in situ CBR would only maintain the stability of a flexible pavement near failure. As the in situ CBR value approaches a value of about 5.8, or greater, the factor of safety increases to a value of about 1.5, or greater. The value of 1.5 appears to be a good “working” design value (Hopkins, 1991). The data in Figure 100 emphasizes the importance of maintaining the in situ CBR value of 6, or greater, throughout the life of the flexible pavement. However, this is not feasible using only mechanical compaction, as shown by the data in Figure 101. Although the initial shear strength, or bearing strength, of the untreated subgrade may be, initially large when first compacted, the strength decreases with increasing exposure to moisture. Clayey subgrade soils absorb water, swell, and lose
Hole-2 0-12”Lime Stabilized
Subgrade
Hole-2 16.5-18”Shale Only
Sulfates
Sulfates
Figure 99. Amount of Sulfates detected in the hydrated lime stabilized and shale only subgrades.

Characteristics and Engineering Properties of the Soft Soil Layer in Highway Soil Subgrade
75
strength, as illustrated by the comparisons of CBR percentile test values in Figure 101. As shown by those data, the initial laboratory KYCBR values when first compacted were large. However, as the clayey soils were exposed to moisture the CBR values decreased significantly. Moreover, the in situ CBR values were less than the soaked laboratory values of KYCBR. The Kentucky CBR test procedure produces compacted specimens that have
larger values of dry densities than those that exist in the field. Consequently, the laboratory KYCBR values tend to be larger than the in situ CBR values. Chemical stabilization, as illustrated by the CBR percentile test curves in Figure 101, offers one of the best means of maintaining an in situ CBR equal to, or greater, than 6. In situ CBR values
0
10
20
30
40
50
60
70
80
90
100
0 10 20 30 40 50 60 70 80 90 100
CBR
Per
cen
tile
Tes
t V
alu
e
Ky Geo Database (3,765 Tests)
SCS Unsoaked (668 Tests)
SCS Soaked (668 Tests)
In Situ Untreated
(103 Tests)
In Situ P. Cement
In Situ Hydrated Lime
In Situ Lime Kiln Dust
0
10
20
30
40
50
60
70
80
90
100
0 10 20 30 40 50 60 70 80 90 100
CBR
Per
cen
tile
Tes
t V
alu
e
Ky Geo Database (3,765 Tests)
SCS Unsoaked (668 Tests)
SCS Soaked (668 Tests)
In Situ Untreated
(103 Tests)
In Situ P. Cement
In Situ Hydrated Lime
In Situ Lime Kiln Dust
Figure 101. Comparisons of percentile test value-CBR curves.
Soaked
0.0
0.5
1.0
1.5
2.0
0 1 2 3 4 5 6 7 8 9
0 1776 0 4732F . ( CBR ) .= +2 0 82R .=
In Situ CBR
Fact
or o
f Saf
ety
Figure 100. Factors of safety as a function of in situ CBR valuesmeasured at the tops of subgrades at the four study highway sections.

Characteristics and Engineering Properties of the Soft Soil Layer in Highway Soil Subgrade
76
measured at the tops of soil subgrades stabilized, or mixed, with lime kiln dust, hydrated lime, Portland cement are shown as a function of percentile test values in Figure 101. Ages of the chemically treated subgrades, at the time of the in situ CBR measurements, ranged from 8 to 15 years. At the 85th percentile tests value, the in situ CBR of the chemically treated subgrades were 24, 27, and 59, respectively. Those values are much larger than the value of the in situ CBR of untreated subgrades at the 85th percentile test value is only 2. Soaked and unsoaked laboratory KYCBR values
at the 85th percentile value are about 3 and 12, respectively. In situ CBR values of chemically treated subgrades are much larger than the unsoaked KYCBR values. CBR values at the 85th percentile test values are summarized and compared in Table 10. Percentile test values as a function of factors of safety computed at each coring location of the four highway study sections are shown in Figure 102. At the 60th percentile test value the factor of safety of the flexible pavements at each coring site was only 1.0. At 40 percent of the locations, the flexible pavements had failed, or were near failure. The factor of safety was 1.5 at only the 35th percentile value. Those percentile test values should have been much higher.
0
20
40
60
80
100
0.00 0.50 1.00 1.50 2.00
Per
cen
tile
Tes
t V
alu
e
Factor of Safety
Figure 102. Percentile test value as a function of the factor of safety obtained from the Perturbation limit equilibrium.
Table 20. Comparison of In situ (field) and laboratory CBR values at the 85th percentile test value
In Situ CBR at the 85th Percentile Test Value
Laboratory KYCBR at the 85th Percentile Test Value
Untreated (Stabilized Mechanically) Clayey Subgrade
2.0
SCS --Unsoaked Laboratory (668) Specimens
3.5
SCS --Soaked Laboratory Specimens (668 specimens)
11.5
Geotechnical Database-- Soaked Laboratory Specimens
3.0
Hydrated Lime-Soil Subgrade 27
Portland Cement-Soil Subgrade 59
Lime Kiln Dust-Soil Subgrade 24

Characteristics and Engineering Properties of the Soft Soil Layer in Highway Soil Subgrade
77
CONCLUSIONS The following conclusions are offered:
• A soft layer of soil frequently develops at the top of untreated, highway soil subgrades. This
situation develops because compacted clayey soils absorb moisture and swell. As swelling occurs, the unit weight of the compacted clayey soil decreases and bearing, or shear, strength decreases. The loss in strength is irreversible. On the basis of percentile test value, moisture contents measured at the very top of untreated subgrades were some 3-4 percent larger than moisture contents measured at points below the top of the subgrades.
• There was direct correlation between in situ CBR and the moisture content of the soil
(untreated) subgrade. As the moisture content of the soil subgrade increases, the value of in situ CBR decreases. This loss of strength during, or after paving, directly affects pavement stability, as demonstrated by results obtained from a bearing capacity model developed by the authors. Analysis using this mathematical model (referred to as the Perturbation limit equilibrium model) showed that when the in situ value of CBR decreased to about 3, or smaller, flexible pavements generally became unstable. However, when the in situ CBR was about 6, or greater, the flexible pavements were in fair to good condition and were generally stable. The factor of safety obtained from the limit equilibrium analysis was equal to 1.5.
• In situ CBR values measured in the field were significantly smaller than CBR strengths of
laboratory compacted soil specimens that had been tested in the soaked and unsoaked state. The Kentucky CBR procedure generally yields CBR values that are larger than in situ CBR values measured in field.
• Mechanical compaction generally creates, initially, large values of preconsolidation pressure
of clayey soils. However, exposure to saturation significantly reduces the preconsolidation pressure of a compacted soil, as demonstrated by laboratory consolidation tests. This process is not reversal. With a decrease in preconsolidation pressure due to the absorption of water and swelling, a compacted soil subgrade is more prone to differential deflection, or compression under wheel loadings. Consequently, pavements resting on soften subgades are subject to larger deflections and potential cracking than subgrade soils that retain their original preconsolidation pressures.
• Based on this study, as well as past studies, the minimum value of CBR required to construct
a flexible pavement should generally be equal to about 6. Construction of a flexible pavement becomes difficult when the in situ value CBR decreases below 6.
• Research needs to be performed to establish a reasonable curing time for soil subgrade
stabilized with hydrated lime and lime kiln dust. The purpose of this research would be to determine if the curing time of 7 days, currently used in practice, could be reduced.
• Small values of factor of safety are obtained for certain combinations of thickness (obtained
from the 1981 Kentucky Flexible Pavement Curves) and ESAL when the subgrade CBR is less than six. Based on a limited number of cases analyzed in this report, certain design thicknesses may be obtained from the design curves that may be unstable during construction or after construction when the in situ CBR value falls below 3.

Characteristics and Engineering Properties of the Soft Soil Layer in Highway Soil Subgrade
78
• Conclusions regarding pavement swelling on KY Route 499, Estill County:
Excessive pavement swelling was due to compacted and in situ Crab Orchard Shale being exposed to moisture. X-ray diffraction tests detected montmorillonite in the clay shale. Montmorillonite is known to absorb available moisture and swell. The swell pressure exerted from the swelling clay located below the pavement and stabilized subgrade was greater than the combined overburden pressure of the asphalt, gravel base, and stabilized subgrade. Lime stabilization reduced swelling of the compacted shale. Allowing compacted shale lime mixtures to cure, before being exposed to moisture sources, reduces swelling further.
• No gypsum, ettringite, or other calcium sulfate based minerals were found in the
hydrated lime stabilized subgrade. Sulfates were detected but may be too low for sulfate calcium reactions to occur and contribute to the swelling. Further research is needed to determine acceptable levels of sulfates.
RECOMMENDATIONS
The following recommendations and comments are offered, as follows:
• Chemical admixtures should be considered as the first choice for stabilizing highway soil subgrades in Kentucky, whenever feasible. Chemical admixture stabilization is the most effective means of maintaining large CBR values (greater than 24 at the 85th percentile test value) during construction and throughout the life of the pavement. For comparison, the in situ CBR value of untreated subgrades at the 85th percentile test value, as shown in this study, was only 2.
• The soft zone of material at the top of soil subgrades does not develop when chemical
stabilization is used. Chemical admixtures that have been used successfully in Kentucky and retain large values of long-term CBR strengths include Portland cement, hydrated lime, and lime kiln dust.
• The concept of using “Full Depth Asphalt Pavement” placed directly on untreated soil
subgrades should not be used. However, this concept appears workable, based on the performance of one site observed in a previous research study, when the full depth pavement design is constructed on a chemically stabilized subgrade.
• The test method, KM–64-501-95 currently used in Kentucky to determine CBR of a given
type of soil should be revised. The test should be performed so that dry density and moisture content of the laboratory remolded CBR specimen are commensurable with dry density and moisture content of the Department of Highways' standard specifications. That is, if the standard specifications require that the subgrade soils be compacted to a minimum value of 95 percent of maximum dry density and (+) 2 percent of optimum moisture, then the laboratory CBR specimen should be remolded to reflect those specification conditions.
Characteristics and Engineering Properties of the Soft Soil Layer in Highway Soil Subgrade
79
• A thorough analysis of the 1981 Flexible Pavement Design Curves and the AASHTO Flexible pavement design curves using the Perturbation limit equilibrium method is recommended. The purpose of this analysis is an effort to identify flexible pavement thickness designs that may be unstable, or those that have very low values of factors of safety. Those analyses could help identify flexible pavement designs that potentially may fail during construction, or after construction.
• Recommendations regarding pavement swelling on KY Route 499, Estill County:
Drainage ditches should be reconstructed at the central test site. The pavement
humps will require periodic milling. Temporary patches will also have to be used. Periodic measurements of points placed on the pavement at different locations during this study may aid in establishing the pattern of swelling and provide some hint of the long-term swelling behavior of the compacted and intact Crab Orchard shale.
Further research is needed to establish better methods for constructing highways
through areas where problematic clay shale, such as the Crab Orchard and New Providence formations are located. This research effort should be comprehensive and consist of examining the many case histories of pavement problems associated with the Crab Orchard shales, as well as shales that are similar to the Crab Orchard shales and residual soils. Moreover, the effects of swelling soil subgrades constructed of clayey soils commonly used in Kentucky on pavement performance needs to be monitored and evaluated.
REFERENCES Burchett, J. “Pavement Management in Kentucky: An Overview in Year 2001,” Pavement
Management Branch of the Kentucky Transportation Cabinet, February 2001—private communication with Jim Burchett, former Branch Manager.
Harris, P.; Sebesta, S.; and Scullion, T. “Hydrated Lime Stabilization of Sulfate-Bearing Soils in Texas,” University of Texas, Texas Transportation Institute, July 2003.
Molen, D., Memorandum. (May 1997) “Geotechnical Engineering Report Estill County, KY 52 – KY 89 Connector (Irvine By-Pass”), Kentucky Transportation Cabinet, Division of Materials, Geotechnical Branch.
Caquot, A. and Kerisel, J., (1953). Ultimate Bearing Capacity of a Foundation on the Surface of a Cohesionless Soil, Proceedings of the Third international Conference on Soils Mechanics and foundation Engineering, Switzerland.
Casagrande, A. (1936). “The Determination of the Preconsolidation Load and Its Practical Significance,” Proc. 1st Int. Conf. Soil Mech. Eng. (Cambridge, Mass.), p. 60.
DeBeer, E. E. and Ladanyi, B., (1961). Etude Experimentwale de Ja Capacite Portante du sable sous des Foundations Etablies en Surface, Proceedings of the 5th International Conference on Soil Mechanics and Foundation Engineering.
Feda, J., (1961). Research on the Bearing Capacity of Loose Soil, Proceedings of the 5th International Conference on Soil Mechanics and foundation Engineering.

Characteristics and Engineering Properties of the Soft Soil Layer in Highway Soil Subgrade
80
Hopkins, T. C. , Girdler, H. F., and Yoder, S. M., (1973). "Stability of a Side-Hill Embankment," I 64, Lexington- Catlettsburg Road, “ Research Report No.363, Division of Research, Kentucky Department of Highway, Lexington, Kentucky
Hopkins, T. C. and Deen, R. C., (January 1973). "Kentucky CBR's and the Soil Support Value," Research Report No. 355, Division of Research, Kentucky Department of Highway, Lexington, Kentucky
Hopkins, T. C. and Deen, R. C., (August 1983). "Identification of Shales," University of Kentucky Transportation Center, College of Engineering, Research Report UKTRP-83-16 (also Geotechnical Testing Journal, American Society for Testing and Materials, March 1984).
Hopkins, T.C. and Sharpe, G.W., (March 1985). Unstable Subgrade I 65, Hardin County (I 65-5(17)92); FSP 047-0065-091-094-0396, University of Kentucky Transportation Center, College of Engineering, Research Report UKTRP 85-9.
Hopkins, T.C. and Allen, D. L., (October 1986a). Lime Stabilization of Pavement Subgrade Soils of Section AA-19 of the Alexandria-Ashland Highway, Research Report 86-24, University of Kentucky Transportation Center, College of Engineering, Lexington, Kentucky.
Hopkins, T. C., (1986b). A Generalized Slope Computer Program: User’s Guide for Hopk-I, Research Report UKTRP-86-2, University of Kentucky Transportation Center, College of Engineering, Lexington, Kentucky.
Hopkins, T.C., (October 1987). Lime Stabilization of Kentucky Soils, University of Kentucky Transportation Center, College of Engineering, Oral presentation to the National Lime Conference, Lexington, Kentucky
Hopkins, T.C., Hunsucker, D., and Sharpe, G.W., (1988). Highway Field Trials of Chemically Stabilized Soil Subgrades, Proceedings of the Ohio River Valley Soils Seminar XIX, Lexington, Kentucky.
Hopkins, T. C. (June 1991). Bearing Capacity Analyses of Pavements, Research Report KTC-91-8, University of Kentucky Transportation Center, College of Engineering.
Hopkins, T.C. Beckham, T.L.; and Hunsucker, D. Q. (June 1994) “Modification of Highway Soil Subgrades,” University of Kentucky, Kentucky Transportation Center.
Hopkins, T.C., Hunsucker, D.Q., and Beckham, T.L., (1994a). Long-term Performance of Untreated Soil Subgrades and Subgrades Treated with Cement and Hydrated Lime, Transportation Research Record No. 1440, pp 45-52.
Hopkins, T.C., Hunsucker, D.Q. and Beckham, T.L., (1994b). Selection of Design Strengths of Untreated Soil Subgrades and Subgrades Treated with Cement and Hydrated Lime, Transportation Research Record No. 1440, pp 37-44.
Hopkins, T.C.; (July 1994c), Minimum Bearing Strength of Soil Subgrades Required to Construct Flexible Pavements, Proceedings, The 4th International Conference on the Bearing Capacity of Roads and Airfields, Vol.1, Minneapolis, Minnesota.
Hopkins, T.C., (July 1994d). Case Studies of Flexible Pavement Failures During Construction, Proceedings, The 4th International Conference on the Bearing Capacity of Roads and Airfields, Vol.1, Minneapolis, Minnesota.
Hopkins, T. C., Beckham, T. L., and Hunsucker,. (June 1995). “Modification of Highway Soil Subgrades,” Research Report KTC-94-11, University of Kentucky Transportation Center, College of Engineering, Lexington, Kentucky.
Hopkins, T. C., Beckham, T. L., Sun C., and Ni, B., (June 2001). “Resilient Modulus of Kentucky Soils,” Research Report KTC-01-07/SPR-163-95-1F, University of Kentucky Transportation Center, College of Engineering, Lexington, Kentucky.
Characteristics and Engineering Properties of the Soft Soil Layer in Highway Soil Subgrade
81
Hopkins, T. C. and Slepak, M. E. (July 1998). Estimated Factors of Safety of the AASHO Road Test Flexible Pavement Sections Based on Limiting Equilibrium Methods, Proceedings, Fifth International Conference on the Bearing Capacity of Roads and Airfields, Trondheim, Norway.
Hopkins, T. C. and Beckham, T. L., (2000). Influence of Clay Fraction on the Behavior of Soil Subgrades, Proceedings, Fifth International Symposium on Unbound Aggregates in Roads, Nottingham, UK June 2000.
Hopkins, T. C. and Beckham, T. L., (June 2002). “Long-Term Benefits of Stabilizing Soil Subgrades,” Research Report KTC-02-19/SPR-196-99-1F, University of Kentucky Transportation Center, College of Engineering, Lexington, Kentucky.
Hopkins, T. C., Beckham, T. L., and Sun, L. (2004). Kentucky Geotechnical Database, Research Report KTC 93-29, Research Report KTC-05-03/SPR227-01-F, College of Engineering, University of Kentucky Transportation Center.
Hopkins, T. C. Sun, L., and Slepak, M. E., (August 2005). “Bearing Capacity Analysis and Design of Highway Base Materials Reinforced with Geofabrics, Research Report KTC- 05-21/SPR-238-02-1F, University of Kentucky Transportation Center, College of Engineering, Lexington, Kentucky.
Hopkins, T. C., Beckham, T. L., and Sun, C. (2005a). “Resilient Modulus of Compacted Crushed Stone Aggregate Bases,” Research Report KTC-05-27/SPR-229-01-1F, University of Kentucky Transportation Center, College of Engineering, Lexington, Kentucky.
Hunsucker, D. Q.; Hopkins, T.C.; and Graves, R. C. (January 1993) "Construction and Performance of Highway Soil Subgrades Modified with Atmospheric Fluidized Bed Combustion Residue and Multicone Kiln Dust," KTC-93-4, January 1993.
Kentucky Methods, (1995). Kentucky Transportation Cabinet, Frankfort, Kentucky. Ni, B., Hopkins, T. C., and Sun, L. (2002). “Modeling the Resilient Modulus of Soils," Proceedings,
Sixth International Conference on the Bearing Capacity of Roads, Railways and Airfields (BCRA’02), Lisbon, Portugal.
Prandtl, (1921). Hautaufsatze Uber die Eindringungsfestigkrit (Harte) plasticher Baustoffe und die Festigkeit von Schneiden, Zaitschrift Fur Angewandte, Mathematik und Mechanik, Vol.1, No. 1.
Reissner, H., (1924). Zum Erddruckproblem, Proceedings, First International Conference on Applied Mechanics, Delft.
Slepak, M. E. and Hopkins, T.C., (1993). Computer Program for Stability Analysis of Embankments with Tensile Elements, Research Report KTC 93-29, University of Kentucky Transportation Center.
Slepak, M. E. and Hopkins, T.C., (January 1995a). Personal Computer Program for Analysis of Embankments with Tensile Elements, Research Report KTC 93-29, University of Kentucky Transportation Center, Geotechnology Section, College of Engineering, Lexington, Kentucky.
Slepak, M. E. and Hopkins, T.C., (1995b). Modified Perturbation Method in Stability Analysis of Reinforced Earth Structures, Geosynthetics ‘95, International Conference Proceedings, Nashville, Tennessee USA.
Southgate, H. F., Deen, R. C. and Havens, J. H., (November 1981). Development of a Thickness Design System for Bituminous Concrete Pavements, University of Kentucky Transportation Center, College of Engineering, Research Report UKTRP-81-20.
Thompson, M. R., (1988). Admixture Stabilization of Subgrades, Proceedings, Nineteenth Annual Ohio River Valley Soils Seminar (ORVSS), Lexington, Kentucky.

Characteristics and Engineering Properties of the Soft Soil Layer in Highway Soil Subgrade
82
Traylor, M.L. and Thompson, M. R., (1977). Sinkage Prediction-Subgrade Stability, Civil Engineering Studies, Transportation Engineering Studies, Transportation Engineering Series No. 17, Illinois Cooperative Highway and Transportation Series No. 168, Department of Civil Engineering, University of Illinois at Urbana-Champaign.
Vesic', A.S. and Johnson, W. H., (1963). Model Studies of Beams Resting on a Silt subgrade, Proceedings, ASCE Journal of the Soil Mechanics and Foundations Division, 89, No. SM1.
Vesic’, A. S. and Saxena, S. K., (1970). Analysis of Structural behavior of AAASHO road Test Rigid Pavements, Report 97, National Cooperative Highway research Program, National Academy of Science, Washington, D. C.
Winterhorn, H. F. and Fang, H. Y., (1975). Foundation Engineering Handbook, Von Nostrand Reinhold Company, New York.
ACKNOWLEDGEMENTS This study is part of a research study examining the effects of saturated subgrades on pavement performance. The Kentucky Transportation Center and Federal Highway Administration provided funding. Bill Broyles, Geotechnical Branch Manager is Chairperson of the research Study Advisory Committee. Tim Adams and Mike Rodgers, resident engineer and construction inspector, respectively, for the project provided plans, survey control points and construction information. Anthony Bowling, Branch Manager for Maintenance District 10, provided traffic control for field-testing. Larry Rice from the University of Kentucky’ Scanning Electron Microscope Facility performed the SEM tests, John May, with the University of Kentucky’s Environmental Research Training Laboratory, for performed total sulfates tests, Gerald Thomas and Bob Rathbone, with the University of Kentucky Center for Applied Energy Research performed and analyzed x-ray diffraction tests. The authors are very grateful for the help provided by the individuals cited above.
��� ���� ��������� �� ���� �� ��� ����� ��� ���� �� �
��� ����� �� � �� ���� �� �� �������
��� ���� ������� ����� �!"�
#"�$% !�� ���&#"�$% !�� �"�� #'()%
� "�� �&! ���$***+���+���+�����,���+���+��
KENTUCKY TRANSPORTATION CENTER
The University of Kentucky is an Equal Opportunity Organization