Embed Size (px)
Citation preview

Multimedia Systems (2009) 15:3–17DOI 10.1007/s00530-008-0126-0
REGULAR PAPER
Characterising and exploiting workloads of highlyinteractive video-on-demand
Andrew Brampton · Andrew MacQuire ·Michael Fry · Idris A. Rai · Nicholas J. P. Race ·Laurent Mathy
Published online: 20 May 2008© Springer-Verlag 2008
Abstract This paper presents a detailed characterisation ofuser behaviour for a series of interactive video experimentsover a 12 month period, in which we served popular sport-ing and musical content. In addition to generic VCR-likefeatures, our custom-built video-on-demand application pro-vides advanced interactivity features such as bookmarking.The dramatic impact of such functionality on how users con-sume content is studied and analysed. We discuss in detailhow this user behaviour can be exploited by content dis-tributors to improve user experience. Specifically, we studyhow simple dynamic bookmark placement and interactivi-ty-aware content pre-fetching and replication can reduce theimpact of highly interactive media on CDN performance.
Keywords Interactive · Video-on-demand · Sports ·World cup · Content distribution
A. Brampton (B) · A. MacQuire · I. A. Rai · N. J. P. Race ·L. MathyComputing Department, Lancaster University, Lancaster, UKe-mail: [email protected]
A. MacQuiree-mail: [email protected]
I. A. Raie-mail: [email protected]
N. J. P. Racee-mail: [email protected]
L. Mathye-mail: [email protected]
M. FryUniversity of Sydney, Sydney, Australiae-mail: [email protected]
1 Introduction
In recent years the Internet has increasingly been used todistribute bandwidth-intensive streaming media. Due to theresources required to deliver such content, dedicated Con-tent Distribution Networks (CDNs) are often used to improvethe experience of end-users. As such systems evolve, usersexpect correspondingly improved interactive functionality,something which is increasingly difficult to achieve withdiverse content types exhibiting varied access patterns. Inorder to provide a high quality of service, modern CDNsmust therefore be optimised to respond to user behaviourwith regard to different content types.
In this paper, we study user behaviour for an interac-tive video-on-demand (VoD) system that serves users with aselection of content. Broadly, we served videos in the sport-ing and musical genres, with respective examples being theentire 2006 FIFA World Cup and 2007 Eurovision Song Con-test. A key distinguishing element of our work is that by usingour own VoD system, we could offer novel interactive func-tionality beyond typical VCR-like features (i.e., the ability topause, resume and skip back and forth within a given videostream). The prime example of this is bookmarking: directlinks to points of interest within the video. An example of abookmark within our sporting content could be a commonevent such the start of a match, or a potentially more popu-lar event, such as a goal. Likewise, in our musical content,we would typically bookmark the beginning of each distinctpiece. Our system also allowed users to contribute their ownbookmarks at any time, distinct from those added during thepublishing process.
Previous studies making use of entertainment content havewitnessed the classic start-to-finish playback model in theiraccess patterns, with occasional VCR-like interactivity. Inour experiments, however, user behaviour proved highly
123
4 A. Brampton et al.
dynamic. Users often chose to watch (and replay) small seg-ments of the full video, in a complete departure from thestart-to-finish model. The behaviour observed may also existin other genres with popular highlight (e.g., educational,entertainment, news, etc.). While our scope is limited tosparsely accessed content, we feel our results are of interestand are relevant to significant new genres of on-line videocontent.
We carried out a statistical analysis of the observed work-load resulting from the dynamic user behaviour, and identi-fied models, various metrics and workload properties. Thesemodels can be used to drive simulations of the type of in-teractivity behaviour studied in this paper. We also discusshow delivery networks can exploit the observed behaviour toimprove user-perceived performance. For instance, we showthat the order in which users view bookmarks can be pre-dicted based on previous activity, enabling CDNs to leveragethis data for performance gains. We also show how simpledynamic bookmark placement techniques and interactivity-aware content management techniques can improve CDNresource usage and performance.
The remainder of this paper is structured as follows: Sect. 2reviews and discusses previous work on VoD workloads. Sec-tion 3 describes our experimental setup and methodology.Section 4 then analyses the traces we obtained during our trialperiod and discusses their significance. Section 5 presentsand explores two simple techniques content distribution net-works can use to exploit the highly dynamic user behaviourfound in our analysis, in order to improve both user satisfac-tion and resource usage. Finally, Sect. 6 concludes the paperwith a brief summary of results and a discussion of futurework.
2 Related work
Much previous work on characterising user interaction hasinvolved authors analysing real-world traces, usually of atleast one month in length. A commonly-used repository ofsuch data is the Internet Traffic Archive (ITA) [8]. The ITAmaintains a collection of both large and small-scale log filesfrom a number of diverse sources; popular examples beingthe entire 1998 FIFA World Cup’s web server logs, or twomonths of logs from the NASA Kennedy Space Center in1995. Unfortunately, many publicly available log files aresimilarly outdated. Although this may imply that they arelikely to be well studied, it equally means they may notbe suitable for characterising modern streaming access pat-terns with VCR-like interactivity. It is perhaps for this rea-son that many works in this field have instead made use ofprivately obtained data, often from large networks such as
Akamai’s [2] or anonymous sources for non-disclosure rea-sons.
Despite this, many common trends are still observedamongst differing video-on-demand workloads, old andnew. For instance, it is often found that only a smallpercentage of objects account for the majority of overallrequests. Similarly, a small percentage of the requests oftenaccount for a large percentage of the overall data transfer.Accordingly, numerous papers have therefore postulated thatthe popularity of objects follows a Zipf distribution [6,7,12,13], although some have also indicated that this is not alwaysthe case [1,5].
In terms of video-on-demand session arrivals several suit-able (and often heavy-tailed) models have been suggested,e.g., the Poisson, Pareto and Exponential distributionsetc. [3]. In general terms, it seems that access patterns dependhighly on the nature of the content. Costa et al. highlightedthis during their examination of four VoD workloads in threedomains (education, entertainment video and entertainmentaudio). For instance, the authors found that educational con-tent was far more popular in the daytime on weekdays,whereas requests for entertainment-based content were moreevenly distributed across the entire week. They also note howa small yet significant fraction of users begin playback atarbitrary positions within the video, and issue an increasingnumber of requests in correlation with the video length. Interms of the requests issued, ‘pause’ was found to be, by far,the most common interaction. It was also noted that the prob-ability of a given interaction was dependent on the type of theprevious interactions, although the number of these actionswas irrelevant [7].
Another common observation was that the popularity ofmedia segments was either roughly uniformly distributedor skewed towards the beginning of videos [3,7]. This is aproperty of the start-to-finish playback model where userspassively watch from the beginning to the end with little inter-activity. Following from this, multiple authors have observedthat a substantial percentage of media downloads are abortedbefore completion. Guo et al. suggest that this may be a resultof clients conducting “pseudo-streaming”; in other words,simply playing back a downloading video file as it arrives.The authors note that in comparison with real streaming,downloading/pseudo-streaming content is neither bandwidthefficient, nor performance effective [1,10].
The majority of previous work into characterising userbehaviour in video-on-demand systems has considered sim-ple or VCR-like interactivity exclusively. The impact ofnewer interactivity features such as bookmarking has not yetbeen considered to our knowledge. Accordingly, we designedour experiment to allow for the study of such effects, as dis-cussed in the following section.
123

Characterising and exploiting workloads of highly interactive video-on-demand 5
(a) (b)
Fig. 1 Video-on-demand system diagrams
3 Experimental setup
We set up a simple, interactive video-on-demand system.1
The system was divided into three main components: thecapture server, the video-on-demand server, and a web inter-face as depicted in Fig. 1.
Our capture server recorded publicly-broadcast rawMPEG-2 streams of the programmes selected for our exper-iments. Once this process completed, the system transcodedthe stream to high and low bitrate Macromedia Flash 7 FLVfiles (1 Mbps and 300 Kbps respectively). Administratorswould then manually add metadata to the system describingthe files as well as marking the location of key events withinthe videos. These locations are referred to as bookmarks, andtypically included events of interest. Within our sport con-tent, for example, goals, fouls and similar occurrences werebookmarked. The final FLV files were then transferred to theVoD server, making them accessible to the users. The full pro-cedure described typically took around twice the length ofthe recorded video, and so the videos were available shortlyafter being aired.
The VoD system was an Apache webserver, which servedthe Flash-based user interface over HTTP. This server wasonly accessible to staff and students within Lancaster Uni-versity’s campus, and those staff and students connectingremotely via the university’s Virtual Private Network (VPN).To aid in logging, all requests made through the user inter-face were verbose, allowing us to determine exactly whichcontrols users pressed and when. Additionally, each play-back window would maintain a periodic (10 s) HTTP-requestheartbeat with the server, which was used to determine whenconnectivity was unexpectedly lost.
To handle user tracking, each user was assigned a uniquesession ID, which was stored within a HTTP cookie and theirURLs. Each event that was logged contained this identifier,
1 More information about the system and its source code is available athttp://www.rcdn.org/
allowing us to track individual users throughout their visit tothe site. If, however, a user blocked or deleted their cookie,they would appear to be new to the system upon each visit.We note within our analysis where this uncertainty couldaffect the results.
The web interface consisted of two main sections: an indexpage allowing the user to select any available video fromthe system, and the player interface that displayed the video(as shown in Fig. 1b). We were aware that the user inter-face would constrain the users’ actions somewhat, and it wastherefore designed to be as simple and generic as possible.Forward and backward buttons were provided that allowedseeking 10, 30 and 60 s in either direction. As these are rel-atively short distances, we also provided a seek bar whichenabled users to seek to any arbitrarily chosen time. Finally,a list of bookmarks was displayed to the users, which enabledthem to jump directly to key events. Bookmarks were addedby an administrator, but later the interface was extended toalso allow users to submit their own bookmarks (via the tagbutton), which other users could see and use. User bookmarksoften covered events that were not typically bookmarked, butwere of particular interest (such as events that came underlater scrutiny).
3.1 Content
We ran our experiments in two phases, firstly covering the2006 FIFA World Cup and nine months later a wider range ofsport and musical events. The content selections were chosenbecause they had points of interest to bookmark, and wouldyield sufficient user demand.
The first experiment made available a total of 66 matchesfrom the World Cup (64 from the event itself, and 2 pre-com-petition friendlies) starting from the 9th of June 2006. Onlyresults after the 13th of June were analysed due to altera-tions made to the logging system and user interface beforethat date. Each match was recorded from the beginning of the
123

6 A. Brampton et al.
pre-match commentary through to the end of coverage, and atthe very least every goal, penalty, and match start/end-point(inclusive of half-time) was bookmarked.
From the 13th of April 2007 we began covering newcontent as part of a second experimental study. This time,our approach was designed to test various autonomic man-agement techniques, and to revalidate our previous exper-imental results. Furthermore, we wished to determine therelevance of our analysis/models to other genres (such asmusic). Over the following two months we covered the lastsix matches from the 2007 UEFA Champions League foot-ball tournament, some other miscellaneous football matches,seven Formula 1 races, as well as several recordings frommusic channels and the 2007 Eurovision Song Contest semi-final and final. The football matches were bookmarked in thesame manner as the previous World Cup event. In the For-mula 1 content we bookmarked the beginning and end of therace, as well as any noteworthy events such as a driver hav-ing to retire (after a crash or technical difficulties). Within themusical content the beginning of each track was bookmarkedwith its corresponding artist and title. A similar approach wastaken with the Eurovision Song Contest, where the beginningof each song was bookmarked with the name of the countrytaking part.
In total there were 88 videos, each video on average was2.5 h in length with a standard deviation of 30 min. The max-imum video length was 4 h, and the minimum length 45 min.There were 695 bookmarks, with each video having on aver-age 7.8.
4 Analysis
In this section, we use traces from our system to characteriseuser behaviour and the resulting workload. Using a com-bination of R-Square fitting and Kolmogorov–Smirnov Tests,models for the various features were determined. Aggregatedresults are shown when applicable, but in some cases it ismore appropriate to show results for individual videos. Wenoted in many cases the features analysed were similar foreach video, so for simplicity we will specifically discuss twoindividual videos in greater detail: the World Cup’s Argen-tina vs. Serbia and Montenegro match, and the EurovisionSong Contest final. Both were amongst the top 5 most pop-ular videos and were representative of their genres (namelysport and music). We will refer to these files as arg-scg andeurovision respectively.
Throughout the two experiments we observed a total of1,800 unique users to the site, with each video receivingon average 68.2 unique users (and an overall maximum of383). During this period we served 925 hours of video, whichequates to 3.3 terabits of data. We received an average demandof 287 ± 31 requests per day, with Thursday being the most
popular. Throughout the day we saw the typical diurnal sinu-soidal access patterns averaging 12 ± 10 requests per hour,reaching its peak at midday with an average demand of 29requests per hour.
We witnessed 123 unique users for arg-scg, and 131unique users for eurovision, who watched for a combinedtotal of 29.1 hours and 79.6 hours respectively. Note that if anindividual does not maintain the same HTTP cookie betweensessions (e.g., their cookie is deleted) they will appear as anew unique user. Equally, if two individuals share the samecookie, they will appear as a single unique user. While weexpect these cases to be rare, they may however introduceerror into the unique user count.
4.1 Interactions
Recall that our system allowed various interactive operations,namely pausing, resuming, seeking forwards and backwards,and jumping to bookmarks. This range of operations, com-bined with the nature of the content, highly influenced userbehaviour. As a result, for most users we observed a completedeparture from the typical start-to-finish playback model thathas been noted in previous work [7].
Table 1 shows, over the duration of the experiment, thefrequency of each action and its corresponding percentageagainst all other operations. Small forward seeks were useda combined 24.9% of the time, whereas backward seekingwas only used 7.67%. These actions only accounted for therelatively small seeks (10, 30, and 60 s), whereas potentiallylarge seeks (seek-bar and following bookmarks) made up34.5% of all operations. The table also shows that in eachsession (a viewing of a single video), a user on average usedbackward actions once, bookmarks and seek bar actions 4.5times, and forward actions 3.25 times.
Table 1 Interactions observed throughout the experiment
Action Frequency Percentage Mean and standard(%) deviation (σ )
per session
Back 10 s 3098 4.50 0.59 (σ = 3.14)
Back 30 s 654 0.95 0.12 (σ = 0.83)
Back 60 s 1532 2.22 0.29 (σ = 1.90)
Forward 10 s 7438 10.79 1.41 (σ = 8.61)
Forward 30 s 1804 2.62 0.34 (σ = 2.93)
Forward 60 s 7930 11.51 1.50 (σ = 7.38)
Seek-bar 9902 14.37 1.88 (σ = 7.39)
Bookmarks 13857 20.11 2.62 (σ = 2.63)
User bookmarks 1236 1.79 0.23 (σ = 1.01)
Pause 11839 17.18 2.24 (σ = 7.65)
Resume 9616 13.96 1.82 (σ = 6.80)
123

Characterising and exploiting workloads of highly interactive video-on-demand 7
0
1000
2000
3000
4000
5000
6000
7000
8000
0 1000 2000 3000 4000 5000 6000 7000 8000
To
time
(sec
onds
)
From time (seconds)
Jump forwardJump back
0
500
1000
1500
2000
2500
3000
3500
4000
0 500 1000 1500 2000 2500 3000 3500 4000
To
time
(sec
onds
)
From time (seconds)
Jump forwardJump back
(a) (b)
Fig. 2 Jumps made by users within two videos
Previous studies have shown that the most common actionis pause/resume [7], however we see that for our traces, for-ward operations are by far the most common, closely fol-lowed by seeking to bookmarks. The table also shows thatthe number of pause operations account for 17.18% of allactions. Pausing not being the most common action can beexplained by the short session durations observed. This isin accordance with previous work which found a positivecorrelation between session time and the number of pauseoperations [14].
To better understand how users navigated through a book-marked video, we analysed the behaviour in the arg-scg andeurovision videos, which had 10 and 24 bookmarks respec-tively. In Fig. 2a and b each point is a seek that is identifiedby a “from” time on the x-axis and a “to” time on the y-axis.A point x, y therefore represents a user that has jumped fromtheir current playback point x to a new point, y. Vertical andhorizontal lines in the figures denote the position of the book-marks. The diagonal line is a current-time marker such thatseeks forward are points which lie above it, while seeks back-ward appear below it. Therefore, no point can fall preciselyon the diagonal. It is immediately obvious from the figuresthat many points are on horizontal lines, implying that mostseeks were to the bookmarks.
The forward seek buttons appear to have been mostly usedfor skipping to the next event, shown on both figures as pointsslightly above the diagonal line between the bookmarks. Thiscould be due to user unfamiliarity with the bookmark inter-face, or possibly users simply browsing the video. Backwardactions were typically used around bookmarks, where userswould often re-watch the bookmarked event. In some casesusers may also have wished to see video immediately pre-ceding the bookmark. An example of this is shown in Fig. 2abefore the bookmark at time 2,815, where users sought up to75 s backwards to see more of the build up to the goal.
Clusters of points can also be seen on horizontal linesshortly after a vertical line, indicating that users jumped from
bookmark to bookmark. In fact, the concentration of clustersof point just above the diagonal time reference indicates thatusers have a tendency to follow bookmarks in sequence, asexemplified in Fig. 2b.
Overall, for both videos these results demonstrate thatusers did not simply view continuously start-to-finish, andwere in fact highly influenced when presented with book-marks.
4.2 Seek distance
The understanding of locality is important for caching andpre-fetching algorithms. By looking at how far users soughtwe can determine the probability of accessing media nearbythe playback point. We therefore define seek distance asthe absolute difference, in seconds, between a user’s currentplayback point and their requested seek destination.
Figure 3a and b display a CDF of seek distance for back-ward and forward actions. A large proportion of seeks(between 50 and 70%) are of a 15, 30, or 60 s values. Theseseeks represent the short seek button presses. 40% of back-ward seeks were less than or equal to 15 seconds in length.This property could be exploited by keeping a small clientside buffer of previously watched segments, which wouldsatisfy many backward seeks if the user has already viewedthem.
Even though small seeks are the majority, there arebetween 30 and 50% of seeks which are further than 60 s.These seeks consist of jumps to bookmarks or “blind” seekswith the seekbar. These long range seeks are log-normallydistributed with a mean of 1,968 s and 1,630 s for forwardand backward seeks respectively. They can be fitted to log-normal models with parameters µ = 6.8269 and σ = 1.5953for forward seeks, and µ = 6.3273 and σ = 1.7906 for back-ward seeks. It can been seen that the backward distributionhas a greater positive skew than the forward distribution, thusit will generate many small seeks.
123

8 A. Brampton et al.
Fig. 3 CDF of seek distance
0 0.1 0.2 0.3 0.4 0.5 0.6 0.7 0.8 0.9
1
0 20 40 60 80 100 120 140 160 180 200
CD
F
Seek Distance (seconds)
Forward SeeksBackward Seeks
(a)
0 0.1 0.2 0.3 0.4 0.5 0.6 0.7 0.8 0.9
1
0 2000 4000 6000 8000 10000 12000 14000
CD
F
Seek Distance (seconds)
Forward SeeksBackward Seeks
(b)
1
10
100
1 10 100 1000 10000
Num
ber
of v
iew
ers
Rank
Object PopularitySegment Popularity (eurovision)
Segment Popularity (arg-scg)
Fig. 4 Object and segment popularity
These behaviours exhibit a high degree of spatial locality,with the majority of seeks being within 60 s. Regarding long-ranged seeks, the log-normally distributed models imply thatsome very large distance seeks do occur, but the majority ofseeks are shorter. Overall the seek distances exhibit a medianof 60 s for forward seeks and 34 s for backward seeks.
4.3 Popularity
We study popularity in terms of the number of viewers whowatched an object or a segment. An object in our system isa single video whereas a segment is a section of video onesecond in length.
The ranking for both object and segment popularity isshown in Fig. 4. The eurovision, and arg-scg were approxi-mately 10,000 seconds in length, causing 10,000 segmentsto be ranked for each video. Recall that only 88 videos wereavailable, so the lowest object rank is 88. Our analysis revealsthat object popularity does not follow the typical power-lawdistribution observed within CDNs [3,6,15] but instead is anormal distribution with parameters µ = 60 and σ = 32.This can be attributed to the nature of our videos and therelatively few new objects each day.
The popularity of one-second segments for all the videosexhibit a Weibull distribution with parameters λ = 2.887and k = 0.69527. Log-normal distributions provide the bestfits for the arg-scg and eurovision results independently with
parameters µ = 2.00, σ = 0.587, and µ = 2.32, σ = 0.567respectively. Note that log-normal and Weibull distributionsclosely relate to power-law or heavy-tailed distributions [9,11]: they are skewed distributions where a small percentageof samples contributes to a sizeable weight of their distri-bution. We observe that a small percentage, (the 10% mostpopular segments), accounted for about 44% of all requests.Previously, Costa et al. [7] found that for educational andentertainment content, the popularity of segments is roughlyuniformly distributed with a slight skew towards the begin-ning for entertainment content. Our result, however, impliesthat there are segments with orders of magnitude more view-ers than others.
To illustrate the order-of-magnitude differences in view-ers, we present Fig. 5a and b which show the popularityof each second of video for arg-scg and eurovision, respec-tively. The vertical lines signify the position of the book-marks; note for the eurovision video there were no bookmarksafter 6,000 s since the performances bookmarked were onlyin the first half. It is clear from the figures that there are peaksof popularity, highly influenced by the bookmarks. In arg-scg(and in other sport content) we observe that most of the book-marks are equally popular. However, in the eurovision (andother music genres), we observe there is a greater variancein the popularity of the bookmarks. This can be attributedto sports having numerous events which all users wish towatch, however in music videos there may be only certainartists which interest the user.
Popularity metrics are important to many CDN algorithmsas they help to decide which resources to allocate to eachobject. We have seen that bookmarked videos provide a con-tent format with specific segments of interest (goals, forexample). This result emphasises the use of partial cachingtechniques [4] to cache only popular segments.
4.4 Longevity
The popularity of both videos and bookmarks in our sys-tem faded over time. We call the duration at which any suchitem remains utilised its longevity. The study of a video or
123

Characterising and exploiting workloads of highly interactive video-on-demand 9
Fig. 5 Number of viewers ateach second of video (eachvertical line represents theposition of a bookmark)
0
20
40
60
80
100
0 1000 2000 3000 4000 5000 6000 7000 8000
Vie
wer
s
Time (seconds)
Kick OffGoal
Goal
GoalHalf-time
2nd half
GoalGoal
Goal
Time
0
20
40
60
80
100
120
140
0 2000 4000 6000 8000 10000
Vie
wer
s
Time (seconds)(a) (b)
100
200
300
400
500
600
0 0 1 2 3 4 5 6 7 8 9 10 11 12 13 14
Req
uest
s pe
r ho
ur
Time online (days)
Fig. 6 Bookmark utilisation over time, following initial usage
bookmark’s longevity can aid cache replacement policies, aswell as other content management decisions.
Figure 6 shows the popularity of all our bookmarks ver-sus the time they were first used. The figure suggests thatfollowing an initial peak and a slight resurgence, there wasa rapid decrease in interest after a short period. R-Squarefitting reveals that the bookmark longevity can be suitablyestimated using a Weibull distribution with λ = 3.10 andk = 0.615. This suggests that the popularity exhibits long-tailed properties. We also observe that 40% of the bookmarkusage occurs within 24 h, with the remainder slowly occur-ring over the following weeks.
The popularity of videos decreased over time, but this isnot true for the popularity of segments within the videos. Thesegments which were popular when the video was first pub-lished were still popular within the video weeks later, longafter the video had lost popularity. This was tested on eachvideo by calculating the distribution of segment popularityfor the first 50% of requests versus the last 50% of requests.The difference in distributions was minor, with an averageR-Square value of 0.9. On a visual inspection of the numberof viewers per second, it was clear that the popularity stillfocused around the bookmarks.
4.5 Session lengths
Session length is the total time a user accessed a video,regardless of the actions they may have taken whilst doing so.
For example, a session may be longer than the actual lengthof the video if the user chose to re-watch segments, and/orpause.
Figure 7a and b show the CDF of both session and inter-seek times (discussion of inter-seek times follows in the nextsubsection). It can be observed from the session times thatmost users access each video for a very short time relativeto its overall length (possibly just watching the events theyare interested in). In particular, note that in the arg-scg casearound 80% of sessions lasted less than 15 min. Given that thevideo was 2.2 h in length, 15 min corresponds to only 11% ofthe total video. A similar result was found with eurovision,with 80% of sessions lasting less than 12% of the total videoduration. The average session duration was found to be only11 and 18 min for arg-scg and eurovision respectively.
We also found that a small minority (roughly 3%) of ses-sion durations were longer than the length of a video. Of thesedurations roughly 39% were between 3 to 8 h long. Our logsshow that these users paused for a long time before decidingto resume playback.
4.6 Inter-seek times
Inter-seek time is described as the duration for which a userwatched a section of a video before seeking to a new loca-tion (disregarding any paused periods). This can be useful,for example, to determine the amount to replicate when usingpartial caching.
From our logs, we found that on average a user performed8.98 seek operations around a video, resulting in a meaninter-seek time of 50.4 s. Figure 7a and b show the CDF forinter-seek times as well as session length. As the inter-seektimes are generally shorter than session times, this impliesthat the majority of users viewed the content as a series ofexcerpts, usually under a minute in length.
The inter-seek time in the music content was found tobe on average longer. This is because the length of a book-marked musical performance generally exceeds the lengthof an event within a football match. Regardless of the differ-ence in inter-seek times, we found that they can be estimatedby log-normal distributions. For instance, the inter-seek time
123

10 A. Brampton et al.
Fig. 7 CDFs of session lengthsand inter-seek times
0
0.2
0.4
0.6
0.8
1
1 10 100 1000 10000
CD
F
Time (seconds)
Inter-seek timesSession times
0
0.2
0.4
0.6
0.8
1
1 10 100 1000 10000
CD
F
Time (seconds)
Inter-seek timesSession times
(a) (b)
for arg-scg can be modelled with parameters µ = 2.15 andσ = 1.72.
Previous studies have found that the majority of inter-seektimes are very short [14]. For educational content, inter-seektimes have also been shown to be Poisson or Pareto distrib-uted [3]. We however found only two thirds of our videos hadinter-seek times that could be suitably modelled by a Paretodistribution, and none that could be modelled well with aPoisson distribution. Models of inter-seek times can be usedby a delivery system to determine the size of video replicasand the time available to react before a user seeks elsewherein the video.
4.7 Sequence
The traces were analysed to study the extent to which users’actions could be predicted. Since jumps to bookmarks madeup a relatively large percentage of all requests, we limit thisprediction to which bookmark will be visited next. If a systemcould predict which bookmark would be requested next by auser, then it could pro-actively respond in order to optimisecontent delivery. For example, based on the next predictedbookmark, the relevant segments could be pushed out by aserver with spare capacity, or pre-fetched by a client.
We call the order that bookmarks are viewed by a sin-gle user a sequence of bookmarks. Every user’s sequencecan be aggregated together to form a directed graph. Eachnode in the graph represents a bookmark with links betweenthem representing the probability of seeking to that bookmarknext. Figure 8 shows a section of one of these directed graphsdepicted as a tree for clarity. The “Start” node represents thebeginning of the video, and the “End” node represents thecompletion of a session. There is also an “Unknown” nodewhich signifies when a seek to another bookmark has notbeen made within 200 s of visiting the previous bookmark(the observed upper bound for bookmarked events’ length).For clarity, links with low probabilities have also been aggre-gated to form a “N Others” node, where N is the number ofaggregated links.
It is clear from the figure that there are multiple choicesto visit from each node, although there is generally one link
44.2 15.6 11.7 6.5 5.8 16.2
80.0 11.8 8.2 50.0 37.5 6.3 6.3
63.6 14.1 12.1 10.1
75.0 17.1 7.9
Start
Goal 1-0 Unknown Goal 2-0 Kick Off End 7 Others
Goal 2-0 Unknown 7 Others Unknown Goal 1-0 Goal 2-0 Start
Goal 3-0 Unknown End 7 Others
Goal 4-0 Half-time 7 Others
Fig. 8 Sequence diagram for Argentina versus Serbia and Montenegrodepicted as a tree
0
0.1
0.2
0.3
0.4
0.5
0.6
0.7
0.8
0.9
1
0 20 40 60 80 100
CD
F
Sequence Graph Link Probability (%)
All linksMost popular link from each state
Fig. 9 CDF of link probabilities for all videos
that is significantly more likely to be chosen. For example,the probability of viewing bookmark “Goal 2-0” immedi-ately after “Goal 1-0” is 80%. We can also see that followingthe “Kick Off” bookmark 50% of users did not visit anotherbookmark within 200 s and instead continue to watch, thiscould indicate that this subset of users were interested inwatching the full game instead of just the highlights. Aninteresting observation for caching is the occurrence of self-loops. A total of 6% of links were between the same twobookmarks, which made up 6.5% of all requests.
To understand how many bookmark-to-bookmark linksare predictable, Fig. 9 shows a CDF of probabilities for alllinks for all videos, as well as probabilities for just the most
123

Characterising and exploiting workloads of highly interactive video-on-demand 11
Fig. 10 CDFs of wait times
0
0.2
0.4
0.6
0.8
1
0 20 40 60 80 100 120 140 160 180
CD
F
Wait time (seconds)
StartGoal 2-0Goal 1-0Goal 5-0Goal 4-0Goal 3-0
0
0.2
0.4
0.6
0.8
1
0 20 40 60 80 100 120 140 160 180
CD
F
Wait time (seconds)
StartUnited Kingdom
SerbiaFinlandRussiaIreland
Ukraine
(a) (b)
popular link from each bookmark. From this figure we canconclude that 10% of all links have more than a 58% chanceof being followed. Looking at just the most popular link fromeach bookmark we observe that over half of the bookmarkshave an outgoing link with a probability over 50%; an encour-aging result for user predictability.
In this analysis we assumed that all users will visit thebookmark in similar order, however in a large heterogeneousenvironment this may not be true. Different sub-groups maywish to view a different set of events possibly in a differentorder to other sub-groups. Across our videos we did try andidentify if there were groups of individuals that behaved dif-ferently to the majority, however none were found. This couldpossibly be due to our genre of media, with all sports fanswishing to see the same events, in the natural sequential order.
4.8 Hotspot length
Jumps to bookmarks comprised roughly 20% of all requestswith an additional 32% of seeks being within 60 s of a book-mark. Bookmarks form the majority of requests within thecontent, and represent the beginning of a popular segmentof video which we call a hotspot. The beginning of a hot-spot is generally known (i.e., the bookmark point), but theend is not. Knowing the length of the hotspot can be use-ful for numerous tasks such as caching and pre-fetching. Wetherefore define wait time as the time elapsed between a userfollowing a bookmark and seeking.
Figure 10a and b show a CDF of wait times for each book-mark in the arg-scg and eurovision videos. It can be seen thatin the football match the wait times follow a similar distri-bution, with the majority of users waiting less than 40 s (this,for example, could corresponds to the length of a run up toa goal). The eurovision results are more varied with aver-age wait times being much longer. This is due to the typicalsong in the Eurovision Song Contest being 180 s in length.Finally, there is a “Start” bookmark listed in both figures: thisis the entry point into both videos, and does not correspondto any event.
To better understand the wait times, distributions were fit-ted. In the general aggregated case a Weibull model fits best
with parameters λ = 24.594 and k = 0.7034. For individualbookmarks log-normal and Weibull models proved best inthe majority of cases. With these models the upper bound ofa hotspots’ lengths can be extrapolated by using, for example,the 95th percentile.
4.9 User behaviour models
Model fitting is important for understanding the differentproperties of the system, and aids in simulation creation andalgorithmic design. Various models have been discussed forthe different parameters of the system. In all cases many mod-els (e.g., normal, log-normal, exponential, Weibull, Pareto,Poisson, Zipf) were fitted to the data with varying success.Generally, more than one distribution fitted well. This sub-section will summarise the analytical models found for eachparameter.
Table 2 gives an overview of the best matching modelsfor each metric discussed previously, with their correspond-ing R-square values. Of particular importance are the typesof distribution which can have a significant impact on thesystem. For example, the Weibull and log-normal modelsare both long-tailed, and systems may have to anticipate theskewed distribution to cope effectively.
The models shown so far are from aggregated resultsacross all the videos. Instead, it may be interesting to modelthe different metrics of each particular video. However dueto the diversity in models and parameters it is not possible toshow each model, so instead Table 3 summaries which mod-els fit with a R-square value greater than 95%. The “maxmodels” column represents the number of datasets that areof sufficient size to have models fitted. For example, there are695 bookmarks, yet only 203 had enough data to be fitted to ahotspot length, and of these, 165 fitted well to a Log-normalmodel, 135 to a Weibull models, etc.
4.10 Summary
Our results have shown that the interactivity options avail-able to users highly influence their behaviour. In particular, itwas found that the novel interactive feature of bookmarking
123

12 A. Brampton et al.
Table 2 A summary of metricswith their correspondingdistributions
Metric Distribution R-square
Object popularity Normal ( µ = 60.129 , σ = 32.111 ) 0.97996
Segment popularity Log-normal ( µ = 0.551 , σ = 1.32 ) 0.98084
Weibull ( λ = 2.887 , k = 0.69527 ) 0.98284
Session length Log-normal ( µ = 4.73, σ = 1.90 ) 0.99779
Weibull ( λ = 233.17, k = 0.51125 ) 0.98666
Inter-seek times Log-normal ( µ = 1.2886, σ = 2.318 ) 0.99644
Weibull ( λ = 7.5243, k = 0.35646 ) 0.99353
Seek distance (forward) Log-normal ( µ = 7.2668, σ = 1.2194 ) 0.99567
Seek Distance (backward) Log-normal ( µ = 7.195, σ = 1.3132 ) 0.99083
Hotspot length Log-normal ( µ = 2.6361, σ = 1.388 ) 0.98463
Weibull ( λ = 24.594 , k = 0.7034 ) 0.99545
Bookmark longevity Weibull ( λ = 3.1004 , k = 0.61592 ) 0.99796
Table 3 Metrics for individual videos and their corresponding distributions
Metric Max models Log-normal Weibull Pareto Normal Exponential Zipf No fit
Segment popularity 84 (from 88 videos) 61 65 12 58 42 13 17
Session length 81 (from 88 videos) 75 72 0 5 31 4 0
Inter-seek times 87 (from 88 videos) 83 83 54 1 3 55 3
Hotspot length 203 (from 695 bookmarks) 165 135 91 5 48 53 22
played a pivotal role, leading to access patterns quite dis-similar from previous related studies that looked at VCR-likeinteractivity alone. The combination of our content type andthe addition of bookmarks led to users accessing content inrelatively short segments sparsely distributed throughout thelength of the videos. Segment popularity is skewed with themost popular segments clearly around the bookmarks, form-ing hotspots. From both a user and a CDN’s perspective,this can be viewed as advantageous; users can reach inter-esting content more quickly through the bookmarks, and theincreased locality of interest means CDNs can respond moreeffectively by, for example, prioritising hotspot replication.
Content placement is an important and difficult problemfor CDNs. The CDN has to decide where within the net-work to replicate or cache content. Typically the content isplaced near to the users, and replicated as a whole. How-ever, as we have seen, not all segments within a piece ofcontent are equal and a CDN can leverage this informa-tion to replicate certain segments more than others. Thisis especially useful when popularity nearly always concen-trates around bookmarks, allowing the relevant segments tobe replicated throughout the network before user demandincreases.
A CDN could be designed to handle high levels of user in-teractivity, with relatively short sessions and inter-seek times.Our results have shown that hotspots following bookmarks
were orders of magnitude shorter than the video containingthem. Furthermore, it encourages the use of an agile deliverymechanism that allows distribution of small sparsely distrib-uted segments quickly and efficiently.
We have also shown that users view the bookmarks in asimilar order, giving them a degree of predictability. Thiscould allow a CDN to exploit pre-fetching techniques toimprove the user’s experience. For example, if the CDN couldpredict the next segment the user will watch, then this couldbe pre-fetched into the user’s playback buffer and when theuser seeks to that segment there will be no delay caused byseek latency and buffering.
The use of bookmarks depends on them being well posi-tioned and of interest to the user. We noted in the first experi-ment that 40% of bookmarks had at least one user seek beforethe bookmark, with 30.7% of these seeks occurring within 5 sof jumping to the bookmark. This perhaps represents userswho were almost immediately dissatisfied with the book-mark’s location. We noted this happened consistently forroughly 6% of the total bookmarks. Upon further inspection,it appeared the bookmarks were inadvertently misplaced.This led to users performing additional seeks to find the cor-rect location, thus placing extra load on the servers.
In Sect. 5, we explore and study the implications of twotechniques designed to exploit some of the properties sug-gested from our analysis.
123
Characterising and exploiting workloads of highly interactive video-on-demand 13
5 Techniques for interactivity support
During our second video trial, we took the opportunity to gobeyond characterising user behaviour, by testing autonomiccontent management techniques in a live system. In this sec-tion we discuss and analyse a simple dynamic bookmarkplacement technique, as well as an interactivity-aware con-tent pre-fetching method based on the prediction of whichbookmark would be viewed next.
5.1 Moving bookmarks
During our video trials, bookmarks were appropriately posi-tioned by administrators before the video was published. Itwas previously noted that a small percentage of bookmarkswere unintentionally misplaced. There are many reasons whya bookmark could be misplaced, such as human error, or alack of insight into user requirements. For example: a book-mark could be placed before a penalty kick, but many usersmay first wish to see the foul that led to the penalty. As such, itcould be beneficial if the system could autonomically detectpoorly placed bookmarks and correct them based on feed-back derived from the user’s actions.
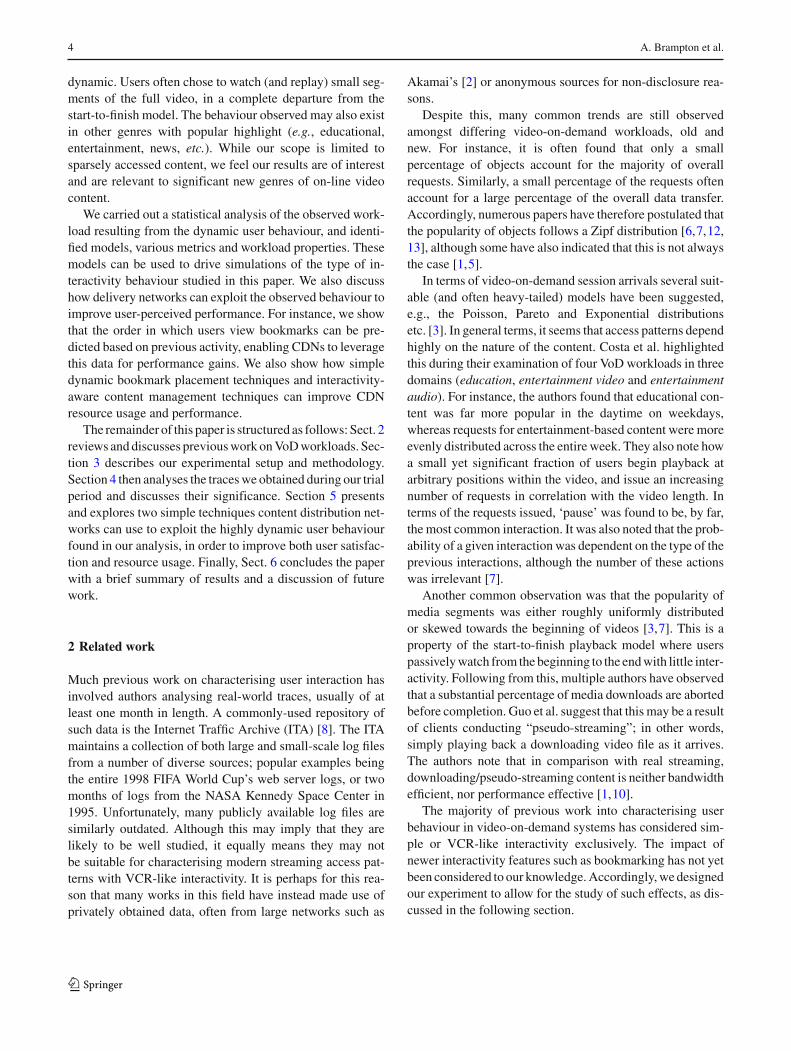
To develop a reactive algorithm that moves bookmarksdependent on user behaviour, different possible scenariosshould first be explained. Figure 11 shows three differentsequences of actions a user would follow shortly after seek-ing to a bookmark.
Scenario A shows the user briefly viewing the bookmark,then seeking to a time earlier than it. While this could indicatethat the bookmarked event was short and that the user wanted
Fig. 11 Different scenarios that may induce bookmark movement
to view it again, it could equally imply that the bookmark wasplaced later than it should have been.
Scenario B is similar to Scenario A but differs in that theuser does not seek back to a point before the bookmark; thismeans the user is simply replaying footage, thus implyingthe bookmark is correctly placed for that individual.
Scenario C represents a situation in which the user’smotives are difficult to determine. Since they watch brieflythen seek forward, several possibilities exist: the bookmarkedevent may have ended, the bookmark may have been placedprematurely, or the user is simply seeking forward towardsthe next event.
A further possibility, not shown in the figure, is for a userto seek far away from a bookmark in either direction. Sinceit is unlikely their destination would be related to the book-mark, such an action would not indicate the bookmark wasincorrectly placed.
Scenario A and Scenario C are therefore the only scenar-ios where the user’s actions could indicate the bookmark ismisplaced. All other actions should reinforce the position ofthe bookmark to reduce future movements once it is correctlyplaced. Additionally since we are less sure of the user’s inten-tions in Scenario C we should only make minor changes tothe bookmark’s placement to limit the impact of false-posi-tives.
Algorithm 1 has been developed to identify these situa-tions and act appropriately with regard to moving a book-mark. An exponential moving average (EMA) is used torecalculate the bookmark’s position with a smoothing con-stant α. The value used for α is dependent on the identifiedscenario. Initially these values were 0.1 and 0.05 allowingus to place greater confidence in the seeking-backward Sce-nario A than the seeking-forward Scenario C. These values
Algorithm 1 Bookmark moving algorithm// Bt is the location of the bookmark at time t// St is the location the user sought at time t// w is the time the user waited before seeking to Stif St < Bt then
// The user seeks backwards before the bookmarkif w <= 20 and St > (Bt − 60) then
// The seek occurred within 20 seconds of viewing the bookmarkand lands within 60 seconds of the bookmarkα = 0.1Bt+1 = αSt + (1 − α)Bt
end ifelse if St > (Bt + w) then
// The user seeks forwardif w <= 60 and St < (Bt + 120) then
// The seek occurred within 60 seconds of viewing the bookmarkand lands within 120 seconds of the bookmarkα = 0.05Bt+1 = αSt + (1 − α)Bt
end ifend if
123
14 A. Brampton et al.
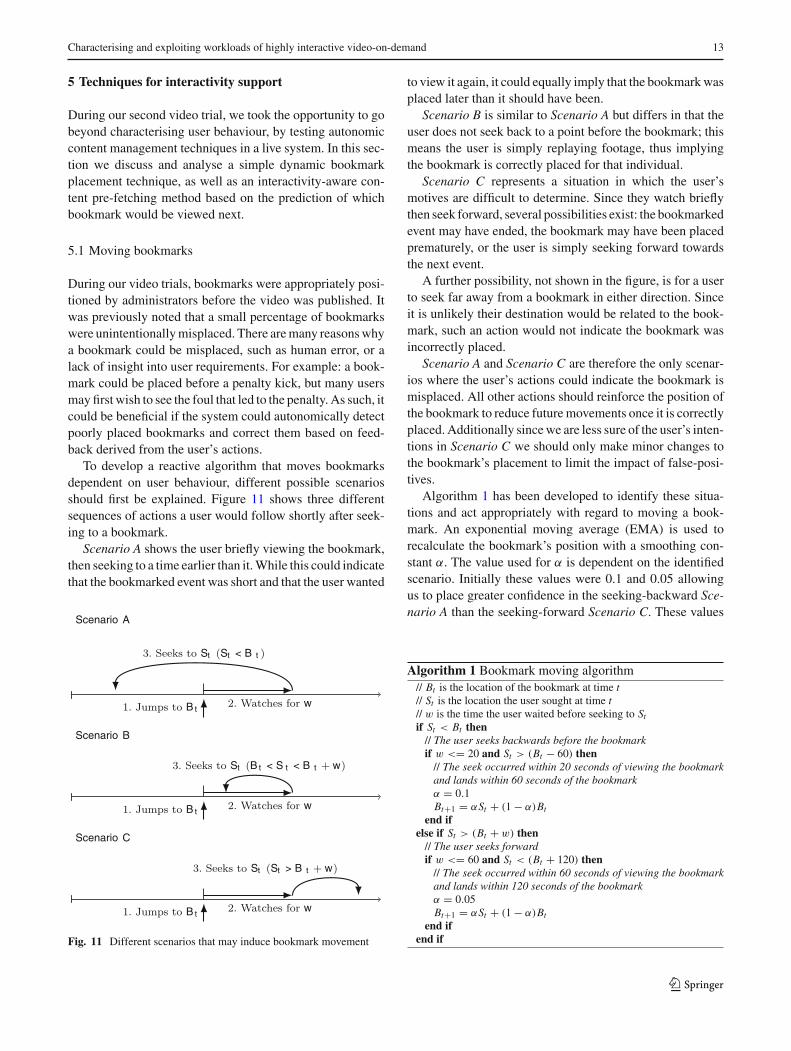
Fig. 12 Manchester Unitedversus Milan single bookmarkposition
7410
7415
7420
7425
7430
26/04 27/04 28/04 29/04 30/04 01/05 02/05 03/05 04/05 05/05
Boo
kmar
k P
ositi
on
Time (day/month)
7410
7415
7420
7425
7430
0 10 20 30 40 50 60 70 80 90
Boo
kmar
k P
ositi
on
Requests (for this bookmark)(a) (b)
were chosen as the intuitive first guesses for experimentalpurposes, and should be refined with future experiments. Forour testing scenario we also used maximum wait times of 20and 60 seconds for backward and forward seeks respectively.These maximum values were chosen because they exceededapproximately 80% of all wait times.
To test this algorithm, several of the bookmarks in oursecond video trial (not our initial World Cup experiment)were deliberately misplaced by different amounts before theyappeared on the live site. Over time the bookmarks weremoved autonomically by our algorithm. For example,Fig. 12a and b show the position of a single bookmark asit was moved by the system with respect to time and receivedrequests. In both cases the system responds and the book-mark quickly moves to a new position, and then graduallyconverges until it becomes stable. In most cases the majorityof movements were only in one direction, but for a coupleof bookmarks the positions oscillated between two values.The most prominent example of this was a foul in a footballmatch which led to a penalty. Some users wished to see thefoul but others only wished to see the penalty a minute later.In these small number of cases it is subjective to decide if abookmark is correctly placed, and in fact using this algorithmthe bookmarks may never converge to a single point. In suchcases, it may be best to bias the bookmark towards the earlierposition, so both the early and later events can easily be seen.
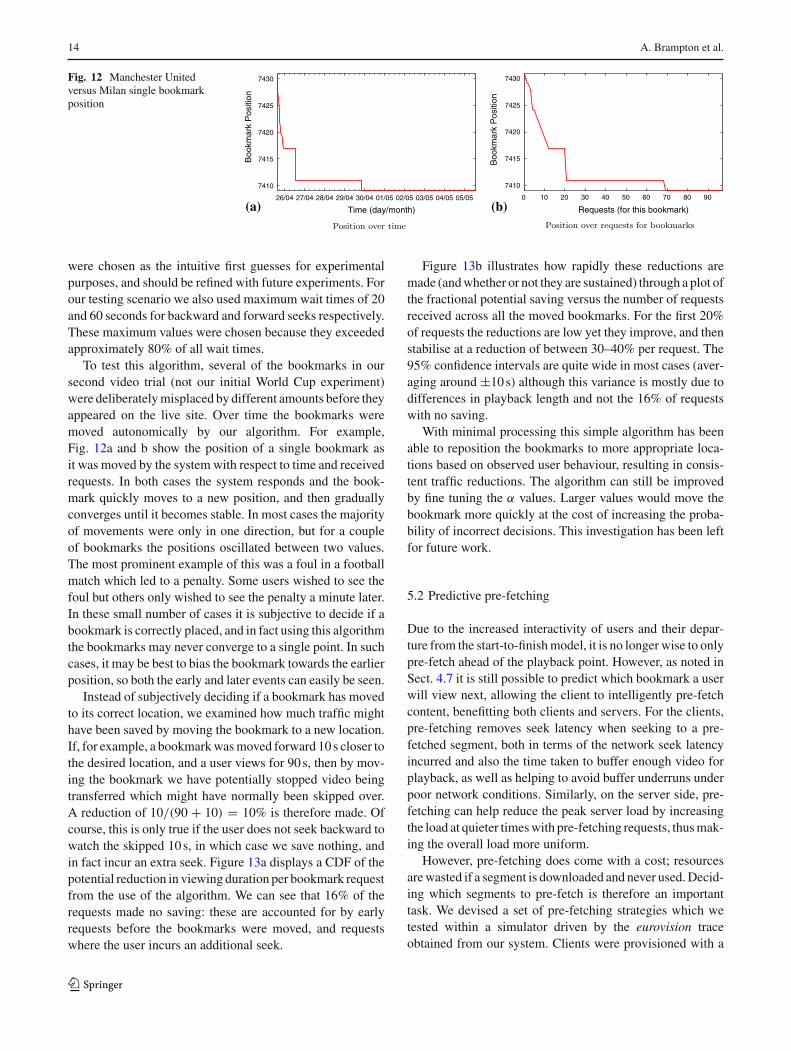
Instead of subjectively deciding if a bookmark has movedto its correct location, we examined how much traffic mighthave been saved by moving the bookmark to a new location.If, for example, a bookmark was moved forward 10 s closer tothe desired location, and a user views for 90 s, then by mov-ing the bookmark we have potentially stopped video beingtransferred which might have normally been skipped over.A reduction of 10/(90 + 10) = 10% is therefore made. Ofcourse, this is only true if the user does not seek backward towatch the skipped 10 s, in which case we save nothing, andin fact incur an extra seek. Figure 13a displays a CDF of thepotential reduction in viewing duration per bookmark requestfrom the use of the algorithm. We can see that 16% of therequests made no saving: these are accounted for by earlyrequests before the bookmarks were moved, and requestswhere the user incurs an additional seek.
Figure 13b illustrates how rapidly these reductions aremade (and whether or not they are sustained) through a plot ofthe fractional potential saving versus the number of requestsreceived across all the moved bookmarks. For the first 20%of requests the reductions are low yet they improve, and thenstabilise at a reduction of between 30–40% per request. The95% confidence intervals are quite wide in most cases (aver-aging around ±10 s) although this variance is mostly due todifferences in playback length and not the 16% of requestswith no saving.
With minimal processing this simple algorithm has beenable to reposition the bookmarks to more appropriate loca-tions based on observed user behaviour, resulting in consis-tent traffic reductions. The algorithm can still be improvedby fine tuning the α values. Larger values would move thebookmark more quickly at the cost of increasing the proba-bility of incorrect decisions. This investigation has been leftfor future work.
5.2 Predictive pre-fetching
Due to the increased interactivity of users and their depar-ture from the start-to-finish model, it is no longer wise to onlypre-fetch ahead of the playback point. However, as noted inSect. 4.7 it is still possible to predict which bookmark a userwill view next, allowing the client to intelligently pre-fetchcontent, benefitting both clients and servers. For the clients,pre-fetching removes seek latency when seeking to a pre-fetched segment, both in terms of the network seek latencyincurred and also the time taken to buffer enough video forplayback, as well as helping to avoid buffer underruns underpoor network conditions. Similarly, on the server side, pre-fetching can help reduce the peak server load by increasingthe load at quieter times with pre-fetching requests, thus mak-ing the overall load more uniform.
However, pre-fetching does come with a cost; resourcesare wasted if a segment is downloaded and never used. Decid-ing which segments to pre-fetch is therefore an importanttask. We devised a set of pre-fetching strategies which wetested within a simulator driven by the eurovision traceobtained from our system. Clients were provisioned with a
123

Characterising and exploiting workloads of highly interactive video-on-demand 15
Fig. 13 Reduction in viewingduration due to the algorithm
0 0.1 0.2 0.3 0.4 0.5 0.6 0.7 0.8 0.9
1
0 20 40 60 80 100
CD
FReduction in viewing duration (%)
0
10
20
30
40
50
0 0.1 0.2 0.3 0.4 0.5 0.6 0.7 0.8 0.9 1Red
uctio
n in
vie
win
g du
ratio
n (%
)
Fraction of bookmark requests received
Saving95% Confidence Interval
(a) (b)
dedicated link to the server, capable of transferring twicethe bitrate required to play the content. Once a client hasfetched enough data to fill a 5 s playback buffer, half of theirbandwidth is allocated to the pre-fetcher whilst the other halfcontinues to fill the playback buffer.
For simplicity, and because interest always formed aroundbookmarks, each strategy will only pre-fetch segments imme-diately following a bookmark (i.e., bookmark hotspots). Inall experiments the amount of each hotspot pre-fetched wasdetermined by varying the percentile of that particular hot-spot’s length model, as described in Sect. 4.8. The details foreach pre-fetch strategy are listed below:
Ahead simply continues to pre-fetch ahead of the play-back point assuming the client has a unlimited buffer. Thisis similar to what some existing streaming applications do.
Ahead (to hotspot end) again simply continues to pre-fetchahead of the playback point but only until the end of hotspotassociated with the bookmark being viewed.
Ahead (and Predictive) works in a similar way to Ahead(to hotspot end), however once it reaches the end of the hot-spot it begins to use the Predictive pre-fetch scheme.
Predictive uses knowledge observed from other users asto which bookmark is likely to be requested next, and thusstarts to pre-fetch the bookmark hotspots in descending orderof probability of being visited. The more users interactingwith the system, the more accurate the predictive knowledgebecomes.
Sequence will pre-fetch bookmark hotspots in the order inwhich they appear within the video regardless of the currentplayback point. For example, in a football match the goalswould be pre-fetched in a sequential order.
Sequence After again pre-fetches bookmark hotspots inthe order in which they appear within the video; the differ-ence being only hotspots that are after the current playbackpoint are fetched. For example, if a user has yet to fetch thefirst bookmark’s hotspot but is already viewing the second,then the first will not be pre-fetched.
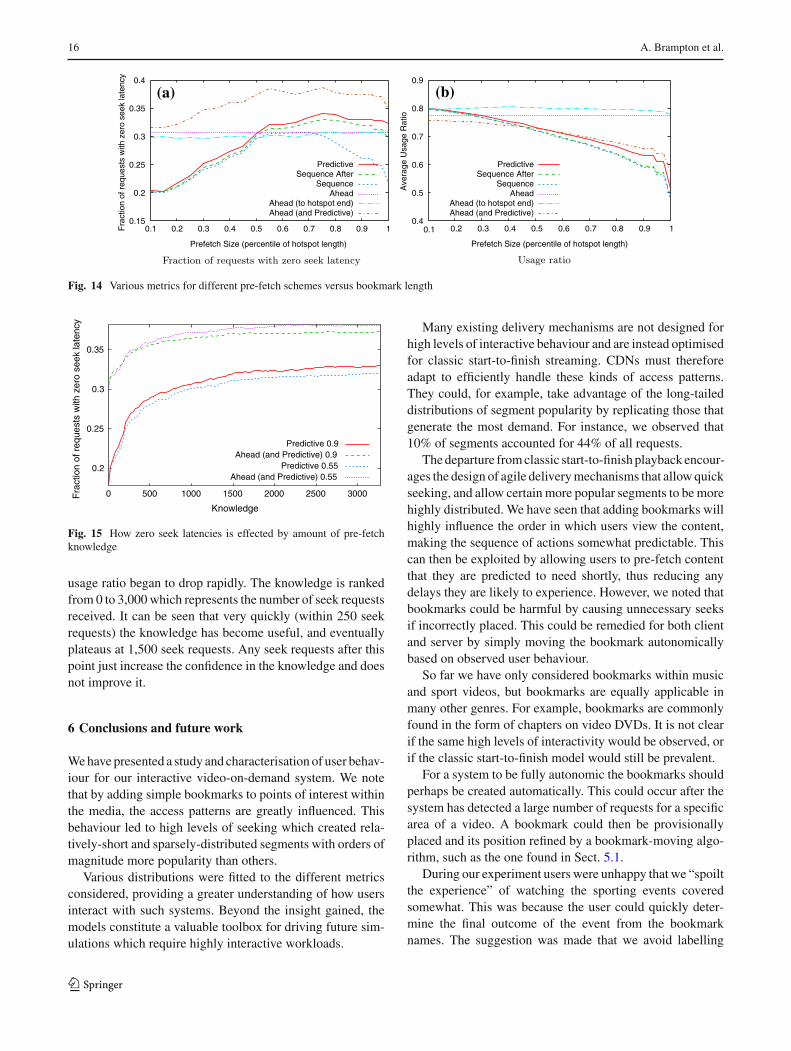
Two metrics were measured to determine how well the dif-ferent schemes behaved. The first metric displayed in Fig. 14ais the fraction of requests with zero seek latency. A seek
latency of zero occurs when the user has already pre-fetcheda playback buffer’s worth of video from a requested seekpoint. The second metric measured the ratio of fetched datawhich was never watched, and therefore needlessly fetched.This usage ratio is shown in Fig. 14b.
Using the simple Ahead scheme 31% of seeks have zerolatency, this is made up of seeks to segments that have alreadybeen viewed, and small forward seeks into the ahead buffer.Adapting this scheme to only pre-fetch to the end of thebookmarks (i.e. the Ahead (to hotspot end) scheme) has aminor negative effect on the seek latency, whilst increasingthe average usage ratio.
The Sequence and Sequence After schemes are very simi-lar, but the simple modification to the Sequence After schemeallowed it to achieve a lower seek latency whilst not degrad-ing its average usage ratio. This was because users had atendency to not seek to a bookmark before the current play-back point, and always go forward within the video, leavingthe Sequence scheme stuck pre-fetching hotspots before thecurrent playback point.
Both the Predictive and the Sequence After schemes per-form in a similar manner, with the Predictive schemes alwaysoutperforming the other. Due to this fact, the Sequence Afterscheme could be used in place of the Predictive scheme whilstknowledge is collected to improve the Predictive scheme’saccuracy.
The best outcome was the combination of Ahead and Pre-dictive schemes named Ahead (and Predictive). Thisexploited the fact that users rarely viewed beyond the endof a hotspot, and thus pre-fetching another hotspot was ofbenefit.
In the previous experiments the Predictive scheme wasprimed with knowledge from all users, but in reality thisknowledge would be built up over time. To test how quicklythis knowledge can be obtained we ran another set of experi-ments where the Predictive and Ahead (and Predictive)schemes were primed with different amounts of knowledge.The results of this are shown in Fig. 15. We set the percentilehotspot length to 0.55 and 0.9 which were chosen since 0.55is where the seek latency began to stabilise, and 0.9 where the
123
16 A. Brampton et al.
0.15
0.2
0.25
0.3
0.35
0.4
0.1 0.2 0.3 0.4 0.5 0.6 0.7 0.8 0.9 1Fra
ctio
n of
req
uest
s w
ith z
ero
seek
late
ncy
Prefetch Size (percentile of hotspot length)
PredictiveSequence After
SequenceAhead
Ahead (to hotspot end)Ahead (and Predictive)
(a)
0.4
0.5
0.6
0.7
0.8
0.9
0.1 0.2 0.3 0.4 0.5 0.6 0.7 0.8 0.9 1
Ave
rage
Usa
ge R
atio
Prefetch Size (percentile of hotspot length)
PredictiveSequence After
SequenceAhead
Ahead (to hotspot end)Ahead (and Predictive)
(b)
Fig. 14 Various metrics for different pre-fetch schemes versus bookmark length
0.2
0.25
0.3
0.35
0 500 1000 1500 2000 2500 3000Fra
ctio
n of
req
uest
s w
ith z
ero
seek
late
ncy
Knowledge
Predictive 0.9Ahead (and Predictive) 0.9
Predictive 0.55Ahead (and Predictive) 0.55
Fig. 15 How zero seek latencies is effected by amount of pre-fetchknowledge
usage ratio began to drop rapidly. The knowledge is rankedfrom 0 to 3,000 which represents the number of seek requestsreceived. It can be seen that very quickly (within 250 seekrequests) the knowledge has become useful, and eventuallyplateaus at 1,500 seek requests. Any seek requests after thispoint just increase the confidence in the knowledge and doesnot improve it.
6 Conclusions and future work
We have presented a study and characterisation of user behav-iour for our interactive video-on-demand system. We notethat by adding simple bookmarks to points of interest withinthe media, the access patterns are greatly influenced. Thisbehaviour led to high levels of seeking which created rela-tively-short and sparsely-distributed segments with orders ofmagnitude more popularity than others.
Various distributions were fitted to the different metricsconsidered, providing a greater understanding of how usersinteract with such systems. Beyond the insight gained, themodels constitute a valuable toolbox for driving future sim-ulations which require highly interactive workloads.
Many existing delivery mechanisms are not designed forhigh levels of interactive behaviour and are instead optimisedfor classic start-to-finish streaming. CDNs must thereforeadapt to efficiently handle these kinds of access patterns.They could, for example, take advantage of the long-taileddistributions of segment popularity by replicating those thatgenerate the most demand. For instance, we observed that10% of segments accounted for 44% of all requests.
The departure from classic start-to-finish playback encour-ages the design of agile delivery mechanisms that allow quickseeking, and allow certain more popular segments to be morehighly distributed. We have seen that adding bookmarks willhighly influence the order in which users view the content,making the sequence of actions somewhat predictable. Thiscan then be exploited by allowing users to pre-fetch contentthat they are predicted to need shortly, thus reducing anydelays they are likely to experience. However, we noted thatbookmarks could be harmful by causing unnecessary seeksif incorrectly placed. This could be remedied for both clientand server by simply moving the bookmark autonomicallybased on observed user behaviour.
So far we have only considered bookmarks within musicand sport videos, but bookmarks are equally applicable inmany other genres. For example, bookmarks are commonlyfound in the form of chapters on video DVDs. It is not clearif the same high levels of interactivity would be observed, orif the classic start-to-finish model would still be prevalent.
For a system to be fully autonomic the bookmarks shouldperhaps be created automatically. This could occur after thesystem has detected a large number of requests for a specificarea of a video. A bookmark could then be provisionallyplaced and its position refined by a bookmark-moving algo-rithm, such as the one found in Sect. 5.1.
During our experiment users were unhappy that we “spoiltthe experience” of watching the sporting events coveredsomewhat. This was because the user could quickly deter-mine the final outcome of the event from the bookmarknames. The suggestion was made that we avoid labelling
123

Characterising and exploiting workloads of highly interactive video-on-demand 17
the bookmarks and instead simply describe them as pointsof interest. This could equally work if the bookmarks wereautonomically created since a system would be unable toname them itself. Note, unnamed bookmarks would only beuseful if they are typically accessed sequentially, and notbased on their name alone.
It was clear that pre-fetching bookmark hotspots only cov-ered 35% of all viewed segments. Thus pre-fetching schemesshould consider more segments. This of course would makeit harder to decide which segments to pre-fetch next. Theprobability of making a wrong decision could be reduced ifthe pre-fetching technique was modified, for example pre-fetching more than one choice simultaneously.
The predictive pre-fetching algorithms used knowledgeinferred from the observations of other users. For example,if the majority of all users visited two bookmarks in the sameorder, it is likely the next user will do the same. How thisknowledge is collected, and how this knowledge is dissem-inated is left open for future study. We did not discuss whowould use this knowledge, indeed both the client and servercould exploit it differently, each with respective pros andcons. For example, if the client has spare capacity, it couldstart to pre-fetch based on both its own previous behaviourand that of the majority of other users. The server could alsodecide to pre-replicate, or to push out segments predicted tobe required when it has spare capacity.
While not the case for all content, high levels of interactiv-ity are becoming more common, whilst users are both rely-ing on and expecting video-on-demand services to providemore advanced interactive functionality. Our study suggeststhat CDN mechanisms must improve to handle more diverseapplications, content and users. To achieve this, the develop-ment of new algorithms must be driven by models derivedfrom realistic characterised workloads. The development ofsuch strategies is reliant on gaining a deep understanding ofthe relevant workload parameters. The analysis and modelspresented in this paper aim to aid in this endeavour.
References
1. Acharya, S., Smith, B., Parnes, P.: Characterizing user access tovideos on the world wide web. In: Proceedings of Multimedia Com-puting and Networking (MMCN), San Jose, California (2000)
2. Akamai: Content distribution network. http://www.akamai.com3. Almeida, J., Krueger, J., Eager, D., Vernon, M.: Analysis of educa-
tional media server workloads. In: Proceedings of the 11th Interna-tional Workshop on Network and Operating Systems Support forDigital Audio and Video (NOSSDAV), Port Jefferson, New York(2001)
4. Chen, S., Shen, B., Wee, S., Zhang, X.: Adaptive and lazy seg-mentation based proxy caching for streaming media delivery. In:Proceedings of the 13th International Workshop on Network andOperating Systems Support for Digital Audio and Video (NOSS-DAV), 22–31 (2003)
5. Cherkasova, L., Gupta, M.: Characterizing locality, evolution, andlife span of accesses in enterprise media server workloads. In: Pro-ceedings of the 12th International Workshop on Network and Oper-ating Systems Support for Digital Audio and Video (NOSSDAV),Miami Beach, Florida (2002)
6. Chesire, M., Wolman, A., Voelker, G.M., Levy, H.M.: Measure-ment and analysis of a streaming media workload. In: Proceedingsof the 3rd USENIX Symposium on Internet Technologies and Sys-tems, San Francisco, California (2001)
7. Costa, C., Cunha, I., Borges, A., Ramos, C., Rocha, M., Almeida,J., Ribeiro-Neto, B.: Analyzing client interactivity in streamingmedia. In: Proceedings of the 13th International World Wide WebConference (WWW), New York, NY (2004)
8. Danzig, P., Mogul, J., Paxson, V., Schwartz, M.: Internet trafficarchive. http://ita.ee.lbl.gov
9. Fishman, G.S., Adan, I.J.B.F.: How heavy-tailed distributions affectsimulation-generated time averages. ACM Trans. Model. Comput.Simul. (TOMACS) 16(2), 152–173
10. Guo, L., Chen, S., Xiao, Z., Zhang, X.: Analysis of multimediaworkloads with implications for Internet streaming. In: Proceedingsof the 14th International World Wide Web Conference (WWW),Chiba (2005)
11. Mitzenmacher, M.: A brief history of generative models for powerlaw and lognormal distributions. Internet Math. 1(2), 226–251
12. Sripanidkulchai, K., Maggs, B., Zhang, H.: An analysis of livestreaming workloads on the Internet. In: Proceedings of theACM SIGCOMM Internet Measurement Conference (IMC), Sicily(2004)
13. Tang, W., Fu, Y., Cherkasova, L., Vahdat, A.: MediSyn: A syntheticstreaming media service workload generator. In: Proceedings ofthe 13th International Workshop on Network and Operating Sys-tems Support for Digital Audio and Video (NOSSDAV), Monterey(2003)
14. Vilas, M., Paneda, X., Garcia, R., Melendi, D., Garcia, V.: Userbehaviour analysis of a video-on-demand service with a widevariety of subjects and lengths. In: Proceedings of the 31stEUROMICRO Conference on Software Engineering and AdvancedApplications, pp. 330–337, (2005)
15. Yu, H., Zheng, D., Zhao, B., Zheng, W.: Understanding user behav-ior in large scale video-on-demand systems. In: Proceddings ofEuroSys (2006)
123