Embed Size (px)
Citation preview

Characterisation of Major Fault Detection Featuresand Techniques for the Condition-BasedMonitoring of High-speed Centrifugal BlowersSamer GowidDepartment of Electronic, Electrical and systems Engineering, Faculty of Engineering, Loughborough University,UKDepartment of Mechanical Engineering and Industrial Engineering, College of Engineering, Qatar University,Qatar
Roger DixonDepartment of Electronic, Electrical and systems Engineering, Faculty of Engineering, Loughborough University,UK
Saud GhaniDepartment of Mechanical Engineering and Industrial Engineering, College of Engineering, Qatar University,Qatar
(Received 25 March 2014; accepted 30 September 2015)
This paper investigates and characterises the major fault detection signal features and techniques for the diagnosticsof rotating element bearings and air leakage faults in high-speed centrifugal blowers. The investigation is based ontime domain and frequency domain analysis, as well as on process information, vibration, and acoustic emissionfault detection techniques. The results showed that the data analysis method applied in this study is effective, asit yielded a detection accuracy of 100%. A lookup table was compiled to provide an integrated solution for thedeveloper of Condition-Based Monitoring (CBM) applications of centrifugal blowers. The major contribution ofthis paper is the integration and characterisation of the major fault detection features and techniques.
1. INTRODUCTION
Condition-Based Monitoring (CBM) is a strategy aimed atextending machine life, lowering maintenance cost, and in-creasing both productivity and profitability.1 Unlike preven-tative maintenance, which is based on servicing a machine atscheduled intervals, CBM relies upon actual machine healthcondition to diagnose faults and to determine when the main-tenance is required. The specific advantage of condition mon-itoring is that potential degradation or failure can be detected.This technique enables the user to take maximum advantageof the useful life of a component, such as a bearing, since theequipment can be left in service if its operational performancemeets the desired performance standards.2
Centrifugal compressors are widely used in the industry, andin particular in the oil and gas industries, as they compress thepropane and mixed refrigerants in the liquefaction process. A15 HP industrial centrifugal blower was employed for the emu-lation of high-speed centrifugal blowers. Due to the similaritybetween centrifugal blowers and centrifugal compressors,3 thiswork can be extended to centrifugal compressors and centrifu-gal equipment.
The global structure of the generally used monitoring sys-tem can be divided into three main sections: The first phaseis data collection, with data reports gathered in a digital form.The second phase is acquisition, which entails calculation ofthe statistical values and functions in time and frequency do-main with integrated data reduction by fault and operational
pattern. The more difficult third phase of automatic fault diag-nostics is still under development and permanently adapted tothe necessities of industrial applications, mainly dependent onthe acting personnel at the monitoring system.4
Machine condition, machine faults, and on-going damagecan be identified in operating machines by fault symptoms andsignatures. Mechanical vibration, acoustic emission (AE), andprocess information are the three major fault detection tech-niques in addition to monitoring changes in process operat-ing parameters, such as pressure, temperatures, and efficiency.Thus, this study will provide a characteristics investigationbased on these major techniques, which should be included inany full capabilities condition-based maintenance system. In-tegrating these techniques can yield early detection and trend-ing of numerous equipment faults. Moreover, it could have apotential to reduce false alarms due to noise and fault interfer-ence issues.
Vibrations of machines are the results of the dynamic forcesdue to moving parts and structures (for example, foundations),which are interlinked to the machine and its mechanical prop-erties. All machine components generate specific vibrationsignatures which are then transmitted to the machine’s struc-ture. Vibration analysis detects repetitive motions of a sur-face on rotating or oscillating machines. The repetitive mo-tions may be caused by unbalance, misalignment, resonance,electrical effects, rolling element bearing faults, or many otherproblems. The various vibration frequencies in a rotating ma-
184 http://dx.doi.org/10.20855/ijav.2016.21.2410 (pp. 184–191) International Journal of Acoustics and Vibration, Vol. 21, No. 2, 2016
S. Gowid, et al.: CHARACTERISATION OF MAJOR FAULT DETECTION FEATURES AND TECHNIQUES FOR THE CONDITION-BASED. . .
chine are directly related to the geometry and the operatingspeed of the machine. By knowing the relationship betweenthe frequencies and the types of defects, vibration analysts candetermine the cause and severity of faults or problem condi-tions. The history of the machine and the previous degradationpattern are important factors in determining the current and fu-ture operating condition of the machine. Frequency, displace-ment, velocity acceleration, and phase angle are the major fivecharacteristics of rotating machine vibration.5
Unlike the mechanical vibration technique, the AE tech-nique is less affected by noise and detects faults such as frictionin bearing in their early stages. All rotating equipment pro-duces frictional forces with high frequency ultrasonic signa-tures, which are often masked by ambient plant noise and lowfrequency vibrations.6 As the defect size increased, acousticemission, root mean square, maximum amplitude, and kurto-sis values increased; however, observations of correspondingparameters from vibration measurements were disappointing.7
For rotating machinery, the most commonly measured AEparameters for diagnostics are amplitude, RMS, energy, kur-tosis, crest factor, counts, and events. Observations of thefrequency spectrum, whilst informative for traditional non-destructive evaluation, were found to have a limited successin machinery monitoring. This is primarily due to the broadfrequencies associated with the sources of generation of AE inrotating machinery. For example, the transient impulse associ-ated with the breakage of contacting surface asperities experi-encing relative motion will excite a broad frequency range.6
The process parameters such as pressure, temperature, vi-bration, and flow rate, and material samples such as oil andair are also used to monitor machine conditions. With theseparameters and samples, condition-based maintenance obtainsindications of system and equipment health, performance, andintegrity, and provides information for scheduling timely cor-rection.8
Tandon and Nakra investigated AE counts and peak ampli-tudes for an outer race defect using a resonant type transducer.It was concluded that AE counts increased with increasing loadand rotational speed. However, it was observed that AE countscould only be used for defect detection when the defect wasless than 250 µm in diameter, though AE peak amplitude pro-vided an indication of defects irrespective of the defect size.8
Rogers utilised the AE technique for monitoring slow rotatinganti-friction slew bearings on cranes employed for gas produc-tion, and obtained encouraging results compared to vibrationmonitoring techniques. Rubbing of the crack faces, grindingof the metal fragments in the bearing, and impacts between therolling elements and the damaged parts in the loaded zone wereidentified as sources of detectable AE signatures. The authorstated that “because of the slow rotational speed of the crane,application of conventional vibration analysis (0–20 kHz) wasof limited value for on-line condition monitoring.” AE reso-nant transducers between 100 kHz and 300 kHz were found tobe informative for online monitoring of bearings using kurto-sis at different frequency bands.9 Wang and Hu investigateduncertainties and ambiguities that exist between pump faultsymptoms and the events using a spectral features-based tech-nique. The research resulted in an effective approach to solvethe problem of fault diagnostics. Fuzzy logic was used tomodel the uncertainty and ambiguity relationship among dif-ferent faults, analyse the fuzzy information that existed in the
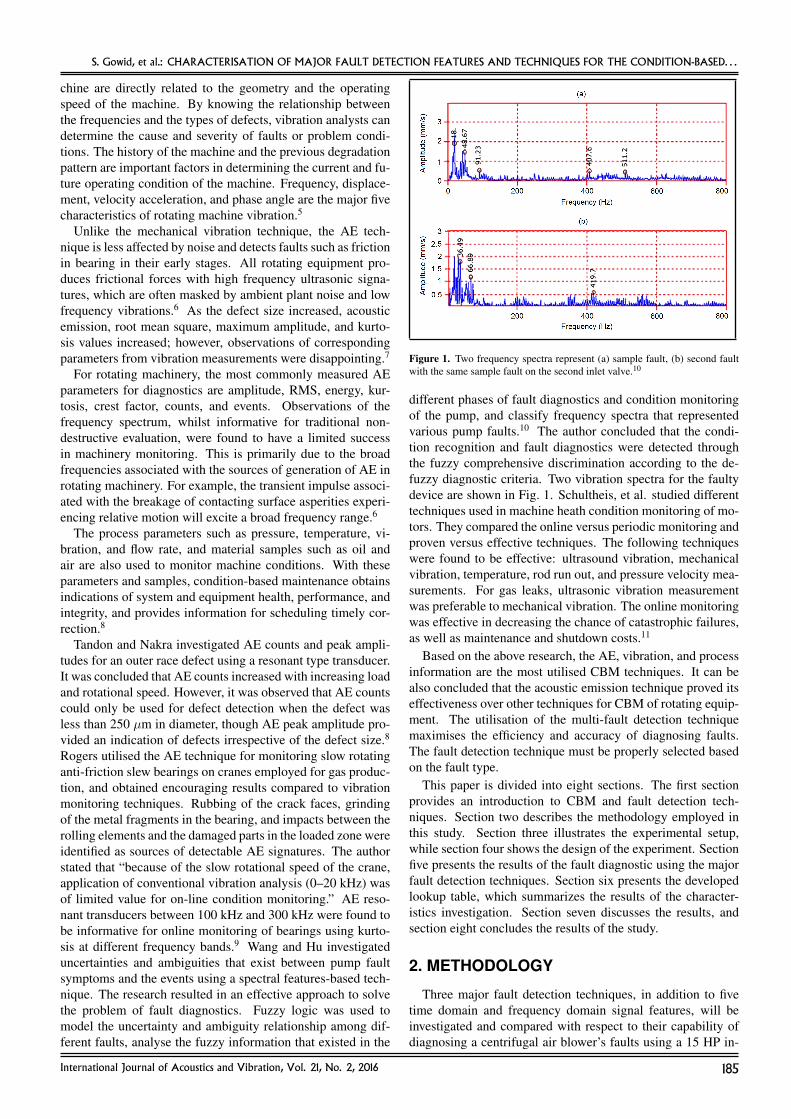
Figure 1. Two frequency spectra represent (a) sample fault, (b) second faultwith the same sample fault on the second inlet valve.10
different phases of fault diagnostics and condition monitoringof the pump, and classify frequency spectra that representedvarious pump faults.10 The author concluded that the condi-tion recognition and fault diagnostics were detected throughthe fuzzy comprehensive discrimination according to the de-fuzzy diagnostic criteria. Two vibration spectra for the faultydevice are shown in Fig. 1. Schultheis, et al. studied differenttechniques used in machine heath condition monitoring of mo-tors. They compared the online versus periodic monitoring andproven versus effective techniques. The following techniqueswere found to be effective: ultrasound vibration, mechanicalvibration, temperature, rod run out, and pressure velocity mea-surements. For gas leaks, ultrasonic vibration measurementwas preferable to mechanical vibration. The online monitoringwas effective in decreasing the chance of catastrophic failures,as well as maintenance and shutdown costs.11
Based on the above research, the AE, vibration, and processinformation are the most utilised CBM techniques. It can bealso concluded that the acoustic emission technique proved itseffectiveness over other techniques for CBM of rotating equip-ment. The utilisation of the multi-fault detection techniquemaximises the efficiency and accuracy of diagnosing faults.The fault detection technique must be properly selected basedon the fault type.
This paper is divided into eight sections. The first sectionprovides an introduction to CBM and fault detection tech-niques. Section two describes the methodology employed inthis study. Section three illustrates the experimental setup,while section four shows the design of the experiment. Sectionfive presents the results of the fault diagnostic using the majorfault detection techniques. Section six presents the developedlookup table, which summarizes the results of the character-istics investigation. Section seven discusses the results, andsection eight concludes the results of the study.
2. METHODOLOGY
Three major fault detection techniques, in addition to fivetime domain and frequency domain signal features, will beinvestigated and compared with respect to their capability ofdiagnosing a centrifugal air blower’s faults using a 15 HP in-
International Journal of Acoustics and Vibration, Vol. 21, No. 2, 2016 185

S. Gowid, et al.: CHARACTERISATION OF MAJOR FAULT DETECTION FEATURES AND TECHNIQUES FOR THE CONDITION-BASED. . .
dustrial air blower system, high-speed NI DAQ system, broadfrequency range AE sensor, vibration sensor, and a pressuresensor.
This paper will utilise a recent Fast Fourier Transform(FFT)-based segmentation and features selection algorithm inthe selection of best spectral feature sets.12 A “lookup table”will then be developed to characterise the major fault detectiontechniques and signal analysis methods for the condition-basedmonitoring of centrifugal blowers. The table will combine in-formation from several fault detection techniques, includingAE vibration, pressure, crest factor, energy factor, RMS, am-plitude, and spectral features. This approach is found to havegreat potential for the development of CBM systems for typicalcentrifugal equipment and improves the accuracy of detectioncompared with the use of a single fault detection technique.
3. EXPERIMENTAL SETUP
Experimental tests were conducted in a laboratory environ-ment hosted by Qatar University using a Paxton AT1200 in-dustrial single-stage centrifugal air blower system. The blowerhas a maximum flow rate of 800 CFM @70” W/C. Figure 2shows the single-stage centrifugal blower.
The air blower system consists of a 15 HP DC motor, a DCinverter for motor speed control, a 4” hose, a 4” air flow controlvalve, and a centrifugal air blower. Four factory calibrated AEsensors from Physical Acoustics were utilised to measure theacoustic signals, along with two low frequency range sensorswith an operating range of 35–100 kHz (Model: R6a) and twohigh frequency range sensors with an operating range of 100–1000 kHz (model: UT1000). The AE sensors were positionedas close as possible to the bearings, as shown in Figs. 3 and 4.However, the AE sensor can measure any frequency outside itsoperating bandwidth, but with less sensitivity. A 70 g triax-ial vibration sensor was positioned midway between the shaftbearings, and a pressure sensor was installed in the outlet pipeand was positioned 50 cm away from the outlet of the blower.
The schematic of the experimental setup is shown in Fig. 4.The AE sensors were attached to signal conditioners and pro-grammable low pass filters with isolated grounds to combatthe problem of aliasing in sampling signals. A cut-off fre-quency of 200 kHz was set to attenuate high frequency AEsignals. The models of bearings A and B are DKT-7203BMPand FAG-2203TV, respectively. The data was collected usingan MSeries- PCI 6250 National Instruments data acquisitionboard with 16 channels, 16-bit resolution, and a 1.25 MS/ssampling rate.
4. DESIGN OF EXPERIMENT
Bearing problems account for over 40% of machine break-downs.8 Thus, this experimental work focuses on bearingsfaults in centrifugal blowers, and investigates the issue of faultinterference, as well. Typical causes of bearing faults are ex-cessive load, overheating, false brinelling, true brinelling, nor-mal fatigue failure, reverse loading, contaminations, lubricantfailure, corrosion, misalignment, loose fits, and tight fits.13
Two typical bearing failure modes were selected to evaluatethe addressed detection techniques — true brinelling and nor-mal fatigue failures. Brinelling occurs when loads exceed the
Figure 2. Single stage centrifugal blower.
Figure 3. Positions of AE sensors.
elastic limit of the ring material. Brinell marks show as inden-tations in the raceways, and these increase bearing vibration(noise). Severe brinell marks can cause premature fatigue fail-ure. Fatigue failure, usually referred to as spalling, is the frac-ture of the running surfaces and subsequent removal of smalldiscrete particles of material. Spalling can occur on the innerring, outer ring, or balls.13
Figure 5 illustrates the faults in bearings A and B. Bear-ing A has a 2 mm throughout hole in the outer race to em-ulate a brinelling fault, while bearing B has four notches inboth sides with a maximum notch width of 1.5 mm to em-ulate a fatigue fault. Five Machine Conditions (MC) wereemulated at an ambient temperature of 22oC as shown in Ta-ble 1. Several tests were conducted under three different opera-tional speeds to check the functionality and proper installationof sensors using the experimental setup shown in Fig. 3. Tocontrol the speed-related risks, the speed was increased from3,600 to 6,960 RPM, and then to 15,650 RPM. The R6a sen-sor, which was directly positioned above bearing A, gave thehighest reading at 15,650 RPM. Hence, as the experiment wasdesigned to have only one AE sensor, the bearing A R6a sensorwas selected for its proper installation and high sensitivity. Inthis study, the measured AE frequencies ranged from 2 kHz to121 kHz.
Five experiments were conducted in a laboratory at themaximum blower rotational speed of 15,650 RPM (maximumpower). The operating point of the blower was set to maximumto emulate industrial air blower systems. The first experiment
186 International Journal of Acoustics and Vibration, Vol. 21, No. 2, 2016

S. Gowid, et al.: CHARACTERISATION OF MAJOR FAULT DETECTION FEATURES AND TECHNIQUES FOR THE CONDITION-BASED. . .
Figure 4. The schematic of the experimental setup.
Table 1. Machine health conditions.
Machine Bearing A Bearing B Air leakageConditionMC 1 Healthy Healthy NoMC 2 Healthy Healthy YesMC 3 Outer race defect Healthy NoMC 4 Healthy Outer race defect NoMC 5 Outer race defect Outer race defect No
emulated the healthy condition, the second experiment emu-lated the air leakage problem, and the remaining experimentsemulated the three bearing fault conditions. Faults emulatedin MC 5 are a combination of MC 3 and MC 4 faults. Theflow control valve was partially closed to maintain an outletair pressure of 1.165 BarA. To emulate the air leakage problem(MC 2), the control valve was set to fully open. The majorityof air leakages occur because of either a crack in blower case,rapture in hose, or a joint failure. The data were sampled usingthe high speed NI DAQ board at a sampling rate of 1 MS/s fora time period of 187 seconds. For each of the five conditions,10 data sets were collected at a fixed time interval of 13 second(one set every 13 second). Each data set had a size of 1×10⁶
samples and a sampling rate of 1 MHz. The first samples forthe five machine conditions were taken 60 seconds after theblower reached its full rotation speed. Fifty percent of the 50data set were used for training while the remaining sets wereused for testing.
5. FAULT DIAGNOSTIC USING MAJORFAULT DETECTION TECHNIQUES
In this section, the fault detection capabilities of the threemajor fault detection techniques14 are investigated and as-sessed for the diagnostics of typical centrifugal blowers’ faults,namely Acoustic Emission (AE), vibration, and process infor-mation techniques.
5.1. Acoustic Emission TechniqueThe AE signals were measured using bearing A R6a AE
sensor. Four samples were collected for each machine condi-tion. Matlab was used to calculate the following time domainfeatures: RMS, amplitude, crest factor, and energy. The fre-quency domain was also utilized and the AE spectral features
(a) Bearing A
(b) Bearing B
Figure 5. Notches in the outer races of bearings A and B.
were extracted. Machine conditions were grouped into threedifferent groups. The first group includes MCs 1 and 2, thesecond group includes MCs 3 and 5, and the third group in-cludes MC 4 only.
Table 2 shows the RMS values of training sets. The RMSvalues shown in Table 2 can be used to detect MC 1, MC 2,MC 4, and group 2. The principal drawback of the AE RMSfeature is that it cannot be utilized for the detection of all ma-
International Journal of Acoustics and Vibration, Vol. 21, No. 2, 2016 187

S. Gowid, et al.: CHARACTERISATION OF MAJOR FAULT DETECTION FEATURES AND TECHNIQUES FOR THE CONDITION-BASED. . .
Table 2. AE RMS Values (V).
1 2 3 4 Min MaxMC 1 0.294 0.310 0.310 0.306 0.294 0.310MC 2 0.342 0.352 0.325 0.321 0.321 0.352MC 3 0.575 0.611 0.607 0.603 0.575 0.611MC 4 2.824 2.834 2.552 2.468 2.468 2.834MC 5 0.713 0.593 0.470 0.457 0.457 0.713
Table 3. AE maximum amplitude values (V).
1 2 3 4 Min MaxMC 1 1.347 1.445 1.389 1.273 1.273 1.445MC 2 1.917 2.037 1.564 1.635 1.564 2.037MC 3 4.622 4.494 4.520 5.015 4.494 5.015MC 4 10.512 10.555 10.207 9.979 9.979 10.555MC 5 4.465 3.638 3.521 3.588 3.521 4.465
Table 4. AE crest factors.
1 2 3 4 Min MaxMC 1 4.585 4.662 4.486 4.165 4.165 4.662MC 2 5.602 5.785 4.816 5.097 4.816 5.785MC 3 8.044 7.351 7.449 8.319 7.351 8.319MC 4 3.723 3.724 3.999 4.043 3.723 4.043MC 5 6.262 6.137 7.493 7.845 6.137 7.845
chine conditions.Table 3 shows the calculated signal maximum amplitudes
of the training sets. The Maximum amplitude feature can beused to differentiate between all machine faults. For severalmachine conditions, the maximum amplitude values are closeto each other, which will definitely affect the accuracy of de-tection.
Table 4 presents the calculated crest factors of training sets.The crest factor is equal to the RMS value divided by the max-imum amplitude of the same signal. The crest factor featurecan be utilized to differentiate between MC 1, MC 2, MC 4,and group 2. This time domain feature cannot be utilized forthe detection of all machine faults.
Table 5 displays the AE energy values of training sets. Theenergy feature can be utilized to differentiate between MC 1,MC 2, MC 4, and group 2. As the difference between the en-ergy values of MC 1 and MC 2 is large, this time series featurecan be better utilized to differentiate between MC 1 and MC 2which gives the energy feature a benefit over RMS, amplitudeand crest factor features. The main drawback is that the energyfeature cannot be utilized to detect all machine conditions.
Figure 6 illustrates the difference in the values of RMS, crestfactor, amplitude, and energy time domain AE signal features.Although the energy feature is best in comparison to others,it cannot be fully utilized to differentiate between condition 3and 4.
An FFT-based segmentation and features selection algo-rithm was utilized to check the suitability of AE spectral fea-tures for the detection of machine conditions. The range ofthe measured AE frequency was 2 kHz to 121 kHz. Moreover,the algorithm investigated the segment sizes (number of divi-sions) that can be utilized for pattern classification. The selec-
Table 5. AE energy values (J).
1 2 3 4 Min MaxMC 1 86,261 96,088 95,869 93,358 86,261 96,088MC 2 117,079 124,004 105,439 102,940 102,940 124,004MC 3 330,158 373,780 368,167 363,459 330,158 373,780MC 4 7,973,092 8,031,877 6,514,243 6,093,149 6,093,149 8,031,877MC 5 508,308 351,403 220,829 209,173 209,173 508,308
Figure 6. Graphical presentation for the AE RMS, amplitude, crest factor andenergy values.
188 International Journal of Acoustics and Vibration, Vol. 21, No. 2, 2016

S. Gowid, et al.: CHARACTERISATION OF MAJOR FAULT DETECTION FEATURES AND TECHNIQUES FOR THE CONDITION-BASED. . .
Table 6. Segmented FFT AE spectra.
S MC 1 MC 2 MC 3 MC 4 MC 5121 kHz 0 1 0 1 0120 kHz 0 1 0 1 0119 kHz 1 1 1 1 1118 kHz 0 0 1 1 1117 kHz 1 1 0 1 1116 kHz 1 1 0 1 1115 kHz 0 1 0 1 1114 kHz 0 1 1 1 1113 kHz 0 1 1 1 1112 kHz 0 1 1 1 1111 kHz 0 1 1 1 1110 kHz 0 1 1 1 1109 kHz 0 1 1 1 1108 kHz 1 1 1 1 1
107: 2 kHz 1 1 1 1 11 kHz 1 1 1 1 1
Table 7. AE crest factors.
1 2 3 4 Min MaxMC 1 1.663 1.655 1.633 1.629 1.629 1.663MC 2 1.660 1.660 1.662 1.662 1.660 1.662MC 3 1.872 1.853 1.828 1.823 1.823 1.872MC 4 1.668 1.653 1.628 1.626 1.626 1.668MC 5 1.685 1.668 1.636 1.630 1.630 1.685
tion of the most suitable maximum Segment size (S) dependson the detection accuracy required.12 Table 6 shows the detec-tion accuracy at different segment sizes where 0 means that thefault cannot be detected at this maximum segment size, while 1means that the fault can be detected. All machines conditionswere detected at a maximum segment size of 108 kHz and aconfidence level of 3. At this segment size, the AE frequencyspectrum was divided into two divisions; the first frequencydivision ranged from 2 kHz to 108 kHz, while the second di-vision ranged from 108 kHz to the maximum measured fre-quency, 121 kHz. At a segment size of 1 kHz, all machineconditions were successfully detected with a confidence levelof 93. At this segment size, the AE frequency spectrum wasdivided into 119 equal divisions of 1 kHz each.
The confidence level is defined as the difference betweenthe highest number of matching features between the signalfeatures and the corresponding fault benchmark features, andbetween the second highest number of matching features be-tween the same signal features and another fault benchmarkfeatures. The larger the value of the difference, the better con-fidence level.12
5.2. Vibration TechniqueDue to the high stiffness of the blower structure in the ver-
tical and horizontal directions, the vertical and horizontal vi-bration signals were weak, and peak amplitudes were close toeach other. Hence, the axial vibration signals were found to bemore informative. The axial RMS vibration values of the train-ing sets shown in Table 7 can be used only for the detection ofMC 3. All other machine conditions have very close RMS val-ues, which prevents the use of this feature for the detection offault conditions of a centrifugal blower.
The maximum amplitudes of all vibration signals are almostequal, and the maximum amplitude feature cannot be utilizedfor the detection of faults. The vibration crest factors of thefour training sets can be utilized only for the detection of MC 3(see Table 8). All other machine conditions have very closecrest factors, which prevents the use of this feature for the de-
Table 8. AE crest factors.
1 2 3 4 Min MaxMC 1 2.999 3.018 3.056 3.068 2.999 3.068MC 2 3.003 2.999 3.008 2.992 2.992 3.008MC 3 2.671 2.696 2.733 2.740 2.671 2.740MC 4 2.994 3.023 3.066 3.073 2.994 3.073MC 5 2.962 2.997 3.051 3.052 2.962 3.052
Table 9. AE crest factors.
1 2 3 4 Min MaxMC 1 922,397 913,554 889,123 884,541 884,541 922,397MC 2 918,251 918,949 920,443 920,779 918,251 920,779MC 3 1,167,622 1,144,503 1,114,004 1,107,512 1,107,512 1,167,622MC 4 927,033 911,303 883,697 881,439 881,439 927,033MC 5 946,480 927,465 892,592 885,805 885,805 946,480
Table 10. Segmented FFT vibration spectra.
S MC 1 MC 2 MC 3 MC 4 MC 510 Hz 1 1 1 1 1110 Hz 1 1 1 1 1210 Hz 1 1 1 1 1310 Hz 1 0 1 1 1410 Hz 1 0 1 1 1510 Hz 1 0 1 0 1610 Hz 1 1 1 1 0710 Hz 0 0 1 0 0810 Hz 1 1 1 1 1910 Hz 1 1 1 1 0
1010 Hz 0 1 1 1 01110 Hz 0 1 1 1 01210 Hz 0 1 1 1 01310 Hz 0 0 1 1 01410 Hz 0 0 1 1 01510 Hz 0 0 1 0 01610 Hz 0 0 1 0 01710 Hz 0 0 1 0 11810 Hz 0 1 1 1 11910 Hz 0 1 1 1 1
tection of fault conditions of a centrifugal blower.The calculated energy values of the training sets shown in
Table 9 can be utilized only for the classification of MC 3.All other machine conditions have intersected values, whichprevents the use of this feature for the detection of machinefaults.
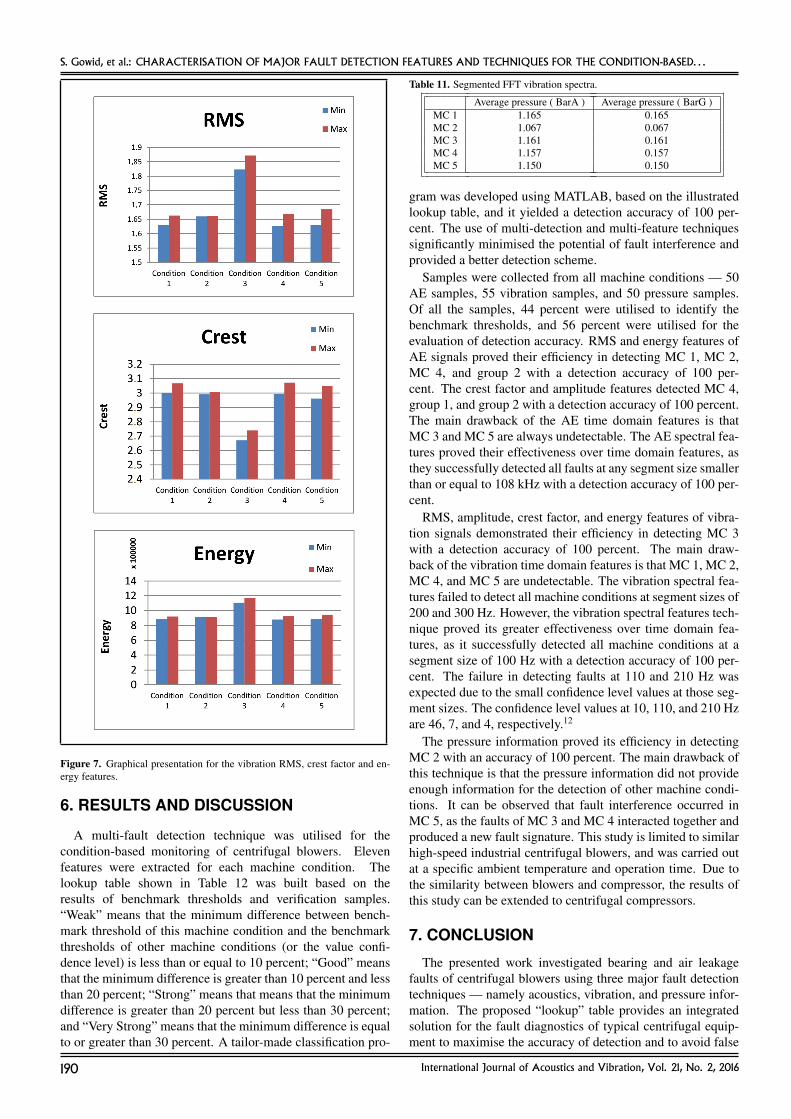
Figure 7 illustrates the difference in the values of RMS,crest factor, and energy time domain vibration signal features.Based on the values shown in Fig. 7, the vibration time do-main features can be effectively utilized to detect MC 3. Thefeatures of other machine faults interfered, however, and can-not be utilized for detecting other machine faults such as MC 1,MC 2, MC 4 and MC 5.
Table 10 shows the detectability of all machine conditionsat different segment sizes.12 All machine conditions were de-tected at a Segment size (S) of 210 Hz and a confidence levelof 4. At segment sizes of 10 and 110 Hz, all machine condi-tions were successfully detected. The confidence levels were46 and 7, respectively.
5.3. Process Information TechniqueThe average pressure information was selected to be inves-
tigated as a major process information for centrifugal blow-ers. A pressure sensor was installed in the air outlet tube torecord the operating pressure. The average pressure shown inTable 11 was calculated based on four consecutive reading foreach machine condition. The analysis showed that this featurecan only be utilized for the classification of MC 2.
International Journal of Acoustics and Vibration, Vol. 21, No. 2, 2016 189
S. Gowid, et al.: CHARACTERISATION OF MAJOR FAULT DETECTION FEATURES AND TECHNIQUES FOR THE CONDITION-BASED. . .
Figure 7. Graphical presentation for the vibration RMS, crest factor and en-ergy features.
6. RESULTS AND DISCUSSION
A multi-fault detection technique was utilised for thecondition-based monitoring of centrifugal blowers. Elevenfeatures were extracted for each machine condition. Thelookup table shown in Table 12 was built based on theresults of benchmark thresholds and verification samples.“Weak” means that the minimum difference between bench-mark threshold of this machine condition and the benchmarkthresholds of other machine conditions (or the value confi-dence level) is less than or equal to 10 percent; “Good” meansthat the minimum difference is greater than 10 percent and lessthan 20 percent; “Strong” means that means that the minimumdifference is greater than 20 percent but less than 30 percent;and “Very Strong” means that the minimum difference is equalto or greater than 30 percent. A tailor-made classification pro-
Table 11. Segmented FFT vibration spectra.
Average pressure ( BarA ) Average pressure ( BarG )MC 1 1.165 0.165MC 2 1.067 0.067MC 3 1.161 0.161MC 4 1.157 0.157MC 5 1.150 0.150
gram was developed using MATLAB, based on the illustratedlookup table, and it yielded a detection accuracy of 100 per-cent. The use of multi-detection and multi-feature techniquessignificantly minimised the potential of fault interference andprovided a better detection scheme.
Samples were collected from all machine conditions — 50AE samples, 55 vibration samples, and 50 pressure samples.Of all the samples, 44 percent were utilised to identify thebenchmark thresholds, and 56 percent were utilised for theevaluation of detection accuracy. RMS and energy features ofAE signals proved their efficiency in detecting MC 1, MC 2,MC 4, and group 2 with a detection accuracy of 100 per-cent. The crest factor and amplitude features detected MC 4,group 1, and group 2 with a detection accuracy of 100 percent.The main drawback of the AE time domain features is thatMC 3 and MC 5 are always undetectable. The AE spectral fea-tures proved their effectiveness over time domain features, asthey successfully detected all faults at any segment size smallerthan or equal to 108 kHz with a detection accuracy of 100 per-cent.
RMS, amplitude, crest factor, and energy features of vibra-tion signals demonstrated their efficiency in detecting MC 3with a detection accuracy of 100 percent. The main draw-back of the vibration time domain features is that MC 1, MC 2,MC 4, and MC 5 are undetectable. The vibration spectral fea-tures failed to detect all machine conditions at segment sizes of200 and 300 Hz. However, the vibration spectral features tech-nique proved its greater effectiveness over time domain fea-tures, as it successfully detected all machine conditions at asegment size of 100 Hz with a detection accuracy of 100 per-cent. The failure in detecting faults at 110 and 210 Hz wasexpected due to the small confidence level values at those seg-ment sizes. The confidence level values at 10, 110, and 210 Hzare 46, 7, and 4, respectively.12
The pressure information proved its efficiency in detectingMC 2 with an accuracy of 100 percent. The main drawback ofthis technique is that the pressure information did not provideenough information for the detection of other machine condi-tions. It can be observed that fault interference occurred inMC 5, as the faults of MC 3 and MC 4 interacted together andproduced a new fault signature. This study is limited to similarhigh-speed industrial centrifugal blowers, and was carried outat a specific ambient temperature and operation time. Due tothe similarity between blowers and compressor, the results ofthis study can be extended to centrifugal compressors.
7. CONCLUSION
The presented work investigated bearing and air leakagefaults of centrifugal blowers using three major fault detectiontechniques — namely acoustics, vibration, and pressure infor-mation. The proposed “lookup” table provides an integratedsolution for the fault diagnostics of typical centrifugal equip-ment to maximise the accuracy of detection and to avoid false
190 International Journal of Acoustics and Vibration, Vol. 21, No. 2, 2016

S. Gowid, et al.: CHARACTERISATION OF MAJOR FAULT DETECTION FEATURES AND TECHNIQUES FOR THE CONDITION-BASED. . .
Table 12. A lookup table for the classification of centrifugal blower faults.
MC 1 MC 2 MC 3 MC 4 MC 5 Group 1 Group 2AE
RMS Weak Weak Very Strong X X StrongAmplitude X X Very Strong X Strong Strong
CF X X Weak X Weak WeakEnergy Weak Weak Very Strong X X Very Strong
FFT @S<90 kHz Very Strong Very Strong Very Strong Very Strong Very Strong X XVibration
RMS X X Good X X X XAmplitude X X X X X X X
CF X X Weak X X X XEnergy X X Good X X X X
FFT@ S=10 Hz Good Good Good Good Good X XPressure
Average (BarG) X Very strong X X X X X
alarms. An accurate assessment of the three major condition-based monitoring techniques was given in this article using fivetime domain and frequency domain features, with a total num-ber of 11 different feature sets for each machine condition.
AE and vibration time domain features failed to detect the 5addressed machine conditions, while the AE and vibration fre-quency domain features managed to detect all of the addressedfaults with a detection accuracy of 100 percent. The pressureinformation was only useful in detecting the air leakage prob-lem (MC 2). The AE technique proved its greater effectivenessover vibration and pressure information techniques, except inthe case of leakage, where the pressure information techniquewas competitive. In comparison to time domain features, theFFT spectral (frequency domain) features were best for the de-tection of high-speed centrifugal air blower faults. The faultinterference occurred during experimentation. Two faults sig-nals, MC 3 and MC 4, interacted with each other in an unex-pected way, which resulted in new fault signatures. Fault inter-ference usually results in a new fault signature, or in maskingone or more of the existing failures. A full capacity CBM sys-tem that collectively use the best features and fault detectiontechniques can be developed based on the results of this study.The collective utilization of the major signal features and faultdetection techniques could have the potential to reduce falsealarms due to noise and fault interference issues.
Future research could investigate other blower faults inaddition to the utilisation of different faults detection tech-niques, such as temperature measurements, thermal imaging,and wavelet analysis. Moreover, further experimentation couldbe carried out to apply the result of this study to similar indus-trial centrifugal blowers and compressors at different condi-tions or to different types of blowers. The issue of fault inter-ference exists, and needs further investigation.
REFERENCES1 Rienstra, A. Predictive Maintenance for the Masses, Air-
bone Ultrasonic, SDT North America, (2005).
2 Viktorov, I. Rayleigh and Lamb Waves, Physical Theoryand Applications, Springer, USA, (2013).
3 Shepard, A. and Dennis, G. Principles of Turbomachinery,McMillan, USA, (1956).
4 Scheer, C., Sudmersen, U., Reimche, W., and Bach, W.Quality control using vibration and acoustic signatures, 3rd
PAN American Conference for Non-Destructive Testing —PANNDT, Rio de Janeiro, Brasil, (2003).
5 Implementation strategies and tools for condition basedmaintenance at nuclear power plants, IAEA-TECDOC-1551, International Atomic Energy Agency, (2007).
6 Mathews, J. Acoustic Emission, Gordon and Breach Sci-ence Publishers Inc, USA, (1983), 3rd edition.
7 Al-Ghamd, A. and Mba, D. Comparative experimentalstudy on the use of Acoustic Emission and vibration analy-sis for bearing defect identification and estimation of defectsize, Mechanical Systems and Signal Processing, 20 (7),1537–1571, (2006).
8 Tandon, N. and Nakra, B. Defect detection of rolling el-ement bearings by acoustic emission method, Journal ofAcoustic Emission, 9 (1), 25–28, (1990).
9 Rogers, L. The application of vibration analysis and acous-tic emission source location to on-line condition monitor-ing of anti-friction bearings, Journal of Tribology Interna-tional, 12 (2), 51–58, (1979).
10 Wang, J. and Hu, H. Vibration-based fault diagnostic ofpump using fuzzy technique, Measurement, 39 (2), 176–185, (2006).
11 Schulthesis, S., Lickteig, C., and Parchewsky, R. Recipro-cating compressor condition monitoring, Proceedings of the36th Turbo Machinery Symposium, Texas, USA, (2007).
12 Gowid, S., Dixon, R., and Ghani, S. FFT-based robustautomated segmentation and features selection algorithmfor condition based monitoring systems, Applied Acoustics,88 (1), 66–74, (2015).
13 Barden Precision Bearings, Bearing failure: causes andcures, Retrieved from http://www.schaeffler.com/remotemedien/media/ shared media/08 media library/01 publications/barden/brochure 2/downloads 24/barden bearing failures us en.pdf, (Accessed March 10,2014).
14 Gowid, S., Dixon, R., and Ghani, S. Profitability, re-liability and condition based monitoring of LNG float-ing platforms: A review, Journal of Natural Gas Scienceand Engineering (Elsevier), 27 (3), 1495–1511, (2015).http://dx.doi.org/10.1016/j.jngse.2015.10.015
International Journal of Acoustics and Vibration, Vol. 21, No. 2, 2016 191