Embed Size (px)
Citation preview

CHAPTER 3
BEHAVIOUR OF A MODEL SQUARE FOOTING ON LOOSESAND REINFORCED WITH WOVEN COIR GEOTEXTILE
3.1 General
The technique of reinforcing the soil below shallow foundations with synthetic
tensile resisting elements (Giroud, 2005; Rowe and Li, 2005; Basudhar et aI., 2008;
Ghazhavi and Lavassan, 2008; Zhou and Wen, 2008; Bathurst et aI., 2009; Wesseloo
et aI., 2009) is a widely accepted practice in the field of geotechnical engineering. But
for countries where the availability and cost of synthetic reinforcing materials are
major constraining factors, it is important to examine the application possibilities of
natural materials such as coir for soil reinforcement. Coir is abundantly available at
cheap rate in India, Indonesia, Brazil and in a few other countries where coconuts are
grown and subsequently processed. Increasing awareness and demand for
environmentally friendly engineering solutions coupled with better durability
compared to all other natural fibers (Ayyar et aI., 2002) make coir a potential material
for soil improvement.
Experimental results reported by various investigators have shown that coir
reinforcement in the form of fibers (Babu and Vasudevan, 2007; Vinod et aI., 2007),
braided ropes (Vinod et aI., 2009) and woven geotextiles (Subaida et aI., 2008) results
in improved engineering behaviour. The research work presented in this Chapter
focuses on plate load testing of loose sand strengthened with woven coir geotextile
layer(s). The findings of the study are considered to be of great importance since the
large scale production of the coir geotextile on a commercial basis is dependent on the
results of the research.
25

The primary objective of this investigation is to find out whether woven coir
geotextile is effective as subsoil reinforcement and if so, to obtain a quantitative
estimate of the degree of improvement. The influence of various parameters such as
the depth of geotextile placement, length, number of layers and spacing between layers
of the geotextile on soil improvement is examined. Even though these parameters
have been intensively studied in the literature for synthetic geogrids and geotextiles
(e.g., Yetimoglu et aI., 1994; Dash et aI., 2001) and to a very limited extent for braided
coir ropes (Vinod et aI., 2009), it is considered worth carrying out the presented study
since the reinforcement mechanism and the degree of soil improvement are all heavily
dependent on the characteristics and configuration of the particular type of
reinforcement used. Reinforced soil system, the behaviour of which is a complex
function of the relative contribution of the various reinforcing mechanisms, may not
necessarily yield the same result with different materials. Even when the same basic
material is used, the behaviour of the soil composite may be a function of the
shape/configuration (strip, geocell, geogrid) and surface as well as tensile
characteristics of the reinforcement. The response of loose sand bed due to the
inclusion of an eco-friendly, cost-effective natural geotextile is expected to have
positive implications in foundation engineering practice.
The details of the experimental study to examine the effectiveness of a
horizontally placed woven coir geotextile layer(s) on the strength improvement and
settlement reduction of loose sand underlying model footings are presented in this
Chapter. The properties of the materials used for the experimental investigation are
described in the subsequent sections.
26

3.2 Materials used
3.2.1 Soil
The soil used in the present investigation to simulate the loose deposit/bed
which needs stabilization was dry sea sand. The basic and index properties of the sand,
determined from laboratory experiments according to ASTM standards are shown in
Table 3.1. The soil is classified as poorly graded soil with letter symbol SP according
to USCS. The sand was placed in the test tank at a unit weight of 16.9 kN/m3 (which
corresponds to a relative density (Dr) of 25%). The friction angle presented in Table
3.1 is that obtained from direct shear tests on sand at the above relative density.
3.2.2 Reinforcement
In this study, type of woven coir geotextile designated as H2M6 (Fig. 3.1)
supplied by National Coir Research and Management Institute (NCRMI), India was
used as the reinforcement. The properties of the woven coir geotextile, determined as
per standards(ASTM4595-09 and ASTM4751-04), are summarised in Table 3.2. The
woven coir geotextile is available in 2m x 30m rolls.
3.3 Laboratory model tests
3.3.1 General
The bearing capacity of soils and foundation settlements under different loads
are estimated by load tests (IS 1888: 1982). As tests on prototype foundation are not
practicable in view of the large loading required, the time factor involved and the
higher cost of full-scale tests, model plate load tests are usually conducted. This is a
semi-direct method since the difference in size of footings in model tests and the actual
structures are to be properly accounted for in arriving at meaningful interpretation of
the test results.
27

28

3.3.3 Preparation of test bed
Sand was poured into the model test tank from a pre-calibrated height (to
achieve the desired relative density) using a raining technique (Khing et al. 1993). The
relative density achieved was confirmed by collecting samples in small cans placed at
different locations in the tank and finding the density of sand at the time of filling .The
values of density for samples collected from different locations in the sand bed were
found to be almost same as given in Table 3.1 (the difference being less than 1%).
After pouring sand to the depths for reinforcement placement, the woven coir
geotextile was placed on the surface of sand symmetrically beneath the footing
location (Fig. 3.3). This was then followed by further placing of sand using the raining
technique up to the required level.
3.3.4 Testing programme
Upon filling the tank with sand upto top, surface of sand was leveled. The
model footing was placed on the leveled surface of sand with the predetermined
alignment such that the load from the loading jack was transferred centrally to the
footing. The load, applied in small increments of 0.05kN, was recorded by a pre
calibrated proving ring of capacity 5kN placed between the hydraulic jack and the
reaction beam. Two sensitive dial gauges (of reading directly to 0.01 mm) placed on
each side of the centre line of the footing and mounted on rigid steel channel section
by means of magnetic base, were used to measure the vertical displacement of the
model footing. Each of load increment was maintained until the rate of displacement
was less than 0.01mm/hr. All the reported are the average of the two dial gauge
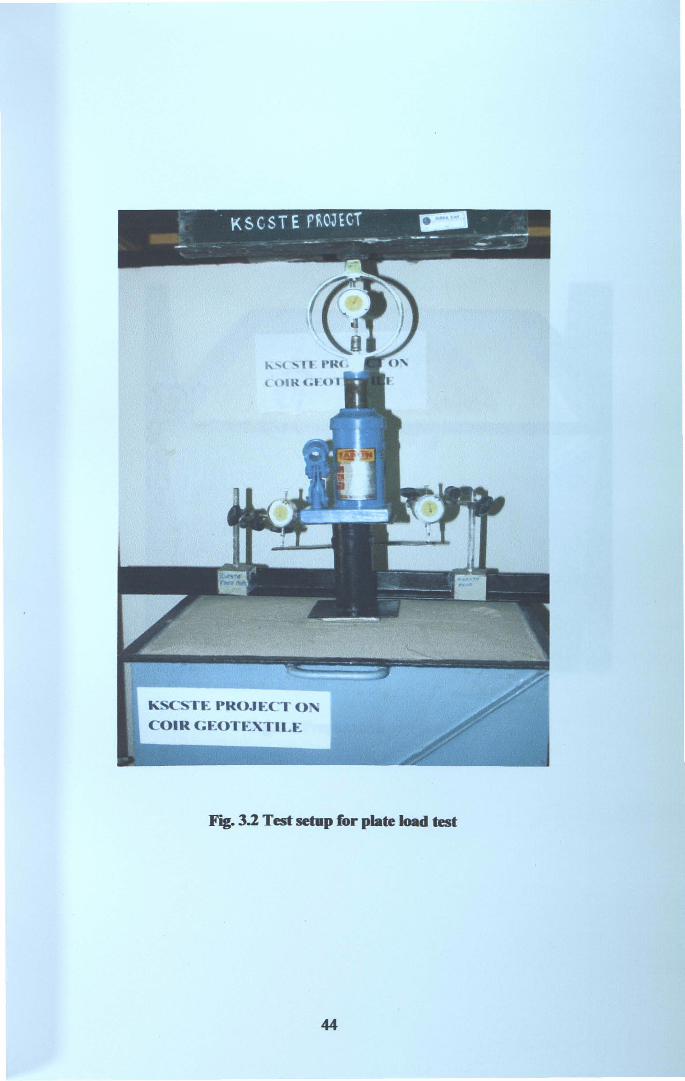
readings were identical. Fig. 3.2 shows the test setup for the model load test. In all of
the experiments, the loading was continued until footing displacement reached at least
29

30mm. The test tank was emptied and fresh sand was placed before each test. All of
the experiments were repeated to ensure the consistency of the test data.
3.3.5 Test variables
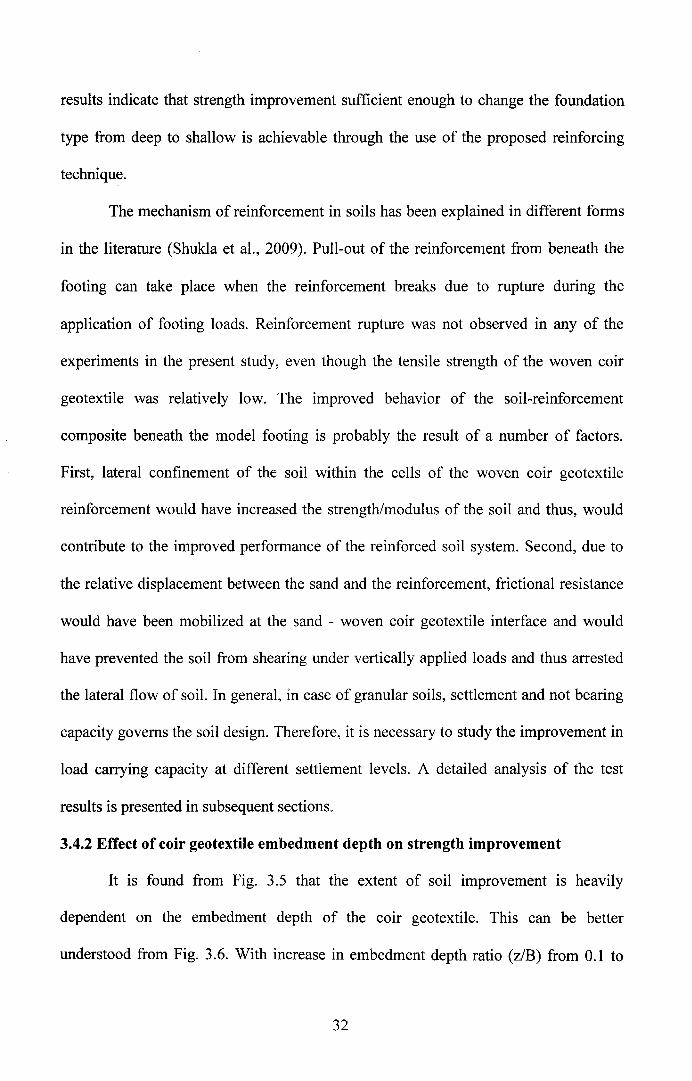
The definition sketch of the problem studied in the present investigation is
shown Figure 3.4. The relative density (Dr-25%) of the fill was kept constant
throughout the investigation. Four different series of experiments were conducted by
varying the following reinforcement parameters: embedment depth(z), length(L),
number of layers(N) and the vertical spacing between layers(p) of the woven coir
geotextile (Table 3.3). Test A is a control model plate load test done on un-reinforced
sand bed. The result of this test was used as the reference to estimate effect of
inclusion of woven coir geotextile layer(s) in improving the load carrying capacity of
loose sand. Test series B was conducted with single layer of woven coir geotextile
(H2M6) kept at varying depths below the footing for ten different embedment depths
(z) for a given length of reinforcement. The objective of this series was to study the
influence of depth of the placement of reinforcement layer in the overall performance
of the model footing. Test series C was performed to examine the influence of the
length of the reinforcement in improving the performance of the model footing. Test
series D was done to study the effect of varying the number and spacing of layers of
reinforcement below the footing. Tests in this Series were done by keeping the top
layer of the reinforcement at constant depth (u = 0.2B) and subsequently increasing the
number oflayers beneath it at vertical intervals of O.1B, 0.2B, 0.3B and 0.4B.
30

3.4 Results and discussion
3.4.1 General
The pressure versus settlement behaviour observed for the different Test Series
are presented in Figs 3.5, 3.8 and 3.10 through 3.13. It is observed that for all
combinations of values of the variables considered in the present investigation, the
response of the model footing on woven coir geotextile reinforced soil bed is found to
be significantly better (even at low strain levels) than that for unreinforced case. The
degree of soil improvement as a result of reinforcement inclusion is expressed in terms
of a non-dimensional strength improvement ratio (Dash et aI., 2003). This parameter is
defined as the ratio of the footing pressure on reinforced sand bed to the corresponding
pressure which produces the same value of settlement on non-reinforced sand. Values
of strength improvement ratio corresponding to normalized settlement
(settlement/width of plate) values of 10, 20, and 30% for the different Test Series are
presented in Table 3.4. It is seen that strength improvement as high as about 14 is
obtained with woven coir geotextile (H2M6; N=4; p/B=O.l).These results are similar
to or even better than the observations made by previous researchers. For example,
results of a series of laboratory model tests on geocell reinforced sand foundations
carried by Dash et aI.(2003) have shown an eight-fold (corresponding to a settlement
equal to 45% of footing width) increase in load carrying capacity. It was also reported
that even at a settlement equal to 45% of the footing width, no failure was observed. In
the present study also, no clear bearing capacity failure was observed in any of the
tests up to a settlement equal to 30% of the footing width. In fact it was observed that
at higher levels of settlement, the model footing on the reinforced soil bed carries more
loads in the applied bearing pressure versus settlement behaviour. The preliminary
31
results indicate that strength improvement sufficient enough to change the foundation
type from deep to shallow is achievable through the use of the proposed reinforcing
technique.
The mechanism of reinforcement in soils has been explained in different forms
in the literature (Shukla et aI., 2009). Pull-out of the reinforcement from beneath the
footing can take place when the reinforcement breaks due to rupture during the
application of footing loads. Reinforcement rupture was not observed in any of the
experiments in the present study, even though the tensile strength of the woven coir
geotextile was relatively low. The improved behavior of the soil-reinforcement
composite beneath the model footing is probably the result of a number of factors.
First, lateral confinement of the soil within the cells of the woven coir geotextile
reinforcement would have increased the strength/modulus of the soil and thus, would
contribute to the improved performance of the reinforced soil system. Second, due to
the relative displacement between the sand and the reinforcement, frictional resistance
would have been mobilized at the sand - woven coir geotextile interface and would
have prevented the soil from shearing under vertically applied loads and thus arrested
the lateral flow of soil. In general, in case of granular soils, settlement and not bearing
capacity governs the soil design. Therefore, it is necessary to study the improvement in
load carrying capacity at different settlement levels. A detailed analysis of the test
results is presented in subsequent sections.
3.4.2 Effect of coir geotextile embedment depth on strength improvement
It is found from Fig. 3.5 that the extent of soil improvement is heavily
dependent on the embedment depth of the coir geotextile. This can be better
understood from Fig. 3.6. With increase in embedment depth ratio (z/B) from 0.1 to
32

about 0.33, there is a significant improvement in strength. A sharp reduction in
strength improvement is observed for values of depth ratio greater than 0.5. It is logical
to believe that at smaller values of depth ratio, the mobilisation of all or some of the
reinforcing mechanisms would materialise only to a lesser extent due to the relatively
low overburden pressure over the geotextile layer. At depths greater than 0.5B, though
the overburden pressure is much higher, the greater thickness of loose sand above the
geotextile layer probably results in increased settlements. The overburden pressure can
be considered to be sufficient enough to induce optimum reinforcing mechanism for
embedment depths between 0.33B and 0.5B for the woven coir geotextiles used. These
results are somewhat comparable with those reported in the literature - 0.5B
(Akinmusuru and Akinbolade, 1981), 0.25B (Yetimoglu et aI.,1994), 0.315B (Hataf
and Bazyar, 2000) 0.3125B (Gosh et aI.,2005) and OAB (Vinod et aI., 2009). A close
examination of Fig. 3.6 indicates that the zone of optimum reinforcement embedment
location shifts slightly towards the base of footing with increasing settlement.
However, further studies are needed to ascertain this finding.
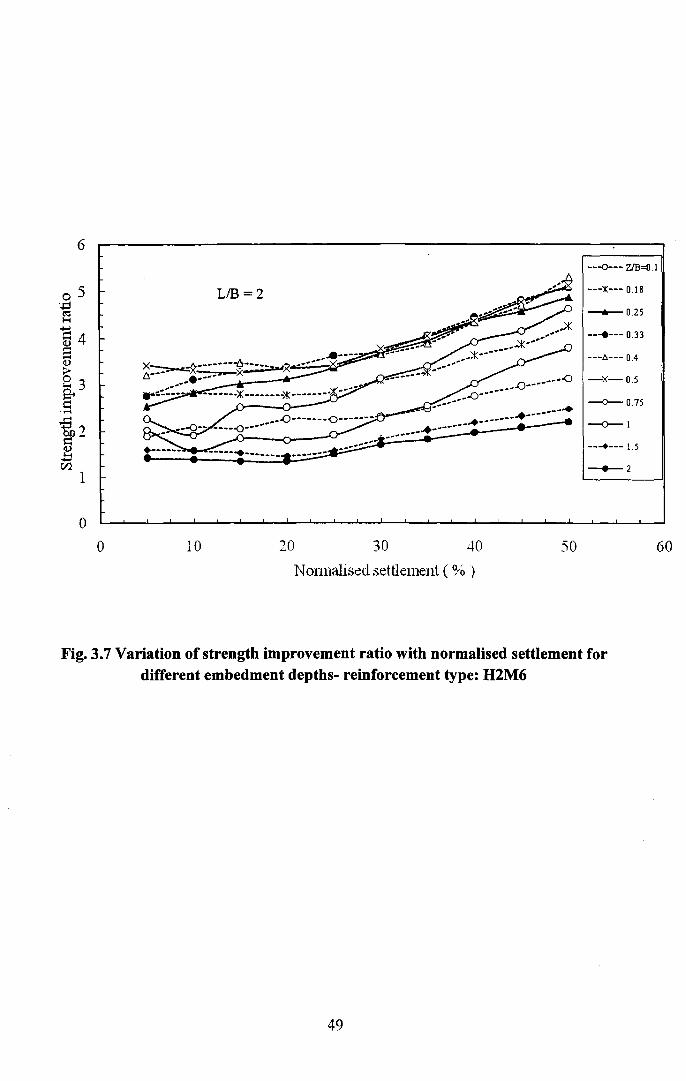
As could be observed from Table 304, use of even a single layer of coir
geotextile resulted in about three-fold improvement in strength (siB = 10%). It is also
seen that strength improvement ratio generally shows an increase with increase in
normalised footing settlement, possibly due to the greater mobilization of
reinforcement mechanism at higher settlements (Fig. 3.7).
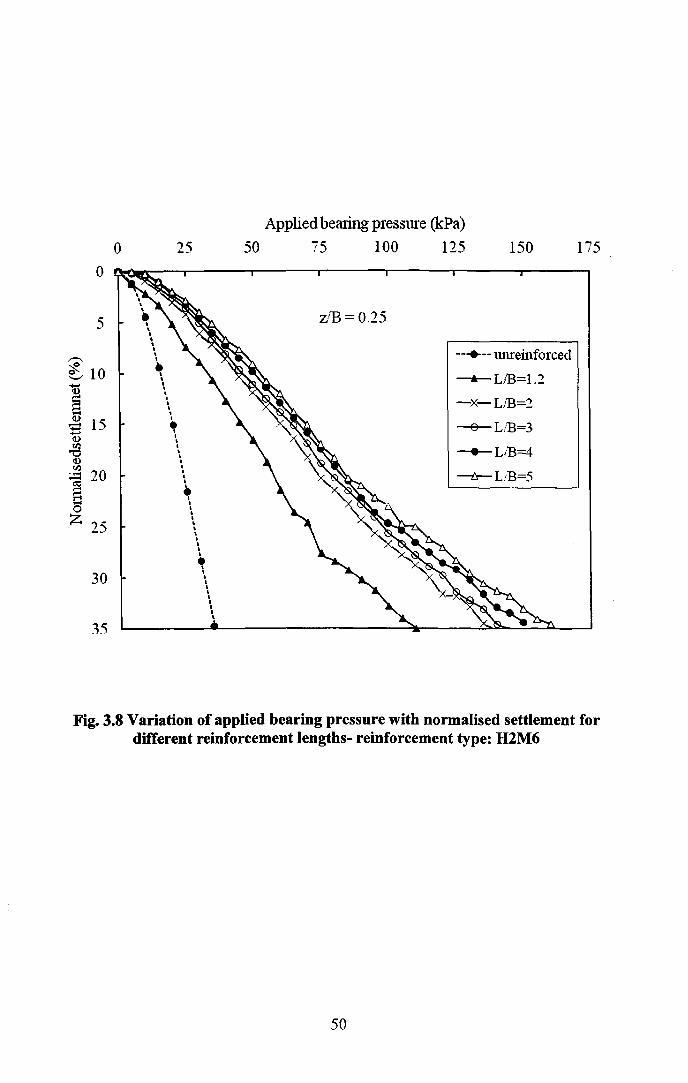
3.4.3 Effect of length of coir geotextile on strength improvement
The provision of geotextile of length as low as 1.2 times the size of the model
footing (Fig. 3.8; Table 304) results in significant increase in strength improvement
33

(about two-fold improvement for siB = 10%). This clearly suggests the existence of
passive resistance mechanism preventing the lateral movement of the soil mass from
within the geotextile cells. Improvement in the response of the reinforced soil bed is
found to be appreciable up to LlB=2 (Fig. 3.9). When the LIB ratio is changed from
1.2 to 2, the increase in strength improvement ratio is about 32% (s/B=10%) while the
same is only about 20% for increase in LIB from 2 to 5. The optimum length ratio
value for geosynthetic reinforced foundation (e.g., Guido et aI., 1985; Dash et aI.,
2001; Sireesh et aI., 2009) lie over a very wide range, from about 2.5 to 5 while the
same was about 3 with braided coir rope (Vinod et aI., 2009). It thus strengthens the
earlier argument that reinforced soil behaviour is unique for each reinforcement type
and configuration.
3.4.4 Effect of multiple layers of coir geotextiles on strength improvement
From Figs. 3.10 through 3.13 (and also from Table 3.4), it can be inferred that
for given number of layers, a smaller value of vertical spacing between the geotextile
layers generally results in more significant strength improvement. When the vertical
spacing is relatively high (say p/B=O.4), strength improvement ratio (corresponding to
s/B=lO%) changes from 4.4 for N=2 to 5.6 for N=4 which is only about 27% higher.
In this case, the third and fourth layers of geotextile are at relatively greater depths
beneath the base of the footing and hence, do not contribute much to soil improvement.
On the other hand when p/B=0.1, the lower layers are still closer to the loaded area,
and hence becomes much more effective in soil improvement (the corresponding
variation in strength improvement ratio being from about 4.4 to 7.0 - about 59%
increase). From the model tests with different combination of layer numbers and
34

spacing, the maxImum value of strength improvement ratio obtained is about 7
(u/B=O.2; N=4; p/B=O.l), the corresponding thickness of the reinforced top layer being
0.58. The next three higher value of strength improvement ratio (about 6.6, 604 and
6.2) correspond to reinforced zones of thickness 0.8B, OAB and 0.6B respectively. At
this stage it can only be suggested that that optimum benefit is obtained by reinforcing
the sand up to a depth of about OAB-0.8B beneath the base of footing with three or
four layers of coir geotextile. From the observations, it can be concluded that, the
influence of Nand plB are inter-dependent; the effect of anyone of these can not be
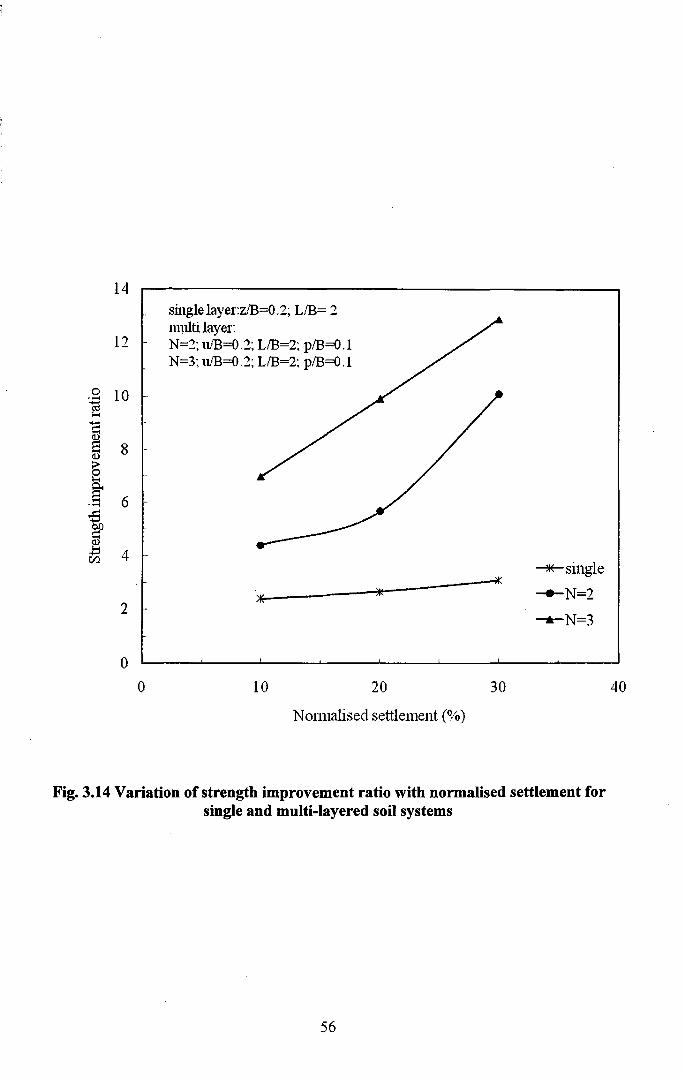
isolated. It is also observed (Table 304) that the rate of increase in strength
improvement ratio with increasing values of normalised settlement is significant for
multi-layer reinforced soil system only. This is better evident from Fig. 3.14.
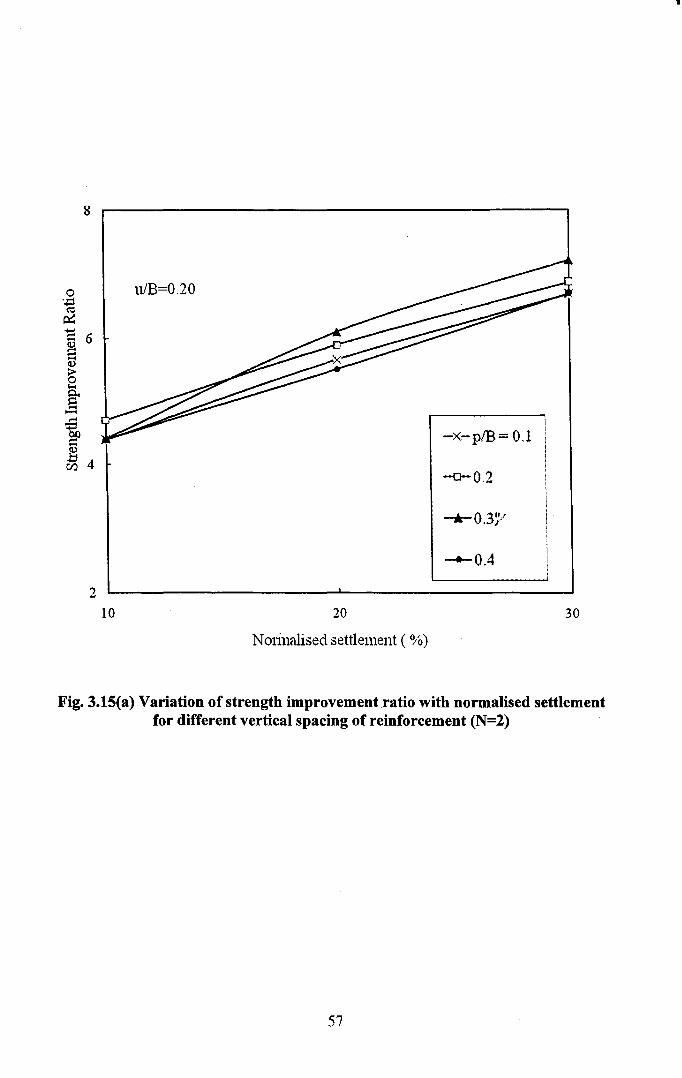
Figures 3.15(a) through (c) present the variation in strength improvement ratio
with normalized settlement for N=2, 3 and 4 respectively. It can be clearly seen from
these figures that p/B=O.l and 0.2 yield significantly better results if number of
reinforcement layers is to either 3 or 4. When N=2, the vertical spacing (if between 0.1
and 004) between reinforcement layers has only much less role to play. This confirms
the earlier argument that the influence of Nand plB are inter-dependent and the effect
of any of these cannot be isolated.
Based on experimental studies on synthetic geotextile reinforced sand,
Basudhar et aI., (2007) have reported that maximum beneficial effect (about 4.5-fold
strength improvement) is obtained by placing three layers of reinforcement within a
depth of about 28. Kumar et aI.(2007) reported a three-fold to four-fold increase in
bearing capacity of strip footing resting on sand, when the top layer (of depth equal
to width of footing) was reinforced with 2 to 4 layers of synthetic geogrid
35

reinforcement. Model tests and numerical analysis of strip footing on sand slopes
reinforced with geogrid/grid anchor (Alamshahi and Hataf, 2009) have indicated that
the optimum number of reinforcement layer is 2 and the reinforcement is to be placed
within an embedment depth of 0.758. The most encouraging observation of the present
investigation is that the use of woven coir geotextile reinforcement appears to be at
least almost equally effective as many of the synthetic reinforcing materials/products
used previously and reported in the literature. However, as stated earlier the results
presented are only qualitative in nature due to scale effects. Attempt to extrapolate the
results to field problems can be made though some suitable scaling law (Butterfield,
1999). However, the findings of the present study are to be confirmed through large
scale field tests before putting this product into use.
3.4.5 Qualitative estimate of strength improvement
The extent of soil improvement due to reinforcement inclusion is a complex
function of the reinforcement type, number of layers of reinforcement (N), normalized
depth to the uppermost layer of reinforcement(z/B), normalized vertical spacing
between reinforcement layers (p/B), reinforcement length to footing width ratio(L1B)
and normalized settlement of the footing(s/B). In particular, influence of parameters
N, z/B and p/B which combinely govern the thickness of the reinforced zone can not
be independently analysed. The exact form of inter-relationship between the variables
is not known; hence, as an initial step, multiple linear regression analyses were
performed to obtain a qualitative estimate of strength improvement.
Multiple linear regression analyses were carried out to obtain a predictive
model for strength improvement ratio in terms of the number of layers (N), normalised
36
depth to the uppermost layer of reinforcement (zlB), normalised vertical spacmg
between layers (p/B), length ratio (LIB) and normalised settlement of the footing(s/B).
For all the experimental data relating to the use of a single layer of reinforcement, the
number of layers was put as 2 and the normalised vertical spacing between layers was
assigned a very high value for all the experimental data related to the use of single
layer of geotextile. The analysis resulted in the following equation (correlation
coefficient = 0.927):
SIR = 0.85 N°.470 (zlBro.203 (pIBro. 159 (LlB)o.315 (s1Bf271 (3.1)
A more logical assessment of the reliability of the above empirical equation
developed was made using a global evaluation technique which simultaneously taken
into consideration of accuracy as well as precision. Accuracy was estimated by mean
(J.!) and precision was estimated by means of standard deviation(s). A global evaluation
of the strength improvement was developed by means of two different indices, named
ranking distance [RD] (Cherubini and Orr 2000) and ranking index [RI] (Briaud and
Tucker 1998) which are defined as follows.
R I = J! lIn SlRpredi 1+ 5 lIn SIRprediISIR"bs,gr SIRtJbs~r
J.!= mean, s= standard deviation;
SIR predi = Strength improvement ratio (predicted); and
SIR obser = Strength improvement ratio (observed)
(3.2)
(3.3)
For a perfect correlation, both these indices tend to zero. Statistical analysis of
the ratio of predicted to observed values of strength improvement ratio yielded
37
satisfactory values for ranking index and ranking distance (0.288 and 0.259
respectively).
This investigation has presented the laboratory model test results on square
footing reinforced by woven coir geotextile reinforcement on loose sand bed. These
laboratory model test results though have scale effects, provide insight into the basic
reinforcing mechanism that establishes the load deformation behavior of the footing
reinforced with woven coir geotextile. Large scale tests carried out by Milligan et al.
(1986) indicate that the general mechanisms and behavior observed in the model tests
are reproduced at large scale. Consequently, the findings from the present investigation
will provide general guidelines for construction as well as large-scale field tests and
would lead to the development of a rational design methodology.
3.5 Concluding remarks
A series of small scale laboratory tests were carried out to evaluate the effect of
woven coir geotextile reinforcement on pressure versus settlement response of a model
footing on loose sand. The effects of the depth to the first layer of the reinforcement,
vertical spacing of the reinforcement layers, number of reinforcement layers, and
length of reinforcement on bearing capacity were investigated.
Based on the results of the present investigation, the following conclusions can
are drawn:
(l ) Woven coir geotextile is an appropriate product for stabilization ofloose sand.
About three-fold increase in strength obtained with even a single layer of
woven coir geotextile suggests that bearing capacity sufficient enough to
38
eliminate the need of a deep foundation IS achievable by the proposed
reinforcing method.
(2) The optimum depth of placement below the base of footing, of a single layer of
woven coir geotextile reinforcement lies in the range 0.33B - 0.58. Optimum
reinforcement embedment location shows a slight shift towards the base of
footing with increasing settlement.
(3) Optimum value of reinforcement length is about two times the width of the
footing. The degree of improvement obtained with length ratio of 1.2 is also
significant. The above findings are different from those reported in the
literature with the use of geosynthetic reinforcements and confirm that no
single reinforcing mechanism can fully explain the behaviour of all reinforced
soil systems; reinforced soil response is a complex function of several variables
and is unique for each reinforcement material and configuration.
(4) Multi-layer reinforced soil system is most effective when the subsoil over a
depth of O.4B - 0.8B is reinforced with three to four layers of coir geotextile.
The influence of number of reinforcement layers and vertical spacing between
layers are to be considered together in any analysis of similar problems.
(5) Rate of improvement in strength with increasing values of normalised
settlement is significant only for multi-layer reinforced soil system.
(6) The study indicates the possibility of developing a predictive model for
strength improvement resulting from the use of woven coir geotextile. A
qualitative estimate of strength improvement can be obtained from the
following equation:
SIR = 0.85 NO.470 (ziBro.203 (pIBro.159 (L/B)O.315 (s1Bl 271
39

Woven coir geotextiles in the present form, can be used for temporary/short
term applications only since coir is biodegradable, though the relatively high lignin
content present in coir makes the degradation much slowly than that in the case of
other natural materials.
Table 3.1 Properties of sand used in the plate load tests
Uniformity coefficient (Cu) 1.6
Coefficient of curvature (Cc) 1.0
Maximum dry unit weight (kN/m3) 19.0
Minimum dry unit weight ( kN/m3) 16.2
Dry unit weight of sand in experiments (kN/m3) 16.9
Relative density of sand in experiments (percent) 25
Angle ofintemal friction (degree) 27.0
Table 3.2 Properties of woven coir geotextile used in plate load tests
Mass per unit area (g/m.l) 365
Thickness at 2 kPa. 7.02
Mesh opening(mm x mm) 20x20
Tensile strength (kN/m)
Wide width MID 4.85
XM/D 4.68
40

Table 3.3 Summary of model tests -
Type of reinforcement: woven coir geotextiIe- H2M6
Test Type of Study on theDetails of test parameters
Series reinforcement effect of
A unreinforced - -
Variable parameter;Depth of
z!B =0.1,0.2,0.25,0.33,0.4,0.5,B H2M6 embedment of
0.75,1.0,1.5,2.0reinforcement
constant parameters: LlB=2; N=1
Variable parameter;Length of
C H2M6 LIB =1.2,2,3,4,5reinforcement
constant parameters: z/B=0.25 N=1
Variable parameter;
p/B =0.1,0.2,0.3,0.4; N=2,3,4 Multiple layers ofD H2M6
constant parameters: L/B=2; reinforcement
u/B=0.2
41

Table 3.4 Strength improvement ratio for the different Test Seriesreinforcement type: H2M6
Test Variable Strength improvement ratio
senes Parameter(s) s/B=10% s/B=20% s/B=30%
z/B
0.10 2.08 2.26 2.32
0.20 2.82 2.78 3.09
0.25 2.83 3.12 3.68
0.33 3.11 3.37 3.71B 0.40 3.40 3.35 3.64
0.50 3.30 3.35 3.76
0.75 1.92 2.51 3.12
1.00 1.58 1.81 2.28
1.50 1.58 1.46 1.83
2.00 1.39 1.34 1.71
LIB
1.2 2.14 2.41 3.00
C2 2.83 3.17 3.68
3 2.97 3.33 3.86
4 3.25 3.48 4.12
5 3.39 3.55 4.23
p/B N
2 4.39 5.66 6.69
0.1 3 6.36 9.91 12.88
4 6.98 10.08 13.83
2 4.71 5.89 6.88
0.2 3 6.18 8.74 10.75
D 4 6.63 9.03 12.10
2 4.42 6.10 7.21
0.3 3 4.48 6.71 8.53
4 5.01 7.31 9.16
2 4.41 5.51 6.70
0.4 3 4.68 6.28 8.02
4 5.60 6.85 8.44
42

Fig. 3.1 Woven coirgeote~mM6
43
K~ C ·...E PROJ ECT 0 ~
COIR GEOTEXTILE
Fig. 3.2 Test setup for plate load test
44

Fig. 3.3 Preparation of test bed
45

L
Modelfootin~:..u.u:1
tz --l-;:--r.A~~
-1 p l----=-2Woven coir geotextile
__l_~NLoose sand
Fig. 3.4 Schematic diagram-plate load tests on woven coir geotextilereinforced soil
46

0
0,,•,,
5 •,,•,•,II
10 •I•,-.., ,,,0 ••0'· •'-" ,,...... I
~ 15 •,•~ ••(l) I....... ,~ ••
20 IV'l I•"'0 •(l) •'J:l •;..::l I,$3 •25 •S ,
•I0 ,Z I,
•I30 ••I
I•,,III
15
Applied bearing pressme (kPa)
50 100
LIB =2
150
--+-- unreinforced
---.- z/B=0.1
---~--- 0.20
--S--0.25
---;+:--- 0.33
-0--0.4
--...-- 0.5
~0.75
___ 1.0
---<>-1.5
200
Fig. 3.5 Variation of applied bearing pressure with normalisedsettlementfor different embedment depths- reinforcement type: H2M6
47

L1B=2
---l:r- sIB = 10%
-0-20%
-+-30%
4
1
o 0.6 1.2 1.8 2.4
NOITl1alised embedment depth (z/B )
Fig. 3.6 Variation of strength improvement ratio with normalisedembedment depth- reinforcement type: H2M6
48
6
0 5+:l~l-4
+->54:=....<I)
>83e..5....
12
-tI)1
0
0 10
LIB =2
20 30 40 50
---0--- 2'lB=O.1
---:1(--- 0.18
___ 0.25
---6--- 0.4
-X-0.5
~0.75
--0--1
---+--- 1.5
60
N0l111alised settlement ( % )
Fig. 3.7 Variation of strength improvement ratio with normalised settlement fordifferent embedment depths- reinforcement type: H2M6
49
-X-L/B=2
--+-- umeinforced
.............. UB=1.2
-e--LtB=3
-+-L/B=4
-fr-UB=5
175150
z/B=0.25
Applied beating pressure (kPa)
50 75 100 1250 25
0,,,,
5 •,,I,,,,
,-.... I
#. 10 it,'-" ,.- ,I\)
,I
§ I,,,I\)
15,
'E •,I\)
,I,,,,I
"'0 ,,I\) ,,,,, I..... 20
,- ,ce I.- •S I
I0 ,Z
,I
25,,,,,
I,•,
30,,,,,,,,,,
~:s
Fig. 3.8 Variation of applied bearing pressure with normalised settlement fordifferent reinforcement lengths- reinforcement type: H2M6
50

5
zlB=O.25
-10%
~20%
-.-30%
1
1 2 3
Length ratio(L1B)
4 5
Fig. 3.9 Variation of strength improvement ratio with length ratio-reinforcementtype: H2M6
51

o
5
10
15
20
25
30
o
,••~•,
I•••••I••II••,I•I••,•,
I•••••III••I•II•••••I••••I
I••II••,••I
100
Applied healing pressme (kPa)
200
u/B= 0.2
300
---'---llnreinforced
-lr-N= 1
-2
-<-3
--4
400
Fig. 3.10 Variation of applied bearing pressure with normalised settlement formulti-layer -reinforcement type: H2M6; plB=O.1
52

o
5
10
15
20
25
30
o
,•I•I•II
III1II
+•I,I,I•I,,•I•I
III••III••II•I,
II,III
I•I•I,I,II•II,
100
Aplied bearing pressme ( kPa)
200
UlB=O.2
300
--+-- unreiforced
-N=l
---N=2
---e--- N= 3
---N=4
400
•
Fig. 3.11 Variation of applied bearing pressure with normalised settlement formulti-layer -reinforcement type: H2M6; plB=O.2
53

00
I,I
5 •I•II•I,
10 •"-I,
~~III
'-"II
~ I- 15 •<l.)I::: I.... I
<l.) ,'E
II
20I
<l.) ITil I
I
"'Cl •<l.) II
Til I..... I- 25 Ico I::: II
~ II0 •:z I
30 III•II,I,
15
Applied beating pressme ( kPa)100 200 300
u/B=0.2--+-- umeinforced
-N=l
-+--2
400
Fig. 3.12 Variation of applied bearing pressure with normalised settlement formulti-layer -reinforcement type: H2M6; plB=O.3
54

00
,,••
5 ••,,I,,,
10 •.--- ,•
~ ••0 •'-" •~ ••Q) 15 ••S •I1) •--< •t:: ••1) I<12 20
,•"V,I
<IJ •rl.l I
:.::l ,•~ ,
13 .,- •,-) I
<5 I•Z I,
••30 I•I,,
I•••i:=i
100Applied bearing pressme (kPa)
200 300
u/B= 0.2
--+--lU11'einforced
--N=l
-2
--0-3
-4
400
Fig. 3.13 Variation of applied bearing pressure with normalised settlement formulti-layer -reinforcement type: H2M6; plB=O.4
55
4
~
"""*""" sing!e
)~)I( -N=2
2 ..""'-N=3
0
0 10 20 30 40
Nollllalised settlement COlo)
14
12
single layer:zJB=O.2; LiB= 2multi layer:N=2; lLiB=O.2; LJB=2; pJB=O.lN=3; wB=O.2; LJB=2; pJB=O.l
Fig. 3.14 Variation of strength improvement ratio with normalised settlement forsingle and multi-layered soil systems
56
8
'I
u/B=0.20
-x-pJB= 0.1
-0-0.2
-+-0.4
2
10 20
Noriualisecl settlement ( %)
30
Fig. 3.15(a) Variation of strength improvement.ratio with normalised settlementfor different vertical spacing of reinforcement (N=2)
57

14
12u/B=0.2
4
10 20Nolll1a1ised settlement(%)
><
-X-p/B= 0.1
~0.2
-lr-0.3
30
Fig. 3.15(b) Variation of strength improvement ratio with normalised settlementfor different vertical spacing of reinforcement (N=3)
58

14
12 ulB=0.2
010'.::1
CI::~
2
10 20NOl1ualised settlemnt (%)
-X-plB=O.l
-0-0.2
-0-0.3
-'-0.4
30
Fig. 3.15(c) Variation of strength improvement ratio with normalised settlementfor different vertical spacing of reinforcement (N=4)
59