Embed Size (px)
Citation preview

Chapter26 An Introduction to Chromatographic Separations
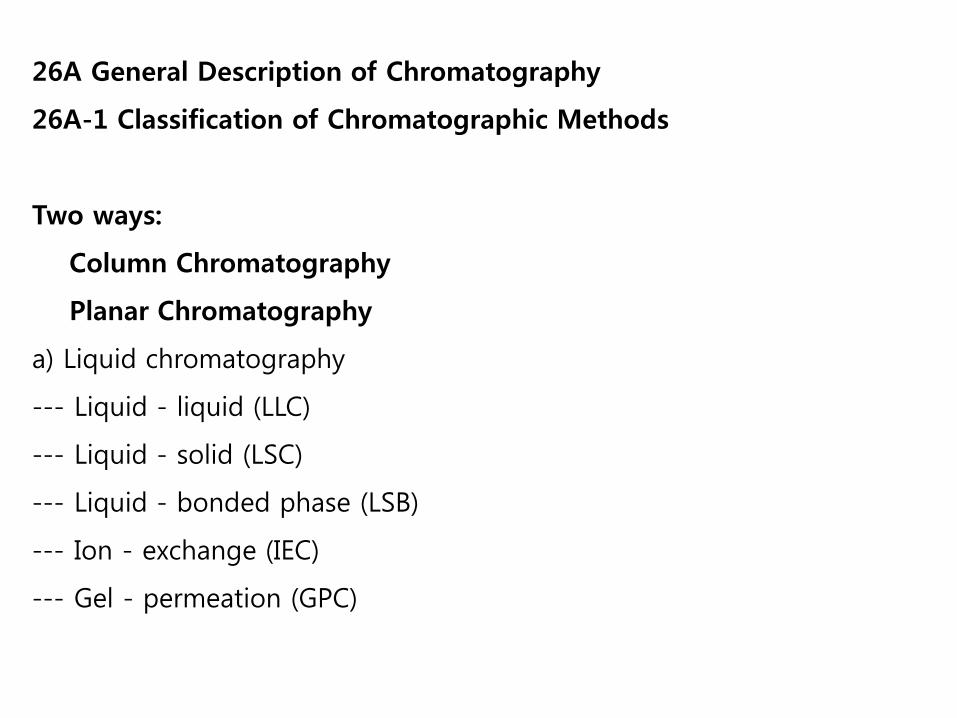
26A General Description of Chromatography
26A-1 Classification of Chromatographic Methods
Two ways:
Column Chromatography
Planar Chromatography
a) Liquid chromatography
--- Liquid - liquid (LLC)
--- Liquid - solid (LSC)
--- Liquid - bonded phase (LSB)
--- Ion - exchange (IEC)
--- Gel - permeation (GPC)

b) Gas chromatography
--- Gas - liquid (GLC)
--- Gas - solid (GSC)
--- Gas - bonded phase
c) Supercritical-fluid chromatography
d) Electrochromatography


26A-2 Elution in Column Chromatography ▪ Analyte Dilution
Fig 26-1 illustrates an important general characteristic of the chromatographic process-namely, dilution of analytes always accompanies chromatographic separation. ▪ Chromatograms
If a detector that responds to solute concentration is placed at the end of the column and its signal is plotted as function of time as shown in the lower part of Fig 26-1. ▪ Improving Column Performance Fig 26-2 shows concentration profiles for the bands containing solutes A and B in Fig 26-1 at time t1 and a later time t2.

Fig. 26-1 Elution Chromatography Fig. 26-2 Concentration profiles of
analyte band A and B

Fig. 26-3. Two component chromatogram illustrating two methods for Improving separation
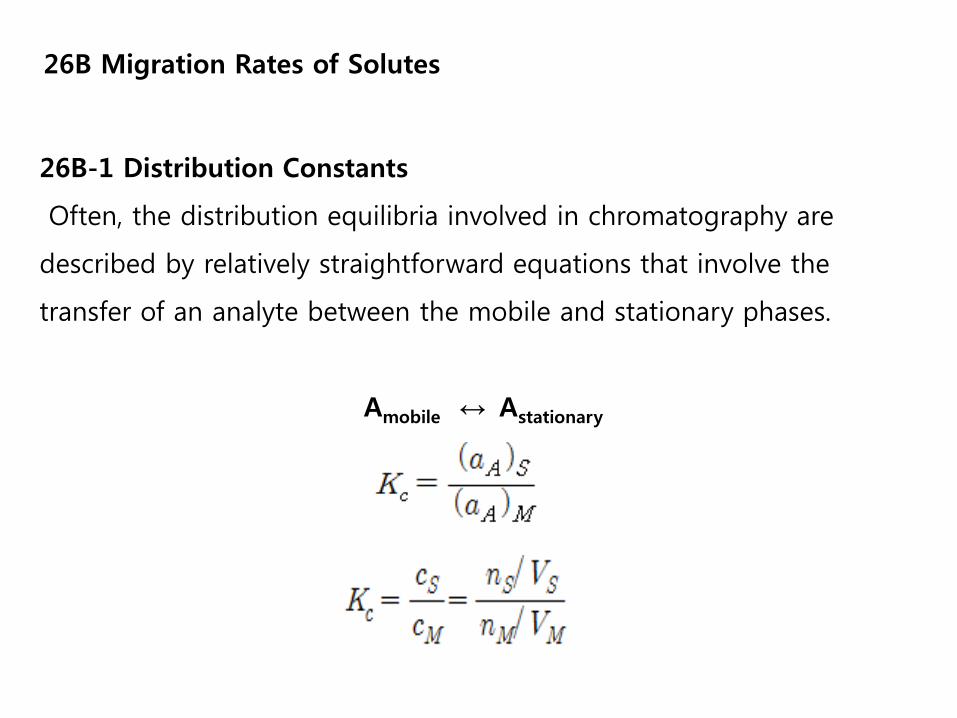
26B Migration Rates of Solutes
26B-1 Distribution Constants
Often, the distribution equilibria involved in chromatography are
described by relatively straightforward equations that involve the
transfer of an analyte between the mobile and stationary phases.
Amobile ↔ Astationary

26B-2 Retention time
The average linear rate of solute migration:

26B-3 The Relationship between Volumetric Flow Rate and Linear
Flow Velocity
The average linear rate of molecules of the mobile phase:
Fig. 26-4. A typical chromatogram for a two-component mixture.

26B-4 The Relationship between Retention Time and Distribution
Constant
= u x fraction of time solute spends in mobile phase
= u x moles of solute in mobile phase / total moles of solute

26B-5 The Rate of Solute Migration: The Retention Factor The retention factor k is an important experimental quantity widely used to compare the migration rates of solutes in columns.

26B-6 Relative Migration Rates: The Selectivity Factor.
The selectivity factor α of a column for the two solutes A and B is
defined as
from
26C Band Broadening and Column Efficiency
26C-1 The Rate Theory of Chromatography
The rate theory of chromatography describes the shapes and breadths of
elution bands in quantitative terms based on a random-walk mechanism
for the migration of molecules through a column.
26C-2 A Quantitative Description of Column Efficiency
Two related terms are widely used as quantitative measures of
chromatographic column efficiency:
1) Plate height, 2) Plate count plate,
N = L/H (26-16)


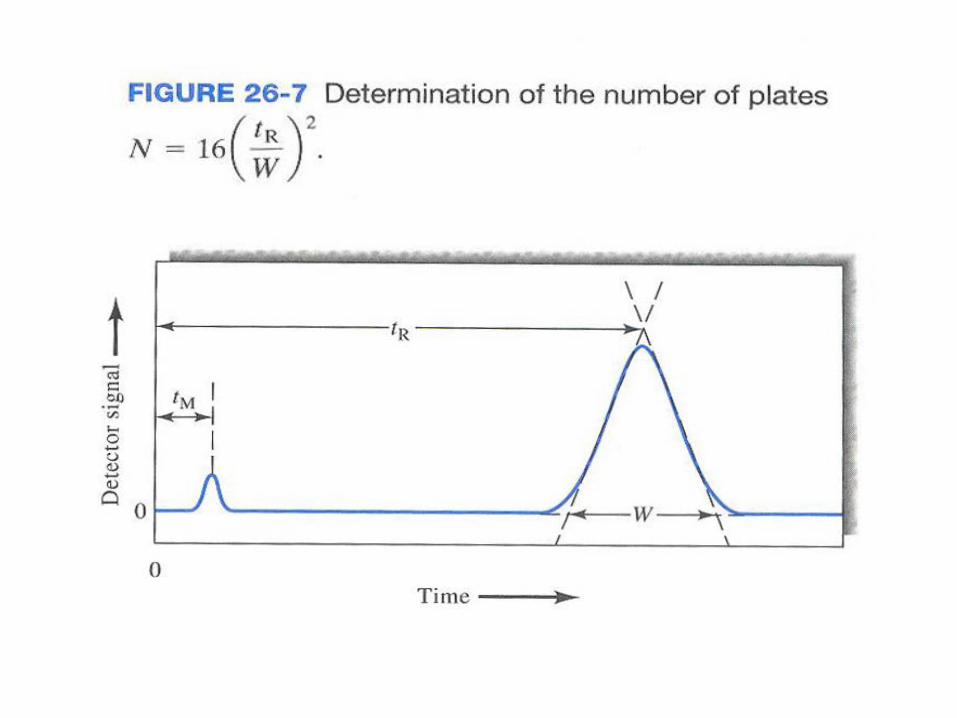
▪ The Definition of Plate Height As shown in Section a1B-1 of Appendix 1, the breadth of a Gaussian curve is described by its standard deviation σ or its variance σ2.
Fig. 26-6. Definition of plate height H=σ2/L.

▪ The Experimental Evaluation of H and N Fig 26-7 is a typical chromatogram with time as the abscissa. Fig 26-7 illustrates a method for approximating τ and σ from an experimental chromatogram.
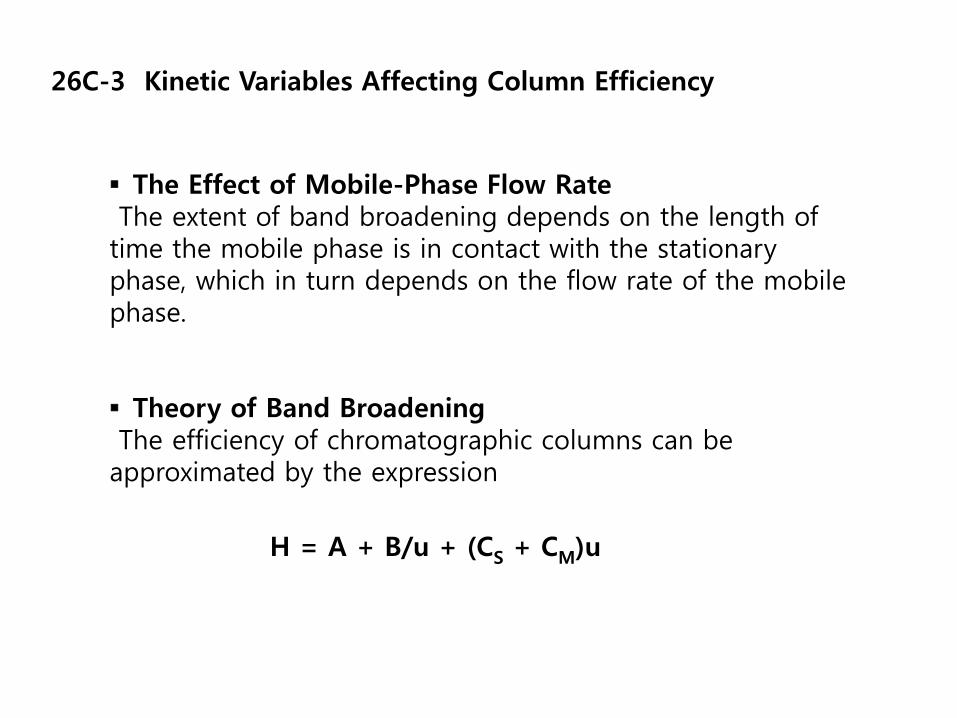
26C-3 Kinetic Variables Affecting Column Efficiency
▪ The Effect of Mobile-Phase Flow Rate The extent of band broadening depends on the length of time the mobile phase is in contact with the stationary phase, which in turn depends on the flow rate of the mobile phase. ▪ Theory of Band Broadening The efficiency of chromatographic columns can be approximated by the expression
H = A + B/u + (CS + CM)u


Fig. 26-8 Effect of mobile-phase flow rate on plate height for LC and GC

∙ The Multipath Term A.
As shown in Fig 26-9, the length of these pathways many differ significantly.

∙ The Longitudinal Diffusion Term B/u.
Fig 26-9. Typical pathways of two molecules during elution.
Diffusion is a process in which species migrate from a more concentrated part of a medium to a more dilute region.

∙ The Stationary-Phase Mass-Transfer Term CSu.
When the stationary phase is an immobilized liquid, the mass-
transfer coefficient is directly proportional to the square of the
thickness of the film on the support particles df2 and inversely
proportional to the diffusion coefficient Ds of the solute in the film.
∙ The Mobile Phase Mass-Transfer Term CMu.
The mass-transfer processes that occur in the mobile phase are
sufficiently complex that we do not yet have a complete
quantitative description.

Fig 26-10. Contribution of various mass-transfer terms to plate height.
H = A + B/u + (CS + CM)u
A Van Deemter plot (Fig. 26-10)

∙ Effect of Mobile-Phase Velocity on Terms in Equation 26-23. Fig 26-10 shows the variation of the three terms in Equation 26-23 as a function of mobile-phase velocity.
∙ Summary of Methods for Reducing Band Broadening. For packed columns, the most important variable that affects column efficiency is the diameter of the particles making up the packing.
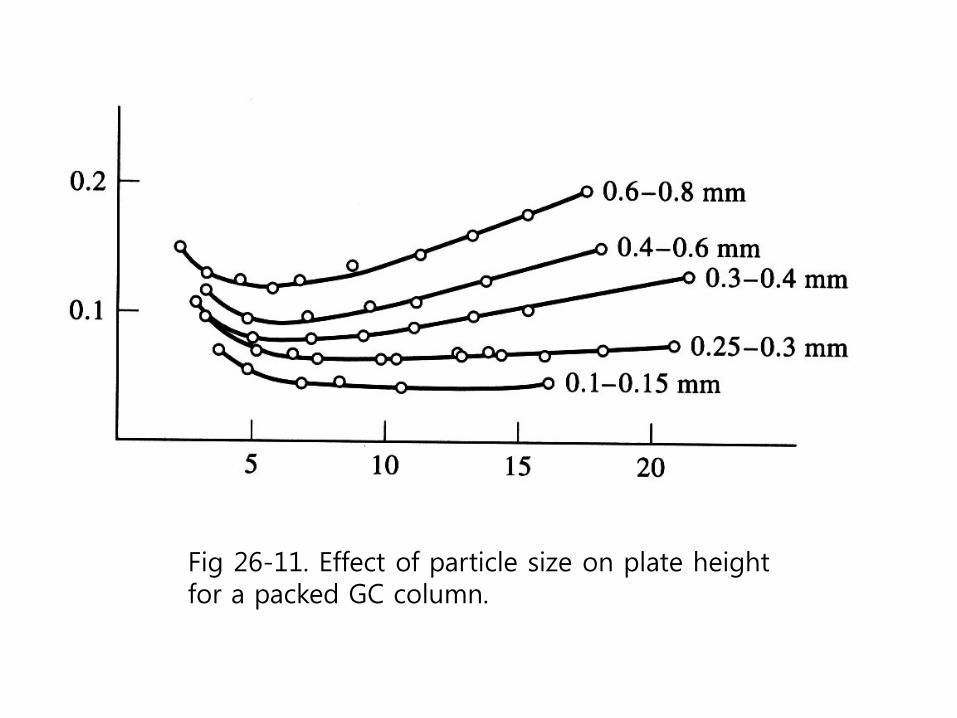
Fig 26-11. Effect of particle size on plate height for a packed GC column.

26D Optimization of Column Performance
26D-1 Column Resolution (Rs)
The resolution Rs of a column tells us how far apart two bands are
relative to their widths.
Fig 26-12. Separation at three resolution values: R = 2∆Z/(WA + WB ).
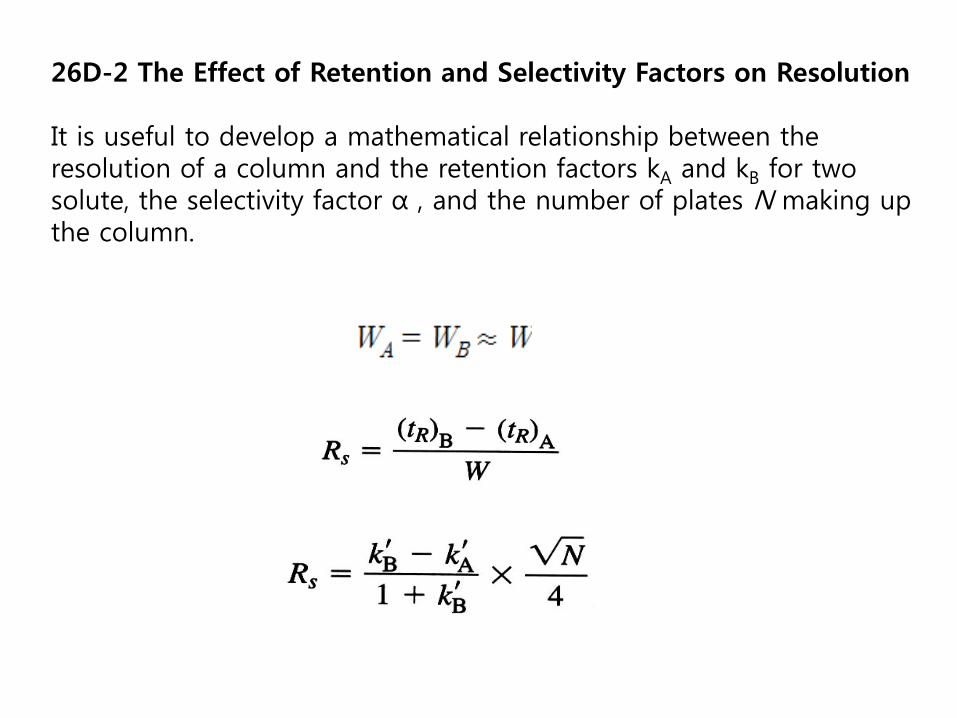
26D-2 The Effect of Retention and Selectivity Factors on Resolution It is useful to develop a mathematical relationship between the resolution of a column and the retention factors kA and kB for two solute, the selectivity factor α , and the number of plates N making up the column.

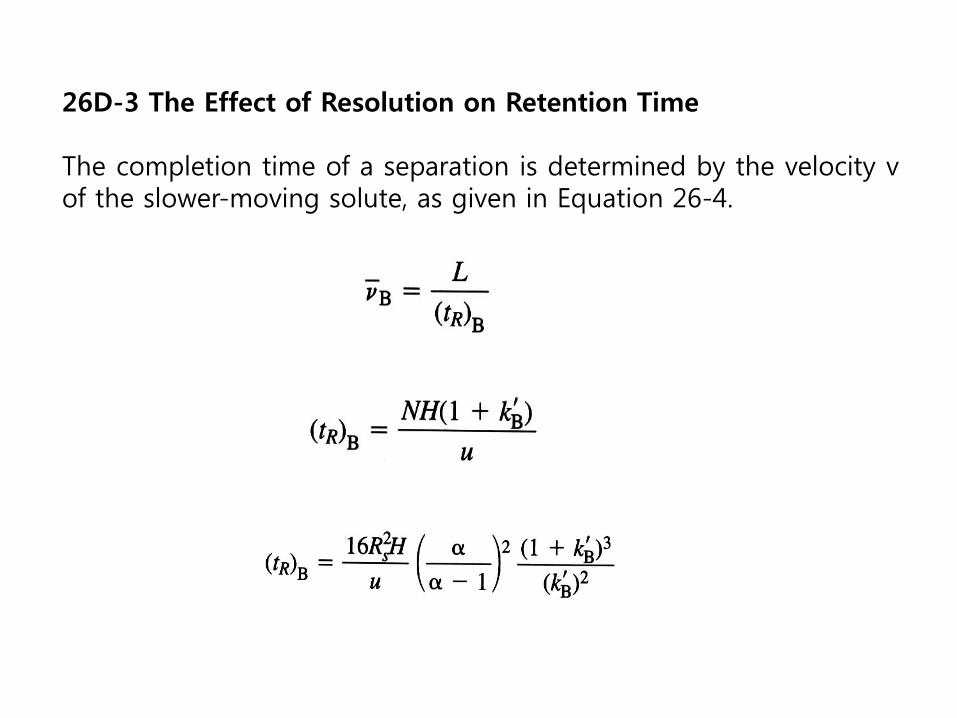
26D-3 The Effect of Resolution on Retention Time The completion time of a separation is determined by the velocity v of the slower-moving solute, as given in Equation 26-4.

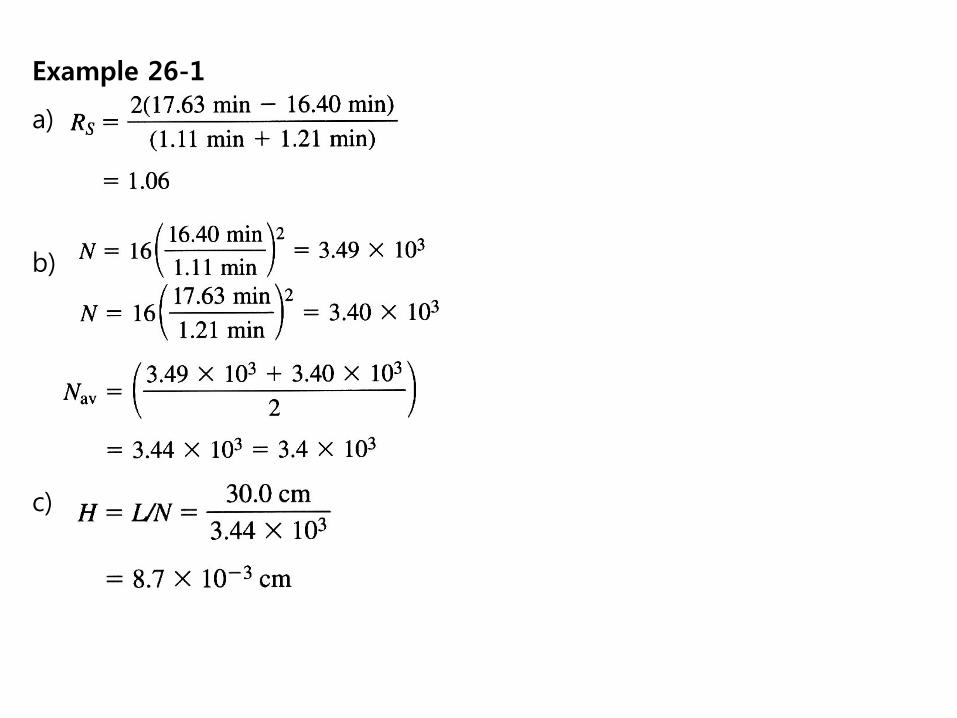
Example 26-1
a)
b)
c)

d)
e)
f)
26D-4 Variables That Affect Column Performance
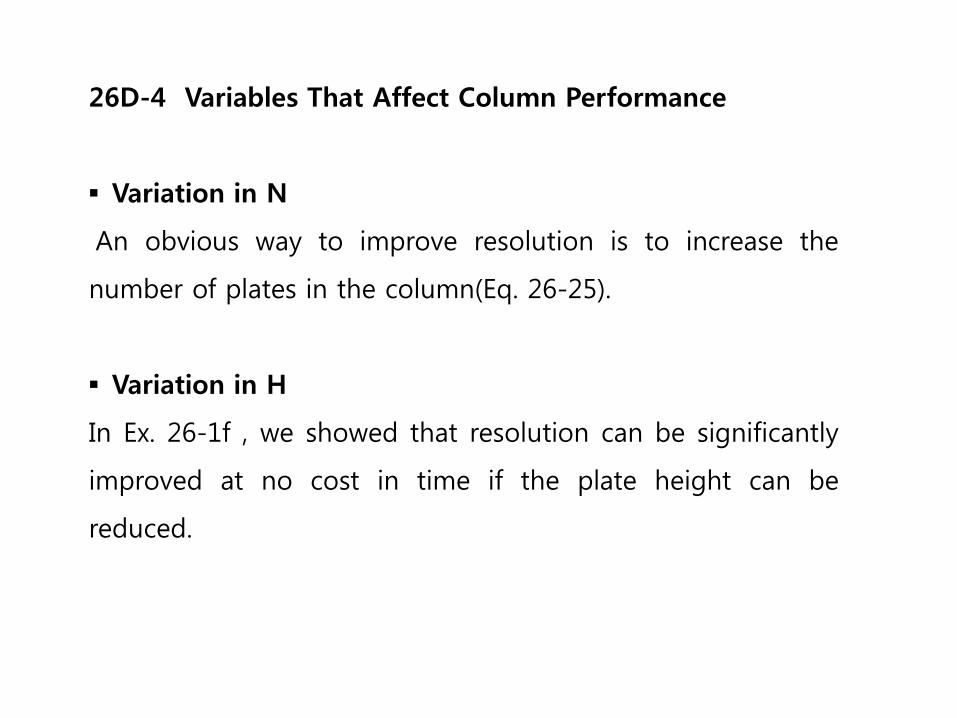
▪ Variation in N
An obvious way to improve resolution is to increase the
number of plates in the column(Eq. 26-25).
▪ Variation in H
In Ex. 26-1f , we showed that resolution can be significantly
improved at no cost in time if the plate height can be
reduced.

▪ Variation in Retention Factor
Often, a separation can be improved significantly by
manipulating the retention factor kB .
▪ Variation in Selectivity Factor
Optimizing k and increasing N are not sufficient to give a
satisfactory separation of two solutes in a reasonable time
when α approaches unity.

Fig26-13. Effect of retention factor kB on resolution and elution time ( tR)B

26D-5 The General Elution Problem
Fig 26-15 shows hypothetical chromatograms for a six-
component mixture made up of three pairs of components
with widely different distribution constants and thus widely
different retention factors.
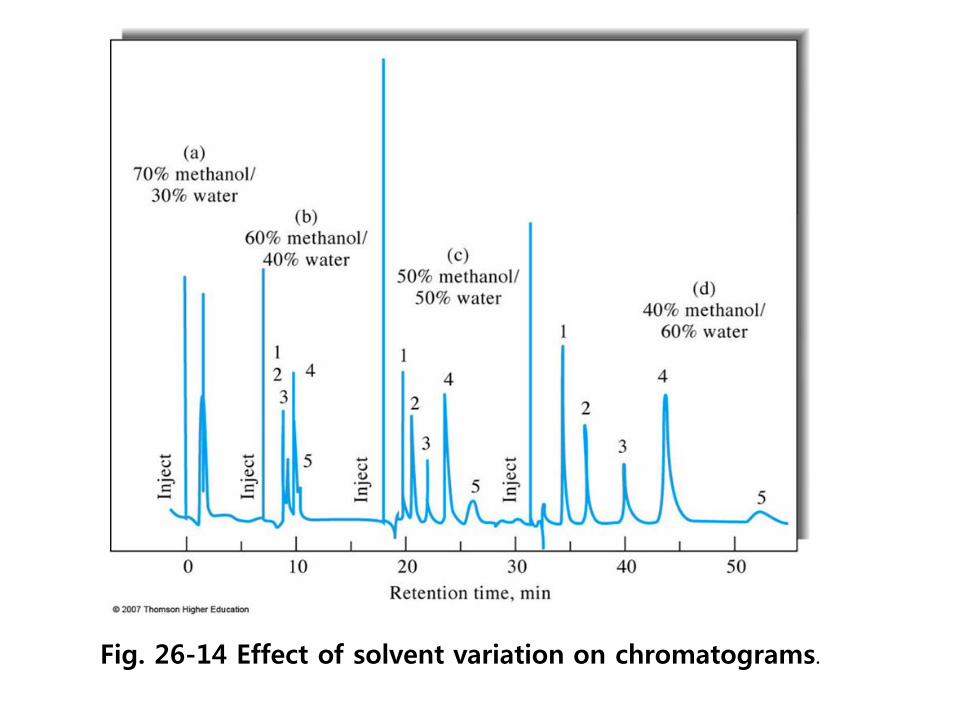
Fig. 26-14 Effect of solvent variation on chromatograms.

Fig. 26-15. The general elution problem in chromatography.
26E Summary of chromatographic relationships
The number of quantities, terms, and relationships employed
in chromatography is large and often confusing. Tables 26-4 and
26-5 summarize the most important definitions and equations
that will be used in the next three chapters.
26F Applications of chromatography
26F-1 Qualitative Analysis
A chromatogram provides only a single piece of qualitative
information about each species in a sample, its retention
time or its position on the stationary phase after a certain
elution period.


26F-2 Quantitative Analysis
▪ Analyses Based on Peak Height
The height of a chromatographic peak is obtained by
connecting the baselines on either side of the peak by a
straight line and measuring the perpendicular distance from
this line to the peak.
▪ Analyses Based on Peak Areas
Peak areas are independent of broadening effects due to the
variables mentioned in the previous paragraph.

▪ Calibration and Standards
The most straightforward method for quantitative
chromatographic analyses involves the preparation of a series
of external-standard solutions that approximate the
composition of the unknown.

▪ The internal-Standard Method
The highest precision for quantitative chromatography is
obtained using internal standards because the uncertainties
introduced by sample injection are avoided.
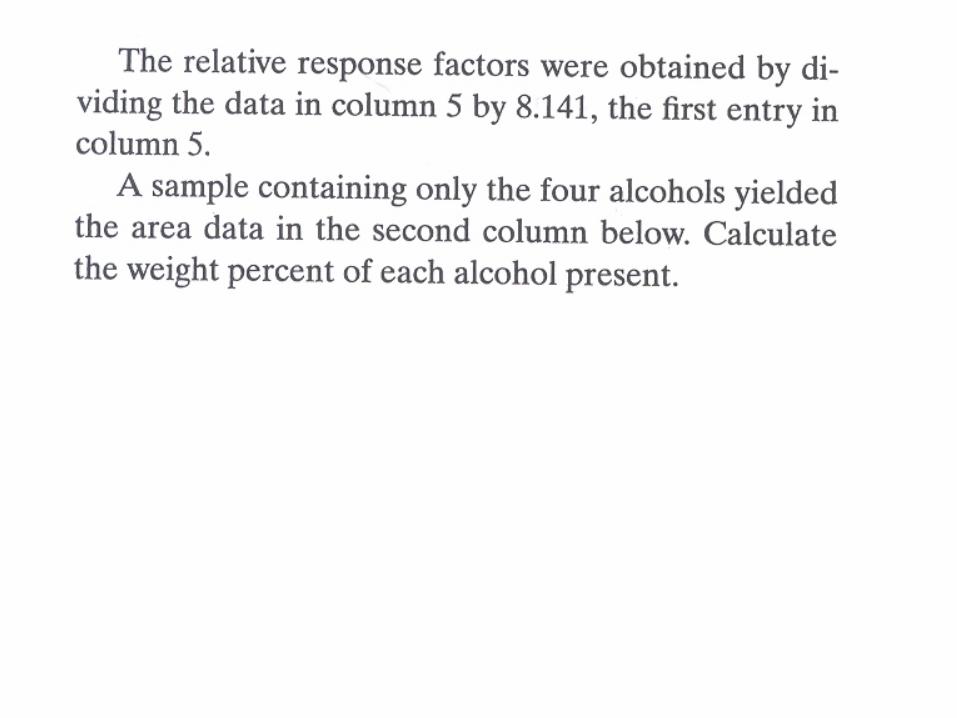
▪ The Area-Normalization Method
Another approach that avoids the uncertainties associated
with sample injection is the area-normalization method.