Embed Size (px)
Citation preview
October 28, 2014
[THE UK'S PRODUCTIVITY PUZZLE - BRYSON AND FORTH DRAFT
PLEASE DO NOT CITE]
1
CHAPTER X. THE UK'S PRODUCTIVITY PUZZLE
Alex Bryson and John Forth
1. INTRODUCTION
In June 2008 the UK was hit by the biggest recessionary shock in living memory. The shock,
which has subsequently come to be known as the "Great Recession", was felt across most
developed economies in the world and many in the developing world. Its origins lay in a
global banking crisis linked to exposures to bad mortgage debts in the United States. The era
of sustained economic growth enjoyed in the UK for nearly two decades was reversed almost
overnight. Stock market crashes throughout the world were precipitated by investor
uncertainty, firms suffered from sudden credit tightening, and demand for goods and services
started falling. Whilst many of these immediate responses to the banking crisis were common
across the world, each country faced specific difficulties due to differences in the nature of
their economies and institutions and the position they were in when the crisis hit. The UK
economy has performed particularly poorly in the intervening years. According to ONS
(2014) UK output per hour in 2013 was 0.5 percentage points below its level in the pre-
recession year of 2007 and 15-16 percentage points below the counterfactual level had
productivity grown at its average rate before the recession (Figure 1).1 This compares with a
productivity gap in 2013 of around 6 percentage points for the rest of the G7.2
NIESR, CEP and IZA. Corresponding author: [email protected] NIESR 1 These GDP figures are based on the new national accounting standard known as ESA 2010 which bring
countries' GDP estimation methodologies broadly into line. According to ONS: "revisions to UK GDP have

October 28, 2014
[THE UK'S PRODUCTIVITY PUZZLE - BRYSON AND FORTH DRAFT
PLEASE DO NOT CITE]
2
Figure 1 Productivity growth in the UK and the rest of the G7, 1997-2013
Source: ONS (2014)
The fact that output per hour remained below its pre-recession peak so long after the onset of
recession is quite remarkable, although the UK is by no means alone in that respect. Output
per hour in 2013 remained below the pre-recession peak in Italy, Germany and Belgium and
increased its level significantly but revisions to GDP growth rates have been much more modest, such that the productivity gap on the latest estimates is only marginally narrower than on the previous estimates". 2 Even if one shares the concerns of other commentators (Riley et al 2014; Pessoa and Van Reenen 2013) that a
linear extrapolation of the productivity growth that occurred prior to recession does not offer a reasonable counterfactual against which to judge the impact of the recession, it is nevertheless a useful starting point against which to make international comparisons.

October 28, 2014
[THE UK'S PRODUCTIVITY PUZZLE - BRYSON AND FORTH DRAFT
PLEASE DO NOT CITE]
3
was barely back to its pre-recession peak in France. The US, Canada, Japan, Ireland and
Spain have all experienced substantial growth in output per hour in that time.
In purely accounting terms the decline in output per hour in the UK can be traced to two
rather surprising trends. The first is the period of low GDP growth which, as Figure 2 shows,
is unprecedented in over 100 years. It was only in August 2013 that GDP returned to its pre-
recessionary peak. According to NIESR estimates, by the third quarter of 2014 UK GDP was
3.5 per cent larger than its previous peak in January 2008 (NIESR, 2014).
Figure 2: Speed of Recovery from Recession in the UK
Source: NIESR.
October 28, 2014
[THE UK'S PRODUCTIVITY PUZZLE - BRYSON AND FORTH DRAFT
PLEASE DO NOT CITE]
4
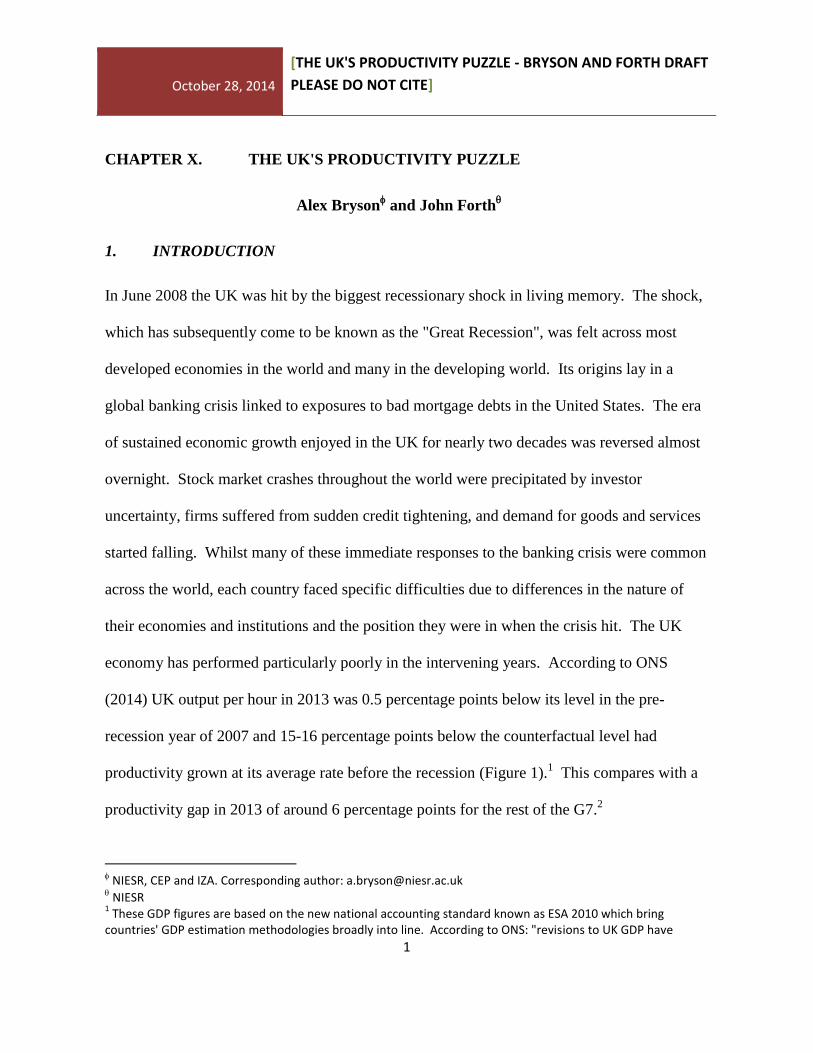
Second, the UK has been a victim of one particular success, namely the muted labour market
response to the recession. Although employment fell in the quarters after the recession, the
decline is nothing like that experienced in the recessions of the 1980s and 1990s (Figure 3).
Furthermore, it has subsequently recovered so that it now stands above the pre-recession peak.
Hours per worker fell more steeply, in part due to growth in part-time working. This, together
with substantial shifts away from full-time permanent contracts towards self-employment and
temporary contracts, suggest flexibility in the UK labour market has sustained employment
levels, in spite of poor growth. Poo GDP growth and sustained employment levels have
combined to push labour productivity down. In this sense the UK stands in contrast with the
United States where unemployment has risen dramatically and GDP has been growing
steadily, returning to growth 14 quarters after the start of the recession.
Figure 3: Employment levels in recent recessions
October 28, 2014
[THE UK'S PRODUCTIVITY PUZZLE - BRYSON AND FORTH DRAFT
PLEASE DO NOT CITE]
5
Source: ONS Integrated Labour Market Database (series MGRZ).
Simply pointing to the trends in the numerator and denominator is only a starting point in
seeking to understand what has become known as the UK's "productivity puzzle". There are
really two puzzles. First, why has economic growth taken quite so long to recover in the UK?
And second, why has the labour market responded so differently to recession this time
compared to earlier recessions? These are the questions addressed in this chapter.
Terminology is important in investigating the UK productivity puzzle. First it is important to
be clear what measure of productivity we are exploring. In this chapter we focus on labour
productivity, as opposed to total factor productivity (TFP). We concentrate on the former
which counts output per worker or output per hour worked. Even here there is room for
confusion: the decline in productivity is not quite so dramatic measured as output per hour, as
opposed to output per head, because hours worked per worker have fallen more than numbers
in employment. Nevertheless, we also briefly consider TFP which is the efficiency with
which employers deploy a given set of inputs: this is likely to change in the aftermath of
recession especially, as we shall see, when the relative price of inputs shifts dramatically.
The remainder of this chapter comprises three sections. The first reviews the literature on the
UK's productivity "puzzle", examining some of the main culprits or suspects that may explain

October 28, 2014
[THE UK'S PRODUCTIVITY PUZZLE - BRYSON AND FORTH DRAFT
PLEASE DO NOT CITE]
6
recent trends. The second section contributes to the empirical literature by testing some
hypotheses in new ways, in order to shed further light on patterns of productivity growth
among British workplaces over the period 2004-2011.3 The third and final section looks to the
future and comments on the prospects for UK productivity growth over the next decade or so.
2. THE USUAL SUSPECTS IN THE UK'S PRODUCTIVITY PUZZLE
In this section we consider some of the key arguments that have been put forward for the two
puzzles behind the UK's productivity puzzle, namely the slow rate of GDP recovery and the
muted employment response to low growth.
The Role of the Finance Sector: The recession was triggered by a banking crisis. Its
international operations mean Finance is a much larger part of the UK economy than it is in
most other countries in the world. One of the government's main priorities in the immediate
aftermath of the Crash was ensuring stability in the banking sector. To this end, it underwrote
the sector to the tune of £1.162 billion, and nationalised RBS and other parts of the banking
sector.4 These actions were successful in staving off a full-scale banking collapse, but they
3 The data used to perform this analysis are the Workplace Employment Relations Survey 2011 (WERS) which is
nationally representative of British workplaces with 5 or more employees. It does not cover Northern Ireland, which is why we talk of Britain, not the UK, when we refer to its findings. 4 This is a National Audit Office estimate in relation to the provision of guarantees and non-cash support (eg the
Credit Guarantee Scheme, Special Liquidity Scheme and Asset Protection Scheme) and the provision of cash including loans to the Financial Services Compensation Scheme and insolvent banks to support deposits, as well as the purchases of share capital in the Royal Bank of Scotland and Lloyds Banking Group. See http://www.nao.org.uk/highlights/taxpayer-support-for-uk-banks-faqs/

October 28, 2014
[THE UK'S PRODUCTIVITY PUZZLE - BRYSON AND FORTH DRAFT
PLEASE DO NOT CITE]
7
were expensive, both in government time and in taxpayers' money, crowding out efforts
which might otherwise have been devoted to stimulating demand with a view to returning to
growth. That stimulus did follow with quantitative easing injecting close to £400 billion into
the UK economy.5 However, the stimulus was not on the scale of that undertaken in the
United States and much of this money found its way onto company balance sheets, rather than
flowing round the British economy, due to investor and consumer uncertainty. Uncertainty is
known to play an important role in constraining corporate investment (Bloom et al., 2007;
Bloom, 2009), but it may have played a particularly important role in the current recession, in
part due to the policy uncertainty surrounding the sovereign debt crisis that unfolded in the
Eurozone shortly after the Crisis began (Lane, 2012). That said, there is no indication in the
OECD's Business Confidence Indicator that the UK suffered a particularly dramatic decline in
business confidence in the aftermath of recession relative to other countries (Appendix Table
A1).
The banking crisis therefore had direct repercussions for productivity growth through its
impact on output in the Finance sector (see below) and by absorbing public finances that
might have been put to good use elsewhere, but it may also have had indirect repercussions
for productivity elsewhere in the economy through credit constraints placed on borrowers,
especially for small and new businesses. The significance of credit constraints in driving
productivity weakness is, however, disputed. First, banks are not a major source of credit for
5 http://www.publications.parliament.uk/pa/cm201213/cmselect/cmtreasy/writev/qe/m18.htm

October 28, 2014
[THE UK'S PRODUCTIVITY PUZZLE - BRYSON AND FORTH DRAFT
PLEASE DO NOT CITE]
8
many companies in Britain: money for expansion often comes from internal resources or
share issuance. This helps explain the fairly small bank-dependence figures presented by
Riley et al. (2014a) for industries pre- and post-recession. What is more, unlike the previous
recession of the early 1990s, company profitability had been high prior to the 2008 recession,
such that many companies were cash rich and therefore capable of investing in growth if they
wished, while interest rates were low. The fact that they chose not to do so reflected deep
unease about the future prospects of the British economy.6 In fact, although bank lending to
companies did fall more sharply in this recession than it did in the three other post-1970
recessions, this only had a modest impact on the sectors and firms most directly affected, so
that the credit supply shock can only account for a small part of the overall decline in
aggregate productivity (Riley et al., 2014a).
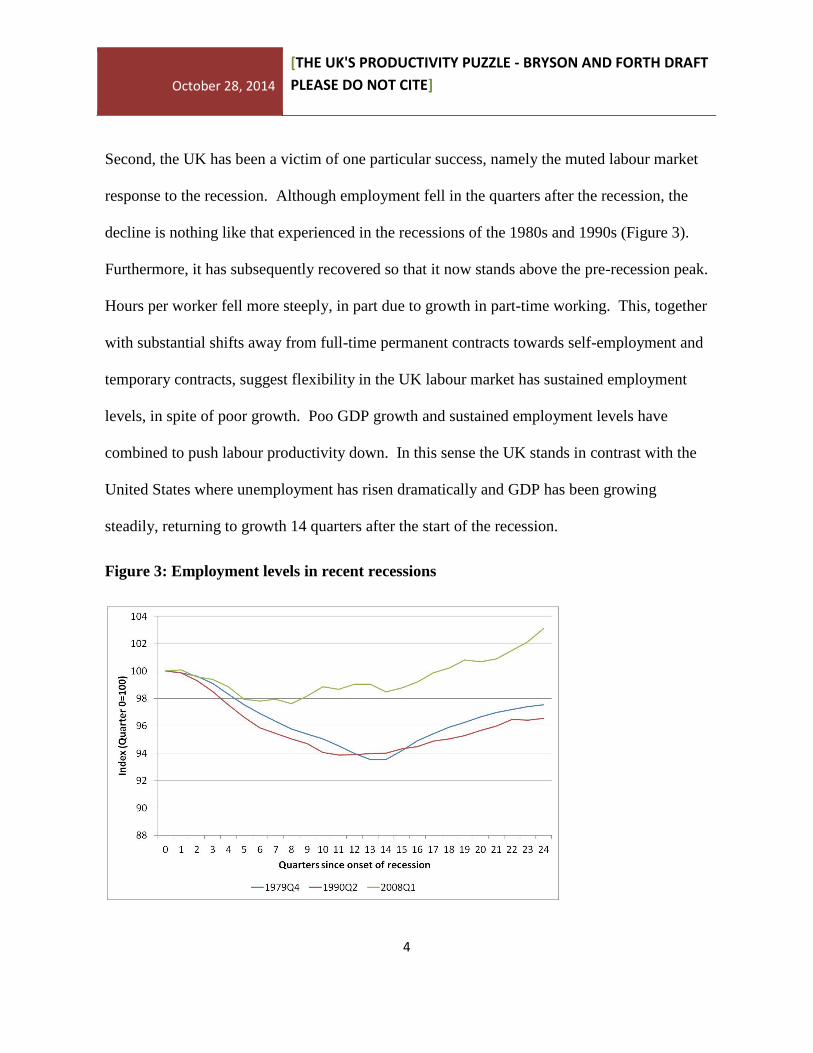
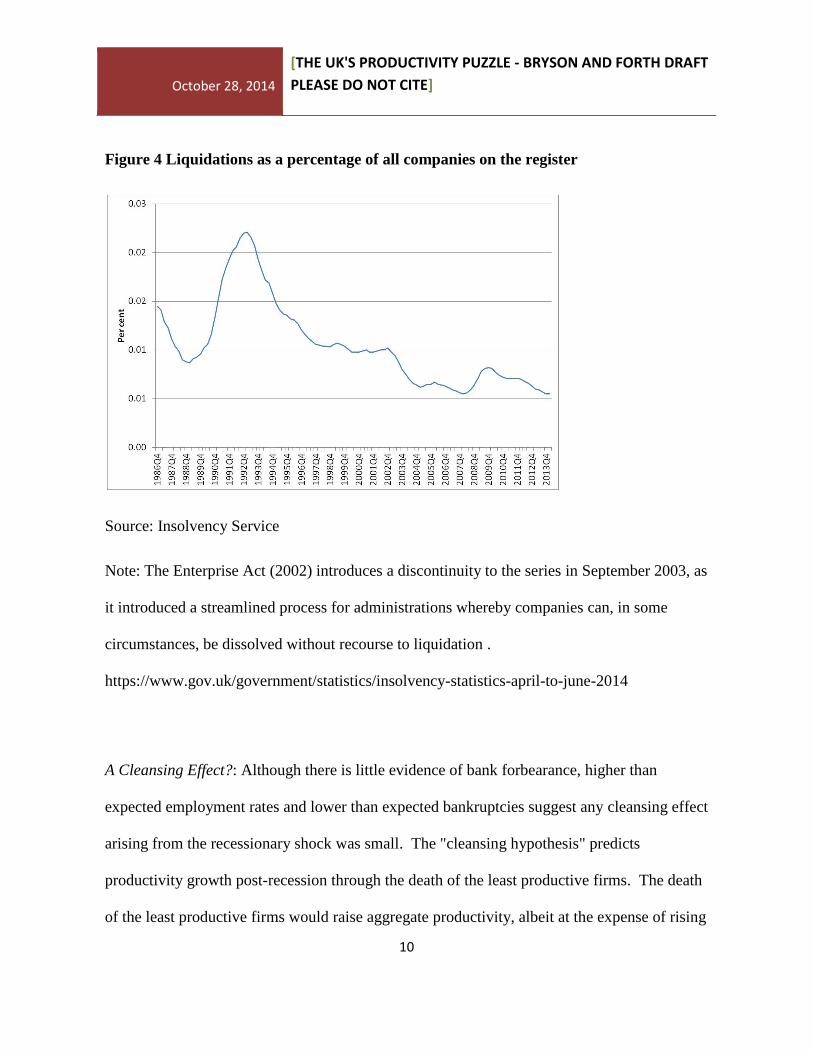
An alternative perspective is that, far from credit drying up, banks and other creditors may
have shown some forbearance to indebted firms: the fact that liquidations spiked briefly post-
recession but began to fall again shortly afterwards (Figure 4) is consistent with banks being
reluctant to call in 'bad' debts, leading to the survival of what appear to be highly
unproductive firms (sometimes referred to as "Zombie" firms). This may have occurred if
banks and other financiers were loathe to declare bad loans at a time when their own balance
sheets were vulnerable. Pessoa and Van Reenen (2013) speculate that political pressures may
6 Corporations' failure to invest has also been a preoccupation in the United States pre-dating the recession.
Lazonick (2014) reveals that between 2003 and 2012 the S&P 500 companies used 54% of their earnings - amounting to $2.4 trillion - to buy back their own stock, while dividends absorbed another 37% of earnings.

October 28, 2014
[THE UK'S PRODUCTIVITY PUZZLE - BRYSON AND FORTH DRAFT
PLEASE DO NOT CITE]
9
also have played a part since the government, as the new owners of banks such as RBS, may
have promoted forbearance to avoid politically damaging rising unemployment. However,
Arrowsmith et al (2013) find little evidence of forbearance outside the commercial real estate
sector and Riley et al. (2014a) find bank forbearance had little effect on aggregate
productivity.
October 28, 2014
[THE UK'S PRODUCTIVITY PUZZLE - BRYSON AND FORTH DRAFT
PLEASE DO NOT CITE]
10
Figure 4 Liquidations as a percentage of all companies on the register
Source: Insolvency Service
Note: The Enterprise Act (2002) introduces a discontinuity to the series in September 2003, as
it introduced a streamlined process for administrations whereby companies can, in some
circumstances, be dissolved without recourse to liquidation .
https://www.gov.uk/government/statistics/insolvency-statistics-april-to-june-2014
A Cleansing Effect?: Although there is little evidence of bank forbearance, higher than
expected employment rates and lower than expected bankruptcies suggest any cleansing effect
arising from the recessionary shock was small. The "cleansing hypothesis" predicts
productivity growth post-recession through the death of the least productive firms. The death
of the least productive firms would raise aggregate productivity, albeit at the expense of rising

October 28, 2014
[THE UK'S PRODUCTIVITY PUZZLE - BRYSON AND FORTH DRAFT
PLEASE DO NOT CITE]
11
unemployment, via a compositional change in the stock of firms. If this had occurred, one
would anticipate some compression in output and productivity following the removal of less
productive firms from the economy. In fact the variance in output rose after the recession
across sectors (Pessoa and Van Reenen, 2013: Figure 13), as did the variance in gross value
added (Barnett et al., 2014a: R38; Barnett et al., 20014b: 123). The variance of productivity
across establishments also rose, even within the same sector (Field and Franklin, 2013).
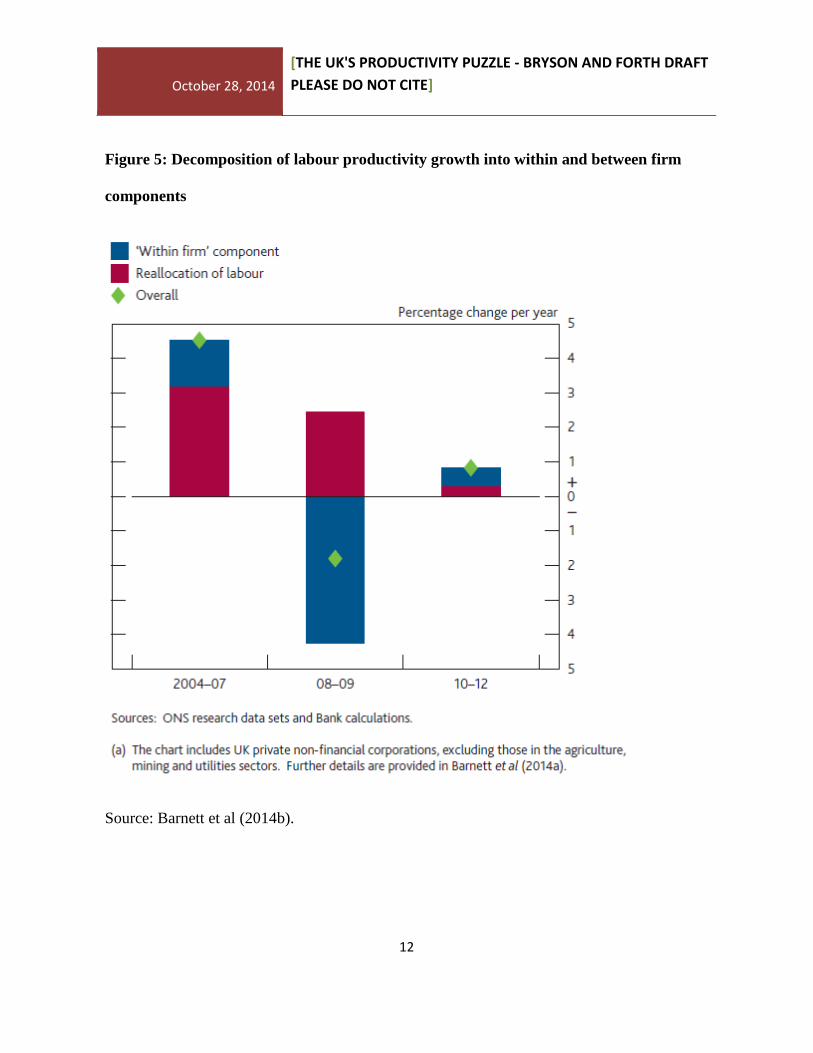
Some have argued that the absence of factor reallocation reflects credit market distortions
such that reallocation may be driven more by credit constraints and less by market
fundamentals such as productivity, demand and costs (Broadbent, 2012). Riley et al.'s
(2014b) decomposition of UK market sector productivity growth between 2002 and 2011
indicates that the contribution of company entry and exit did not change very much over time.
The reallocation of factors of production towards more productive sectors declined a little,
explaining some of the fall in productivity. But, as both Riley et al. (2014b) and Barnett et al.
(2014b) show, the chief contributor to falling productivity post-recession is attributable to
within-sector and within-company factors (Figure 5). The implication is that neither bank
forbearance issues nor the lack of a cleansing effect arising due to problems in the banking
sector were major contributors to low productivity growth after 2008.
October 28, 2014
[THE UK'S PRODUCTIVITY PUZZLE - BRYSON AND FORTH DRAFT
PLEASE DO NOT CITE]
12
Figure 5: Decomposition of labour productivity growth into within and between firm
components
Source: Barnett et al (2014b).
October 28, 2014
[THE UK'S PRODUCTIVITY PUZZLE - BRYSON AND FORTH DRAFT
PLEASE DO NOT CITE]
13
Both firm-level and workplace-level aggregate figures suggest any cleansing effect of the
recession may have been muted. The proportion of loss-making firms in the economy rose
significantly post-recession (Barnett et al., 2014b: 124-125). Direct evidence on the rate of
workplace closures indicates they were no different in the period affected by recession (2004-
11) than they were in the more benign conditions in the period 1998-2004 (Van Wanrooy et
al., 2013). Redundancies did rise immediately after the shock, but returned to pre-recession
rates shortly thereafter, indicating a short-run impact of recession (Broadbent, 2012: Chart 4).
Incentives to innovate: The opportunity cost of time and resources is low during recessions
due to depressed demand, potentially encouraging firms to focus on the reallocation of capital
and labour to increase productivity in time for an up-turn (Geroski and Gregg, 1997: 11).
However, there is little evidence of heightened reallocation activity within firms and
workplaces. There appears to be a moderate degree of work reorganization taking place
within workplaces but these changes are not significantly associated with the degree to which
workplaces were adversely affected by recession (Van Wanrooy et al., 2013: 183-184).
Instead the extensive work reorganisations uncovered by workplace surveys "serve as
indicators of managers' willingness to innovate, whether in good times or bad" (op. cit., 184).
This is also the conclusion Geroski and Gregg (1997) came to in their firm-level investigation
of resource allocation after the recession of the early 1990s.7 However, the UK Innovation
Survey conducted for the Department for Business Innovation and Skills by ONS indicates a
7 In the manufacturing sector in the United States there has not been the same degree of resource reallocation
to more highly productive firms as occurred in the 1980s (Foster et al., 2013).

October 28, 2014
[THE UK'S PRODUCTIVITY PUZZLE - BRYSON AND FORTH DRAFT
PLEASE DO NOT CITE]
14
marked decline in the rate of both product and process innovation in UK firms, although the
real expenditure on R&D has remained broadly constant. On the basis of these figures Bank
of England analysts estimate that the fall in the number of product innovators may account for
1 percentage point of the productivity shortfall between 2008 and 2012 (Barnett et al., 2014b:
122-123).
Labour Hoarding: The short-term spike in redundancies, the low rate of bankruptcies,
liquidations and closures, are also consistent with labour hoarding, that is, the retention of
staff in spite of a substantial downturn in demand for goods and services. Indeed Barnett et al
(2014b, Chart 5) show that the proportion of firms with shrinking output but constant
employment almost doubled through recession, from around 10% in 2005-2007 to around
18% in 2008-2010. Labour hoarding is most likely to occur when firms are uncertain about
the timing of an up-turn in demand, and thus prepared to hang onto staff rather than incur the
costs of firing and rehiring (Martin and Rowthorn, 2012). The muted unemployment response
to falling GDP is uncontested. However, the labour hoarding interpretation of this
phenomenon is disputed: can firms really be underutilising labour so long after the
recessionary shock? Some argue that firms are retaining high skilled labour having learned
that they let high value-added workers go too cheaply in the previous recession.8 It is possible
that the returns to firm-specific human capital have increased since the last recession, making
skilled labour turnover even more costly. However, Goodridge et al. (2013) argue that skilled
8 Qualitative evidence in support of this proposition comes from the Bank of England's Agents (Barnett et al.,
2014b: 120).

October 28, 2014
[THE UK'S PRODUCTIVITY PUZZLE - BRYSON AND FORTH DRAFT
PLEASE DO NOT CITE]
15
labour retention does not constitute hoarding. Rather, skilled workers may be producing
intangible capital which isn't measured. This could explain why we observe something which
looks like skilled labour hoarding but is, in fact, a mismeasurement of the output of skilled
labour. Furthermore, higher than expected employment levels are due not only to declining
flows out of employment but also to hiring rates which are at or above their pre-recession
average (Barnett et al., 2014b: 121), something that is difficult to characterise as labour
"hoarding".
The Flexible Labour Market: Whether it is characterised as labour hoarding or not, firms are
employing far more individuals than one might have anticipated given the sustained reduction
in output. So why might this be? One possibility is that firms are taking advantage of the
UK's flexible labour market. The UK is known for low levels of labour market regulation and,
as such, we might expect to see higher employment levels and, perhaps, higher labour
"churn", than in some countries. Certainly, the UK was experiencing historically high levels
of employment prior to the Crash in 2008, measured both in terms of the total numbers in the
workforce and labour market participation rates. But what is at issue here is the labour
market's response to that downturn. As noted in the introduction, the UK economy has more
jobs today than it did at the pre-recession peak. It is true, however, that workers began
working fewer hours, on average, with the onset of recession, which is why the fall in labour
productivity is not so dramatic when measured as output per hour compared with output per
head. This difference is accounted for by the increasing percentage of employees working

October 28, 2014
[THE UK'S PRODUCTIVITY PUZZLE - BRYSON AND FORTH DRAFT
PLEASE DO NOT CITE]
16
part-time and by a reduction in the average hours worked by full-time employees. The UK
economy has effectively adjusted at the intensive, as opposed to the extensive, margin.
Figure 6 Balance of under-employment to over-employment, 2001-2013
Note: Chart shows millions of additional hours desired by those who would like to work more
hours, and millions of additional hours worked by those who would like to work fewer hours.
Source: Bell and Blanchflower (2014)
This has resulted in a growth in "under-employment" among those in the labour force, with
the percentage of employees wishing to work more hours outstripping the percentage wishing

October 28, 2014
[THE UK'S PRODUCTIVITY PUZZLE - BRYSON AND FORTH DRAFT
PLEASE DO NOT CITE]
17
to work fewer hours (Figure 6). However, there has been a recent increase in average hours
worked such that they have returned to the hours worked shortly before the recession.9
Further evidence of labour force flexibility is evident in the growth of self-employment: the
number of workers who were self-employed in their main job rose by 367,000 between April-
June 2008 and April-June 2012, most of the increase occurring between 2011 and 2012. This
is an increase in the rate of self-employment 13.0 to 14.1% (Table 1). However, not all forms
of flexible employment contract have risen dramatically. In contrast to other European
countries such as France there has been no substantial growth in the use of temporary
contracts.
Table 1 Numbers of self-employed and employees in the UK, April-June, 2008-2012
Self-employed
(Thousands) Employees
(Thousands) Self-employment rate
(%)
2008 3,810 25,416 13.0
2009 3,790 24,817 13.2
2010 3,896 24,783 13.6
2011 3,957 25,011 13.7
2012 4,176 24,983 14.1
Source: Labour Force Survey
Declining real wages: The UK has experienced large and unprecedented reductions in real
wage growth since the recession. The rate of real wage growth began to decline in 2003, well
before the onset of recession, for reasons that are currently unknown (Gregg et al., 2014a).
9 The ONS's seasonally adjusted series for main jobs indicates that average weekly hours were 32.2 (37.3 for
full-timers) in Jan-Mar 2008 just prior to the recession. They fell to 31.5 (36.6) in Jan-Mar 2009, only recovering to their pre-recession level in Jan-Mar 2012 for full-timers (37.3 hours) and Jan-Mar 2014 (32.1 hours) for all employees.
October 28, 2014
[THE UK'S PRODUCTIVITY PUZZLE - BRYSON AND FORTH DRAFT
PLEASE DO NOT CITE]
18
Real wage losses have been experienced across the wage distribution. This has made labour
particularly cheap for employers such that incentives to substitute labour for capital have
increased (see below). This may lie behind labour "hoarding" and healthy hiring rates, since a
higher labour to capital ratio may be optimal for profits compared with the pre-recessionary
period.
To date analysts have been largely unable to identify the precise mechanisms by which labour
market flexibility and real wage decline have occurred, though there does appear to be a
strong correlation between movements in labour productivity and mean hourly total
compensation (Gregg et al., 2014b: Figure 7). One hypothesis is that the bargaining power of
workers has declined, partly due to the long-run decline in trade union collective bargaining
coverage, and partly through changes in the UK's unemployment benefits regimes which
require benefit recipients to actively seek work and accept job offers even if they are not
offering the wages or job prospects job seekers would ideally like.10
Consistent with this,
Gregg et al. (2014a) demonstrate a marked increase in the sensitivity of real wages to
unemployment in the 2000s, one that is particularly marked in the non-union sector. Another
factor has been the growth in the labour force since 2008: the UK's population rose from 61.4
to 63.1 million between 2008 and 2014, partly due to immigration, a labour supply shock that
has dampened real wages. It is certainly the case that a substantial percentage of employees
10
This has spawned debate about labour's share and, in particular, whether wages have kept up with productivity growth. It does appear that real wage growth, measured as real producer wages, has fallen behind growth in output. However, part of the explanation lies in the increasing percentage of all labour costs going to pensions. When this is accounted for the gap is not apparent (Pessoa and Van Reenen, 2013).

October 28, 2014
[THE UK'S PRODUCTIVITY PUZZLE - BRYSON AND FORTH DRAFT
PLEASE DO NOT CITE]
19
have suffered nominal wage freezes, especially in the public sector (van Wanrooy et al.,
2013). Pay freezes have been just as common among union covered employees as they have
been in the uncovered sector (van Wanrooy et al., 2013, op. cit.). Many employees have
suffered nominal wage reductions due to a combination of falling bonus payments, and
reductions in overtime and normal hours, but many who have remained in the same job have
even suffered hourly basic pay reductions (Gregg et al., 2014b).
Capital shallowing: One hypothesis which appears to account for a sizeable part of the
decline in labour productivity is capital shallowing, that is, the decline in the capital-labour
ratio. This occurs when there are substantial shifts in the relative price of factor inputs. As
noted above, real wages in the UK have fallen during this recession. Furthermore, the UK has
experienced one of the lowest rates of growth in hourly labour costs: according to Eurostat in
2013 they stood at 20.9 Euros per hour, compared to an EU28 average of 23.7 Euros
(Eurostat, 2014). The UK's hourly labour costs were static between 2008 and 2013, rising
more slowly than all but four of the EU's 28 countries.11
At the same time, the cost of capital
has risen, despite low interest rates, due to banks' reluctance to lend (Broadbent, 2012; Pessoa
and Van Reenen, 2013). These trends create incentives for firms to reduce levels of capital
investment and increase their labour usage. The increase in new hires since 2008 is striking
11
On average real hourly labour costs rose by 10% over the period in the EU. Only Greece, Croatia, Hungary and Poland experienced real declines in hourly labour costs. These labour costs are the wage and non-wage costs in the whole economy excluding agriculture and public administration for enterprises with 10 or more employees and are calculated by extrapolating the 2008 Labour Cost Survey hourly labour cost data expressed in national currencies using the Labour Cost Index (LCI) transmitted by the Member States http://epp.eurostat.ec.europa.eu/cache/ITY_PUBLIC/3-27032014-AP/EN/3-27032014-AP-EN.PDF

October 28, 2014
[THE UK'S PRODUCTIVITY PUZZLE - BRYSON AND FORTH DRAFT
PLEASE DO NOT CITE]
20
and is consistent with "capital shallowing" (Broadbent, 2012 Chart 4). When uncertainty is
rife, firms may feel more comfortable with investments in human capital than fixed capital
since human capital is less "sticky" and can therefore be off-loaded if expectations regarding
growth are not forthcoming (Bloom et al., 2007).
The data on capital stocks date back to 2010 making it difficult to establish whether there has
been a commensurate decline in capital investments by firms (Riley et al., 2014a: R28). Bank
of England analysts estimate capital per worker would have been around 8% higher at the end
of 2013 relative to the counterfactual level that might have obtained in the absence of
recession, a gap which, they suggest, might account for 2.5 percentage points of the
productivity shortfall (Bennett et al., 2014b: 122).
Using the perpetual inventory method Pessoa and Van Reenen (2013) estimate that capital per
worker declined by 5 percent between the second quarter of 2008 and the second quarter of
2012.12
Their decomposition of changes in labour productivity suggests capital shallowing
caused by changes in factor prices accounts for two-thirds of the decline in labour
productivity since the beginning of the Crisis. The decline in average hours per worker
contributed another quarter, while changes in Total Factor Productivity (TFP) accounted for
under one-tenth, a point we return to below.
12
Oulton (2013) argues Pessoa and Van Reenen's (2013) over-estimate the pre-crisis capital stock when calculating capital per worker.
October 28, 2014
[THE UK'S PRODUCTIVITY PUZZLE - BRYSON AND FORTH DRAFT
PLEASE DO NOT CITE]
21
This relatively large contribution of capital shallowing to poor productivity growth is
challenged by Field and Franklin (2014) however. Using a growth accounting framework to
decompose annual output growth in what they term their "indicative estimates" they suggest
that much of the year-on-year change in labour productivity between 2008 and 2012 reflects
changes in TFP, whereas capital deepening made modestly positive contributions to annual
labour productivity growth between 2008 and 2011, before contributing a small amount to
negative growth in 2012.
Sectoral differences: Across the private sector there has been a very prolonged output slump
in the UK since 2008 accompanied by a surprisingly buoyant labour market. The picture is
very different in the public sector. Following substantial growth in public sector employment
under New Labour in the late 1990s and early 2000s, the Coalition Government instituted
measures to raise output per worker. But the austerity programme introduced in response to
the recession focussed on reductions in public sector labour costs through pay freezes and a
very substantial reduction in the size of the public sector workforce. This has probably led to
an increase in public sector productivity, although ONS latest figures show only modest
annual growth of 0.3% in 2009 and 2010 (Pope, 2013).
October 28, 2014
[THE UK'S PRODUCTIVITY PUZZLE - BRYSON AND FORTH DRAFT
PLEASE DO NOT CITE]
22
The other sector that has attracted particular attention is Finance. It is possible that the
reversal in GDP with the recession may have been exaggerated by pre-recessionary growth in
the Finance sector if this growth was illusory, reflecting over-exposure to bad debts and the
production of over-valued assets. In fact, Finance is treated as an intermediate input in
national accounts so is not counted in the value-added underpinning GDP growth (Oulton,
2013). It is true that productivity grew rapidly in the Finance sector prior to the recession:
gross value added per employee rose 156% in Finance between 1995 and 2007 compared with
65% in the economy as a whole (Bell and Van Reenen, 2010: 13). Nevertheless, it only
contributed around 10 per cent of the 2.7 per cent growth in value added per hour that
occurred in the market sector over the period 1979-2007 (Corry et al., 2012).
However, recent analyses by ONS (Wales and Taylor, 2014) point to more sectoral variance
in productivity trends than has hitherto been suggested. Of 25 sub-industries examined, six
had experienced increased labour productivity between 2008 and the fourth quarter of 2013,
primarily through lower hours worked. But three industries - Finance, Utilities and Oil -
accounted for three-quarters of the fall in output per hour. These falls within industries were,
however, offset somewhat by a reallocation of workers away from low productivity industries
towards more productive industries. ONS estimate labour reallocation contributed 1.5
percentage points to aggregate productivity growth over the period.

October 28, 2014
[THE UK'S PRODUCTIVITY PUZZLE - BRYSON AND FORTH DRAFT
PLEASE DO NOT CITE]
23
Measurement error: There are some commentators who caution that the UK productivity
puzzle is not as puzzling as it may, at first, seem, because measurement errors in both output
and employment may accentuate the real underlying trends. Although employment and hours
figures may have become harder to collect with recent increases in immigration and rising
self-employment, they are unlikely to be so problematic as to require a full reappraisal of the
UK productivity puzzle. Calculating GDP is more difficult. Although often subject to
revision, Grice (2012) argues that these revisions are not sizeable enough to explain away the
puzzle. However, Barnett et al. (2014b: 118) suggest that, taken together, measurement issues
and output revisions could explain up to 4 percentage points in the productivity shortfall since
the onset of recession. Inter alia they point to declining output in the North Sea oil and gas
sector since the early 2000s which, if not fully accounted for, overstate the pre-recession
growth trend.
Some maintain the GDP figures are not as bad as they look because they do not capture
intangible assets which, it is argued, are particularly large in the UK. Although they do not
appear on balance sheets because they are too short term, they can be the basis for future
revenue generation (Goodridge et al., 2013).13
13
They are currently treated as intermediate consumption rather than a form of investment. However, from 2014 R&D will be treated as an investment and appear in the Blue Book as part of gross fixed capital formation, thus contributing to GDP.

October 28, 2014
[THE UK'S PRODUCTIVITY PUZZLE - BRYSON AND FORTH DRAFT
PLEASE DO NOT CITE]
24
There is nevertheless heated debate about whether the productivity downturn suggests a
structural problem in the UK economy, not just a response to a large downturn in demand.
Some suggest there has been no large drop in the efficiency with which firms utilise inputs,
namely Total Factor Productivity (TFP). Although interpretations of TFP trends can vary
depending on the base period one is comparing against, the trends in TFP are not dramatically
different to those observed for the 1980s recession, and are better than the decline experienced
in the 1970s recession (Pessoa and Van Reenen, 2013: Figure 15). However, as noted earlier,
not all commentators are quite so sanguine about TFP trends. We return to the issue of TFP in
the final section of this chapter since this has direct implications for the UK's longer-term
prospects.
Summary: In summary, the 2008 Great Recession was notable in the UK for three things: the
enormity of the output shock; the muted unemployment response; and the very slow rate of
recovery. At the time of writing employment levels are above those experienced prior to the
recession, despite the fact that these were high by historical standards, but this appears to have
come at the expense of an unprecedented decline in real wages. Real wages only began rising
in the last quarter of 2013/14, around five years after the beginning of the recession (ONS,
April 2014). Output only recently exceeded pre-recession levels. In contrast to countries such
as France, the productivity issue has been centre-stage in academic and policy debates.
Perhaps the most important conclusion from the work to date is that most of the decline in
productivity is within sector and within firm. These trends cannot be accounted for by sector-

October 28, 2014
[THE UK'S PRODUCTIVITY PUZZLE - BRYSON AND FORTH DRAFT
PLEASE DO NOT CITE]
25
specific shocks and credit constraints. It is against this backdrop that we turn to a micro-
analysis of workplace-level behaviour between 2004 and 2011 to gain insights into the
processes that may have contributed to this aggregate picture.
3. NEW EVIDENCE ON THE UK'S PRODUCTIVITY PUZZLE: A WORKPLACE
PERSPECTIVE
In this section we use the Workplace Employment Relations Survey (WERS) to test some -
but by no means all - of the hypotheses that might shed light on trends in labour productivity.
Our focus is on the private sector where the puzzle is most apparent. The unit of analysis is
British workplaces. The survey is nationally representative of workplaces with 5 or more
employees across most sectors of the economy but we focus solely on private sector
workplaces. Box 1 contains details of the survey. The analyses undertaken in this section
focus on the two cross-sections of workplaces in 2004 and 2011 (plus some analysis of the
1998 cross-section) and the panel of workplaces surveyed in 2004-2011 which permit
investigations of within-workplace change, something that is particularly useful since
estimates of productivity decline from both the Bank of England (2013, see Figure 5 earlier)
and Riley et al. (2014b) suggest this was primarily a within-firm, rather than between-firm
phenomenon.

October 28, 2014
[THE UK'S PRODUCTIVITY PUZZLE - BRYSON AND FORTH DRAFT
PLEASE DO NOT CITE]
26
Box 1: The Workplace Employment Relations Survey
3.1: The 'cleansing' hypothesis
If, as suggested in Section Two, the 'cleansing' effect of the recession was muted, we might
expect workplace performance prior to recession to have a muted impact on workplace
survival subsequently. In fact, this proves not to be the case. Although the rate of workplace
closure between 2004 and 2011 did not differ relative to the rate in the previous survey for the
period 1998-2004, workplaces' financial performance in 2004 were predictive of whether they
had closed by 2011 (Table 2).

October 28, 2014
[THE UK'S PRODUCTIVITY PUZZLE - BRYSON AND FORTH DRAFT
PLEASE DO NOT CITE]
27
Table 2: Rates of workplace closure 2004-2011 by relative financial performance in 2004
Financial Performance
relative to industry average
in 2004:
Raw: Controls:
Closure
rate
Marginal Effect Closure
rate
Marginal effect
Below .29 - .25 -
Average .17 -.12 .17 -.09
Better .20 -.10 .21 -.04
A lot better .08 -.21 .08 -.17 Notes: Managers are asked: "Compared with other workplaces in the same industry how would you assess your
workplace's financial performance...a lot better than average, better than average, about average, below average,
a lot below average". We combine the last two categories. Marginal effects are estimated relative to base case of
"below average" performance. Underlined marginal effects are statistically significant at a 95% confidence level.
Models based on 1,527 observations (1,525 with controls). Controls are: single digit industry; region; single-
establishment firm; establishment size; workplace age; largest occupational group.
Source: Workplace Employment Relations Survey
Nineteen percent of workplaces in 2004 had closed by 2011, but the rate was 29% among
those whose financial performance in 2004 was "below" the industry average compared with
8% among those with financial performance "a lot better" than the industry average. This 21
percentage point difference is statistically significant. It falls to a 17 percentage point
differential when controlling for other factors, but remains statistically significant. In
contrast, financial performance in 1998 was not significantly associated with closure by 2004,
a period when economic conditions were relatively benign. These results are consistent with
recession having a "cleansing" effect by "killing" the poorest performers. However, poor
labour productivity relative to the industry average in 2004 did not influence closure

October 28, 2014
[THE UK'S PRODUCTIVITY PUZZLE - BRYSON AND FORTH DRAFT
PLEASE DO NOT CITE]
28
probabilities by 2011 suggesting that, if recession did have a "cleansing" effect in the private
sector it operated by reducing the survival probabilities of less profitable establishments,
rather than those of the less productive establishments.
3.2: Incentives to Innovate
If the opportunity costs of production encourage workplaces to innovate when faced with
recession-induced shocks to demand we should see a positive correlation between innovation
and the size of the demand shock experienced by workplaces. However, this prediction is
predicated on the assumption that the demand shock is temporary, not permanent. If, in fact,
there continues to be uncertainty facing employers, they may choose to delay innovations
until they sense an upturn.
In both 2004 and 2011 the Workplace Employment Relations Survey asked HR Managers:
"Over the last two years has management here introduced any of the changes listed on this
card?....introduction of performance related pay; introduction or upgrading of new technology
(including computers)14
; changes in working time arrangements; changes in the organization
of work; changes in work techniques or procedures; introduction of initiatives to involve
employees; introduction of technologically new or significantly improved product or service;
none of these". In general, the incidence of innovation in the two years prior to 2011 has not
14
This 2011 item combines new technology and computers whereas they were contained in separate items in 2004.
October 28, 2014
[THE UK'S PRODUCTIVITY PUZZLE - BRYSON AND FORTH DRAFT
PLEASE DO NOT CITE]
29
changed significantly relative to the two years prior to 2004, although the percentage of
workplaces reporting changes to work organization rose significantly from 32% to 37%.
Evidence on the incidence of innovation does not provide direct evidence regarding the role
of recession in workplace innovation, nor its links to workplace performance. To investigate
this we examined whether there was any correlation between the amount and type of
innovation undertaken at the workplace and the degree to which HR managers thought their
workplace had "been adversely affected by the recent recession" (where responses were coded
"no adverse effect; just a little; a moderate amount; quite a lot; a great deal"). The impact of
recession, which approximates the "shock" workplaces received as a result of the recession15
,
was not associated with the degree to which workplaces innovated in the two years prior to
the 2011 survey, the only exception being a reduced likelihood of introducing performance
pay.
Product market conditions did, nevertheless, affect the rate of workplace innovation. The
number of innovations undertaken in the two years prior to 2011 were negatively associated
with HR managers saying the market for their main product or service was "declining" or
"turbulent", consistent with the conjecture that uncertainty regarding future demand inhibits
innovation. The size of these effects is substantial. The mean number of innovations
15
How adversely workplaces were affected by recession was hard to predict using workplace characteristics in 2004, confirming that it came as a "shock" (Van Wanrooy et al., 2013: 16-18).

October 28, 2014
[THE UK'S PRODUCTIVITY PUZZLE - BRYSON AND FORTH DRAFT
PLEASE DO NOT CITE]
30
undertaken out of a total of up to seven was 2.2. Ceteris paribus, compared to being in a
"growing" market, being in a "declining" market reduced the number of innovations by 0.5 of
an innovation while being in a turbulent market reduced the number by 0.3 of an innovation -
reductions of 23% and 14% respectively.16
Workplaces benefitted from the number of workplace innovations they undertook, both in
terms of workplace performance and in terms of their ability to come out stronger from the
recession. HR managers were asked to rate their own workplace relative to the industry
average on three dimensions: financial performance; labour productivity; and the quality of
product or service. Responses are coded on a 5-point scale from "a lot better than average" to
"a lot below average". The number of innovations workplaces put in place was statistically
significantly associated with higher labour productivity relative to the industry average, and to
higher quality of output relative to the industry average, but not with financial performance.
These results are robust to the inclusion of control variables, including the impact of the
recession. The implication is that more innovative workplaces had higher productivity, both
in terms of the quantity and quality of output, but that those innovations were costly to make,
thus making no significant difference to short-term profitability. Nevertheless, the number of
innovations undertaken was significantly associated with a lower likelihood of agreeing to the
16
In addition to the variables capturing the impact of recession, the location of the market and the state of the product/service market, these models contain the following controls: establishment size, single-establishment firm, single-digit industry, region, workplace age, union recognition, largest non-managerial occupational group, number of competitors, perception of high market competition, perception of high degree of overseas competition.

October 28, 2014
[THE UK'S PRODUCTIVITY PUZZLE - BRYSON AND FORTH DRAFT
PLEASE DO NOT CITE]
31
statement: "This workplace is now weaker as a result of its experience during the recent
recession". This association is robust to controlling for other variables, including the extent to
which the workplace had been adversely affected by the recession. The addition of one
innovation reduced the probability of agreeing the workplace was weaker as a result of the
recession by 3%.
3.3: Labour hoarding
Between 2004 and 2011 the mean number of employees in private sector workplaces that had
survived over the period rose from 38 to 47. If one expresses this growth as a percentage
relative to the average level of employment across the two years this is a growth rate of 11
percentage points, so a little over 1 percentage point per annum. However this average growth
rate hides huge heterogeneity across workplaces, as indicated in Figure 7.
If we simply characterise workplaces according to the change in their employment level
between 2004 and 2011 we can identify three types of workplace: those who experienced a
fall in employment of over 20 percent ("shrinkers"); those experiencing growth in
employment of 20% or more ("growers") and those in between ("no change"). One-fifth
(21%) shrank; two-fifths (41%) grew; and the remaining two-fifths (39%) experienced no
change (Table 3).

October 28, 2014
[THE UK'S PRODUCTIVITY PUZZLE - BRYSON AND FORTH DRAFT
PLEASE DO NOT CITE]
32
Figure 7: Employment Growth, 2004-2011, private sector panel
Note: employment growth calculated as difference in employment levels expressed as a percentage of the
average employment level in 2004 and 2011
Source: Workplace Employment Relations Survey
For workplaces with at least 10 employees we can compare workplace growth and shrinkage
in 2004-2011 with rates of employment change in 1998-2004. The patterns are remarkably
similar with a quarter of workplaces shrinking, a third growing and two-fifths remaining
broadly similar in size (rows 2 and 3 in Table 3). Measuring employment change as the
difference in levels expressed as a percentage of average employment size in the two periods
0
.005
.01
.015
De
nsity
-200 -100 0 100 200emp change as % av emp in 04 and 11

October 28, 2014
[THE UK'S PRODUCTIVITY PUZZLE - BRYSON AND FORTH DRAFT
PLEASE DO NOT CITE]
33
indicates employment grew by 6.2 percentage points between 1998 and 2004 and 5.7
percentage points between 2004 and 2011. On the face of it, this evidence appears consistent
with a labour hoarding story, in the sense that employment growth patterns appear unaffected
by the onset of recession in 2008.
Table 3: Employment Change as a Percentage of Base Year Employment Level, Private
Sector Panel
Shrunk by at
least 20%
No Change Grew by at least
20%
2004-11, at least 5 employees: 21 39 41
2004-11, at least 10 employees: 25 40 34
1998-2004, at least 10
employees:
24 42 34
Notes: (1) row percentages (2) Row 1 N=1,370; Row 2 N=1172; Row 3 N=591
Source: Workplace Employment Relations Survey
However, there is clear evidence that the impact of the recession did dramatically affect
employment growth in workplaces. The degree to which HR managers said their workplace
had "been adversely affected by the recent recession" was strongly negatively associated with
employment growth (Table 4). Whereas 60% of workplaces who had been unaffected by the
recession reported growth of at least 20%, this was only the case for one-third (33%) of those
who said they had been adversely affected "a great deal". Conversely, only 7% of those
unaffected had shrunk by at least 20% compared with 30% of those affected "a great deal".
Put another way, those unaffected by recession only accounted for 3% of shrinkers, but 11%

October 28, 2014
[THE UK'S PRODUCTIVITY PUZZLE - BRYSON AND FORTH DRAFT
PLEASE DO NOT CITE]
34
of growers, whereas the figures for those affected "a great deal" were 29% and 16%
respectively.
Being adversely affected by the recession was still negatively correlated with the rate of
employment change among private sector panel workplaces when controlling for observable
differences between workplaces measured back in 2004. Indeed, in these models - which
accounted for up to 17 percent of the variance in employment growth between 2004 and 2011
- the size of the recession effect did not alter significantly with the addition of workplace
controls.17
Table 4: Employment Change and Impact of Recession, 2004-2011 Column percentages
Recession
Impact:
Shrunk by at
least 20%
No Change Grew by at least
20%
None 6.9 33.1 60.1
A little 10.3 38.5 51.2
Moderate 16.8 46.8 36.5
Quite a Lot 25.7 34.9 39.4
A great deal 29.7 37.7 32.6
All 20.4 39.0 40.7 Notes: (1) Row percentages (2) Private sector panel, all with 5+ employees (3) N=1,366 (4) Recession impact
are responses to the question "Looking at this card, can you tell me to what extent your workplace has been
adversely affected by the recent recession?"
Source: Workplace Employment Relations Survey
17
These 2004 controls were: being a single-site firm; industry; region; workplace age; union recognition; largest occupational group; and employment size. Other variables performed as expected: for instance, employment levels in 2004 were negatively correlated with growth, as one would expect given regression to the mean.
October 28, 2014
[THE UK'S PRODUCTIVITY PUZZLE - BRYSON AND FORTH DRAFT
PLEASE DO NOT CITE]
35
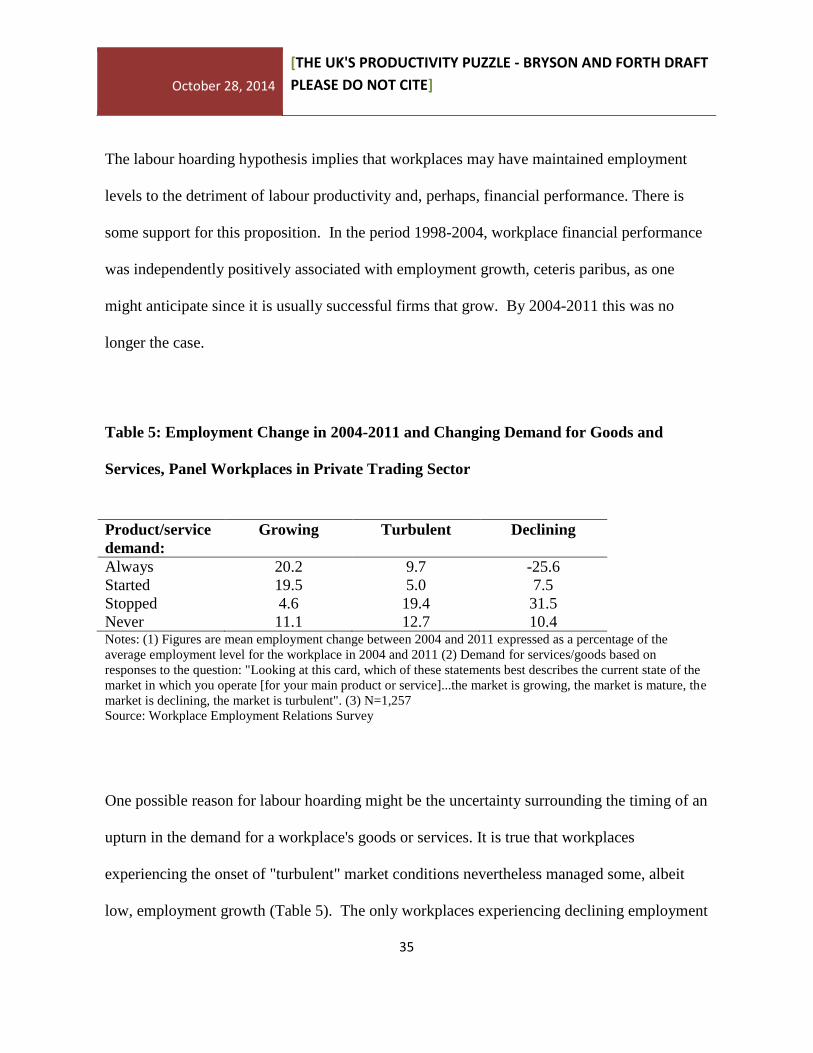
The labour hoarding hypothesis implies that workplaces may have maintained employment
levels to the detriment of labour productivity and, perhaps, financial performance. There is
some support for this proposition. In the period 1998-2004, workplace financial performance
was independently positively associated with employment growth, ceteris paribus, as one
might anticipate since it is usually successful firms that grow. By 2004-2011 this was no
longer the case.
Table 5: Employment Change in 2004-2011 and Changing Demand for Goods and
Services, Panel Workplaces in Private Trading Sector
Product/service
demand:
Growing Turbulent Declining
Always 20.2 9.7 -25.6
Started 19.5 5.0 7.5
Stopped 4.6 19.4 31.5
Never 11.1 12.7 10.4 Notes: (1) Figures are mean employment change between 2004 and 2011 expressed as a percentage of the
average employment level for the workplace in 2004 and 2011 (2) Demand for services/goods based on
responses to the question: "Looking at this card, which of these statements best describes the current state of the
market in which you operate [for your main product or service]...the market is growing, the market is mature, the
market is declining, the market is turbulent". (3) N=1,257
Source: Workplace Employment Relations Survey
One possible reason for labour hoarding might be the uncertainty surrounding the timing of an
upturn in the demand for a workplace's goods or services. It is true that workplaces
experiencing the onset of "turbulent" market conditions nevertheless managed some, albeit
low, employment growth (Table 5). The only workplaces experiencing declining employment

October 28, 2014
[THE UK'S PRODUCTIVITY PUZZLE - BRYSON AND FORTH DRAFT
PLEASE DO NOT CITE]
36
were those whose market had been in decline in both 2004 and 2011 (Table 5). These effects
were robust to controlling for observable differences across workplaces, including the extent
to which the HR Manager said the workplace had been adversely affected by recession. If the
onset of market turbulence is an indicator of greater uncertainty, there is no clear evidence
here that it was linked to labour hoarding.
Skilled employees constituted a growing percentage of all private sector employees between
2004 and 2011. Among private sector workplaces present in both 2004 and 2011, the
percentage of skilled employees - defined as those in the top three occupational
classifications, namely managers, professionals and associate professionals and technical
employees - rose five percentage points, from 26% to 31%. However, what is striking is that
this growth was negatively correlated with workplace employment growth. In workplaces
that had shrunk by at least 20%, the increase in the percentage of employees who were skilled
was 9 percentage points, whereas it was only 2 percentage points in workplaces that had
grown by at least 20%. The negative correlation between workplace employment growth and
skilled employment was robust to controlling for workplace characteristics.18
This is
suggestive evidence that workplaces faced with shrinking workforces may have been
hoarding skilled labour. However, there was no association between changes in the
18
A 1 percentage point decline in employment was associated with a statistically significant 0.7 percentage point increase in the percentage of skilled employees in models containing the same controls as indicated in footnote 15.
October 28, 2014
[THE UK'S PRODUCTIVITY PUZZLE - BRYSON AND FORTH DRAFT
PLEASE DO NOT CITE]
37
percentage of skilled employees and how adversely workplaces were affected by the
recession, nor product market conditions.
If "hoarded" skilled labour was generating intangible capital then one might anticipate a link
between a growth in the percentage of skilled employees and a workplace's ability to
innovate. However, there was no association between growth in skilled employment and
workplace innovation using the measures of innovation introduced in Section 3.2.
Intuitively, if labour hoarding has been taking place, one might also expect an increase in job
tenure. There has been a statistically significant increase in employees' workplace tenure since
2004. In private sector panel workplaces mean workplace tenure was under two years in one-
third (33%) of workplaces in 2004, falling to just over one-quarter (27%) in 2011. The
percentage with an average of at least 5 years' tenure rose from 35% to 52%.
This section adds to the macro-level data on employment by using workplace-level data to
show that employment levels within British private sector workplaces held up over the course
of the recession, perhaps to a surprising degree given the recessionary shock. It is true that
the impact of recession and the disruption to product markets clearly had a significant impact
on employment, but there was no extensive shake-out of jobs in British workplaces and the
positive link between financial performance and employment growth evident in the late 1990s

October 28, 2014
[THE UK'S PRODUCTIVITY PUZZLE - BRYSON AND FORTH DRAFT
PLEASE DO NOT CITE]
38
and early 2000s disappeared in the period 2004-11. Furthermore, the percentage of
employees in skilled occupations rose, especially in those workplaces whose total
employment shrank. Together, these findings offer some, albeit limited, evidence in favour of
the labour hoarding hypothesis.
3.4: A slowdown in HRM investments?
One area that has not been discussed a great deal in the broader literature on the productivity
puzzle is that of HRM investments, that is, the human resource practices that managers may
implement in pursuit of higher productivity. If the recession had reduced the rate at which
HRM investments were made - for example, by lowering the rate of return on such
investments - this might have contributed to a slow-down in productivity growth.
The broad literature on HR practices and workplace performance (e.g. Huselid, 1995; Bloom
and Van Reenen, 2010a) tends to focus on three sets of practices which are expected to have
positive implications for productivity: first, work organisation practices which give workers a
greater level of autonomy, aid collaboration and raise their skills; second, performance or
quality management practices which seek to more closely manage workers’ effort and output;
and third, incentive pay schemes which seek to motivate workers through financial incentives.
October 28, 2014
[THE UK'S PRODUCTIVITY PUZZLE - BRYSON AND FORTH DRAFT
PLEASE DO NOT CITE]
39
It is apparent from existing work (e.g. Wood and Bryson, 2009) that some of the practices
cited above, such as team-working and the use of quality targets, became more prevalent in
Britain over the period 1998-2004, when the economy was growing strongly. Here we
investigate whether the rate of growth of these practices might have slowed since the mid-
2000s, or whether the returns to such HR practices might have diminished, in such a way as to
have contributed to the general slowdown in productivity growth.
Alongside the three sets of practices considered above, we also look at arrangements for
employee voice. Collective employee representation through trade unions was known to be
negatively associated with workplace performance in Britain in the 1980s and 1990s, but
unionisation is known to have weakened in recent decades, whilst arrangements for direct
communication between managers and employees have grown in popularity (Blanchflower
and Bryson, 2009).
Our analysis again calls on the Workplace Employment Relations Survey, but this time
employs data from the cross-section surveys of 1998, 2004 and 2011. We use data on private
sector workplaces with 10 or more employees and, first, chart the incidence of the HR
practices discussed above over the course of the three surveys. We then examine the
associations between these HR practices and a subjective measure of workplace productivity
in each year, as a rough indication of whether there may have been changes in returns.

October 28, 2014
[THE UK'S PRODUCTIVITY PUZZLE - BRYSON AND FORTH DRAFT
PLEASE DO NOT CITE]
40
Table 6: Share of employment in private sector workplaces with specific HR practices,
1998-2011
1998 2004 2011 2004 v
1998
2011 v
2004
2011 v
1998
% % % Signif. Signif. Signif.
Semi-autonomous team-working+ 44 35 48 *** ***
Functional flexibility+ 79 78 82 **
Training for 80%+ experienced
employees+
21 41 49 *** *** ***
Problem-solving groups 49 34 30 *** * ***
Quality targets 55 58 63
Appraisals for 80%+ non-managerial
employees
53 69 78 *** *** ***
Profit-related pay 53 44 43 *** ***
Share-ownership scheme 32 33 28 **
Voice:
Representative + Direct 26 31 33 ** ***
Representative only 43 28 24 *** * ***
Direct only 11 21 23 *** ***
Neither 20 20 19
Base: employment in private sector workplaces with 10+ employees
Notes: + for the largest occupational group
Key: *** = sig. at 1 per cent; ** sig. at 5 per cent; * sig. at 10 per cent
Source: Workplace Employment Relations Survey
Table 6 shows the percentage of employees who work in establishments where the specified
practices operate.19
Considering first those practices relating to work organisation and skills,
we see increases in the use of team working, in the use of functional flexibility and in the
intensity of training between 2004 and 2011. The rise in team working reversed an earlier
19
We prefer this employment share to the share of workplaces with a practice, since larger workplaces contribute disproportionately to aggregate levels of productivity.

October 28, 2014
[THE UK'S PRODUCTIVITY PUZZLE - BRYSON AND FORTH DRAFT
PLEASE DO NOT CITE]
41
decline seen between 1998 and 2004, whilst the increased intensity of training represented the
continuation of a prior trend.
Turning to quality and performance-management practices, we see a decline in the use of
problem-solving groups and a rise in the use of performance appraisals but, again, neither
change was unique to the period 2004-2011. On incentive pay, we see a small decline in the
prevalence of share ownership schemes, and in respect of voice, we see the continuation of a
shift away from sole reliance on representative arrangements and towards the use of direct
forms of communication, either alone or in combination with forms of employee
representation.
On the whole, these patterns indicate a progressive shift away from formal, collective
approaches to the management of employees and employee performance (i.e. problem-solving
groups, group-based incentive pay and engagement with unions) towards a more
individualistic focus that encompasses up-skilling and the direct management of quality and
performance. However, there appears to be no obvious change in trajectory between 1998-
2004 and 2004-2011. These patterns do not therefore suggest that that the recent period of
recession in Britain was characterised by any particular slow-down in the diffusion of
‘productivity-enhancing’ HR practices.

October 28, 2014
[THE UK'S PRODUCTIVITY PUZZLE - BRYSON AND FORTH DRAFT
PLEASE DO NOT CITE]
42
The evidence of any changes in returns is also weak, insofar as we can gauge with our data.
WERS only provides accounting data on performance for a small subset of workplaces and so
we must rely on the subjective rating given by the workplace manager. They are asked to rate
the level of labour productivity at their workplace relative to the average for their industry and
answer on a five-point scale from ‘A lot above average’ to ‘A lot below average’. We can
then investigate whether specific practices are associated with levels of productivity in a given
year and whether these ‘returns’ appear to change over time. If the returns diminish, this
might suggest that increased diffusion of the practice is making a smaller contribution to
productivity growth going forward. One must, however, accept that there are considerable
caveats, given the cross-sectional nature of the data and the subjective nature of the
performance rating.
The results of this analysis are presented in Tables 7 and 8. In the first of these tables, the
individual practices shown in Table 6 are included together in an ordered-probit regression of
the workplace’s subjective productivity rating. Once we control for a set of observable
workplace characteristics, including the size of the workplace, its industry sector and its
location, we see no consistent pattern of changing returns. The most notable patterns are a
reduction between 2004 and 2011 in the productivity advantage conferred by functional
flexibility, and a reduction between 1998 and 2004 in the productivity disadvantage

October 28, 2014
[THE UK'S PRODUCTIVITY PUZZLE - BRYSON AND FORTH DRAFT
PLEASE DO NOT CITE]
43
associated with reliance on representative voice.20
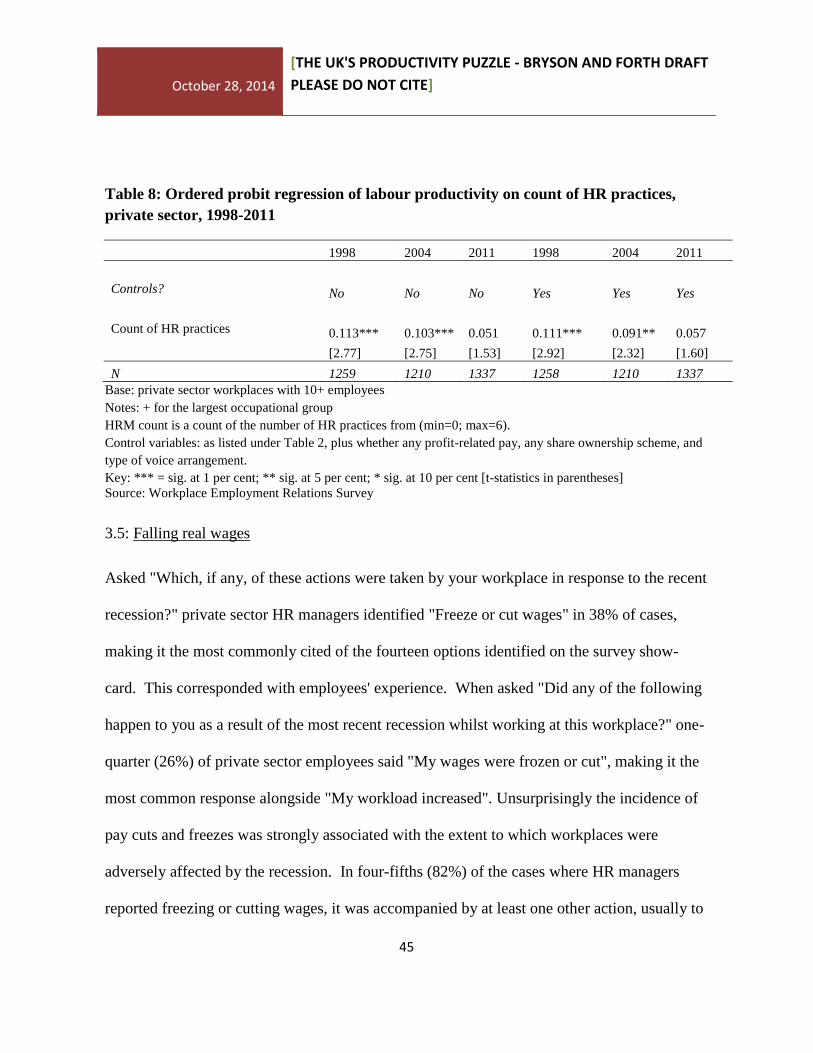
Table 8 replaces the first six practices with
a count variable, since key parts of the HR literature argue for the importance of bundles of
practices (e.g. MacDuffie, 1995). The mean value of this count variable rises from 3.03 in
1998 to 3.11 in 2004 and 3.46 in 2011, with the increase between 2004 and 2011 being
statistically significant at the 1 per cent level. In the regressions it appears that the coefficient
on the count variable declines between 2004 and 2011, but statistical tests cannot reject the
null hypothesis that the coefficients are the same in both years.
Taken together, these results do not indicate any particularly notable break in the diffusion or
impact of HR practices in Britain during the recent recession. The overriding impression is,
instead, of a continuation of earlier trends towards greater up-skilling and more systematic
monitoring and assessment of quality and performance.
20
This accords with the more general picture of a diminution of ‘negative’ union effects set out by Blanchflower and Bryson (2009).

October 28, 2014
[THE UK'S PRODUCTIVITY PUZZLE - BRYSON AND FORTH DRAFT
PLEASE DO NOT CITE]
44
Table 7: Ordered probit regression of labour productivity on specific HR practices,
private sector, 1998-2011
1998 2004 2011 1998 2004 2011
Controls? No No No Yes Yes Yes
Semi-autonomous team-working+ 0.162 0.045 0.048 0.097 -0.022 0.062
[1.26] [0.44] [0.50] [0.80] [-0.21] [0.63]
Functional flexibility+ 0.303** 0.278** 0.010 0.393*** 0.264** 0.055
[2.16] [2.51] [0.10] [2.94] [2.46] [0.53]
Training for 80%+ experienced
employees+ -0.067 0.027 -0.059 -0.073 0.006 -0.112
[-0.49] [0.25] [-0.63] [-0.51] [0.05] [-1.15]
Problem-solving groups 0.071 0.129 -0.049 0.045 0.119 0.011
[0.61] [1.06] [-0.39] [0.41] [0.96] [0.08]
Quality targets 0.065 -0.072 0.196** 0.138 -0.052 0.157
[0.58] [-0.65] [2.04] [1.18] [-0.46] [1.65]
Appraisals for 80%+ non-managerial
employees 0.096 0.218* 0.122 0.024 0.253** 0.157
[0.76] [1.93] [1.17] [0.19] [2.04] [1.40]
Profit-related pay 0.011 0.181* 0.098 0.184 0.216** 0.067
[0.08] [1.71] [0.99] [1.36] [2.08] [0.66]
Share-ownership scheme 0.163 -0.213* 0.050 0.213 -0.211 0.075
[1.18] [-1.73] [0.41] [1.59] [-1.62] [0.60]
Voice (ref = None):
Representative + Direct -0.111 0.062 0.191 -0.159 0.237 0.160
[-0.67] [0.39] [1.39] [-0.98] [1.51] [1.05]
Representative only -0.399*** -0.053 0.021 -0.436*** 0.249 -0.001
[-2.75] [-0.34] [0.13] [-2.95] [1.54] [-0.01]
Direct only 0.084 0.194 0.153 0.050 0.081 0.133
[0.43] [1.43] [1.27] [0.26] [0.59] [1.08]
N 1259 1210 1337 1258 1210 1337
Base: private sector workplaces with 10+ employees
Notes: + for the largest occupational group
Control variables: workplace size; industry sector; region; largest occupational group; whether part of multi-site
organisation; number of competitors in main market; degree of competition in that market; whether market
local/regional/national/international; whether market growing/mature/ declining/ turbulent.
Key: *** = sig. at 1 per cent; ** sig. at 5 per cent; * sig. at 10 per cent [t-statistics in parentheses]
Source: Workplace Employment Relations Survey
October 28, 2014
[THE UK'S PRODUCTIVITY PUZZLE - BRYSON AND FORTH DRAFT
PLEASE DO NOT CITE]
45
Table 8: Ordered probit regression of labour productivity on count of HR practices,
private sector, 1998-2011
1998 2004 2011 1998 2004 2011
Controls? No No No Yes Yes Yes
Count of HR practices 0.113*** 0.103*** 0.051 0.111*** 0.091** 0.057
[2.77] [2.75] [1.53] [2.92] [2.32] [1.60]
N 1259 1210 1337 1258 1210 1337
Base: private sector workplaces with 10+ employees
Notes: + for the largest occupational group
HRM count is a count of the number of HR practices from (min=0; max=6).
Control variables: as listed under Table 2, plus whether any profit-related pay, any share ownership scheme, and
type of voice arrangement.
Key: *** = sig. at 1 per cent; ** sig. at 5 per cent; * sig. at 10 per cent [t-statistics in parentheses]
Source: Workplace Employment Relations Survey
3.5: Falling real wages
Asked "Which, if any, of these actions were taken by your workplace in response to the recent
recession?" private sector HR managers identified "Freeze or cut wages" in 38% of cases,
making it the most commonly cited of the fourteen options identified on the survey show-
card. This corresponded with employees' experience. When asked "Did any of the following
happen to you as a result of the most recent recession whilst working at this workplace?" one-
quarter (26%) of private sector employees said "My wages were frozen or cut", making it the
most common response alongside "My workload increased". Unsurprisingly the incidence of
pay cuts and freezes was strongly associated with the extent to which workplaces were
adversely affected by the recession. In four-fifths (82%) of the cases where HR managers
reported freezing or cutting wages, it was accompanied by at least one other action, usually to

October 28, 2014
[THE UK'S PRODUCTIVITY PUZZLE - BRYSON AND FORTH DRAFT
PLEASE DO NOT CITE]
46
cut costs. For example, over one-third (36%) of those freezing or cutting wages had also
instituted a freeze of filling vacant posts, 28% had reduced paid overtime, 28% had
"postponed plans to expand", 27% had made "changes in the organisation of work", and 22%
had made compulsory redundancies.
Further insights can be gleaned regarding pay setting during the recession in relation to the
last pay settlement for the largest non-managerial occupation at the workplace. The
percentage of settlements resulting in a pay freeze or cut doubled between 2004 and 2011
from 12% to 26%. Again, the influence of recession was in clear evidence: whereas only 15%
of workplaces who reported no adverse effect of the recession had instituted a pay freeze or
cut in the last pay settlement for the largest non-managerial occupation, this rose to 36%
where the HR manager said the workplace had been affected "a great deal".
As noted earlier, the decline in real wages in Britain since the onset of recession is almost
unprecedented in a period of low inflation, raising questions as to how management has been
able to make such sizeable wage adjustments. One common hypothesis is that the reduced
incidence of collective bargaining and a loss of union bargaining power has limited unions'
ability to block pressures for wage reductions. The incidence of workplace trade unions and
membership density changed little between 2004 and 2011, although there was a reduction in
the scope of collective bargaining in the private sector which may be indicative of unions'
reduced ability to maintain influence over a wide bargaining agenda (van Wanrooy et al.,
October 28, 2014
[THE UK'S PRODUCTIVITY PUZZLE - BRYSON AND FORTH DRAFT
PLEASE DO NOT CITE]
47
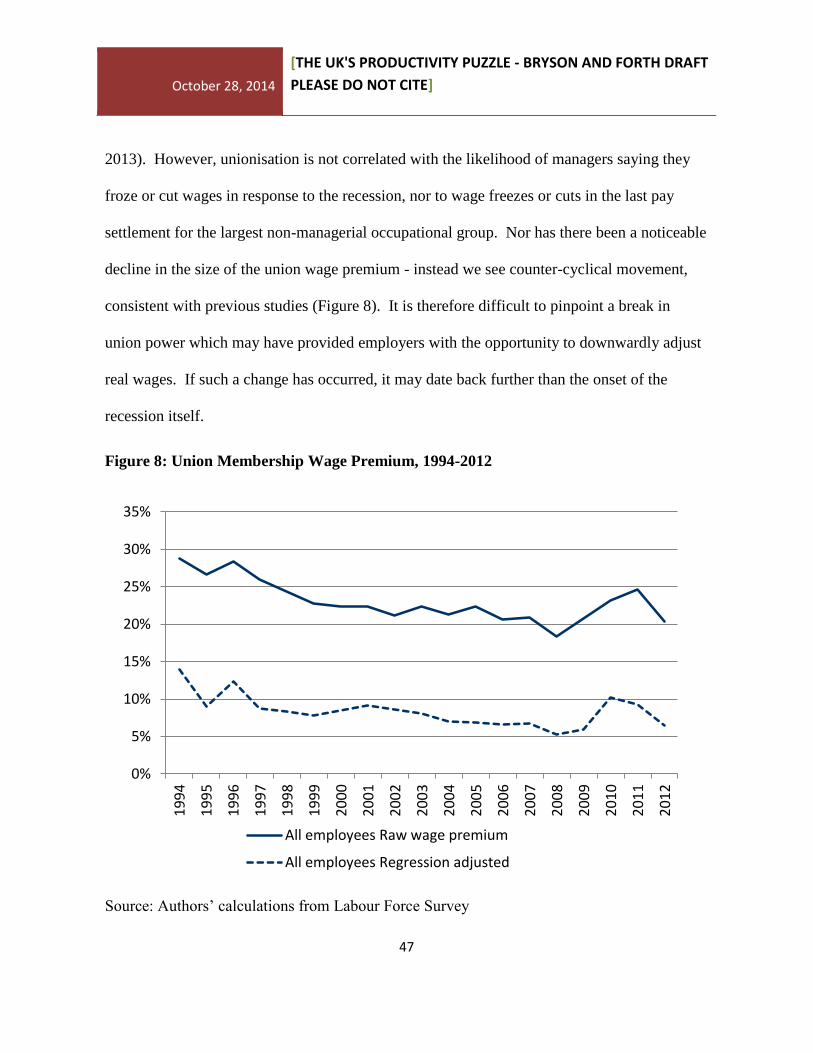
2013). However, unionisation is not correlated with the likelihood of managers saying they
froze or cut wages in response to the recession, nor to wage freezes or cuts in the last pay
settlement for the largest non-managerial occupational group. Nor has there been a noticeable
decline in the size of the union wage premium - instead we see counter-cyclical movement,
consistent with previous studies (Figure 8). It is therefore difficult to pinpoint a break in
union power which may have provided employers with the opportunity to downwardly adjust
real wages. If such a change has occurred, it may date back further than the onset of the
recession itself.
Figure 8: Union Membership Wage Premium, 1994-2012
Source: Authors’ calculations from Labour Force Survey
0%
5%
10%
15%
20%
25%
30%
35%
19
94
19
95
19
96
19
97
19
98
19
99
20
00
20
01
20
02
20
03
20
04
20
05
20
06
20
07
20
08
20
09
20
10
20
11
20
12
All employees Raw wage premium
All employees Regression adjusted

October 28, 2014
[THE UK'S PRODUCTIVITY PUZZLE - BRYSON AND FORTH DRAFT
PLEASE DO NOT CITE]
48
There are two other changes which analysts point to as potential reasons for the weakness of
real wage growth since the recession: welfare reform and immigration. Welfare reform in the
UK has been extensive in recent years and has focused on increasing labour market
participation of the inactive and unemployed (OECD, 2013a: 67-77). It can affect employer
wage setting and job seeker behaviour in a variety of ways that can limit real wage growth.
For instance, unemployed job seekers may be prepared to accept job offers at lower rates of
pay than might have been the case in the absence of reform. We are able to identify those
workplaces most likely to draw applicants from welfare benefit recipients, and thus those
most likely to be affected by welfare reform, through two data items in WERS, namely
whether the workplace used the public job placement service to fill vacancies for the largest
non-managerial occupation at the workplace in the last twelve months, and whether they
workplace had special procedures to encourage job applications from those who had been
unemployed for at least twelve months. Neither were associated with pay freezes or cuts in
the last pay settlement for the workplace's largest non-managerial occupational group, nor
were they associated with freezes or cuts in wages, or the reduction of non-wage benefits, in
response to the recession. Thus, to the extent that welfare reform might be expected to impact
most on employers engaging with the public job placement service and drawing from the
unemployed for recruits, there was no discernible direct effect of welfare reform on these
aspects of wage setting. Of course, it is quite possible that the reforms have had other direct
effects on wage setting, and that they have had broader, less direct effects on the operation of
the labour market in general.

October 28, 2014
[THE UK'S PRODUCTIVITY PUZZLE - BRYSON AND FORTH DRAFT
PLEASE DO NOT CITE]
49
Although the UK has experienced a very substantial inflow of migrants in the last few years -
a labour supply shock that could, in principle, slow the rate of real wage growth - the
empirical evidence on the link between immigration and wages is heavily contested (see Ruhs
and Vargas-Silva, 2014). In 2011, for the first time WERS collected information on the
number of non-UK nationals employed at the workplace, distinguishing between those from
the European Economic Area (the EEA21
) and those outside. Private sector workplaces
employed a mean of 7.6% non-UK nationals in 2011, of whom 3.0% were non-EEA
nationals. Although the percentage of non-UK nationals employed at the workplace had no
bearing on wage freezes or cuts that were directly attributed to the recession, and no effect on
cuts to non-wage benefits in response to the recession, the probability of a pay freeze or cut
for the largest non-managerial occupational group in the last pay settlement rose with the
proportion of non-EEA nationals employed. One-quarter (26%) of private sector workplaces
had instituted a pay freeze or cut for the largest non-managerial group of employees in the last
pay settlement. An increase in 1 percentage point in the number of non-EEA nationals
employed at a workplace raised the probability of a wage freeze or cut by roughly 0.4 of a
percentage point.22
The proportion of EEA nationals was not statistically significant. One
potential explanation for this finding is that a workplace's ability to employ non-EEA
21
The European Union, Iceland, Liechtenstein, Norway and Switzerland. 22
The coefficient on the proportion of non-EEA nationals was -.52 in the absence of controls (t-stat of 3.95), falling to -.38 (t=2.23) with controls for number of employees, single establishment organization, industry, region, union, and largest occupational group.

October 28, 2014
[THE UK'S PRODUCTIVITY PUZZLE - BRYSON AND FORTH DRAFT
PLEASE DO NOT CITE]
50
nationals reduces the bargaining power of employees at that workplace, thus limiting their
ability to resist wage freezes or cuts.
Table 9: Influences on the Most Recent Pay Settlement for the Largest Non-Managerial
Occupation
2004 2011
All Freeze/cut Increase All Freeze/cut Increase
Financial
Performance
30 36 29 36 44 34
Productivity levels 21 23 21 19 18 19
Changes in Cost of
Living
24 11 26 21 17 22
Recruitment and
Retention
21 16 21 13 11 14
Industrial Action <1 <1 <1 <1 <1 <1
None of these 4 14 3 12 11 12
N workplaces 1750 182 1587 1756 379 1346 Notes: (1) Responses to question: "Looking at this card, which of the factors listed influenced the size of the pay
settlement or review for [largest occupational group]?" (2) Figures are column percentages based on N
responses, so adding to 100.
Source: Workplace Employment Relations Survey
If wages have fallen in response to changes in productivity levels we might expect to see
"Productivity levels within the organisation or workplace" featuring prominently as an
influence on the last pay settlement for the largest non-managerial occupation in the
workplace. Table 9 compares the influences on pay settlements in 2011 with those in 2004
for all settlements and those that resulted in a freeze or cut versus a pay increase. The most
commonly cited influence is "The financial performance of the workplace or organisation": it

October 28, 2014
[THE UK'S PRODUCTIVITY PUZZLE - BRYSON AND FORTH DRAFT
PLEASE DO NOT CITE]
51
accounted for over one-third (36%) of responses in 2011, up from 30% in 2004, and was
particularly salient in settlements leading to a freeze or cut. "Rises in the cost of living" was
the second most commonly cited factor, and was more salient in cases where the settlement
led to a pay rise. "Industrial Action threatened or taken" rarely featured in employers'
considerations at all, perhaps indicating the limitations of unions' influence over pay awards.
Productivity levels accounted for around one-fifth of responses, but they were no more
heavily cited in 2011 than they were in 2004, nor did they feature more in cases where there
was a pay freeze or cut. There is therefore little to indicate that productivity had become a
more common consideration in wage setting as a result of the recession.23
3.6: Working harder or not so hard?
There are two competing hypotheses regarding the potential effect of the recession on
individuals' labour productivity. The first is that the combination of lower product and service
demand with labour hoarding has created "slack" such that employees are not required to
work as hard or as "smart" as they were previously. Declining real wages may have
contributed to this trend since employees may lack the incentive to put in additional effort.
The alternative hypothesis is that recession has placed additional pressures on employees to
23
These figures are based on the subset of coded responses available in 2004 and 2011. In 2011 a more extended set of options was provided including reference to the national minimum wage for example. Productivity levels accounted for 16% of this more extended set of influences in 2011, a figure that didn't differ according to whether the settlement resulted in a pay increase or not. Financial performance was mentioned almost twice as many times (31%).

October 28, 2014
[THE UK'S PRODUCTIVITY PUZZLE - BRYSON AND FORTH DRAFT
PLEASE DO NOT CITE]
52
increase their efforts, either directly following the loss of co-workers, or indirectly through the
threat of dismissal or replacement by job-seekers.
Although we lack direct measures of individual productivity employees are asked how
strongly they agree with the statement "My job requires that i work very hard". The
percentage of employees who "strongly agree" with this statement increased significantly
from 25% in 2004 to 32% in 2011. This difference remains statistically significant and
actually grows in size when controlling for observable differences in employees'
demographic, job and workplace characteristics. How hard people thought they were required
to work was not associated with how adversely the workplace had been affected by the
recession. Instead it was positively associated with HR Managers' perceptions of the degree of
market competition the workplace currently faced. Furthermore, it was positively associated
with the number of changes employees said had been made to their jobs as a result of the
recession.24
Further investigation revealed this association was driven by those who said "My
workload increased", a response given by one-quarter (26%) of private sector employees. The
evidence is therefore supportive of the proposition that employees were working harder than
prior to the recession, partly as a result of changes made by management in response to
recession, but also due to highly competitive market conditions. However, there is little
evidence that management were able to translate that hard work into a more productive
workplace since how hard employees said their jobs required them to work was not
24
Those who had been in the same workplace during the recession were asked "Did any of the following happen to you as a result of the most recent recession?" and were offered nine responses.

October 28, 2014
[THE UK'S PRODUCTIVITY PUZZLE - BRYSON AND FORTH DRAFT
PLEASE DO NOT CITE]
53
significantly correlated with HR Managers' perceptions of the workplace's productivity
relative to the industry average.25
3.7: The UK's "flexible labour market"
The UK is often characterised as an economy with a very flexible labour force relative to
many of its EU counterparts for two reasons. First, it is fairly lightly regulated such that
employers face relatively low dismissal costs and face minimal constraints in terms of the
sorts of labour contracts they can utilise (OECD Employment Outlook, 2013b). The second
aspect, touched upon already, is the low incidence and relative weakness of trade unions. For
many years it has been argued that unions face declining bargaining power and, as such, a
reduced ability to influence both wage setting (see above) and restrictions on work practices
and labour supply. Employers in Britain may avail themselves of this labour market flexibility
when setting wages, as discussed above, but they may also take advantage of it in configuring
their workforce.
WERS asks HR managers what types of workers they use, either under contract, or directly as
employees, to undertake the workplace's business. These include shift-working, fixed-term
and temporary contracts, freelancers, agency workers, home-workers, zero hours contracts
25
Analyses of the panel of private sector workplaces revealed that, although there was a positive correlation between the mean workplace score for how hard employees worked and the workplace's labour productivity and financial performance, this association disappeared having accounted for fixed workplace unobservable characteristics (both in workplace fixed effects and first difference models) - so there was no association between change in employees working hard and improvement in workplace performance.
October 28, 2014
[THE UK'S PRODUCTIVITY PUZZLE - BRYSON AND FORTH DRAFT
PLEASE DO NOT CITE]
54
and annual hours contracts, as well as part-time workers. The latter are very commonly used
in Britain: they can be found in three-quarters of private sector workplaces. Such contracts
offer employers numerical flexibility which can be useful when seeking to adjust the amount
of labour they need in response to changes in demand such as the onset of recession.
Workplaces were more likely to resort to numerical flexibility via these contracts in 2011 than
they were in 2004: excluding the use of part-time workers (who were present in 76% of
private sector workplaces in 2004 and 77% in 2011), half (50%) of workplaces had used at
least one form of flexible contract in 2004, but this had risen to two-thirds (65%) by 2011
(van Wanrooy et al., 2013: 40). There were no striking increases in the use of a particular
type of contract, with the exception of shift-working which was used in 24% of private sector
workplaces in 2004 and 32% in 2011. Instead, usage increased marginally across a range of
contract types. The percentage using two or more such contracts rose from 43% to 57%.
However, the use of numerical flexibility was not associated with HR managers' perceptions
of how adversely their workplace had been affected by the recession. Instead, if one
considers the actions employers said they took in response to the recession they tended to
involve cost cutting, for example through compulsory redundancies, and work reorganisation
(van Wanrooy et al., 2013: 19), consistent with the managerial prerogatives that characterise
Britain's "right-to-manage" model of employment relations. Managers were actually more
likely to say they had cut the number of agency or temporary staff in response to recession,

October 28, 2014
[THE UK'S PRODUCTIVITY PUZZLE - BRYSON AND FORTH DRAFT
PLEASE DO NOT CITE]
55
rather than increase them (13% reduced them compared to 3% who increased them), perhaps
as a further cost-cutting exercise, in the knowledge that core employees could be relied upon
to offer numerical flexibility through reduced paid overtime (19% of workplaces), and even
reduced basic hours (15% of workplaces).
To see if workplaces appeared to benefit from greater use of numerical flexibility we sought
to identify whether there was any correlation between the use of numerical flexibility, its
strength emerging from the recession, and its performance in 2011. Conditioning on how
adversely the workplace had been affected by recession, plus other standard controls (size,
single workplace organisation, age, industry, region, unionised, and largest non-managerial
occupational group), there was no association between the intensity with which numerical
flexibility was used (as measured by the number of types of flexible contract worker used)
and how strongly the HR manager agreed with the statement "This workplace is now weaker
as a result of its experience during the recent recession". Replacing this count variable with
the variables identifying the type of numerical flexibility used, two practices - shift-working
and the use of fixed term contracts - were actually associated with a greater likelihood of
emerging weaker from recession. Similarly, conditioning on the same set of controls, the
number of numerical flexibility practices was not associated with labour productivity or
financial performance in 2011. Two practices - fixed term contracts and annualised hours
contracts - were significantly associated with lower labour productivity than the industry
average.

October 28, 2014
[THE UK'S PRODUCTIVITY PUZZLE - BRYSON AND FORTH DRAFT
PLEASE DO NOT CITE]
56
Analyses of the panel of private sector workplaces indicates that workplaces that increased
their use of numerical flexibility between 2004 and 2011 experienced a deterioration in
workplace performance, as captured by an additive scale combining scores for financial
performance, labour productivity and quality of output. This effect was statistically
significant and apparent in both first difference and workplace fixed effects estimates which
account for unobserved fixed differences across workplaces. The workplace fixed effects
estimates also revealed a negative correlation between changes in labour productivity relative
to the industry average and increased use of numerical flexibility. Of course it is not possible
to infer causality from such estimates. It is possible, for instance, that it is those workplaces
whose performance is deteriorating who resort to more numerical flexibility practices.
Nevertheless, these results provide robust evidence that the numerical flexibility employers
can use as a result of Britain's flexible labour market model was not beneficial in terms of
workplaces' performance and productivity.
A priori it is perhaps unclear what impact unionisation may have had on workplace
productivity. On the one hand, if unions have limited bargaining strength, not only is the
upward pressure on wages likely to diminished as discussed earlier, but employers are at
liberty to pursue profit maximisation without regard to their employees' collective voice. This
may be advantageous to firms if managers have the information and capability to follow the
right course of action. It may not be so beneficial to firms if, as some argue, managers benefit

October 28, 2014
[THE UK'S PRODUCTIVITY PUZZLE - BRYSON AND FORTH DRAFT
PLEASE DO NOT CITE]
57
from effective worker voice - as, for example, in the case of firms adopting a "mutual gains"
approach whereby firms seek to maximise profits via worker involvement, subject to workers
benefiting through an increased share of those profits (Kochan, 1994).
Neither the presence of a union recognised for pay bargaining nor union density are
significantly associated with workplace performance in 2011, whether performance is
measured in terms of the additive performance scale, financial performance or labour
productivity. However, analyses of the panel reveal that workplaces that experienced an
increase in union density between 2004 and 2011 also improved their performance relative to
the industry average, both on the additive scale and in terms of labour productivity. Similarly,
in some estimates workplaces that became unionised experienced improved workplace
performance, though this finding is less robust. This is limited evidence in favour of the
proposition that unionisation may be beneficial to workplaces seeking to improve their
performance after the recession, perhaps because unions may have adopted a "mutual gains"
stance. It runs counter to the proposition that firms benefit from a highly deregulated and
non-unionised environment.
3.8 Summary
The picture regarding the genesis and explanations for the productivity puzzle derived from
micro-analyses of the Workplace Employment Relations Surveys is one of complexity and

October 28, 2014
[THE UK'S PRODUCTIVITY PUZZLE - BRYSON AND FORTH DRAFT
PLEASE DO NOT CITE]
58
heterogeneity. We find clear evidence of labour intensification but employers appeared
incapable of turning this effort into improved workplace level productivity. There is
substantial evidence of widespread pay freezes and cuts which help explain the substantial
decline in real wage growth since the on-set of recession. Pay freezes and cuts were often
initiated by workplace managers in direct response to the recession. It remains unclear why
such wage adjustments were possible in this recession when they have been largely absent in
earlier recessions, but it is possible that employers faced "softer" constraints emanating from
union power and the need to maintain wage levels to recruit and retain staff. Immigration
may have played a role: downward wage adjustments were more likely in workplaces using
non-UK nationals from outside Europe. Workplace closure rates were little different to those
experienced in more benign conditions prior to the recession, but there is some evidence of a
"cleansing" effect with poorer performing workplaces being more likely to close.
Employment growth rates vary greatly across workplaces but, on average, they have held up
well during recession. However, this observation overlooks the impact the recession had in
workplace shrinkage, especially in the face of declining and turbulent demand for goods and
services. There is some evidence of labour "hoarding", especially hoarding of high skilled
labour: this has had no discernible impact on the rate of innovation. There appeared to be little
change in the overall rate of workplace innovation but, again, declining or turbulent demand
for goods and services limited the degree of innovation in processes and products. There was
no discernible impact of recession on either the number of HRM practices workplaces
invested in, nor their returns on those investments. There is no evidence that workplaces have

October 28, 2014
[THE UK'S PRODUCTIVITY PUZZLE - BRYSON AND FORTH DRAFT
PLEASE DO NOT CITE]
59
benefitted from Britain's "flexible" labour market as indicated by using recruitment channels
used by welfare recipients or the use of numerically flexible workers. On the contrary, in
workplaces with increasing unionisation appeared to benefit in terms of improved workplace
performance.
4. THE FUTURE
The old orthodoxy that recessions tend to have short-term impacts on output has recently been
challenged. Instead, a consensus has emerged that "hysterisis" - a long-term effect of
recession on output due to reduced capital accumulation, scarring effects on workers through
job loss, and disruptions to economic processes underlying technological progress - is likely.
In his analysis of 23 OECD countries Ball (2014) finds the Great Recession has had a large
impact on countries' productive capacity (as measured by estimates of potential output) and
that the growth rate of potential output is well below what it was before 2008 meaning "the
level of potential output is likely to fall even farther below its pre-crisis trend in the years to
come" (Ball, 2014: 2).
Preoccupied with which policy levers to pull and when, economists at the Bank of England
and elsewhere have been trying to grapple with the evidence to date on the sources of the
UK's productivity puzzle so as to distinguish cyclical from more persistent economic
difficulties. In the most recent review Barnett et al. (2014b) emphasise the continued

October 28, 2014
[THE UK'S PRODUCTIVITY PUZZLE - BRYSON AND FORTH DRAFT
PLEASE DO NOT CITE]
60
weakness of growth in the UK's labour productivity, suggesting that strength in labour hiring
and "modest pickup in productivity growth suggest that spare capacity within firms is unlikely
to explain much of the current weakness". Instead, they emphasise the potential for the
financial crisis to have a persistent effect on productivity levels. Their estimate is that these
more persistent factors, such as reduced investment in physical and intangible capital,
together with impaired resource allocation, may account for between 6 and 9 percentage
points of the 16 percentage point shortfall in labour productivity relative to the pre-crisis
trend. At the same time they recognise that "there remains considerable uncertainty around
any interpretation of the puzzle".
In his analysis of OECD countries Ball (2014: Table 1) suggests the rate of growth in the
UK's productive capacity is two-thirds of its pre-recession rate, a recessionary "hit" similar in
magnitude to that experienced by France, much smaller than the impact on Spain, and much
larger than the impact on Germany.
At the time of writing the UK's labour market was hotting up. Unemployment has been
falling quite quickly and some real wage growth has returned. Some fear wage "catch up" as
workers seek to make up for the lost wages incurred since the recession hit. But this scenario
assumes a degree of worker bargaining power that is not in evidence. As noted earlier, union
reach continues to decline, albeit slowly, and some parts of its traditional power base - notably
public sector - face the biggest challenges. There is evidence that a wedge is opening up
October 28, 2014
[THE UK'S PRODUCTIVITY PUZZLE - BRYSON AND FORTH DRAFT
PLEASE DO NOT CITE]
61
between productivity growth and wage growth, especially among lower paid workers,
consistent with low and/or diminishing bargaining power. High labour market participation
rates may help account for such trends since unemployed labour may more easily substitute
for existing labour. As Gregg et al. (2014b) note wage growth is unlikely without productivity
growth and, they maintain, with real wages remaining low, firms' incentives for capital
investment remain muted. There is thus a 'vicious circle' in which poor productivity begets
low wage growth and vice versa. (The public sector may be an exception: here government
intervention in wage setting and employment levels will continue, potentially driving
productivity growth).
But perhaps the "acid test" of the recession's impact on the UK's longer-term productivity
performance is what has happened to TFP. Here the jury is still out. Pessoa and Van Reenen
(2013) argue that there has been no structural break in TFP. They suggest that there has been
a small drop in TFP after the crisis due to under-utilisation of factors in the recession and
uncertainty-driven misallocation, suggesting longer-term effects should be limited. Others are
less sanguine. Barnett et al. (2014) argue that "the change in the capital to labour ratio since
the crisis can only account for a small part of the shortfall in productivity relative to its pre-
crisis trend. Therefore, it is likely that much of the fall in measured labour productivity is
accounted for by a fall in TFP...We make the inference that the loss in labour productivity
identified...will largely reflect a loss in measured aggregate TFP due to the misallocation of
capital across sectors". They suggest the process of capital reallocation since 2008 has been
October 28, 2014
[THE UK'S PRODUCTIVITY PUZZLE - BRYSON AND FORTH DRAFT
PLEASE DO NOT CITE]
62
"unusually slow...relative to previous UK recessions and other banking crises" (p. R35),
consistent with the possibility that efficient resource allocation may impair the UK's longer-
term growth prospects.
In the longer run the UK's productivity trends are likely to reflect the long-tail of poorly
performing firms that the UK has been noted for over many years. Some of this is due to
structural factors such as the role of family owned firms, and "poor management" more
generally in Britain (Bloom and Van Reenen, 2010b). Furthermore Britain continues to be
characterised by laissez-faire economics and politics in the Thatcher mould such that it
eschews state intervention and shies away from industrial strategy and protects managers'
right-to-manage, even when those managers appear poorly equipped for the job.
However, there are some areas where optimism is merited. A number of reforms have been
undertaken since the 1980s which have provided a foundation for a continuation in the long-
term productivity catch up the UK began relative to its competitors in the 1980s. These
reforms include the expansion of higher education, reforms to welfare systems and labour
law, and deregulation of capital flows (Aghion et al., 2013). The UK has invested very
heavily in human capital via growth in participation in higher education. The question is: can
UK benefit from the investments in the UK educational system? Second, reforms in other
areas such as the welfare system and labour law, provide for a flexible labour market capable
of absorbing future shocks, while the deregulation of capital flows and a relatively liberal

October 28, 2014
[THE UK'S PRODUCTIVITY PUZZLE - BRYSON AND FORTH DRAFT
PLEASE DO NOT CITE]
63
immigration policy ensure the free flow of capital and labour. London is a global centre, one
of only a few truly international 'hub' cities benefiting from agglomoration and networking. It
continues to thrive and prosper, offering safe haven for international capital, migrant labour
flows and talented entrepreneurs.
Acknowledgements We acknowledge the Department of Business, Skills and Innovation, the Economic and Social
Research Council, the Advisory, Conciliation and Arbitration Service and the National
Institute of Economic and Social Research as the originators of the 2011 Workplace
Employee Relations Survey data, and the Data Archive at the University of Essex as the
distributor of the data. We thank Rebecca Riley for comments on an earlier draft.

October 28, 2014
[THE UK'S PRODUCTIVITY PUZZLE - BRYSON AND FORTH DRAFT
PLEASE DO NOT CITE]
64
REFERENCES
Aghion, P., Besley, T., Browne, J., Caselli, F., Lambert, R., Lomax, R., Stern, N. and Van
Reenen, J. (2013) Investing for Prosperity: Report of the LSE Growth Commission,
London: LSE
Arrowsmith, M., Franklin, J., Gregory, D., Griffiths, M., Wohlmann, E. and Young, G. (2013)
"SME forbearance and its implications for monetary and fiscal stability", Bank of
England Quarterly Bulletin, 53, 4: 296-303
Ashworth, J, Goodhart, C. Secker, G, Stannard, I and Baker, M (2013), ‘Productivity
slowdown largely cyclical: good news for the medium-term outlook’, Morgan Stanley
research, 15 July 2013
Ball, L. M. (2014) "Long-term Damage From the Great Recession in OECD Countries",
NBER Working Paper No. 20185
Barnett, A., Broadbent, B., Chiu, A., Franklin, J. and Miller, H. (2014a) "Impaired Capital
Reallocation and Productivity", National Institute Economic Review, 228: R35-R48
Barnett, A., Batten, S., Chiu, A., Franklin, J. and Sebastia-Barriel, M. (2014b) "The UK
Productivity Puzzle", Bank of England Quarterly Bulletin, Q2
Barnett, A, Chiu, A, Franklin, J and Sebastia-Barriel, M (2014c), ‘The productivity puzzle: a
firm-level investigation into employment behaviour and resource allocation over the
crisis’, Bank of England Working Paper forthcoming.

October 28, 2014
[THE UK'S PRODUCTIVITY PUZZLE - BRYSON AND FORTH DRAFT
PLEASE DO NOT CITE]
65
Bell, D. and Blanchflower, D. G. (2014) “Quarter 3 2013 Underemployment”, Blog post at:
http://bellblanchflowerunderemployment.com/, 10th
February 2014.
Bell, B. and Van Reenen, J. (2010) "Bankers' Pay and Extreme Wage Inequality in the UK",
Centre for Economic Performance Special Paper No. 21
Blanchflower D. and Bryson, A. (2009) “Trade union decline and the economics of the
workplace”, pp.48-73 in W Brown, A Bryson, J Forth and K Whitfield (eds) The
Evolution of the Modern Workplace, Cambridge University Press.
Bloom, N. (2009) "The Impact of Uncertainty Shocks", Econometrica, 77: 623-685
Bloom N. and Van Reenen J. (2010a) "Human Resource Management and Productivity" in D.
Card and O. Ashenfelter (eds) Handbook of Labour Economics, vol. 4, chap 19,
Elsevier.
Bloom, N. and Van Reenen, J. (2010b) "Why Do Management Practices Differ across Firms
and Countries?", Journal of Economic Perspectives, 24, 1: 203-224
Bloom, N., Bond, S. and Van Reenen, J. (2007) "Uncertainty and Company Investment
Dynamics: Empirical Evidence from UK firms", Review of Economic Studies, 74: 391-
415
Broadbent, B. (2012) "Productivity and the allocation of resources", Speech, Durham
Business School
Corry, D., Valero, A. and Van Reenen, J. (2012) "UK Economic Performance Under Labour",
Renewal, 20, 1: 56-69

October 28, 2014
[THE UK'S PRODUCTIVITY PUZZLE - BRYSON AND FORTH DRAFT
PLEASE DO NOT CITE]
66
Eurostat (2014) Labour Costs in the EU 28
Field, S. and Franklin, M. (2014) "Multi-factor Productivity, Indicative Estimates to 2012",
ONS
Field, S. and Franklin, M. (2013) "Micro-data perspectives on the UK productivity
conundrum", ONS
Foster, L., Grim, C. and Haltiwanger, J. (2013) "Reallocation in the Great Recession:
Cleansing or Not?", US Census Bureau mimeo
Geroski, P. A. and Gregg, P. (1997) Coping with Recession: UK Company Performance in
Adversity, Cambridge: Cambridge University Press
Goodridge, P., Haskel, J. and Wallis, G. (2013) "Can intangible investment explain the UK
Productivity Puzzle?", National Institute Economic Review, 224: R48-R58
Gregg, P., Machin, S. and Fernandez-Salgado, M. (2014a) "Real Wages and Unemployment
in the Big Squeeze", The Economic Journal, 124, 576: 408-432
Gregg, P., Machin, S. and Fernandez-Salgado, M. (2014b) "The Squeeze on Real Wages -
And What It Might Take to End It", National Institute Economic Review, 228: R3-R16
Grice J (2012) “The productivity conundrum: interpreting the recent behaviour of the
economy”, London: Office for National Statistics.
Huselid, M (1995) “The impact of human resource management practices on turnover,
productivity and corporate performance”, Academy of Management Journal, 38, 3: 635-
72.

October 28, 2014
[THE UK'S PRODUCTIVITY PUZZLE - BRYSON AND FORTH DRAFT
PLEASE DO NOT CITE]
67
Kochan, T. A. (1994) The Mutual Gains Enterprise: Forging a Winning Partnership Among
Labor, Management and Government, Harvard Business School Press
Lane, P. R. (2012) "The European Sovereign Debt Crisis", Journal of Economic Perspectives,
26, 3: 49-68
Lazonick, W. (2014) "Profits without Prosperity", Harvard Business Review, September, pp.
47-55
MacDuffie J (1995) “Human resource bundles and manufacturing performance: flexible
production systems in the world auto industry”, Industrial and Labor Relations Review,
48, 2: 197-221.
Martin B and Rowthorn R (2012) Is the British Economy Supply Constrained II?A Renewed
Critique of Productivity Pessimism, Centre for Business Research, University of
Cambridge
NIESR (2014) "GDP Growth of 0.7 per cent in 2014 Q3", NIESR Press Release, 7th October
2014
OECD (2013a) "Labour market, welfare reform and inequality" in OECD Economic Surveys:
United Kingdom 2013, OECD Publishing
OECD (2013b) OECD Employment Outlook 2013, OECD Publishing
Office for National Statistics (2014) "International Comparisons of Productivity - First
Estimates, 2013", ONS Press Release 17 October 2014

October 28, 2014
[THE UK'S PRODUCTIVITY PUZZLE - BRYSON AND FORTH DRAFT
PLEASE DO NOT CITE]
68
Oulton, N. (2013) "Has the Growth of Real GDP in the UK been overstated because of Mis-
Measurement of Banking Output?", National Institute Economic Review, 224, May,
R59-R65
Pessoa, J. P. and Van Reenen, J. (2013) "The UK Productivity and Jobs Puzzle: Does the
Answer Lie in Labour Market Flexibility?", CEP Special Paper No. 31
Pope N (2013) “Public service productivity estimates: Total public services, 2010”, London:
Office for National Statistics.
Riley, R., Rosazza-Bondibene, C. and Young, G. (2014a) "The Financial Crisis, Bank
Lending and UK Productivity: Sectoral and Firm-level Evidence", National Institute
Economic Review No. 228: R17-R34
Riley, R., Rosazza-Bondibene, C. and Young, G. (2014b) "Productivity Dynamics in the
Great Stagnation: Evidence from British Businesses", CFM Discussion Paper No. 2014-
07
Ruhs, M. and Vargas-Silva, C. (2014) The Labour Market Effects of Immigration, Migration
Observatory Briefing, University of Oxford
van Wanrooy, B., Bewley, H., Bryson, A., Forth, J., Stokes, L. and Wood, S. (2013)
Employment Relations in the Shadow of Recession: Findings from the 2011 Workplace
Employment Relations Study, Palgrave MacMillan
Wadsworth, J. (2013)
Wales, P. and Taylor, C. (2014) ONS Economic Review, April 2014

October 28, 2014
[THE UK'S PRODUCTIVITY PUZZLE - BRYSON AND FORTH DRAFT
PLEASE DO NOT CITE]
69
Wood S. and Bryson A. (2009) “High involvement management”, pp.151-175 in W Brown, A
Bryson, J Forth and K Whitfield (eds) The Evolution of the Modern Workplace,
Cambridge University Press.

October 28, 2014
[THE UK'S PRODUCTIVITY PUZZLE - BRYSON AND FORTH DRAFT
PLEASE DO NOT CITE]
70
Appendix Table A1: OECD Standardised Business Confidence Indicator
Source: OECD. StatExtracts http://stats.oecd.org/index.aspx?queryid=299. Note: these series are standardised to
show deviations from within-country trends.
95
99
103
01/01/200601/04/200701/07/200801/10/200901/01/201101/04/201201/07/2013
France
Germany
Spain
UnitedKingdom
UnitedStates
Euro area(18countries)