Embed Size (px)
Citation preview

143
Chapter-VI
REVENUES OF THE SAMPLE GRAMA PANCHAYATS
6.1 Introduction:
This chapter is focused on the analysis of the different sources of revenue of
the GPs in the selected talukas of Koppal district. Based on the time series data
covering a period of 6 years i.e., from 2002-03 to 2007-08, the trends in the revenue
of the GPs is examined. Further, an analysis of the individual components of revenue
is made so as to understand the structure of revenue mobilisation. A complete
examination of the revenue sources of the GPs will provide an insight into its fiscal
strength. Analysis of the fiscal trends is necessary to evaluate the performance of the
GPs. An examination of the trends in the various sources of revenue will reveal the
strengths and weakness and will help to identify appropriate solutions.
Despite the availability of human resources such as elected representatives and
bureaucrats, many panchayats may not succeed for the simple reason that they may
not have adequate material resources. The major problem of panchayat finance is the
inadequate resources of GPs for an effective discharging of their functions. The
balance between obligations and resources is essential to ensure efficient working of
GPs. Inadequate resources are the main impediments in the way of the GPs to render
services efficiently and effectively. Lack of funds makes them unpopular. If the GPs
are to render services at reasonable standards, they should have enough resources.
Hence, like any other institution, panchayats also need sufficient financial resources.
Mobilisation of financial resources and ensuring that they are available continuously
without any break are very important components. Hence, the financial resource
mobilisation has received the foremost attention in the discussion that follows.
6.2 Revenue Powers of Panchayati Raj Institutions in Karnataka:
The Karnataka Panchayat Raj Act, 1993 specifies own revenue sources of the
three levels of Panchayats in the state. According to the Act, only GPs have the

144
powers to raise revenue from taxes and neither the TPs nor ZPs have independent tax
powers. The ZPs and TPs have to depend upon the transfers made from the central
and state governments. The own revenues of ZPs and TPs are minor; they consist of
fees charged by them, gifts and contributions received by them, rents charged on the
shops, establishments and buildings rented by them and sale proceeds of movable and
immovable properties owned by them. The ZPs too do not have significant own
sources of revenue. In the main, these consist of fees and penalties levied by ZPs, rent
from land and other properties let out by ZPs, interests and profits of ZPs, gifts and
contributions made to ZPs and revenue from sale proceeds of land and other
properties of ZPs.
Under clause 199 of the Karnataka Panchayat Raj Act, 1993, the GPs can levy
tax on land and buildings within the limits of their respective geographical area that
are not subject to agricultural assessment. This levy is subject to the exemptions and
maximum rate specified by the state government. In addition, GPs may also levy
water rate for the supply of water for drinking and other purposes. The Act also
specifies some other taxes to be levied subject to the exemptions and maximum rates
prescribed by the state government. These are: (i) tax on entertainment other than
cinematograph shows; (ii) taxes on vehicles other than motor vehicles; (iii) taxes on
advertisements and hoarding; (iv) pilgrim fees on persons attending jatras, festivals
etc., when GPs make arrangement for water supply, health and sanitation; (v) market
fee; (vi) fees on the registration of cattle brought for sale in the market (vii) fees on
buses and taxies and auto-stands provided the GP, and (viii) fee on grazing cattle in
the grazing lands.
The Act also provides that taxes, rates or fees payable by the owners of any
factory or Industry established in any panchayat area may be compounded into an
annual lump sum payment as agreed upon by the owner and the GP. If such an
agreement is not possible, the concerned ZP, after hearing both the GP and the owner
of the factory, may determine the lump sum payable and this will be binding on the

145
GP and the owner of the factory. Collection of taxes, fees or other revenues may be
done by the GP or any agency entrusted with the task by the GP. In addition to these,
the state government may levy a cess equivalent to the rate of land revenue on all
items of land revenue, and the proceeds will be passed on to the GPs in the respective
areas. Similarly, the state government may levy additional stamp duty imposed by the
Karnataka Stamp Act, 1957 on the transfer of immovable property at a rate not
exceeding 3 per cent on the market value of property, and in the case of lease, the
value of rent for 10 years. The proceeds of the additional stamp duty will be
transferred to the TPs based on the collections in their respective jurisdictions.
Apart from these, provisions for statutory and discretionary transfers and
borrowings have been provided. Another important provision made in almost all the
state PR Acts is constitution of a Finance Commission by the states once in five years
in conformity with Article 243-I of the Indian constitution.
6.3 Revenues of Grama Panchayats:
The GPs although autonomous in character but largely are subordinate to state
government, which create them. Their revenues are also limited to the sources
assigned to them under the state law. Their income is derived from taxation and
services, people inhabited within the limits of panchayats. The GPs levy taxes from
the residents within the area of panchayat. Direct taxation is common in Panchayat
fiscal administration. They also receive assistance in form of grants from state and
central governments for discharging their functions. The income or revenue2 of
Grama Panchayats can be classified in the following broad heads as depicted in the
figure-1.
2 For the sake of convenience, the words ‘income’ and ‘revenue’ are herein after referred
interchangeably.
146
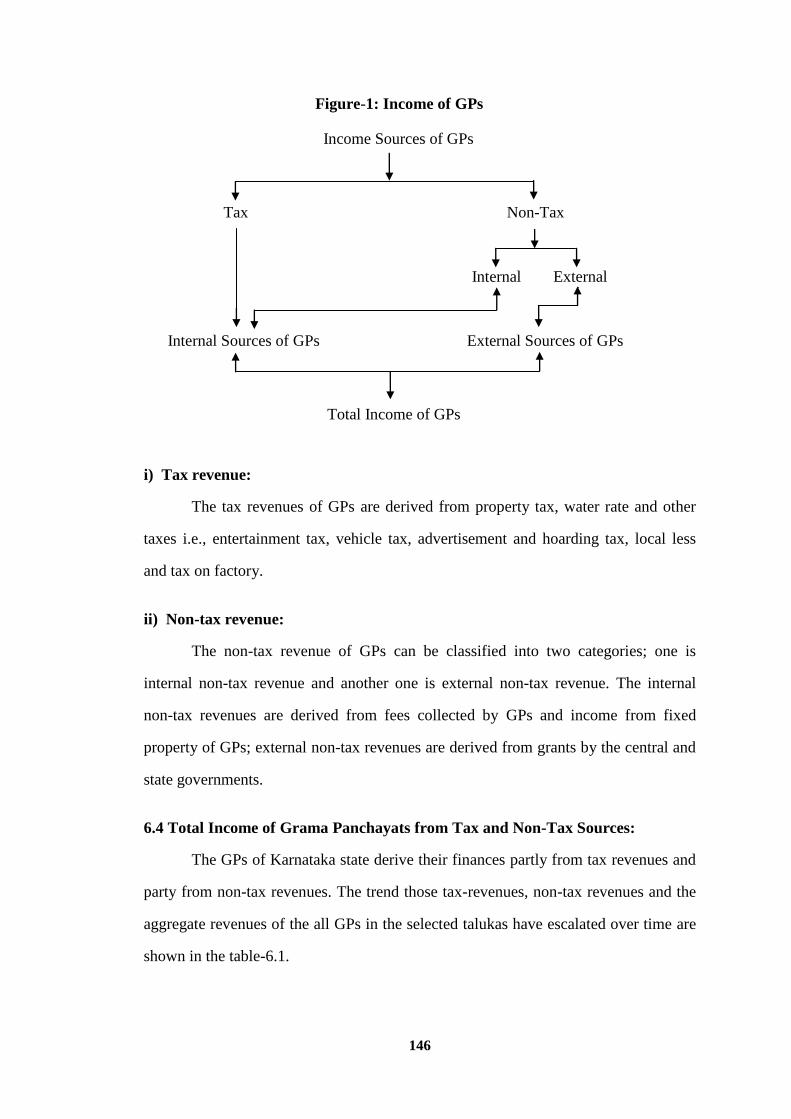
Figure-1: Income of GPs
Income Sources of GPs
Tax Non-Tax
Internal External
Internal Sources of GPs External Sources of GPs
Total Income of GPs
i) Tax revenue:
The tax revenues of GPs are derived from property tax, water rate and other
taxes i.e., entertainment tax, vehicle tax, advertisement and hoarding tax, local less
and tax on factory.
ii) Non-tax revenue:
The non-tax revenue of GPs can be classified into two categories; one is
internal non-tax revenue and another one is external non-tax revenue. The internal
non-tax revenues are derived from fees collected by GPs and income from fixed
property of GPs; external non-tax revenues are derived from grants by the central and
state governments.
6.4 Total Income of Grama Panchayats from Tax and Non-Tax Sources:
The GPs of Karnataka state derive their finances partly from tax revenues and
party from non-tax revenues. The trend those tax-revenues, non-tax revenues and the
aggregate revenues of the all GPs in the selected talukas have escalated over time are
shown in the table-6.1.

147
Table-6.1: Total Income of the GPs from Tax & Non-Taxes
(Rs. in Lakhs)
Year
GPs of Gangavathi Taluk GPs of Yelburga Taluk
Tax Non- Tax Total Percentage
Variation Tax Non-Tax Total
Percentage
Variation
2002-03 46.88 275.85 322.73 - 20.75 188.98 209.73 -
2003-04 71.35 189.32 260.67 -19.23 14.24 194.72 208.96 -0.37
2004-05 81.97 480.41 562.38 115.74 46.04 292.11 338.15 61.83
2005-06 86.47 549.24 635.71 13.04 50.34 573.32 623.66 84.43
2006-07 112.58 736.69 849.27 33.59 41.64 997.23 1038.87 66.58
2007-08 69.25 586.21 655.46 -22.82 59.52 1176.32 1235.84 18.96
Average 78.08 469.62 547.70 24.06 38.76 570.45 609.20 46.29
Source: 1. Office of the Local Audit Circle, Koppal.
2. Offices of the GPs in Gangavathi & Yelburga Talukas.
GPs of
Gangavathi Taluk
GPs of
Yelburga Taluk
A) Net increase in amount 588.60 1026.88
B) Net increase in percentage 225.80 491.42
C) Net increase in annual average percentage 37.63 81.90
D) Highest growth rate 115.74 84.43
E) Lowest growth rate -22.82 -0.37
The time series data relating to total income of the all GPs in the both talukas
for the six years period i.e., from 2002-03 to 2007-08 are presented in the table-6.1. It
indicates that the gross income of all 38 GPs in Gangavathi taluk increased from Rs.
322.73 lakhs to Rs. 849.27 lakhs except 2003-04 and 2007-08 in which years decline
trend is observed; it has thus risen by 225.80% during the study period. On the other
hand, the gross income of all 33 GPs in Yelburga taluk has increased from Rs. 209.73
lakhs to Rs. 1235.84 lakhs except 2003-04 in which year a small amount decline is
perceived; it has thus risen by 491.42%. Whopping of the non-tax income is the main
reason for increase in the aggregate income of the GPs.

148
The average amount of Rs. 609.20 lakhs of total receipts of the all GPs in
Yelburga taluk for the six years is greater than the average total receipts of Rs. 547.70
lakhs of the all GPs in Gangavathi taluk. Hence, average total receipts of (Rs. 609.20
lakhs ÷ 33 GPs) Rs. 18.46 lakhs of each GP in Yelburga taluk for the six years are
greater than that of (Rs. 547.70 lakhs ÷ 38 GPs) Rs. 14.41 lakhs of each GP in
Gangavathi taluk. The average annual growth rate of 46.29% of the GPs in Yelburga
taluk is better than that of 24.06% of the GPs in Gangavathi taluk. The erratic
variations are found in the growth rates of gross income. In terms of percentage, very
wide fluctuations can be easily observed pertaining to the growth rates of gross
income ranging from - 22.82% to 115.74% and from -0.37% to 84.43% in the GPs of
Gangavathi and Yelburga talukas respectively. As for the average amount and the
average annual growth rates of the total income, the GPs of Yelburga taluk displayed
the better performance than the GPs of Gangavathi taluk.
Graph-6.1
Total Income of the GPs from Tax & Non-Taxes (Rs. in Lakhs)
The graph-6.1 reveals that the minimum gross income of Rs. 260.67 lakhs in
2003-04 of the GPs in Gangavathi taluk is higher than the Rs. 188.98 lakhs in
0
100
200
300
400
500
600
700
800
900
1000
1100
1200
1300
2002-03 2003-04 2004-05 2005-06 2006-07 2007-08 Average
Rs.
in
Lak
hs
Year
GPs of Gangavathi Taluk GPs of Yelburga Taluk
Amount Amount
Average Line Average Line
149
2002-03 of the GPs in Yelburga taluk. The maximum gross income of Rs. 1235.84
lakhs in 2007-08 of the GPs in Yelburga taluk is higher than the Rs. 849.27 lakhs in
2006-07 of the GPs in Gangavathi taluk. The total receipts of the GPs in Gangavathi
taluk has crossed the average line for four years i.e., from 2004-05 to 2007-08; while
it has crossed the average line for three years i.e., from 2005-06 to 2007-08 in respect
of the GPs in Yelburga taluk.
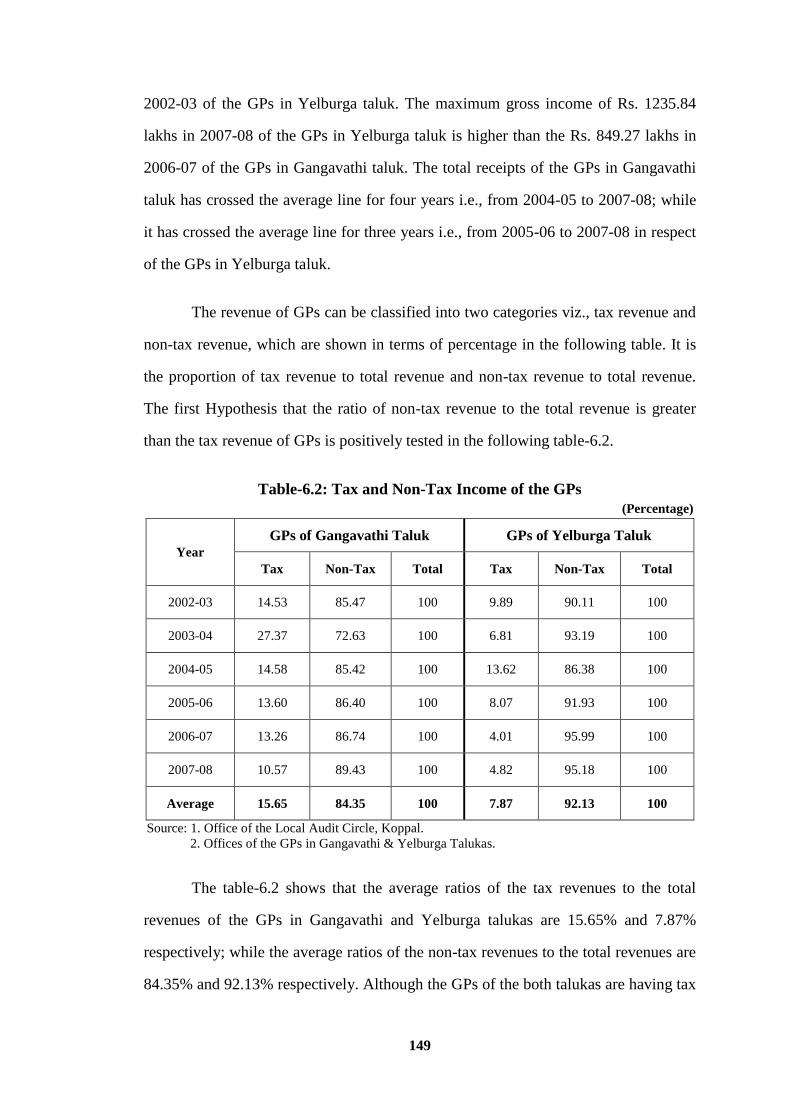
The revenue of GPs can be classified into two categories viz., tax revenue and
non-tax revenue, which are shown in terms of percentage in the following table. It is
the proportion of tax revenue to total revenue and non-tax revenue to total revenue.
The first Hypothesis that the ratio of non-tax revenue to the total revenue is greater
than the tax revenue of GPs is positively tested in the following table-6.2.
Table-6.2: Tax and Non-Tax Income of the GPs
(Percentage)
Year
GPs of Gangavathi Taluk GPs of Yelburga Taluk
Tax Non-Tax Total Tax Non-Tax Total
2002-03 14.53 85.47 100 9.89 90.11 100
2003-04 27.37 72.63 100 6.81 93.19 100
2004-05 14.58 85.42 100 13.62 86.38 100
2005-06 13.60 86.40 100 8.07 91.93 100
2006-07 13.26 86.74 100 4.01 95.99 100
2007-08 10.57 89.43 100 4.82 95.18 100
Average 15.65 84.35 100 7.87 92.13 100
Source: 1. Office of the Local Audit Circle, Koppal.
2. Offices of the GPs in Gangavathi & Yelburga Talukas.
The table-6.2 shows that the average ratios of the tax revenues to the total
revenues of the GPs in Gangavathi and Yelburga talukas are 15.65% and 7.87%
respectively; while the average ratios of the non-tax revenues to the total revenues are
84.35% and 92.13% respectively. Although the GPs of the both talukas are having tax

150
revenue much lesser than that of non-tax revenue, the tax revenue of the GPs in
Yelburga taluk is much lower than that of the GPs in Gangavathi taluk. The ratios of
tax revenue are not only low but also showed the declining trend for the several years
and vice versa in case of non-tax ratios. The share of tax revenue in the total revenue
of the GPs in the both talukas approximately stands at 16% and even less. The GPs
finance is mainly derived from non-tax revenue sources; the tax revenue sources did
not make any significant contribution during the study period. This is evident from the
graphs-6.2 and 6.3.
Graph-6.2
Tax Revenue of the GPs % to Total Income
The above graph-6.2 reveals the ratios of tax revenue to total revenue. The
ratio for only one year i.e., 2003-04 crossed the average line (15.65%) in the GPs of
Gangavathi taluk; while the ratios for three years i.e., 2002-03, 2004-05, and 2005-06
crossed the average line (7.87%) in the GPs of Yelburga taluk. The highest and lowest
ratios in the GPs of Gangavathi taluk are shown in 2003-04 and 2007-08 respectively.
In case of the GPs in Yelburga taluk the highest and lowest ratios are shown in
2004-05 and 2006-07 respectively. From the above graph, it is evident that the
0
2
4
6
8
10
12
14
16
18
20
22
24
26
28
30
2002-03 2003-04 2004-05 2005-06 2006-07 2007-08 Average
Per
cen
tage
GPs of Gangavathi Taluk GPs of Yelburga Taluk
Percentage Percentage
Average Line Average Line
Year

151
contribution of tax revenue to total revenue of the GPs in Gangavathi taluk is better
than the GPs in Yelburga taluk.
Graph-6.3
Non-Tax Revenue of the GPs % to Total Income
The graph-6.3 reveals the ratios of non-tax revenue to total revenue. The ratios
for five years except 2003-04 crossed the average line (84.35%) in the GPs of
Gangavathi taluk; while the ratios for three years i.e., 2003-04, 2006-07, and 2007-08
crossed the average line (92.13%) in the GPs of Yelburga taluk. The highest and
lowest ratios in the GPs of Gangavathi taluk are recorded in 2007-08 and 2003-04
respectively. In case of the GPs in Yelburga taluk the highest and lowest ratios are
recorded in 2006-07 and 2004-05. As revealed in the graph, though the contribution
of non-tax revenue to total revenue of the GPs in Yelburga taluk is higher than the
GPs in Gangavathi taluk, the ratios are significantly higher in the both cases. The
share of non-tax revenue in total revenue of the GPs in the both talukas roughly stands
at 84% and even more.
0
10
20
30
40
50
60
70
80
90
100
2002-03 2003-04 2004-05 2005-06 2006-07 2007-08 Average
Year
Per
cen
tag
e
GPs of Gangavathi Taluk GPs of Yelburga Taluk
Percentage Percentage
Average Line Average Line

152
6.5 Income of Grama Panchayats from Taxes:
1) According to section 199 of the Karnataka Panchayat Raj (KPR) Act, 1993, the
GPs can levy following taxes;
a) Property Tax on buildings and lands which are not subject to agricultural
assessment, within the limits of the panchayat area.
b) Tax on water (drinking water).
c) Tax on entertainment other than cinematography shows.
d) Tax on vehicles other than motor vehicles.
e) Tax on advertisement and hoarding.
2) Section 202 provides for levy of tax on factory / industry by the GP.
The revenue mobilisation from taxes by the all GPs in the both talukas is
presented in the following table-6.3.
Table-6.3: Income of the GPs from Taxes
(Rs. in Lakhs)
Yea
r
GPs of Gangavathi Taluk GPs of Yelburga Taluk
Pro
per
ty
Ta
x
Wa
ter
Ra
te
Oth
er
Ta
xes
To
tal
Ta
x
Rev
enu
e
Per
cen
tag
e
Va
ria
tio
n
Pro
per
ty
Ta
x
Wa
ter
Ra
te
Oth
er
Ta
xes
To
tal
Ta
x
Rev
enu
e
Per
cen
tag
e
Va
ria
tio
n
2002-03 33.13 6.30 7.45 46.88 - 10.39 7.94 2.42 20.75 -
2003-04 62.19 7.66 1.50 71.35 52.20 6.69 7.55 NA 14.24 -31.37
2004-05 68.75 13.22 NA 81.97 14.88 20.33 9.76 15.95 46.04 223.31
2005-06 76.86 8.95 0.66 86.47 5.49 41.15 3.03 6.18 50.34 9.34
2006-07 95.42 17.16 NA 112.58 30.20 28.61 13.03 NA 41.64 -17.28
2007-08 58.95 10.30 NA 69.25 -38.49 38.82 18.37 2.33 59.52 42.94
Average 65.88 10.60 1.60 78.08 12.86 24.33 9.95 4.48 38.76 37.82
Source: 1. Office of the Local Audit Circle, Koppal.
2. Offices of the GPs in Gangavathi & Yelburga Talukas.
Note: NA – Data Not Available.

153
GPs of
Gangavathi Taluk
GPs of
Yelburga Taluk
A) Net increase in amount 65.70 45.28
B) Net increase in percentage 140.15 317.98
C) Net increase in annual average percentage 23.36 52.99
D) Highest growth rate 52.20 223.31
E) Lowest growth rate -38.49 -31.37
The table-6.3 indicates that the gross tax income of the all 38 GPs in
Gangavathi taluk increased from Rs. 46.88 lakhs to 112.58 lakhs between 2002-03
and 2006-07, declined sharply to 69.25 lakhs in 2007-08; it has thus risen by 140.15%
during the study period. On the other side, the gross tax income of the all 33 GPs in
Yelburga taluk has increased from Rs. 20.75 lakhs to 50.34 lakhs between 2002-03
and 2005-06, deteriorated to Rs. 41.64 lakhs in 2006-07, again increased to Rs. 59.52
lakhs in 2007-08; it has thus risen by 317.98%.
The average amount of Rs. 78.08 lakhs of total tax income of the all GPs in
Gangavathi taluk is much greater than that of the average of Rs. 38.76 lakhs of the all
GPs in Yelburga taluk. Hence, average total tax receipt of (Rs. 78.08 lakhs ÷ 38 GPs)
Rs. 2.05 lakhs of each GP in Gangavathi taluk is greater than that of the average of
(Rs. 38.76 lakhs ÷ 33 GPs) Rs. 1.17 lakhs of each GP in Yelburga taluk. As for
generation of total tax income, the GPs in Gangavathi taluk showed the better
performance than the GPs in Yelburga taluk.
The graph-6.4 exhibits that the minimum gross tax income of Rs. 46.88 lakhs
in 2002-03 of the GPs in Gangavathi taluk is higher than that of the Rs. 14.24 lakhs in
2003-04 of the GPs in Yelburga taluk. The maximum gross tax income of Rs. 112.58
lakhs in 2006-07 of the GPs in Gangavathi taluk is higher than that of the Rs. 59.52
lakhs in 2007-08 of the GPs in Yelburga taluk. The gross tax income of the GPs in the
former taluk has crossed the average line (Rs. 78.08 lakhs) for three years i.e., from

154
2004-05 to 2006-07; while it has crossed the average line (Rs. 38.76 lakhs) for four
years i.e., from 2004-05 to 2007-08 in respect of the GPs in the latter taluk.
Graph-6.4: Income of the GPs from Taxes (Rs. in Lakhs)
6.6 Income of Grama Panchayats from Non-Taxes:
The non-tax revenue of GPs can be classified in two categories, viz., internal
non-tax revenue and external non-tax revenue. The total of internal and external non-
tax revenues are equal to the total non-tax revenue which is symbolically represented
as follows;
Total Internal Total External Total
Non -Tax Revenue Non-Tax Revenue Non-Tax Revenue
The internal non-tax revenues are derived from own accounts and the external
non-tax revenues are derived from other than own accounts of GPs.
6.6 (i) The Internal Non-Tax Revenues of Grama Panchayats:
They are generated by the GPs through different means viz., pilgrim fees, Jatra
fees, market fees, license fees, mutation fees, notice fees, warrant fees, fees on buses,
0
10
20
30
40
50
60
70
80
90
100
110
120
2002-03 2003-04 2004-05 2005-06 2006-07 2007-08 Average
Rs.
in
La
kh
s
Year
GPs of Gangavathi Taluk GPs of Yelburga Taluk
Amount Amount
Average Line Average Line
+ =
155
taxis and auto stands, fees on grazing lands, rent or income from own buildings and
assets, interest earned on deposits, sale proceeds of movable and immovable assets,
auction of trees, fruits, etc. The KPR Act permits the PRIs including GPs to receive
contributions, gifts and aid from different sources. These are mainly from local
people, philanthropists, charitable institutions, voluntary and non-governmental
organisations. In some of the GPs closer to the major cities and towns, rents from
shops and establishments constructed and let out by the panchayats also generate
significant revenues.
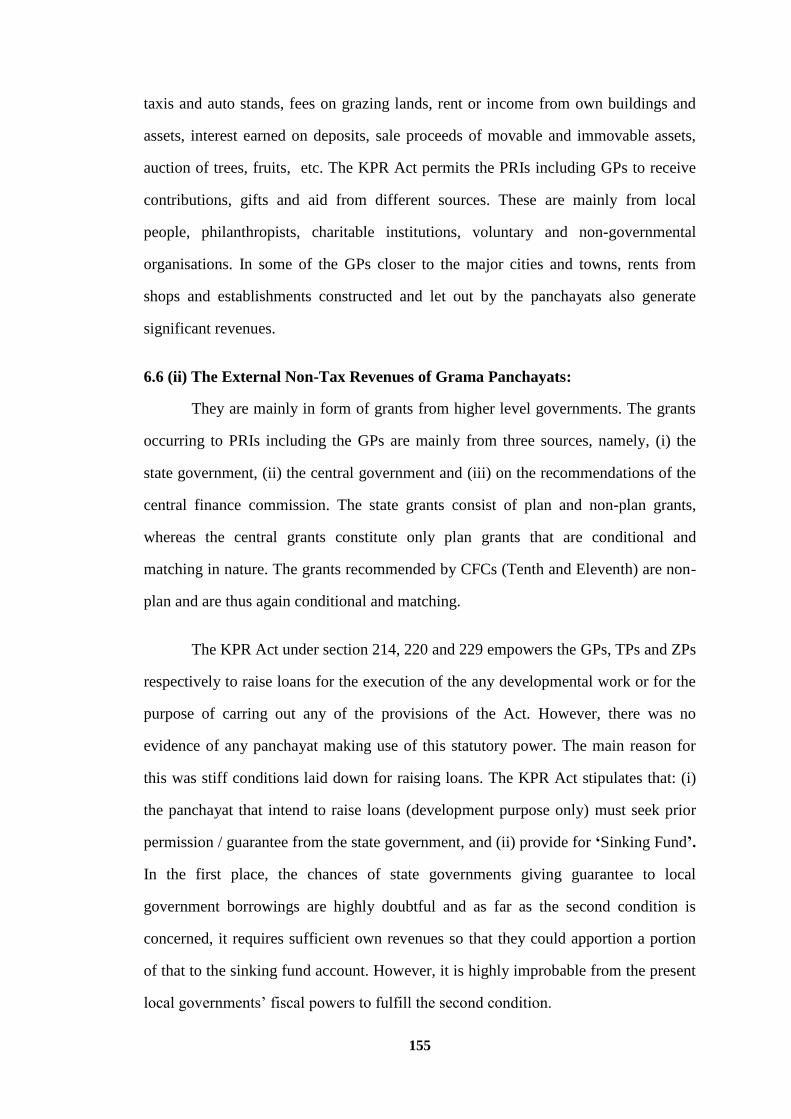
6.6 (ii) The External Non-Tax Revenues of Grama Panchayats:
They are mainly in form of grants from higher level governments. The grants
occurring to PRIs including the GPs are mainly from three sources, namely, (i) the
state government, (ii) the central government and (iii) on the recommendations of the
central finance commission. The state grants consist of plan and non-plan grants,
whereas the central grants constitute only plan grants that are conditional and
matching in nature. The grants recommended by CFCs (Tenth and Eleventh) are non-
plan and are thus again conditional and matching.
The KPR Act under section 214, 220 and 229 empowers the GPs, TPs and ZPs
respectively to raise loans for the execution of the any developmental work or for the
purpose of carring out any of the provisions of the Act. However, there was no
evidence of any panchayat making use of this statutory power. The main reason for
this was stiff conditions laid down for raising loans. The KPR Act stipulates that: (i)
the panchayat that intend to raise loans (development purpose only) must seek prior
permission / guarantee from the state government, and (ii) provide for ‘Sinking Fund’.
In the first place, the chances of state governments giving guarantee to local
government borrowings are highly doubtful and as far as the second condition is
concerned, it requires sufficient own revenues so that they could apportion a portion
of that to the sinking fund account. However, it is highly improbable from the present
local governments’ fiscal powers to fulfill the second condition.

156
The trends relating to internal non-tax revenue, external non-tax revenue and
total non-tax revenue are presented in the following table-6.4.
Table-6.4: Income of the GPs from Non-Taxes
(Rs. in Lakhs)
Year
GPs of Gangavathi Taluk GPs of Yelburga Taluk In
tern
al
No
n-T
ax
Ex
tern
al
No
n-T
ax
To
tal
No
n-T
ax
Per
cen
tag
e
Va
ria
tio
n
Inte
rna
l
No
n-T
ax
Ex
tern
al
No
n-T
ax
To
tal
No
n-T
ax
Per
cen
tag
e
Va
ria
tio
n
2002-03 8.15 267.70 275.85 - 4.58 184.40 188.98 -
2003-04 6.44 182.88 189.32 -31.37 11.71 183.01 194.72 3.04
2004-05 14.61 465.80 480.41 153.76 15.47 276.64 292.11 50.02
2005-06 12.50 536.74 549.24 14.33 9.98 563.34 573.32 96.27
2006-07 9.47 727.22 736.69 34.13 5.13 992.10 997.23 73.94
2007-08 15.07 571.14 586.21 -20.43 19.15 1157.17 1176.32 17.96
Average 11.04 458.58 469.62 30.08 11.00 559.44 570.45 48.25
Source: 1. Office of the Local Audit Circle, Koppal.
2. Offices of the GPs in Gangavathi & Yelburga Talukas.
GPs of
Gangavathi Taluk
GPs of
Yelburga Taluk
A) Net increase in amount 547.37 987.34
B) Net increase in percentage 289.12 522.46
C) Net increase in annual average percentage 48.19 87.08
D) Highest growth rate 153.76 96.27
E) Lowest growth rate -31.37 3.04
The time series data relating to the non-tax revenue of the all GPs in the both
talukas is presented in the table-6.4. It shows that the gross non-tax revenue of the
GPs in Gangavathi taluk increased from Rs. 275.85 lakhs to 736.69 lakhs during the
study period except 2003-04 and 2007-08 in which years decline trend is noticed; it
has thus risen by 289.12%. On the other side, the gross non-tax revenue of the GPs in

157
Yelburga taluk increased from 188.98 lakhs to 1176.32 lakhs between 2002-03 and
2007-08; it has thus risen by 522.46%.
The average amount of Rs. 570.45 lakhs of gross non-tax revenue of the all
GPs in Yelburga taluk for the six years is higher than the average of Rs. 469.62 lakhs
of the all GPs in Gangavathi taluk. Consequently, the average gross non-tax revenue
of (Rs. 570.45 lakhs ÷ 33 GPs) Rs. 17.29 lakhs of each GP in Yelburga taluk for the
six years is greater than the average of (Rs. 469.62 lakhs ÷ 38 GPs) Rs. 12.36 lakhs of
each GP in Gangavathi taluk. The average annual growth rate of 48.25% of the GPs in
Yelburga taluk is higher than that of 30.08% of the GPs in Gangavathi taluk. With
respect to generation of the gross non-tax income, the GPs of Yelburga taluk showed
the better performance than the GPs of Gangavathi taluk.
Graph-6.5
Income of the GPs from Non-Taxes (Rs. in Lakhs)
The above graph-6.5 shows that the minimum gross non-tax income of Rs.
189.32 lakhs in 2003-04 of the GPs in Gangavathi taluk is higher than that of the Rs.
188.98 lakhs in 2002-03 of the GPs in Yelburga taluk. The maximum gross non-tax
0
100
200
300
400
500
600
700
800
900
1000
1100
1200
2002-03 2003-04 2004-05 2005-06 2006-07 2007-08 Average
Rs.
in
Lak
hs
Year
GPs of Gangavathi Taluk GPs of Yelburga Taluk
Amount Amount
Average Line Average Line

158
income of Rs. 1176.32 lakhs in 2007-08 of the GPs in Yelburga taluk is much higher
than that of the Rs. 736.69 lakhs in 2006-07 of the GPs in Gangavathi taluk. The gross
non-tax income of the GPs in Gangavathi taluk has crossed the average line (Rs.
469.62 lakhs) for the last four years; while it has crossed the average line (Rs. 570.45
lakhs) for the last three years in case of the GPs in Yelburga taluk.
The second hypothesis that the proportion of external non-tax revenue is
greater than the internal non-tax revenue in the non-tax structure of GPs is proved in
the following table-6.5.
Table-6.5: Income of the GPs from Non-Taxes
(Percentage)
Year
GPs of Gangavathi Taluk GPs of Yelburga Taluk
Internal
Non- Tax
External
Non-Tax
Total
Non-Tax
Internal
Non- Tax
External
Non-Tax
Total
Non-Tax
2002-03 2.95 97.05 100 2.42 97.58 100
2003-04 3.40 96.60 100 6.01 93.99 100
2004-05 3.04 96.96 100 5.30 94.70 100
2005-06 2.28 97.72 100 1.74 98.26 100
2006-07 1.29 98.71 100 0.51 99.49 100
2007-08 2.57 97.43 100 1.63 98.37 100
Average 2.59 97.41 100 2.94 97.06 100
Source: 1. Office of the Local Audit Circle, Koppal.
2. Offices of the GPs in Gangavathi & Yelburga Talukas.
The table-6.5 discloses that the average percentage of internal non-tax revenue
of the GPs in Gangavathi and Yelburga talukas for the six years are 2.59% and 2.94%
respectively; while the average percentage of external non-tax revenue are 97.41%
and 97.06% respectively. The ratios of internal non-tax revenue are not only low but
also showed the declining trend for the several years and vice versa in respect of
external non-tax ratios. Although the GPs’ finance is mainly derived from non-tax
sources, external non-tax revenue is so much greater than the internal non-tax

159
revenue. The external non-tax revenue has a lion share and internal non-tax revenue
has a lean share in the GPs’ finance.
Graph-6.6
Internal Non-Tax Revenue of the GPs % to Total Income
The above graph-6.6 exhibits the ratios of internal non-tax revenue to total
revenue. The ratios for the first three years crossed the average line (2.59%) in the
GPs of Gangavathi taluk; while the ratios for two years i.e., 2003-04 and 2004-05
crossed the average line (2.94%) in the GPs of Yelburga taluk. The highest and lowest
ratios in the GPs of the both talukas are shown in 2003-04 and 2006-07 respectively.
From the graph it is obvious that the internal non-tax revenue sources did not make
any signification contribution to GPs’ finance in the both talukas.
The graph-6.7 exhibits that the ratios of external non-tax revenue for the last
three years continuously crossed the average line (97.41%) in the GPs of Gangavathi
taluk; while the ratios for four years i.e., 2002-03, 2005-06, 2006-07, and 2007-08
crossed the average line (97.06%) in the GPs of Yelburga taluk. The highest and
lowest ratios in the GPs of the both talukas are recorded in 2006-07 and 2003-04
0
1
2
3
4
5
6
7
2002-03 2003-04 2004-05 2005-06 2006-07 2007-08 Average
GPs of Gangavathi Taluk GPs of Yelburga Taluk
Percentage Percentage
Average Line Average Line
Per
cen
tag
e
Year

160
respectively. From the graph, it is evident that the external non-tax sources made very
significant contribution to the GPs’ finance in the both talukas.
Graph-6.7
External Non-Tax Revenue of the GPs % to Total Income
6.6. ii (a) Income of Grama Panchayats from Internal Non-Tax Sources:
The internal non-tax revenue is the income which is generated by own account
of GPs other than tax revenue. It is derived from fees and revenue from GPs’ fixed
property. The income of the all GPs in the both talukas from the internal non-tax
sources is shown in the table-6.6.
The time series data as shown in the table-6.6 indicates that the gross internal
non-tax revenue of all 38 GPs in Gangavathi taluk decreased from Rs. 8.15 lakhs in
2002-03 to Rs. 6.44 lakhs in 2003-04, rose to Rs. 14.61 lakhs in 2004-05, again fell to
Rs. 12.50 lakhs and 9.47 lakhs in 2005-06 and 2006-07 respectively, again showed
the increasing tendency to Rs. 15.07 lakhs in 2007-08; it has thus risen by 134.01%.
On the contrary, the gross internal non-tax revenue of all 33 GPs in Yelburga taluk
has increased from Rs. 4.58 lakhs to Rs. 15.47 lakhs between 2002-03 and 2004-05,
10
20
30
40
50
60
70
80
90
100
2002-03 2003-04 2004-05 2005-06 2006-07 2007-08 Average
GPs of Gangavathi Taluk GPs of Yelburga Taluk
Percentage Percentage
Average Line Average Line
Year
Per
cen
tag
e

161
decreased to Rs. 9.98 lakhs and 5.13 lakhs in 2005-06 and 2006-07 respectively, again
rose to Rs. 19.15 lakhs in 2007-08; it has thus risen by 318.12%. Fluctuations in the
revenue from internal non-tax revenue are greater in the GPs of Yelburga taluk than
the GPs of Gangavathi taluk.
Table-6.6: Income of the GPs from Internal Non-Taxes
(Rs. in Lakhs)
Year
GPs of Gangavathi Taluk GPs of Yelburga Taluk
Fee
s
Co
llec
ted
by
GP
s
Rev
enu
e fr
om
GP
s’ F
ixed
Pro
per
ty
To
tal
Inte
rna
l
No
n -
Ta
x
Per
cen
tag
e
Va
ria
tio
n
Fee
s
Co
llec
ted
by
GP
s
Rev
enu
e fr
om
GP
s’ F
ixed
Pro
per
ty
To
tal
Inte
rna
l
No
n -
Ta
x
Per
cen
tag
e
Va
ria
tio
n
2002-03 3.33 4.82 8.15 - 3.13 1.45 4.58 -
2003-04 4.29 2.15 6.44 -20.98 10.82 0.89 11.71 155.68
2004-05 11.50 3.11 14.61 126.86 13.63 1.84 15.47 32.11
2005-06 8.01 4.49 12.50 -14.44 8.23 1.75 9.98 -35.49
2006-07 6.12 3.35 9.47 -24.24 3.62 1.51 5.13 -48.60
2007-08 12.14 2.93 15.07 59.13 15.26 3.89 19.15 273.29
Average 7.57 3.47 11.04 25.27 9.11 1.89 11.00 75.40
Source: 1. Office of the Local Audit Circle, Koppal.
2. Offices of the GPs in Gangavathi & Yelburga Talukas.
GPs of
Gangavathi Taluk
GPs of
Yelburga Taluk
A) Net increase in amount 8.63 14.57
B) Net increase in percentage 134.01 318.12
C) Net increase in annual average percentage 22.34 53.02
D) Highest growth rate 126.86 273.29
E) Lowest growth rate -24.24 -48.60
The average amount of Rs. 11.04 lakhs of receipts from gross internal non-tax
sources of the all GPs in Gangavathi taluk for the six years is slightly higher than that

162
of Rs. 11.00 lakhs of the all GPs in Yelburga taluk. However, the average of
(Rs. 11.00 lakhs ÷ 33 GPs) Rs. 0.33 lakhs of each GP in Yelburga taluk for the six
years is greater than that of the average of (Rs. 11.04 lakhs ÷ 38 GPs) Rs. 0.29 lakhs
of each GP in Gangavathi taluk. The average annual growth rate of 75.40% of the
GPs in Yelburga taluk is better than that of 25.27% of the GPs in Gangavathi taluk.
As far the average revenue from internal non-taxes is concerned the GPs in the both
talukas exhibits more or less same position.
6.6. ii (b) Income of Grama Panchayats from External Non-Tax Sources:
The external non-tax revenue is obtained by other than own accounts (other
than tax revenue) of GPs. They are in forms of different grants as shown in the
following table-6.7.
Table-6.7: Income of the GPs from External Non-Taxes
(Rs. in Lakhs)
Year
GPs of Gangavathi Taluk GPs of Yelburga Taluk
Gra
nts
fro
m
the
Sta
te G
ov
t.
Gra
nts
fro
m
the
CF
Cs
Gra
nts
fro
m
Cen
tra
lly
& /
or
Sta
te S
po
nso
red
Sch
emes
To
tal
Ex
tern
al
No
n-T
ax
Per
cen
tag
e
Va
ria
tio
n
Gra
nts
fro
m
the
Sta
te G
ov
t.
Gra
nts
fro
m
the
CF
Cs
Gra
nts
fro
m
Cen
tra
lly
& /
or
Sta
te S
po
nso
red
Sch
emes
To
tal
Ex
tern
al
No
n-T
ax
Per
cen
tag
e
Va
ria
tio
n
2002-03 82.49 74.33 110.88 267.70 - 60.10 50.50 73.80 184.40 -
2003-04 70.65 1.74 110.49 182.88 -31.68 76.67 6.31 100.03 183.01 -0.75
2004-05 49.74 40.53 375.53 465.80 154.70 40.60 40.33 195.71 276.64 51.16
2005-06 191.21 25.80 319.73 536.74 15.23 179.47 22.84 361.03 563.34 103.64
2006-07 192.50 73.10 461.62 727.22 35.49 167.76 121.56 702.78 992.10 76.17
2007-08 50.75 40.25 480.14 571.14 -21.46 218.72 68.09 870.36 1157.17 16.64
Average 106.22 42.63 309.73 458.58 30.46 123.89 51.60 383.95 559.44 49.36
Source: 1. Office of the Local Audit Circle, Koppal.
2. Offices of the GPs in Gangavathi & Yelburga Talukas.

163
GPs of
Gangavathi Taluk
GPs of
Yelburga Taluk
A) Net increase in amount 544.34 974.16
B) Net increase in percentage 297.65 532.30
C) Net increase in annual average percentage 49.61 88.72
D) Highest growth rate 154.70 103.64
E) Lowest growth rate -31.68 -0.75
The time series data as shown in the above table reveals that the gross external
non-tax revenue of the all 38 GPs in Gangavathi taluk rose from Rs. 267.70 lakhs to
Rs. 727.22 lakhs except 2003-04 and 2007-08 in which years decrease is observed; it
has thus risen by 297.65%. Whereas the gross external non-tax revenue of the all 33
GPs in Yelburga taluk rose from Rs. 184.40 lakhs to Rs. 1157.17 lakhs except 2003-
04 in which year small amount of decline is noticed; it has thus raised by 532.30%
which is much higher than the GPs in the other taluk.
The average amount of Rs. 559.44 lakhs of total external non-tax revenue of
the all GPs in Yelburga taluk for the six years is higher than the average of Rs. 458.58
lakhs of the all GPs in Gangavathi taluk. Accordingly, the average of (Rs.559.44
lakhs ÷ 33 GPs) Rs. 16.95 lakhs of each GP in Yelburga taluk is greater than that of
the average of (Rs.458.58 lakhs ÷ 38 GPs) Rs.12.07 lakhs of each GP in Gangavathi
taluk. The GPs in Yelburga taluk be provided with more grants than the GPs in
Gangavathi taluk. Hence, the average annual growth rate of 49.36% of the GPs in
Yelburga taluk is much better than that of 30.46% of the GPs in Gangavathi taluk.
6.7 Income of Grama Panchayats from Internal (Own) Sources:
The internal sources of GPs can be classified into two categories viz., tax and
internal non-tax. The total of tax and internal non-tax revenue is equal to total internal
revenue, which are symbolically presented as;

164
Total Internal Total
Tax Revenue Non-Tax Revenue Internal Revenue
The tax and internal non-tax revenue are derived from own accounts of the
GPs which are presented in the following table-6.8.
Table-6.8: Income of the GPs from Internal (Own) Sources
(Rs. in Lakhs)
Year
GPs of Gangavathi Taluk GPs of Yelburga Taluk
Total
Tax
Internal
Non-Tax
Total
Internal
Income
%
Variation
Total
Tax
Internal
Non-Tax
Total
Internal
Income
%
Variation
2002-03 46.88 8.15 55.03 - 20.75 4.58 25.33 -
2003-04 71.35 6.44 77.79 41.36 14.24 11.71 25.95 2.45
2004-05 81.97 14.61 96.58 24.15 46.04 15.47 61.51 137.03
2005-06 86.47 12.50 98.97 2.47 50.34 9.98 60.32 -1.93
2006-07 112.58 9.47 122.05 23.32 41.64 5.13 46.77 -22.46
2007-08 69.25 15.07 84.32 -30.91 59.52 19.15 78.67 68.21
Average 78.08 11.04 89.12 12.08 38.76 11.00 49.76 36.66
Source: 1. Office of the Local Audit Circle, Koppal.
2. Offices of the GPs in Gangavathi & Yelburga Talukas.
GPs of
Gangavathi Taluk
GPs of
Yelburga Taluk
A) Net increase in amount 67.02 53.34
B) Net increase in percentage 121.79 210.58
C) Net increase in annual average percentage 20.30 35.10
D) Highest growth rate 41.36 137.03
E) Lowest growth rate -30.91 -22.46
The time series data as shown in the above table represents the gross income
from internal sources of all 38 GPs in Gangavathi taluk increased from Rs. 55.03
lakhs to 122.05 lakhs between 2002-03 to 2006-07, but fall to Rs. 84.32 lakhs in
+ =

165
2007-08; it has thus increased by 121.79% during the study period. On the other hand,
the gross income from internal sources of all 33 GPs in Yelburga taluk increased from
Rs. 25.33 lakhs to Rs. 61.51 lakhs in the first three years, but fall to Rs. 60.32 lakhs
and Rs. 46.77 lakhs in the next two years, again rose to Rs.78.67 lakhs in the last year;
it has thus increased by 210.58%.
The average amount of Rs. 89.12 lakhs of receipts from internal sources of the
all GPs in Gangavathi taluk for the six years is higher than the average of Rs. 49.76
lakhs of the all GPs in Yelburga taluk. Consequently, the average of (Rs.89.12 lakhs ÷
38 GPs) Rs. 2.35 lakhs of each GP in the former taluk is greater than that of average
of (Rs. 49.76 lakhs ÷ 33 GPs) Rs. 1.51 lakhs of each GP in the latter taluk. In terms of
amount, the GPs of Gangavathi taluk showed better performance than the GPs of
Yelburga taluk in generating the income from internal (own) sources. Nevertheless,
the annual average growth rate of 36.66% of the GPs in Yelburga taluk is much better
than that of 12.08% of the GPs in Gangavathi taluk.
6.8 Income of Grama Panchayats from External Sources:
Table-6.9: Income of the GPs from External Sources
(Rs. in Lakhs)
Year
GPs of Gangavathi Taluk GPs of Yelburga Taluk
External Non-Tax =
Total External Income
Percentage
Variation
External Non-Tax =
Total External Income
Percentage
Variation
2002-03 267.70 - 184.40 -
2003-04 182.88 -31.68 183.01 -0.75
2004-05 465.80 154.7 276.64 51.16
2005-06 536.74 15.23 563.34 103.64
2006-07 727.22 35.49 992.10 76.17
2007-08 571.14 -21.46 1157.17 16.64
Average 458.58 30.46 559.44 49.36
Source: 1. Office of the Local Audit Circle, Koppal.
2. Offices of the GPs in Gangavathi & Yelburga Talukas.

166
GPs of
Gangavathi Taluk
GPs of
Yelburga Taluk
A) Net increase in amount 303.44 972.77
B) Net increase in percentage 113.35 527.53
C) Net increase in annual average percentage 18.89 87.92
D) Highest growth rate 154.70 103.64
E) Lowest growth rate -31.68 -0.75
As presented in the table-6.9 the revenue from external sources of the GPs
received by them are solely in form of grants i.e., external non-tax revenue. Hence,
grants received by GPs are equal to total external revenue, symbolically presented as
follows;
Total External Total
Non-Tax Revenue External Revenue
The table-6.9 is a derivative of table-6.7 on which the observations have been
made already.
6.9 Total Income of Grama Panchayats from Internal and External Sources:
The income of GPs can be classified into two categories viz., internal sources
and external sources. The total of internal and external income is equal to total
income, which is symbolically presented as;
Total Total Total
Internal Income External Income Income
The internal income is derived from own accounts and the external income is
derived from other than own accounts of GPs which are presented in the following
tables. The third hypothesis that resources of GPs are mainly derived from external
sources i.e., grants from higher level governments is verified in the tables- 6.10 and
6.11.
=
+ =

167
Table-6.10: Total Income of the GPs from Internal & External Sources
(Rs. in Lakhs)
Year
GPs of Gangavathi Taluk GPs of Yelburga Taluk
Internal
Income
External
Income
Total
Income
Internal
Income
External
Income
Total
Income
2002-03 55.03 267.70 322.73 25.33 184.40 209.73
2003-04 77.79 182.88 260.67 25.95 183.01 208.96
2004-05 96.58 465.80 562.38 61.51 276.64 338.15
2005-06 98.97 536.74 635.71 60.32 563.34 623.66
2006-07 122.05 727.22 849.27 46.77 992.10 1038.87
2007-08 84.32 571.14 655.46 78.67 1157.17 1235.84
Average 89.12 458.58 547.70 49.76 559.44 609.20
Source: 1. Office of the Local Audit Circle, Koppal.
2. Offices of the GPs in Gangavathi & Yelburga Talukas.
Table-6.11: Total Income of the GPs from Internal & External Sources
(Percentage)
Year
GPs of Gangavathi Taluk GPs of Yelburga Taluk
Internal
Income
External
Income
Total
Income
Internal
Income
External
Income
Total
Income
2002-03 17.05 82.95 100 12.08 87.92 100
2003-04 29.84 70.16 100 12.42 87.58 100
2004-05 17.17 82.83 100 18.19 81.81 100
2005-06 15.57 84.43 100 9.67 90.33 100
2006-07 14.37 85.63 100 4.50 95.50 100
2007-08 12.86 87.14 100 6.37 93.63 100
Average 17.81 82.19 100 10.54 89.46 100
Source: 1. Office of the Local Audit Circle, Koppal.
2. Offices of the GPs in Gangavathi & Yelburga Talukas.
The table-6.10 reveals the amount and table-6.11 reveals the ratios of internal
revenue and external revenue to the total revenue of all GPs in the both talukas. The
average ratios of internal revenue of the all GPs in Gangavathi and Yelburga talukas

168
are 17.81% and 10.54% respectively; while the average ratios of external revenue of
all GPs in these talukas are 82.19% and 89.46% respectively. The GPs in Gangavathi
taluk are better placed than the GPs of Yelburga taluk as for the average ratio of
internal revenue is concerned or it can also be assertively said that the reliance of the
GPs in Yelburga taluk on the external revenue is enormously high than the GPs in
Gangavathi taluk.
The most identifiable trend of the whole episode is that the ratios of internal
revenue are descending downwards while those of the external revenue are ascending
upwards except 2003-04 in the GPs of Gangavathi taluk; 2003-04 and 2004-05 in the
GPs of Yelburga taluk. The overall average share of internal sources for the six years
tenure comes to not so appreciable level of 18%. In other words, the GPs of the
sample talukas are depended upon the external sources to the extent of 82% and even
more. The inference has drawn from the above figures are that the GPs reliance on the
external sources is predominantly high. The GPs resources are mainly derived from
external sources i.e., the internal sources did not make any significant contribution to
the GPs of the sample talukas during the study period. Moreover the GPs are either
unwilling to tap the internal sources fully or the internal sources are very inflexible in
yielding the expected revenues.
The graph-6.8 reveals the ratios of internal revenue to total income of the GPs
in the sample talukas. In the GPs of Gangavathi taluk the ratios crossed the average
line (17.81%) for 2003-04; while in the GPs of Yelburga taluk the ratios crossed the
average line (10.54%) for first three years. The average line of the GPs in the former
taluk is higher than that of the GPs in the latter taluk. Therefore, the contribution of
internal sources to total income of the GPs in Gangavathi taluk is better than the GPs
in Yelburga taluk.

169
Graph-6.8
Internal Revenue of the GPs % to Total Income
Graph-6.9
External Revenue of the GPs % to Total Income
0
2
4
6
8
10
12
14
16
18
20
22
24
26
28
30
2002-03 2003-04 2004-05 2005-06 2006-07 2007-08 Average
0
10
20
30
40
50
60
70
80
90
100
2002-03 2003-04 2004-05 2005-06 2006-07 2007-08 Average
Per
cen
tag
e P
erce
nta
ge
Year
GPs of Gangavathi Taluk GPs of Yelburga Taluk
Percentage Percentage
Average Line Average Line
Year
GPs of Gangavathi Taluk GPs of Yelburga Taluk
Percentage Percentage
Average Line Average Line
170
The graph-6.9 shows the ratios of external revenue to total income of the GPs
in the selected talukas. In the GPs of Gangavathi taluk the ratios crossed the average
line (82.19%) for first one year and last four years; whereas in the GPs of Yelburga
taluk the ratios crossed the average line (89.46%) for last three years. The average line
of the GPs in Yelburga taluk is higher than that of the GPs in Gangavathi taluk.
Therefore, the contribution of external sources to total income of the GPs in Yelburga
taluk is higher than the GPs in Gangavathi taluk.
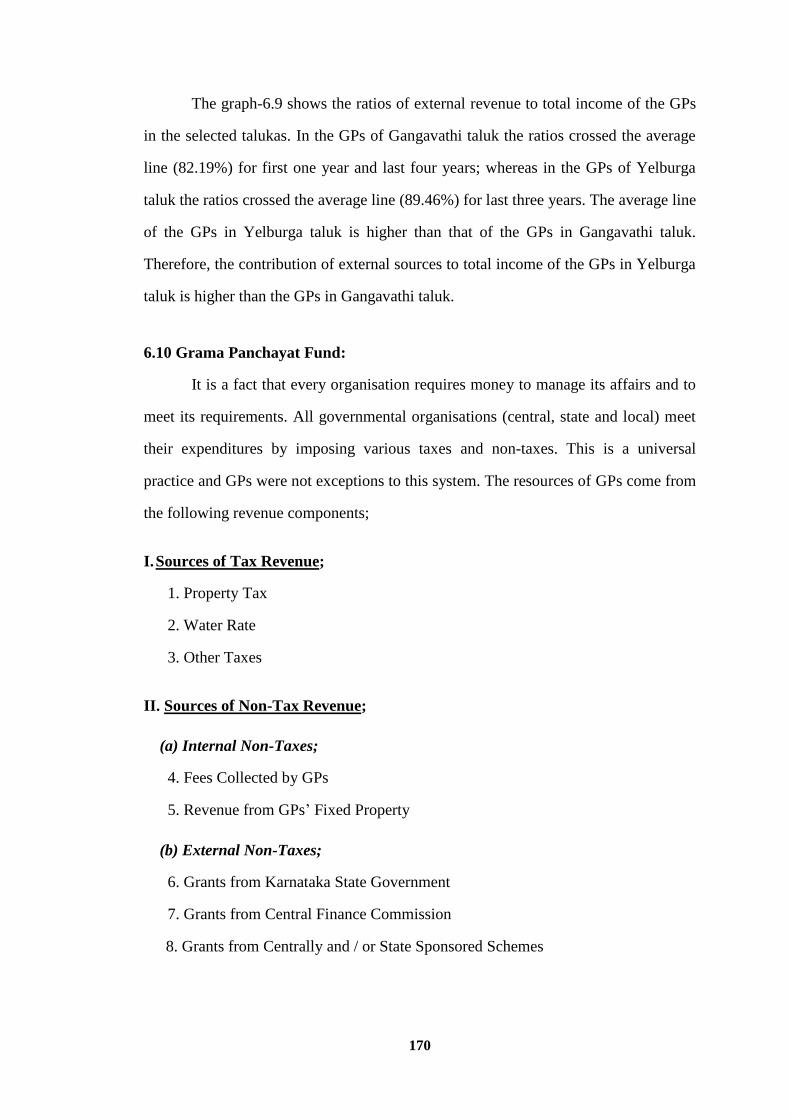
6.10 Grama Panchayat Fund:
It is a fact that every organisation requires money to manage its affairs and to
meet its requirements. All governmental organisations (central, state and local) meet
their expenditures by imposing various taxes and non-taxes. This is a universal
practice and GPs were not exceptions to this system. The resources of GPs come from
the following revenue components;
I. Sources of Tax Revenue;
1. Property Tax
2. Water Rate
3. Other Taxes
II. Sources of Non-Tax Revenue;
(a) Internal Non-Taxes;
4. Fees Collected by GPs
5. Revenue from GPs’ Fixed Property
(b) External Non-Taxes;
6. Grants from Karnataka State Government
7. Grants from Central Finance Commission
8. Grants from Centrally and / or State Sponsored Schemes

171
6.11 Tax Rates:
The rates at which the tax can be levied on various components laid down in
the IV schedule of Karnataka Panchayati Raj Act, 1993 are shown in the following
table-6.12.
Table-6.12: Taxes and Their Rates
Sl.
No. Particulars
Tax Rate
(In Rupees) Description Section
1.
Tax on lands not
subject to
agricultural
assessment
Re.1 for every
100 square
meter
Re.1 per annum for every 100
square meter.
199 of
KPR
Act,1993
2 Tax on buildings
10% of annual
letting value
(per annum)
Tax may be levied on the basis of
10% of annual letting value of huts,
temporary and permanent houses. If
building is used for own living, tax
rate should be decided on the basis
of its value.
199 of
KPR
Act,1993
3
Tax on
entertainment
other than
cinematography
shows.
Rs. 20 per
entertainment
For a circus, drama exhibition,
amusements, games or sports and
magic show which generates
income.
199 of
KPR Act
1993
4
Tax on vehicles
other than motor
vehicles.
Rs. 25 Per
annum
For every 4 wheeled vehicle with
springs constructed to be drawn by
two or more horses, bulls, or
bullocks.
199 of
KPR
Act,1993 Rs. 10 per
annum
i) For every 2 wheeled vehicle with
springs constructed to be drawn by
one or more horses, bulls, or
bullocks.
ii) For every other vehicle with
springs.
iii) For every cart or vehicle without
springs.
Rs. 5 Per
annum For every bicycle or tricycle
5
Tax on
advertisement and
hoarding.
Rs. 5 for every
square meter
Per month
For advertisement other than
premises of trade institutions, ex:
advertisements at road side, on
buildings wall.
199 of
KPR
Act,1993
6 Water rate
General water
rate Rs. 10 per
month
For providing water facility through
street taps or water supply schemes. 199 of
KPR
Act,1993 Special water
rate Rs. 25 per
month
For supplying water to houses
through taps.
Source: Prajaprabutva, Vikendrikarana Matthu Abivrudhi, ANSSIRD, Mysore, 2009.

172
6.12 The Property Tax:
Separate figures for tax on lands not subject to agricultural assessment and tax
on buildings could not be ascertained as records are showing consolidated collection
for these taxes. Hence, for the present study data of tax on lands not subject to
agricultural assessment and tax on buildings are presented in a united source of
income as a property tax.
6.12 (i) Rate of the Property Tax:
The tax shall be levied;
(a) On the building at the rate of 10 per cent of the annual letting value of such
building, per annum; and
(b) On the land, at the rate of 1 rupee per annum for every 100 square meter.
6.12 (ii) Exemption:
The following buildings and lands shall be exempted from the levy of tax
under sub-section (1) of Section 199 of KPR Act namely;
(a) Buildings and lands belonging to the Zilla Panchayats, Taluk Panchayats and
Grama Panchayats.
(b) Buildings and lands belonging to Central Government or any State Government
and used for the purposes of such Government and not used for intended to be
used for residential or commercial purposes;
(c) Buildings and lands, used solely for charitable or public religious purposes and not
let out for rent; and
(d) Lands measuring less than 100 square meter and buildings having an annual
letting value of less than rupees twenty-five.
6.12 (iii) Assessment List:
The Secretary shall, as soon as may be after the publication of the notice of
resolution under KPR (Panchayat Taxes and Fees) Rule 3 but not later than the 1st

173
day of December next following, prepare an assessment list relating to the buildings
and lands in the Panchayat area showing the-
(a) Serial number of each house or land;
(b) Name of the owner and occupier, if any;
(c) Annual letting value of the buildings; and
(d) Amount of tax assessed thereon.
6.12 (iv) Objection to the Assessment List:
When the assessment list is completed, a notice shall be published by affixing
it on the notice board of the office of the Grama Panchayat, and also by beat of drum
in the Panchayat area, stating that the list is open for inspection at the office of the
Grama Panchayat and that objections will be considered and decided by the Grama
Panchayat on a date which shall not be earlier than thirty days from the date of
publication of the aforesaid notice.
6.12 (v) Inspection of Assessment List:
Every person whose name appears in the assessment list, every person
claiming to be the owner or occupier of any building or land, and the agent of any
such person shall be at liberty to inspect the list and to make extracts there from
without any charge.
6.12 (vi) Authentication of Assessment List:
(1) All objections to the assessment shall be considered and decided by the Grama
Panchayat on the date specified in the notice published under KPR (Panchayat
Taxes and Fees) Rule 8 or on any later date and the decision of the Grama
Panchayat shall be communicated to the person objecting to the assessment.
(2) The Grama Panchayat shall cause to be made necessary amendments, if any, in the
assessment list in accordance with the orders under the KPR sub-rule (1) or the
orders of the Zilla Panchayat under the Rule 39 and thereafter the assessment list
shall be authenticated by the Adhyaksha.

174
(3) The entries in the list authenticated under the sub-rule (2) shall be conclusive
evidence of the amount of tax leviable.
6.12 (vii) Alteration of the Assessment List:
(1) Grama Panchayat may at any time alter the assessment list by inserting or deleting
an entry-
(a) In respect of any building or land, if such entry has been omitted from, or
erroneously made in, the assessment list through fraud, accident or mistake;
(b) In respect of any building constructed, altered, added to or reconstructed after
preparation of the assessment list, after giving the person interested in the
alteration of the list, a notice of not less than one month calling upon to file
objections, if any, to such alteration.
(2) An objection made under the sub-rule (1) before the time specified in such notice
shall be considered and decided by the Grama Panchayat.
(3) Any entry or alteration made under this rule shall be deemed to have been made-
(a) In the case of building constructed, altered, added to or reconstructed, on the date
on which such construction, alteration, addition or reconstruction was completed or
of the date on which the building was first occupied after such construction,
alteration, addition or reconstruction, whichever is earlier; and
(b) In other cases, on the date of which the circumstances justifying the entry or
alteration existed.
(4) The tax or the enhanced tax, as the case may be, which becomes leviable on
account of alteration of the assessment and after the first day of April of a year,
shall be levied in respect of the remaining period of such year as nearly as may be
in the same proportion in which the remaining period bears to the whole year.
175
6.12 (viii) Liability to Pay the Tax:
(1) Where the owner of any building or land assessed to tax transfers such building or
land to any person, such owner as well as the transferee shall, within two months
from the date of such transfer, give a notice of the same to the Grama Panchayat.
(2) Where the owner of any building or land assessed to tax dies, his heirs who
succeed to the building or land shall, within two months from the date of the
death of such person give notice of the same to the Grama Panchayat.
(3) Where such transfer of ownership of the building or land or the death of the owner
of the building or land comes to the knowledge of the Grama Panchayat, either
through a notice under the sub-rule (1) or (2) or otherwise it shall, after such
enquiry as it may deem fit, substitute the names of the transferee or the legal heirs
of the deceased owner, as the case may be, in the records of the Grama Panchayat.
6.12 (ix) Liability to Give Notice in Case of Demolition or Removal of a Building:
Owner of the building or any portion of the building assessed to tax under
these rules shall, if such building or part thereof, is demolished give notice of the
same in writing to the Secretary failing which he shall continue to be liable to pay the
tax in respect of such building till it is communicated to the Grama Panchayat:
Provided that nothing in this rules shall apply in respect of a building or portion of a
building which has fallen down or is burnt.
6.12 (x) Revision of the Assessment List:
(1) It shall not be necessary to prepare a new assessment list every year but every part
of the assessment list shall be completely revised not less than once in every four
years.
(2) Grama Panchayat may adopt the valuation and assessment in the list of the
previous year for the year immediately following with such alteration as may be
deemed necessary.

176
6.12 (xi) Occupier’s Right to Recover the Tax Paid by Him:
Where the occupier of any building or land has paid the tax under sub-section
(2) of Section 199 of the KPR Act, in respect of such building or land, he shall be
entitled to be reimbursed by the owner of such building or land and may in addition
to, any other remedy open to him deduct the amount of tax so paid from the rent or
any other amount payable by him to the owner.
6.12 (xii) Remission of Assessment when Done:
Where any building or land assessed to tax has remained vacant and
unproductive for the whole or part of a year the Grama Panchayat shall remit or
refund proportionately the amount of tax in respect of the period of such vacancy:
Provided that no such remission or refund shall be granted unless the building or land
is vacant and underproductive for not less than sixty consecutive days and that notice
in writing of the fact of the building or land being vacant and unproductive has been
given to the Secretary: Provided further that no remission or refund shall be granted
for any period prior to the date of the receipt of the notice.
Table-6.13: Income of the GPs from Property Tax
Year
GPs of Gangavathi Taluk GPs of Yelburga Taluk
Amount (Rs. in Lakhs)
% to
Total Tax
Revenue
% to
Total
Revenue
Amount (Rs. in Lakhs)
% to
Total Tax
Revenue
% to
Total
Revenue
2002-03 33.13 70.67 10.27 10.39 50.07 4.95
2003-04 62.19 87.16 23.86 6.69 46.98 3.20
2004-05 68.75 83.87 12.22 20.33 44.16 6.01
2005-06 76.86 88.89 12.09 41.15 81.74 6.60
2006-07 95.42 84.76 11.24 28.61 68.71 2.75
2007-08 58.95 85.13 8.99 38.82 65.22 3.14
Average 65.88 83.41 13.11 24.33 59.48 4.44
Source: 1. Office of the Local Audit Circle, Koppal.
2. Offices of the GPs in Gangavathi & Yelburga Talukas.
177
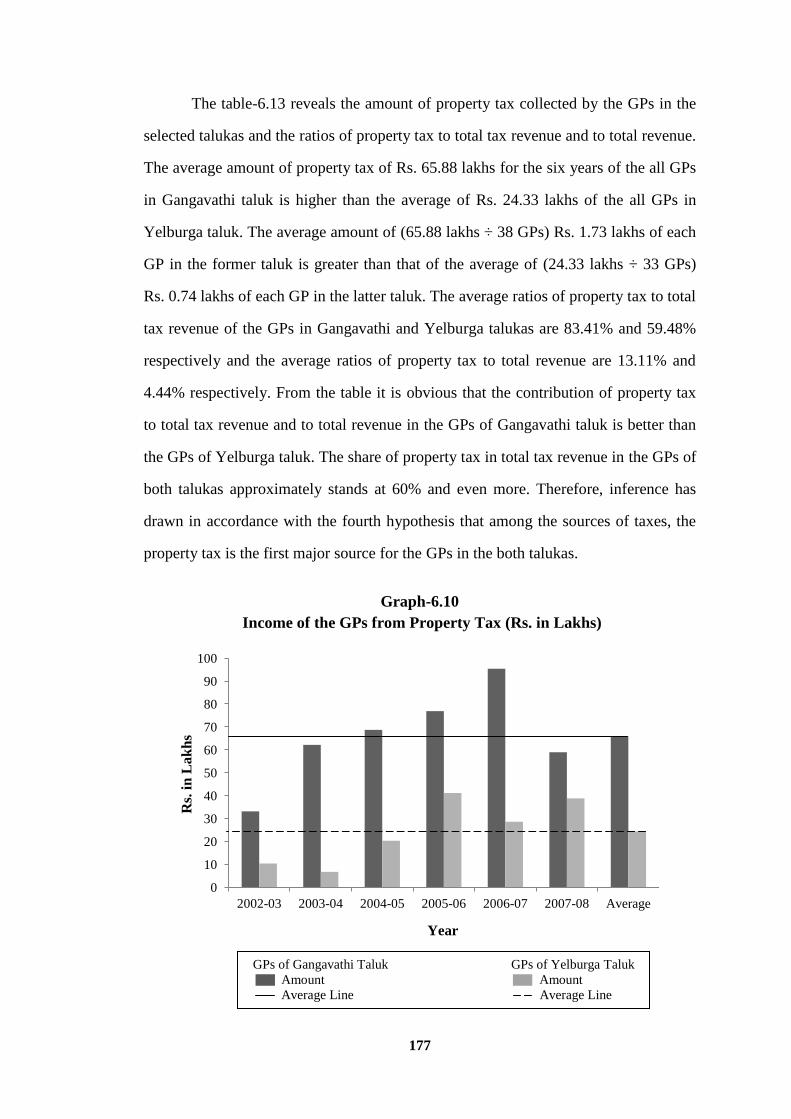
The table-6.13 reveals the amount of property tax collected by the GPs in the
selected talukas and the ratios of property tax to total tax revenue and to total revenue.
The average amount of property tax of Rs. 65.88 lakhs for the six years of the all GPs
in Gangavathi taluk is higher than the average of Rs. 24.33 lakhs of the all GPs in
Yelburga taluk. The average amount of (65.88 lakhs ÷ 38 GPs) Rs. 1.73 lakhs of each
GP in the former taluk is greater than that of the average of (24.33 lakhs ÷ 33 GPs)
Rs. 0.74 lakhs of each GP in the latter taluk. The average ratios of property tax to total
tax revenue of the GPs in Gangavathi and Yelburga talukas are 83.41% and 59.48%
respectively and the average ratios of property tax to total revenue are 13.11% and
4.44% respectively. From the table it is obvious that the contribution of property tax
to total tax revenue and to total revenue in the GPs of Gangavathi taluk is better than
the GPs of Yelburga taluk. The share of property tax in total tax revenue in the GPs of
both talukas approximately stands at 60% and even more. Therefore, inference has
drawn in accordance with the fourth hypothesis that among the sources of taxes, the
property tax is the first major source for the GPs in the both talukas.
Graph-6.10
Income of the GPs from Property Tax (Rs. in Lakhs)
0
10
20
30
40
50
60
70
80
90
100
2002-03 2003-04 2004-05 2005-06 2006-07 2007-08 Average
Rs.
in
Lak
hs
Year
GPs of Gangavathi Taluk GPs of Yelburga Taluk
Amount Amount
Average Line Average Line

178
The graph-6.10 reveals that the highest and lowest yields from the property tax
are in the years of 2006-07 and 2002-03 respectively in the GPs of Gangavathi taluk;
while the highest and lowest yields from this tax are in the years of 2005-06 and
2003-04 respectively in the GPs of Yelburga taluk. The collection of the tax in the
GPs of the former taluk crossed the average line (Rs. 65.88 lakhs) for three years
i.e., 2004-05, 2005-06 and 2006-07; in case of the GPs in the latter taluk it has crossed
the average line (Rs. 24.33 lakhs) for last three years. The average line of the GPs in
Gangavathi taluk is much higher than that of the GPs in Yelburga taluk.
Graph-6.11
Property Tax of the GPs % to Total Tax Revenue
The above graph-6.11 shows the ratios of property tax to total tax revenue of
the GPs in the both talukas. The ratios of the GPs in Gangavathi taluk crossed the
average line (83.41%) for last five years; whereas in case of the GPs in Yelburga taluk
the ratios crossed the average line (59.48%) for last three years. From the graph, it is
evident that the contribution of property tax to total tax revenue of the GPs in
Gangavathi taluk is better than that of the GPs in Yelburga taluk. Therefore, the
0
10
20
30
40
50
60
70
80
90
100
2002-03 2003-04 2004-05 2005-06 2006-07 2007-08 Average
Year
Per
cen
tage
GPs of Gangavathi Taluk GPs of Yelburga Taluk
Percentage Percentage
Average Line Average Line

179
revenue component of property tax made significant contribution in the GPs of
Gangavathi taluk during the study period.
6.13 The Water Rate:
A GP may levy the water rate for supply of water for drinking and other
purposes. It is the revenue component of tax sources that is derived from own
accounts of GPs and collected from the residents living within the limits of
panchayats area.
6.13 (i) Period of Levy:
(1) The water rate under sub-section (2) of Section 199 of KPR Act may be levied on
the owner of a building for a year or part thereof and shall be paid every quarterly
commencing from the 1st day of April, 1st day of July, 1st day of October and 1st
day of January of such year.
(2) Where such owner has left the Panchayat area or cannot otherwise be found the
occupier of such building shall be liable for the water rate levied under KPR
(Panchayat Taxes and Fees) sub-rule (1).
(3) The occupier of the building who has paid the water rate under the sub-rule (2)
shall be entitled to be reimbursed by the owner of such building and may, in
addition to any other remedy open to him, deduct the amount of water rate so paid
from the rent or any other amount payable by him to the owner.
6.13 (ii) Remission for Temporary Stoppage of Water Supply:
If through any accident in the water works arrangements or due to any other
cause there is a temporary stoppage in the water supply, no reduction shall be claimed
in the water rate nor the Grama Panchayat shall be liable for damages for any loss or
inconvenience sustained by the rate payer; so, however, the Grama Panchayat may
grant proportionate remission in water rate if there is a stoppage of water supply
continuously for more than a month.

180
Alignment of water rate with total tax revenue and total revenue is presented
for the all GPs of the sample talukas in the following table.
Table-6.14: Income of the GPs from Water Rate
Year
GPs of Gangavathi Taluk GPs of Yelburga Taluk
Amount (Rs. in Lakhs)
% to
Total Tax
Revenue
% to
Total
Revenue
Amount (Rs. in Lakhs)
% to
Total Tax
Revenue
% to
Total
Revenue
2002-03 6.30 13.44 1.95 7.94 38.27 3.79
2003-04 7.66 10.74 2.94 7.55 53.02 3.61
2004-05 13.22 16.17 2.35 9.76 21.20 2.89
2005-06 8.95 10.35 1.41 3.03 6.02 0.49
2006-07 17.16 15.24 2.02 13.03 31.29 1.25
2007-08 10.30 14.87 1.57 18.37 30.86 1.49
Average 10.60 13.46 2.04 9.95 30.11 2.25
Source: 1. Office of the Local Audit Circle, Koppal.
2. Offices of the GPs in Gangavathi & Yelburga Talukas.
The above table-6.14 shows the amount of water rate collected by the all GPs
in the both talukas and the ratios of water rate to total tax revenue and to total
revenue. The average amount of water rate of Rs. 10.60 lakhs for the six years of the
all GPs in Gangavathi taluk is higher than the average of Rs. 9.95 lakhs of the all GPs
in Yelburga taluk. However, the average amount of (9.95 lakhs ÷ 33 GPs) Rs. 0.30
lakhs of each GP in Yelburga taluk is greater than that of the average of (10.60 lakhs
÷ 38 GPs) Rs. 0.28 lakhs of each GP in Gangavathi taluk. As for the average amount
is concered the GPs in the both talukas exhibits more or less same position. The
average ratios of water rate to total tax revenue of the GPs in Gangavathi and
Yelburga talukas are 13.46% and 30.11% respectively and the average ratios of water
rate to total revenue are 2.04% and 2.25% respectively. From the table it is evident
that the contribution of water rate to total tax revenue and to total revenue in the GPs
of Yelburga taluk is better than the GPs of Gangavathi taluk. The share of water rate
in total tax revenue of the GPs in the both the talukas approximately stands at 30%

181
and even less. Therefore, inference has drawn in accordance with the fourth
hypothesis that among the sources of taxes, the water rate is the second major source
for the GPs in the both the talukas.
Graph-6.12
Income of the GPs from Water Rate (Rs. in Lakhs)
The graph-6.12 shows that highest and lowest yields from the water rate are in
the years of 2006-07 and 2002-03 respectively in the GPs of Gangavathi taluk; while
the highest and lowest yields are in the years of 2007-08 and 2005-06 respectively in
the GPs of Yelburga taluk. The collection of the water rate in the GPs of the former
taluk crossed the average line (Rs. 10.60 lakhs) for two years i.e., 2004-05 and 2006-
07; in case of the GPs in the latter taluk it has crossed the average line (Rs. 9.95 lakhs)
for the last two years. The average line of the GPs in Gangavathi taluk is just higher
than the GPs in Yelburga taluk.
The graph-6.13 reveals the ratios of water rate to total tax revenue of the GPs
in the both talukas. The ratios of the GPs in Gangavathi taluk crossed the average line
(13.46%) for three years i.e., 2004-05, 2006-07, and 2007-08; whereas in case of the
0
2
4
6
8
10
12
14
16
18
20
2002-03 2003-04 2004-05 2005-06 2006-07 2007-08 Average
Rs.
in
La
kh
s
Year
GPs of Gangavathi Taluk GPs of Yelburga Taluk
Amount Amount
Average Line Average Line

182
GPs in Yelburga taluk the ratios crossed the average line (30.11%) for four years
i.e., 2002-03, 2003-04, 2006-07 and 2007-08. From the graph, it is evident that the
contribution of water rate to total tax revenue of the GPs in Yelburga taluk is better
than the GPs in Gangavathi taluk. Therefore, the revenue component of water rate
made significant contribution in the GPs of Yelburga taluk during the study period.
Graph-6.13
Water Rate of the GPs % to Total Tax Revenue
6.14 The Other Taxes:
For the present study, low revenue yielding taxes are classified as other taxes
viz., entertainment tax, vehicle tax, advertisement and hoarding tax, tax on factory.
6.14 (i) Tax on Entertainment Other than Cinematograph Shows:
6.14. i (a) Interpretation:
(1) 'Entertainment' means and includes a drama, exhibition, amusements, games or
sports to which persons are entertained on payment for admission;
(2) ‘Payment for admission’ means and includes-
(a) Any payment for seats or other accommodation, a place of entertainment; and
0
5
10
15
20
25
30
35
40
45
50
55
60
2002-03 2003-04 2004-05 2005-06 2006-07 2007-08 Average
Per
cen
tag
e
Year
GPs of Gangavathi Taluk GPs of Yelburga Taluk
Percentage Percentage
Average Line Average Line

183
(b) Any payment for a programme or synopsis of an entertainment;
(3) 'Proprietor' in relation to any entertainment includes owner, manager, agent or any
other person responsible for the management thereof.
6.14. i (b) Exemptions:
No tax on entertainment shall be levied in respect of an entertainment-
(a) Which is not open to the general public.
(b) The proceeds of which are intended to be utilised for the public, educational,
cultural or charitable purposes.
6.14. i (c) Levy and Recovery of Entertainment Tax:
The tax on entertainment shall be levied before the beginning of an
entertainment and shall be recovered from the proprietor.
6.14. i (d) Refund of Entertainment Tax:
(1) If after the payment of tax on entertainment the entertainment is not held on
account of any extenuating or unavoidable circumstances the amount of tax paid
shall be refunded to the proprietor.
(2) Grama Panchayat shall, unless there are reasons to believe that a claim for refund
under KPR (Panchayat Taxes and Fees) sub-rule (1) is not admissible sanction the
refunds of tax if- (i) an application in writing is made to the Adhyaksha within
three days from the date fixed for the entertainment; and (ii) The receipt for
having paid the entertainment tax is produced.
6.14 (ii) Tax on Vehicles Other than Motor Vehicles:
6.14. ii (a) Exemptions:
No tax under chapter VI of the KPR Act shall be levied on-
(a) Vehicles belonging to Central or State Government;
(b) Vehicles kept solely for sale by vehicle makers and dealers;

184
(c) Vehicles which are under repairs or kept at a vehicle maker for a period not
exceeding six months;
(d) Vehicles belonging to the Grama Panchayat, Taluk Panchayat or Zilla Panchayat.
6.14. ii (b) Levy of Vehicle Tax:
(l) Grama Panchayat may levy vehicle tax on the person having possession, custody
or control of any vehicle specified in Schedule IV to the Act, if such vehicle has
been kept or used within the Panchayat area for an aggregate period of not less
than 120 days in a year. Provided that no tax shall be levied on a vehicle for any
year-
(a) If full tax for that year in respect of such vehicles has already been paid to the
Grama Panchayat by some other person; or
(b) If the tax equal to or in excess of the amount payable in the Panchayat area in
respect of such vehicle for that year has already been paid to any other Grama
Panchayat.
(2) If during the middle of the year any person having possession, custody or control
of any vehicle liable to tax replaces such vehicle being incapable of use, by another
vehicle of the same description, no tax shall be levied again on the replacing
vehicle for the rest of the year.
6.14 (iii) Tax on Factory:
The tax on factory under Section 202 of KPR Act may be levied if a factory or
industry owner provides sanitary and other ameneties for buildings and land used by
the industry, the GP may in lieu of taxes, rates, fees receive such amount annually as
may be agreed between the GP and the factory / industry owner. If such agreement
cannot be reached, the CEO shall determine the amount payable by such owner.
Alignment of other taxes with total tax revenue and total revenue is presented
for the all GPs of the sample talukas in the table-6.15.

185
Table-6.15: Income of the GPs from Other Taxes
Year
GPs of Gangavathi Taluk GPs of Yelburga Taluk
Amount (Rs. in Lakhs)
% to
Total Tax
Revenue
% to
Total
Revenue
Amount (Rs. in Lakhs)
% to
Total Tax
Revenue
% to
Total
Revenue
2002-03 7.45 15.89 2.31 2.42 11.66 1.15
2003-04 1.50 2.10 0.58 NA - -
2004-05 NA - - 15.95 34.64 4.72
2005-06 0.66 0.76 0.10 6.18 12.24 0.99
2006-07 NA - - NA - -
2007-08 NA - - 2.33 3.92 0.19
Average 1.60 3.13 0.49 4.48 10.41 1.17
Source: 1. Office of the Local Audit Circle, Koppal.
2. Offices of the GPs in Gangavathi & Yelburga Talukas.
Note: NA - Data Not Available.
The above table shows the amount of other taxes collected by the all GPs in
the both talukas and the ratios of other taxes to total tax revenue and to total revenue.
The average amount of other taxes of Rs. 4.48 lakhs of the all GPs in Yelburga taluk
is much higher than the average of Rs. 1.60 lakhs of the all GPs in Gangavathi taluk.
The average amount of (Rs. 4.48 lakhs ÷ 33 GPs) Rs. 0.14 lakhs of each the GP in
Yelburga taluk is much greater than that of the average of (1.60 lakhs ÷ 38 GPs) Rs.
0.04 lakhs of the each GP in Gangavathi taluk. The average ratios of other taxes to
total tax revenue of the GPs in Gangavathi and Yelburga talukas are 3.13% and
10.41% respectively; the average ratios of other taxes to total revenue are 0.49% and
1.17% respectively. From the table it is evident that the contribution of other taxes to
total tax and to total revenue in the GPs of Yelburga taluk is better than the GPs of
Gangavathi taluk. The share of other taxes in total tax revenue of the GPs in the both
talukas approximately stands at 10% and even less. Therefore, inference has drawn
that among the sources of taxes, other taxes did not fetch adequate income for the GPs
in the sample talukas.

186
Graph-6.14
Income of the GPs from Other Taxes (Rs. in Lakhs)
As shown in the above graph-6.14 the highest and lowest yields from the other
taxes are in the years of 2002-03 and 2005-06 respectively in the GPs of Gangavathi
taluk; while the highest and lowest yields are in the years of 2004-05 and 2007-08
respectively in the GPs of Yelburga taluk. The collection of other taxes in the GPs of
the former taluk crossed the average line (Rs. 1.60 lakhs) only in the year of 2002-03;
in case of the GPs in the latter taluk, it has crossed the average line (Rs. 4.48 lakhs) in
the years of 2004-05 and 2005-06. The average line of the GPs in Yelburga taluk is
higher than the GPs in Gangavathi taluk.
The graph-6.15 reveals the ratios of other taxes to total tax revenue of the GPs
in the both talukas. The ratio of the GPs in Gangavathi taluk has crossed the average
line (3.13%) for 2002-03; whereas in case of the GPs in Yelburga taluk the ratios
crossed the average line (10.41%) for the three years i.e., 2002-03, 2004-05 and 2005-
06. From the graph, it is obvious that the contribution of other taxes to total tax
revenue in the GPs of Yelburga taluk is much better than the GPs of Gangavathi taluk.
0
2
4
6
8
10
12
14
16
18
2002-03 2003-04 2004-05 2005-06 2007-08 Average
Rs.
in
La
kh
s
Year
GPs of Gangavathi Taluk GPs of Yelburga Taluk
Amount Amount
Average Line Average Line

187
Graph-6.15
Other Taxes of the GPs % to Total Tax Revenue
6.15 Fees Collected by Grama Panchayats:
Fees are charged by the government to meet the cost of administrative services
rendered. To quote Seligman, “A fee is a payment to defray the cost of each recurring
service undertaken by the government, primarily in the public intrest, but conferring a
measurable advantage to the payer”. The amount of fee is based on the cost of
rendering the service. Quid pro quo is present in a fee. According to statutory powers
GP may charge following fees;
1) Pilgrim fee on persons attending jatras, festivals where necessary arrangements for
water supply, health and sanitation are made by GP.
2) Market fee for sale of goods in market place.
3) Fee on registration of cattle brought for sale in market place.
4) Fee on buses, taxies and auto-stands.
5) Fee on grazing cattle in grazing lands.
0
3
6
9
12
15
18
21
24
27
30
33
36
2002-03 2003-04 2004-05 2005-06 2006-07 2007-08 Average
Per
cen
tag
e
Year
GPs of Gangavathi Taluk GPs of Yelburga Taluk
Percentage Percentage
Average Line Average Line

188
6) Licence fees;
(a) Licence fees for construction of buildings / extension of buildings (section 64 of
KPR Act).
(b) Licence fees for establishment of factory, workshop or work place etc., (section
66 of KPR Act).
(c) Licence fees for permitting offensive or dangerous trade like hotels, restaurant,
meat shop, bakery, boarding house, lodging house etc., (section 68 of KPR
Act).
(d) Licence fees from shops i.e., commercial establishments (section 69 of KPR
Act).
7) Development charges from private layouts.
8) Notice fees.
9) Warrant fees (distraint warrant and writ of demand).
10) Fines.
11) Local Cesses: Section 204 provides for levy of local cess on the land revenue by
the government whose proceeds are to be passed on to the GP of that area.
12) Miscellaneous receipts from fees.
In the following presentation and analysis, an attempt is made to align fees
collected with internal non-tax revenue, total non-tax revenue and total revenue for
the all GPs of the both sample talukas.
The table-6.16 reveals the amount of fees and the ratios of fees to total internal
non-tax, to total non-tax and to total revenue of the all GPs in the both talukas. The
average amount of fees of Rs. 9.11 lakhs of the all GPs in Yelburga taluk for the six
years is higher than the average of Rs. 7.57 lakhs of the all GPs in Gangavathi taluk.
The average amount of (9.11 lakhs ÷ 33 GPs) Rs. 0.28 lakhs of the each GP in

189
Yelburga taluk is greater than the average of (7.57 lakhs ÷ 38 GPs) Rs. 0.20 lakhs of
the each GP in Gangavathi taluk. The average ratios of fees to total internal non-tax
revenue of the GPs in Gangavathi and Yelburga talukas are 65.91% and 80.26%
respectively; the average ratios of fees to total non-tax revenue are 1.70% and 2.50%
respectively; the average ratios of fees to total revenue are 1.43% and 2.27%
respectively. From the table it is evident that the contribution of fees to these three
ratios in the GPs of Yelburga taluk is better than that of the GPs of Gangavathi taluk.
The share of fees in total non-tax revenue of the GPs in the both talukas
approximately stands at 3% and even less. Therefore, inference has drawn that among
the sources of non-taxes, fees did not generate adequate income for the GPs in the
sample talukas. However, the share of fees in internal non-tax revenue of the GPs in
the both talukas approximately stands at 65% and even more. Accordingly, among the
sources of internal non-taxes, fees are the first major source for the GPs.
Table-6.16: Income from Fees Collected by the GPs
Year
GPs of Gangavathi Taluk GPs of Yelburga Taluk
Am
ou
nt
(Rs.
in
La
kh
s)
%
to T
ota
l
Inte
rna
l
No
n-T
ax
Rev
enu
e
% t
o T
ota
l
No
n-T
ax
Rev
enu
e
% t
o
To
tal
Rev
enu
e
Am
ou
nt
(Rs.
in
La
kh
s)
%
to T
ota
l
Inte
rna
l
No
n-T
ax
Rev
enu
e
%
to T
ota
l
No
n-T
ax
Rev
enu
e
%
to
To
tal
Rev
enu
e
2002-03 3.33 40.86 1.21 1.03 3.13 68.34 1.66 1.49
2003-04 4.29 66.61 2.27 1.65 10.82 92.40 5.56 5.18
2004-05 11.50 78.71 2.39 2.04 13.63 88.11 4.67 4.03
2005-06 8.01 64.08 1.46 1.26 8.23 82.46 1.44 1.32
2006-07 6.12 64.63 0.83 0.72 3.62 70.57 0.36 0.35
2007-08 12.14 80.56 2.07 1.85 15.26 79.69 1.30 1.23
Average 7.57 65.91 1.70 1.43 9.11 80.26 2.50 2.27
Source: 1. Office of the Local Audit Circle, Koppal.
2. Offices of the GPs in Gangavathi & Yelburga Talukas.

190
Graph-6.16
Income from Fees Collected by the GPs (Rs. in Lakhs)
The above graph-6.16 shows that highest and lowest income from the fees are
in the years of 2007-08 and 2002-03 respectively in the GPs of the both talukas. The
amount of fees in the GPs of Gangavathi taluk crossed the average line (Rs. 7.57
lakhs) for the three years i.e., 2004-05, 2005-06 and 2007-08; in respect of the GPs in
Yelburga taluk it has crossed the average line (Rs. 9.11 lakhs) for the three years i.e.,
2003-04, 2004-05 and 2007-08. The average line of the GPs in Yelburga taluk is
higher than that of the GPs in Gangavathi taluk.
The graph-6.17 reveals the ratios of fees to total non-tax revenue of the GPs.
The ratios in the GPs of Gangavathi taluk crossed the average line (1.70%) for the
three years i.e., 2003-04, 2004-05 and 2007-08; while in case of the GPs in Yelburga
taluk the ratios crossed the average line (2.50%) for 2003-04 and 2004-05. From the
graph, it is evident that the contribution of fees to total non-tax revenue in the GPs of
Yelburga taluk is better than that of the GPs in Gangavathi Taluk.
0 1 2 3 4 5 6 7 8 9
10 11 12 13 14 15 16
2002-03 2003-04 2004-05 2005-06 2006-07 2007-08 Average
Rs.
in
La
kh
s
Year
GPs of Gangavathi Taluk GPs of Yelburga Taluk
Amount Amount
Average Line Average Line

191
Graph-6.17
Fees Collected by the GPs % to Total Non-Tax Revenue
6.16 Income from Fixed Property of Grama Panchayats:
Income from GP property includes rent from land, rent from building, sale of
land (including sale value of residential and commercial sites), sale of buildings,
income from lands (sale of fruits, grass and other minor products, sale of wood, fuel,
fallen trees), income from cattle pounds, sale of manure and street refuses like dust,
dirt, dung etc.
In the following presentation and analysis, an attempt is made to align income
from fixed property with internal non-tax revenue, total non-tax revenue and total
revenue for the all GPs of the both sample talukas.
The table-6.17 reveals the amount of income from fixed property and its ratios
to total internal non-tax, to total non-tax and to total revenue of the all GPs in the both
talukas. The average amount (Rs. 3.47 lakhs) of income from fixed property of the all
GPs in Gangavathi taluk for the six years is much greater than the average amount
0
1
2
3
4
5
6
2002-03 2003-04 2004-05 2005-06 2006-07 2007-08 Average
Per
cen
tag
e
Year
GPs of Gangavathi Taluk GPs of Yelburga Taluk
Percentage Percentage
Average Line Average Line
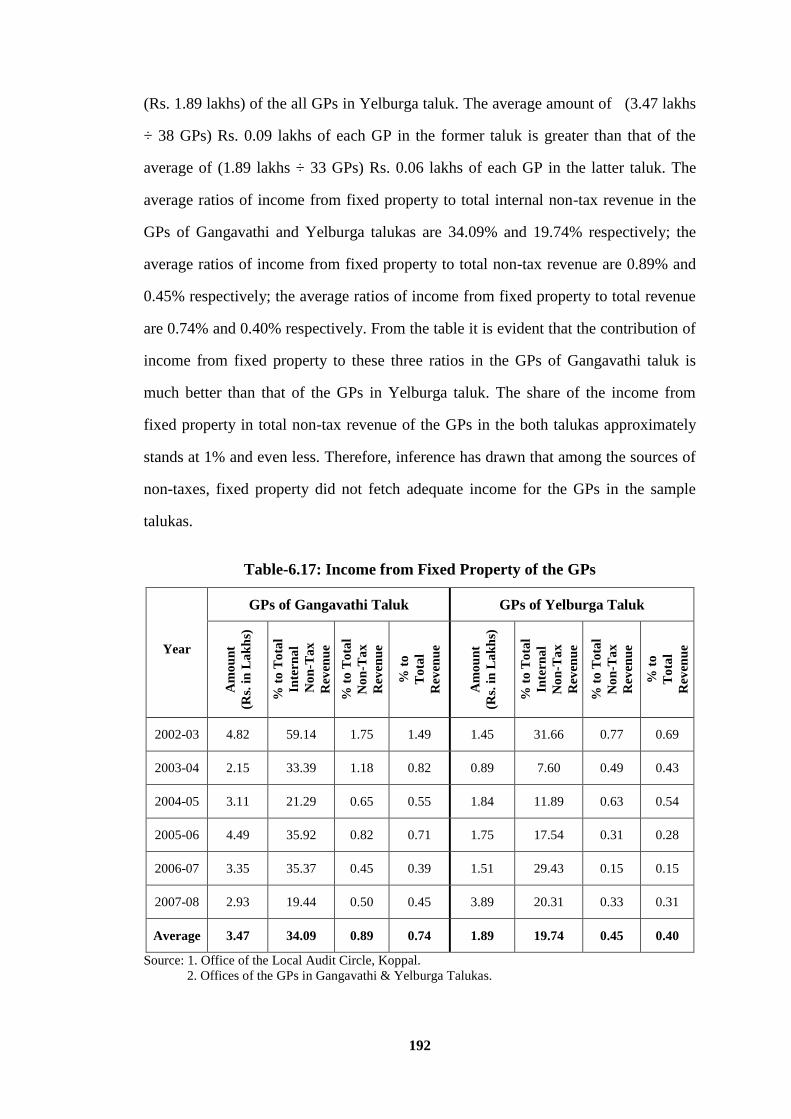
192
(Rs. 1.89 lakhs) of the all GPs in Yelburga taluk. The average amount of (3.47 lakhs
÷ 38 GPs) Rs. 0.09 lakhs of each GP in the former taluk is greater than that of the
average of (1.89 lakhs ÷ 33 GPs) Rs. 0.06 lakhs of each GP in the latter taluk. The
average ratios of income from fixed property to total internal non-tax revenue in the
GPs of Gangavathi and Yelburga talukas are 34.09% and 19.74% respectively; the
average ratios of income from fixed property to total non-tax revenue are 0.89% and
0.45% respectively; the average ratios of income from fixed property to total revenue
are 0.74% and 0.40% respectively. From the table it is evident that the contribution of
income from fixed property to these three ratios in the GPs of Gangavathi taluk is
much better than that of the GPs in Yelburga taluk. The share of the income from
fixed property in total non-tax revenue of the GPs in the both talukas approximately
stands at 1% and even less. Therefore, inference has drawn that among the sources of
non-taxes, fixed property did not fetch adequate income for the GPs in the sample
talukas.
Table-6.17: Income from Fixed Property of the GPs
Year
GPs of Gangavathi Taluk GPs of Yelburga Taluk
Am
ou
nt
(Rs.
in
La
kh
s)
% t
o T
ota
l
Inte
rna
l
No
n-T
ax
Rev
enu
e
% t
o T
ota
l
No
n-T
ax
Rev
enu
e
% t
o
To
tal
Rev
enu
e
Am
ou
nt
(Rs.
in
La
kh
s)
% t
o T
ota
l
Inte
rna
l
No
n-T
ax
Rev
enu
e
% t
o T
ota
l
No
n-T
ax
Rev
enu
e
% t
o
To
tal
Rev
enu
e
2002-03 4.82 59.14 1.75 1.49 1.45 31.66 0.77 0.69
2003-04 2.15 33.39 1.18 0.82 0.89 7.60 0.49 0.43
2004-05 3.11 21.29 0.65 0.55 1.84 11.89 0.63 0.54
2005-06 4.49 35.92 0.82 0.71 1.75 17.54 0.31 0.28
2006-07 3.35 35.37 0.45 0.39 1.51 29.43 0.15 0.15
2007-08 2.93 19.44 0.50 0.45 3.89 20.31 0.33 0.31
Average 3.47 34.09 0.89 0.74 1.89 19.74 0.45 0.40
Source: 1. Office of the Local Audit Circle, Koppal.
2. Offices of the GPs in Gangavathi & Yelburga Talukas.

193
Graph 6.18
Income from Fixed Property of the GPs (Rs. in Lakhs)
The above graph-6.18 shows that highest and lowest income from fixed
property are in the years of 2002-03 and 2003-04 respectively in the GPs of
Gangavathi taluk; whereas the highest and lowest income from fixed property are in
the years of 2007-08 and 2003-04 respectively in the GPs of Yelburga taluk. The
income in the GPs of the former taluk crossed the average line (Rs. 3.47 lakhs) for
2002-03 and 2005-06; in case of the GPs in the latter taluk it has crossed the average
line (Rs. 1.89 lakhs) for 2007-08. The average line of the GPs in Gangavathi taluk is
much higher than that of the GPs in Yelburga taluk.
As presented in the graph-6.19 the ratios of income from fixed property to
total non-tax in the GPs of Gangavathi taluk are crossed the average line (0.89%) for
the first two years; while the ratios in the GPs of Yelburga taluk are crossed the
average line (0.45%) for the first three years. From the graph, it is obvious that the
contribution of income from fixed property to total non-tax revenue in the GPs of
Gangavathi taluk is much better than the GPs of Yelburga taluk.
0
1
2
3
4
5
2002-03 2003-04 2004-05 2005-06 2006-07 2007-08 Average
Rs.
in
La
kh
s
Year
GPs of Gangavathi Taluk GPs of Yelburga Taluk
Amount Amount
Average Line Average Line

194
Graph 6.19
Income from Fixed Property of the GPs % to Total Non-Tax Revenue
6.17 Grants from Karnataka State Government to Grama Panchayats:
Section 206 of the KPR Act states that the state government shall make a grant
of Rs. 1.00 lakhs annually to each GP on condition that it be utilised for meeting costs
of street lights, electricity charges, maintenance of water supply schemes, sanitation
and other welfare activities. No part of this grant shall be spent towards establishment
expenses not related to the previously mentioned purposes. The grants are passed
through the ZP to the GPs. The ZPs deduct the electricity charges payable by the GPs
to the KPTCL. From 1994 to 1998, each GP received Rs. 1.00 lakhs out of which the
electricity charges were deducted by the ZPs and the balance amount was transferred.
The statutory grant has been revised to Rs. 2.00 lakhs per annum in the year 1999
through an order by the government. Again, by an order an additional grant of Rs. 1.5
lakhs (development grant) was given to each GP from the year 2001. It must also be
mentioned that often, even the entitled grants were not given to GPs. Although in
principle, until 2001-02, each GP was supposed to receive Rs. 3.5 lakhs, in actual
practice, due to resource constraints, the state government gave much less than this
0
0.2
0.4
0.6
0.8
1
1.2
1.4
1.6
1.8
2
2002-03 2003-04 2004-05 2005-06 2006-07 2007-08 Average
Per
cen
tag
e
Year
GPs of Gangavathi Taluk GPs of Yelburga Taluk
Percentage Percentage
Average Line Average Line

195
amount. This development grant has further been enhanced to Rs. 3.00 lakhs in the
financial year 2003-04, Rs. 4.00 lakhs in 2005-06, Rs. 5.00 lakhs in 2006-07 and Rs.
6.00 lakhs in 2008-09. However, in the recent budget speech for 2011-12, the Chief
Minister has announced that each GP henceforth will be given a lump sum grant of
Rs. 8.00 lakhs per year.
According to Section 207 of the KPR Act, the government shall make the
establishment grant to every TP and ZP to cover the expenses of establishment at such
scale as may be determined by it. Section 208 of the Act authorises the government to
make discretionary grant to GPs, TPs and ZPs for such purposes and on such terms
and conditions as may be decided by it.
The table-6.18 reveals the amount of grant transferred from GOK to the GPs
and its ratios to total external non-tax, to total non-tax and to total revenue of the GPs
in the both talukas. The average amount of the grant of Rs. 123.89 lakhs transferred to
the all 33 GPs in Yelburga taluk for the six years is greater than that of the Rs. 106.22
lakhs to the all 38 GPs in Gangavathi taluk. The average amount of (Rs. 123.89 lakhs
÷ 33 GPs) Rs. 3.75 lakhs to each GP in Yelburga taluk is greater than that of (Rs.
106.22 lakhs ÷ 38 GPs) Rs. 2.80 lakhs to each GP in Gangavathi taluk. The average
ratios of grants from GOK to total external non-tax revenue of the GPs in Gangavathi
and Yelburga talukas are 25.18% and 26.14% respectively; the average ratios of
grants from GOK to total non-tax revenue are 24.53% and 25.30% respectively; the
average ratios of grants from GOK to total revenue are 20.33% and 23.34%
respectively. From the table it is evident that the contribution of grants from GOK to
these three ratios in the GPs of Yelburga taluk is better than the GPs of Gangavathi
taluk. The share of grants from GOK in total non-tax revenue approximately stands at
25% and the share in total revenue approximately stands at 20% and even more.
Therefore, inference has drawn in accordance with the fifth hypothesis that the grants
from GOK are not only the second major sources of external non-taxes, but also total
revenues of the GPs in the both talukas.

196
Table-6.18
Grants from GOK to the GPs
Year
GPs of Gangavathi Taluk GPs of Yelburga Taluk
Am
ou
nt
(Rs.
in
La
kh
s)
% t
o T
ota
l
Ex
tern
al
No
n-T
ax
Rev
enu
e
% t
o T
ota
l
No
n-T
ax
Rev
enu
e
% t
o
To
tal
Rev
enu
e
Am
ou
nt
(Rs.
in
La
kh
s)
% t
o T
ota
l
Ex
tern
al
No
n-T
ax
Rev
enu
e
% t
o T
ota
l
No
n-T
ax
Rev
enu
e
% t
o
To
tal
Rev
enu
e
2002-03 82.49 30.81 29.90 25.56 60.10 32.59 31.80 28.66
2003-04 70.65 38.63 37.32 27.10 76.67 41.89 39.37 36.77
2004-05 49.74 10.68 10.35 8.84 40.60 14.68 13.90 11.93
2005-06 191.21 35.62 34.81 30.08 179.47 31.86 31.30 28.86
2006-07 192.50 26.47 26.13 22.67 167.76 16.91 16.82 16.17
2007-08 50.75 8.88 8.66 7.74 218.72 18.90 18.59 17.70
Average 106.22 25.18 24.53 20.33 123.89 26.14 25.30 23.34
Source: 1. Office of the Local Audit Circle, Koppal.
2. Offices of the GPs in Gangavathi & Yelburga Talukas.
Graph-6.20
Grants from GOK to the GPs (Rs. in Lakhs)
0
25
50
75
100
125
150
175
200
225
2002-03 2003-04 2004-05 2005-06 2006-07 2007-08 Average
Rs.
in
Lak
hs
Year
GPs of Gangavathi Taluk GPs of Yelburga Taluk
Amount Amount
Average Line Average Line

197
The graph-6.20 shows that highest and lowest income from the grants are in
the years of 2006-07 and 2004-05 respectively in the GPs of Gangavathi taluk;
whereas the highest and lowest income from the grants are in the years of 2007-08
and 2004-05 respectively in the GPs of Yelburga taluk. The income from the grants in
the GPs of the former taluk crossed the average line (Rs. 106.22 lakhs) for 2005-06
and 2006-07; in case of the GPs in the latter taluk it has crossed the average line (Rs.
123.89 lakhs) for last three years. The average line of the GPs in Yelburga taluk is
higher than that of the GPs in Gangavathi taluk.
Graph-6.21
Grants from GOK to the GPs % to Total Non-Tax Revenue
As shown in the above graph-6.21 the ratios of the grants from GOK to total
non-tax revenue in the GPs of Gangavathi taluk crossed the average line (24.53%) for
four years i.e., 2002-03, 2003-04, 2005-06 and 2006-07; while in case of the GPs in
Yelburga taluk the ratios crossed the average line (25.30%) for three years i.e., 2002-
03, 2003-04, and 2005-06. As far the contribution of the grants from GOK to total
non-tax revenue is concerned the GPs in the both talukas exhibits more or less same
position.
0
5
10
15
20
25
30
35
40
2002-03 2003-04 2004-05 2005-06 2006-07 2007-08 Average
Per
cen
tage
Year
GPs of Gangavathi Taluk GPs of Yelburga Taluk
Percentage Percentage
Average Line Average Line

198
6.18 Grants from Central Finance Commissions to Grama Panchayats:
The state government also gets transfers from the central government on the
recommendation of the Central Finance Commission for strengthening the local
bodies. The grants are given to the state government and the latter passes it on to the
GPs based on their population. Subsequent to the 73rd amendment to the Indian
Constitution, the Central Finance Commission appointed by the President of India
under Article 280 of the Constitution requires it to recommend, inter alia,
“… measures to augment the consolidated fund of the state to supplement the
resources of panchayats in the states based on the recommendation of the SFC”. In
doing this, the Commission is required to consider the recommendations made by the
SFC and if these are not available (either because state has not appointed the SFC or
the latter has not submitted the report) the Commission will have to make its own
assessment about the ways and means to augment the consolidated fund of the state to
supplement the resources of panchayats. The 10th, 11th and 12th Finance
Commissions made the recommendations to this effect. Thus, the recommendation to
augment the consolidated fund of the state by the 11th and 12th Finance Commissions
entitle the Karnataka state to receive Rs. 78.72 crores (for the period 2000-05) and
Rs. 888.00 crores (for the period 2005-10) respectively. This is provided as grant to
the panchayats by the state government.
According to the recommendation of the Tenth Finance Commission, GPs are
expected to contribute 50 per cent of the grant received as a matching amount (now
reduced to 25 per cent by the 11th Finance Commission). However, this does not
result in any additional resource mobilisation effort as the GPs merely divert existing
revenues to make up the “matching contribution”. The amount of the grant received
by each GP is not very significant. The money receivable by each GP during the
period 2000-05 on the recommendation of 11th Finance Commission works to Rs.
1.27 lakhs or about Rs. 25,000 each year. The fund received under this head has to be
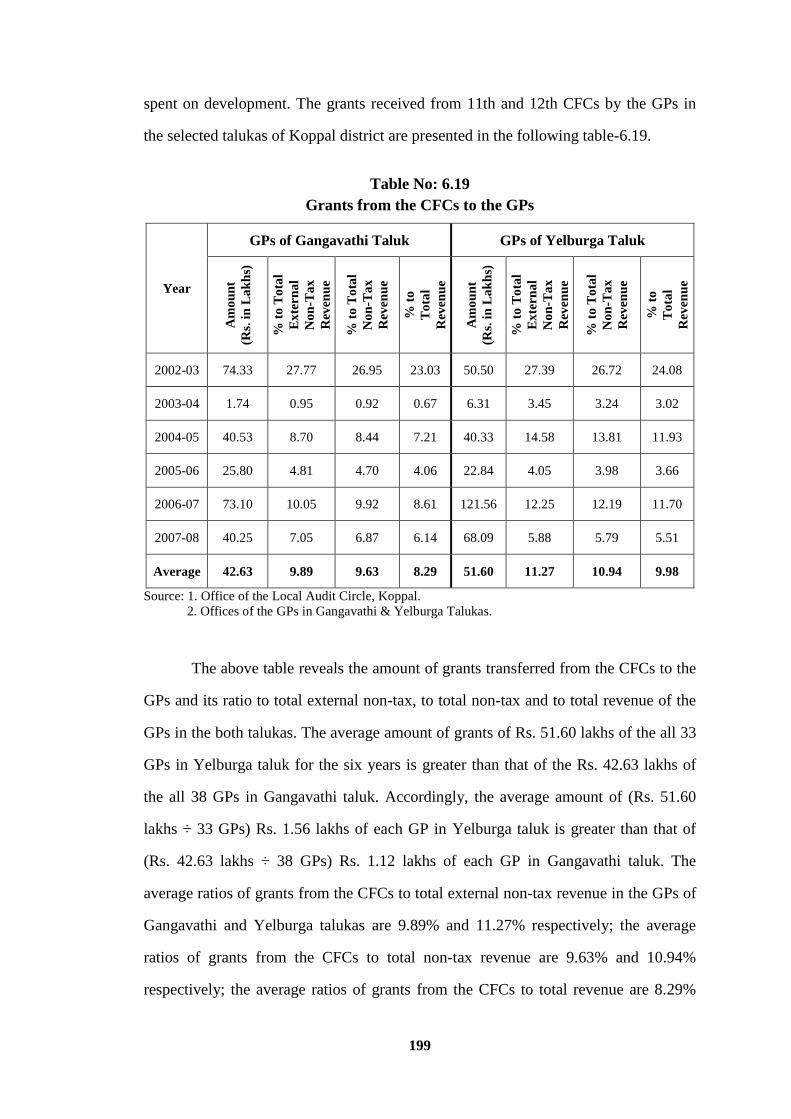
199
spent on development. The grants received from 11th and 12th CFCs by the GPs in
the selected talukas of Koppal district are presented in the following table-6.19.
Table No: 6.19
Grants from the CFCs to the GPs
Year
GPs of Gangavathi Taluk GPs of Yelburga Taluk A
mo
un
t
(Rs.
in
La
kh
s)
% t
o T
ota
l
Ex
tern
al
No
n-T
ax
Rev
enu
e
% t
o T
ota
l
No
n-T
ax
Rev
enu
e
% t
o
To
tal
Rev
enu
e
Am
ou
nt
(Rs.
in
La
kh
s)
% t
o T
ota
l
Ex
tern
al
No
n-T
ax
Rev
enu
e
% t
o T
ota
l
No
n-T
ax
Rev
enu
e
% t
o
To
tal
Rev
enu
e
2002-03 74.33 27.77 26.95 23.03 50.50 27.39 26.72 24.08
2003-04 1.74 0.95 0.92 0.67 6.31 3.45 3.24 3.02
2004-05 40.53 8.70 8.44 7.21 40.33 14.58 13.81 11.93
2005-06 25.80 4.81 4.70 4.06 22.84 4.05 3.98 3.66
2006-07 73.10 10.05 9.92 8.61 121.56 12.25 12.19 11.70
2007-08 40.25 7.05 6.87 6.14 68.09 5.88 5.79 5.51
Average 42.63 9.89 9.63 8.29 51.60 11.27 10.94 9.98
Source: 1. Office of the Local Audit Circle, Koppal.
2. Offices of the GPs in Gangavathi & Yelburga Talukas.
The above table reveals the amount of grants transferred from the CFCs to the
GPs and its ratio to total external non-tax, to total non-tax and to total revenue of the
GPs in the both talukas. The average amount of grants of Rs. 51.60 lakhs of the all 33
GPs in Yelburga taluk for the six years is greater than that of the Rs. 42.63 lakhs of
the all 38 GPs in Gangavathi taluk. Accordingly, the average amount of (Rs. 51.60
lakhs ÷ 33 GPs) Rs. 1.56 lakhs of each GP in Yelburga taluk is greater than that of
(Rs. 42.63 lakhs ÷ 38 GPs) Rs. 1.12 lakhs of each GP in Gangavathi taluk. The
average ratios of grants from the CFCs to total external non-tax revenue in the GPs of
Gangavathi and Yelburga talukas are 9.89% and 11.27% respectively; the average
ratios of grants from the CFCs to total non-tax revenue are 9.63% and 10.94%
respectively; the average ratios of grants from the CFCs to total revenue are 8.29%

200
and 9.98% respectively. From the table it is obvious that the contribution of the CFCs
grants to these three ratios in the GPs of Yelburga taluk is better than the GPs of
Gangavathi taluk. The share of the CFCs grants in total non-tax revenue
approximately stands at 11% and even less; the share of the CFCs grants in total
revenue approximately stands at 10% and even less. Therefore, inference has drawn in
accordance with the fifth hypothesis that the grants from the CFCs are not only the
third major sources of external non-taxes, but also total revenues of the GPs in the
both talukas.
Graph 6.22
Grants from the CFCs to the GPs (Rs. in Lakhs)
The above graph-6.22 exhibits that highest and lowest income from the CFCs
grants are in the years of 2002-03 and 2003-04 respectively in the GPs of Gangavathi
taluk; whereas the highest and lowest income from the grants are in the years of
2006-07 and 2003-04 respectively in the GPs of Yelburga taluk. The income from the
grants in the GPs of the former taluk crossed the average line (Rs. 42.63 lakhs) for
2002-03 and 2006-07; in respect of the GPs in the latter taluk the grants crossed the
0
10
20
30
40
50
60
70
80
90
100
110
120
130
2002-03 2003-04 2004-05 2005-06 2006-07 2007-08 Average
Year
GPs of Gangavathi Taluk GPs of Yelburga Taluk
Amount Amount
Average Line Average Line
Rs.
in
Lak
hs

201
average line (Rs. 51.60 lakhs) for the last two years. The average line of the GPs in
Yelburga taluk is higher than that of the GPs in Gangavathi taluk.
Graph 6.23
Grants from the CFCs to the GPs % to Total Non-Tax Revenue
As shown in the following graph-6.23 the ratios of the CFCs grants to total
non-tax revenue in the GPs of Gangavathi taluk crossed the average line (9.63 %) for
2002-03 and 2006-07; while in the GPs of Yelburga taluk the grants crossed the
average line (10.94%) for 2002-03, 2004-05 and 2006-07. From the graph, it is
evident that the contribution of the CFCs grants to total non-tax revenue in the GPs of
Yelburga taluk is better than the GPs of Gangavathi taluk.
6.19 Grants from Centrally and / or State Sponsored Schemes to GPs:
In addition to grants from GOK and CFC, GPs also receive specific purpose
transfers for the implementation of centrally and / or state sponsored schemes at grass
root level. The government of India released funds for this and the state government
0
2
4
6
8
10
12
14
16
18
20
22
24
26
28
2002-03 2003-04 2004-05 2005-06 2006-07 2007-08 Average
Per
cen
tag
e
Year
GPs of Gangavathi Taluk GPs of Yelburga Taluk
Percentage Percentage
Average Line Average Line

202
also released its matching shares. The most important specific purpose transfer is for
the sponsored schemes on poverty alleviation namely;
i) Sampoorna Grama Rozgar Yojana or SGRY (Comprehensive Village Employment
Scheme). The two separate centrally sponsored programs initiated earlier – the
Jawahar Rozgar Yojana (JRY) / Jawhar Grama Samriddi Yojana (JGSY), and
Employment Assurance Scheme (EAS) were consolidated into SGRY. This is a
shared cost program in which central government contributes 87.5 per cent of the
cost and the state government contributes 12.5 per cent. The central government’s
contribution is made in cash to the tune of 37.5 per cent and the remaining 50 per
cent contribution is by way of food grains.
ii) National Rural Employment Guarantee Programme or NREGP in which every
household in rural India will have a right to at least 100 days of guaranteed
employment every year for at least one adult member. This is also a shared cost
program on 80:20 between the centre and states.
The table-6.20 brings out the position of grants received by the all GPs in the
selected talukas of Koppal district during the study period for the implementation of
the centrally and / or state sponsored schemes.
The table-6.20 reveals the amount of grants from centrally and / or state
sponsored schemes to the GPs and its ratio to total external non-tax, to total non-tax
and to total revenue of the GPs in the both talukas. The average amount of grants
from the sponsored schemes of Rs. 383.95 lakhs of the all 33 GPs in Yelburga taluk is
greater than that of the Rs. 309.73 lakhs of the all 38 GPs in Gangavathi taluk.
Consequently, the average amount of (Rs. 383.95 lakhs ÷ 33 GPs) Rs. 11.63 lakhs of
each GP in Yelburga taluk is greater than that of (Rs. 309.73 lakhs ÷ 38 GPs) Rs. 8.15
lakhs of each GP in Gangavathi taluk. The average ratios of grants from the sponsored
schemes to total external non-tax revenue of the GPs in Gangavathi and Yelburga
talukas are 64.93% and 62.60% respectively; the average ratios of grants from the

203
sponsored schemes to total non-tax revenue are 63.25% and 60.81% respectively; the
average ratios of grants from the sponsored schemes to total revenue are 53.57% and
56.15% respectively. From the table it is obvious that the contribution of grants from
the sponsored schemes to the first two ratios in the GPs of Gangavathi taluk is better
than the GPs in Yelburga taluk and vice versa in respect of the last ratios. The share of
the grants from the sponsored schemes in total non-tax revenue approximately stands
at 60% and even more; the share of the same grants in total revenue approximately
stands at 53% and even more. Therefore, inference has drawn in accordance with the
fifth hypothesis that the grants from the centrally and / or state sponsored schemes are
not only the first major sources of external non-taxes, but also total revenues of the
GPs in the both talukas.
Table-6.20
Grants from Centrally and / or State Sponsored Schemes to the GPs
Year
GPs of Gangavathi Taluk GPs of Yelburga Taluk
Am
ou
nt
(Rs.
in
La
kh
s)
%
to T
ota
l
Ex
tern
al
No
n-T
ax
Rev
enu
e
%
to T
ota
l
No
n-T
ax
Rev
enu
e
%
to
To
tal
Rev
enu
e
Am
ou
nt
(Rs.
in
La
kh
s)
%
to T
ota
l
Ex
tern
al
No
n-T
ax
Rev
enu
e
%
to T
ota
l
No
n-T
ax
Rev
enu
e
%
to
To
tal
Rev
enu
e
2002-03 110.88 41.42 40.20 34.36 73.80 40.02 39.05 35.19
2003-04 110.49 60.42 58.36 42.39 100.03 54.66 51.37 47.87
2004-05 375.53 80.62 78.17 66.78 195.71 70.74 66.99 57.88
2005-06 319.73 59.57 58.21 50.29 361.03 64.09 62.97 57.89
2006-07 461.62 63.48 62.66 54.35 702.78 70.84 70.48 67.65
2007-08 480.14 84.07 81.91 73.25 870.36 75.22 73.99 70.43
Average 309.73 64.93 63.25 53.57 383.95 62.60 60.81 56.15
Source: 1. Office of the Local Audit Circle, Koppal.
2. Offices of the GPs in Gangavathi & Yelburga Talukas.
The graph-6.24 shows the amount of grants transferred under sponsored
schemes to the GPs and the graph-6.25 shows percentage of the same grants to total
non-tax revenue.

204
Graph-6.24
Grants from Centrally and / or State Sponsored Schemes to the GPs
(Rs. in Lakhs)
Graph 6.25
Grants from Centrally and / or State Sponsored Schemes to the GPs
% to Total Non-Tax Revenue
0
100
200
300
400
500
600
700
800
900
2002-03 2003-04 2004-05 2005-06 2006-07 2007-08 Average
0
10
20
30
40
50
60
70
80
90
2002-03 2003-04 2004-05 2005-06 2006-07 2007-08 Average
Rs.
in
La
kh
s
Year
Per
cen
tage
Year
GPs of Gangavathi Taluk GPs of Yelburga Taluk
Percentage Percentage
Average Line Average Line
GPs of Gangavathi Taluk GPs of Yelburga Taluk
Amount Amount
Average Line Average Line

205
The graph-6.24 shows that highest and lowest income from grants under the
sponsored schemes are in the years of 2007-08 and 2003-04 respectively in the GPs of
Gangavathi taluk; whereas the highest and lowest income from the grants are in the
years of 2007-08 and 2002-03 respectively in the GPs of Yelburga taluk. The income
from the grants in the GPs of the former taluk crossed the average line (Rs. 309.73
lakhs) for last four years; in case of the GPs in the latter taluk it has crossed the
average line (Rs. 383.95 lakhs) for the last two years. The average line of the GPs in
Yelburga taluk is higher than that of the GPs in Gangavathi taluk.
As shown in the graph-6.25 the ratios of grants from the sponsored schemes to
total non-tax revenue in the GPs of Gangavathi taluk crossed the average line
(63.25%) for 2004-05 and 2007-08; while in the GPs of Yelburga taluk the ratios
crossed the average line (60.81%) for the last four years. From the graph it is evident
that the contribution of grants from centrally and / or state sponsored schemes to total
non-tax revenue in the GPs of Gangavathi taluk is better somewhat than the GPs of
Yelburga taluk.