Embed Size (px)
Citation preview

B
. . .
CHAPTER V
PROPAGATION DATA BASES
Researchers have been performing experiments to gather
propagation data on millimeter-wave Earth-space links since the late1960’s, and in the process, have accumulated sizable data bases. Inthis chapter, we describe the various satellites used in this work,and present summary results of the significant experiments conductedin the United States. The results presented are primarilycumulative attenuation statistics, though some depolarizationmeasurements are included as well. This is, by necessity, a limitedsampling of the existing data bases. We therefore preface the databy citing additional summaries of propagation data for theinterested reader.
5.1 SUMMARIES OF EXPERIMENTAL DATA
The International Radio Consultative Committee (CCIR) publishesa summary of worldwide experimental data in the Recommendations andReports issuing from its periodic plenary assemblies. Volume V of
this publication, “Propagation in Non-Ionized Media,” deals with all
aspects of microwave propagation--both terrestrial and earth-to-space. Within Volume V, the data is presented as a series ofreports and recommendations submitted to and adopted by the CCIR.
Because of this presentation format, data of interest to designers
may be found in several places.
5-1

I
The most complete collection of measured propagation data is foundin the two CCIR documents;
1. Report 564-3, “Propagation Data and Prediction MethodsRequired for Earth-Space Telecommunications Systems,” (CCIR-1986a), and
2. Document 5/378, “Data Banks Used for Testing Prediciton
Methods in Sections E, F and G of Volume V,” (CCIR-1986b).
The CCIR separates the data between the two reports based on the
availability of an acceptable prediction method for that type ofmeasurement. Data for which an accepted method does not exist ispresented in the first document (Report 564-3)~ while data for whichan accepted method does exist is presented in the second document.
5-2
The data summaries in Report 564-3 are presented in Annex I, andinclude sections on the following subjects:
. Seasonal variations - worst month
. Duration of individual fades
● Rates of change of attenuation
● Scintillation and multipath effects
● Noise temperature
. Cross-polarization due to hydrometers
● Angle-of-arrival -.
Document 5/378 presents detailed tabulations of earth-space path
data for:
● Annual slant-path rain attenuation statistics (Table II-l),
\● Worst month slant-path attenuation statistics (Table II-2),
-.

● Fade duration statistics (Table II-3), and
● Annual XPD statistics based on satellite measurements (Table
II-4).
The results of extensive NASA sponsored measurements conducted inthe 1970’s is documented in a report entitled “A Compendium ofMillimeter Wave Propagaiton Studies Performed by NASA,” (Kaul, et al- 1977). The report contains a reasonably complete summary andreferences to the 15.3 and 31.65 GHz measurements with ATS-5, andthe 13.2, 17.8, 20 and 30 GHz measurements with ATS-6.
5.2 SATELLITES USED FOR PROPAGATION RESEARCH
Within the United States and Canada, four satellite systems(seven satellites) have been utilized to obtain the bulk of theearth-space propagation data. A brief summary of the satellite
. . characteristics that relate to propagation studies is given in Table5.2-1.
European researchers used 20 and 30 GHz transmissions from theATS-6 during the 1975/76 period when the satellite was stationedover Europe. The Italian satellite SIRIO, carrying a circularlypolarized three-carrier beacon at 11.331, 11.597 and 11.836 GHz,began operation in October 1977. Finally, the Orbiting TestSatellite (OTS), launched by the European Space Agency, providedbeacon transmissions at 11.575 and 11.786 GHz starting in May 1978.The Japanese have launched four satellites supporting propagationresearch. These are designatedbeacons at various frequencies
al-1979).
ETS-11, CS, BS and ECS, and carrynear 12, 20 and 34 GHz (Hayashi, et
Satellite propagation beacons are not the only means forcollecting experimental data. Radars, radiometers (fixed and sun
synchronous) and low-orbiting satellites can also provide valuabledata, but usually with some deficiency. A general deficiency is the
lack of polarization data available from these measurement
5-3
-.
Table 5.2-1. Satellite Parameters Related to Propagation Studies
Satellite launch Date Sstellite Posi t Ion Llpl ink Frquencles Doml ink Frequencies Antenna
ATS-5 8112/69 Inititlly over 31.65 GHZ w i t h 15.3 GHz with side-Indian Ocean,
Linearly polarized conicalsidebands at :1, b a n d s at iO.1, *1,
drifted to lDG” W.horns with 20” coverage and
ilD, and :50 MHz *5O MHz fran carrierl o n g i t u d e ; ramlnod
19.1 dB boresight gainfrom carr ier
s p i n n i n g at 76 rm
ATS-6 513DI14 94* N. longftude CMSAT EXP, : COHSAT EX P. : COHSAT EXP. : Dual-frequencyfor first year then 1 3 . 1 9 - 1 3 . 2 GHz 4 .14 - 4 .15 GHz l inear ly polar{zed dishmve to 35” E. long. 17.74- 17.8 G H Z 4 . 1 6 - 4 , 1 7 G H zm;.~turned to NASA/GSFC EXP. : NASA/GSFC EXp. :
20 and 30 GHz 20 GHz: 2$ :19; horn8 sldetonesSpaced tlBO MHz 30 GHz: stmflar to above
CTS 1117176 116° W. 14.0- 14.5 GHz 11.7 W beacon 16” horn, RHCP for beacon11.7- 12.2 GHz
coM2tAA D1 : 5/13/76 Dl: 95” H. long.(sotel 1 ttes D2: 7122176 02: 95° b!. long.0 1 , D2 0 3 D3 : 6/29/78 03: 87” W. long.
19.04 and 28.66 GHz5.9 -6 .4 GHz
L i n e a r l y polarfzed offsetbeacons
and Mf M : 2fZV81 04: 127* M. long.ptrabol fc d!shes.
3.9 -4 .2 GHz 19.04 GHz switched betweenver t ica l an i hor izonta lpo lar iza t ion . 28 .56 GHzv e r t i c a l l y mlarized.Sidebands of 28.56 GHz*528,9 ~Z (D3)i264.4 MHz (01 tnd 0 2 )
ETS-11 2 / 7 7 130” E. long. 1 .7 , 11 .5 , 34 .5 GHzbeacons
SIR1O 8f77 15* U. long. 17.4 GHz 11 .3 , 11 .6 , 11 .9 Wbeacons
Cs 12/77 135” E. long. 27.6- 6.3 GHz 3.95, 19.45 GHzbeacons
6,0 -6.3 6Hz 17.9 -20.2 6HZ3.8 -4.1 6Hz
BS 4 /78 110° E. long. 14.0- 14.4 GHz 11.7 W bmcon1 2 . 0 - 1 2 . 1 6HZ
01S 5f7e 10* E. long. 1 4 . 2 - 1 4 . 5 6Hz 11.6- 11.8 GHzbeacons11.5 - 1 1 . 8 w
5-4

B
techniques. Specifically, the expense of calibrating and operatingradar systems and the attenuation saturation effect in radiometersystems limit their use.
5.3. FORMAT OF DATA PRESENTED
Because of the volume and variety of data being presented byexperimenters throughout the United States and Canadar it isimpossible to claim that the following data is complete. However itis certainly representative of the tropospheric effects on earth-space paths for the location indicated.,
To limit the volume of data presented, the cumulativeattenuation statistics will be emphasized, since this is the mostcomplete data base available and, from this, the rain rate anddepolarization may be inferred (as described in Chapters 3 and 4).The results will be presented by frequency range or satellite beaconfrequency, as appropriate.
To assist with the comparison of data from variousexperimenters, NASA has encouraged the use of standardizedcumulative statistics plot formats. The use of these formats, givenin Figures 5.3-1 and 5.3-2, will permit experimental results from
different sources to be overlaid for direct comparison. The formscover from 0.0001 to 10 percent of the total period, which should bea sufficiently large range for most applications. The attenuation
scales cover from O-35 and O-45 dB, which should be sufficient tocover the link margin range of most systems. The 45 dB graph is
recommended for use above 15 GHz. These same forms may be utilized
for depolarization statistics if the attenuation labels are changedto cross-polarization discrimination. Each chart should be labeled
with the period of the measurement~ frequency~ location andelevation angle. This provides, on the figure, all the informationneeded for comparison of data.
5-5

10.OOOO
1.0000
0.1ooo
0.0100
0.0010
0.000
I I 1 I 1 1 I II
I I 1 1 I’11111”I 1“1
1 1 ’ I 1 I
1
I I 1 1 I 1 1 I 1 I I 1 I I 1 I 1 1 1 1 I 1 1 I I 1 1 I 1 I 1 I I 1 I
o 5 10 15 20 25 30 35
PATH AITENUATION IN DB
Figure 5.3-1. Cumulative Attenuation Graph for Use in the -11/14 GHz Bands
5-6

.8
\
10.OOOO
O.1ooo
0.0100
0.0010
0.0001
1 I I I 11’ ’’1’ ’1 ’1 ’’’’ 1’ ’’’1’” ‘l ’’’’ l’ ’’’i’’”
1
.
.
.
.
.
1 1 1 I Illllllllllllillll”ll l“I’’’l”” J’’’””J
I 5 10 15 20 25 ~ 35 40 45PATH ATTENUATION INDB
Figure 5.3-2. Cumulative Attenuation Graph for Use above 15 GHz
5-7

5.4 EXPERIMENTAL CUMULATIVE ATTENUATION STATISTICS
5.4.1 11.5-11.7 GHz Data
The Communications Technology Satellite (CTS) has provided theopportunity for extensive long-term measurements of rainfallattenuation and other propagation effects in the 11.7 to 12.2 GHzband. A continuous 11.7 GHz circularly polarized beacon operatedfrom launch through late 1979, except for two periods during solar
eclipse (March 4 through April 16, 1976 and August 31 throughOctober 17, 1976).
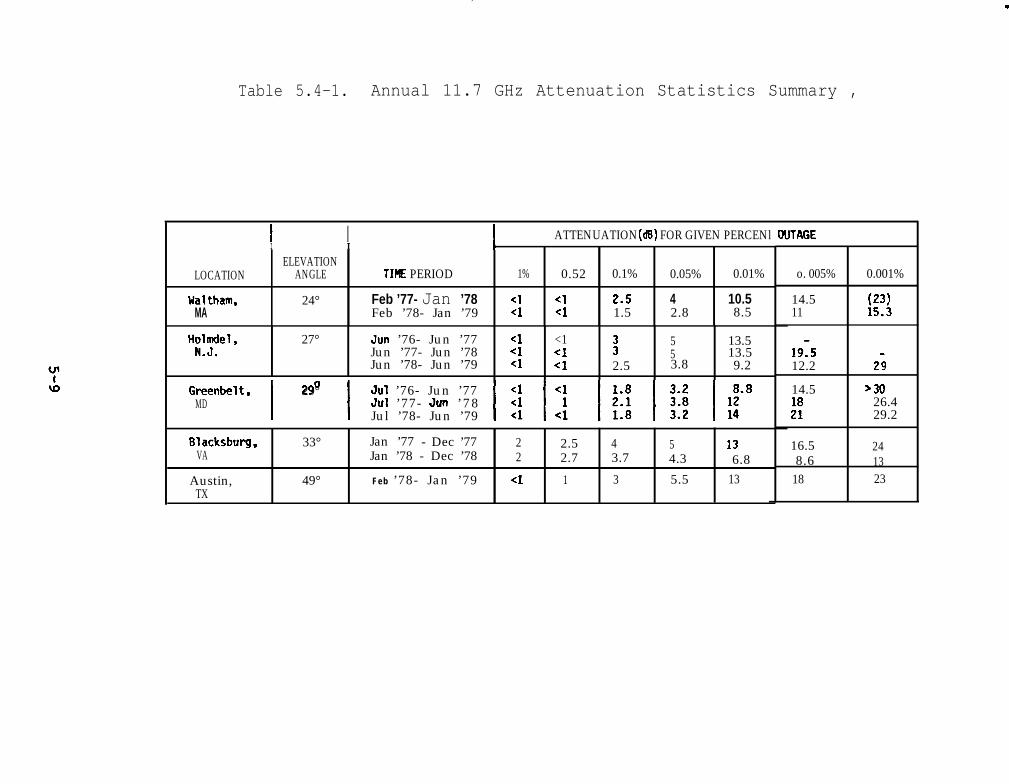
Figures 5.4-1 through 5.4-5 show the cumulative statistics forthe five United States locations of (listing in order of ascendingelevation angle):
I Waltham, MA (GTE Laboratories, Inc.)
I Holmdel, NJ (Bell Telephone Labs.)
I Greenbelt, MD (NASA Goddard Space Flight Center)
Blacksburg, VA (Virginia Polytechnic Institute and State
University)
I Austin, TX (University of Texas at Austin)
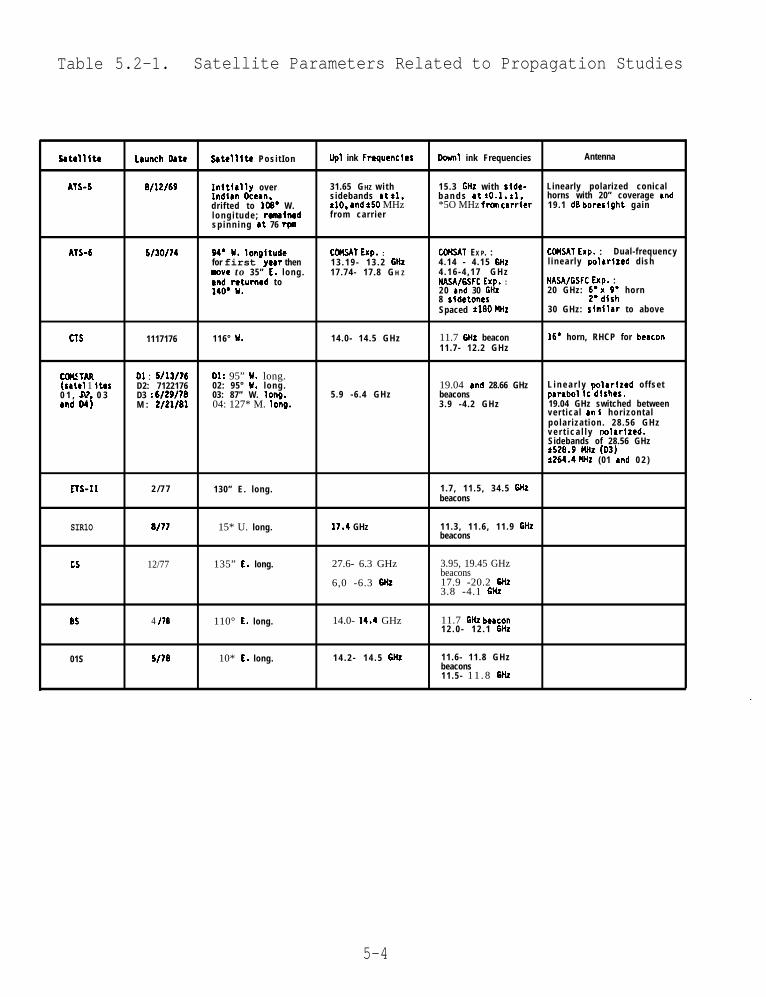
All of the distributions are based on 12 calendar months ofcontinuous data. Details of the recording methods and processingtechniques are given in the references in each figure. Table 5.4-1
summarizes the attenuation statistics at each of the locations for0.001, 0.005, 0.01, 0.05, 0.1, 0.5 and 1% of the observation period.Note that the data shows a wide range of variations, even forconsecutive years at one location.
1“ Elevation angle differences between the five locations prevents \
I a direct comparison of the measured distributions. The
distributions can be converted to a common elevation angle byassuming the precipitation to be horizontally stratified in the
5-8
.,’-’
Table 5.4-1. Annual 11.7 GHz Attenuation Statistics Summary ,
I I 1 ATTENUATION (dll) FOR GIVEN PERCENlI I I
ELEVATIONLOCATION ANGLE TIME PERIOD 1% 0.52 0.1% 0.05% 0.01%
Waltham, 24° Feb ’77- Jan ’78 <1 <1 2.5 4 10.5MA Feb ’78- Jan ’79 d <1 1.5 2.8 8.5
Holmdel, 27° Jun ’76- Jun ’77 <1 <1 5 13.5N.J. Jun ’77- Jun ’78 <1 <1 : 5 13.5
Jun ’78- Jun ’79 <1 <1 2.5 3.8 9.2
Greenbelt, II29° Jul ’76- Jun ’77MD &ll ’77- JUrI ’ 7 8
Jul ’78- Jun ’79 Iw IRI!W”8Blacksburg, 33° Jan ’77 - Dec ’77 2 2.5 4 5 13
VA Jan ’78 - Dec ’78 2 2.7 3.7 4.3 6.8
Austin, 49° Feb ’78- Jan ’79 d 1 3 5.5 13TX
UTAGE
o. 005% 0.001%
14.5 :;3;11 .
19:512.2 2;
14.5 >3026.4
:; 29.2
16.5 248.6 13
18 23

t=a
1.0000 =
A\\\\ \ \
10.0000 ~, I I I I 1 I I Il “
1 I II I 1 I I I 1 I I I
I I 1 I I 1 1 I I -’
11.7 GHzWALTHAM, MASSACHUSETTS
Elevation Angle: 24 DegreesAntenna Diameter: 3 Meters
NACKONEY (1979)
0.1000
0.0100 z
0.0010 :
P
\\
\\\\
First YearFeb 1977 – Jan 1978
\
\
\—Second Year
\Feb 1978 – Jan 1979
\
\
O.0001 -’ I 1 1 I 1 t 1 I I I 1 1 1 Ill I 1 I 1 1 I I I 1 1 1 1 I I 1 1 I I
o 5 10 15 20 25 30 35
PATH ATTENUATION IN DB
. .
Figure 5.4-1. Annual 11.7 GHz Attenuation Distributions .for Waltham, MA
5-1o

B
10.OOOO c, 1 I I I 1 1 I I I“’’l ’’’’l’” 1 l ’ ” I I 1 I I l-l
P
1.0000
0.1ooo
0,0100
0.0010
O.OOO(
11.7 GHzHOLMDEL, NEW JERSEY
Elevation Angle: 27 DegreesAntenna Diameter: 6 Meters
ARNOLD, ET AL (1980)
June 1977 – June 1978
June 1978– June 1979
i
.
I I 11 I 1 1 111111111111’’’ 1’” 1 1 1 1 1 1 1 1 1
0 5 10 15 20 25 30 35
PATH ATTENUATION IN DB
Figure 5.4-2. Anual 11.7 GHz Attenuation Distributionfor Holmdel, NJ
5-11
10.OOOO _, I I I I I 1 I I I I I I I 1“1’11” I I I I I I I I I I I J
11.7 GHzGREENBELT, MARYLANDElevation Angle:29 Degrees
Antenna Diameter: 4.6 MetersIPPOLITO (1979)
/Third YearJuI 1978 – Jun 1979
0.01 Ooz
0.0010 =
1 I 1 1 1 I I 1 1 1 10.Ooo1-1 1 1 1 I 1 I I 1 I I I I I I I I I 1 I 1 1 I
o 5 10 15 20 25 30 35
First YearJuI 1976 – Jun 1977
‘ \ “-\\
PATH ATTENUATION IN DB
Figure 5.4-3. Annual 11.7 GHz Attenuation Distributionsfor Greenbelt, MD
5-12

I 1 1 I I10.0000 ~, I I I I I t I I I
I I 1 Il “
I I 11’I 1 1’
1 I I
N -
11.7 GHzBLACKSBURG, VIRGINIA
Elevation Angle: 33 DegreesAntenna Diameter: 3.7 Meters
BOSTIAN, ET AL (1979)
0.0100
I
0.0010 1Jan – Dec 1978
I 1 I 1I IO.0001 ● “’” I 1 I 1 I I I 1. I I I I I I 1 ! 1 I I 1 1 I I 1
15 20 25 30 350 5 10
PATH ATTENUATION IN DB
Figure 5.4-4. Annual 11.7 GHz Attenuation Distributionfor Blacksburg, VA
5-13

10.OOOO
1.0000
k“’’l ’’’’ 1”” ’’l ’’’’l”” 1“’’1””~
I 11.7 GHzAUSTIN, TEXAS
Elevation Angle: 49 DegreesAntenna Diameter: 3 Meters
VOGEL (1979) !
V.u I Vo :
0.0010 ❑
\ Jan – Dec 1978
iI
O.0001 I I I 1 1 I I 1 I 1 I 1 I I I 1 I 1 1 I 1 1 I I I 1 1 I I I 1 I I 1 I
o 5 10 15 20 25 30 35
PATH AITENUATION IN DB
-,
Figure 5.4-5. Annual 11.7 GHz Attenuation Distributionfor Austin, TX

I . 1
region of the elevation angle variations. Four of the sites have
elevation angle differences of less than 9°; and, except for the 49°elevation angle at Austin, the sites differ by only a few degrees.
Figure 5.4-6 presents annual 1978 distributions for each locationconverted to a 30 degree elevation angle. The distributions were
converted to a 300 elevation angle by the relation
A30 = (sin @/sin 30°) Afj (5.4-1)
where J@ is the measured attenuation in dB at the elevation angle e,
and A30 is the attenuation at an elevation angle of 30°. The
distributions for the two nearest locations, Greenbelt and Holmdel,show some similarity, while the distributions for Blacksburg andWalthdm are significantly lcwer. Comparisons of this kind should be
observed with some caution~ however, since the distributions arebased on only 12 months of continuous data, and local precipitationconditions will vary greatly from year to year (see above).
It is interesting to note, however, that all five locations arein similar temperate continental rain climate regions. Both the
CCIR and global rain models place the five locations discussed herein the same climate zones. Thus, attenuation prediction models
\ based on the two above referenced procedures would yield similarattenuation distributions for all five locations. Such a similarity
is not evident for the measured annual distributions presented herefor those five locations.
Figure 5.4-7 presents distributions at three locations wherelong-term measurements, extending from 29 to 36 months duration~
were available. The long-term distributions are much smoother than
the individual 12 month distributions, and the curves for Holmdeland Greenbelt are very similar~ particularly in the region from .01to .0025%, which is the area of 9reat interest for sYstem desi9nmargin criteria. The results point out the desirability for multi-
year continuous measurements in the evaluation of rain attenuation
effects on communications system performance.
5-15

. .
1
zoi=a
10.0000 I I I I I I I I I 1 1 I 1 ’ I I I 11” I I 1 1 1 I I I I I 1
11.7 GHzAdjusted Elevation Angle: 30 Degrees
\O.1ooo =.
GREENBELT, MD
\
0,0100 ;
\
\ \0.001 0= \ \ :
\\
\BLACKSBURG, VA
‘hWALTHAM, MA
1 1 II I 1 1IO.0001 I I I 1 Ill I I Illllllltll’”1 I 1
0 5 10 15 20 25 30 35
PATH AITENUATION IN DB
Figure 5.4-6. Comparison of 1978 Annual 11.70GHz AttenuationDistribution of Measurements at Five Locations Ad]usted
to 30 Degrees Elevation Angle
.
5-16\-.

1 0 . O O O O I I I I I 1 I 1 I l“” l“ll!’” I l’” I I I 1 I 1-
11.7 GHz
zoFa>zLuL<
l-Q\ \
HOLMDEL, NJ (27° El. Angle)
/36 Months; May 1976 – Apr 1979t
[
\ ‘\\ i,\\\,\/l- \.\
WALTHAM, MA (24° El. Angle)/29 Months; Feb 1977 – Jun 1979
lx\\ ‘\\\\
0 . 0 1 0 0\
\\
t\\
[
0.0010 L\\\\-\-_
GREENBELT, MD (29° El. Angle)’36 Months: Jul 1976 – Jun 1979
II I 1 1 1 1 I 1 1 1 1 I
O.0001 1 I I 1 1 1 1 1 1 11111111’’ 1’”
0 5 10 15 20 25 30 35
PATH AITENUATION IN DB
Figure 5-4.7. Long-Term 11.7 GHz Attenuation Dis~tributions forThree Locations with Nearly Identical Elevatlon Angles
5-17

Representative European and Japanese attenuation data forfrequencies near 11.7 GHz are shown in Figure 5.4-8 and -9. Figure
5.4-8 shows 11.6 GHz attenuation distribution curves for locatiOnSin Italy (Fucino, near Rome and Gera Lario, near Lake Como), France(Gometz-la-Ville, near Paris), and England (Slough, near London).
Sources of these data are Macchiarella and Mauri (1980), Ramat(1980), and Davies (1981), respectively. Also shown is 11.5 GHzdata for Japan (Kashima, on the coast east of Tokyo), from Hayashi(1979). Satellites used for the experiments represented here areSIRIO and ETS-11. Figure 5.4-9 presents data from an experiment inwhich separate antennas at the same station (near Darmstadt~Germany) simultaneously monitored 11.6 GHz beacon signals from theOTS and SIRIO spacecraft. The elevation angles of the two paths
were within 4° of each other, but they differed by about 30° inazimuth. The large difference that is evident in the distributionshas been attributed to orographic effects on local weather patterns:The SIRIO link passes over a hilly area for several kilometers while
the OTS link lies over the Rhine river valley. These results (from
Rucker - 1980) demonstrate the degree to which local climaticvariations can affect rain attenuation statistics.
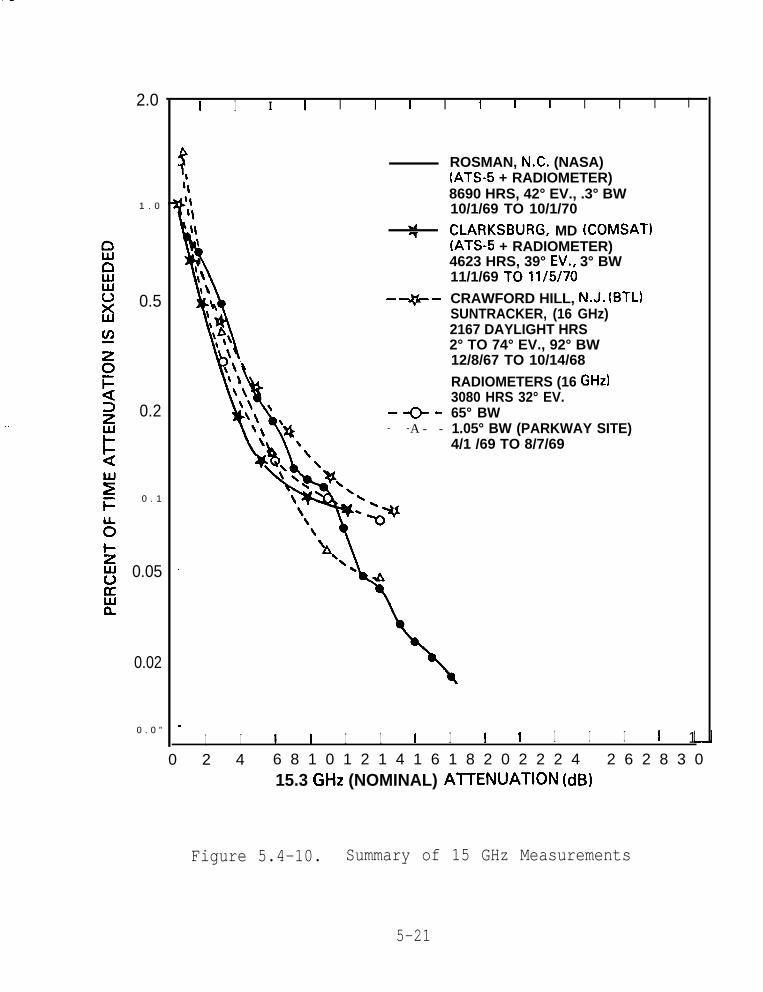
5.4.2 15-16 GHz Data
The 15 to 16 GHz experimental data base shown in Figure 5.4-10is limited. The satellite beacon measurements were taken by NASA
and COMSAT at North Carolina and Maryland. The earlier radiometer
measurements by Bell Telephone Laboratories are included tosupplement this satellite data. These radiometer measurements
appear to agree with the satellite data up to 14 dB where theradiometer measurements stop because of sky temperature saturation.No other long-term 15 GHz data bases are known to exist in the U.S.or Canada. However, the Tracking and Data Relay Satellite System
will eventually provide extensive data for 7 to 22 degree elevation
angles from White Sands, NM.
5-18

.1
. .
1 0 . O O O O I
1.0000
0.1ooo
0 . 0 1 0 0
0.0010
0.0001
0
I 1 I l“’’I’’’’1 ’’’’1’” I l ’ ” 1 I 1 I I f
I
\
I\\\
G e r a Lario, I t a l y3 7 ° a l , l/78–12i79
Fucino, I t a l y42°el, 1 / 7 8 – 1 2 / 7 9
1
SIRIO
S l o u g h , E n g l a n d ( 1 1 . 6 Gtiz)3 0 ° e l , 9 1 7 7 - 8 / 8 0
Gometz-le-Ville, F r a n c e32” et, 1 1 / 7 7 - 1 1 / 7 8
Kashima, J a p a n ETS4147o el, 5177-5178 ( 1 1 . 5 GI+z)
J I 1 1 1 I 1 1 1 1 I I I 1 1 11 1 1 1
5 10 15 20 25 30 35
PATH ATTENUATION IN DB
Figure 5.4-8. European and Japanese Attenuation Statisticsfor 11.5 and 11.6 GHz
5-19

i
1 0 . O O O O
1,0000
0.1ooo
0.0100
0.0010
0.0001
I I I I I I I Il“” l “
I I11’ ’’1’”
I I1 I 1 1
Darmstadt, Germany11.7 GHz
1979
SIRIO
2 8 . 8 ” cd
OTS32.5” el
P a t h A z i m u t h
Difference = ~“
J I 1 1 1111111111111111’’”l” ‘ 1 111 I !
o 5 1 0 15 20 25 30 35
PATH AITENUATION IN DB
Figure 5.4-9. Simultaneous Attenuation Statistics for Two Pathsfrom Same Earth Station
5-20
2.0
1 . 0
0.5
0.2
0 . 1
0.05
0.02
0 . 0 ”
I I I I I I 1 I I I I I I I I
$1’1
d7-
-+-
--e-- -A - -
ROSMAN, N.C. (NASA)(ATS-5 + RADIOMETER)8690 HRS, 42° EV., .3° BW10/1/69 TO 10/1/70
CLARKSBURG, MD (COMSAT)(ATS-5 + RADIOMETER)4623 HRS, 39° EV,, 3° BW11/1/69 TOll/5/70
CRAWFORD HILL, N.J. (BTL)SUNTRACKER, (16 GHz)2167 DAYLIGHT HRS2° TO 74° EV., 92° BW12/8/67 TO 10/14/68
RADIOMETERS (16 GHz)3080 HRS 32° EV.65° BW1.05° BW (PARKWAY SITE)4/1 /69 TO 8/7/69
\
.1 I 1 I I 1 I I 1 I 1 I I 1 1
0 2 4 6 8 1 0 1 2 1 4 1 6 1 8 2 0 2 2 2 4 2 6 2 8 3 015.3 Gtiz (NOMINAL) AITENUATION (dB)
Figure 5.4-10. Summary of 15 GHz Measurements
5-21

-.
5.4.3 19-20 GHz Data
Cumulative attenuation data in the 19 to 20 GHz range has beenaccumulated from both the ATS-6 and the COMSTAR beacons. In
addition, the COMSTAR beacon has provided a source for directmeasurement of depolarization.
The cumulative attenuation statistics at 19.04 and 20.0 GHz havebeen plotted in Figure 5.4-11. The Crawford Hill COMSTARmeasurements (curve 2) included independent measurement ofattenuation on nearly vertical (21 degrees from vertical) and nearlyhorizontal polarizations. Generally, horizontal and circularlypolarized signals are attenuated more than vertically polarizedsignals. During 0.01% of the time, the COMSTAR measurements showedthe horizontal attenuation to be about 2 dB greater than thevertical polarization (Cox, et al - 1979a). The polarizationdependence arises because of the shape and general orientation ofthe raindrops. Also shown are the effects of hurricane Belle on theannual cumulative statistics. Clearly, this single eventsignificantly shifts the curve for the moderate values ofattenuation associated with heavy~ but not intense~ rain rates.
. .
Figure 5.4-12 shows results from Japanese experiments using the19.45 GHz beacon on the CS spacecraft.
5.4.4 28-35 GHz Data
The 28.56 GHz COMSTAR beacons and the 30 GHz ATS-6 beacon have
provided excellent sources for attenuation measurements in the 30GHz frequency region. The cumulative attenuation statistics forseveral locations in the U.S. are given in Figure 5.4-13. Japanese
researchers have collected annual propagation data at 34.5 GHz withthe beacon on the ETS-11 satellite, as shown in Figure 5.4-12.
5-22 i..

I
. .
. .
10.0000 ‘,, ,, I I I 1 l “ ’ ’ I ’ ’ ’ ’ 1 ’ ’ ’ ’ 1 ’ ’ ” 1 ’ “ ’ 1 ’ ’ ’ ’ 1 ’ ”
- :1
@ HOLMDEL, NJ (Cox, et al. - 1979)18,5°, 6/76 - 5/77
@ HOLMDEL, NJ (Cox, et al. - 1979)38.6 °,5/77” 5/78
I .Uuuu
\
\
h @ CLARKSBURG, MD(Kurnar - 1 9 8 2 )a Amnn 43.5°, 8/78 - 9/80
L @ BLACKSBURG, VA(Bostian, etal. - 1979)450, ~f78 . 12/78
:1
@ AUSTIN, TX(Vogel - 1982)520, 10/78 . 8/80
\ ( AU V POL EXCEPT @, WIICH 1$21° from V & H I
0.1000 y \ With Hurricane
\ ~ Without Hurricane
0.0100 :
0.001 OH
I0.0001 1 1 I I 111111111111111111’1111”1 ‘illlll’’l””J
o 5 10 15 20 25 30 35 40 45
PATH ATTENUATION IN dB
Figure 5.4-11. Summary of 19.04 and 20 GHz Measurements
5 - 2 3

1
. .
lo.Oooo p, 11, ,,, ,,, ,l,ll ,,, ,,, ,,, ,,, ,,, ,,,,,,, ,,,,,,-
Kashima, Japan
yJ
O.lo(n
0 . 0 1 0 0
0 . 0 0 1 0
1.0000
IOoom
47° Elevation
34.5 G H zms-116m-6na
1170-1217a
1111111 1111111 1111,11,,,,1,,,,1,,,,1 11,,1,,,, Jo 5 10 15 20 25 30 35 @ 45
PATH AITENUATION IN DB
Figure 5.4-12. Results ofand
Experiments with Japanese ETS-11CS Beacons
-.
5 - 2 4

B
.-
5.4.5 Frequency ScalinQ of Attenuation Data
The relation between measured attenuations may be examined inseveral ways. The so-called statistical relation is obtained as aset of paired attenuations that are exceeded for equal amounts oftime. These points may be obtained from the cumulative attenuationdistributions. For the Crawford Hill measurements, for example,(Arnold, et al-1979) 19.5 dB attenuation at 19 GHz and 40.3 dB at 28GHz were both exceeded for 65 min. This statistical relation isplotted in Figure 5.4-14 as a series of open circles for 19 and 28GHz data for Crawford Hill.
The instantaneous attenuation relation may be determined fromsimultaneous data recordings of attenuation at the two frequencies.This instantaneous relation is also shown in Figure 5.4-14. Thedashed curve indicates the median 19 GHz attenuation observed forvalues of 28 GHz attenuation on the abscissa. The bars in thefigure indicate the span between the 10% and 90% points in thedistribution of 19 GHz attenuations observed for the 28 GHzattenuation values. The quantization is 0.5 dB for the 10% and 90%points and for the median. Note that, while these results arestatistical in nature as well, ’the quantity considered is theinstantaneous attenuation for the two frequencies. It is evidentfrom the figure that the statistical relation and the medianinstantaneous relation are essentially identical.
The dotted line on Figure 5.4-14 is the line for Az =(fz/fl)2 AI= 2.25AI where Al is the attenuation in dB at frequency fl=19.04 GHzand A2 is the attenuation in dB at frequency fz = 28.56 GHz. The
relationships between the measured attenuations depart from afrequency squared relation particularly at high attenuation. Astraight line, Az = 2.lA1 fits the data closely up to A1=20 dB butthe data depart from this line at still higher attenuation. This
less than frequency squared attenuation dependence is” consistentwith the frequency dependence of Chu’s theoretical attenuationcoefficients (1974) in this frequency range. The further decrease
in frequency dependence at higher attenuations is consistent with
5-25

10.0000 ●_,,,,
l’ ‘ ‘ ‘ ‘ ‘ ‘ “’’”J
1 1 I 1 I 1 1 I I I I I 1 I 1 I I 1 I 1 I 1 1 I I 1 I
@ HOLMDEL, NJ (Cc)x, ,,,l. - 1979)38.6°, 5/77 . 5/78
@ WALLOPS ISLAND, VA (Gcddhirsh - 1982)43.50, 4/77 - 8/80
1.0000 :
0.1000 ~
0.0100 =
@ CLARKSBURG, MD (Kumr - 1982)
k
\43.5°,8178. 9/80
\@ BLACKSBURG, VA (Bostim,ettd. - 1979)
\45°, 1/78 - 12/78
\ @ AUSTIN, TX (Vogel - 1982)\ 52°, 10/78 - 8/80
[ALLVPOLJ i
0.0010
I
o 5 10 15 20 25 30 35 40 45
PATH ATTENUATION IN dB
Figure 5.4-13. Summary of 28.56 and 30 GHz Measurements
5 - 2 6

I
22 I I I I I I I I I I I I
2s o STATISTICAL ATTN. RELATION FOR EQUALTIME EXCEEDED
Tl6 24 --- MEDIAN INSTANTANEOUS ATTN. RELATION o _~~m - I 10% - SD% SPREAD IN INSTANTANEOUS ATTN. ,...
*f’Ii !
.0 ,.
La
. . . . . IDEALIZED FREQUENCY
w
. . ““> SOUAREO RELATION
. .
~ 16
~12
*+.4$8: .“ ““““
w5~ 8 -
/
&J+’*
: :p#.=6/18m - 6/18/7s
1 I I 1 I 1 I 1 i0 4 8 1 2 1 6 2 0 2 4 2 S 2 2 3 4 0 4 4 4 S 6 2
Figure 5.4-14.
2S GHz ATTENUATION (dBl
Relationships between 19 and 28 GHz Attenutation forEarth-Space Radio Propagation
l.al ,I
0.s5 -
0.s0 -
0.s6 -
8 O.EI~
0.T6 -
i 0.70 -
: 0“= -
: 0.00 -$x 0.ss -
iiO.w
k“g :.: -F 0.26 -%
E “a8 0.25 -E 0.20 -
0.1s -0.10
005 -
0- R
❑ A,- SdB
mAq=16dB
❑ Aq-2Sd8
iZ&w WI
ELEVATION ANGLE: 41,6°WALLOPS ISLANO, VA
Isn-ms
1I
Figure 5.5-1. Histogram Denoting Percentage Times for VariousMonths the Fades of 5, 15,-and 25 dB-Were Exceeded
5-27
.

the same effect observed in the theoretical coefficients at higherrain rate since higher attenuation is associated with more intenserain.
In Figure 5.4-14, the increase in the spread between 10% and 90%points as attenuation increases is consistent with constantfractional fluctuation in the ratio of the attenuations at the twofrequencies.
5.5 TEMPORAL DISTRIBUTION
Systems may be able toor periods of the day more
OF FADES
accommodate fades during certain monthsreadily than during other periods. To
help assess the magnitude of these effects along the eastern U.S.coast, Goldhirsh (1979, 1980) and others (Rogers and Hyde - 1979,Brussaard - 1977) have prepared histograms and cumulativedistributions for various-months and times.
5.5.1 Monthly Distribution of Attenuation
Figure 5.5-1 shows the percentage of time for each month in theperiod April 1977 to March 1978 that fades of 5, 15, and 25 dB wereexceeded. These measurements (Goldhirsh - 1979) were made at 28.56
GHz from the COMSTAR D2 satellite to Wallops Island, VA at anelevation angle of 41.6 degrees. The fades are more excessive
during the summer months, except for July. This low value for July
is not expected to be representative for that month and demonstrates
how data from a single year can misrepresent the long-term averagevalue.
Weather Bureau data may also be utilized to obtain thisdistribution by month, but this procedure may be inaccurate becausethe type of rainconsideration toin a given monthIdeally the rain
may vary significantly throughout the year. Some
the amount of rainfall occurring in thunderstormsis needed to make these estimates more realistic.rate distribution for each month would be required
along with the attenuation models presented in Chapter 3. The
variability of the statistics from year to year is demonstrated by a
5-28
-,

comparison of the 1977-78 data with that obtained at’ Wallops Islandin the September 1978-August 1979 period, using the COMSTAR D3satellite (Goldhirsh - 1980). While the overall attenuationexceedance plots for the two periods agreed closely, several monthlyexceedance, values differed greatly between years. The percentage ofJUIY for which 15 dB was exceeded, for example,” was about 0.3% inthe 78-79 period compared with 0.02% in the 77-78 period. The 15 dB
exceedance percentages differed by more than a factor of two betweenyears for six of the twelve months.
5.5.2 Diurnal Distribution of Attenuation
One would expect severe fades to be most likely to occur duringthe late afternoon and early morning hours, when tropospheric heatexchange is the greatest and convective rains are most frequent.The 28 GHz COMSTAR data taken at Wallops Island, shown in Figures5.5-2 and 5.5-3 (Goldhirsh - 1979), tends to confirm the expectationfor the late afternoon. The figures show the attenuation statisticsfor the 1977-1978 period in terms of which 4-hour intervals of theday the attenuation was recorded. Figure 5.5-2 is a histogramgiving time percentages for exceedance of 5, 15 and 25 dBattenuation values, and Figure S.5-3 shows the complete cumulativedistributions for each interval.
The time-of-day attenuation histogram of Figure 5.5-4 is from11.7 GHz radiometer-based attenuation data at Etam, West Virginia(Rogers and Hyde - 1979). It shows two periods of the day dominatedby deep, long fades? in early morning and late afternoon, asexpected. The 11.4 GHz diurnal fade distribution given by Brussaard
(1977) for a number of European locations exhibits a marked peakbetween 1500 and 1800 local time, but no peak in the morning. The
19.5 GHz 1979-80 data for Kashima, Japan shows a very differentpattern (Fukuchi, et al - 1981), including a drop in deep fades at
around 1700 local time. one-year data compiled at Palmetto, Georgia
using the COMSTAR 19 GHz beaconr shows a broad minimum in the
diurnal distribution of deep fades between about 0500 and 1000, anda broad peak between 1700 and 2300 (Lin~ et al - 1980).
5-29

8
0.10 -
0.C9 -
O.m -
0.07 -
0.0s -
0.06 -
0.04 -
003 -
nAg-6.dB■ Aq-16dB
❑ Aq-36dB
8~ “m
Figure 5.5-2. Diurnal Distribution !of Fades Exceeding 5, 15, and 25 dB k’ 0.01
for Six Contiguous Four-Hour TimeSlots of the Day oU
Is : 3 7 11 15 19
—
‘ 26.6
—
I r
Figure 5.5-3 Cumulative Distri-butions for Six Contiguous Four-Hour Time Slots of Day
. ..m&.vr !
191
i GHz
TIME OF OAY - HR {EST)
lo”f ,i
. .1 I I I 1 I I 1 I 1 I I I
=.66 GHzELEVATION ANGLE: 41.6”WALLOPS ISLAND, VA
1977-1378● .1
-.
FADE DEPTH ld61
5-30

8
Figure 5*5 -4 .
n>3dB lf##>9dB
~>7dB _>lldB
2 0 0 I 1 I 1 1 1 I 1 I 1 1 1 1 1 1 1 I 1 I I 1 I T 1
LOctober 1977 -OcIober 1978
100 Etam, W. Va. 11.7 GHz
m
Jh-’ I
o 4 8
TIME OF DAY tHRl
n
- E S T
l-v
Diurnal Distribution of Fades3, 7, 9, 11 dB
lW ~ , , , m , 11 c1
LENOX, W. VA.lBOel, 11.6GHzOCT 1 9 7 7 - OCT197B
lb
, ,1 2 s 10 m 60 too
FADE DURATION IMIN)
Exceeding
Figure 5.6-1. Histogram of Fade Duration From Radiometer Data
5-31

f
The diurnal distribution, like the monthly distribution, varieswidely from year to year. Goldhirsh (1980) presents a comparison ofdiurnal distributions of the 1977-78 and the 1978-79 periods for 28GHz attenuation at Wallops Island. In three of the six timeintervals, the 15 dB exceedance percentage differed by more than afactor of two between the years.
5.6 FADE DURATION
Several experimenters have derived fade duration statistics forearth-space links. Rogers and Hyde (1979) present histograms of thenumber of fades exceeding specific depth and duration for 11.6 GHzat Etam and Lenox, West Virginia, based on a year’s radiometermeasurements. Figure 5.6-1 shows the Lenox histogram. Rogers(1981) gives similar data for Shimotsui, Japan, and in additionshows joint fade duration histograms for pairs of diversity sites inWest Virginia and Japan.
Fade duration statistics have been compiled for 19 and 37 Gz atSlough, England, using a sun-tracking radiometer. Figure 5.6-2shows histograms for fades exceeding 5 and 10 dB from the Sloughdata. Note that the method of presentation differs from that ofFigure 5.6-1. The data in the earlier figure was the number of -fades greater than or equal to the abscissa value, and the presentfigure gives the number with a length falling in one-minuteintervals.
The use of a sun-tracking radiometer to estimate long-term pathattenuation provides a greater range of measurement than astationary sky-noise radiometer~ but the data by necessity includes
no night-time fading events. Also, due to the dependence of rain
attenuation on elevation angle, a rainstorm occurring when the sunis low in the sky would produce deeper fades than an identical storm
occurring closer to noon. Thus, long-term attenuation data from a
sun-tracking radiometer ,is colored by the time of day that events
producing fades tend to occur. One would expect this to limit its
accuracy in describing statistics for a fixed elevation angle.
. .
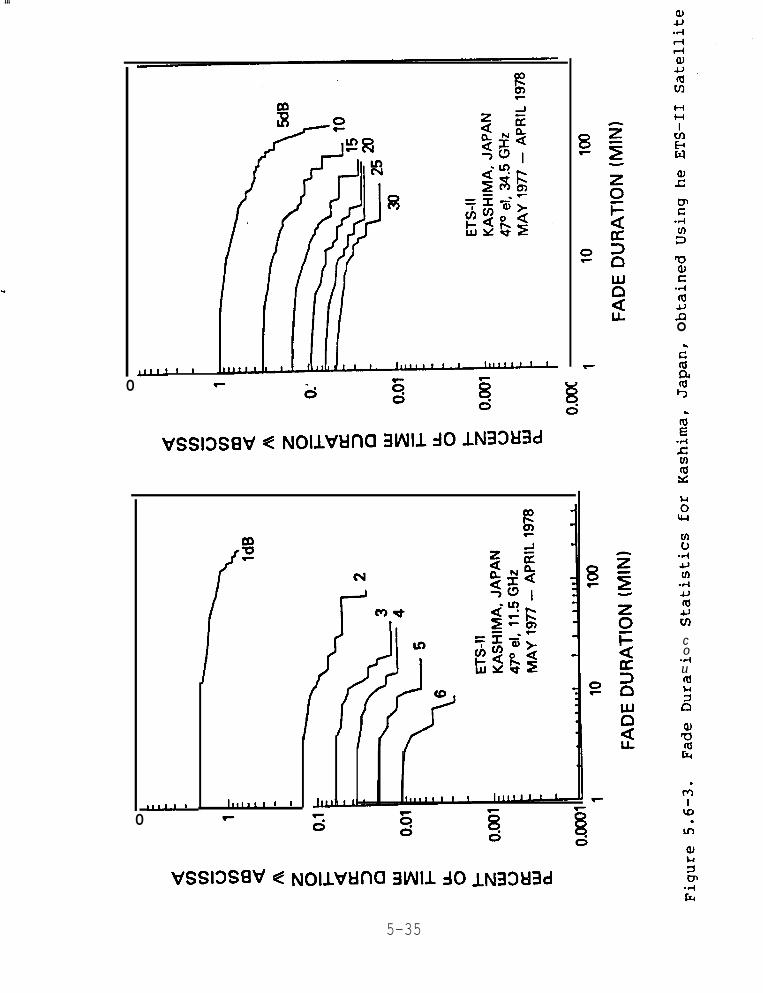
5-32

Fade duration statistics from direct attenuation measurementshave been compiled by Japanese researchers for 11.5 and 34.5 GHzusing the ETS-11 satellite, shown in Figure 5.6-3, as well aslimited 19.45 and 11.7 GHz statistics from the CS and BS experiments(Hayashi, et al - 1979).
Lin, et al (1980) present a summarization of fade duration datafor 19 and 28.5 GHz on the COMSTAR (D2)-to-Palmetto, Georgia path.The durations of fades exceeding each of several attenuationthresholds between 5 and 25 dB at each frequency were normalized andpresented on a single plot. The normalization consisted of dividing
each fade duration value by the average duration for its frequencyand threshold. The combined normalized data was shown to closelyfit a log-normal distribution, which confirmed expectations.
5.7 EXPERIMENTAL DEPOLARIZATION DATA
The crosspolarization discrimination not exceeded for a givenpercentage of time, in decibels, is approximated by a relation(Nowland, et al-1977)
XPD = z- ~ loglo (CPA) (5.7-1)
where CPA is the copolarized attenuation value in decibels exceededfor the same percentage of time. This suggests that the data be
presented in a semilogarithmic format wherein each parameter isalready a logarithm of another parameter. Therefore, in this
Handbook we have replotted the results of others in order to presenta uniform format of the data and to allow easy comparison with theCCIR approximation (see Eq. 4.3-27).
5-33

to 80
70
60
50
u)waaLL 40uouwg303z
20
10
0
37 GHz, Slou h, England23 Months &servat ion
5 to 62° ElevationAngles
An. DurationFade> 5dB=873minFade> 10dB = 7 mm
Standard Deviation
Fade> SdB= 13minFade> l&lB = 9 mm
Swdard Deviation of Ave,ageFade>SdB = .73Fade> lCMB-1
50
40
30
20
1 0
0
19 GHz, Slou h, England50 Months C%servation
5 to 62” ElevationAngles
Awq DuratkmFtie > 5d8 = 4.87 minFade> l&lB = 2.4 min
Standard Bat ionFade > WB = 5.9 minFade >lOdB = l.?min
Standard Deviation of AverageFade> SdB- .44Fade >10d8 = .2
1❑ Fades > 5dB
w+ ~ Fades > 10dB+++
o 1 0 20 30 40
0 1 0 20
~ Figure 5.6-2. Histograms of
30 40 50DURATION OF FADE (MINS)
Fades Greater Than 5
60 70 80
and 10 dB at 19 and 37 GHz
1.
m
0*’ I 1
0
o
w’ I 1!1111 1 1 I lu
VSSIOSSV < NOllVUnO 3Wll dO lN32U3d
t-iH
CLHW
.-laAJ.(2o.
uwco.-4uaL4iin
5-35
. .

5.7.1 19 GHz Data
Figures 5.7-1 and 5.7-2 present the 19 GHz cross-polarization
data obtained by the Bell Laboratories experimenters at CrawfordHill, NJ (Arnold, et al - 1979). The near vertical polarization
appears to have slightly more cross-polarization discrimination thanthe horizontal polarization. However, both polarizations show less
discrimination than the CCIR estimate. Therefore~ in this case~ theCCIR approximation appears to be optimistic.
5.7.2 28 GHz Data
The COMSTAR signal at 28 GHz had a fixed polarization, thusallowing measurements at only one orientation with respect to theraindrop anisotropy. The data replotted from Bell measurements(Arnold, et al-1979) is shown in Figure 5.7-3. Again, the CCIRapproximation is over-optimistic when compared to the measured data.
5.7.3 Joint Attenuation - Depolarization Data . .
Systems using orthogonal polarizations for frequency reuse
suffer degradation due to crosstalk caused by depolarization inaddition to the degradation due to rain attenuation. A full
statistical description of the availability of such a system mustconsider the attenuation and depolarization jointly. Figure 5.7-4
(Arnold, et al - 1979) depicts such joint statistics for attenuationand depolarization on the 28 GHz COMSTAR-Crawford Hill Link. Thefigure gives the percentage of time that a given attenuation valuewas exceeded or a given XPD value was not exceeded. Note that the—lower bound of all the curves is simply the attenuation exceedancecurve, since it corresponds to low values of XPD~ which happen avery low percentage of the time. Thus the location of this lower
bound is established by attenuation alone. On the other hand, the
curves become independent of attenuation for large values ofattenuation, since the non-exceedance percentage for XPD faroutweighs the exceedance percentage for attenuation.
5-36

.I
Figure 5.7-1. 19 GHz Cross-Polarization Measurements -Near Vertical Polarization
Figure 5.7-2. 19 GHz Cross-Polarization Measurements -Near Horizontal Polarization
-46
-m
-s
-20
-26
-20
- 1s
-10
CRAWFORD HILL 19 GHI
‘ \
SI181T7 - $/10176 PARTIALELEV. 360“
\ “
POLARIZATION t8” FROMHORIZONTAL
‘\
.
). . . ------
ATIENUATION(dB)
-e ,1 v I I 1 c 1 1 T T
-42 CRAWFORD HILL 19 G14zmm - 611w6 PARTIAL
\
ELEv. 390°POLARIZATION 21° FROM
\
HORIZONTAL-24
\
●
-20 %4*
●
●
k“+%
.-s .*. y
● 2’+. . .
\
-a2 “ . * \
.*+
. . \-16
“ “ _ \:
a.-o
.-10 I I 1 1 I 1 1 1 1 1
2 3 4 6 0 78810 am m 40
A t t e n u a t i o n
5-37

\●
Figure 5.7-3. 28 GHZCrosspolarizationMeasurements
Figure 5.7-4. JointAttenuation-DepolarizationStatistics for 28 GHz Link
-45! u 1 1 1 1 m 1 w I
\
-40
-35
-32
-25
-20
-15
-10 I 1 1 1 I I I 1 I 12
A3 4 5 6 7 8 9 1 0 20 aa
CRAWFORD HILL 26 GHI
\5,1877-5 1BT8 PARTIAL
ELEV ‘W 6°
%.
POLARIZATION 6W FROMHORIZONTAL
%.+/.
%+.●
● %.
.0● T
.““,.*\.
““”.\
● *, \
00 . . . .\“
●
-1.
A~ENUATION(dB)
ao I
\10
0.8
0.6
0 4
0.2
01
00snm
\
.
\
\\
DEPOL ldBl -
- 3 0
: \ \
L - 2 5
\ \
- -
F
~~;-,o004
‘wCRAWFORO HILL 26QHz -156H8171 W8f76 COMPLETE - l oELEV 366°MEAS DEPOL ANO ATTN
2- 1 FOR POL 21° FROM Vzwu
-,
5 10 16 2 0 2 5 2 0 2 2 4 0 4 5
AITENUATION(dB)
5-38

A family of curves of the type shown in Figure 5.7-4 gives theoutage percentage for a hypothetical system that is unavailable wheneither an attenuation or an XPD threshold is passed. This is a—useful approximation~ although most systems allow for some tradeoffbetween XPD and attenuation. When attenuation is low, for example,greater crosstalk may be tolerable than when attenuation isappreciable.
5.8 PHASE AND AMPLITUDE DISPERSION
Experimental measurements of the phase and amplitude dispersionin the lower troposphere made from the CO’MSTAR D2 satellite havebeen made at Crawford Hill, NJ (Cox, et al-1979b). The measurementswere made across the 528 MHz coherent sidebands at 28 GHz andbetween the 19 and 28 GHz carriers which were coherent.
The nine-month Crawford Hill data set has been comprehensivelysearched for evidence of phase dispersion. For all propagationevents, the change in average sideband to carrier phase is less thanthe measurement uncertainty of about 13° for attenuation up to 45 dB.Phase fluctuations are consistent with signal-to-noise ratios overthe 45 dB attenuation range. The change in average 19 to 28 GHzphase is on the order of 60° over a 30 dB attenuation range at 28GHz . This average phase change appears to be due only to theaverage dispersive properties of the water in the rain along thepath. There is no evidence of multipath type dispersion.
Attenuation in dB at 28 GHz is 2.1 times greater than that at 19GHz for attenuations up to 29 dB at 19 GHz. The small spread
observed in the relationship between 19 and 28 GHz attenuations isconsistent with the absence of significant phase dispersion over the528 MHz bandwidth.
5-39

5.9 REFERENCESI
Arnold,
Arnold,
H.W., D.C. Cox, H.W. Hoffman and R.P. Leek (1979),1
“Characteristics of Rain and Ice Depolarization for a 19 and28 GHz Propagation Path from a COMSTAR Satellite,”Conference Record, ICC 79~ VO1. Sr Bostont ‘MA PP 400501-60
H.W., D.C. Cox, and A.J. Rustako~ Jr. (1980), “RainAttenuation at 10-30 GHz Along Earth-Space Paths: ElevationAngle, Frequency, Seasonal and Diurnal Effects, “ConferenceRecord, ICC 80, Seattle, WA, Vol. 3, pp. 40.3.1-7.
Bostian, C.W., et al (1979), “A Depolarization and AttenuationExperiment Using the COMSTAR and CTS Satellites,” Virg.Poly. Inst. and State Univ., Annual Report, NASA Cont. NAS5-22577.
Brussaard, G. (1977), “Rain Attenuation on Satellite-Earth Paths at11.4 and 14 GHz, “URSI Commission F Symposium Proceedings,April 28 - May 6, 1977 La Baule, France.
CCIR (1978) “Rain Attenuation Prediction “ Document P/lOS-E, CCIRStudy Groups Special Preparatory Meeting (WARC-79)~International Telecommunications Union, Geneva.
CCIR (1986a), “Propagation Data and Prediction Methods Required forSpace Telecommunications Systems,” Report 564-3, in VolumeV, Recommendations and Reports of the CCIR - 1986,International Telecommunications Union, Geneva, ISBN No. 92-61-02741-5, NTIS Accession No. PB-87-14116-4.
CCIR (1986b), “Data Banks Used for Testing Prediction Methods inSections E, F and G of Volume V,” Document 5/378 (Rev.1),International Telecommunications Union~ Geneva.
Chu, T.S. [1974), “Rain Induced Cross-Polarization at Centimeter andMillimeter Wavelengths~” BSTJ, Vol. S3~ pp 1557-790
Cox, D.C., H.W. Arnold and A.J. Rustako, Jr. (1979a), “Attenuationand Depolarization by Rain and Ice Along Inclined RadioPaths Through the Atmosphere at Frequencies Above 10 GHz,”Conference Record, EASCON 79, Arlington, VA, Vol. 1,pp 56-61.
-.
Cox, D.C., H.W. Arnold and R.P. Lick (1979b)~ “Phase and AmplitudeDispersion for Earth-Space Propagation in the 20 to 30 GHzFrequency Range,” URSI Program and Abstracts, SpringMeeting, Seattle, Washington, June 18-22, p 253.
Crane, R.K. (1980), “Prediction of Attenuation by Rainr” IEEE Trans.on Comm.~ Vol. COM-28~ No. 91 PPo 1717-17330
5-40

. .
Davies,
Davies,
P.G. (1976), “Diversity Measurements of Attenuation at 37GHz with Sun-Tracking Radiometers in a 3-site Network,” ProcIEEE, Vol. 123, page 765.
P.G., M.J. Courthold and E.C. MacKenzie (1981),“Measurements of Circularly-Polarized Transmissions from theOTS and SIRIO Satellites in the 11 GHz Band,” IEE ConferencePublication No. 195, Internat. Conf. Ant. Prop., York,U.K., April 1981.
Fukuchi, H., M. Fujita~ K. Nakamura, Y. Furuhama, and Y. Otsu(1981) , “Rain Attenuation Characteristics on Quasi-Millimeter Waves Using Japanese Geostationary Satellites CSand BSE,” IEEE Conference Publication No. 195, Internat.Conf. Ant. Prop., York~ U.K., April 1981.
Goldhirsh, J. (1979), “Cumulative Slant Path Rain AttenuationStatistics Associated with the Comstar Beacon at 28.56 GHzfor Wallops Island, VA,” IEEE, Trans. Ant. Prop., Vol. Ap-
27, No. 6, pp 752-758.
Goldhirsh, J. (1980), “Multiyear Slant-Path Rain Fade Statistics at28.56 GHz for Wallops Island, VA,” IEEE Trans. Ant. ProP.~vol. AP-28, No. 6, pp. 934-941.
Goldhirsh, J. (1982), “Space Diversity Performance Prediction forEarth-Satellite Paths using Radar Modeling Techniques,”Radio Science, Vol. 17? No. 6~ pp. 1400-1410.
Hayashi, R., Y. Otsu, Y. Furuhama, and N. Fugono (1979)1“Propagation Characteristics on Millimeter and Quasi-Millimeter Waves by Using Three Geostationary Satellites ofJapan,” paper IAF-79-F-281, XXX Congress, InternationalAstronautical Federation, Munich, Germany.
Ippolito, L.J. (1978), “11.7 GHz Attenuation and Rain RateMeasurements With the Communications Technology Satellite(CTS),” NASA Tech. Memo. 80283, Greenbelt~ MD.
Kaul, R., D. Rogers and J. Bremer (1977), “A Compendium ofMillimeter Wave Propagation Studies Performed by NASA,” ORITech. Rpt., NASA Contract NAS5-24252.
Kumar, P.N. (1982), “Precipitation Fade Statistics for 19/29 - GHzComstar Beacon Signals and 12-GHz Radiometric Measurements,”COMSAT Technical Review, Vol. 12, No. 1, pp. 1-27.
Lin, s.H., H.J. Bergmann, and M. V. Pursley (1980) “Rain Attenuationon Earth-Satellite Paths - Summary of 10-Year Experimentsand Studies~” BSTJ~ Vol. 591 No. 2~ Pp. 183-228.
5-41

.1
Macchiarella, G. and M. Mauri (1981), “Statistical Results onCentimetric Waves Propagation after Two Years of Activitywith the Italian Satellite SIRIO~” URSI Commission F OPenSymposium, Lenoxville, Canada, May 1980.
Nackoney, O.G. (1979)~ “CTS 11.7 GHz Propagation Measurements, ThirdYear’s Data and Final Report,” GTE Laboratories Report TR-79-471.2, Waltham, MA.
Nowland, W.L., R.L. Olsen and I.P. Shkarofsky, (1977), “TheoreticalRelationship Between Rain Depolarization and Attenuation,”Electronics Letters, Vol. 13, No. 22, pp 676-7.
Raxnat, P. (1980), “Propagation Oblique clans les Bandes de Frequenciesdes 11 et 14 GHz,” URSI Commission F Open Symposium,Lenoxville, Canada, May 1980.
Rice, P.L. and N.R. Holmberg (1973)~ “Cumulative Time Statistics of
Rogers,
Rogers,
Rucker,
Rustako,
Surface Point Rainfall Rates,” IEEE Trans. Comm., Vol. COM-21 pp 1131-1136.
D. V. (1981), “Diversity- and Single-Site RadiometricMeasurements of 12-GHz Rain Attenuation in DifferentClimates,” IEEE Conference Publication No. 195, Internat.Conf. Ant. Prop., York, U.K., April 1981.
D. V. and G. Hyde (1979)~ “Diversity Measurements of 11.6GHz Rain Attenuation at Etam and Lenox, West Virginia~”COMSAT Tech. Rev., Vol. 9, No. 1, pp. 243-254.
F. (1980), “simultaneous Propagation Measurements in the12-GHz Band on the SIRIO and OTS Satellite Links,” URSICommission F Open Symposium, Lenoxville, Canada, May 1980.
A.J., Jr. (1979), “Measurement of Rain Attenuation andDepolarization of the CTS Satellite Beacon at Holmdel, NewJersey,” 1979 USNC/URSI Meeting, June 18-22, Seattle WA(abstract).
Vogel, W.J. (1979)~ “CTS Attenuation and Cross PolarizationMeasurements at 11.7 GHz,” Univ. Texas Austin, Final Fpt.,NASA Contract NAS5-22576.
Vogel, W.J. (1982), “Measurement of Satellite Beacon Attenuation at11.7, 1904, and 28.56 GHz and Radiometric Site Diversity at13.6 GHz,” Radio Science, Vol. 17, No. 68 PP. 1511-15200
5-42


![Monografia final - Pedro Govêa - revisão 29-06 · ó ,qwurgxomr $ hvfrokd gh id]hu xpd dydoldomr ixqgdphqwdolvwd gh xpd hpsuhvd sru phlr gd dsolfdomr gh xp ³ydoxdwlrq´ ghulyd](https://img.dokumen.tips/doc/110x75/5f8af41997bc433e5b7476c9/monografia-final-pedro-govfa-revisfo-29-06-qwurgxomr-hvfrokd-gh.jpg)


![AULA6-Massasdear.e.frentes [Modo de Compatibilidade]lcb.fflch.usp.br/sites/lcb.fflch.usp.br/files/upload/paginas/AULA6-Massasdear.e... · 'H XPD PDQHLUD JHUDO R FOLPDGH XPD GDGD UHJLmR](https://img.dokumen.tips/doc/110x75/607bce6b09d5857c401b9a2f/aula6-massasdearefrentes-modo-de-compatibilidadelcbfflchuspbrsiteslcbfflchuspbrfilesuploadpaginasaula6-massasdeare.jpg)
![6RPRV D 6HNHOHND 0XOWLPpGLD XPD QRYD … · 6rprv d 6hnhohnd 0xowlppgld xpd qryd rujdql]domr txh vh ghglfd qd surpromr rx sxeolfdomr gh surgxwrv vhuylorv frphufldlv h lpsuhvvmr h](https://img.dokumen.tips/doc/110x75/5bef764209d3f2112f8c6b00/6rprv-d-6hnhohnd-0xowlppgld-xpd-qryd-6rprv-d-6hnhohnd-0xowlppgld-xpd-qryd-rujdqldomr.jpg)