Embed Size (px)
Citation preview

CHAPTER V
INDUSTRIAL LOCATION POLICY IN MAHARASHTRA
I •
Maharashtra produces roughly one-fourtn of total industrial output ln
India. Stil I it would be wrong to tnink that tne State asa whole is
industriallzed. 70 per cent of the industry ln Maharasntra is
concentrated ln the Bombay-Ihane-pune belt, ~ich constitutes onlY
8.4 per cent of the area and is responsible for only one-fourth of the
population. The rest of the State, barring a few centres, is as
poorly developed as many industrially oackward states in the country.
This concentration is the result of historical forces. The British
':deveJO'p~d' BOrftbay a!; the' centre 'of thetr- trade anCf; ··later'~ f"Or'":""'· ........ . I
administration in western 'India, as also for exploiting 'its natu'ral
harbour. By the middle ot the nineteenth century, Bombay was the
unrivalled trading centre in the whoie of l..est~rn· India. Even' traders
from older centres, like Surat, migrated to Bombay in this period.
As in the case of all cities developed to foster colonial trade, the
transport network, and especially railways, was developed with Bombay
as the centre, and the city thrived at the expense of its hinterland.
Agglomerative forces came into play, and industry grew and diversified
in and around the city. This process continued unchecked till the
1960s, when the State Government intervened to restrict further growth
of industry in Bombay. Government policy, together with dispersing
forces 1 ike soaring rents and factor prices, and laoour trouble, led
to the spill-over of industry towardS the suburbs at first and, later,

113
to the nearest large urban centre of Pune.
Industrial location policies in Maharashtra, therefore, were formula
ted to control the growth of ~ombay and, more recently, of Pune. The
efforts have been bi-directional : to restrict further industrial
growth in the Bombay and Pune Metropolitan Kegions (BMR and PMR) and,
simultaneously, to create alternative locations for industry by
developing suitable areas in the less developed regions of the State,
and espeCially those which had potential for industrial growth.
Evolution of Industrial Location Policy
Governmental concern over the rapidly-increasing population, and the
accompanying POllution and congestion, in the Bombay and Pune Metro-
politan Regions, led to the establishment of several committees to
" -Yeco1Tl11end -'a: course' of -a'ttian" to -d~al :'With 'tt'lepr-clbl em:1 Arl these'-'
cbmmfttees stressed the necessity oOf curbing industrial growth both
wjthin the city 1 imits and in the suburbs. In order to attract . . " . ......
industrial units away from Bombay to other parts of the State, the
committees recommended the use of positive incentives and the develop
ment of the requisite facilities in the less developed regions.
In 196!:l, the State Government announced an industrial location policy
which encompassed both negative and positive strategies. New units
or sUbstantial expansions of existing units were to be discouraged in
Greater Bombay to prevent further congestion. (Unfortunately, some
exceptions were permitted, especially for the textile industry; this
deviation came in for criticism by the Gadgil Committee.) Along with
1. ~ee Appendix V.l for details.

this restrictive policy, steps were to be taken to provide essential
infrastructural facilities in the less developed areas Of the State
and various incentive schemes were to be formulated to attract
industrial units to these backward locations. Thus, prevention of
further growth in Bombay was to be coupled with the development of
industry in other areas of the State.
The State Location Policy announced in 1968 was much more liberal
than the 1965 policy. Industries in conforming zones in Greater
Bombay were encouraged to expand on the grounds' that this would
alleviate the growing unemployment problem in the city. Small-scale
units were to be allowed in Greater Bombay, irrespective of the
industry they belonged to.
In 1973, a Report of Industrial Location was prepared to determine
the optimal pattern of location in the State. The Report urged a
ban on growth of new industrial units, and even expansion of
existing units, in the BMR. It was stressed that the pricing of
infrastructure in developed centres should reflect the true social
cost. In addition to .these deterrents to location in the developed
regions, it was suggested that new locations must be made attractive
to industry by providing adequate transport and communications, as
well as social facilities) there. Till such time as these locations
developed agglomeration economies, the Government should make up
for the higher private costs by way of incentives. Some of the
incentives which could be used were:
a) Privileged access to raw materials through a raw materials
bank at the locations concerned;
b) Officially subsidized labour training facilities;
114

115
c) Officially sponsored and subsidized repair and other facilities;
d) Payron subsidy, if labour productivity is lower in the region,
or capital subsiay if capital costs or costs of repair and
maintenance are higher.
It was suggested that a new system should be devised for. the admini
stration of these temporary subsidy schemes, so that the subsidy
provided at a location was reduced as cost differences between that
location.and a developed one declined. The subsidy could be graded
according to the existing level of industrial employment at each
location. Also, the first unit to be setup ina backward area
should get a higher subsidy than the second one, and so on, since
the risk element of the first unit was the greatest. As will be
observed later, these suggestions have been incorporated in the
scheme of incentives of the State Government.
In 1974, the industrial location policy was revised. The BMK was
divided into four zones, with location being most restricted in
Zone I and increasingly liberal in the more outlying areas. An
important element of this policy was the introduction of 'No
Objection Certificates' (NOCs). No new industrial unit could be
set up in the BMR, nor an existing unit expanded or shifted, unless
it obtained an NOC. Only export-oriented units, or those requiring
large quantities of imported raw materials, were to be given
preference for locating in the BMR.
In 1~76, the PMK Plan was adopted. This prohibited the location of
new large and medium units within the municipal 1 imits. Even small
scale units and service industries could be set up only in

ear-marked industrial estates. The NOe scheme was introduced along
similar lines as in Bombay.
Industrial location policy for the BMR has subsequently been revised
from time to time. Though all the committees on industrial location
have repeatedly stressed the necessity of curbing industrial gl'owth
in and around Bombay, these strong recommendations are not reflected
in the actual industrial location policy of the State Government.
In fact, since the inception of industrial location policy, the
State Government has been shifting its stance, stricter at some
times and liberal at others. Stil I, the policy is becoming increas
ingly restrictive regarding the location of industry in Bombay and
Pune. This restrictive policy is only one side of the strategy.
The positive sides of the strategy are more important from the
point of view of industrial dispersal and have attempted to induce
industrial location in the less developed regions in two ways. One
was through the development of attractive locations for industry
outside the BombaY-Pune belt by designating certain places as
'growth centres', which would act as counter-magnets to Bombay and
Pune. The other was to actively promote industry in these centres
and in other areas by developing industrial estates and by providing
a system of financial incentives.
The Growth Centre Approach
The strategy applied in selecting growth centres was to concentrate
on a few centres at a time, bring them quickly to a self-sustaining
stage and the~ switch this concentrated promotional effort to other
locations. Growth centres have been established in and around
cities that had some essential infrastructure to start with, and
116

where 1ndustrial estates. had been developed. It was felt that the
centres selected on this basis would prove effective as counter
attractions to Bombay and Pune.
117
Nasik was the f,rst place to be designated as a growth centre in 1967.
It was chosen because of its proximity to Bombay, avai-Iability of ~he
requisite infrastructure and the prior existence of industry. It was
felt that these characteristics would help in bringing about rapid
growth of industry at this location'. SUbsequently, growth centres
have been chosen on the basis of their nearness to markets in Bombay
and Pune, availability of infrastructure and the government policy
relating to regional balance. The spatial pattern of the centres
had been conceived, with Bombay as centre, to be in concentric,
widening circles. This pattern has not been followed in practice.
In order to satisfy an larea criterion I, and in response to politica-l
pressures, some growth centres were chosen in relatively remote
regions. This has led to a deviation from the spatial pattern that
was conceptualised, as well as from norms relating to industrial
development potential.
There are now seventeen growth centres, of which eight were given
this designation in just five years between 1978 and 1983. These
were Bhandara, Chandrapur, ~hiplun, Murbad, Paithan, Patalganga,
Ratnagiri and Satara. The short time in which so many growth
centres were selected for promotion appears quite contrary to the
earlier policy of concentrating on a few centres at a time. This
earl ier pol icy was, in fact, pursued till 1978. Prior to this,
the centres chosen were: Nasik in 1967, followed by Roha in 1968,
Nagpur in 1969, Aurangabad in 1970, Tarapur in 1973, Ahn~dnagar

and Kudal in 1975, and Jalgaon and Jalna in 1978. Thus, nine growth
centres were selected in eleven years, from 1967 to 1978.
Many of the centres are relattve1y near Bombay and Pune. This has
proved, and will continue to prove, to be of crucial importance in
their rate of development. The promotion strategy has been to
persuade a few large firms to locate in these centres after which,
118
it was hoped, other firms in the large and small sectors would be
attracted. As will be observed later, this strategy has not been
successful in all the centres. The really successful centres have
been those·which were near Bombay or had easy access to Bombay, and
had well-developed infrastructura1 facilities. Other than encourag
ing large industry to locate in the selected centres, educational,
recreational and other cultural and economic facilities are developed
in" these centres, with." the view that "tnesefactors "have consider~ble"
weightage in the ·Iocation decisions of entrepreneurs.
The Package Scheme of Incentives
One of the most important measures used for persuading entrepreneurs
to choose backward locations is the Package Scheme of Incentives of
the State Government. The package scheme was i niti ally introduced
in 1964, and it was revised several times since then, the last such
revision being in 1983 when the Central Government announced its New
Incentive Scheme. The State Government incentives relate to
financial and non-financial assistance, such as sales tax. and octroi
relief, electricity and water rebates, capital subsidy, subsidy for
industrial housing, preferential treatment in government purchase,

and so on. 2
Upto 1973, the incentives were provided at a uniform rate in all the
developing regions. In 1973, a system of graded incentives was
introduced, whereby the quantum of incentives was linked with the
degree of backwardness of each area. The tal uka was chosen as the-,
regional unit and the developing region (defined as the whole State
excluding the Bombay and Pune Metropolitan Regions) was divided into
Groups II, III and IV. The quantum of incentives and the period for
whi ch they were avail ab 1 e, increased from Group II to Group IV .
tal ukas.
In 197Y, the location of large-scale units in the backward talukas
1 19
was given special encouragement by designating such units as 'pioneer'
or 'near-new' units, and entitling these units to high~r incentives . . " ~ '. " '. . '. " .. " '.' . ~ , ., . .'.
The major incentives provided under the 1~83 Package Scheme are:
a) Sales tax incentives;
b) Special Capital Incentive;
c) Octroi refund;
d) Contribution towards cost at feasibility study;
e) Preferential treatment in government purchase programme.
The Package Scheme offers considerable tinancial benefits to industry
in backward areas. r40st of the incentives represent subsidies on
variable costs, such as the sales tax incentives, octroi relief, and
electricity and water rebates. There is only one subsidy on fixed
cost, the Special Capital Incentive.
2. See Appendix V.2 for details.

The concessions relating to sales tax attempt to compensate tne
entrepreneur for the higher costs and delays invol ved in the procure
ment of raw materials in the less developed areas, and the higher
stocks that have to be maintained in these areas. There are also
greater difficul ties in the transportation and marketing of products,
and costs of production in the initial stages of development tend to
be higher. The sales tax incentives are meant to tide the firm over
these problems. The other incentives which reduce working capital
requirements ate also meant to i'mprove the profitability of the firm
in the backward locations and to compensate for the cost differences
between developed and backward areas.
The 'Special Capital Incentive, introduced in 19/6, was equivalent to
the Central Inyestment Subsidy, and was oftered in districts which
. were··not· el i gible for the -CIS .. ·:rhis ··i-ncenti.y·e is· 1 i kely -to .dtss ipa te
the effect of the Central Government locational strategy wherein' only
three districts received a subs·idy on. fixed capital. ~~ith the
introduction of the Special Capital Incentive, all districts in the
State became eligible for a capital subsidy.
The incentives offered to pioneer and near-new units appear to be
economically sound. They are likely to prove useful in prorrK:lting
large industry in areas where little industrial development has taken
place. If the units attracted are capable of inducing further growth
in the region through ancillarization, these incentives cou1d promote
genuine development in the less developed region. The questio'n that
arises here is whether it is economically viable to promote industry
in this manner in every taluka; this aspect has already been
discussed in the earlier chapters.

'.' .
121
A major drawback of the Package Scheme is that there is no incentive
relating to labour. The first scheme included an incentive for labour
training and the 1976 scheme provided for an employment incentive,
but both these incentives have been discontinued. One of the main
objectives of industrial development in the backward areas is the
provi s ion of al ternati ve employment opportunities to the 1 oc:a 1 popu
lation. This necessitates the provision of incentives for developing
human resources and local skills, and encouraging the use of labour
intensive technique~, whenever possible. In this regard, it may be
noted that not only is there no encouragement for the util ization
of local human resources, but the use of local natural resources is
actually discouraged. Resource-based industries in the most
backward talukas are given incentives at lower rates, and are also not
accorded pioneer status. It is well-known that such industries offer . . . .~. . .. . . ....
a comparative advantage and form the 'export base' of a region.
While it is true that natural resources may be tapped without the
provision of incentives, there is no doubt that the incentives may
make it worthwhile to tap resources in backward areas which otherwise
may not be economical. Even if resource-based industries are
considered inappropriate for fostering rapid industrial growth
because they are generally slow-growing industries, there appears to
be no justification for a policy which discourages resource-based
industries.
Coming to the coverage of the incentives, it may be stated that
graded incentives are more equitable because cost differences are
greater in the more backward talukas. It appears, however, that
the classitication of the talukas~~pa~~en adopted on an ad-hoc
~ /"Jr---'" . ~
t)' • , "f J, ' • .0' '-:.).,
. \.. {! \~ ~~\. -1 1",
.... \
basis and no definite criteria were used. In this regard, the
Dandekar Committee on Kegional Imbalances in Maharashtra suggested a
new system for classifying talukas using two criteria:
122
1) Industrial backwardness as measured by the percentage of workers
employed in manufacturing and repair and service establishments
to the total work-force; and
2) Distance from the developed region of Bombay-Pune.
The Committee also recommended a steeper gradation of incentives than
at present to give relatively more advantage to the less developed
areas.
The Package Scheme of Incentives is implemented by the State Industrial
and Investment Corporation of Maharashtra (SICOM) for large and medium
units and by the Regional Development Corporations (ROes) foY' small
scale units. To what extent has the Package Scheme benefited the
industrially backward districts?
Prior to the reorganization of the districts, thirteen districts (out
of the total of twenty-six) were eligible for the Central Government
incentives, and had been declared specially backward. upto 1974,
these districts received half the disbursements made under the
Package Scheme. The three CIS districts together received over one
third of assistance disbursed, with Chandrapur alone accounting for
more than 25 per cent of the total. Of the non-backward districts,
Nasik and Nagpur districts had large shares; these were districts
where growth centres had been established by this time. (The other
growth centre district was Kulaba, where Roha was designated as a
growth centre; this district ranked fifth in terms of assistance
d.i sbursed under the Package Scheme upto 1974.)

j j j j j j j j j j j j j j j j j j j j j j
j j j j j j j j j j j
j j j j j j
j j j
j
j j j

123
TABLE V.1 DISTRICT-WISE DISTRIBUTION OF ASSISTANCE DISBURSED
UNDER THE PACKAGE SCHEME OF INCENTIVES
Di strict Assistance Disbursed
Upto 1974 Upto 1983
tRs.1 akhs) (%) (Rs.1akhs) (%)
Backward Distrlcts
CIS Di stricts Aurangabad 70.81 10.33 660.53 8.60 Chanora pur 174.13 25.41 447.46 5.82 t<atnagiri 1.67 0.24 257.87 3.36 .
Sub-Total 246.61 35.y8 1365.86 17.78
Other Backward uistricts Jalgaon 17.76 2.59 243.1 y 3.16 Ku1aoa . 32.42 4.73 810.21 1 u. 54 Dhu1e Y.60 1.40 1 z5. 11 1.63 Nanded 9.14 1.33 67.57 0.88 Yavatma1 4.07 0.59 31.22 0.41 Bu1 dhana 10.57 1.54 40.48 0.53 Bhandar·a 0.80 0.1 Z 105.31 1. 37 Osmanabad 6.26 0.91 63.00 0.8Z Parbhani 9.18 0.12 Bhir 0.46 0.U7 18.28 0.z4
Sub-Tota 1 91.08 13.28 1513.55 19.70
Total 337.69 4Y.26 2879.41 37.48
Non-Backwara Districts Grea ter Bombay Thane 20.09 2.Y3 1348.68 17.55 Pune 0.56 0.96 258.27 3.36 Ahmednagar 14.24 2.0ts 645.24 8.40 Sho1apur 24.37 3.56 216.25 2.81 Ko1 hapur 27.77 4.u5 294.73 3.84 Nagpur 70.46 1 O. 2ts 500.06 6.51 Nasi k 127.27 18.57 1066.30 13.88 Sa tara 14.97 2.18 127.86 1.66 Sang1i Y.03 1. 32 1z0.66 1. 57 Amrava ti 2u.14 2.94 6U.84 0.79 Ako1a 1.83 0.27 137.08 1.78 Wardha 10.97 1. 6U 28.48 0.37
Total 347 .70 50.74 4ts04 .95 62.52 Grand Total 685.39 100.00 7684.36 100.0U
Source Government of Maharashtra, Planning Department, Report of the Fact Finding Committee on Regional Imbalance in Maharashtra l t 984)

124
By 1983, the distribution had changed considerab1y.3 The backward
districts then accounted for less than 40 per cent of assistance under
the Package Scheme. The share of the CIS districts was half their
share in 1974. Of the non-backward districts, Thane and Nasik had
very large shares; both these were growth centre districts. Another ,
growth centre district, Ahmednagar, was also favoured. Of the
backward districts, Aurangabad and Kulaba, again both districts with
growth centres, had relatively large shares ..
It seems, therefore, that the benefits of the incentive schemes have
accrued to relatively developed districts. t·1ore than one-fourth of
total assistance under the Package Scheme upto 1983 was disbursed in 4
Thane and Kulaba districts, which are adjacent to Bombay. This is
even more disturbing in view of the fact that graded incentives were
introduced in 1973. These results suggest that entrepreneurs prefer
locations which are not in the most backward areas, even if the rate
of incentives is higher in these regions.
Insti tutions for Regional Development of Industry
, Several agencies nave been instituted in Maharasntra for implementing
the policies and incentives of the State and Central Governments.
The main State Government institutions are the Maharashtra Industrial
Development Corporation, the State Industrial and Investment Corpora
tion of Maharashtra and the Maharashtra State Financial Corporation.
3. The regional distribution of government assistance over time has usually been compared using progressive totals rather than through marginal additions. This is because the major part of assistance was provided after 1970-71. Therefore, there is little ditference between the percentage distribution of cumulative assistance provided upto the 19~Os, and that of assistance provlded from l~nO-71 onwards.

125
Maharashtra Industrial Development Corporation (MIDC)
The MIDC, established in 1962, has the task of controlling industrial
location in the developed areas and to attract industry to the less
developed parts of the State by developing industrial estates
equipped with suitable infrastructure, such as water and power,
roads and drainage systems, post offices and schools. From 33
industrial estates in 1970-71, the number increased to 57 in 1981,
with at least one estate in each district. The availability of
ready plots and sheds in the estates has proved very attractive to
entrepreneurs. Between 1971 and 1981, 5401 factories were set up in
Maharashtra of which 80 per cent were established in MIDe estates.
A specific objective of the MIDC is to assist and attract industry
to the developing areas. This is done by using a discriminatory
pricing policy in the rates of land and water in MIDe areas,favouring
the less developed regions. This policy discourages industrial
location in the developed regions and provides a positive inducement
for industrial location in the developing regions.
The premium rates of land in the different regions are shown in Table
V.L. The rate in Marol industrial estate, in Greater Bombay, is 100
times greater than that in the least developed regions. It may be
observed that the rates in the developed regions are higher than the
average of all rates, and those in the developing regions are below
this average.
The rate of increase in land prices is also lower in the developing
regions. For instance, in the most backward areas, the Irate remained
unchanged at Rs. 2.50 per square metre during 1977 to 1980. uver the
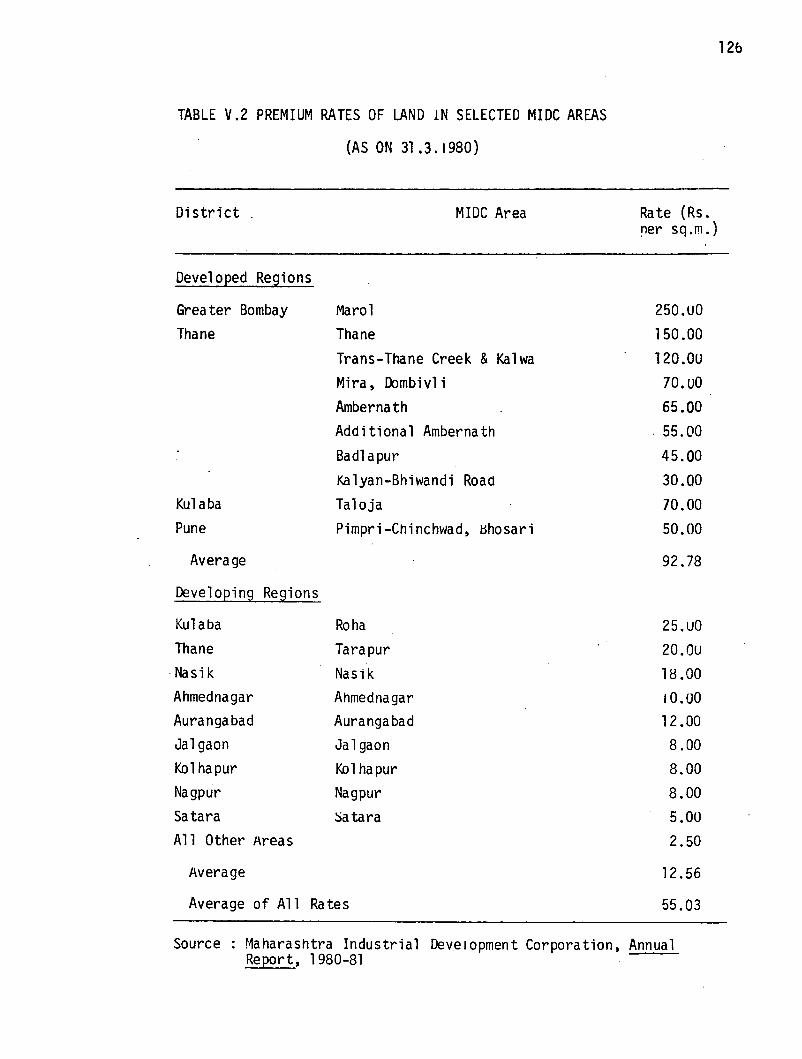
TABLE V.2 PREMIUM RATES OF LAND IN SELECTED MIDC AREAS
(AS ON 31.3.1980)
District .
Developed Regions
Grea ter Bombay Thane
Ku1 aba Pune
Average
Developing Regions
Ku1 aba Thane
·Nasik Ahmednagar Aurangabad Ja1 gaon Ko1 hapur Nagpur Satara All Other Areas
Average
Marol Thane
MIDC Area
Trans-Thane Creek & Kalwa Mira, rAlmbivl i Ambernath Additional Ambernath Badl apur Ka1yan-Bhiwandi Road Taloja Pimpri-Chinchwad, ~hosari
Roha Tarapur Nasi k Ahmednagar Aurangabad Ja 1 gaon Kol hapur Nagpur ::>atara
Average of All Rates
Rate (Rs. !1er sq.rn.)
250.uO 150.00 120.0u
70.uO 65.00
. 55.00
45.00 30.00 70.00 50.00
92.78
25.uO 20.0u 18.00 10.UO 12.00 8.00 8.00 8.00 5.0U 2.50
12.56
55.03
Source : t~aharashtra Industrial Development Corporation, Annual Report, 1980-81
126
127
same period, the tate in Marol was raised from Rs. 150 to Rs. 250 per
square metre, in Thane from Rs. 90 to Rs. 150, and in Pune from Rs. 40
to Rs. 50. In some growth centre areas, which have witnessed rapid
growth of industry, such as Aurangabad and Roha, rates have been
increased rapidly. Thus, in Roha, between 1977 and 1980, land prices
increased from Rs. ~ to Rs. 25, and in Aurangabad from RS.6 to Rs.12.
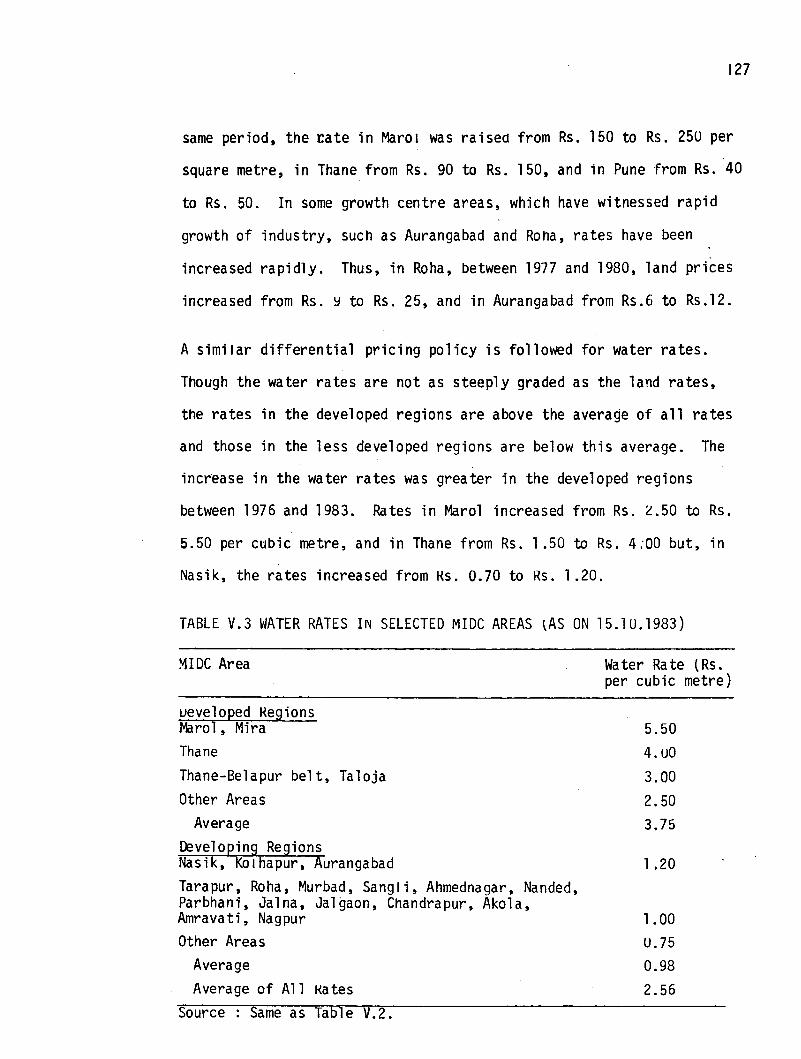
A similar differential pricing policy is followed for water rates.
Though the water rates are not as steeply graded as the land rates,
the rates in the developed regions are above the average of all rates
and those in the less developed regions are below this average. The
incr"ease in the water rates was greater in the developed regions
between 1976 and 1983. Rates in Maro1 increased from Rs. L.50 to Rs.
5.50 per cubic metre, and in Thane from Rs. 1.50 to Rs. 4;00 but, in
Nasik, the rates increased from Ks. 0.70 to Rs. 1.20.
TABLE V.3 WATER RATES IN SELECTED MIDC AREAS tAS ON 15.1U.1983)
MIDC Area
ueve10ped Kegions Marol, Mira Thane Thane-Belapur belt, Taloja Other Areas
Wa te r Ra te (Rs. per cubic metre)
5.50 4.uO 3.00 2.50
Average 3.75 Developing Regions Nasik, KOlhapur, Aurangabad 1.20 Tarapur, Roha, Murbad, Sangli, Ahmednagar, Nanded, Parbhani, Ja1na, Jalgaon, Chandrapur, Ako1a, Amravati, Nagpur 1.00 Other Areas U.75
Average 0.98 Average of All Kates 2.56
Source: Same as Table V.2.

128
There seems to be a clear differentiation in the land and water rates
charged by the MIDC in the developed and developing regions of the
State. This kind of cross-subsidization is fully justlt"ied if both
private and social costs in different areas are taken into account.
It has been observed that the economic rate per square metre of land
ranges from Rs. 8 to Rs .. 12, whereas the land is actually disposed
off at r..ates of Rs. 2.50 to Rs. 6 in the developing areas. 4
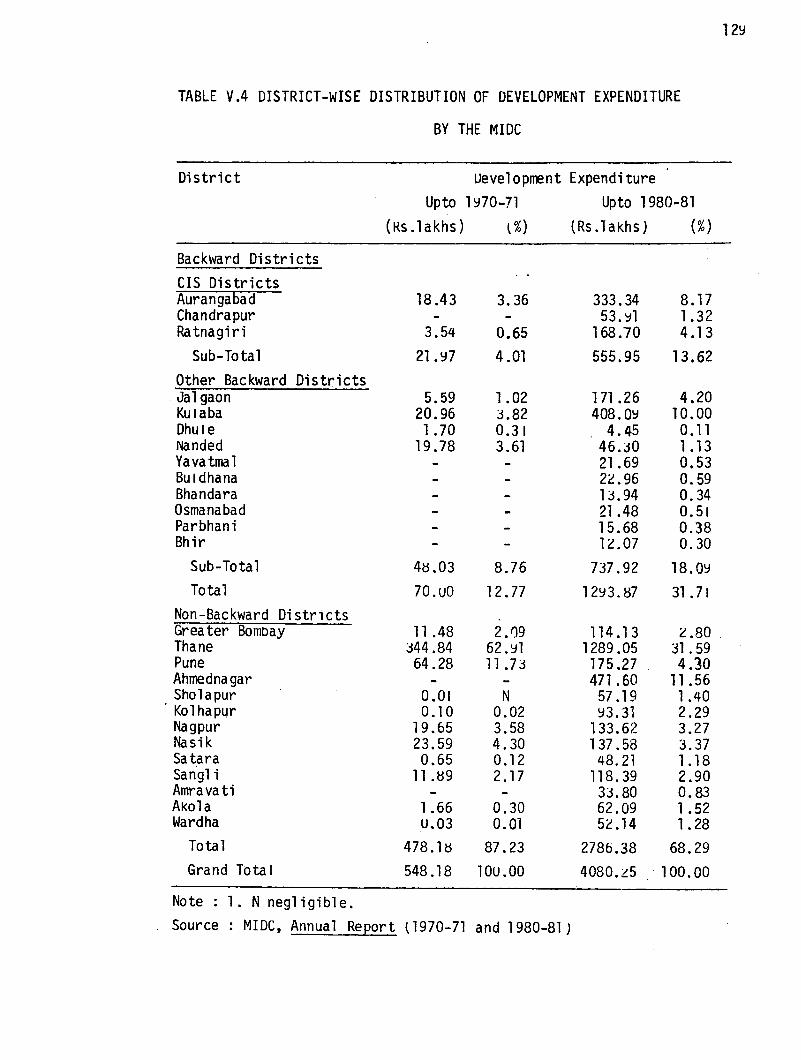
In terms of direct assi stance, however, the MIDC has favoured the
developed regions. Ihe distribution of development expenditure, the
lOOney spent on developing industrial estates, favoured the nOrJ
backward districts. Upto 1970-71, the backward districts received
less. than 15 per cent of total development expenaiture and, upto
1981, their share had increased to a little over 30 per cent. Thane
alone received 63 per cent of development expenditure upto 1970-71,
and Pune accounted for another 12 per cent. By 1981, Thane still
accounted for over 30 per cent of the total spent. Other districts
with fairly large shares were Ahmednagar, Aurangabad and Kulaba,
the latter two being backward districts and all three having growth
centres. The developed parts of Thane and Ku1aba districts (those
which are included in the BMR) accounted for over 65 per cent of
total expenditure by the MIDC in 197u-71 and over 20 per cent upto
1981.
Similarly, out Of total plots developed in MIDC areas, over tlO per
cent were in the non-backward districts in 1970-71 and about 75 per
cent upto 198U-81. Of 3, 143 plots developed upto 1970-71, about
4. G. S. Kulkarni and A. P. KUlkarni, Community Cost of Industrial Location at Bombay and Nasik (SICOM, 1968) .
12Y
TABLE V.4 DISTRICT-wISE DISTRIBUTION OF DEVELOPMENT EXPENDITURE
BY THE MIDC
District ueve10pment Expenditure
Upto 1 Y70-71 Upto 1980-81
(Rs.1 akhs) t %) (Rs.l akhs) (%)
Backward Districts
CIS Districts Aurangabad 18.43 3.36 333.34 8.17 Chandrapur 53. ~1 1.32 Ratnagiri 3.54 0.65 168.70 4.13
Sub-Total 21.Y7 4.01 555.95 13.62
Other Backward Districts Jal gaon 5.59 1.02 171.26 4.20 KUlaba 20.96 ~L82 408. O~ 10.00 Dhule 1.70 0.3 I 4.45 0.11 Nanded 19.78 3.61 46.JO 1.13 Yava tma 1 21.69 0.53 BUI dhana 2~.96 0.59 Bhandara 1 j. 94 0.34 Osmanabad 21 .48 0.51 Parbhani 15.68 0.38 Bhir 1~.07 0.30
Sub-Total 4~.03 8.76 737.92 18.0Y Total 70.uO 12.77 1213 3.87 31 .71
Non-Backward Districts Grea ter BomDay 11 .48 2.r)9 114.13 L.80 Thane j44.84 62.131 1289.05 31.59 Pune 64.28 11 .7 j 175.27 4.30 Ahmednagar 471 .60 11 .56 Sholapur 0.01 N 57.19 1.40
. Kolhapur 0.10 0.02 133.31 2.29 Nagpur 19.65 3.58 133.62 3.27 Nasik 23.59 4.30 137.58 3.37 Sa tara 0.65 0.12 48.21 1.18 Sangl i 11 .~9 2.17 118.39 2.90 Amravati 33.80 0.83 Akola 1.66 0.30 62.09 1.52 Wardha U.03 0.01 5~ .14 1.28
Total 478.1~ 87.23 2786.38 68.29 Grand Tota I 548.18 10u.00 4080.z5 . 100.00
Note: 1. N negligible.
Source : MIDC, Annual Re~ort {1970-71 and 1980-81)

130
TABLE V.5 DISTRICT-WISE DISTRIBUTION OF PLOTS DEVELOPED AND
ALLOTTED IN MIDC AREAS
(%) District Plots Developed Plots Allotted
Upto 1 y71 Upto 19~1 Upto 1971 Upto 1981
Backward Di s tricts
(.;IS Districts Aurangabad 9.48 6.97 6.20 6.87 (.;handrapur 2.20 0.71 Ratnagiri 1.53 2.53 1.41 1.87
Sub-Total 11 .01 11 .7u 7.61 9 .45
utherBackward Districts Jal gaon 4.23 1.81 6.51 1.59 Ku1aba 2.76 5.06 2.76 5.2~ Dhu1e 0.8::$ 0.21 0.99 u.25 Nanded 0.64 1.69 1. 73 Yavatma1 0.89 0.47 Bu1dhana 0.96 0.65 Bhandara 0.38 0.38 Osmanabad 1.1 u 0.71 Parbhani 0.74 0.55 Bhir . ~" . .io ..... ". .. ··0.10. 0.49 .. ~ ..' .' ... 0.40 .
Sub-Total 8.56 13.93 1 U.26 12.01
rotal 19.57 25.63 17 .~7 21 .46
Non-Backwara Di stricts Grea ter Bombay ~.45 2.36 2.24 2.72 Thane 44.36 2Y.40 53.54 ::$4.56 Pune 17.94 12.1 u 13.96 11. 16 Ahmednagar 2.24 2.25 Sholapur 4.49 4.27 1<01 hapur 0.06 2.59 0.05 2.7Y Nagpur 2. 10 4.71 2.6U 4.91 Nasi k 11 .45 7.41 8.65 ,'.77 Satara 0.67 1.63 1. 8~ Sang1 i 0.73 2.80 0.05 1.85 Amra va ti 0.99 1.12 Ako1a 0.67 2.07 1.04 2.00 Wardha 1.5~ 1.32
Total 80.43 74.37 82.13 7t1.54
Grand lota1 100.uO 100.00 100.00 1 00. uO
(Number) (3143) (11715) (192U) (9862)
Source : Same as Table V.4.

l,4UO (over 40 per cent) were in Thane district alone. Of nearly
12,OuO plots developed upto 1980-81, about 30 per cent were in this
district. This is because, pf fifty-seven MlUC areas, twelve are in
Thane district of which ten are in Group 'A' talukas (where no
131
. incentives are provided). In fact, the developed parts of Thane and
Kulaba districts (which are included in the BMR) accounted for 44 per
cent of plots developed ana 54 per cent of plots allotted upto
1970-71; by 1980-81, the shares were 26 per cent and J1 per cent
respectively. The only other districts with large shares were Pune,
Nasik and Aurangabad. The Share of the backward districts in plots
allotted was even less than their share in plots developed, which
suggests that entrepreneurs have consistently preferred locating
units in relatively developed areas. Out of about 2,000 plots
allotted in MIDC areas upto 1970-71 t rrore than half were in Thane
district and another 14 per cent were in Pune. Thus, rrore than two-
thirds of industry in MIDC areas was in the developed districts. By
1981, the share of these two districts had declined to about ¢5 per
cent. Of the backward districts, the only district which received
substantial benefits tram MIDC activities was Aurangabad, both upto ~ ~
1970-71 and upto 1980-81. }-
f A similar picture was observed for industry assisted in MIDC areas.
Upto 1~70-71, less than 10 per cent of the units assisted in MIDC
areas were in the ba'ckward di~tricts and by 1980-81 their share had , ..;,']
~f' increased to about 20 per cen~. The share of the backward districts
in investment and employment generated in the assisted units was
even lower; lt was less. than 5 per cent in 1970-71 and below 20 per
cent in 1980-~1. This implies that the average size of units in the

132
TABLE V.6 DISTRICT-WISE DISIRIBUTION OF INDUSTRY CATALYSED
IN MIDC AREAS
~ %)
Di strict Un its in Prod- Capi tal In- Employment uction & Con- vestment Generated struction
Upto Upto Upto Upto Upto Upto 1971 1981 1971 1 ~81 1971 19t11
tsackward Di s tri cts
CIS Districts Aurangabad 4.73 7.37 2.7'l. 5.29 1.40 7.67 Chandrapur '0.09 U.48 1.70 U.98 0.68 Ra tnagiri 0.34 1.73 1.03 0.06 0.~9
Sub-Tota 1 5.16 10.US 2.72 8.02 2.44 9.34
uther Backward Districts Ja1 gaon 2.32 3.30 o .l5 1.04 0.7u .1 .10 Ku1aoa 0.69 5.9'l. 9.44 O.Ot> 5.44 Dhu1 e 1.28 0.29 u.17 0.13 0.46 0.27 Nanded 0.79 0.54 0.97 Yava tma 1 0.05 0.06 0.01 Bu1 dhana 0.36 0.03 0.06 Bhandara 0.12 N Osmanabad 0.31 0.u2 0.01 Parbhani 0.j1 0.06 0.10 Bhir 0.40 0.09 u.12
Sub-Total 4.29 11.85 0.32 11.41 1 .. 21 8.08
Total 9.45 21 .93 3.04 19.43 3.65 17.42
Non-Backward Di stricts Grea ter Bombay 5.41 4.66 u.22 2.35 1.22 4.12 Thane 48.88 35.76 82.28 39.10 73.73 39.64 Pune 23.02 12.19 11 .75 24.16 14.32 16.05 Ahmednagar 2.35 1.67 1.53 Sho1apur 1.55 0.40 1.63 Ko1 hapur O.OY 3.28 0.70 0.34 1.55 Nagpur 2.41 4.70 0.63 l.35 1.26 4.49 Nasi k 10.22 8.46 2.08 8.35 S.'l.6 10.92 Sa tara 1.99 0.49 0.95 Sang1 i 0.09 0.83 'J.l!-2 0.22 0.4Y Amrava ti 0.50 0.04 0.06 Ako1a 0.43 1.35 0.45 0.~6 Wardha U.45 0.09 0.19
Tota I 90.55 78.u7 96.96 80.57 96.35 82.58 Grand lota1 100.uO 1 00 • 00 1 UO . UO 1 00. uO 1 00. 00 100.00
Note: I. N neg 1 i 9 i b 1 e .
Source : Same as Table V.4.

backward areas was less than those in the developed regions. l'rear1y
halt the units assisted in MIDC areas upto 1970-71 were in Thane
district, and tnese units accounted tor over 80 per cent of lnvest
ment cata1ysed in all MIUC areas and nearly 75 per cent of the
employment generated. Even in 1980-81 this district nad about 4U
per cent of industry cata1ysed. Upto 1970-71, the developed parts
of Thane and Ku1aba districts accounted for nearly half of the total
units assisted in the MIDC areas, and 82 per cent and 74 per cent
of the investment cata1ysea and the employment generated. upto
1980-~1, 36 per cent of units, 39 per cent of investment and 40
per cent of employment were in these developed regions. The other
districts which attracted industry were Pune upto 1970-71, and
Aurangabad and Nasik upto 1~80-8l.
It seems that the single largest beneficiary of MIDC's activities
133
has been Thane district, followed by Pune. Both these are relatively
industrialized districts and large parts of these districts are
considered 'developed' and are not eligible for the State Government
incentives. Despite this fact, the majority of industrial estates
developed, as well as industry assisted, have been in these two
districts. Even in Ku1aba, most of the units assisted have been
located in the developed parts of the district.
Tne justification for favouring these areas seems to have been that,
since industry was to be restricted in Bombay, these were the only
other areas in the State which could be quickly made attractive for
industrial location. It is felt, however, that the imposition of a
complete ban on industry in Bombay would by itself have been enough
to induce industry to locate in Thane and Pune, and even in the
areas of Ku1aba which are adjacent to Bombay; these were the only
attractive alternative locatlons available near Bombay. There was,
it seems, no need for the MIuC to concentrate more than ~hird of
its development expenditure in Tnane and Pune. Why should scarce
government resources have been used to develop industrial estates at
places which would have attracted industry witnout this massive
expenditure? It mi gh t ha ve proved more useful if, instead, efforts
had been directed towards developing industrial locations in regions
which had potential for industrial growth, but where industry would
not have been located without positive encouragement. While Nasik
and Aurangabad have been assisted, they could have been better
favoured, and so could Sholapur, Kolhapur and Ahme,dnagar. which have
been relatively neglected. These were intermediate districts Which
already had some industry. Larger.govern~ent assistanc~ could well
have led to the rapid establishment of industrial centres in these
regions.
The State Industrial and Investment Corporation of Maharashtra
134
SICOM was established in 1966 with the objective of promoting industrial
investment in the less developed areas of the State. With this end
in view, its jurisdiction specifically exclUdes the Bombay and Pune
Metropo1 1 tan Regions. SICOM offers a package of financial incenti ves
and services to the entrepreneur, such as term loans for tixed
assets, other financial assistance, assistance in project identifica
tion and plant location, and so on. Besides these activities, SICOM
is actively involved in promoting growth centres. The main promotion
policy ;s to induce large firms to locate in the growth centres, and
especially in the most recently designated growth centres.

135
TABLt V.l DISTRICT-WISE DISTRIBUTION OF FINANCIAL ASSISTANCE
DISBURSED UNDER SICOM'S SCHEMES
Ui stri ct Assistance Disbursed upto 1970-71 Upto 1981-82
(Rs.lakhs) (%) (Rs.1akhs) (%)
Backward Districts CIS Districts Aurangabad z4.78 3.00 z391 .64 13.86 Chandrapur 0.38 0.05 1432.39 tl .. 30 Ratnagiri 2.66 0.32 755.91 4.38
Sub-Total 27.82 3.37 4579.~4 26.54 Other Backward Di stricts Jal gaon 5.76 0.70 506.12 2.93 Kulaba 78.01 9.43 1890.n 10.96 Dhule 12.50 L51 137.25 0.80 Nanded 51.00 6.17 ,06.00 1.1 ~ Yavatmal 5.20 0.63 5.58 0.03 BUldhana 15.38 1. 86 35.49 . 0.21 Bhandara 25b.76 1.49 Osmanabad 0.85 0.01
. Parbnant '" : 0 .. 24 N.
Bhir lu.25 0.06 Sub-Total 167.B5 20.30 3049.26 17.68 Total 195.67 23.67 7629.20 44.22
Non-~ckward Dlstricts Grea ter Bombay Thane 43.27 5.23 3353.49 19.44 Pune 18.14 2.19 389.~7 2.26 Ahmednagar 2.40 0.29 124z.37 7.20 Sno lapur 73.97 8.94 457 . 9~ 2.65 Ko 1 hapur 27.23 3.29 353.46 2.05 Nagpur 221 .87 26.82 1505.35 8.72 Nasik 134.40 16.25 1613.48 9.35 sa tara 14.b4 1.77 399.69 2.32 Sangl i 16.00 I .93 74.60 U.43 Amravati 48.73 0.28 Akola 0.97 0.12 152.76 0.8~ Wardha 28.69 3.47 33.40 0.19
Total 581.58 70.30 9625.29 55.78 Not speciflcally for one
district 50.00 6.u3 Grand lotal 827.z5 100.00 17254.49 10U.OO
. NO.te : 1. N neg1 igible. Source : S IeOM.

13b
SICQM' s assistance 1S much more equitably distributed than that at the
MluC. Ihis may be because the developed parts of Maharasntra are not
eligible tor assistance from SlCOM. Upto 197U-71, tne thirteen
backward d1stricts received nearly 25 per cent of assista.nce disbursed
by ~ICOM and, Dy 1981-82, their share was 44 per cent. The three CIS
districts together received over one-fourth of assistance upto
1981-82. Most of the assistance in the backward districts was in
Kulaba and Nanded upto 1970-71, and in Aurangabad, Kulaba and
Chandrapur upto 1981-8~. Of the non-backward districts, two
districts with growth centres. Nagpur and Nasik, received 27 per cent
and 16 per cent of assistance disbursed upto 1970-71. By 1981-8~,
Thane district ranked first w1th nearly zO per cent, followed by
Nasik, Nagpur and Ahmednagar.
Of the total units assisted by SleOM upto 198v-82, 35 per cent were in ~ " .' ••••• ~ • .,' .' • • o. •• • '. ..",. ,.... •• ' ..' '. '. • ..... .' •••• ~ 0'..:- • 0; ". '.. .. •
tbe backward di~tricts, of which half .were in the CIS distl"jcts. The
backward districts accounted for 45 per cent of investment in the
assisted units and 34 per cent of employment. Aurangabad had the
highest share in assisted industry among the backward districts. It
may be noted that, on tne average, the non-backward districts had
higher employment generated per unit than the backward districts.
It may be useful to observe the role of the growth centres in
attracting industry. uf total SICOM-assisted industry in the State,
40 per cent was in the nine growth centres. Nasik, Nagpur and
Aurangabad have been the most successful in attracting industry.
These three growth centres accounted for about 75 per cent of units
assisted in all the growth centres which means that about 30 per
cent of total industry assisted by SICOM was in these three centres.

137
TABLE V.S DISTRICT-WISE STATISTICS OF UNITS ASSISTED BY SICOM
(UPTO 31.3. 1 982 )
District Units in Pro- Investment Employment , . duction Catalysed Generated
(No. ) (%) (Rs. (%) (No. ) (%) crores)
Backward Districts CIS Districts Aurangabad 241 9.75 108.95 15.uO 18198 11 .38 Chandrapur 59 2.4u 63.99 8.8J 8090 5.06 Ratnagiri 169 6.84 24.40 3.36 5454 3.41
Sub-Total 469 18.99 197.34 27.19 31742 19.85 Other Backward Districts Ja 19aon 73 2.95 25.52 ::l.51 4102 2.56 Kul aba 78 3.16 60.10 8.28 38Y9 2.44 Dhul e 35 1.42 9.15 1.26 27u3 1.69 Nanded 50 2.02 Y.27 1.28 3447 2.15 Yavatma1 28 1.13 7.21 0.99 1986 1.24 Bul dhana 29 1.17 109b 0.27 1148 U.72 Bhandara 17 0.69 9.11 1. 25 5Y4 0.37 Osmanabad 46 1.86 5.12 0.71 3115 1. 95
, .parbhan:i ' ',":. , "·18 0;73' ' O.8Z' o.n' 1181," " 0.74 ' Bhir 1 J 0.53 1.06 0.15 369 0.23
, -Sub-Tota 1 387 15.6b 129.32 17.81 22544 14.09 Total H56 34.65· 326.66 45-.00 54286 33.Y4
Non-Backward Districts Grea ter Bombay Thane 169 6.84 80.92 11 .14 7268 4.54 Pune 17- 0.69 7.94 1.09 3430 2.14 Ahmednagar 143 5.79 52.14 7.18 12049 7.53 Sho1apur 154 6.23 15.40 2.12 11421 7.14 Kol hapur 26J 10.64 42.u5 5.79 12612 7.88 Nagpur 270 10.Y3 52.61 7.i4 20685 12.93 Nasik 262 10.60 108.53 14.95 24053 15.04 Satara H5 3.44 12.50 1.72 3342 2.09 Sang 1 i 90 3.64 14.05 1. 93 4224 2.64 Amra va ti 48 1.94 4.23 0.08 2144 1.34 Akola 86 3.48 7.43 1.u2 2537 1. 5Y Wardha 28 1.13 1. 73 0.24 1912 1.20
Total 1615 65.35 39Y.53 55.00 105677 66.U6 Grand Total 2471 10u.00 726.1 Y 100.00 15Y963 100.0u
Notes : 1. Investment catalysed is defined as project cost including working capital margin.
2. Employment generated 1S defined as the direct employment crea ted by the u.n it.
Source : SICOM.

TABLE V.9 GROWTH CENTRE - WISE STATISTICS OF UNITS ASSISTED BY
SICOM (UPTO 31.3.1982)
Growth Centre Units in Pro- Investment Employment duction Ca ta1ysed Genera ted
(No. ) t%) {Rs. (%) (No. ) (%) . crores) ,
Nasik 246 25.26 101 .06 24.50 22852 31.96
Roha 53 5.44 48.3~ 11. 73 3084 4.31
Nagpur 263 27.0u 51.88 12.57 20589 28.80
Aurangabad 209 21.46 82.82 20.07 13933 19.49
Tara pur 88 9.03 68.37 16.57 3564 4.98
Ahmednagar 52 5.34 31 .74 7.69 4210 5.89
Kuda1 16 1.64 9.72 2.36 13~4 1.85
, J~ l.ga.9~ .. '. . 2Et . , .. '(,. .. 87 1.2 .. .45 .. 3.0~ . . '. .6;3.9 .... 0.89 .
Ja 1 na .. . 19 1.. 96 6.13 1.49 1307· 1,.83
Total 974· 1 oU.OO . 412.56 100.00 . 71502 100.00
Percentage of total SlCOM-ass i sted industry 39.42 56.81 44.70
Source : SICOM.
SICOM's assistance is biased ln favour ot the growth centres. The
policy seems to be to concentrate on promoting industry in growth
centres in particular. The most successful growth centres have been
Nasik, Aurangabad and Nagpur, and most of tne other. centres are
developing gradually as well, with the exception of Kudal. The main
drawback of this last centre is that its location is remote from
138

the developed parts of the State. 5
Maharashtra State Financial Corporation (MSFC)
The MSFC was established in 1962, mainly to assist small and medium
scale units by way of term finance. It operates the Concessiona'l
Kefinance scheme of the lOBI and disburses the Capital Investment
Subsidy of the Central Government to assisted units in the specified
backward districts. Thus, the MSFC and SICOM are the State Govern
ment institutions for providing term loans to ind'ustrial units.
unlike SICUM, the MSFC is not barred from assisting units in the
139
developed regions. The distribution of MSFC's assistance, therefore,
has tended to favour the non-backward districts, and especia'lly
Bombay, Thane and Pune. These three districts received nearly 45
per" c~nt "of' a:ssiStance,' dfsb'tirsed Lipt"6 1'971-72 ; 'arid .4'7 per' tent .. 'upt6
1982·-H3. The 'backward di stricts, on the other hand', rec:~ived oni y
'about one-fourth of the total assistance disbursed in both periods.
The CIS districts accounted for half the share of all the backward
districts. Among the backward districts, Aurangabad, Ratnagiri and
Kulaba had relatively large shares.
The preceding analysis shows that the operations of the three major
institutions in Maharashtra for promoting industrial development in
the backward areas have benefited the already industria.lly developed
regions. Before summing up the analysis regarding the distribution
of government assistance, mention may be made of the distribution of
5. This being one of the growth centres selected for the field survey, the reasons for its failure are studied in detail later.

140
TABLE V.l0 DISTRICT-WISE DISTRIBUTION OF ASSISTANCE DISBURSED
BY THE MSFC
Di strict Asslstance Disbursed
Upto 1971 -72 upto 1982-83
(Rs.1akhs) (%) (Rs.1akhs) ( %)
Backward Districts
C I::; Di stricts Aurangabad 25.b6 4.23 1789.19 7.76 Chandrapur . 12.47 2.06 469.98 2.04 Ratnagiri 37.28 6.15 930.71 4.u4
Sub-Total 75.41 12.44 3189.&:s 13.84
Other Backward Districts· Ja Igaon 4.57 U.75 327./)1 1.42 Ku1 aba 16.55 2.73 1602. ')1 0.95 Dhu1e 3.45 0.57 197.06 0.85 Nanded 16.35 2.70 196.18 0.85 Yavatmal 6.93 l.14 99.81 0.43 Bu1dhana 2.13 0.35 149.32 U.65 Bhandara 6~82 1.13 218.43 0.95 Osmanabad 2.95 0.49 158.93 0.69 Parbhani 17.48 2.tl8 117.72 0.51 Bhir l.B5 0.31 118.33 0.51
Sub-Total 79.08 13.05 3184.80 1 3. tl1
Total 154.49 25.49 6374.68 27.65
Non-Backward Districts Greater Bombay 105.50 17.40 4024.47 17.40 Thane 71.58 11.81 4698.73 20.39 Pune 90.21 14.88 2131.98 9.25 Ahmednagar 19.22 3.17 599.24 2.6U Sho1apur 21 .15 3.49 335.78 1.40 Kolhapur 53.91 8.39 1199.31 5.20 Nagpur 41.35 6.90 1492.79 6.48 Nasik 20.15 3.32 745.83 3.24 Sa tara 4.53 0.75 383.50 1.66 Sang1 i 4.38 0.72 483.54 2.10 Amravati 9.25 1.53 245.71 1.07 Ako1a 8.29 1.37 219.61 0.95 Wardha 1.70 0.2tl 113.11 0.q9
Total 451.72 74.51 16673.60 n.35 Grand Total 606.21 100.00 23048.28 . 10u.·00
Note: Data relate only to disbursements in Maharashtra.
Source : MSFC t Annual Report (1971-72 and 1982-83)

Central Government 1ncentives.6
Central Government Incentives
Up to 1983, three districts were e1iglb1e for the Capital Investment
Subsidy, and a total ot thirteen districts \inc1uding the three ~IS
districts) were eligible for the other incentive schemes. Under the
19t13 scheme, seventeen districts·are eligible for the schemes, . .
which include four recently-formed districts. Of these, Gadchiro1i
(formerly part of Chandrapur district) was designated as a 'No
Industry District'.
Capital Investment Subsidy Upto 1982-83, the total amount of
subsidy disbursed in Maharashtra was Rs. 875.30 lakhs. Of this
amount, nearly 70 per cent was disbursed in Aurangabad, 20 per cent
in Ratnagiri and the rest in Chandrapur.
Schemes of Concessional Finance Upto lY82, of the total concess-
ional finance provided by the lOBI under its Project Finance Scheme,
Aurangabad and Chandra pur each received over one-fourth and Jalgaon
received another 20 per cent. uf concessional refinance, Kulaba
received over 30 per cent of disbursements, followed by Aurangabad
witn a 1 ittl e 1 ess .than 30 per cent and Ra tnagiri with about 10 per
cent. The CIS districts appear to have benefited the most 1"rom the
Central Government incentive schemes.
141
Industrial Licences It may be worthwhile to observe the distribution
of industrial licences granted upto 1970-71, and after the Central
6. The operations of other agencies set up tor assisting regional development of industry in the State are mentioned in Appendix V.3.

TABLE V.11 DISTRICT -!HSE DISTRIBUTION OF INDUSTRIAL LICENCES
District
Backward Districts
CIS Districts Aurangabad Chandra pur Ra tnagi ri
Sub-Total
Other Backward Districts Ja 1 gaon Ku1aba Uhu1e Nanded Yavatma1 Bu1dhana Bhandara Osmanabad Parbhani Ijhir
Sub-Tota 1
Total
Non-Backward Districts Grea ter Ijombay Thane Pune Ahmednagar Sho lapur 1<01 hapur Nagpur Nasik Sa tara Sang1 i Amravati Ako1a Wardha
Total
Grand Total
Industrial Licences Granted
1952-71 (No.) {%}
14 '14
8
36
21 77 12
2 6 7 1
10 3 1
140 176
203b 664 359 47 38 36 40 37 32 34 11 15 lu
3358
3534
0.40 0.40 0.22 1.02
0.59 2.18 0.34 0.06 0.17 0.20 0.03 0.28 0.08 0.03
3.96
4.98
57.58 18.79 10.16 1.33 1. tJ8 I .02 1.13 1.05 U.91 0.96 0.31 0.42 0.28
95.02 100.00
1971-84 (No.) (%)
105 38 37
HW
31 183
9 5 3
11 9
12 6 ~
277
457
509 647 332 57 20 56 76
122 18 28 10 10 8
18Y3
L350
4.47 1.61 1.57 7.65
1.32 7.79 0.38 0.21 0.13 0.47 0.38 0.51 0.26 0.34
11.79
19.44
21.66 27.53 14.13
2.43 0.85 2.3~ 3.23 5.19 0.77 1.19 0.43 0.43 0.34
80.56 100.0u
Source : Government of Maharashtra, Directorate of Industries.
142
143
Government announced special incentives for backward areas, to see
whether the policy is reflected in the distribution of licences. There
is some difference between the distribution of licences granted prior
to 1971, ana after, The non-backward districts received ~5 per cent
of licences granted upto 1~71, of which nearly 6U per cent were
granted in Bombay, another 2U per cent in Thane and ]0 per cent in
Pune. Thus, nearly all the licences granted in Maharashtra upto 1971
went towards these three developed districts. From 1971-84,. the non
backward districts still received over tlO per cent of licences, and
the three developed districts received nearly two-thirds of total
licences. Of the backward districts, only Kulaba and Aurangabad had
fairly large shares. If the distribution of industrial licences is
compared to the distribution of government assistance, it may be
observed that the former is more biased in favour of the developed
districts. Ihis implies that the industrial location policy of the
Central and State Governments is not reflected in the regional
distribution of 1 icences granted.
l3efore summing up this chapter, the di.stribution of total assistance
disbursed by the MIDC, SICUM, MSFC, and under the Package Scheme of
Incentives and the Capital Investment Subsidy, may be observed.
Upto 1970-71, the backward districts received 21 per cent of total
assistance disbursed; by 19t12-83, their share was about 35 per cent.
Ihese figures show the disparity in assistance across the districts.
Half the districts, which are industrially backward, received about
one-thira of total assistance. On the other hand, Thane and Greater ,
Bombay together received 3u per cent of assistance disbursed. Other

144
TABLE V.12 DISTRICT-WISE DISTRIBUTION OF TOTAL ASSISTANCE DISBURSED
Di s tric t Upto 1970-71 upto 1982 ··tl3
Total Per Total Per Gapi ta Cap; ta
lRs.1akhs) (%) (Rs) tRs.1akhs) (%) l Rs)
Backward Districts
CIS Di stncts Aurangabad 68.87 3A8 3.49 6261.01 9.33 257.34 Chandrapur 12.8~ 0.65 0.78 z547.71 3.tlO 123.92 Ratnagiri 43.49 2.19 2.18 2834.7ti 4.22 134. ~9
Sub-Total 125.21 6.32 2.15 11 b43. 50 17.35 171.85
Other Backward Districts valgaon 15.92 0.80 0.75 1598.42 ~.38 61 .06 Ku1aba 115.51 5.83 9.15 6856.45 10.22 461.40 Dhu1e 17.65 0.89 1.06 490.35 U.73 23.92 Nanded 87.13. 4.40 6.23 608.43 O. Y1 34.79 Yavatma1 12.13 0.61 0.85 179.65 0.27 10.34 BUldhana 17 .51 0.88 1.3~ 398.57 0.~9 26.41 Bhandara 6.8Z 0.34 0.43 Y54.65 1.4z 51 .94 Osmanabad 2.9~ 0.15 0.16 z91.69 0.43 13.07 Parohani 1 7 .4ti 0.88 1.16 162.15 0.24 8.87 Bhir 1.85 0.09 0.14 171 .21 u.26 11.52
Sub-Tota 1 z94.95 14.tl7 2.1311711.57 17.45 70.33
Total 420.16 21.19 2.14 23355.07 34.80 93.76
Non-Backward Di stricts Grea ter Bombay 116.98 5.YO 1.96 9735.92 14.51 118.11 Thane 459.69 23.20 20.14 11l93.02 ' 1 b.68 333.92 Pune 172 .03 8.71 5.43 3933.02 5.86 94.45 Ahmednagar L1 .62 1. fJ9 u.95 3402~ti4 5.07 125.66 Sholapur 95.13 4.tlO 4.22 111 U.87 1.66 42.56 Kol hapur 81.24 4.10 3.97 21tl7.07 3.26 tl7.27 Nagpur 283.37 14.30 14.58 4077 .81 6.u8 157.51 Nasik 178.14 8.99 7.52 4313.05 6.43 144.15 Sa tara 19.8L 1.00 1.14 1150.33 1. 71 56.42 Sang1 i 32.27 I .63 2.10 9U2.28 1.34 49.28 Amravati 9.25 0.47 0.60 42ti.07 0.64 23.00 Ako1a 10.92 0.55 U.73 615.36 0.92 33.6tl Wardha 30.42 1. 54 3.YO 319.98 0.48 34.52
Total 1511 .48 76.27 5. 17 43369.62 64.64 100.04
Not specifical1y'tor one district 50.0u 2.54 374.08 0.56
Grand Total 1 9ti 1 • 64 1 00 . uO 3.65 67099.37 100.UO 96.90
Note : Data relate to assistance disbursed oy the MIDC, SICOM, MSFC and under the Package Scheme of Incentives and CIS.
Source: Same as Tables V.l. V.4, V.7 and V.l0.
145
than HOmbay, Thane and Pune. the only districts to benefit upto 1970-71
were Nagpur, Nasik and Ku1aba. These were all districts in which
growth centres had Deen established prior to 1970, and where industry
was being actlvely promoted. Upto 1983, Thane, Kulaba and Bombay
received 40 per cent of total assistance. Ihis means that, of the
money avowedly spent for the development of industry in the less
developed regions, 40 per cent was disbursed in and around Bombay.
In fact, this area should not nave received any financial subsidies • •
In view of these developments, it is not surprising that, despite
tne crores of rupees spent for 'industria1 dispersal', so little
progress has been made in the removal of reglonal disparities. If
so much assistance, concessional and otherwise, is being disbursed
in the developed districts, naturally there would be fewer resources
available for promoting industry in the less developed regions . • "j .................. '. , •
Though industrial centres such as Nagpur, Nasik and Aurangabad have
developed outside the Bombay-Pune belt, their developemnt would have
been faster if greater assistance had been provided there, rather
than in the Bombay and Pune regions.
In terms of per capita assistance, the average figure for the
backward districts was less than half that for the non-backward
districts upto 1970-71. By 1982-83, this disparity had declined
considerably; average per capita assistance was Rs. 94 in the
backward districts and a little over Rs. 100 in the non-backward
districts. In 19/0-71, Thane had held the top pOSition, followed
by Nagpur, Kulaba and Nasik. In 1982-~3, Ku1aba ranked first,
followed by Thane, Aurangabad, Nagpur and Nasik.

Conclusion
The evolution ot industrial location policy in Maharashtra may be
traced .to the necessity of preventing turther industrial concentra
tion in the congested metropolises of Bombay and Pune. Together
with this negative approach, attempts were made to provide industry
with alternative locations in the less developed area~, and
especially in places which would be able to provide conducive
environments for rapid industrial growth. Thus, industrial location
policy in Maharashtra may be divided into two distinct phases since
its inception. During the latter part of the 1950s, and most of the
1960s, the main thrust of the policy was to curb further growth of
industry in Bombay. From the late sixties onwards, though this
restrictive policy was continued, there has been greater emphasis
, ··on pas·Hive rreastJr~s . to· induce industrial-·' ocation in the·1 ess .. , ..
developed parts of· the State.
The main positive pol icies have consisted of a system of financial
incentives for industries in the backward areas, and the estab'l ish
ment of industrial estates equipped with infrastructural facilities
in the developing parts of the State. One of the major aims of
policy has been to develop industry in places which would act as
effective counter-magnets to Bombay and Pune; this led to the
adoption of the growth centre strategy. While most of the earl ier
centres selected were places intermediate (both in terms of de~velop
ment,and geographically) to the backward areas and the highly
industrialized Bombay-Pune belt, in later years an 'area approach'
has been developed, and pOlitical pressures satisfied, by selecting
relatively remote places as growth centres. However, the most
146

successful centres have been those which were relatively near Bombay
or were well-connected to this city, such as Nagpur. Nasik and
Aurangabad. This seems to justify the view that regional development
strategy should initially focus on areas of intermediate.development
rather than attempting to develop the most backward areas first.
One of the major drawbacks of industrial location policy has been
that areas around Bombay and Pune are eligible for incentives from
the ?tate ~overnment, though at lower rates. The availability of
incentives, together with the proximity to established industrial
centres, has made these areas more attractive, as alternative
locations for industries not permitted within the metropol itan
limits of Bombay and Pune, than the growth centres. One of the
reasons for providing industry with attractive locations near
·····-Bombay· maY"have ··been -the appre"hens;·on ·1:hat~th.i-s· i-ndustrY"woul d . ,. -
otherwise prefer locations n'ear Bombay, but in Gujarat State',rather'
than locations further away from Bombay in Maharashtra. As wil.l be
observed later, such migration of industry outside the State has
a 1 ready started.
Un the whole, it may be stated that location policy in Maharashtra
has had a limited success. Though the Bombay-Thane-Pune belt
continues to dominate the industrial scenario in the State, other
industrial centres have developed, though somewhat slowly, in the
less developed parts of the State.
Over two decades have passed since the policy of industrial dispersal
was adopted in Maharashtra, and various institutions were set up in
this regard. What has been the impact of government policies on
147
industrial location? Which other factors can be identified as
having influenced industrial location decisions? Before attempting
to answer such questions, tne evolution of industrial location
policies in Gujarat is reviewed to facilitate an inter-state compari
son of the causal factors for industrial location.
148

APPENDIX V.1 COMMITTEES ON INDUSTRIAL LOCATION IN MAHARASHTRA
The Barve Study Group
In March 1958, the Barve Study Group was set up by the State Govern
ment to evolve strategies to tackle the problem of congestion and
over-concentration of industry in Bombay city and its suburbs. In
its Report, the Group pOinted out the urgent neet for a definite
location pOlicy. the absence of which had led to the existing
regional pr-ob1ems in the State.
It was recommended that no new units Should be allowed to be set up,
nor existing units to be expanded, in the Bombay Island area, exc~pt
if the industries were especially dependent on the port facilities,
or were inseparably ancillary to existing units. The Group felt
•. ·· .. that- ·I·ocation" ot:'large~'Sc~leunits "In' <the heavy'. indtistrial'S"ec·tor'
should be al fowed' only on the extensions of the"Bombay MuniCipal
.Corporation (6MC) limits, if allowed at all 'in Greater Homba~, and
that all units which could be conveniently located outside Greater
Bombay should not be allowed even in the suburban limits. In order
to attract industrial units away from Bombay to other parts of the
State, the Group recommended the use of positive incentives and the
provision of the requisite facilities, as well as active encourage
ment by the State Government.
Development Plan for Greater Bombay
In 1964, a Development PI'an was prepared by the BMC. The Pl an
advocated that no new industrial unit employing more than twenty
persons should be"permitted in the city, unless it belonged to a
149

150
service industry catering to the needs of the local population. It was
proposed that all available land in the industrial zones of the city
should be reserved for industries shifting from 'non-contorming'
locations in the city itself, and t"or storage godowns. Another
policy to be followed was that no new large-scale unit (employing
rrore than fitty persons) should be allowed in Greater Bombay unles's
the unit was ancillary to an existing industry, an industry entirely
dependent on the port for its operatlon or a service industry
required to satisfy the consumer needs of the local popu1ation.
The Gadgil Committee on Metropolitan Regions
The objectives of this Committee, set up in 1965, were to evolve
principles for planning the metropolitan regions of Bombay and Pune.
The Committee was of the view that further industrial growth should ...... '!! •. ~'i '.~ .• ·f ... •• 'it--:- ~':' .. ,._ .... :: .... ' '.#~ •• ~ ......... ;"'.:..? ~ ... '" ........................ 1 ....... ~ .......... ""'···.l··.~ .• ~ ••• -, • ..; ...•
" "
be permitted only outside the congested areas. This would prove '. .' ,', .
beneficial in two ways. ~urther concentration of industry in these
areas would be limited, and the less developed areas would benetit.
It was felt that a positive shift of industry, and especially of
heavy industry, was required from the BMR to other areas. The
Committee found no reason to especially favour the textile industry
(as had been done in the Industrial Location Policy of 1965) and
suggested that it should be shifted away from ~ombay Island to the
mainland or to other parts of the State. Consumer or service
industries needed by the residents of ~ombay, as also llight industries
shifted from the Island area, should be located in the suburbs. The
industrial zones and estates in the Bombay region shou"ld be reserved
for industries shifting from the Island area rather than permitting
new units to be located there. Regarding Pune. the Committee
stressed that new industrial units should be permitted only outside
the city limits.
Bombay Metropol itan Region Development Authori ty Plan
The BMRDA Plan delimited the BMR. The region now included, with
Greater Bombay, ten municipal and non-municipal towns. In the eas't,
the BMR extended to the eastern administrative 1 imits of Kalyan and
Bhiwandi and to the foot-nills of the Sahyadarl ranges in Karjat
Dahisar. In 1~74t some more areas of Kulaba district were inc·luded
in the BMR.
Under this Plan. only industries catering to local consumption,
service industries and ancillaries to existing industries were to be
allowed in Greater Bombay. It was felt that, in order to induce
industries·to 'shift out-of<Greater'Bombay" the 'emphasis, shou~d'be'on
the provision of incentives (i.e., persuasion) rather than on
compulsion. Large labour-intensive industries, like textiles, were
to be encouraged in the less developed parts of the State. The
Plan envisaged a curtailment of industrial zones in Greater Bombay
by 800 hectares.
Dandekar Committee on Regional Imbalance in Maharashtra
The Report of this Committee was submitted in 1984. The objectives
of the Committee were to study the sector-wise regional imbalances
in the State and to suggest methods of overcoming the existing
disparities. Regarding industrial location, this Committee, like
its predecessors, stressed that it was necessary that the location
pol icy for the BMR be enforced strictly. No new industries of any
151

size, excepting service industries, should be allowed in Zones I and
II. Even modernization, replacement and renovation of existing units
should not be allowed in these zones because these operations were
often accompanied by expansion. No new industrial areas should be
developed in Zones III and Iv to ensure that industrial growth is
curbed in the BMR. Positive incentives were recommended to induce
industries to shift out Of the congested areas.
Industrial Location Policy for the BMR
At present, the BMR is delineated into four zones
Zone I Bombay Island.
Zone I I Suburbs and extended suburbs of Greater Bombay, Thane
Municipal Corporation, Mira and Bhayandar.
Zone I I I : New Bombay area. ", .. '.;, ....... ,'- . ' ....... -~.. ." .. ' -.~. . " ," .. ::,. "';"
Zone IV : Remaining area of the BMR.
New large or medium industry~ or ~xpansion of existing units, is not.
permitted in Zones I and II. No new small-scale industY'ial estates
are permitted in these zones. In Zones III and IV, new industrial
units are permitted only in the areas ear-marked for industry,
subject to strict enforcement of pollution control measures.
152

153
APPENDIX V.2 A NOTE ON THE PACKAGE SCHEME OF IN~ENTIVES
The first package Scheme of Incentives of the Government of Maharashtra
was introduced in 1964. The major incentives offered were
1) Sales tax loan limited to tl per cent ot fixed assets;
2) Octroi duty exemption;
3) Exemption from wa ter royalties and non-agricul tura 1 assessment;
4) Electricity tariff concessions to units having maximum demand
of 200 KW or more per month, equivalent to the ditference
between the Maharashtra State Electricity tloard's tariffs and
the Tata Electric Company's taritfs in Bombay;
5) Other incentives like 75 per cent contribution towards cost of
preparing the feasibility study, subsidies for labour training
and industrial housing, and preferential treatment in
................. government· s·tores· purchas.E!. J" '".
These incentives were appl icable to !:>5 industries an'd for units set
up on or after September 25, 1964,outside the Bombay-nune belt.
The incentives were available for 13 years from the date of 1icence/
registration. The electricity tariff incentive was given for five
years, and the labour training incentive for three years, from the
date of commencement of production.
From April 1, 1969, the scheme was made applicable to all industries
set up in the specified·deve1opin9 areas. The Sales Tax Refund,
which was earlier given in the form of an outright grant, was
converted into an interest-free loan without security for a period
of 18 years. The period for which incentives were available to a
unit was reduced to six years from the date of commencement of
production. Another modification introduced was that existing units

in developed areas with sales tax liability of over Rs. 9 lakhs (tne
lower limit for existing units in developing areas was Rs. 3 1akhs)
in the previous tnree years, could obtain an interest-free sales tax
loan to the extent of 25 per cent of the fixed assets to be created
by them in the developing areas. This loan was repayable aftE!r 18
years without security. This scheme is since known as Part II of
the sales tax incentive.
Ihe schemes of 1964 ana 1969 were applicable at a uniform rate in all
the developing areas of the State. In 1973, graded incentives were
introduced. Group I areas, covering the BMR and PMR, were not
el igible t-or the incentives. The rest of the State was divided into
Groups 11, III and IV at the taluka level, with the quantum and rate
of incentives increasing from Group II to Group IV talukas.
Ihe Schell'E was further modified in 1976. Th"edeveloping areas· were
divided into two Groups -- 18 1 and 1(1. An employment incentive was
introduced as ·part o·f the s~les tax. incentive. The incentive now
amounted to 4 per cent of fi xed assets pi us Rs. 1,2UO per job per
year, or 8 per cent of fixed asse.ts, whichever was lower. A Special
Capita I Inentive was introduced which was appl icable to units set up
in MIDC areas/government industrial estates in the developing areas,
other than in the districts eligible tor the Capital Investment
Subsidy of the Central Government. The incentive amounted to 15 per
cent of fixed capital investment with a ceiling of Rs. l~ lakhs
(like the· CIS) and was given as an interest-free unsecured loan
repayable in 12 years in six equal annual instalments.
In 1 Y79, the developing regions were reclassified into three Groups --
154

18 1, lei and 10'. The developed region was called Group lA' and was
not eligible tor the incentives. The Sales Tax Incentive could now be
taken either by way of deferral of sales tax payable, or exemptl0n,
instead of the interest-free loan provided ear11er. A new concept of
'pioneer unit l was introduced, whereby the t'irst large-scale unit
(defined as one with net fixed assets exceeding Rs. b crorE~S in Group
lei areas and Rs. 2 crores in Group 10 1 areas) set up in Group 'e l
and IDI areas was given Ipioneer' status which entitled it to
incentives at higher rates. Another concept of Inear-new unit' was
introduced whereby a unit set up by an existing unit at the same
location and of similar size, but manufacturing different products,
was eligible for higher incentives. An MIDe Incentive was provided
to units set up in MIoe areas at the rate of 5 per cent with a
ceiling .of Rs. 51akhs. , .• ~\~ .• · .. ;.· .. ·~ .. ·.;":,.~·:-.. ..... ·.·?:il'" ~'" ... -.~ .. : .......... ~",.~ .( .. \-.:~, .. :.. .• :, ..•. ~::.:. ::- .) '~'4" ..... ~._ ":' "'lrO :',:.~. -,1.".'! !~:.' ...... "!
The latest scheme has been operative 'from April ,1, 198"3. The'main
change .introduced ,was tha.t very large units lw.ith investment over
Rs. 25 crores) will be granted pioneer status in lei and ID' areas
even if the taluka already has pioneer units. The package is
available to new units and to existing units undertaking expansion/
diversification involving flxed capital investment over Rs. 15
crores land five times the fixed capital investment of the existing
unit). Units may opt for either Part lor Part II incentives.
Sales Tax Incentive
Part 1 The incentive is available by way ot deferral or exemption
of sales tax liability as shown below:
155

For MSI/LSI For SSI
Group '8 1 & Res-ource-Based Units 75% of FCI for 3 years 100% of FCI for 3 years
Group IC I 80% of t-CI for 5 years 100% of t-CI for !i years
Group lUi 85% of FC! for 7 years 100% of FC! for 7. years
Pioneer Unit 90% of FcI for 9 years
Part I I The 1ncentive 1S available by way of aeferral of sales tax
1 iabi1 ity of the existing unit. Sales tax deferred 1S
payable after 12 years in six equal annual instalments.
Scale
Group 18 1 £5% of FCI or 3 years STL, whichever is lower.
Group I l, I 30% of FC! OT 4 years ~TL, whichever is lower.
Group lUi 35% of FC! or 5 years ~TL, whichever is lower.
Pioneer Unit 4010 of FCI or 6 years STL,
Ceiling
Rs. 501akhs
Rs. 75 lakhs
Rs. 1 Ou 1 a kh s
KS. 150lakns : -, .. , .... ,;, .... ' .. , ...... .:. .. .whj.~I}~v~r. > i.,~,.1o.~~~ ! • ..; .'..,- .; ... ".' ....... ' :" .•..... ~_ ••.· ••. t· ~··1···.·· .• 1 ...
S.pecial Cap.ita.l Incentive
The incentive is availabJe as an outright grant, graded as follows.
~1S!/LSI Units SSI Units
Scale ceil i ng Scale Cei 1 i ng
Group 18 1 15% of FeI Rs. 1::> 1 akhs 20% of FCI Rs.7.5 1akhs
Group IC' 20% of Fe! Rs. 2u 1akhs 2~% of FCI Rs .1.5 1akhs
Group 'DI 20% of Fe! Rs. 2u 1akhs 25% of FCI Rs.7.5 1 akhs
Pi 0 neer Un it £5% of FCI Rs. 25 1 akhs
Note: SST, MSI. LSI: Small, medium and large scale units respectively.
FC! fixed capital investment.
STL sales tax liability.
156

Octroi Refund
Part I is available to new units for 3/5/7/9 years depending on
location in B/C/D areas or for a pioneer unlt.
Part II is available during implementation of the project, but not'
for expansion/diversification.
Contribution towards Cost of Feaslbility Study
75 per cent of the cost of preparing the feasibility study is borne
by the State Government. On implementation of the project, the
quantum is treated as an interest-bearing loan repayable after
five years.
Preferential Treatment in Government Purchase
33 per cent of the lndented quantities 1n government purchase is
reserved for eligible units. ~ .. 4· ·,·7.~··'J»-4~"'·"'.· ~ ........ , .... ~ •• ~::.);".ff; ...... :.~ .. :. ... ~-•... ;-•• :. ... ,\
The MIDC lncenti"ve and Housing SubSidy have been' drop'ped from. the
Package Scheme of 1983 ... ,
157

APPENDIX V.3 INSTITUTIONS FOR INDUSTRIAL uEVELOPMENT
Other than the MIDC. SICOM and MSFC, the following institutions have
been set up to assist regional development of industry.
Regional Development ~orporations (ROCs)
Maharashtra may be divided into four broad regions: Western Mahara
shtra, Konkan, Vidarbha and Marathwada. Four ROCs have been set up,
one for each region. over the period 1967-70. The major functions
of the ROCs are
a} to furnish techno-economic information on schemes and projects
that can be taken up in the respective regions by prospective
entrepreneurs and to playa promotional role with respect to
economic development;
. b ~···to· ~rforrn "cer:ta'i1'I""agency ~uncti'ol'i"s··o·n'·"bE!halfO'f .. ttre'.Sta'te "'" .. t..
Government for' economic development;
c) to encourage setting up of industries by attracting entreprene:urs
or by encouraging prospective local entrepreneurs to start
industries and to participate in equity capital if needed; and
d) in suitable cases, to set up divisions and subsidiaY'ies of the
Corporations for starting certain industries in the region or
for setting up projects in the jOint sector.
The RO~s are responsible for overall development, including
industrial development, of each region. They co-ordinate the
, activi ties of the various state-l evel agencies. In 1975, Regional
Co-ordination Committees were set up tor this purpose to be
achieved more effectively. The RDes especially promote schemes
which utilize locally available raw materials and are labour-
158

intensive. They implement the Package Scheme for small-scale units
and help in the implementation of the Capital Investment Subsidy of
the Central Government.
Udyog Mi tra
The Udyog Mitra was set up to assist large and medium scale units by
co-ordinating the facilities provided by the various State Government
institutions. This body consists of the Commissioner of Industries
and the chief executives of the other State Government agenci es.
Zilla Udyog Mitras have been set up at the district level along
similar lines to assist small-scale units. The members of these
bodies meet a few times every month, at various places in the! State,
to tackle the problems of entrepreneurs on-the-spot.
159

L _______ _____ _ _
160
MAP V.I
MAHARASHTRA
GROWTH CENTRES AND CLA SSIFICA TlON OF AREAS
FOR INCENTIVES
BOUNDARIES ----STATE - ------ DISTRICT - - - - - - -- TALUK
GREATER BOMBAY 2 THANE 1 KULABA
CL ~ S ~ICATION Cl' AREAS
.J. DEVELOPED AREAS
:;"8 0 FAIRLY DEVELO~ED AREAS O:J C l E SS DEVELOPED AR~AS ' t:l 0 c=:J LEAST DEVELCftO AI£AS _ I ~ INDUSTRIALLY BACKWARD ~O/STRCT
~ ~~~J ~1v~iL~~'tFAL . • ~~OWTH CENTRES - J
Source: Based on : Ma ha rashtra Tndustrjal Devel opm en t Corporation, MIne : J,eads the vlay f or Fntrepre-neurship in Maharashtra. -