Embed Size (px)
Citation preview
CHAPTER V
IMPACT OF PANDYAN GRAMA BANK’S CREDIT SCHEMES ON
BENEFICIARIES
The main focus of this chapter is to analyse the socio-economic
characteristics of the sample beneficiaries, namely, age and sex composition, size
of family, educational status, employment, income, expenditure, indebtedness and
savings. It also explains the impact of the bank loan on the economic conditions
of the respondents, such as, income, employment, expenditure, savings and debts
of the households of the respondents. The concerned economic variables before
bank assistance are compared with the corresponding figures after the bank
assistance, to find out the impact of the assistance on the households. Also the
various hypotheses are tested with suitable tools and the results are interpreted.
5.1 Details of the Bank Loan Procedure
Since the beneficiaries of the bank are mainly from the weaker sections, the
lending procedure and terms are simplified. The banks uses prescribed loan
application forms, for various types of loans. They are available in local languages
and the task of filling them is being done by the bank staff as majority of the
target group of beneficiaries are uneducated. Processing of the loan applications
involves checking the required documents and assessing the repayment capacity
of the applicant.
159
To assess the repayment capacity of the borrower the bank considers the
economic activities of the borrower. The bank obtains ‘no dues’ certificate from
other financial institutions operating in the area so as to avoid duplication of
credit. In the case of Government sponsored schemes the identification of poor
households, selection of beneficiaries and forwarding of application to bank are
undertaken by Block Development Officer. The time lag between forwarding of
application from Block Development Officer and disbursement of credit varied
from 15 days to 1 month.
The bank conducts a pre-sanction survey to assess the financial viability of
the loan activity. The loan applications will be rejected if there is any technical
objection or any inadequacy of required information. The decision of the Branch
Manager is final in sanctioning a loan. The bank accepts the hypothecation of
assets created from loan activity as security for the loans sanctioned. The bank
acts according to the guidelines issued by the NABARD relating to unit cost, unit
size, period of loan repayment and gestation period.
5.1.1 Purpose-wise Classification of Loans
The field survey referred to in Chapter V, covered 600 sample beneficiaries
financed by the 20 branches of the PGB selected for our study. This 600, includes
120 dairy loans beneficiaries, 120 sheep loan beneficiaries, 120 bullock cart loan
beneficiaries, 120 small business loan beneficiaries and 120 rural artisans.
160
i) Dairy Loan
Dairy assistance has always occupied an important place in the anti-
poverty programmes like Integrated Rural Development Programme. Maintenance
of milch animal fits well with the knowledge and skill of the rural households.
The milch animals are purchased with the help of a purchase committee which
consists of the beneficiary, the president of Milk Producer’s Co-operative Society,
the Bank Official and the Extension Officer (Animal Husbandary) of the blocks.
A unit consists of a pair of cows and its cost is Rs.6000. The animals are ear-
tagged for identification and insured on the spot for 3 years.
The repayment period was 5 years including the holiday or grace period of
one year. The mode of repayment was monthly. The interest rate was 10 per cent.
The security/ guarantee was hypothecation of assets.
ii) Sheep Loan
Loans are sanctioned for purchase of sheep of reputed breeds. A unit
consists of 20 ewes and one ram and its cost is Rs.5000. The repayment period
was 5 years including the grace or holiday period of one year. The mode of
repayment was half-yearly. The interest rate was 10 per cent.
161
iii) Work Bullock and Cart Loan
Loans were sanctioned for purchase of a pair of bullocks and a cart
(conventional/ modern). The unit cost was Rs.5500. Loans are to be repaid within
a period of 5 years. The mode of repayment was half-yearly. The interest rate was
10 per cent. The security/guarantee was hypothecation of assets.
iv) Small Business Loan
Loan under this scheme covers new business, development/ expansion of
existing small business. In the case of small business loan there was little
uniformity in the unit costs fixed. The amount of loan sanctioned under this
category varied from Rs.3000 to Rs.15000. The rate of interest on scheme loans
was 10 per cent and non-scheme loans was 12.5 per cent. Loan amount was
repayable within 36 months by monthly installments.
v) Rural Artisans
Under this scheme financial assistance was given to weavers, carpenters,
potters and the like. In the case of rural artisans there was no fixed unit cost. The
amount of loan sanctioned for rural artisans varied from Rs.3000 to Rs.15000.
The rate of interest on scheme loans was 10 per cent and non-scheme loans was
12.5 per cent. Loan amount was repayable within 3 years by monthly installments.
162
5.1.2 Subsidy
Borrowers who avail scheme loans are eligible to get subsidy. Small
farmers are eligible for a subsidy of 25 per cent of loan amount, marginal farmers,
agricultural labourers, and rural artisans for 33.33 per cent and scheduled caste/
scheduled tribe families enjoy a subsidy of 50 per cent. Subsidy and loan are to be
released simultaneously.
5.2 Discussion of Results
5.2.1 Age-wise Distribution
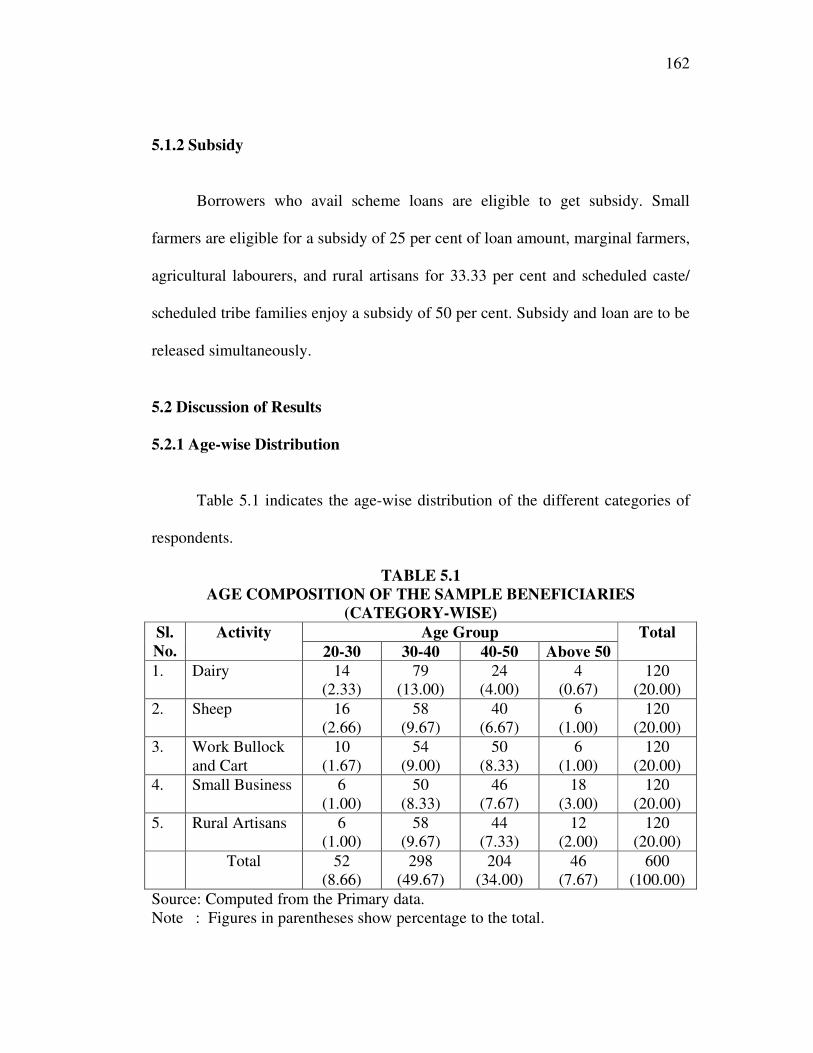
Table 5.1 indicates the age-wise distribution of the different categories of
respondents.
TABLE 5.1
AGE COMPOSITION OF THE SAMPLE BENEFICIARIES
(CATEGORY-WISE)
Sl.
No.
Activity Age Group Total
20-30 30-40 40-50 Above 50
1. Dairy 14
(2.33)
79
(13.00)
24
(4.00)
4
(0.67)
120
(20.00)
2. Sheep 16
(2.66)
58
(9.67)
40
(6.67)
6
(1.00)
120
(20.00)
3. Work Bullock
and Cart
10
(1.67)
54
(9.00)
50
(8.33)
6
(1.00)
120
(20.00)
4. Small Business 6
(1.00)
50
(8.33)
46
(7.67)
18
(3.00)
120
(20.00)
5. Rural Artisans 6
(1.00)
58
(9.67)
44
(7.33)
12
(2.00)
120
(20.00)
Total 52
(8.66)
298
(49.67)
204
(34.00)
46
(7.67)
600
(100.00)
Source: Computed from the Primary data.
Note : Figures in parentheses show percentage to the total.
163
Of the total 600 beneficiaries, 298 belong to the age group of 30-40, 102
belong to the age group of 40-50, 52 belong to the age group of 20-30 and 23
belong to the age group of above 50 years. This forms 49.67 per cent, 34.00 per
cent, 8.66 per cent and 7.67 per cent respectively. The information presented
indicates that Pandyan Grama Bank has a very large clientele in the age group 30
to 50 (about 84 per cent).
5.2.2 Sex-wise Distribution
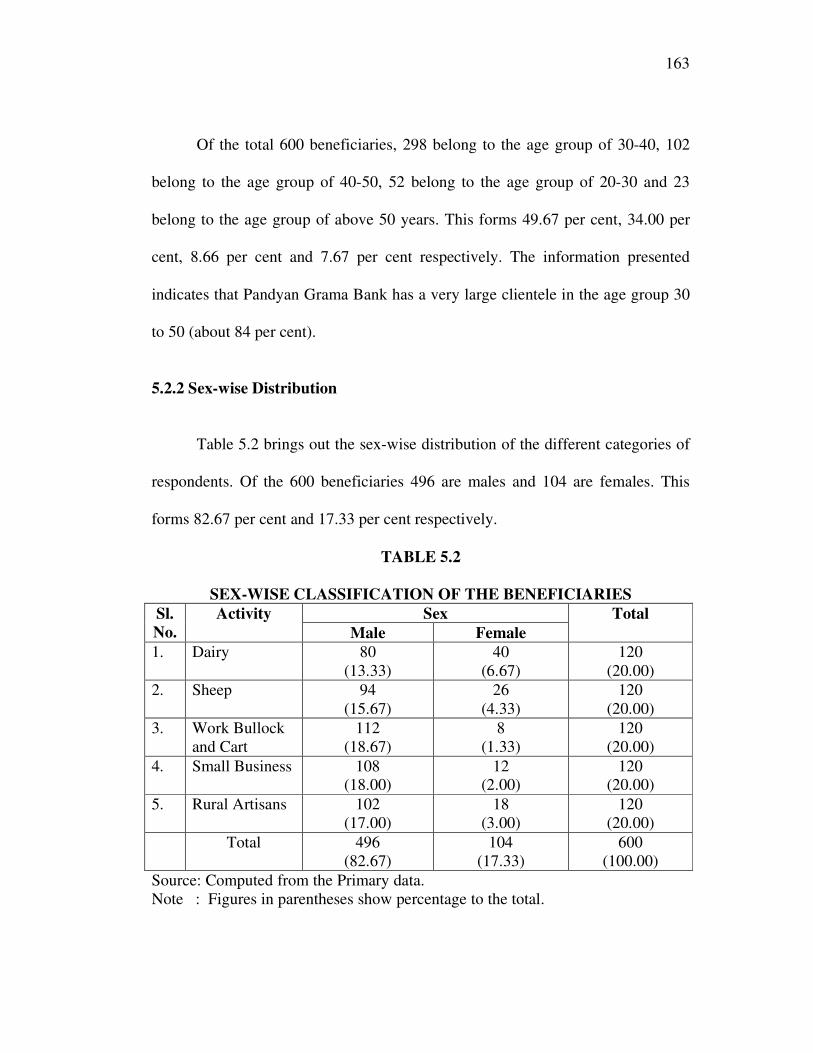
Table 5.2 brings out the sex-wise distribution of the different categories of
respondents. Of the 600 beneficiaries 496 are males and 104 are females. This
forms 82.67 per cent and 17.33 per cent respectively.
TABLE 5.2
SEX-WISE CLASSIFICATION OF THE BENEFICIARIES
Sl.
No.
Activity Sex Total
Male Female
1. Dairy 80
(13.33)
40
(6.67)
120
(20.00)
2. Sheep 94
(15.67)
26
(4.33)
120
(20.00)
3. Work Bullock
and Cart
112
(18.67)
8
(1.33)
120
(20.00)
4. Small Business 108
(18.00)
12
(2.00)
120
(20.00)
5. Rural Artisans 102
(17.00)
18
(3.00)
120
(20.00)
Total 496
(82.67)
104
(17.33)
600
(100.00)
Source: Computed from the Primary data.
Note : Figures in parentheses show percentage to the total.
164
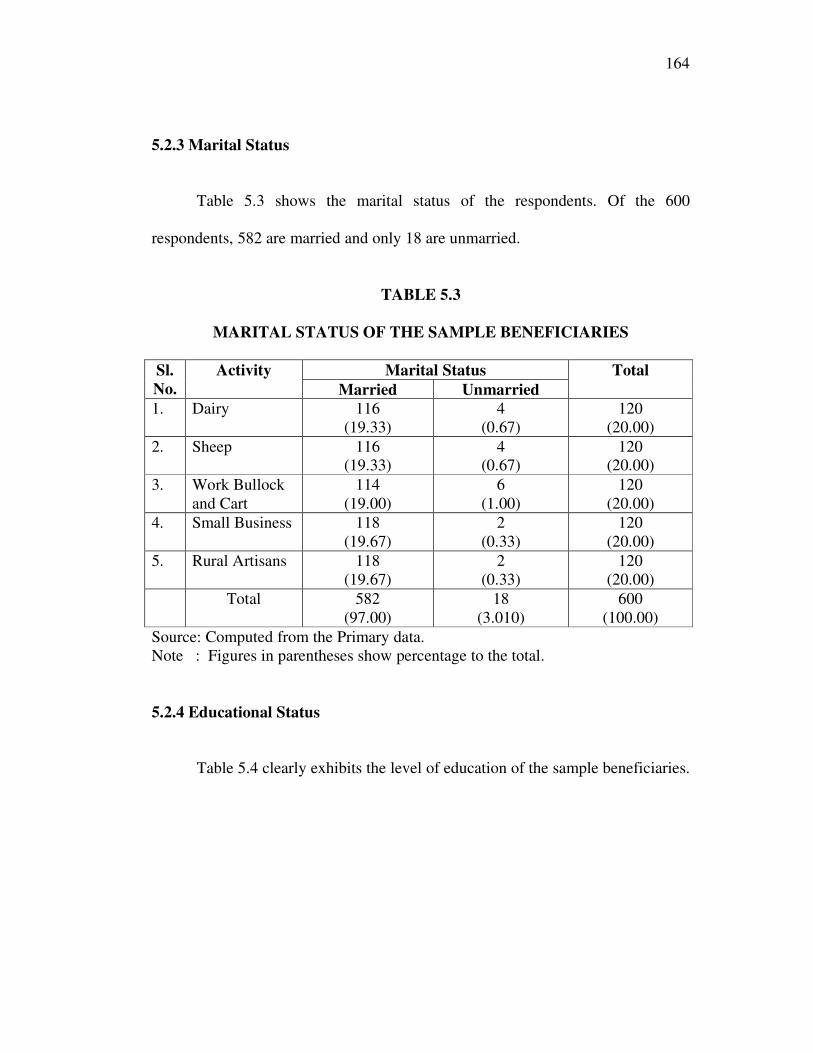
5.2.3 Marital Status
Table 5.3 shows the marital status of the respondents. Of the 600
respondents, 582 are married and only 18 are unmarried.
TABLE 5.3
MARITAL STATUS OF THE SAMPLE BENEFICIARIES
Sl.
No.
Activity Marital Status Total
Married Unmarried
1. Dairy 116
(19.33)
4
(0.67)
120
(20.00)
2. Sheep 116
(19.33)
4
(0.67)
120
(20.00)
3. Work Bullock
and Cart
114
(19.00)
6
(1.00)
120
(20.00)
4. Small Business 118
(19.67)
2
(0.33)
120
(20.00)
5. Rural Artisans 118
(19.67)
2
(0.33)
120
(20.00)
Total 582
(97.00)
18
(3.010)
600
(100.00)
Source: Computed from the Primary data.
Note : Figures in parentheses show percentage to the total.
5.2.4 Educational Status
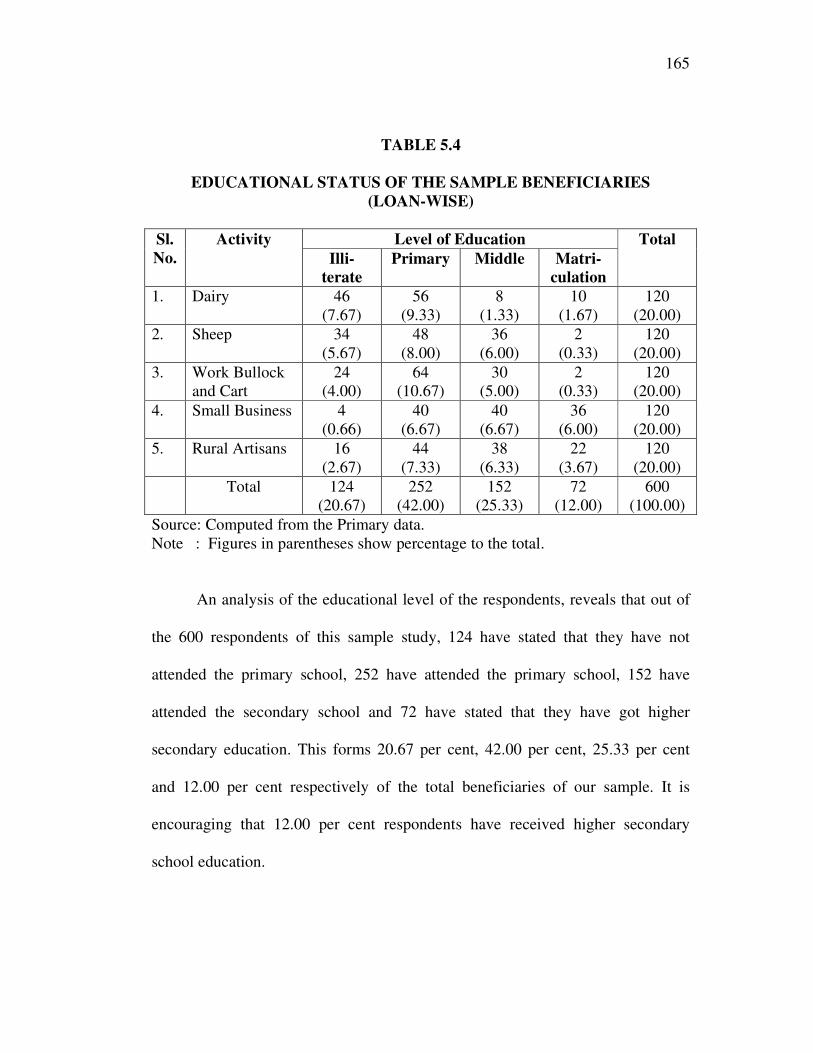
Table 5.4 clearly exhibits the level of education of the sample beneficiaries.
165
TABLE 5.4
EDUCATIONAL STATUS OF THE SAMPLE BENEFICIARIES
(LOAN-WISE)
Sl.
No.
Activity Level of Education Total
Illi-
terate
Primary Middle Matri-
culation
1. Dairy 46
(7.67)
56
(9.33)
8
(1.33)
10
(1.67)
120
(20.00)
2. Sheep 34
(5.67)
48
(8.00)
36
(6.00)
2
(0.33)
120
(20.00)
3. Work Bullock
and Cart
24
(4.00)
64
(10.67)
30
(5.00)
2
(0.33)
120
(20.00)
4. Small Business 4
(0.66)
40
(6.67)
40
(6.67)
36
(6.00)
120
(20.00)
5. Rural Artisans 16
(2.67)
44
(7.33)
38
(6.33)
22
(3.67)
120
(20.00)
Total 124
(20.67)
252
(42.00)
152
(25.33)
72
(12.00)
600
(100.00)
Source: Computed from the Primary data.
Note : Figures in parentheses show percentage to the total.
An analysis of the educational level of the respondents, reveals that out of
the 600 respondents of this sample study, 124 have stated that they have not
attended the primary school, 252 have attended the primary school, 152 have
attended the secondary school and 72 have stated that they have got higher
secondary education. This forms 20.67 per cent, 42.00 per cent, 25.33 per cent
and 12.00 per cent respectively of the total beneficiaries of our sample. It is
encouraging that 12.00 per cent respondents have received higher secondary
school education.
166
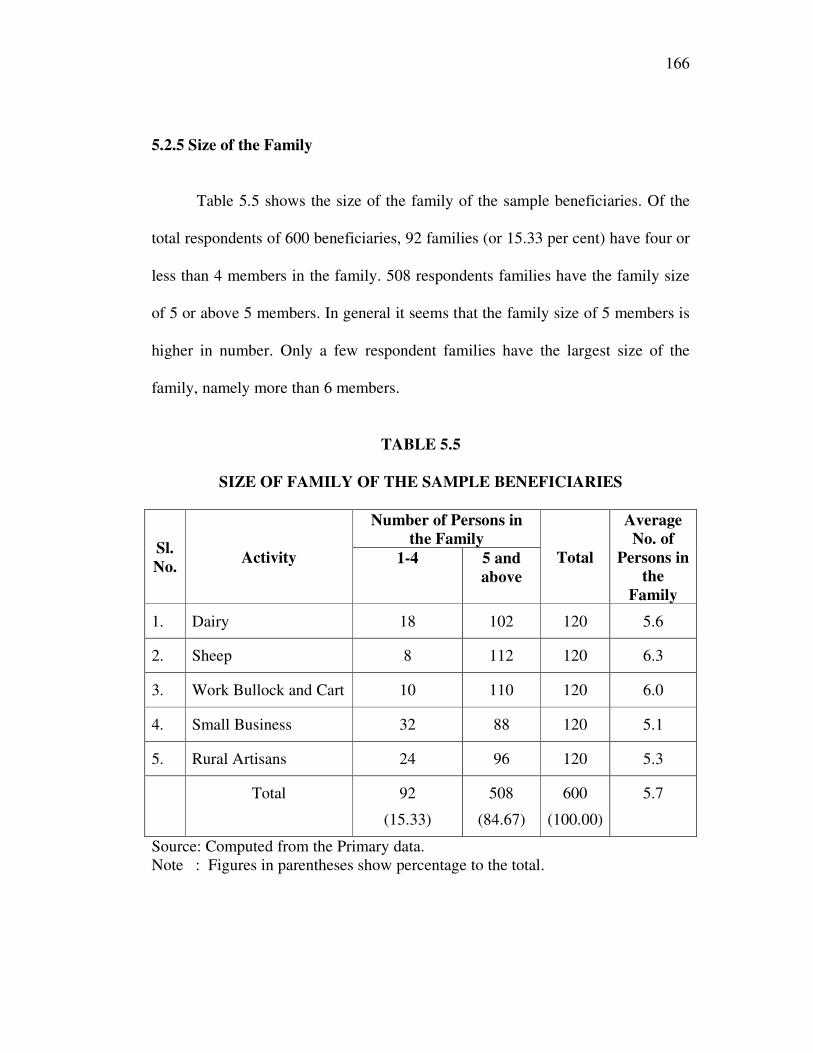
5.2.5 Size of the Family
Table 5.5 shows the size of the family of the sample beneficiaries. Of the
total respondents of 600 beneficiaries, 92 families (or 15.33 per cent) have four or
less than 4 members in the family. 508 respondents families have the family size
of 5 or above 5 members. In general it seems that the family size of 5 members is
higher in number. Only a few respondent families have the largest size of the
family, namely more than 6 members.
TABLE 5.5
SIZE OF FAMILY OF THE SAMPLE BENEFICIARIES
Sl.
No. Activity
Number of Persons in
the Family
Total
Average
No. of
Persons in
the
Family
1-4 5 and
above
1. Dairy 18 102 120 5.6
2. Sheep 8 112 120 6.3
3. Work Bullock and Cart 10 110 120 6.0
4. Small Business 32 88 120 5.1
5. Rural Artisans 24 96 120 5.3
Total 92
(15.33)
508
(84.67)
600
(100.00)
5.7
Source: Computed from the Primary data.
Note : Figures in parentheses show percentage to the total.
167
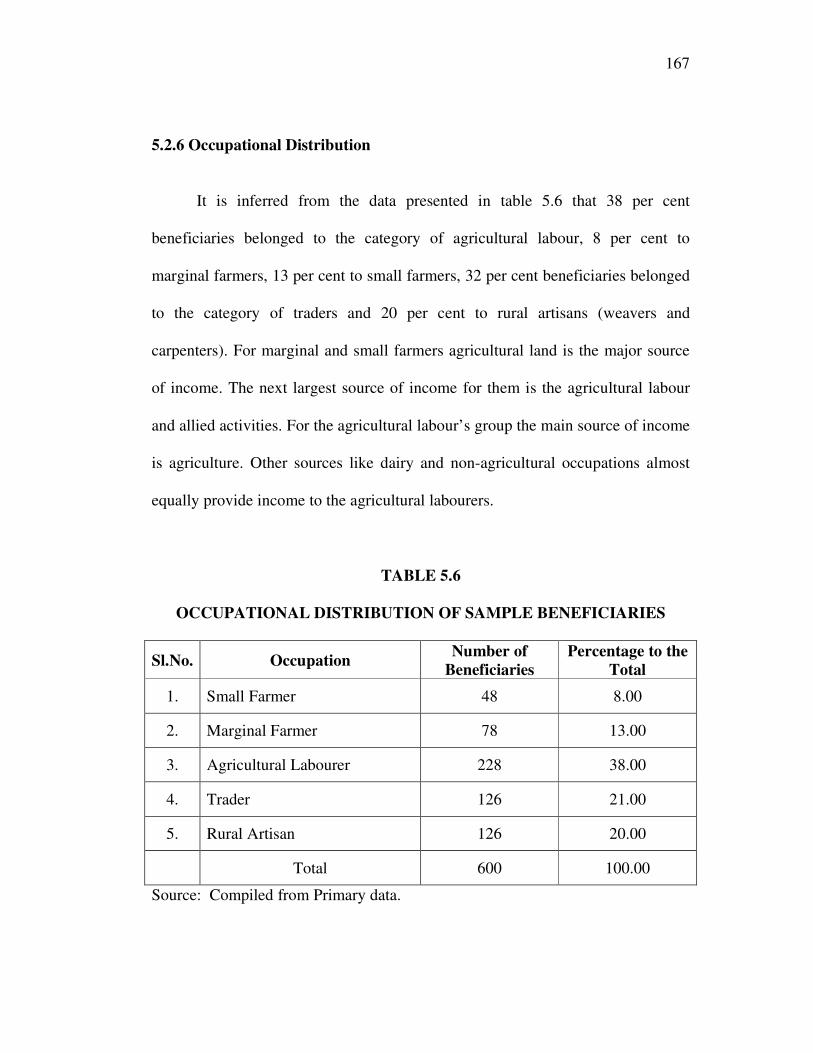
5.2.6 Occupational Distribution
It is inferred from the data presented in table 5.6 that 38 per cent
beneficiaries belonged to the category of agricultural labour, 8 per cent to
marginal farmers, 13 per cent to small farmers, 32 per cent beneficiaries belonged
to the category of traders and 20 per cent to rural artisans (weavers and
carpenters). For marginal and small farmers agricultural land is the major source
of income. The next largest source of income for them is the agricultural labour
and allied activities. For the agricultural labour’s group the main source of income
is agriculture. Other sources like dairy and non-agricultural occupations almost
equally provide income to the agricultural labourers.
TABLE 5.6
OCCUPATIONAL DISTRIBUTION OF SAMPLE BENEFICIARIES
Sl.No. Occupation Number of
Beneficiaries
Percentage to the
Total
1. Small Farmer 48 8.00
2. Marginal Farmer 78 13.00
3. Agricultural Labourer 228 38.00
4. Trader 126 21.00
5. Rural Artisan 126 20.00
Total 600 100.00
Source: Compiled from Primary data.
168
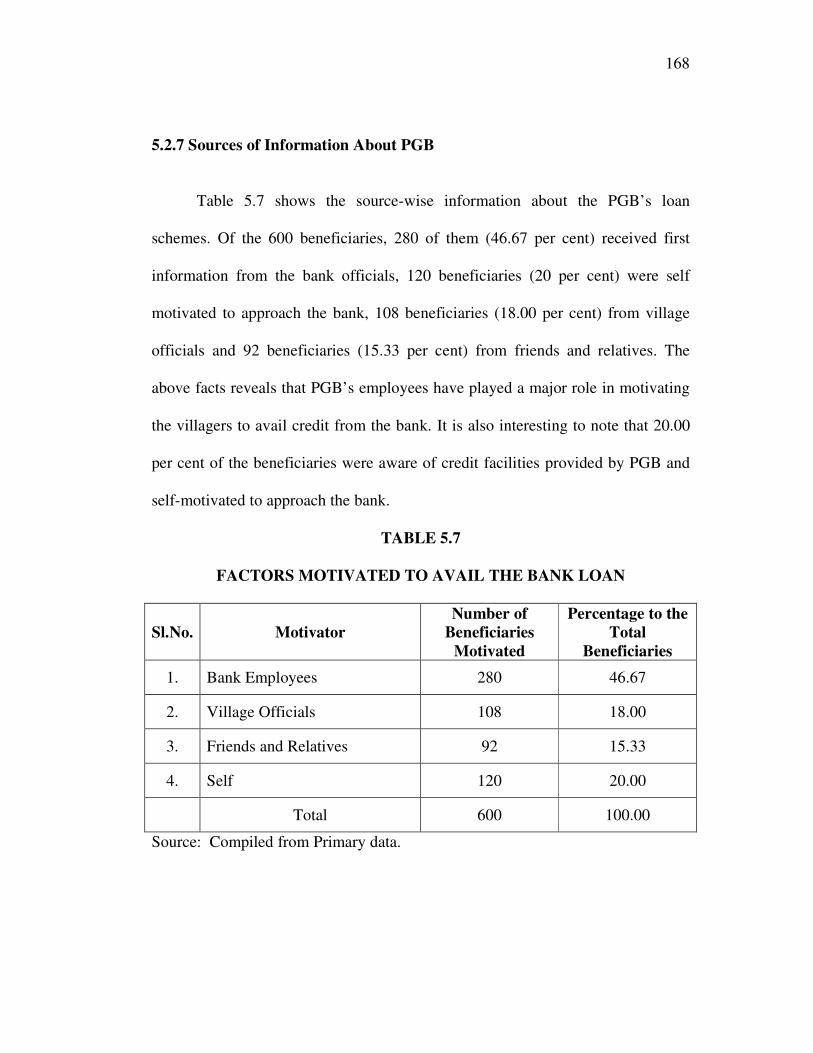
5.2.7 Sources of Information About PGB
Table 5.7 shows the source-wise information about the PGB’s loan
schemes. Of the 600 beneficiaries, 280 of them (46.67 per cent) received first
information from the bank officials, 120 beneficiaries (20 per cent) were self
motivated to approach the bank, 108 beneficiaries (18.00 per cent) from village
officials and 92 beneficiaries (15.33 per cent) from friends and relatives. The
above facts reveals that PGB’s employees have played a major role in motivating
the villagers to avail credit from the bank. It is also interesting to note that 20.00
per cent of the beneficiaries were aware of credit facilities provided by PGB and
self-motivated to approach the bank.
TABLE 5.7
FACTORS MOTIVATED TO AVAIL THE BANK LOAN
Sl.No. Motivator
Number of
Beneficiaries
Motivated
Percentage to the
Total
Beneficiaries
1. Bank Employees 280 46.67
2. Village Officials 108 18.00
3. Friends and Relatives 92 15.33
4. Self 120 20.00
Total 600 100.00
Source: Compiled from Primary data.
169
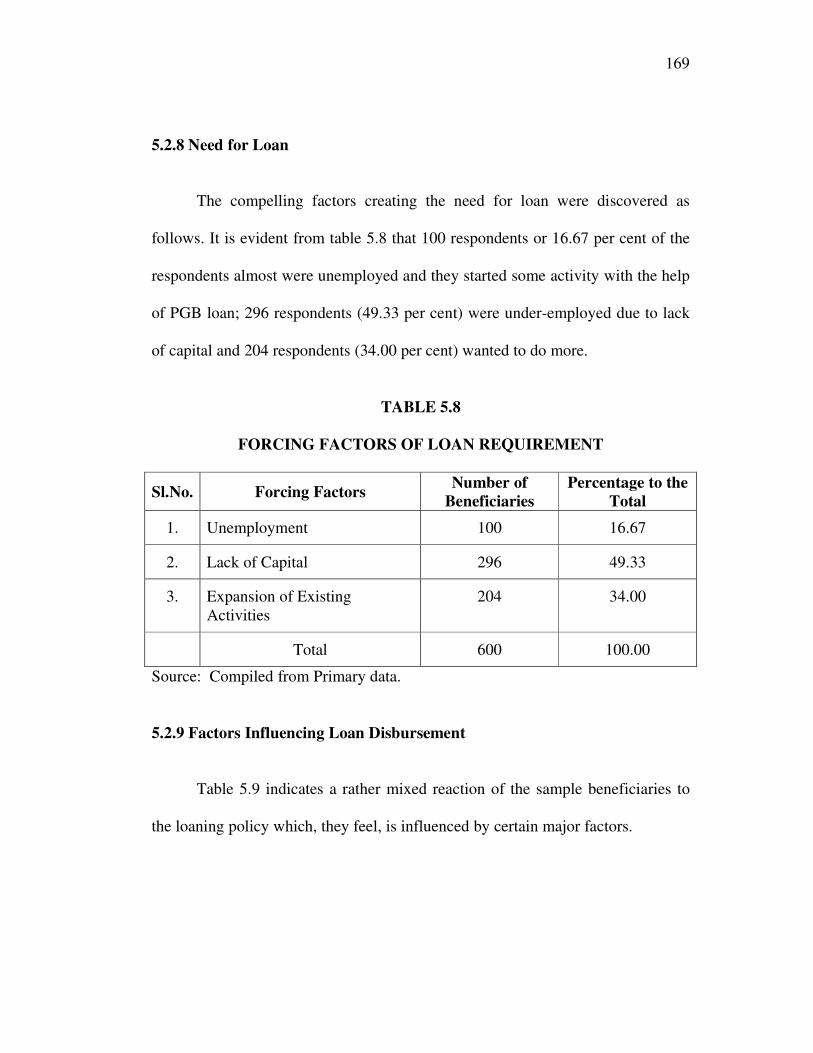
5.2.8 Need for Loan
The compelling factors creating the need for loan were discovered as
follows. It is evident from table 5.8 that 100 respondents or 16.67 per cent of the
respondents almost were unemployed and they started some activity with the help
of PGB loan; 296 respondents (49.33 per cent) were under-employed due to lack
of capital and 204 respondents (34.00 per cent) wanted to do more.
TABLE 5.8
FORCING FACTORS OF LOAN REQUIREMENT
Sl.No. Forcing Factors Number of
Beneficiaries
Percentage to the
Total
1. Unemployment 100 16.67
2. Lack of Capital 296 49.33
3. Expansion of Existing
Activities
204 34.00
Total 600 100.00
Source: Compiled from Primary data.
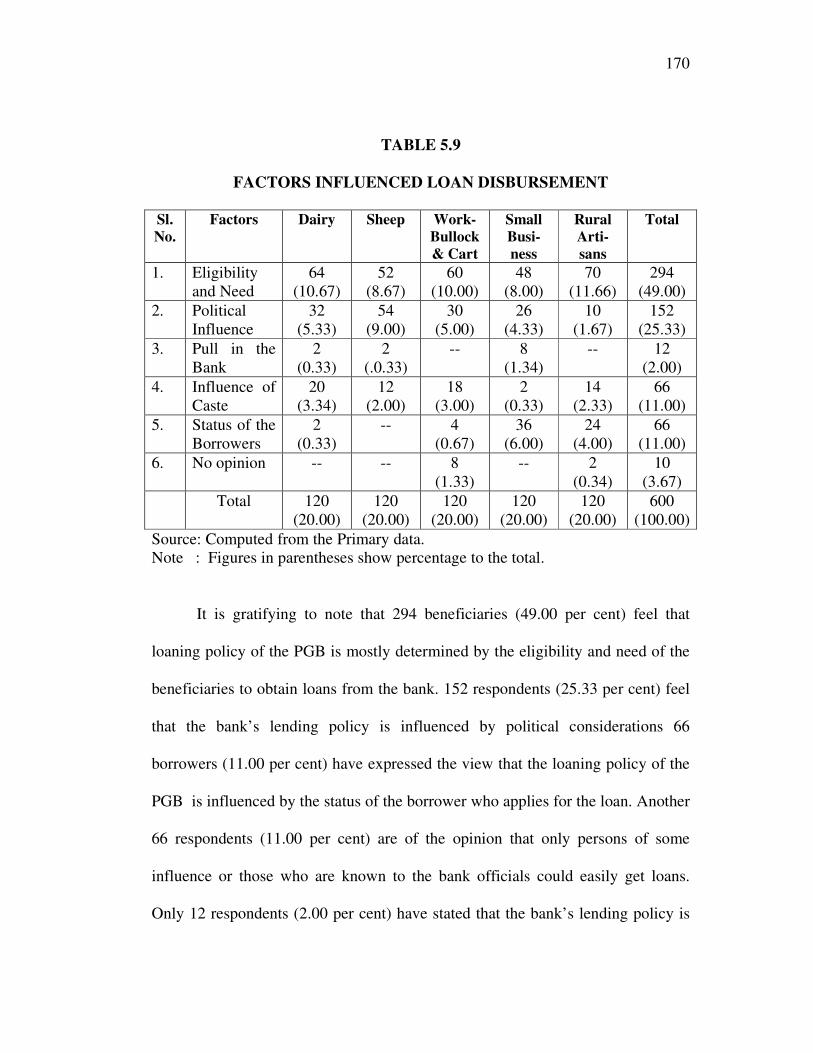
5.2.9 Factors Influencing Loan Disbursement
Table 5.9 indicates a rather mixed reaction of the sample beneficiaries to
the loaning policy which, they feel, is influenced by certain major factors.
170
TABLE 5.9
FACTORS INFLUENCED LOAN DISBURSEMENT
Sl.
No.
Factors Dairy Sheep Work-
Bullock
& Cart
Small
Busi-
ness
Rural
Arti-
sans
Total
1. Eligibility
and Need
64
(10.67)
52
(8.67)
60
(10.00)
48
(8.00)
70
(11.66)
294
(49.00)
2. Political
Influence
32
(5.33)
54
(9.00)
30
(5.00)
26
(4.33)
10
(1.67)
152
(25.33)
3. Pull in the
Bank
2
(0.33)
2
(.0.33)
-- 8
(1.34)
-- 12
(2.00)
4. Influence of
Caste
20
(3.34)
12
(2.00)
18
(3.00)
2
(0.33)
14
(2.33)
66
(11.00)
5. Status of the
Borrowers
2
(0.33)
-- 4
(0.67)
36
(6.00)
24
(4.00)
66
(11.00)
6. No opinion -- -- 8
(1.33)
-- 2
(0.34)
10
(3.67)
Total 120
(20.00)
120
(20.00)
120
(20.00)
120
(20.00)
120
(20.00)
600
(100.00)
Source: Computed from the Primary data.
Note : Figures in parentheses show percentage to the total.
It is gratifying to note that 294 beneficiaries (49.00 per cent) feel that
loaning policy of the PGB is mostly determined by the eligibility and need of the
beneficiaries to obtain loans from the bank. 152 respondents (25.33 per cent) feel
that the bank’s lending policy is influenced by political considerations 66
borrowers (11.00 per cent) have expressed the view that the loaning policy of the
PGB is influenced by the status of the borrower who applies for the loan. Another
66 respondents (11.00 per cent) are of the opinion that only persons of some
influence or those who are known to the bank officials could easily get loans.
Only 12 respondents (2.00 per cent) have stated that the bank’s lending policy is
171
influenced by caste consideration. In fact, this finding is of great significance,
chiefly because it amply proves that the bank’s policy is not biased by casteism.
The last category of beneficiaries who formed 1.67 per cent of the total number
of sample beneficiaries had declined to express any opinion at all. But from the
discussions with these beneficiaries, the impression formed is that if they
expressed any adverse opinion about the bank, it might possibly affect their future
relations with the bank.
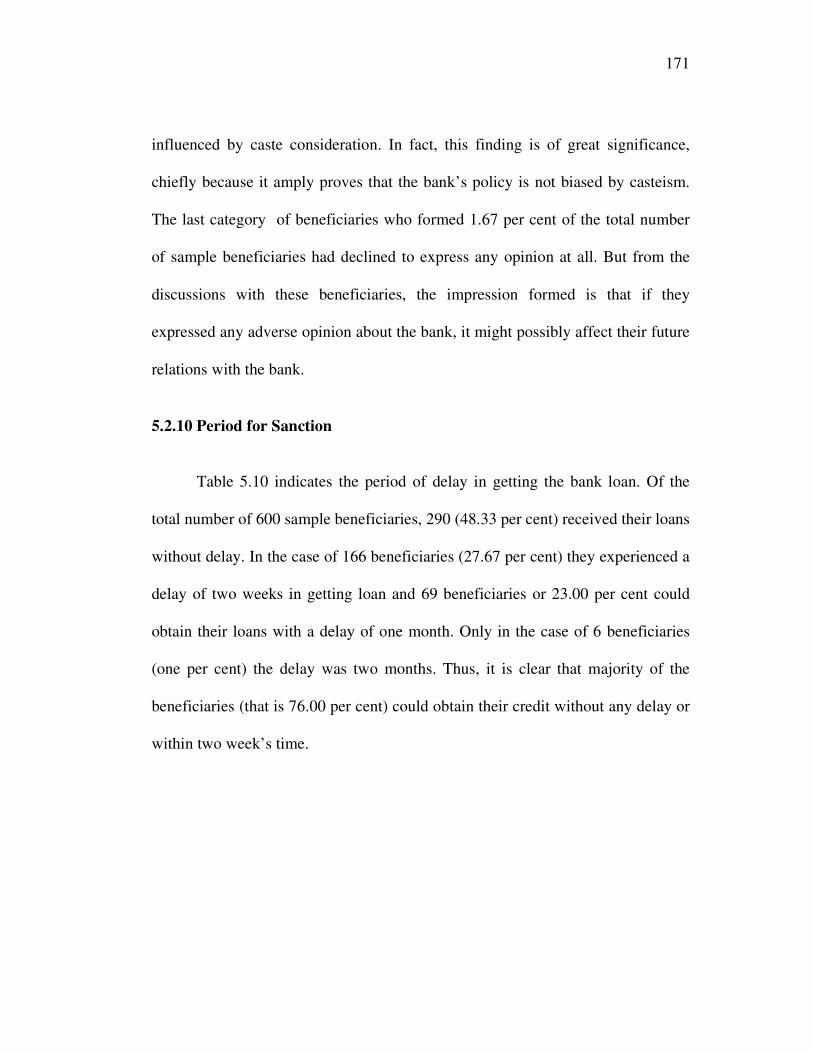
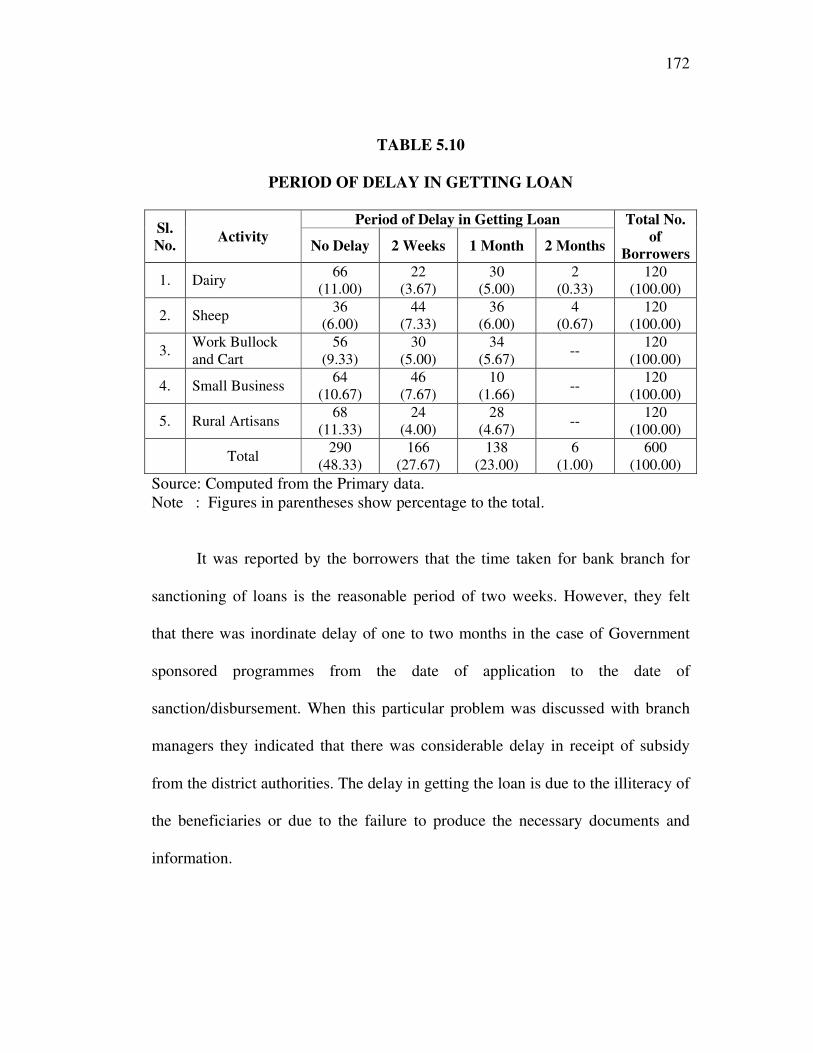
5.2.10 Period for Sanction
Table 5.10 indicates the period of delay in getting the bank loan. Of the
total number of 600 sample beneficiaries, 290 (48.33 per cent) received their loans
without delay. In the case of 166 beneficiaries (27.67 per cent) they experienced a
delay of two weeks in getting loan and 69 beneficiaries or 23.00 per cent could
obtain their loans with a delay of one month. Only in the case of 6 beneficiaries
(one per cent) the delay was two months. Thus, it is clear that majority of the
beneficiaries (that is 76.00 per cent) could obtain their credit without any delay or
within two week’s time.
172
TABLE 5.10
PERIOD OF DELAY IN GETTING LOAN
Sl.
No. Activity
Period of Delay in Getting Loan Total No.
of
Borrowers No Delay 2 Weeks 1 Month 2 Months
1. Dairy 66
(11.00)
22
(3.67)
30
(5.00)
2
(0.33)
120
(100.00)
2. Sheep 36
(6.00)
44
(7.33)
36
(6.00)
4
(0.67)
120
(100.00)
3. Work Bullock
and Cart
56
(9.33)
30
(5.00)
34
(5.67) --
120
(100.00)
4. Small Business 64
(10.67)
46
(7.67)
10
(1.66) --
120
(100.00)
5. Rural Artisans 68
(11.33)
24
(4.00)
28
(4.67) --
120
(100.00)
Total 290
(48.33)
166
(27.67)
138
(23.00)
6
(1.00)
600
(100.00)
Source: Computed from the Primary data.
Note : Figures in parentheses show percentage to the total.
It was reported by the borrowers that the time taken for bank branch for
sanctioning of loans is the reasonable period of two weeks. However, they felt
that there was inordinate delay of one to two months in the case of Government
sponsored programmes from the date of application to the date of
sanction/disbursement. When this particular problem was discussed with branch
managers they indicated that there was considerable delay in receipt of subsidy
from the district authorities. The delay in getting the loan is due to the illiteracy of
the beneficiaries or due to the failure to produce the necessary documents and
information.
173
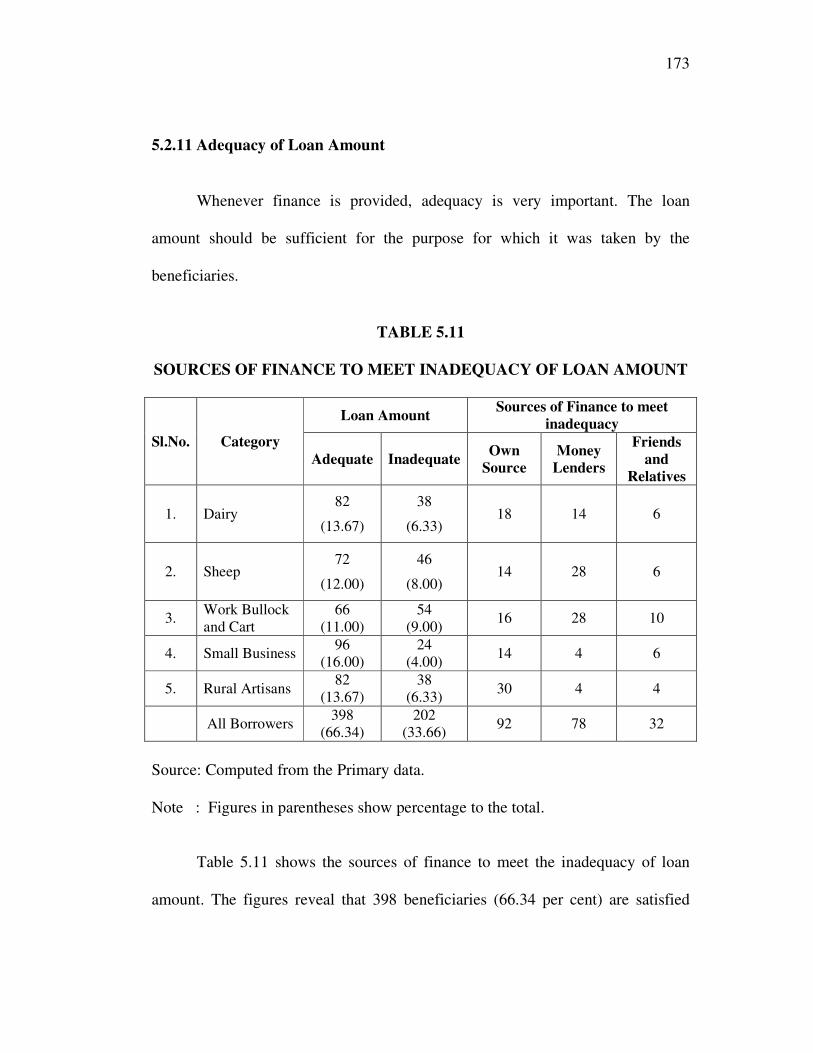
5.2.11 Adequacy of Loan Amount
Whenever finance is provided, adequacy is very important. The loan
amount should be sufficient for the purpose for which it was taken by the
beneficiaries.
TABLE 5.11
SOURCES OF FINANCE TO MEET INADEQUACY OF LOAN AMOUNT
Sl.No. Category
Loan Amount Sources of Finance to meet
inadequacy
Adequate Inadequate Own
Source
Money
Lenders
Friends
and
Relatives
1. Dairy 82
(13.67)
38
(6.33) 18 14 6
2. Sheep 72
(12.00)
46
(8.00) 14 28 6
3. Work Bullock
and Cart
66
(11.00)
54
(9.00) 16 28 10
4. Small Business 96
(16.00)
24
(4.00) 14 4 6
5. Rural Artisans 82
(13.67)
38
(6.33) 30 4 4
All Borrowers 398
(66.34)
202
(33.66) 92 78 32
Source: Computed from the Primary data.
Note : Figures in parentheses show percentage to the total.
Table 5.11 shows the sources of finance to meet the inadequacy of loan
amount. The figures reveal that 398 beneficiaries (66.34 per cent) are satisfied
174
with the adequacy of credit and remaining 202 beneficiaries (33.66 per cent) said
that they had to borrow to compensate the shortage. The inadequacy of credit is
one of the important reasons that have resulted in the credit granted by the bank
being not used for specific purposes. The table further reveals that 92
beneficiaries overcome the credit gap getting money from their own source (that
is, past savings), 39 beneficiaries from money lenders and 16 beneficiaries from
friends and relatives.
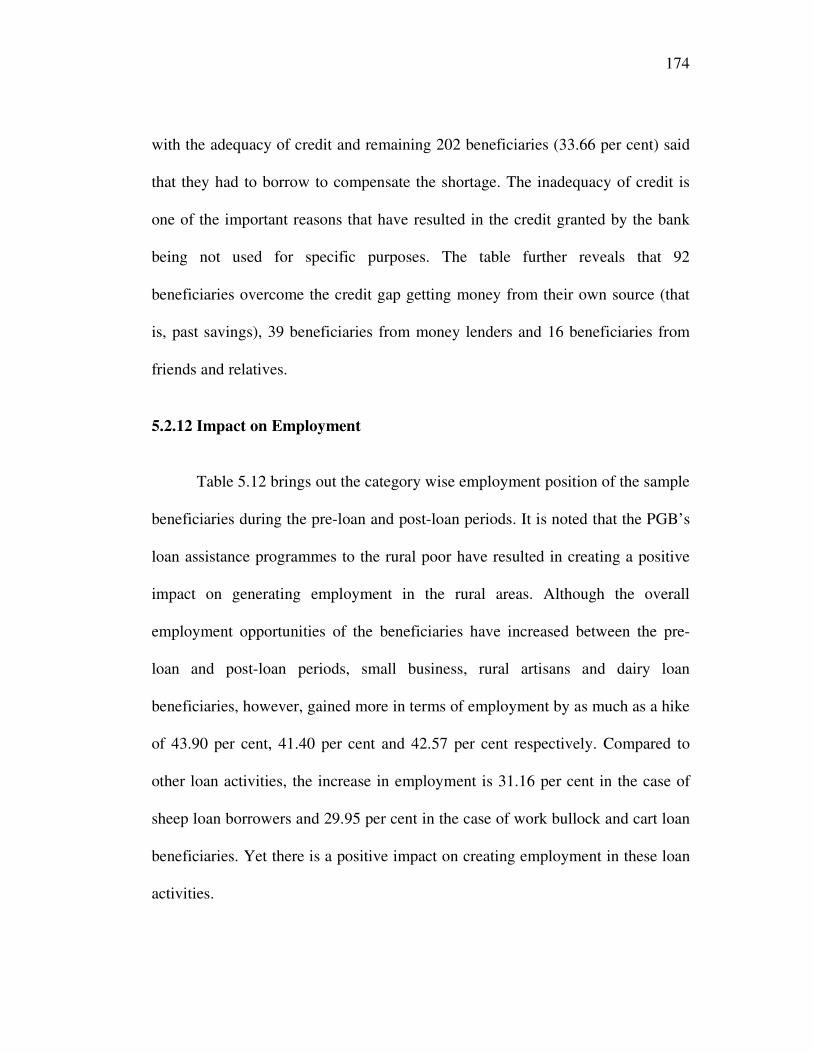
5.2.12 Impact on Employment
Table 5.12 brings out the category wise employment position of the sample
beneficiaries during the pre-loan and post-loan periods. It is noted that the PGB’s
loan assistance programmes to the rural poor have resulted in creating a positive
impact on generating employment in the rural areas. Although the overall
employment opportunities of the beneficiaries have increased between the pre-
loan and post-loan periods, small business, rural artisans and dairy loan
beneficiaries, however, gained more in terms of employment by as much as a hike
of 43.90 per cent, 41.40 per cent and 42.57 per cent respectively. Compared to
other loan activities, the increase in employment is 31.16 per cent in the case of
sheep loan borrowers and 29.95 per cent in the case of work bullock and cart loan
beneficiaries. Yet there is a positive impact on creating employment in these loan
activities.
175
TABLE 5.12
EMPLOYMENT POSITION OF THE SAMPLE BENEFICIARIES IN THE
PRE-LOAN AND POST-LOAN PERIODS (AVERAGE ANNUAL
EMPLOYMENT PER BORROWER IN MANDAYS)
Sl.
No.
Activity Average Employment Percentage
of Increase
t-test
Pre-Loan
Period
Post-Loan
Period
1. Daily 404 576 42.47 32.30*
2. Sheep 398 522 31.16 13.63*
3. Work Bullock and Cart 414 546 29.95 15.12*
4. Small Business 410 590 43.90 21.57*
5. Rural Artisans 430 608 41.40 31.41*
Total 412 568 36.89 40.66*
Source: Computed from the Primary data.
Note : * Indicates the difference between Pre-loan and Post-loan employment
and it is statistically significant at 5 per cent level.
In order to test the null hypothesis that there is no difference between
employment position in different activities in the pre-loan and that in post-loan
period, t-test has been employed for each category. The estimated results of t-test
presented in table 5.13 reveals that the difference between the employment
position in the pre-loan period and that in post-loan period for all activities is
statistically significant at 5 per cent level. Hence, the null hypothesis is rejected.
Thus, it may be concluded that the PGBs’ loan schemes have generated
employment to the beneficiaries.
176
5.2.13 Impact on Income
The ultimate benefit of bank finance to the rural poor has been analysed by
finding out whether any change in income has taken place during the post-loan
period and if so to what extent. The researcher has done this by analysing the
relevant data and quantifying them for the purpose of working out the net
incremental income. The incremental income is taken to be the difference between
the post- investment and pre-investment net income of beneficiary.
The sample beneficiaries and members of their families pursued other
occupations besides the activities financed by the bank branches. The productive
loan activities carried out by the sample beneficiaries with the credit assistance
from the bank branches made an impressive contribution to raising the household
net income of the sample beneficiaries of the five districts.
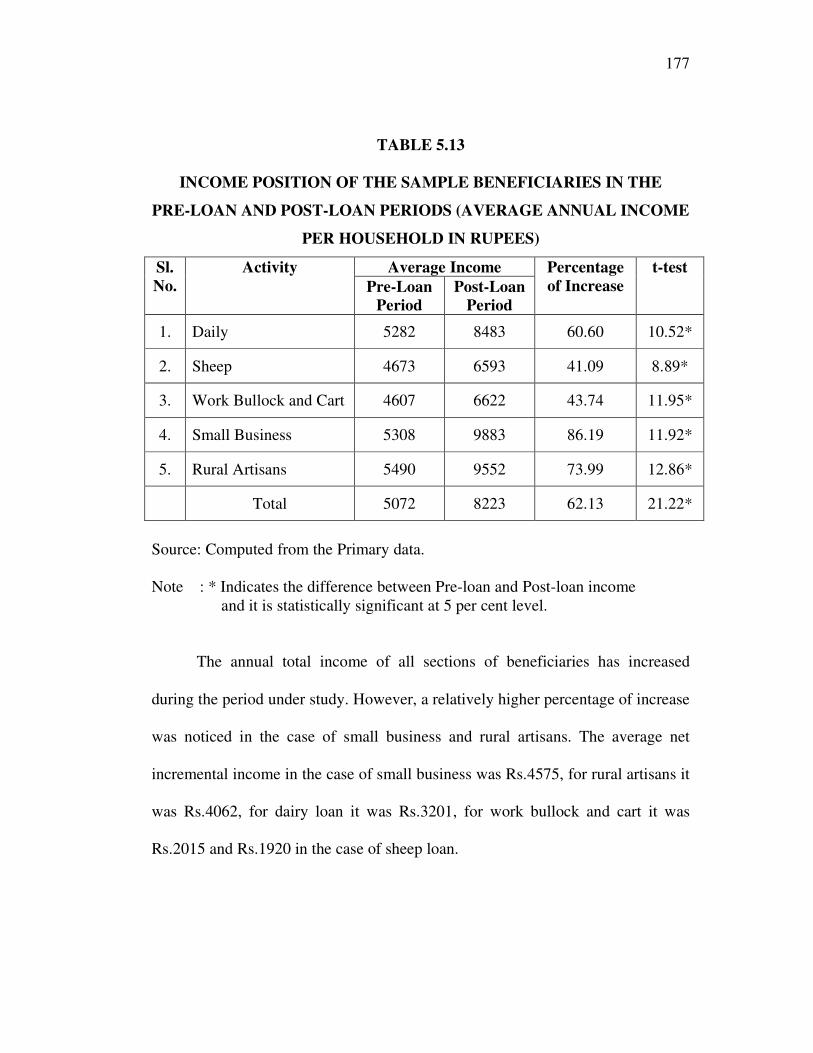
Table 5.13 shows the income position of the sample beneficiaries before
and after availing the bank loan. The annual total income earned by the sample
beneficiaries as a whole averaged at Rs.8223 which is higher by 60.63 per cent
than the sum of Rs.5072 calculated for the pre-loan period.
177
TABLE 5.13
INCOME POSITION OF THE SAMPLE BENEFICIARIES IN THE
PRE-LOAN AND POST-LOAN PERIODS (AVERAGE ANNUAL INCOME
PER HOUSEHOLD IN RUPEES)
Sl.
No.
Activity Average Income Percentage
of Increase
t-test
Pre-Loan
Period
Post-Loan
Period
1. Daily 5282 8483 60.60 10.52*
2. Sheep 4673 6593 41.09 8.89*
3. Work Bullock and Cart 4607 6622 43.74 11.95*
4. Small Business 5308 9883 86.19 11.92*
5. Rural Artisans 5490 9552 73.99 12.86*
Total 5072 8223 62.13 21.22*
Source: Computed from the Primary data.
Note : * Indicates the difference between Pre-loan and Post-loan income
and it is statistically significant at 5 per cent level.
The annual total income of all sections of beneficiaries has increased
during the period under study. However, a relatively higher percentage of increase
was noticed in the case of small business and rural artisans. The average net
incremental income in the case of small business was Rs.4575, for rural artisans it
was Rs.4062, for dairy loan it was Rs.3201, for work bullock and cart it was
Rs.2015 and Rs.1920 in the case of sheep loan.
178
The activities of the small businessmen and rural artisans proved to be the
most remunerative among the five different activities. The increase in net income
in percentage terms was the highest in small business (86.19 per cent) followed by
rural artisans’ activities (73.99 per cent) and dairy (60.60 per cent). But it was the
lowest in the case of sheep loan beneficiaries (41.09 per cent) and work bullock
and cart loan beneficiaries 943.74 per cent). The bullock and cart and sheep loan
beneficiaries are the least benefited.
The review of the PGB’s loan assistance in the five operational districts
during the period under study clearly brings out the fact that the credit extended to
different categories of beneficiaries produced significantly beneficial impact in
terms of higher levels of income. This field survey had demonstrated that the
increase in income per beneficiary was higher in the post-loan period as compared
to that in the pre-loan period. The figures indicate that after availing the bank
loans, the sample beneficiaries devoted more time and attention to the activities
financed and succeeded in making profitable use of the funds.
On a further probe into the various internal and external factors which
influenced the income generating process it was found that there were positive
and encouraging internal factors such as (i) creation, possession and maximum
utilisation of assets out of bank assistance ii) previous experience of the borrowers
in the activities financed and external factors such as i) increased demand for
179
goods and services and (ii) recent developments in infrastructural facilities. At the
same time there were negative and hindering internal factors such as (i)
inadequate loan amount, (ii) multiple financing and external factors such as (i)
poor and inadequate supporting arrangements, (ii) stiff competition in business
and (iii) increase in cost of inputs. These factors have been identified as the most
important variables in income generating process under different loan activities.
The null hypothesis that there is no difference between the average annual
income per household in the pre-loan period and that in post-loan period for all
activities has been tested by applying t-test. The computed results presented in
table 5.14 that the differences are significant at 5 per cent level for all activities
and the null hypothesis is rejected. Hence, the alternative hypothesis framed is
that the income of the beneficiaries of different activities has increased after
availing the bank credit. It could be observed from the data shown in table 5.15
that the income of the beneficiaries has increased after availing the bank loan.
basing on the statistical results it is concluded that there is a substantial increase in
the income of the beneficiaries of all activities after getting bank credit.
5.2.14 Percentage Increase in the Household Income
The primary objective of the survey of respondent households was to find
out the impact of the credit facilities offered by the PGB between 1987 and 1989.
To what extent did their incomes and economic status improve? To answer this
180
question, the respondents annual incomes before and after the utilisation of the
loans were ascertained and processed. It is a matter of satisfaction that none of
sample households recorded a fall in annual income after availing the bank loans.
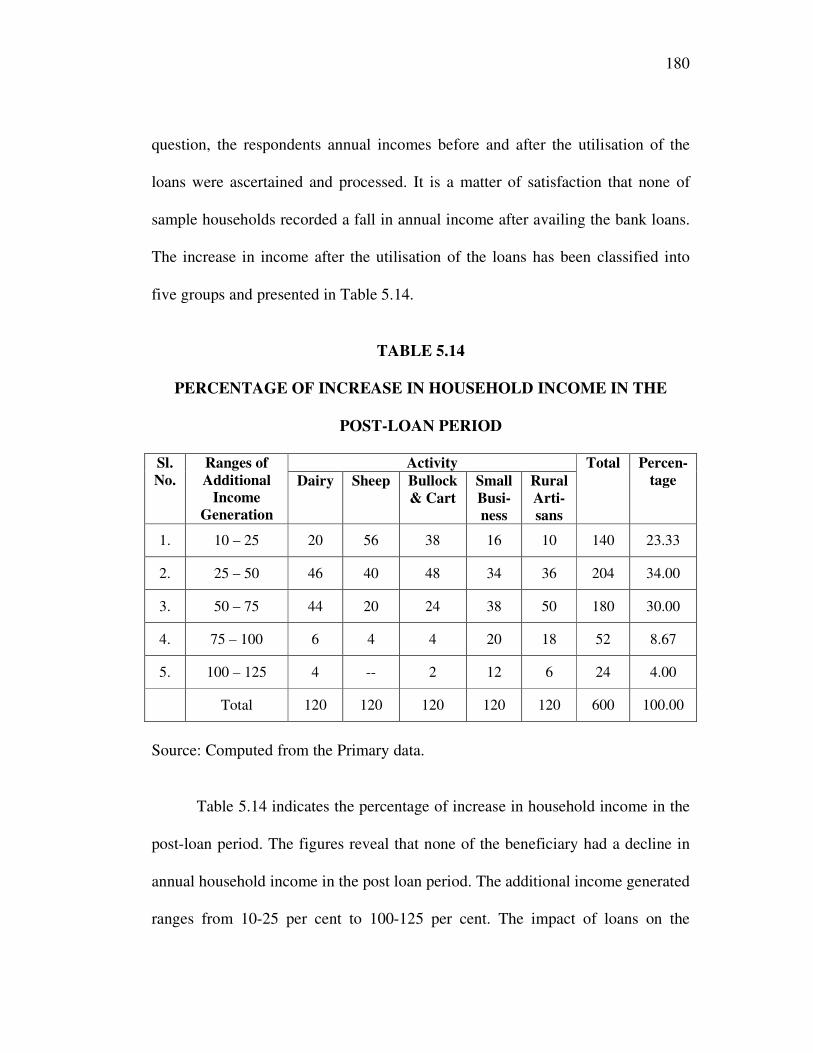
The increase in income after the utilisation of the loans has been classified into
five groups and presented in Table 5.14.
TABLE 5.14
PERCENTAGE OF INCREASE IN HOUSEHOLD INCOME IN THE
POST-LOAN PERIOD
Sl.
No.
Ranges of
Additional
Income
Generation
Activity Total Percen-
tage Dairy Sheep Bullock
& Cart
Small
Busi-
ness
Rural
Arti-
sans
1. 10 – 25 20 56 38 16 10 140 23.33
2. 25 – 50 46 40 48 34 36 204 34.00
3. 50 – 75 44 20 24 38 50 180 30.00
4. 75 – 100 6 4 4 20 18 52 8.67
5. 100 – 125 4 -- 2 12 6 24 4.00
Total 120 120 120 120 120 600 100.00
Source: Computed from the Primary data.
Table 5.14 indicates the percentage of increase in household income in the
post-loan period. The figures reveal that none of the beneficiary had a decline in
annual household income in the post loan period. The additional income generated
ranges from 10-25 per cent to 100-125 per cent. The impact of loans on the
181
income of the respondents is noted as follows: 140 beneficiaries (23.33 per cent)
improved their income position by 10-25 per cent, 204 beneficiaries (34 per cent)
by 25-50 per cent, 180 beneficiaries (30.00 per cent) by 50-75 per cent,
52 beneficiaries (8.67 per cent) by 75.-100 per cent and 24 beneficiaries (4.00 per
cent) by 100-125 per cent. The table also reveals that small business and rural
artisans are the groups of beneficiaries most benefited from the bank assistance
because a majority of borrowers in this group had an increase in income between
50-125 per cent.
5.2.15 Poverty Level in the Post- Loan Period
Yet another important objective of providing credit assistance to the
clientele group is to enable them to cross the poverty line. In the case of sample
beneficiaries this objective seemed to have been achieved to an appreciable level.
In our study the family income of Rs.20700 per annum was taken as the poverty
line income.
Table 5.15 indicates the poverty position of beneficiaries in the pre-loan
and post-loan periods. The analysis on the status of the respondents with the
income base at the poverty line, revealed that whereas there were only 48
households (8.00 per cent) of the sample beneficiaries above the poverty line in
the pre-loan period, the number of such households shot up to 452 (75.33 per
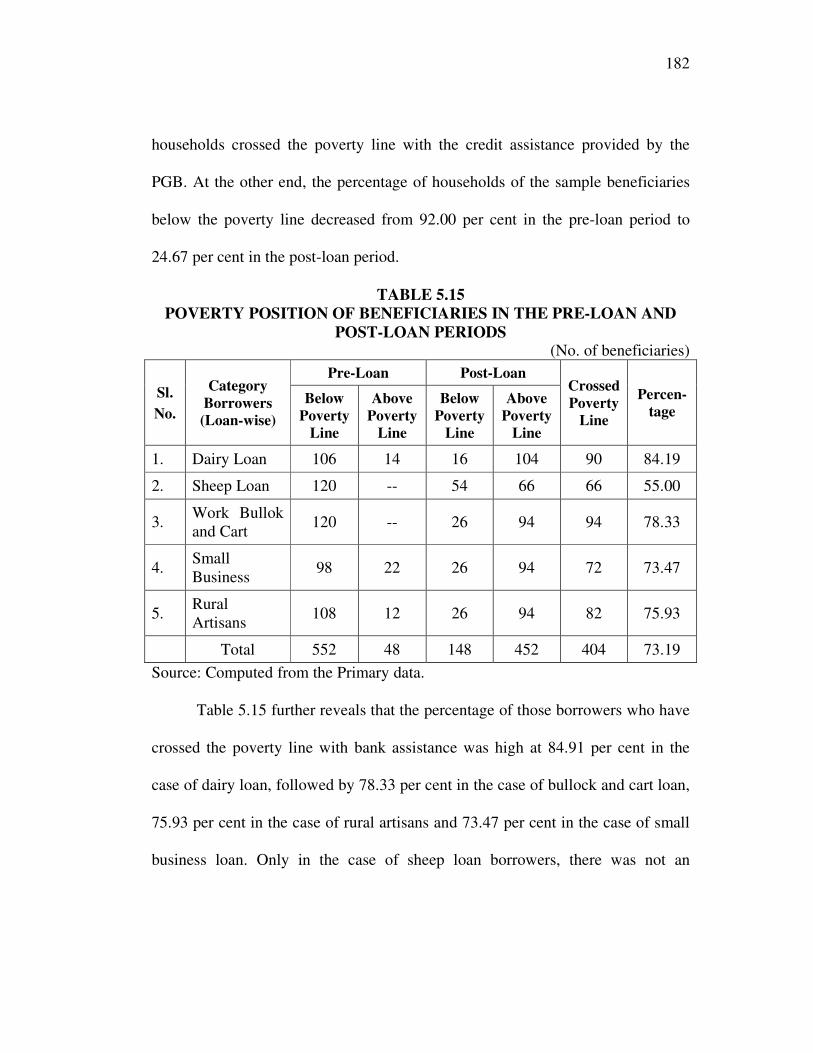
cent) in the post-loan period. It indicates that 404 (73.19 per cent) of the
182
households crossed the poverty line with the credit assistance provided by the
PGB. At the other end, the percentage of households of the sample beneficiaries
below the poverty line decreased from 92.00 per cent in the pre-loan period to
24.67 per cent in the post-loan period.
TABLE 5.15
POVERTY POSITION OF BENEFICIARIES IN THE PRE-LOAN AND
POST-LOAN PERIODS (No. of beneficiaries)
Sl.
No.
Category
Borrowers
(Loan-wise)
Pre-Loan Post-Loan Crossed
Poverty
Line
Percen-
tage Below
Poverty
Line
Above
Poverty
Line
Below
Poverty
Line
Above
Poverty
Line
1. Dairy Loan 106 14 16 104 90 84.19
2. Sheep Loan 120 -- 54 66 66 55.00
3. Work Bullok
and Cart 120 -- 26 94 94 78.33
4. Small
Business 98 22 26 94 72 73.47
5. Rural
Artisans 108 12 26 94 82 75.93
Total 552 48 148 452 404 73.19
Source: Computed from the Primary data.
Table 5.15 further reveals that the percentage of those borrowers who have
crossed the poverty line with bank assistance was high at 84.91 per cent in the
case of dairy loan, followed by 78.33 per cent in the case of bullock and cart loan,
75.93 per cent in the case of rural artisans and 73.47 per cent in the case of small
business loan. Only in the case of sheep loan borrowers, there was not an
183
appreciable reduction in the number and proportion of the borrower’s household
crossing the poverty line after availing the bank loan.
Thus, the objective of raising the poor above the poverty line, in real spirit
of it, is achieved to the tune of 73.19 per cent. It could be concluded that there was
an appreciable reduction in the number and proportion of the same borrower’s
household below the poverty line in the post-loan period as compared to those in
the pre-loan period.
Thus, the hypothesis that a positive impact has been made on the
eradication of poverty in all activities in the study area stands fully supported.
5.2.16 Income and Poverty Levels
An attempt was made to assess the impact of the loan activity on overall
income levels of the sample beneficiaries. For this purpose the income of the
beneficiary before availing the bank loan was calculated. The net increase in
income through the loan activity was assessed. Further the beneficiaries were
classified into six types as follows.
Category I
Beneficiaries who belong to target group and were below poverty line of
Rs.20700 as annual income before starting loan activity and managed to cross the
poverty line with the help of loan activity.
184
Category II
Beneficiaries who belong to target group and were below poverty line
before starting loan activity and continued to remain below poverty line even after
loan activity.
Category III
Beneficiaries who belong to target group but earned more than Rs.6400
before and after loan activity.
Category IV
Beneficiaries who belong to non-target group with annual household
income more than Rs.20700 and above the poverty line in pre and post-loan
periods.
Category V
Beneficiaries who belong to non-target group but only had annual
household income of less than Rs.20700 in the pre and post-loan periods.
Category VI
Beneficiaries who belong to non-target group with annual household
income less than Rs.20700 before starting loan activity and above the poverty line
after availing the bank loan.
185
TABLE 5.16
INCOME AND POVERTY LEVEL IN THE POST-LOAN PERIOD
(TARGET AND NON-TARGET GROUPS)
Sl.
No. Items No. of
Borrowers
Percentage
to Total
A. Target Group
1. Category I (Pre-loan Income < Rs.6400,
Post-loan Income > Rs.6400)
380 63.34
2. Category II (Pre-loan Income < Rs.6400,
Post-loan Income < Rs.6400)
146 24.33
3. Category III (Pre-loan Income > Rs.6400,
Post-loan Income > Rs.6400)
12 2.00
B. Non-Target Group
4. Category IV (Pre-loan Income > Rs.6400,
Post-loan Income > Rs.6400)
36 6.00
5. Category V (Pre-loan Income < Rs.6400,
Post-loan Income < Rs.6400)
2 0.33
6. Category VI (Pre-loan Income < Rs.6400,
Post-loan Income > Rs.6400)
24 4.00
Grand Total 600 100.00
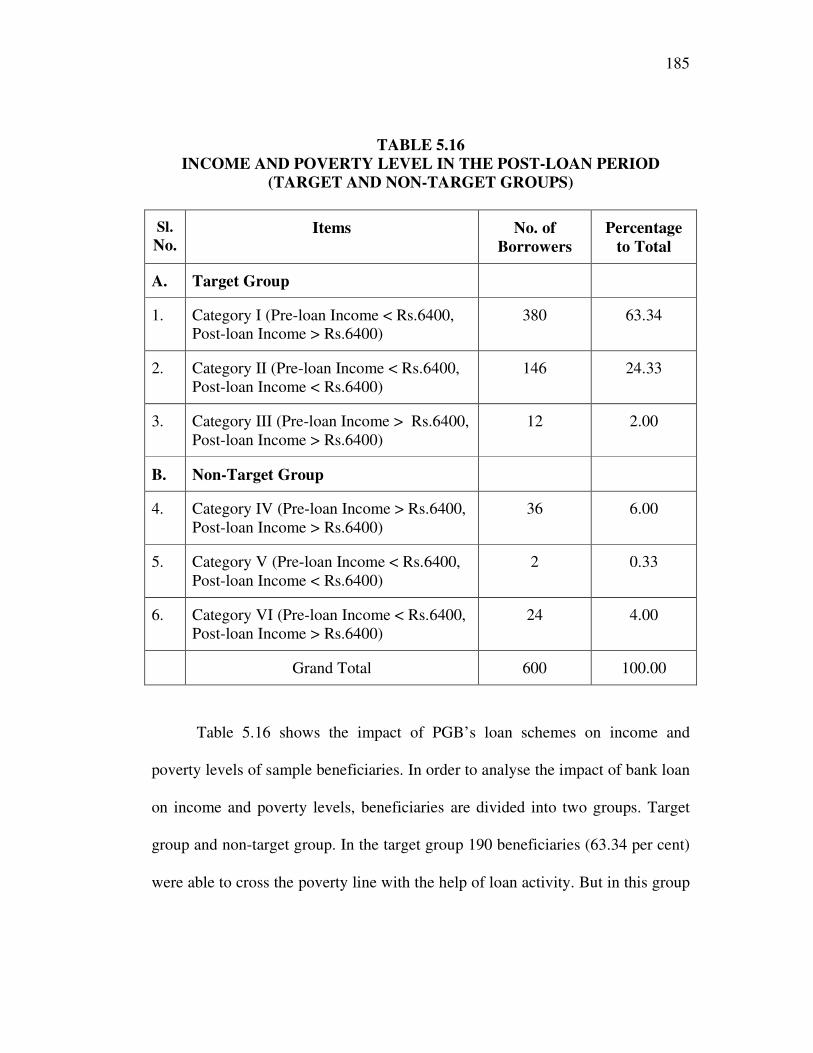
Table 5.16 shows the impact of PGB’s loan schemes on income and
poverty levels of sample beneficiaries. In order to analyse the impact of bank loan
on income and poverty levels, beneficiaries are divided into two groups. Target
group and non-target group. In the target group 190 beneficiaries (63.34 per cent)
were able to cross the poverty line with the help of loan activity. But in this group
186
73 beneficiaries (24.33 per cent) were not able to cross the poverty line in the
post-loan period for reasons which were already discussed.
In the non-target group three beneficiaries (4.00 per cent) were able to
cross the poverty line in the post loan period with the help of loan activity. But
there was only one beneficiary in this group who was not able to cross the poverty
line even after the bank assistance. Thus, the above analysis also proves that the
PGB loan schemes helped the beneficiaries increase their income position and
thereby cross the poverty line.
5.2.17 Expenditure
To understand the economic standard of the respondents, it is necessary to
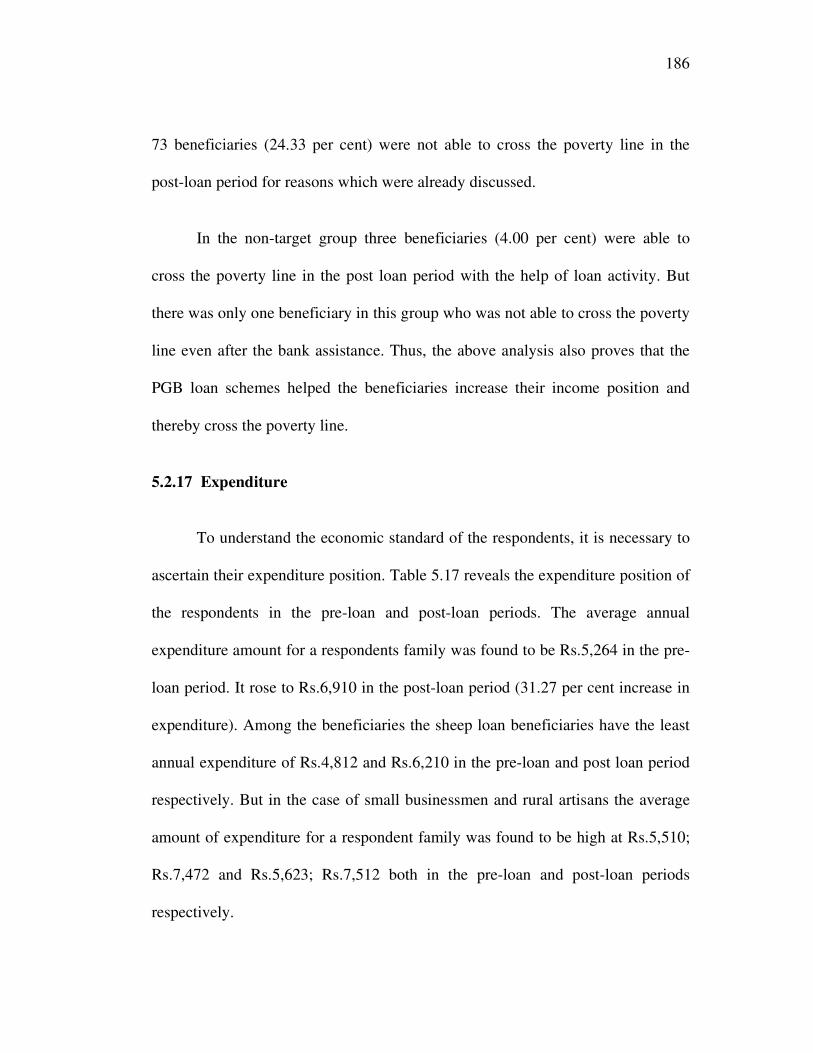
ascertain their expenditure position. Table 5.17 reveals the expenditure position of
the respondents in the pre-loan and post-loan periods. The average annual
expenditure amount for a respondents family was found to be Rs.5,264 in the pre-
loan period. It rose to Rs.6,910 in the post-loan period (31.27 per cent increase in
expenditure). Among the beneficiaries the sheep loan beneficiaries have the least
annual expenditure of Rs.4,812 and Rs.6,210 in the pre-loan and post loan period
respectively. But in the case of small businessmen and rural artisans the average
amount of expenditure for a respondent family was found to be high at Rs.5,510;
Rs.7,472 and Rs.5,623; Rs.7,512 both in the pre-loan and post-loan periods
respectively.
187
TABLE 5.17
EXPENDITURE OF THE SAMPLE BENEFICIARIES IN THE
PRE-LOAN AND POST-LOAN PERIODS (AVERAGE ANNUAL
EXPENDITURE PER HOUSEHOLD IN RUPEES)
Sl.
No.
Activity Expenditure (Rs.) Percentage
of Increase
in
Expenditure
t-test
Pre-Loan
Period
Post-Loan
Period
1. Daily 5270 6902 30.97 12.63*
2. Sheep 5104 6452 26.39 18.14*
3. Work Bullock and Cart 4812 6210 29.05 19.21*
4. Small Business 5510 7472 35.61 13.83*
5. Rural Artisans 5623 7512 33.59 12.69*
Total 5264 6910 31.27 25.80*
Source: Computed from the Primary data.
Note : * Indicates the difference between Pre-loan and Post-loan expenditure
and it is statistically significant at 5 per cent level.
To test the null hypothesis that there is no increase in expenditure in the
post loan period, the t-test was applied. The results of the test shown in table 5.17
reveal that the difference between the expenditure in the pre-loan period and that
in the post-loan period is statistically significant at 5 per cent level. Hence, the
null hypothesis is rejected. Therefore, the alternative hypothesis framed is that the
average annual household expenditure has increased in the post-loan period. Thus,
it may be concluded from the data given in table 5.18 that average annual
household expenditure has increased in the post-loan period for all activities in the
study area.
188
5.2.18 Savings
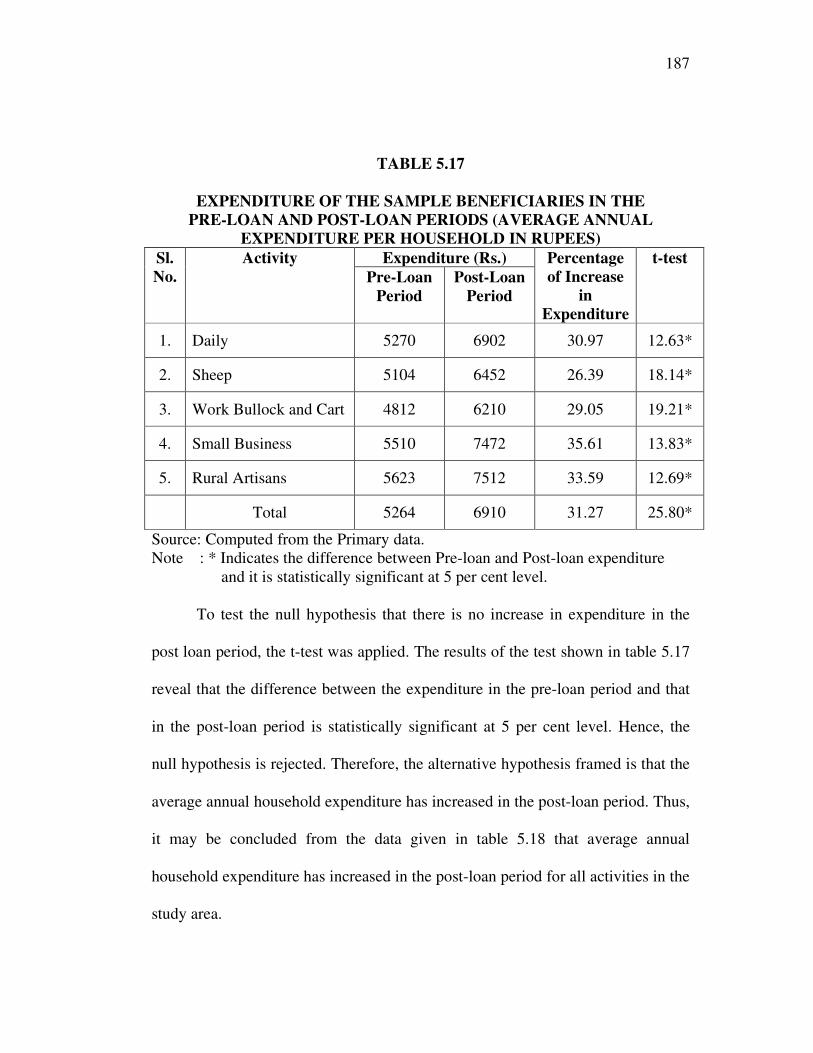
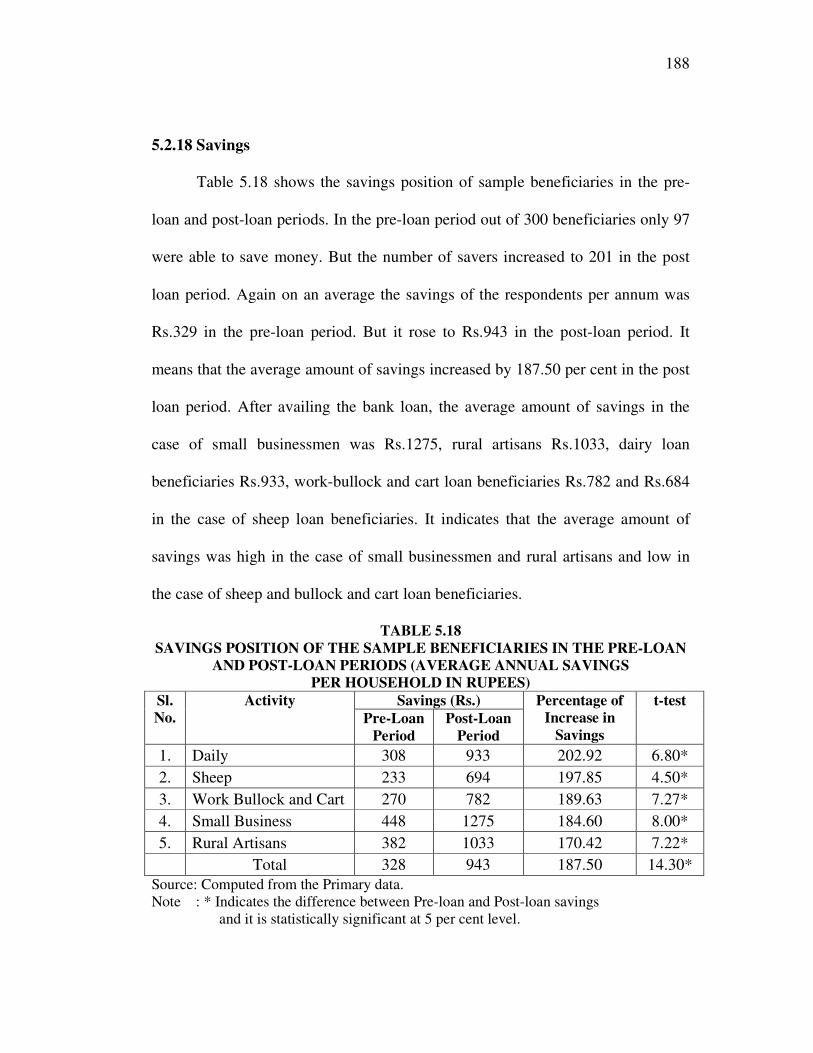
Table 5.18 shows the savings position of sample beneficiaries in the pre-
loan and post-loan periods. In the pre-loan period out of 300 beneficiaries only 97
were able to save money. But the number of savers increased to 201 in the post
loan period. Again on an average the savings of the respondents per annum was
Rs.329 in the pre-loan period. But it rose to Rs.943 in the post-loan period. It
means that the average amount of savings increased by 187.50 per cent in the post
loan period. After availing the bank loan, the average amount of savings in the
case of small businessmen was Rs.1275, rural artisans Rs.1033, dairy loan
beneficiaries Rs.933, work-bullock and cart loan beneficiaries Rs.782 and Rs.684
in the case of sheep loan beneficiaries. It indicates that the average amount of
savings was high in the case of small businessmen and rural artisans and low in
the case of sheep and bullock and cart loan beneficiaries.
TABLE 5.18
SAVINGS POSITION OF THE SAMPLE BENEFICIARIES IN THE PRE-LOAN
AND POST-LOAN PERIODS (AVERAGE ANNUAL SAVINGS
PER HOUSEHOLD IN RUPEES)
Sl.
No.
Activity Savings (Rs.) Percentage of
Increase in
Savings
t-test
Pre-Loan
Period
Post-Loan
Period
1. Daily 308 933 202.92 6.80*
2. Sheep 233 694 197.85 4.50*
3. Work Bullock and Cart 270 782 189.63 7.27*
4. Small Business 448 1275 184.60 8.00*
5. Rural Artisans 382 1033 170.42 7.22*
Total 328 943 187.50 14.30*
Source: Computed from the Primary data.
Note : * Indicates the difference between Pre-loan and Post-loan savings
and it is statistically significant at 5 per cent level.
189
The mode of savings with chit funds seems to be the most popular form
among the respondents. The next important mode of savings among the people is
the banks. The post office savings is the least prevalent among the respondents.
This may be due to the fact that in most of the villages, there is no post office
savings facility.
In order to test the hypothesis that there is no significant difference
between the average annual household savings in the pre-loan period and those in
post-loan period, t-test has been applied. The computed results of the t-test show
that the differences are significant at 5 per cent level for all activities. Hence, the
null hypothesis is rejected. The alternative hypothesis framed is that the average
annual savings per household has increased after getting the bank loan. Thus, it
may be concluded that the average annual savings per households has increased in
the post-loan period for all activities in the study area.
5.2.19 Debt Position
Table 5.19 depicts the annual average debts (excluding PGB loan) of
different categories of respondents in the pre-loan and post-loan periods. In the
pre-loan period 190 beneficiaries were in debt position and the average amount of
debt was Rs.1380. But, in the post-loan period only 102 respondents were in debt
position and the average amount of debt declined to Rs.576. It signifies that the
debt position of the respondents declined by 58.26 per cent in the post-loan
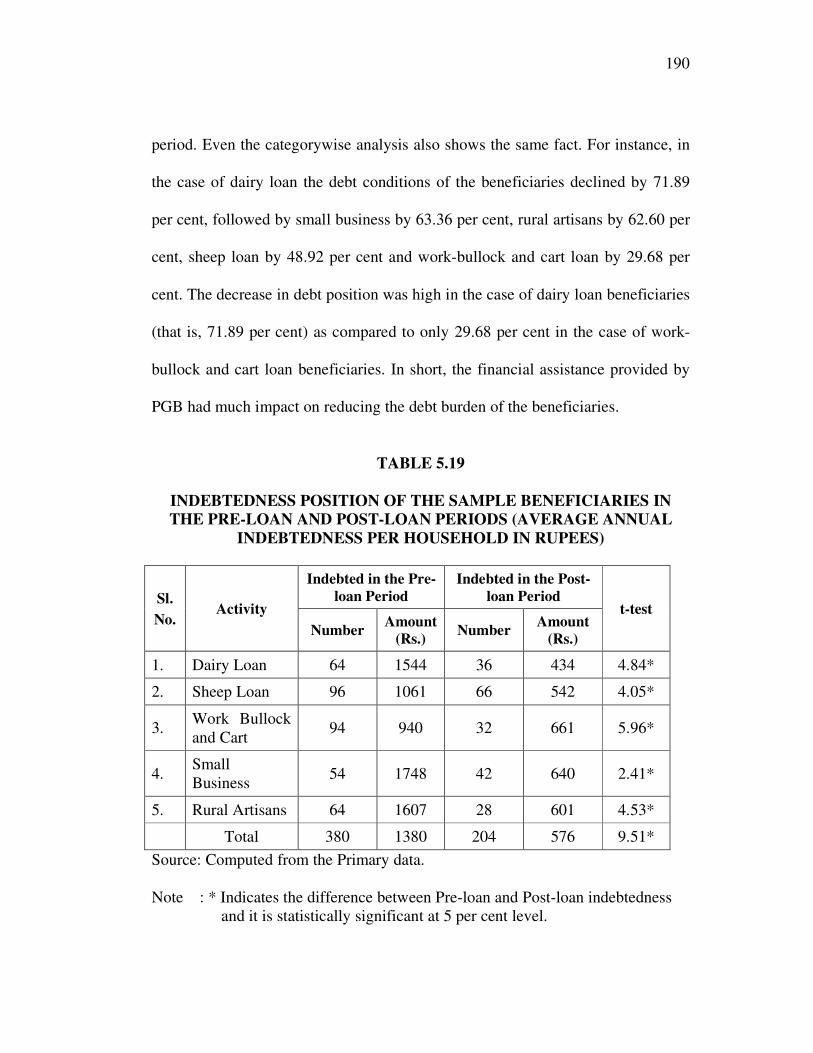
190
period. Even the categorywise analysis also shows the same fact. For instance, in
the case of dairy loan the debt conditions of the beneficiaries declined by 71.89
per cent, followed by small business by 63.36 per cent, rural artisans by 62.60 per
cent, sheep loan by 48.92 per cent and work-bullock and cart loan by 29.68 per
cent. The decrease in debt position was high in the case of dairy loan beneficiaries
(that is, 71.89 per cent) as compared to only 29.68 per cent in the case of work-
bullock and cart loan beneficiaries. In short, the financial assistance provided by
PGB had much impact on reducing the debt burden of the beneficiaries.
TABLE 5.19
INDEBTEDNESS POSITION OF THE SAMPLE BENEFICIARIES IN
THE PRE-LOAN AND POST-LOAN PERIODS (AVERAGE ANNUAL
INDEBTEDNESS PER HOUSEHOLD IN RUPEES)
Sl.
No. Activity
Indebted in the Pre-
loan Period
Indebted in the Post-
loan Period t-test
Number Amount
(Rs.) Number
Amount
(Rs.)
1. Dairy Loan 64 1544 36 434 4.84*
2. Sheep Loan 96 1061 66 542 4.05*
3. Work Bullock
and Cart 94 940 32 661 5.96*
4. Small
Business 54 1748 42 640 2.41*
5. Rural Artisans 64 1607 28 601 4.53*
Total 380 1380 204 576 9.51*
Source: Computed from the Primary data.
Note : * Indicates the difference between Pre-loan and Post-loan indebtedness
and it is statistically significant at 5 per cent level.
191
To test the null hypothesis that there is no difference between the average
indebtedness per household in the pre-loan period and that in post-loan period the
t-test has been applied. The calculated results of t-test reveal that there is
significant difference between the average indebtedness per household in the pre-
loan period and that in post-loan period. Hence, the null hypothesis is rejected.
The alternative hypothesis framed is that the indebtedness position of the sample
beneficiaries in the post-loan period has declined. Thus, it may be observed from
the data shown in Table 5.19 that the average indebtedness position of the sample
beneficiaries has declined considerably for all activities in the study area.
An attempt is made by the researcher to find out the impact of the bank
loans on the financial positions of the respondents. When they were asked to tell
their experiences, the respondents generally expressed that bank loans had a
considerable impact on improving their economic position. The respondents
explained the impact of bank loan on them as follows:
1. After getting the bank loans, the respondents were able to improve their
business in terms of their turn over.
2. After receiving the bank loans, increased flow of income has been
experienced by most of the respondents.
3. The respondents were in a position to repay their past loans which they
got from non-institutional/ private sources at high rate of interest.
192
4. As a result of increase in the incomes, the beneficiaries were able to
save more amounts. In many cases, their savings were invested in chit
funds.
5. Bank loans also enabled the respondent to lead a comfortable life. Most
of them were able to increase their asset holdings like purchase of a
house-site, jewels, vehicles (like bicycles) and vessels. They were able
to provide better education, health facilities and nutrious food to their
children and family members. Thus in many ways the bank loans
enabled the respondents to increase their standard of living.
5.2.20 Repayment
The present study aims to examine the credit repayment performance of the
beneficiaries financed by PGB. It attempts at giving a critical analysis of the
extent of repayment of loans sanctioned by the bank and highlighting the
important reasons for the non-repayment of such loans. On the basis of the
analysis, it also tries to offer certain suggestions for improvement from the stand
point of policy formulation.
The most important cannon of any sort of lending should be inherently
self-liquidating character of loans. Repayment of loans is very important for the
profitability and viability of the lending institutions. Poor recovery of loans not
only inhabits the ability of the system to recycle the funds but also deprives the
193
benefits of borrowing to the other needy people. Better recovery of loans helps in
building up confidence of the general public in the soundness of the banking
system. It also improves the efficiency of the staff and helps to devote more time
to development work rather than keeping themselves busy in recovering loans.
The ancient India was known for loan repayment habit of its people. Sons
were honest enough to settle the debts of even their forefathers. They were ready
to accept the moral responsibility to repay all debts. The situation is quite different
today. Around 50 per cent of loans of commercial banks, RRBs and co-operative
societies are not returned.
Repayment implies generation of adequate income over and above
household expenditure and maintenance cost.
The recovery of bank loans would be possible, if the borrower is willing to
pay and he has the capacity to pay. Loan recovery cannot made even in the case of
those beneficiaries who are willing to repay but they have no capacity to repay.
The activities being sponsored for finance by the bank are generally not viable
because of loan amount ceiling and/or for a number of other causes. The finance
provided in majority of the cases, may be helpful in adding to the creation of
assets only, but not to the building up of financial capacity by generation of
adequate income. Hence, the loans sanctioned by the bank in majority of the cases
remain unrecoverable.
194
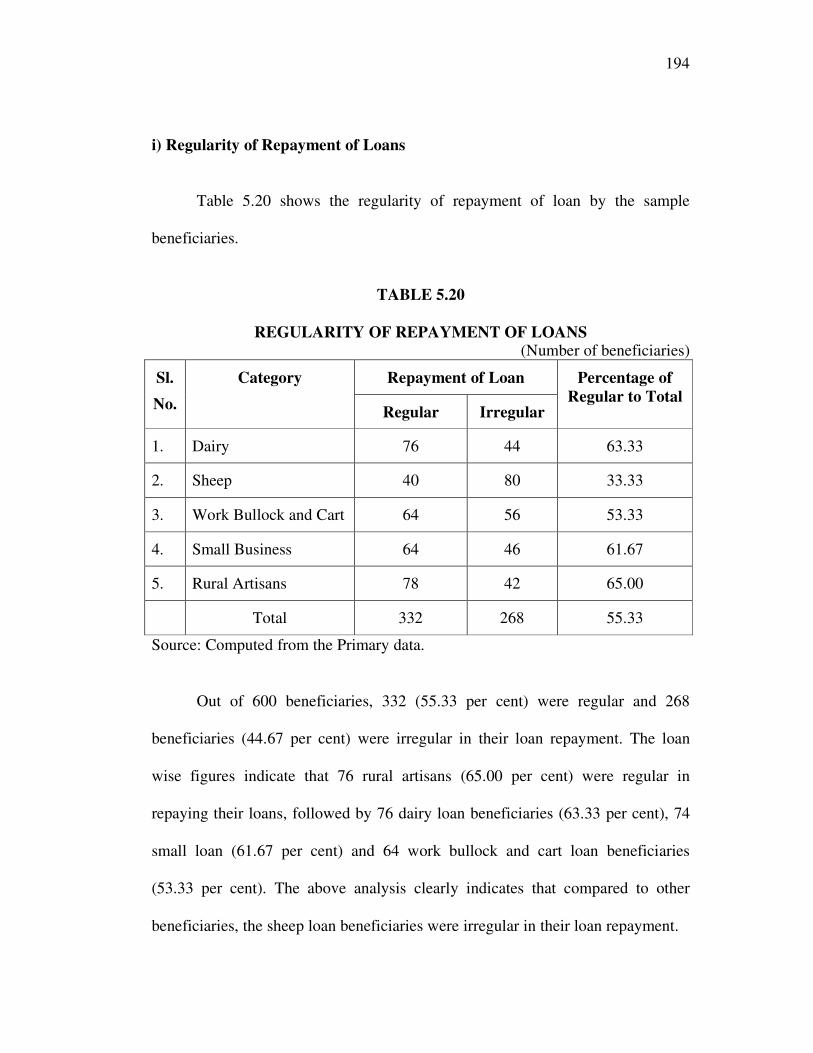
i) Regularity of Repayment of Loans
Table 5.20 shows the regularity of repayment of loan by the sample
beneficiaries.
TABLE 5.20
REGULARITY OF REPAYMENT OF LOANS (Number of beneficiaries)
Sl.
No.
Category Repayment of Loan Percentage of
Regular to Total Regular Irregular
1. Dairy 76 44 63.33
2. Sheep 40 80 33.33
3. Work Bullock and Cart 64 56 53.33
4. Small Business 64 46 61.67
5. Rural Artisans 78 42 65.00
Total 332 268 55.33
Source: Computed from the Primary data.
Out of 600 beneficiaries, 332 (55.33 per cent) were regular and 268
beneficiaries (44.67 per cent) were irregular in their loan repayment. The loan
wise figures indicate that 76 rural artisans (65.00 per cent) were regular in
repaying their loans, followed by 76 dairy loan beneficiaries (63.33 per cent), 74
small loan (61.67 per cent) and 64 work bullock and cart loan beneficiaries
(53.33 per cent). The above analysis clearly indicates that compared to other
beneficiaries, the sheep loan beneficiaries were irregular in their loan repayment.
195
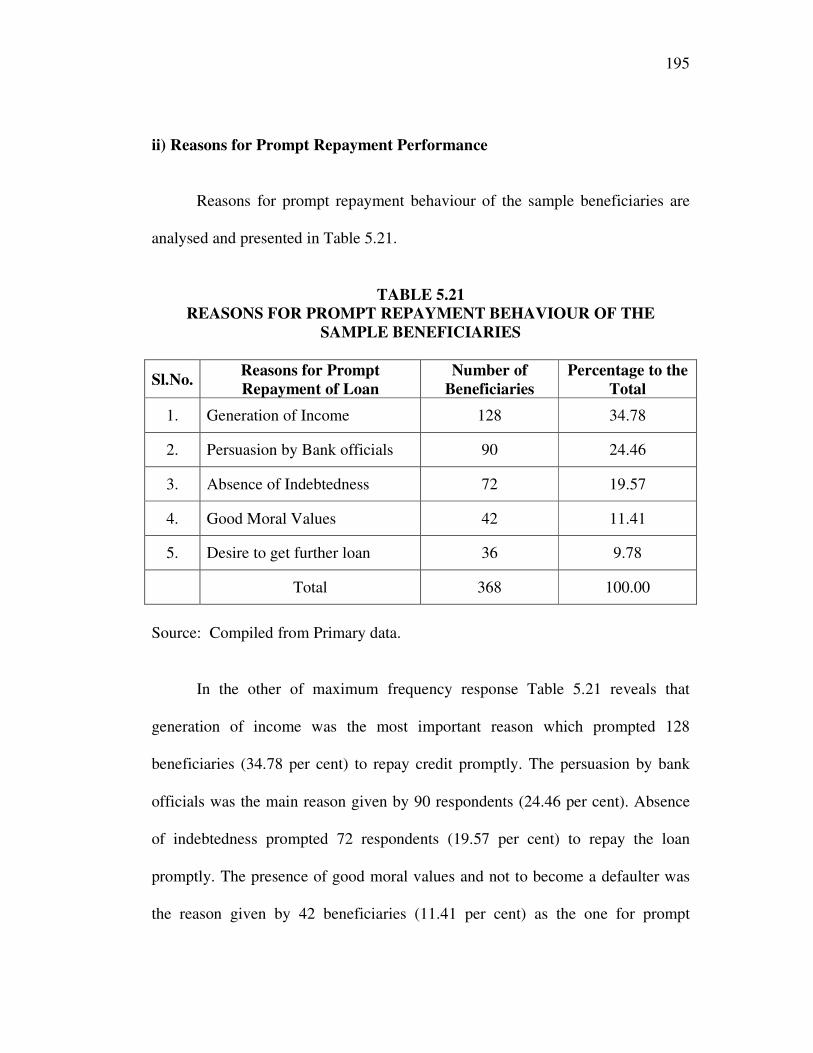
ii) Reasons for Prompt Repayment Performance
Reasons for prompt repayment behaviour of the sample beneficiaries are
analysed and presented in Table 5.21.
TABLE 5.21
REASONS FOR PROMPT REPAYMENT BEHAVIOUR OF THE
SAMPLE BENEFICIARIES
Sl.No. Reasons for Prompt
Repayment of Loan
Number of
Beneficiaries
Percentage to the
Total
1. Generation of Income 128 34.78
2. Persuasion by Bank officials 90 24.46
3. Absence of Indebtedness 72 19.57
4. Good Moral Values 42 11.41
5. Desire to get further loan 36 9.78
Total 368 100.00
Source: Compiled from Primary data.
In the other of maximum frequency response Table 5.21 reveals that
generation of income was the most important reason which prompted 128
beneficiaries (34.78 per cent) to repay credit promptly. The persuasion by bank
officials was the main reason given by 90 respondents (24.46 per cent). Absence
of indebtedness prompted 72 respondents (19.57 per cent) to repay the loan
promptly. The presence of good moral values and not to become a defaulter was
the reason given by 42 beneficiaries (11.41 per cent) as the one for prompt
196
repayment performance. The desire to get further loans induced 36 beneficiaries
to repay the loan amount promptly.
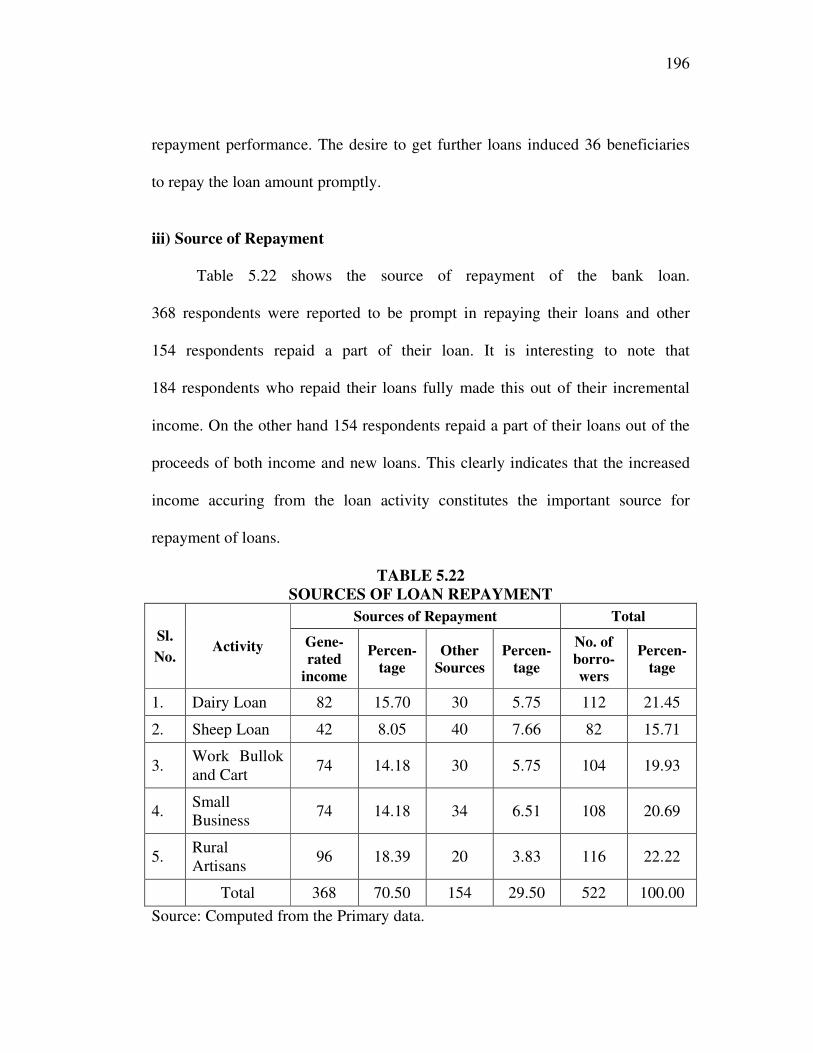
iii) Source of Repayment
Table 5.22 shows the source of repayment of the bank loan.
368 respondents were reported to be prompt in repaying their loans and other
154 respondents repaid a part of their loan. It is interesting to note that
184 respondents who repaid their loans fully made this out of their incremental
income. On the other hand 154 respondents repaid a part of their loans out of the
proceeds of both income and new loans. This clearly indicates that the increased
income accuring from the loan activity constitutes the important source for
repayment of loans.
TABLE 5.22
SOURCES OF LOAN REPAYMENT
Sl.
No. Activity
Sources of Repayment Total
Gene-
rated
income
Percen-
tage
Other
Sources
Percen-
tage
No. of
borro-
wers
Percen-
tage
1. Dairy Loan 82 15.70 30 5.75 112 21.45
2. Sheep Loan 42 8.05 40 7.66 82 15.71
3. Work Bullok
and Cart 74 14.18 30 5.75 104 19.93
4. Small
Business 74 14.18 34 6.51 108 20.69
5. Rural
Artisans 96 18.39 20 3.83 116 22.22
Total 368 70.50 154 29.50 522 100.00
Source: Computed from the Primary data.
197
Repayment performance of the beneficiaries was measured with the help of
a three-point Repayment Performance Scale (RPS). The RPS gave the percentage
figures of beneficiaries belonging to three different groups.
a) Full payment, that is, payment of loan according to demand;
b) Partial payment, that is, payment of loan at less than bank demand; and
c) No payment at all except adjustment of subsidy.
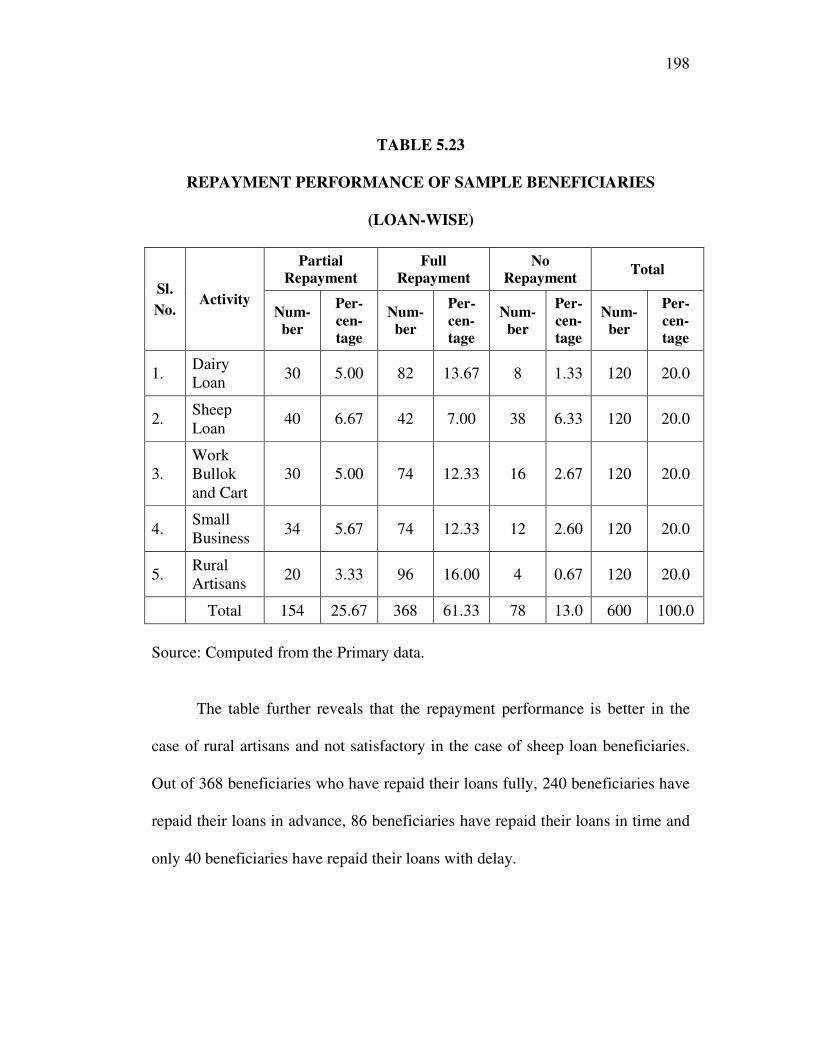
The category-wise classification of beneficiaries and their repayment
performance are given in Table 5.23. Of the total number of beneficiaries, 368
(61.33 per cent) have repaid the loan completely. Among the different categories
of beneficiaries, who have repaid the loan completely, 22.28 per cent belong to
the category of dairy loanee, 26.09 per cent belong to the category of rural
artisans, 20.11 per cent belong to the category of small business, 20.11 per cent
belong to the category of bullock and cart and 11.41 per cent belong to the
category of sheep loanee. It is interesting to note that 368 beneficiaries have fully
repaid their loans out of their income generated from investment of the loans.
198
TABLE 5.23
REPAYMENT PERFORMANCE OF SAMPLE BENEFICIARIES
(LOAN-WISE)
Sl.
No. Activity
Partial
Repayment
Full
Repayment
No
Repayment Total
Num-
ber
Per-
cen-
tage
Num-
ber
Per-
cen-
tage
Num-
ber
Per-
cen-
tage
Num-
ber
Per-
cen-
tage
1. Dairy
Loan 30 5.00 82 13.67 8 1.33 120 20.0
2. Sheep
Loan 40 6.67 42 7.00 38 6.33 120 20.0
3.
Work
Bullok
and Cart
30 5.00 74 12.33 16 2.67 120 20.0
4. Small
Business 34 5.67 74 12.33 12 2.60 120 20.0
5. Rural
Artisans 20 3.33 96 16.00 4 0.67 120 20.0
Total 154 25.67 368 61.33 78 13.0 600 100.0
Source: Computed from the Primary data.
The table further reveals that the repayment performance is better in the
case of rural artisans and not satisfactory in the case of sheep loan beneficiaries.
Out of 368 beneficiaries who have repaid their loans fully, 240 beneficiaries have
repaid their loans in advance, 86 beneficiaries have repaid their loans in time and
only 40 beneficiaries have repaid their loans with delay.
199
The concept of partial repayment has a high degree of ambiguity in the
sense that it signifies varying degrees of repayment ranging from, say, 0.99 per
cent to say, 99.99 per cent. The limit of the three point RPS is that it has given a
wide range of variability to the second point of the scale and hence does not give a
true picture of repayment. Nevertheless, it has been able to compartmentalise
between the best, better and the worst categories. There are 154 beneficiaries or
25.67 per cent of the beneficiaries who made partial repayment of the bank loan.
Among them the highest percentage is that of sheep loanees comprising 25.97 per
cent, followed by small traders comprising 22.08 per cent of the beneficiaries.
It is interesting to compare the figures for full repayment with those of
partial repayment. In the former case, the performance of rural artisans
outweighed that of the other categories of beneficiaries and their tendency for
complete repayment is largely owing to their desire to have a better and stronger
claim on future PGB loans. It can be inferred from the table that the rural artisans
have been able to make the best use of the bank loan.
The table also reveals that 78 respondents (13.00 per cent) have not repaid
any loan what so ever. The greatest defaulter in the repayment category are the
beneficiaries of sheep loan, accounting for 48.72 per cent of the total strength of
the defaulters. Only 4 (5.13 per cent) of the defaulters are from the category of
rural artisans.
200
Among the beneficiaries selected from five different loan activities, rural
artisans showed the best repayment record of 80.00 per cent, followed by dairy
loan with 68.33 per cent, bullock and cart loan and small business loan with
61.67 per cent each. The repayment performance was very poor in the case of
sheep loan borrowers with only 35.00 per cent. The overall repayment percentage
by all the respondents was 61.33.
The percentage of repayment on the whole by all the respondents is found
to be better. This could be attributed to (i) the incremental income enabled the
beneficiaries of different loan activities to make easy repayment, (ii) the active
interest shown by the beneficiaries in expanding their activities and
(iii) inducement by the manager’s promise for the sanctioning of next loan.
It is also noticed that low percentage of recovery of sheep loan activity is
common to five operational districts of the bank. The repayment performance of
respondents under sheep loan in almost all the districts was far below the overall
repayment performance of the beneficiaries. This could be attributed to (i) the low
incremental net income from this loan activity as compared to that of the other
activities, (ii) the increased family/consumption expenses, (iii) the inadequate
veterinary services, (iv) the repayment of old debt and (v) the expenses on social
ceremonies affected their repayment.
201
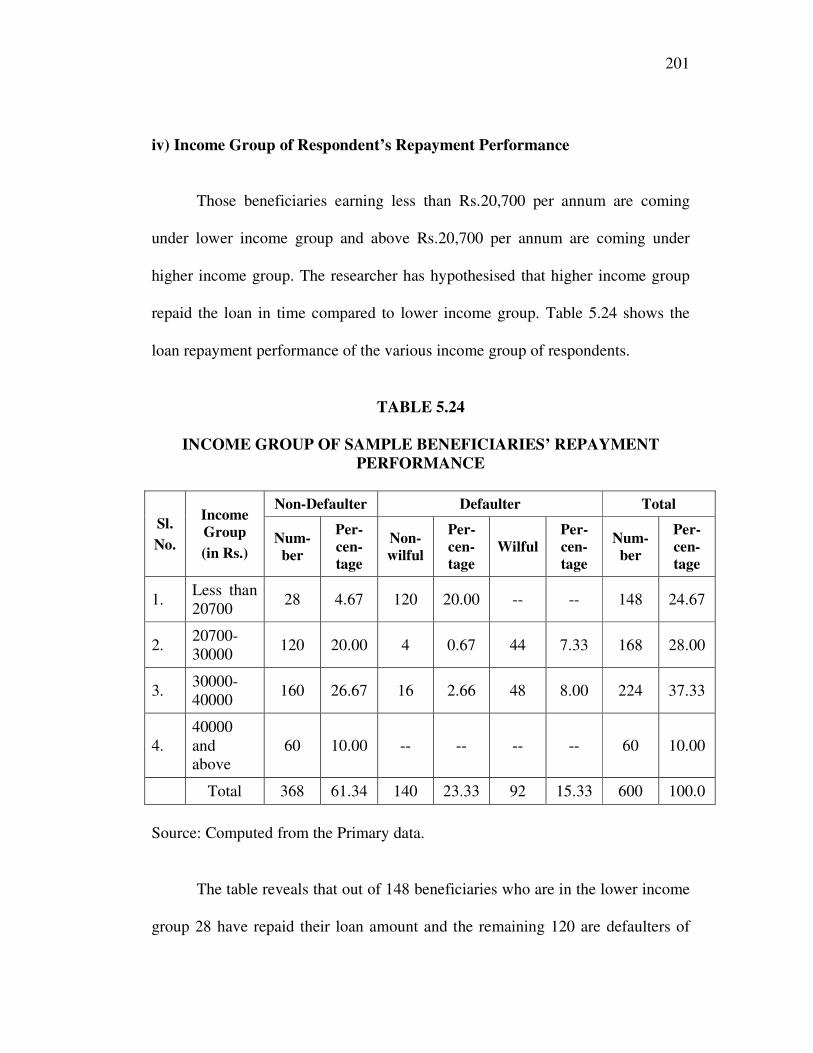
iv) Income Group of Respondent’s Repayment Performance
Those beneficiaries earning less than Rs.20,700 per annum are coming
under lower income group and above Rs.20,700 per annum are coming under
higher income group. The researcher has hypothesised that higher income group
repaid the loan in time compared to lower income group. Table 5.24 shows the
loan repayment performance of the various income group of respondents.
TABLE 5.24
INCOME GROUP OF SAMPLE BENEFICIARIES’ REPAYMENT
PERFORMANCE
Sl.
No.
Income
Group
(in Rs.)
Non-Defaulter Defaulter Total
Num-
ber
Per-
cen-
tage
Non-
wilful
Per-
cen-
tage
Wilful
Per-
cen-
tage
Num-
ber
Per-
cen-
tage
1. Less than
20700 28 4.67 120 20.00 -- -- 148 24.67
2. 20700-
30000 120 20.00 4 0.67 44 7.33 168 28.00
3. 30000-
40000 160 26.67 16 2.66 48 8.00 224 37.33
4.
40000
and
above
60 10.00 -- -- -- -- 60 10.00
Total 368 61.34 140 23.33 92 15.33 600 100.0
Source: Computed from the Primary data.
The table reveals that out of 148 beneficiaries who are in the lower income
group 28 have repaid their loan amount and the remaining 120 are defaulters of
202
bank loan. In the case of the income group of Rs.20700-30000, out of 168
beneficiaries 120 have repaid the loan amount and 48 are defaulters. Out of 48
defaulters in this group 44 are willful defaulters. In the case of the income group
of Rs.30000-40000, out of 224 respondents, 160 have repaid the loan and 64 are
defaulters. Out of 64 defaulters in this group 48 respondents are willful defaulters.
Only in the case of the higher income group of Rs.40000 and above all the 60
respondents have repaid the loan amount and there is no defaulter in this income
group. About 25 per cent of the respondents in the middle income group are found
to be willful defaulters. From the above analysis it is proved that the higher
income group repaid the loan more promptly compared to lower income group.
v) Repayment Performance of Target and Non-Target Group Beneficiaries
Table 5.25 shows the repayment performance of target group and non-
target group beneficiaries.

203
204
Out of 600 beneficiaries 544 (90.67 per cent) were scheme loan
beneficiaries and the remaining 56 (9.33 per cent) were non-scheme beneficiaries.
Out of this 544 scheme beneficiaries, 332 (61.03 per cent) repaid the loan amount
and 212 (38.97 per cent) were having overdues. The percentage of beneficiaries
with overdues was high in the case of sheep loan (65.00 per cent). This percentage
was moderate in the case of beneficiaries of small business, bullock and cart and
dairy loan. The percentage of beneficiaries with outstanding was low in the case
of rural artisans (19.30 per cent). The average outstanding amount was high in the
case of sheep loan with Rs.2195, followed by Rs.1184 in the case of small
business, Rs.1066 in the case of bullock and cart and Rs.969 in the case of dairy
loan beneficiaries.
Table 5.25 further reveals that the percentage of beneficiaries with
outstanding to total was more or less the same in the case of dairy loan (36.36 per
cent), small loan (35.71 per cent) and 33.39 per cent in the case of rural artisans.
The average outstanding loan amount was high in the case of dairy loan and rural
artisans with Rs.1,179 and Rs.1,167 respectively. Thus the above analysis clearly
indicates that the repayment performance of non-scheme beneficiaries was better
than that of the scheme loan beneficiaries.
Some branch managers of the bank confined that they had to include non-
target group beneficiary due to two reasons: The first reason was to ensure a fairly
205
good recovery performance and second reason was to create a potential deposit
base.
vi) Reasons for Non-Repayment
An intensive enquiry was made with a view to identify the factors
responsible for rising overdues and to ascertain the magnitude and seriousness of
this problem. For this purpose, the respondents were asked to identify the
important reason for non-repayment. Several reasons were given for non-
repayment some of which have a direct bearing on the role of PGB as a lending
agency. Instances of non-repayment or partial repayment were not merely due to
low returns on investments but also due to reasons like utilisation of major part of
the returns from the activity for consumption purposes or diversion of the income
to other purposes.
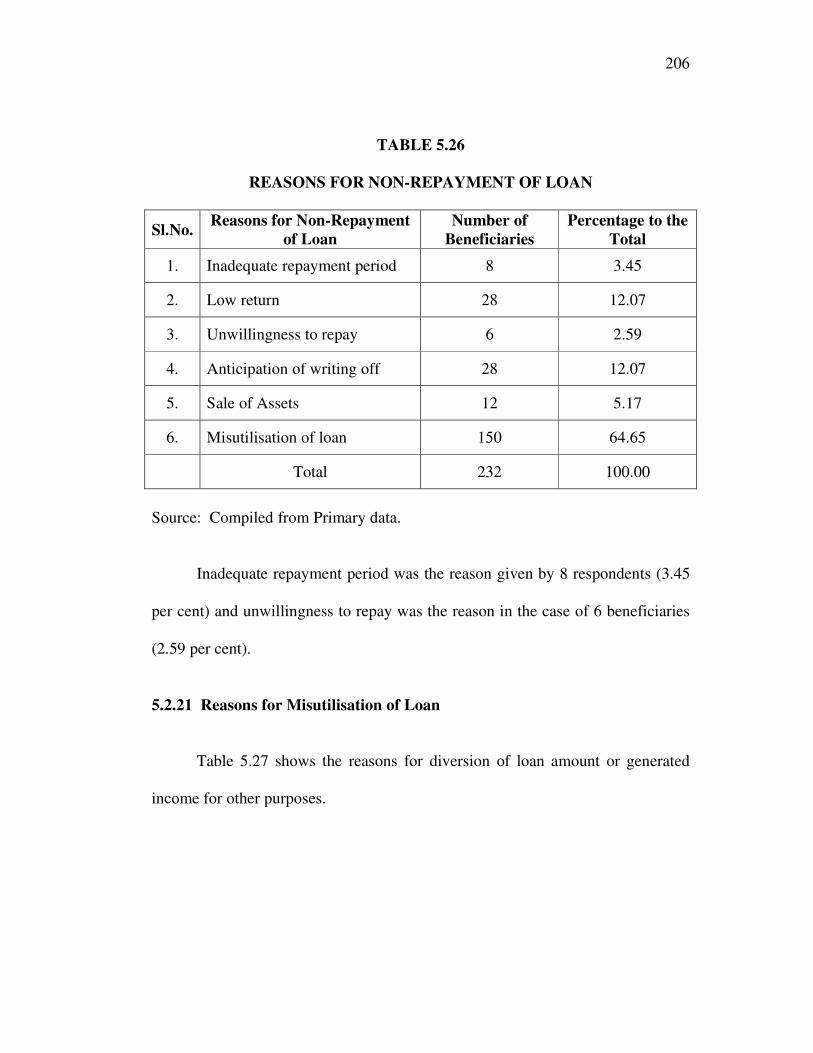
The reasons for non-repayment have been presented in Table 5.26. Out of
232 respondents who had not repaid the loan 150 (64.65 per cent) diverted the
loan amount or generated income for other purposes. The reason for non-
repayment in the case of 28 borrowers (12.07 per cent) was low/ poor yield from
the activity. The anticipation of writing off/debt relief was the reason given by
28 respondents (12.07 per cent). The sale of assets created through bank loan was
the reason for non-repayment of loan in the case of 12 beneficiaries
(5.17 per cent).
206
TABLE 5.26
REASONS FOR NON-REPAYMENT OF LOAN
Sl.No. Reasons for Non-Repayment
of Loan
Number of
Beneficiaries
Percentage to the
Total
1. Inadequate repayment period 8 3.45
2. Low return 28 12.07
3. Unwillingness to repay 6 2.59
4. Anticipation of writing off 28 12.07
5. Sale of Assets 12 5.17
6. Misutilisation of loan 150 64.65
Total 232 100.00
Source: Compiled from Primary data.
Inadequate repayment period was the reason given by 8 respondents (3.45
per cent) and unwillingness to repay was the reason in the case of 6 beneficiaries
(2.59 per cent).
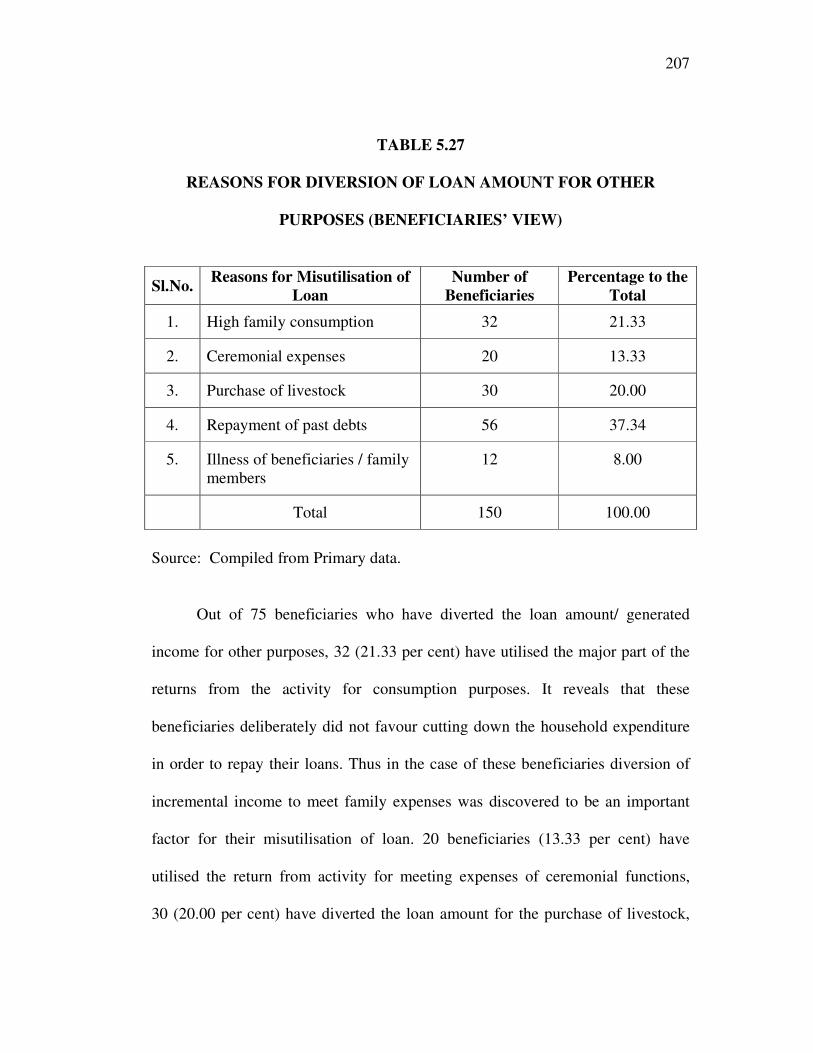
5.2.21 Reasons for Misutilisation of Loan
Table 5.27 shows the reasons for diversion of loan amount or generated
income for other purposes.
207
TABLE 5.27
REASONS FOR DIVERSION OF LOAN AMOUNT FOR OTHER
PURPOSES (BENEFICIARIES’ VIEW)
Sl.No. Reasons for Misutilisation of
Loan
Number of
Beneficiaries
Percentage to the
Total
1. High family consumption 32 21.33
2. Ceremonial expenses 20 13.33
3. Purchase of livestock 30 20.00
4. Repayment of past debts 56 37.34
5. Illness of beneficiaries / family
members
12 8.00
Total 150 100.00
Source: Compiled from Primary data.
Out of 75 beneficiaries who have diverted the loan amount/ generated
income for other purposes, 32 (21.33 per cent) have utilised the major part of the
returns from the activity for consumption purposes. It reveals that these
beneficiaries deliberately did not favour cutting down the household expenditure
in order to repay their loans. Thus in the case of these beneficiaries diversion of
incremental income to meet family expenses was discovered to be an important
factor for their misutilisation of loan. 20 beneficiaries (13.33 per cent) have
utilised the return from activity for meeting expenses of ceremonial functions,
30 (20.00 per cent) have diverted the loan amount for the purchase of livestock,
208
12 (8.00 per cent) to meet unexpected medical expenses and 56 (37.34 per cent)
have diverted the incremental income for the repayment of past debts taken from
other sources. Thus some beneficiaries could not repay the loans because they had
resorted to private borrowings at exorbitant rates of interest and when incremental
income accrued, the beneficiaries gave priority to repayment of private loans and
to that extent, the repayment of bank loan suffered.
Therefore, intensified post sanction follow-up measures must be taken up
by the field supervisors for ensuring proper and systematic recovery of dues
which would otherwise go unremitted.
5.2.22 Unsuitable or Unwilling Borrowers
Out of the total 600 sample beneficiaries 71 (23.67 per cent) were found
unsuited for the activity. This indicates that they either lacked experience in the
line or were unwilling to take up the activity.
5.2.23 Opinions of the Beneficiaries
i) Benefits from Bank Loan
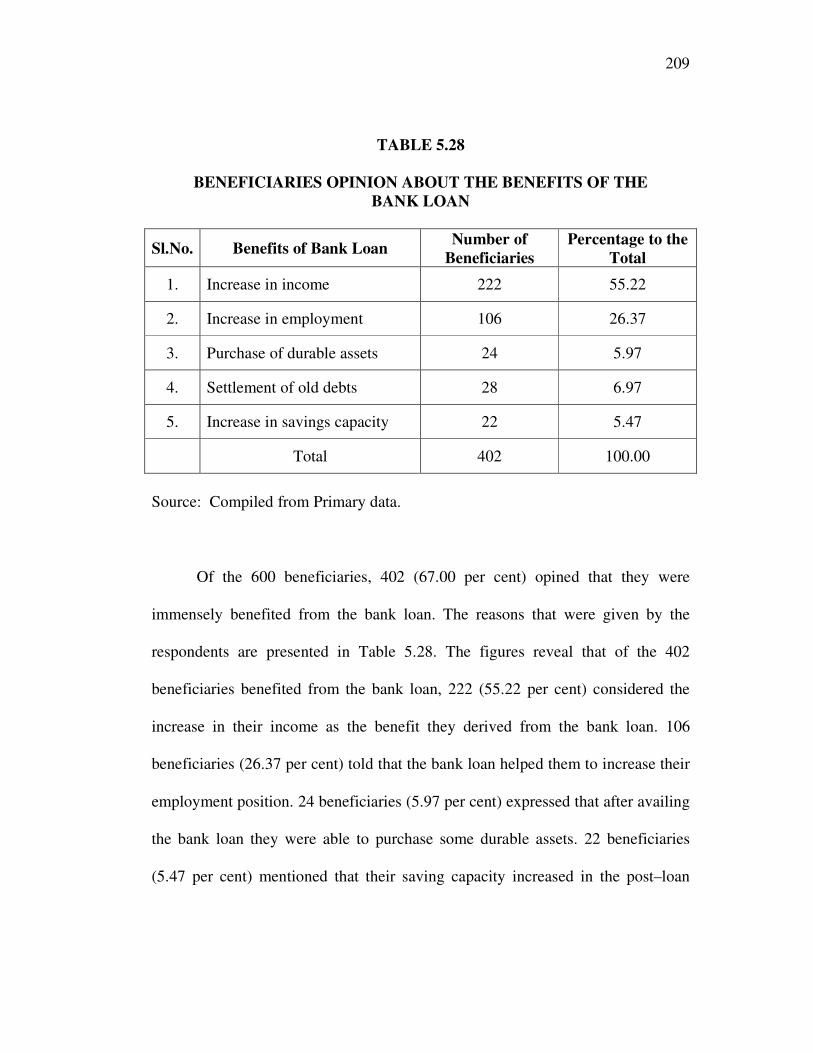
Table 5.28 shows the respondents opinion about the benefits of the bank
loan they had availed.
209
TABLE 5.28
BENEFICIARIES OPINION ABOUT THE BENEFITS OF THE
BANK LOAN
Sl.No. Benefits of Bank Loan Number of
Beneficiaries
Percentage to the
Total
1. Increase in income 222 55.22
2. Increase in employment 106 26.37
3. Purchase of durable assets 24 5.97
4. Settlement of old debts 28 6.97
5. Increase in savings capacity 22 5.47
Total 402 100.00
Source: Compiled from Primary data.
Of the 600 beneficiaries, 402 (67.00 per cent) opined that they were
immensely benefited from the bank loan. The reasons that were given by the
respondents are presented in Table 5.28. The figures reveal that of the 402
beneficiaries benefited from the bank loan, 222 (55.22 per cent) considered the
increase in their income as the benefit they derived from the bank loan. 106
beneficiaries (26.37 per cent) told that the bank loan helped them to increase their
employment position. 24 beneficiaries (5.97 per cent) expressed that after availing
the bank loan they were able to purchase some durable assets. 22 beneficiaries
(5.47 per cent) mentioned that their saving capacity increased in the post–loan
210
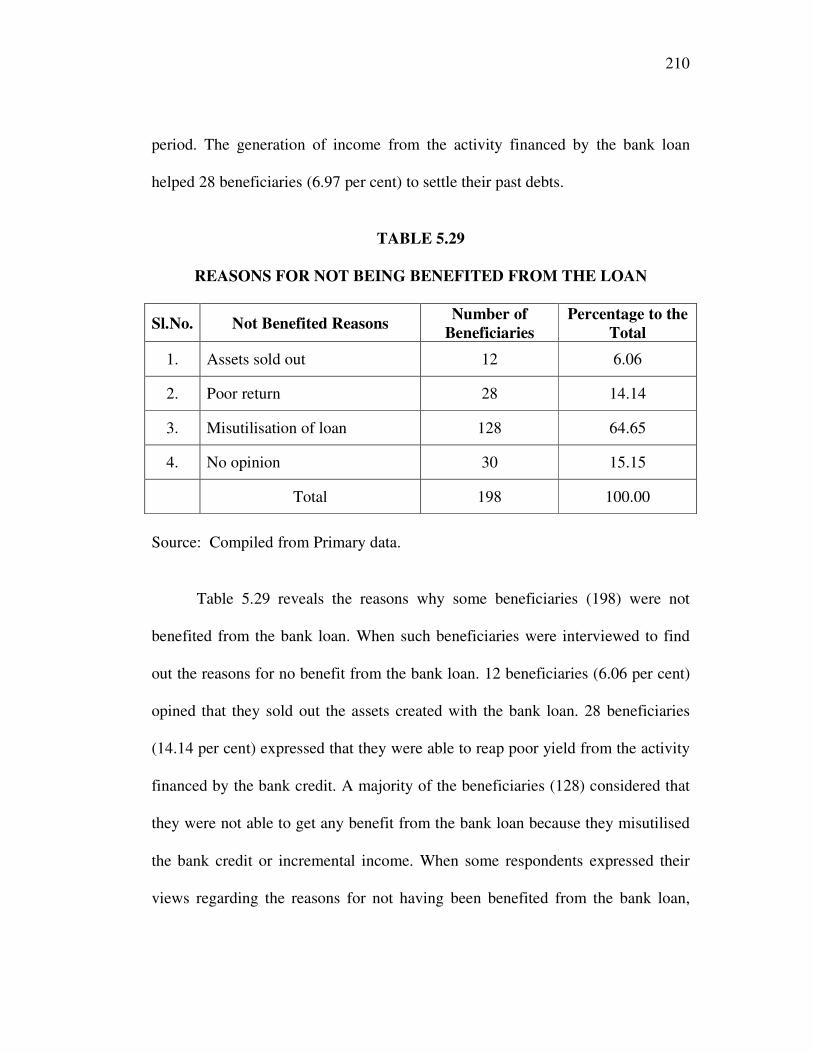
period. The generation of income from the activity financed by the bank loan
helped 28 beneficiaries (6.97 per cent) to settle their past debts.
TABLE 5.29
REASONS FOR NOT BEING BENEFITED FROM THE LOAN
Sl.No. Not Benefited Reasons Number of
Beneficiaries
Percentage to the
Total
1. Assets sold out 12 6.06
2. Poor return 28 14.14
3. Misutilisation of loan 128 64.65
4. No opinion 30 15.15
Total 198 100.00
Source: Compiled from Primary data.
Table 5.29 reveals the reasons why some beneficiaries (198) were not
benefited from the bank loan. When such beneficiaries were interviewed to find
out the reasons for no benefit from the bank loan. 12 beneficiaries (6.06 per cent)
opined that they sold out the assets created with the bank loan. 28 beneficiaries
(14.14 per cent) expressed that they were able to reap poor yield from the activity
financed by the bank credit. A majority of the beneficiaries (128) considered that
they were not able to get any benefit from the bank loan because they misutilised
the bank credit or incremental income. When some respondents expressed their
views regarding the reasons for not having been benefited from the bank loan,
211
30 respondents did not give any opinion. Thus the above analysis also proves that
misutilisation of credit was the reason for non-repayment of the bank loan.
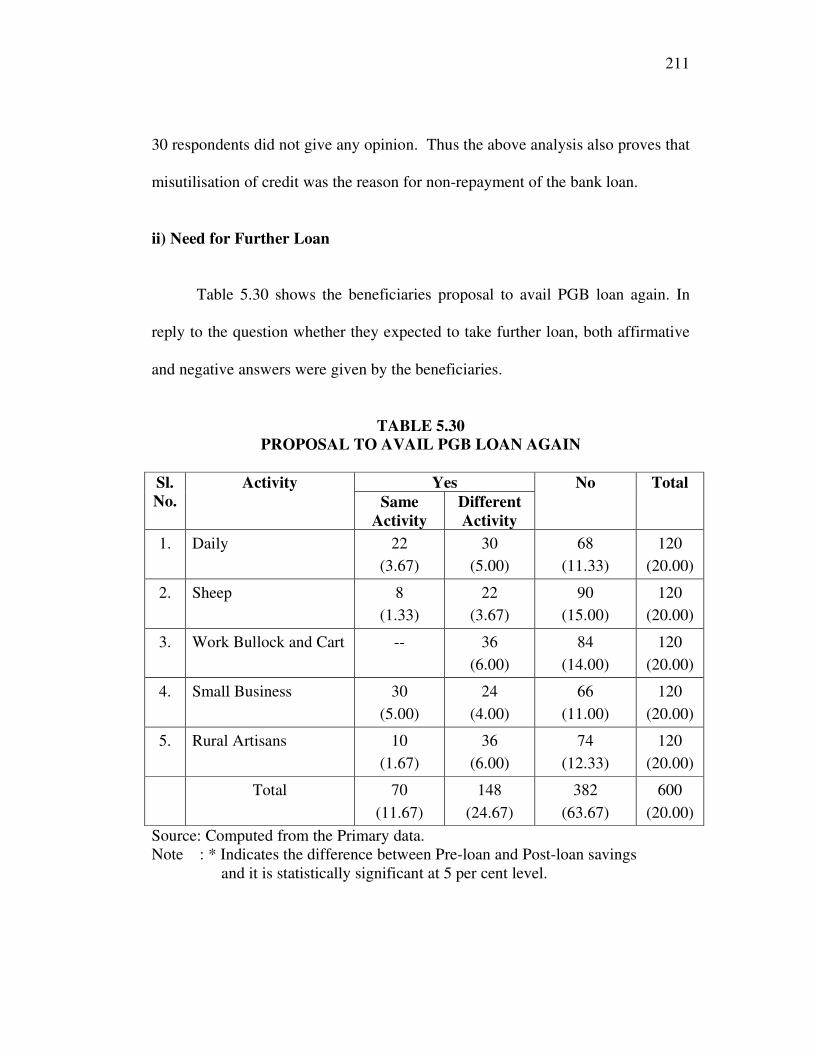
ii) Need for Further Loan
Table 5.30 shows the beneficiaries proposal to avail PGB loan again. In
reply to the question whether they expected to take further loan, both affirmative
and negative answers were given by the beneficiaries.
TABLE 5.30
PROPOSAL TO AVAIL PGB LOAN AGAIN
Sl.
No.
Activity Yes No Total
Same
Activity
Different
Activity
1. Daily 22
(3.67)
30
(5.00)
68
(11.33)
120
(20.00)
2. Sheep 8
(1.33)
22
(3.67)
90
(15.00)
120
(20.00)
3. Work Bullock and Cart -- 36
(6.00)
84
(14.00)
120
(20.00)
4. Small Business 30
(5.00)
24
(4.00)
66
(11.00)
120
(20.00)
5. Rural Artisans 10
(1.67)
36
(6.00)
74
(12.33)
120
(20.00)
Total 70
(11.67)
148
(24.67)
382
(63.67)
600
(20.00)
Source: Computed from the Primary data.
Note : * Indicates the difference between Pre-loan and Post-loan savings
and it is statistically significant at 5 per cent level.
212
Inspite of increase in income due to loan activities 382 of the 600
respondents (63.66 per cent) did not want to avail further loans from PGB. Only
202 respondents (36.34 per cent) wanted to avail further loans. Of this, 70
respondents wanted to avail further loan for the same activity indicating the
comparatively better income yielding capacity assured and steady stream of
income without much risk and mentioned the desire to expand the size of existing
unit rather than to start a new activity. But 148 respondents wanted to avail a
subsequent loan for different activity.
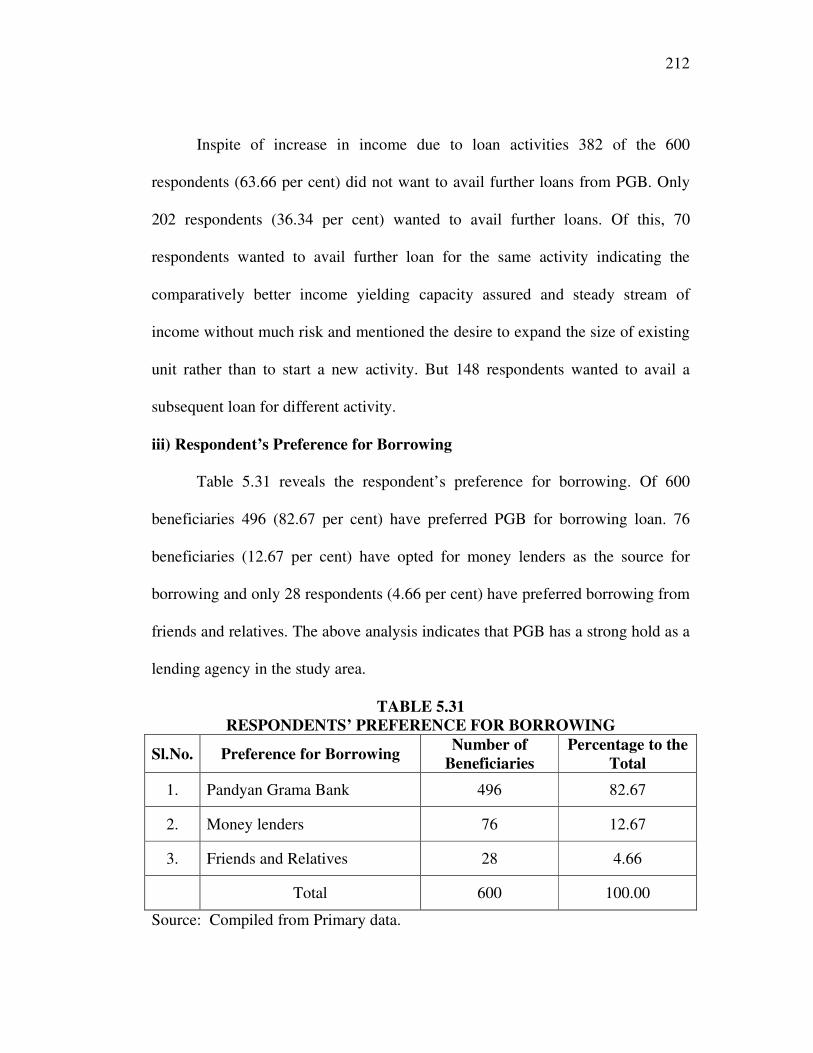
iii) Respondent’s Preference for Borrowing
Table 5.31 reveals the respondent’s preference for borrowing. Of 600
beneficiaries 496 (82.67 per cent) have preferred PGB for borrowing loan. 76
beneficiaries (12.67 per cent) have opted for money lenders as the source for
borrowing and only 28 respondents (4.66 per cent) have preferred borrowing from
friends and relatives. The above analysis indicates that PGB has a strong hold as a
lending agency in the study area.
TABLE 5.31
RESPONDENTS’ PREFERENCE FOR BORROWING
Sl.No. Preference for Borrowing Number of
Beneficiaries
Percentage to the
Total
1. Pandyan Grama Bank 496 82.67
2. Money lenders 76 12.67
3. Friends and Relatives 28 4.66
Total 600 100.00
Source: Compiled from Primary data.
213
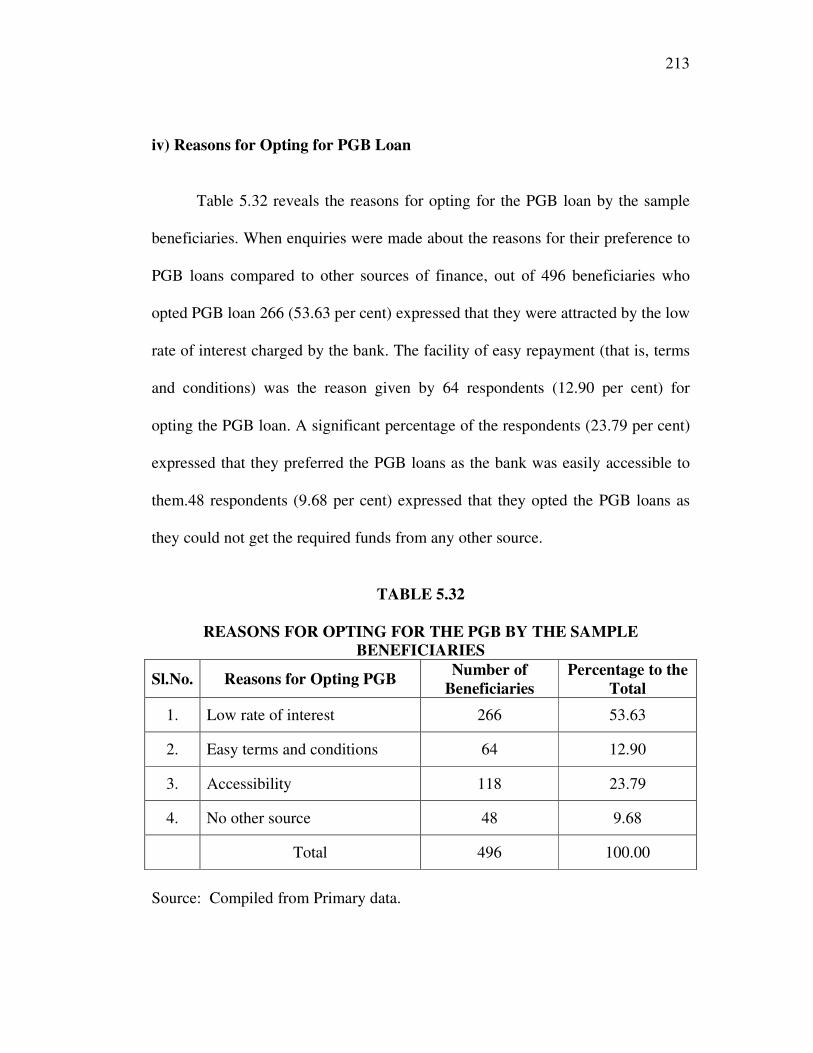
iv) Reasons for Opting for PGB Loan
Table 5.32 reveals the reasons for opting for the PGB loan by the sample
beneficiaries. When enquiries were made about the reasons for their preference to
PGB loans compared to other sources of finance, out of 496 beneficiaries who
opted PGB loan 266 (53.63 per cent) expressed that they were attracted by the low
rate of interest charged by the bank. The facility of easy repayment (that is, terms
and conditions) was the reason given by 64 respondents (12.90 per cent) for
opting the PGB loan. A significant percentage of the respondents (23.79 per cent)
expressed that they preferred the PGB loans as the bank was easily accessible to
them.48 respondents (9.68 per cent) expressed that they opted the PGB loans as
they could not get the required funds from any other source.
TABLE 5.32
REASONS FOR OPTING FOR THE PGB BY THE SAMPLE
BENEFICIARIES
Sl.No. Reasons for Opting PGB Number of
Beneficiaries
Percentage to the
Total
1. Low rate of interest 266 53.63
2. Easy terms and conditions 64 12.90
3. Accessibility 118 23.79
4. No other source 48 9.68
Total 496 100.00
Source: Compiled from Primary data.
214
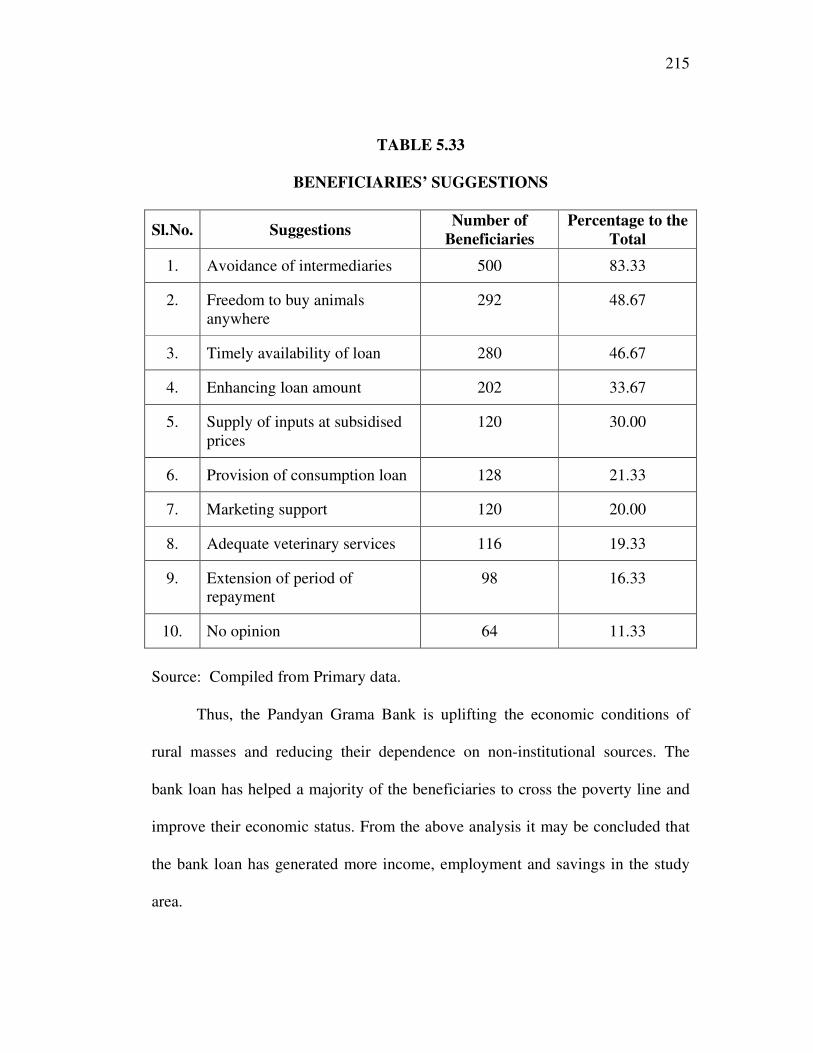
5.3 Beneficiaries’ Suggestion
An survey was conducted among the beneficiaries to obtain their
suggestions to overcome the problems faced by them and for the better
functioning of the PGB. The suggestions offered by the respondents are presented
in Table 5.33. In the form of suggestions 83.33 percent respondents requested
avoidance of intermediaries; 48.67 per cent beneficiaries wanted freedom to buy
cattle anywhere they liked; 46.67 per cent respondents insisted on timely
availability of loan; 33.67 per cent respondents suggested an enhancement of loan
amount; 30.00 per cent beneficiaries insisted on the supply of inputs at subsidised
prices; 21.33 per cent beneficiaries consumption loan; 20.00 per cent beneficiaries
wanted marketing support for their produce; 19.33 per cent respondents needed
adequate veterinary services; 16.33 per cent beneficiaries requested for the
extension of period of repayment and only 11.33 per cent respondents offered no
suggestion.
215
TABLE 5.33
BENEFICIARIES’ SUGGESTIONS
Sl.No. Suggestions Number of
Beneficiaries
Percentage to the
Total
1. Avoidance of intermediaries 500 83.33
2. Freedom to buy animals
anywhere
292 48.67
3. Timely availability of loan 280 46.67
4. Enhancing loan amount 202 33.67
5. Supply of inputs at subsidised
prices
120 30.00
6. Provision of consumption loan 128 21.33
7. Marketing support 120 20.00
8. Adequate veterinary services 116 19.33
9. Extension of period of
repayment
98 16.33
10. No opinion 64 11.33
Source: Compiled from Primary data.
Thus, the Pandyan Grama Bank is uplifting the economic conditions of
rural masses and reducing their dependence on non-institutional sources. The
bank loan has helped a majority of the beneficiaries to cross the poverty line and
improve their economic status. From the above analysis it may be concluded that
the bank loan has generated more income, employment and savings in the study
area.

216
158-202,204-216