Embed Size (px)
Citation preview

FIN 3000
Chapter 7
Risk and Return: History
Liuren Wu
Overview
1. Calculate Realized and Expected Rates of Return and Risk.
2. Describe the Historical Pattern of Financial Market Returns.
3. Compute Geometric and Arithmetic Average Rates of Return.
4. Explain Efficient Market Hypothesis
FIN3000, Liuren Wu2

Realized Return from an Investment
Realized return or cash return measures the gain or loss on an investment.
FIN3000, Liuren Wu3

Example
Example 1: You invested in 1 share of Apple (AAPL) for $95 and sold a year later for $200. The company did not pay any dividend during that period. What will be the cash return on this investment?
Cash return (dollar return) = 200+0-95=105
Rate of return =105/95=1.1053=110.54%.
FIN3000, Liuren Wu4
FIN3000, Liuren Wu5
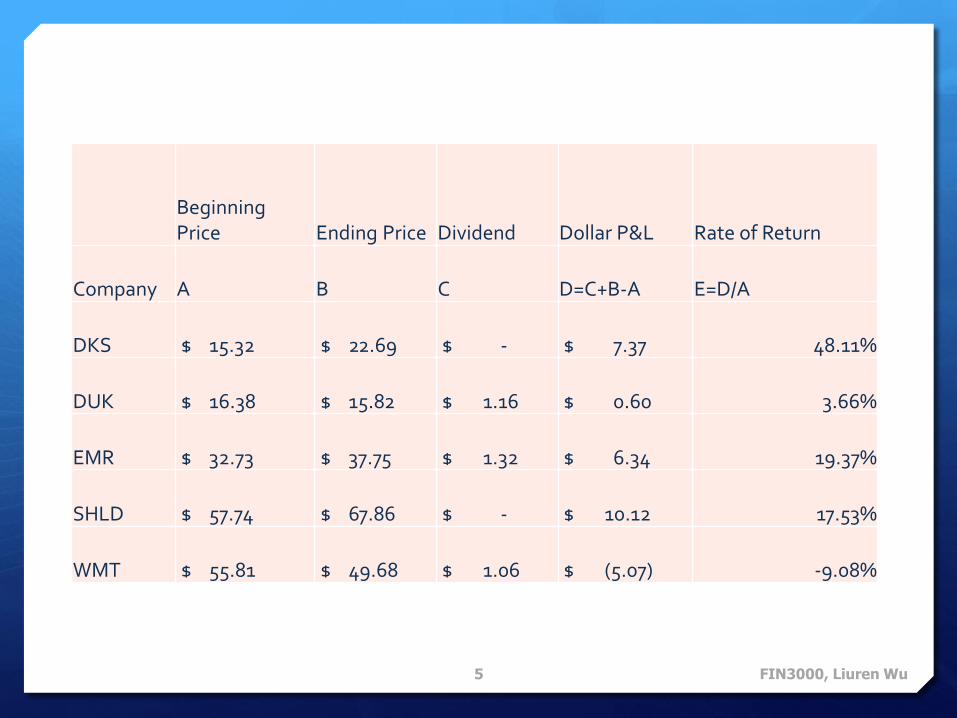
Beginning Price Ending Price Dividend Dollar P&L Rate of Return
Company A B C D=C+B-A E=D/A
DKS $ 15.32 $ 22.69 $ - $ 7.37 48.11%
DUK $ 16.38 $ 15.82 $ 1.16 $ 0.60 3.66%
EMR $ 32.73 $ 37.75 $ 1.32 $ 6.34 19.37%
SHLD $ 57.74 $ 67.86 $ - $ 10.12 17.53%
WMT $ 55.81 $ 49.68 $ 1.06 $ (5.07) -9.08%
Comments
Table 7-1 indicates that the returns from investing in common stocks can be positive or negative.
Past performance is not an indicator of future performance.
FIN3000, Liuren Wu6

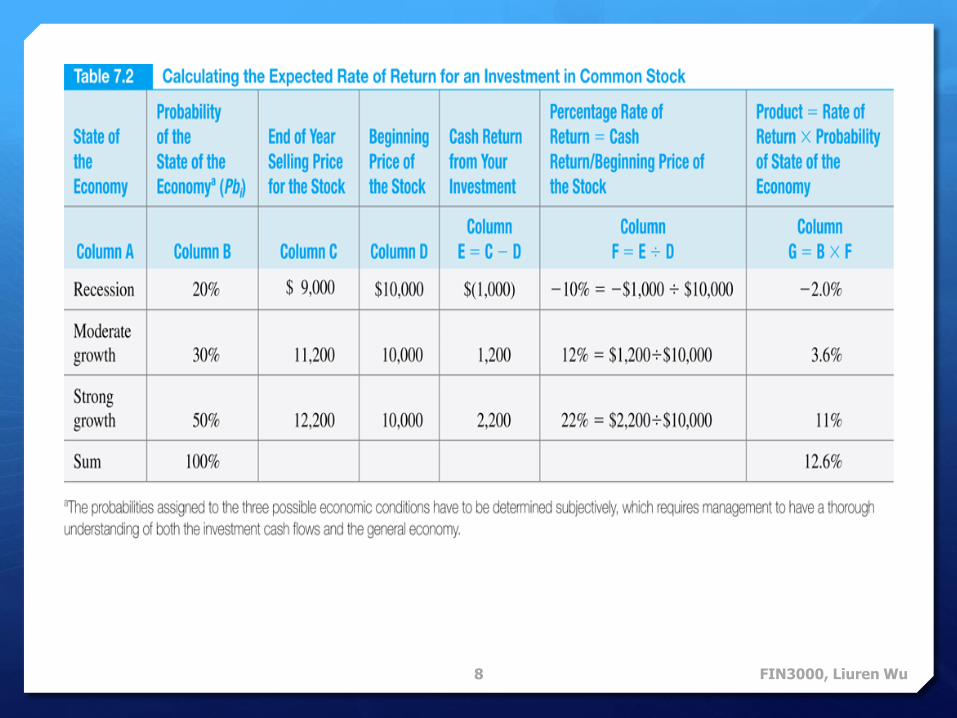
Expected Return from an Investment
Expected return is what you expect to earn from an investment in the future.
It is estimated as the average of the possible returns, where each possible return is weighted by the probability that it occurs.
FIN3000, Liuren Wu7
FIN3000, Liuren Wu8
Risk
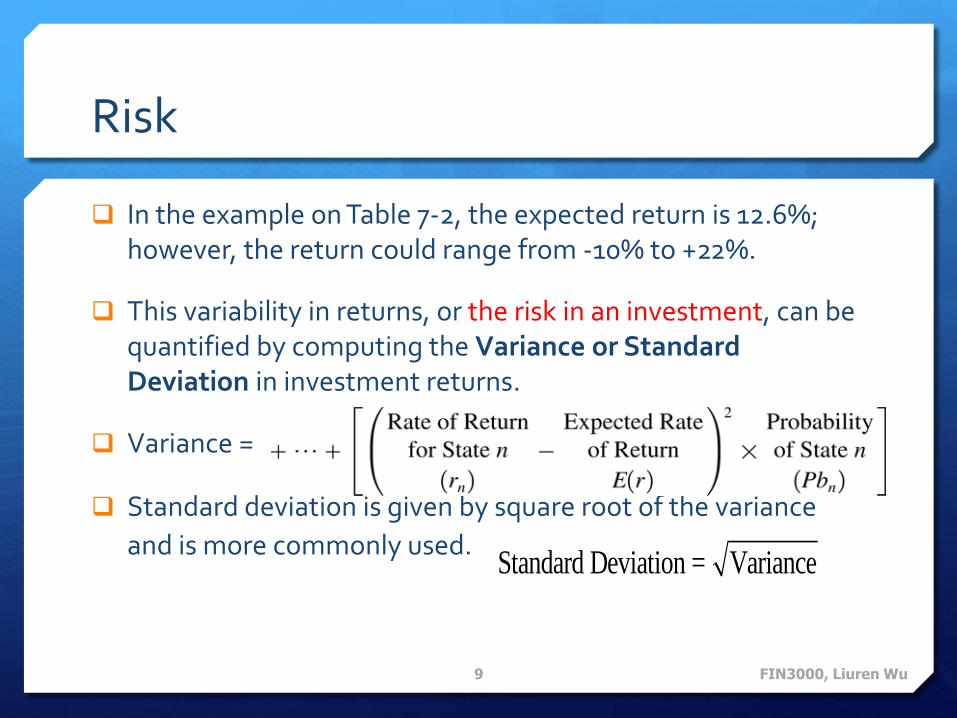
In the example on Table 7-2, the expected return is 12.6%; however, the return could range from -10% to +22%.
This variability in returns, or the risk in an investment, can be quantified by computing the Variance or Standard Deviation in investment returns.
Variance =
Standard deviation is given by square root of the variance
and is more commonly used.
FIN3000, Liuren Wu9
Standard Deviation = Variance

Example
Let us compare two possible investment alternatives:
① U.S. Treasury Bill –Treasury bill is a short-term debt obligation of the U.S. Government. Assume this particular Treasury bill matures in one year and promises to pay an annual return of 5%. U.S. Treasury bill is considered risk-free as there is no risk of default on the promised payments.
② Common stock of the Ace Publishing Company – an investment in common stock will be a risky investment.
FIN3000, Liuren Wu10

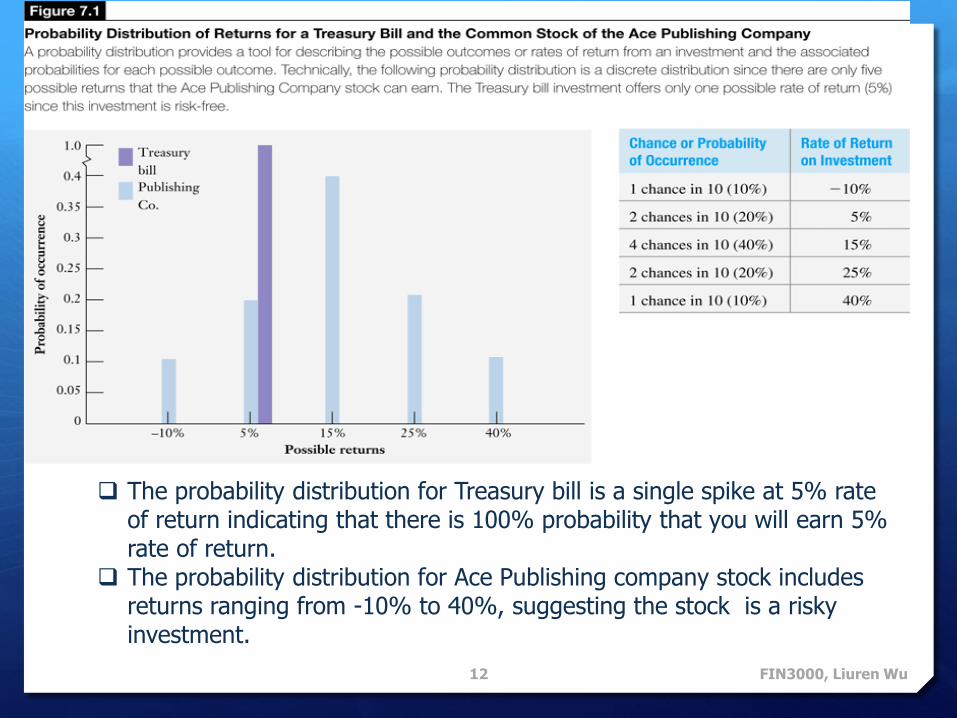
Probability Distribution
The probability distribution of an investment’s return
contains all possible rates of return from the investment along with the associated probabilities for each outcome.
Figure 7-1 contains an assumed probability distribution for U.S. Treasury bill and Ace Publishing Company common stock.
FIN3000, Liuren Wu11
FIN3000, Liuren Wu12
The probability distribution for Treasury bill is a single spike at 5% rate of return indicating that there is 100% probability that you will earn 5% rate of return.
The probability distribution for Ace Publishing company stock includes returns ranging from -10% to 40%, suggesting the stock is a risky investment.

Expected return and variance calculation
From Figure 7.1, we can compute the expected returns:
Treasury Bill: 5%
Stock: .1x(-10%) + .2x 5% + .4x15% + .2x25%+.1x40%=15%.
We can also compute the variance and standard deviation:
Treasury: Variance=0.
Stock: .1x(-10%-15%)2+.2x(5%-15%)2+.2x(25%-15%)2+.1x(40%-15%)2 =0.0165, Std Dev=
FIN3000, Liuren Wu13
0.0165 = 0.1285 =12.85%

FIN3000, Liuren Wu14
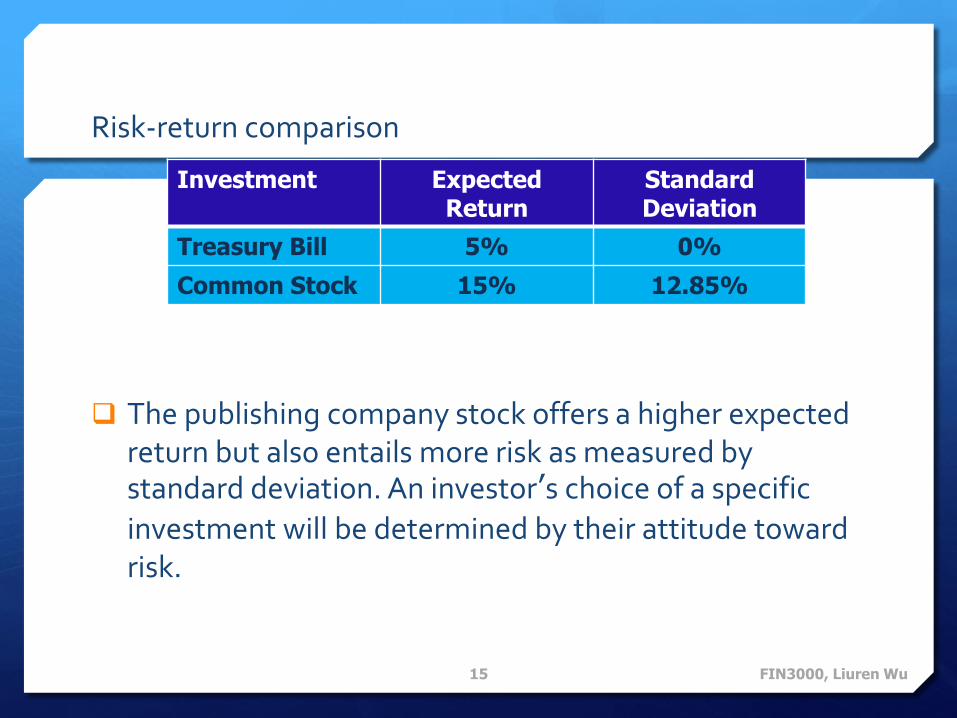
Risk-return comparison
The publishing company stock offers a higher expected return but also entails more risk as measured by standard deviation. An investor’s choice of a specific
investment will be determined by their attitude toward risk.
FIN3000, Liuren Wu15
Investment Expected Return
Standard Deviation
Treasury Bill 5% 0%
Common Stock 15% 12.85%

U.S. Financial Markets — Domestic Investment Returns
Figure 7-2 shows the historical returns earned on four types of investments (small stocks, large stocks, government bonds, treasury bills) over the period 1926-2008.
The graph shows the value of $1 investment made in each of these asset categories in 1926 and held until the end of 2008.
We observe a clear relationship between risk and return. Small stocks have the highest annual return but higher returns are associated with much greater risk.
FIN3000, Liuren Wu16

FIN3000, Liuren Wu17

Historical risk-return relation
We observe a clear relationship between risk and return. Small stocks have the highest annual return but higher returns are associated with much greater risk.
The riskier investments have historically realized higher returns.
The historical returns of the higher-risk investment classes have higher standard deviations
FIN3000, Liuren Wu18
Annual Small Stocks
Large Stocks
Government Bonds
Treasury Bills
Return 11.7% 9.6% 5.7% 3.7%
S.D. 34.1% 21.4% 8.5% 0.9%

Geometric vs. Arithmetic Average Rates of Return
Arithmetic average may not always capture the true rate of return on an investment. In some cases, geometric or compound average may be a more appropriate measure.
Suppose you bought a stock for $25. After one year, the stock rises to $30 and in the second year, it falls to $15. What was the average return on this investment?
The stock earned +20% in the 1st year and -50% in the 2nd year.
Simple average = (20%-50%) ÷ 2 = -15%
Geometric (compound) average: {($15/$25)1/2} - 1 = 22.54%
FIN3000, Liuren Wu19
Geometric vs. Arithmetic Average Rates of Return
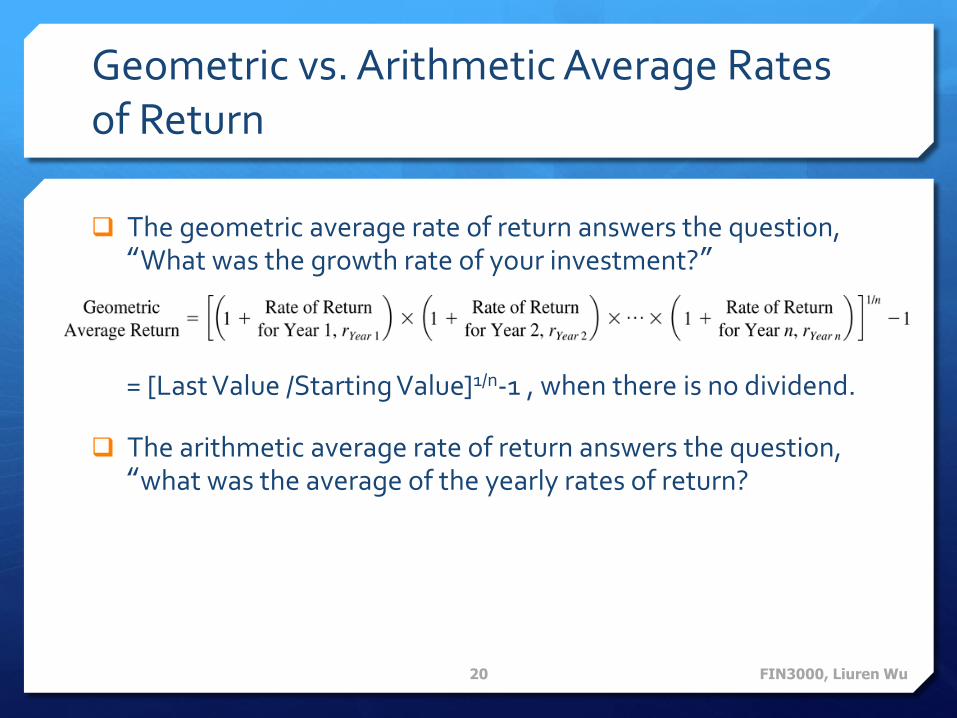
The geometric average rate of return answers the question, “What was the growth rate of your investment?”
= [Last Value /Starting Value]1/n-1 , when there is no dividend.
The arithmetic average rate of return answers the question, “what was the average of the yearly rates of return?
FIN3000, Liuren Wu20
Example
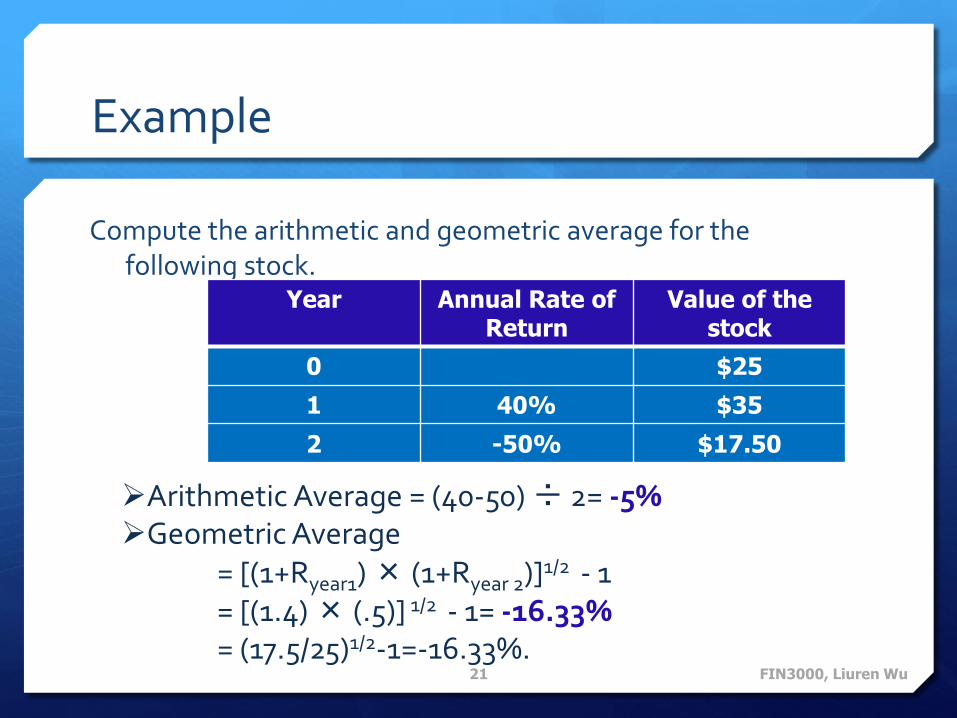
Compute the arithmetic and geometric average for the following stock.
FIN3000, Liuren Wu21
Year Annual Rate of Return
Value of the stock
0 $25
1 40% $35
2 -50% $17.50
Arithmetic Average = (40-50) ÷ 2= -5%Geometric Average
= [(1+Ryear1) × (1+Ryear 2)]1/2 - 1= [(1.4) × (.5)] 1/2 - 1= -16.33%= (17.5/25)1/2-1=-16.33%.

Choosing the Right “Average”
Both arithmetic average geometric average are important and correct. The following grid provides some guidance as to which average is appropriate and when:
FIN3000, Liuren Wu22
Question being addressed:
Appropriate Average Calculation:
What annual rate of return can we expect for next year?
The arithmetic average calculated using annual rates of return.
What annual rate of return can we expect over a multi-year horizon?
The geometric average calculated over a similar past period.

What Determines Stock Prices?
In short, stock prices tend to go up when there is good news about future profits, and they go down when there is bad news about future profits.
The efficient market hypothesis (EMH) states that securities prices accurately reflect future expected cash flows and are based on information available to investors.
An efficient market is a market in which all the available information is fully incorporated into the prices of the securities and the returns the investors earn on their investments cannot be predicted.
FIN3000, Liuren Wu23

The Efficient Market Hypothesis
1. The Weak-Form Efficient Market Hypothesis
All past security market information is fully reflected in security prices. This means that all price and volume information is already reflected in a security’s price.
2. The Semi-Strong Form Efficient Market Hypothesis
All publicly available information is fully reflected in security prices. This is a stronger statement as it includes all public information, e.g., firm’s financial statements, analysts’
estimates, announcements about the economy.
3. The Strong Form Efficient Market Hypothesis
All information, regardless of whether this information is public or private, is fully reflected in securities prices.
FIN3000, Liuren Wu24

Do We Expect Financial Markets To Be Perfectly Efficient?
In general, markets are expected to be at least weak form and semi-strong form efficient.
If there did exist simple and obvious profitable strategies, the strategies would attract the attention of investors, who by implementing the strategies would compete away the profits.
We would not expect financial markets to be strong-form efficient. We expect the markets to partially, but not perfectly, reflect information that is privately collected.
The markets will be inefficient enough to provide some investors with an opportunity to recoup their costs of obtaining information, but not so inefficient that there is easy money to be made in the stock market.
FIN3000, Liuren Wu25

The Behavioral View
Efficient market hypothesis is based on the assumption that investors, as a group, are pretty rational. This view has been challenged.
What if investors are not rational?
If investors do not rationally process information, then markets may not accurately reflect even public information.
FIN3000, Liuren Wu26
Example: Overconfidence
For example, overconfident investors may under react when management announces earnings as they have too much confidence in their own views of the company’s true value and tend to place too little weight
on new information provided by management.
As a result, this new information, even though it is publicly and freely available, is not completely reflected in stock prices.
FIN3000, Liuren Wu27

Market Efficiency –What does the Evidence Show?
The degree of efficiency of financial markets is an important question and has generated extensive research.
Historically, there has been some evidence of inefficiencies in the financial markets. This is summarized by three observations in Table 7-4.
More recent evidence suggests that these patterns (as noted in Table 7-4) have largely disappeared after 2000.
FIN3000, Liuren Wu28

FIN3000, Liuren Wu29
Trend
Following the publication of academic research on market inefficiencies, institutional investors set up hedge funds to exploit these patterns. By trading aggressively on these patterns, the hedge funds have largely eliminated the inefficiencies.
If there is a type of inefficiency that is publicly known and is easy to be traded against, it is hard for this efficiency to last.
Some inefficiencies can last longer, e.g.,
Super high frequency, the implementation of which asks for heavy investment in infrastructure.
Super low frequency: Many investors do not have the patience, and it is hard to verify whether the strategy still works or not.
Strategies involving heavily quantitative information processing.FIN3000, Liuren Wu30