Embed Size (px)
Citation preview
7
Chapter Two
IS AMC FLYING LESS?
In the 1990s, the number of Air Force active-duty military personnel declinedby 40 percent.1 During this period, the Air Force was deployed on a continualbasis in Northeast and Southwest Asia. It was also deployed for peacekeepingin Bosnia and for evacuation operations and humanitarian assistance inSomalia, Bangladesh, Thailand, Cambodia, Rwanda, and Ethiopia.2 Many be-lieve that this increased commitment, coupled with reduced resources, placedadded stress on Air Force aircraft and personnel.
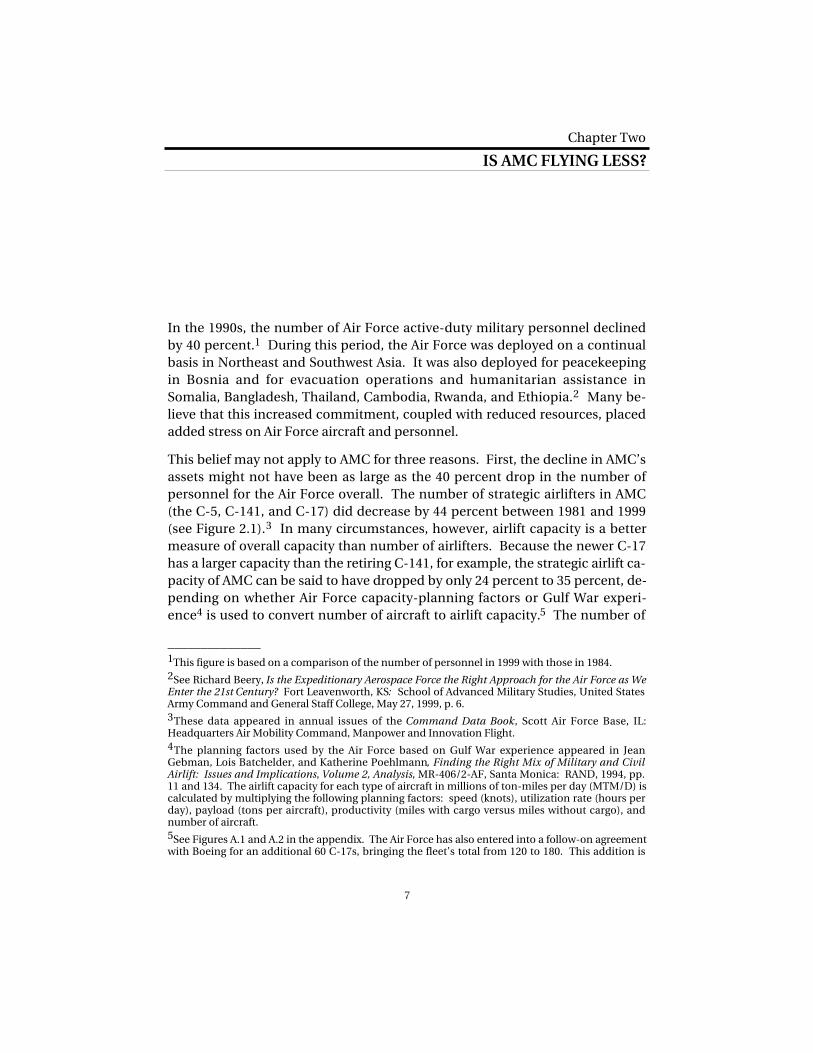
This belief may not apply to AMC for three reasons. First, the decline in AMC’sassets might not have been as large as the 40 percent drop in the number ofpersonnel for the Air Force overall. The number of strategic airlifters in AMC(the C-5, C-141, and C-17) did decrease by 44 percent between 1981 and 1999(see Figure 2.1).3 In many circumstances, however, airlift capacity is a bettermeasure of overall capacity than number of airlifters. Because the newer C-17has a larger capacity than the retiring C-141, for example, the strategic airlift ca-pacity of AMC can be said to have dropped by only 24 percent to 35 percent, de-pending on whether Air Force capacity-planning factors or Gulf War experi-ence4 is used to convert number of aircraft to airlift capacity.5 The number of
______________ 1This figure is based on a comparison of the number of personnel in 1999 with those in 1984.2See Richard Beery, Is the Expeditionary Aerospace Force the Right Approach for the Air Force as WeEnter the 21st
Century? Fort Leavenworth, KS: School of Advanced Military Studies, United States
Army Command and General Staff College, May 27, 1999, p. 6.3These data appeared in annual issues of the Command Data Book, Scott Air Force Base, IL:Headquarters Air Mobility Command, Manpower and Innovation Flight.4The planning factors used by the Air Force based on Gulf War experience appeared in JeanGebman, Lois Batchelder, and Katherine Poehlmann, Finding the Right Mix of Military and CivilAirlift: Issues and Implications, Volume 2, Analysis, MR-406/2-AF, Santa Monica: RAND, 1994, pp.11 and 134. The airlift capacity for each type of aircraft in millions of ton-miles per day (MTM/D) iscalculated by multiplying the following planning factors: speed (knots), utilization rate (hours perday), payload (tons per aircraft), productivity (miles with cargo versus miles without cargo), andnumber of aircraft.5See Figures A.1 and A.2 in the appendix. The Air Force has also entered into a follow-on agreementwith Boeing for an additional 60 C-17s, bringing the fleet’s total from 120 to 180. This addition is

8 The Peacetime Tempo of Air Mobility Operations
RANDMR1506-2.1
Num
ber
of a
ircra
ft
1981
Fiscal year
350
1983 1985 1999
300
150
0
100
50
1987
C-141
Total
C-5
1989 1991 1993 1995 1997
C-17
250
200
Figure 2.1—The Number of Strategic Airlifters Has Decreased Sharply Since 1992
strategic airlift pilots declined by 25 percent between 1982 and 2000 (see Figure2.2).
Second, peacetime operations for fighters and bombers differ from those forairlifters and tankers. Both are heavily involved in routine deliveries of person-nel, supplies, and equipment to overseas bases even in the absence of small-scale contingencies. In the 1990s, however, the number of major U.S. militaryinstallations abroad declined by almost 75 percent6 and active-duty militarypersonnel abroad decreased by 50 percent,7 significantly reducing the demandon airlifters and tankers for routine deliveries. Moreover, when contingencyactivities are high, AMC has the flexibility to hire commercial air carriers toshare air mobility chores. In the opposite situation, when contingency activi-ties are low, AMC can reduce commercial augmentation to retain flying hoursfor the training and aging of its pilots. In contrast, aside from some training
_______________________________________________________________________ expected to more than compensate for the C-141’s retirement and to continue the uptrend in totalairlift capability that began in 1997. In fact, Major General Arthur Lichte, AMC’s Chief of Plans andPrograms, said, “It’s our command’s position that we would want 222 C-17s or more.” (See“Despite Heavy Demands, AMC Predicts No Change in Airlift Requirement,” Inside the Air Force,March 8, 2002.) The 42 or more C-17s, on top of the 60 aircraft recently bought, will further enhancethe uptrend.6See Figure A.3 in the appendix.7See Figure A.4 in the appendix.

Is AMC Flying Less? 9
RANDMR1506-2.2
Num
ber of full-tim
e pilots
1982
Fiscal year
1,400
1984 1986 2000
1,200
600
0
400
200
1988
C-141
Total
C-5
1990 1992 1994 1996 1998
C-17
1,000
800
Figure 2.2—The Number of Strategic Airlift Pilots Declined in the Mid-1990s
missions, the overall annual intensity of fighters and bombers depends on thefrequency and level of contingency deployments. In the absence of special de-ployments, in other words, fighter and bomber units have fewer routine activi-ties and do not have a commercial counterpart to help share their burden.Thus, the overall intensity of AMC peacetime operations can be less sensitive tospecial deployments and hence more stable through the years.
Third, although the total peacetime airlift operations in the 1990s seemed nu-merous and intensive, they should be compared to those during the 1980s todetermine whether resources were truly more stressed.
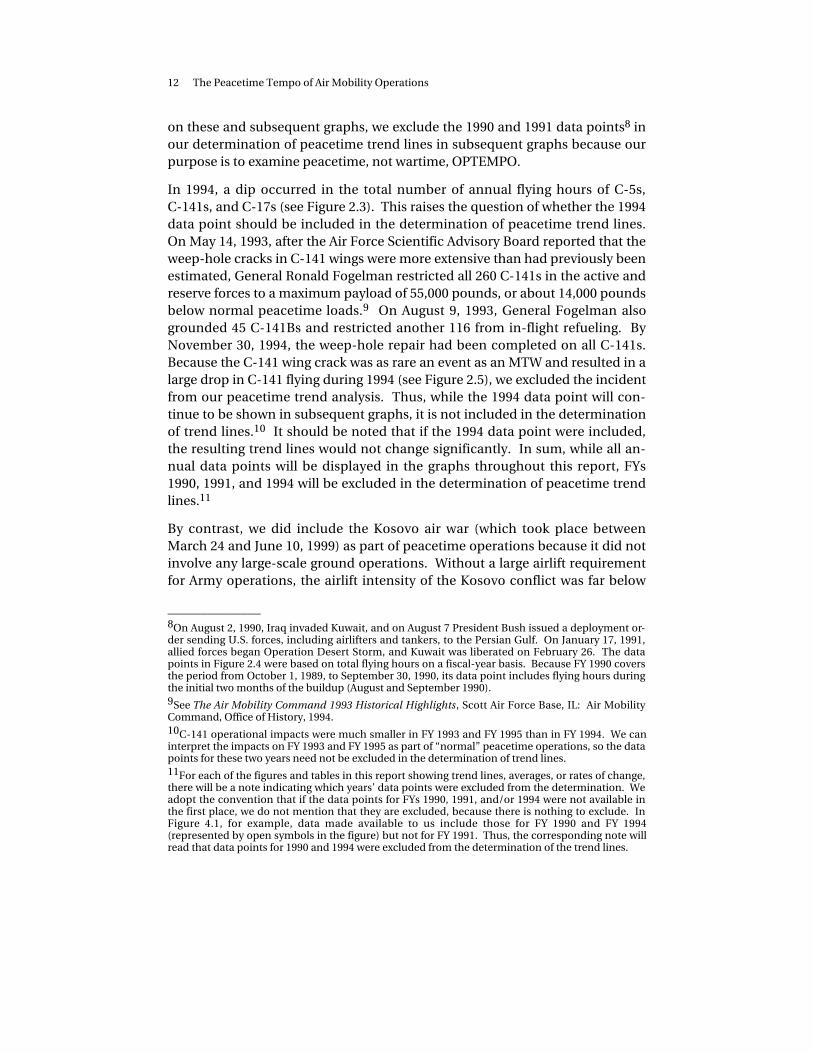
This chapter addresses the question, Is AMC flying more or less? Although thisquestion would appear to be straightforward, simple answers with plots of an-nual flying hours over time ignore how many aircraft and pilots are involved.Figure 2.3 shows three such curves for strategic airlifters (the C-5, C-141, andC-17), tactical airlifters (the C-130), and tankers (the KC-135 and KC-10), re-spectively. Thus, it would be better to pose the questions, Is AMC flying moreper aircraft, and is AMC flying more per pilot? Even these questions, however,are too broad, as a C-141 would differ from its replacement, the C-17, both incapacity and in other characteristics. Also, an airlifter’s function is very differ-ent from that of a tanker. Yet an examination of flying hours per aircraft

10 The Peacetime Tempo of Air Mobility Operations
RANDMR1506-2.3
Annual fly
ing hours
1980
Fiscal year
600,000
1985 1990 2000
500,000
400,000
300,000
0
200,000
100,000
1995
KC-135/KC-10
C-130
C-5/C-141/C-17
NOTE: The reasons for the missing 1980s data for the tankers and the mid-1990s
data for C-130s will be given later in the chapter.
Figure 2.3—Annual Flying Hours for Airlifters and Tankers
for all aircraft types would not reveal the hours of a retiring aircraft decreasingor those of a newly deployed aircraft increasing. One must therefore refine thequestion as follows: Is AMC flying more per aircraft within a given aircraft type?Similarly, is AMC flying more per pilot within a given aircraft type?
We will use three measures to assess AMC flying: (1) the annual flying hours peraircraft of a given type during peacetime; (2) the monthly flying hours per CP ofa given aircraft type during peacetime; and (3) the monthly flying hours per ACof a given aircraft type during peacetime. We have separated the data for CPsand ACs to reflect differences in flying requirements.
ANNUAL FLYING HOURS PER AIRCRAFT
The flying-hour data given herein are based on the annual spreadsheets of theFlying-Hour Program provided by Phil Widincamp, AMC/DOT. Figures 2.4 and2.5 show the annual flying hours for AMC-owned C-5s and C-141s, respectively,from FY 1981 to FY 1999. Both figures show the highest number of flying hoursin 1991, a period that includes the Gulf War. Although we show all data points

Is AMC Flying Less? 11
RANDMR1506-2.4
Annual fly
ing hours
1980
Fiscal year
140,000
1985 1990 1995 2000
120,000
100,000
80,000
60,000
40,000
20,000
0
Figure 2.4—C-5 Annual Flying Hours
RANDMR1506-2.5
Annual fly
ing hours
1980
Fiscal year
450,000
1985 1990 1995 2000
350,000
250,000
200,000
150,000
100,000
50,000
0
400,000
300,000
Figure 2.5—C-141 Annual Flying Hours
12 The Peacetime Tempo of Air Mobility Operations
on these and subsequent graphs, we exclude the 1990 and 1991 data points8 inour determination of peacetime trend lines in subsequent graphs because ourpurpose is to examine peacetime, not wartime, OPTEMPO.
In 1994, a dip occurred in the total number of annual flying hours of C-5s,C-141s, and C-17s (see Figure 2.3). This raises the question of whether the 1994data point should be included in the determination of peacetime trend lines.On May 14, 1993, after the Air Force Scientific Advisory Board reported that theweep-hole cracks in C-141 wings were more extensive than had previously beenestimated, General Ronald Fogelman restricted all 260 C-141s in the active andreserve forces to a maximum payload of 55,000 pounds, or about 14,000 poundsbelow normal peacetime loads.9 On August 9, 1993, General Fogelman alsogrounded 45 C-141Bs and restricted another 116 from in-flight refueling. ByNovember 30, 1994, the weep-hole repair had been completed on all C-141s.Because the C-141 wing crack was as rare an event as an MTW and resulted in alarge drop in C-141 flying during 1994 (see Figure 2.5), we excluded the incidentfrom our peacetime trend analysis. Thus, while the 1994 data point will con-tinue to be shown in subsequent graphs, it is not included in the determinationof trend lines.10 It should be noted that if the 1994 data point were included,the resulting trend lines would not change significantly. In sum, while all an-nual data points will be displayed in the graphs throughout this report, FYs1990, 1991, and 1994 will be excluded in the determination of peacetime trendlines.11
By contrast, we did include the Kosovo air war (which took place betweenMarch 24 and June 10, 1999) as part of peacetime operations because it did notinvolve any large-scale ground operations. Without a large airlift requirementfor Army operations, the airlift intensity of the Kosovo conflict was far below
______________ 8On August 2, 1990, Iraq invaded Kuwait, and on August 7 President Bush issued a deployment or-der sending U.S. forces, including airlifters and tankers, to the Persian Gulf. On January 17, 1991,allied forces began Operation Desert Storm, and Kuwait was liberated on February 26. The datapoints in Figure 2.4 were based on total flying hours on a fiscal-year basis. Because FY 1990 coversthe period from October 1, 1989, to September 30, 1990, its data point includes flying hours duringthe initial two months of the buildup (August and September 1990).9See The Air Mobility Command 1993 Historical Highlights, Scott Air Force Base, IL: Air MobilityCommand, Office of History, 1994.10C-141 operational impacts were much smaller in FY 1993 and FY 1995 than in FY 1994. We caninterpret the impacts on FY 1993 and FY 1995 as part of “normal” peacetime operations, so the datapoints for these two years need not be excluded in the determination of trend lines.11For each of the figures and tables in this report showing trend lines, averages, or rates of change,there will be a note indicating which years’ data points were excluded from the determination. Weadopt the convention that if the data points for FYs 1990, 1991, and/or 1994 were not available inthe first place, we do not mention that they are excluded, because there is nothing to exclude. InFigure 4.1, for example, data made available to us include those for FY 1990 and FY 1994(represented by open symbols in the figure) but not for FY 1991. Thus, the corresponding note willread that data points for 1990 and 1994 were excluded from the determination of the trend lines.
Is AMC Flying Less? 13
what an MTW such as the Gulf War would have demanded and also fell belowthat of OEF, our demarcation for peacetime and wartime.12 As far as airlift isconcerned, we therefore treated the Kosovo air war as a small-scale contin-gency that did not demand high air mobility support and included it in ourtrend analysis of peacetime operations.
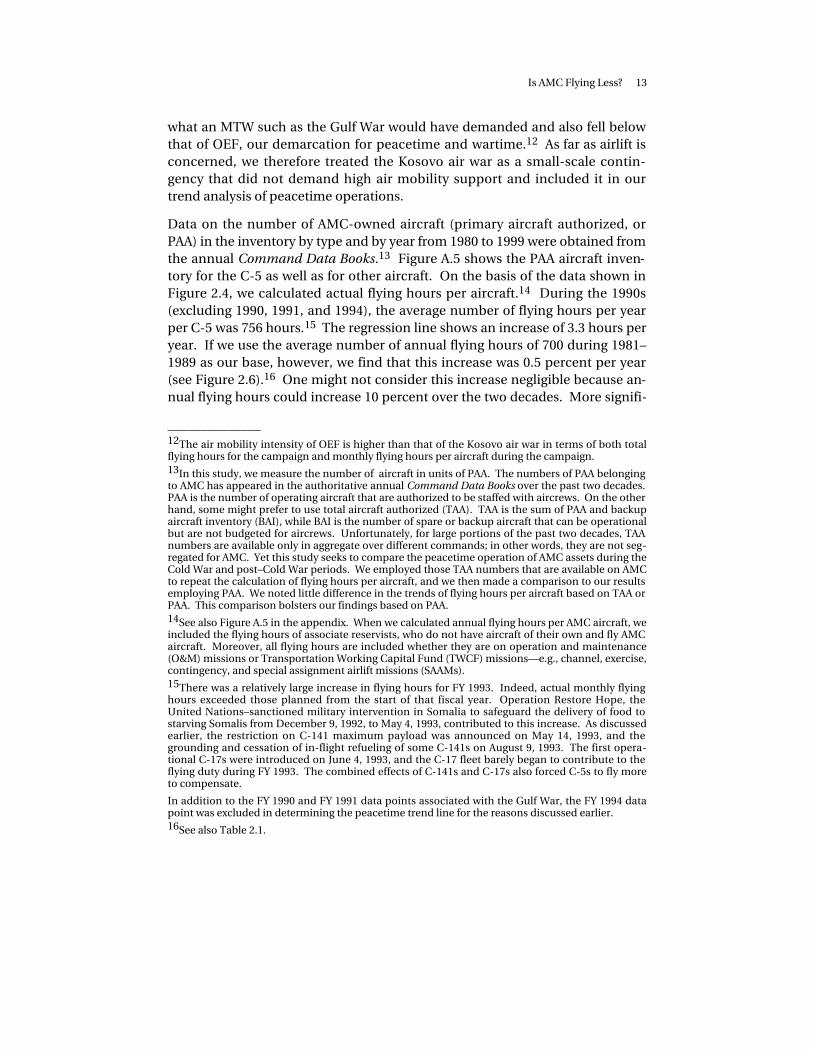
Data on the number of AMC-owned aircraft (primary aircraft authorized, orPAA) in the inventory by type and by year from 1980 to 1999 were obtained fromthe annual Command Data Books.13 Figure A.5 shows the PAA aircraft inven-tory for the C-5 as well as for other aircraft. On the basis of the data shown inFigure 2.4, we calculated actual flying hours per aircraft.14 During the 1990s(excluding 1990, 1991, and 1994), the average number of flying hours per yearper C-5 was 756 hours.15 The regression line shows an increase of 3.3 hours peryear. If we use the average number of annual flying hours of 700 during 1981–1989 as our base, however, we find that this increase was 0.5 percent per year(see Figure 2.6).16 One might not consider this increase negligible because an-nual flying hours could increase 10 percent over the two decades. More signifi-
______________ 12The air mobility intensity of OEF is higher than that of the Kosovo air war in terms of both totalflying hours for the campaign and monthly flying hours per aircraft during the campaign.13In this study, we measure the number of aircraft in units of PAA. The numbers of PAA belongingto AMC has appeared in the authoritative annual Command Data Books over the past two decades.PAA is the number of operating aircraft that are authorized to be staffed with aircrews. On the otherhand, some might prefer to use total aircraft authorized (TAA). TAA is the sum of PAA and backupaircraft inventory (BAI), while BAI is the number of spare or backup aircraft that can be operationalbut are not budgeted for aircrews. Unfortunately, for large portions of the past two decades, TAAnumbers are available only in aggregate over different commands; in other words, they are not seg-regated for AMC. Yet this study seeks to compare the peacetime operation of AMC assets during theCold War and post–Cold War periods. We employed those TAA numbers that are available on AMCto repeat the calculation of flying hours per aircraft, and we then made a comparison to our resultsemploying PAA. We noted little difference in the trends of flying hours per aircraft based on TAA orPAA. This comparison bolsters our findings based on PAA.14See also Figure A.5 in the appendix. When we calculated annual flying hours per AMC aircraft, weincluded the flying hours of associate reservists, who do not have aircraft of their own and fly AMCaircraft. Moreover, all flying hours are included whether they are on operation and maintenance(O&M) missions or Transportation Working Capital Fund (TWCF) missions—e.g., channel, exercise,contingency, and special assignment airlift missions (SAAMs).15There was a relatively large increase in flying hours for FY 1993. Indeed, actual monthly flyinghours exceeded those planned from the start of that fiscal year. Operation Restore Hope, theUnited Nations–sanctioned military intervention in Somalia to safeguard the delivery of food tostarving Somalis from December 9, 1992, to May 4, 1993, contributed to this increase. As discussedearlier, the restriction on C-141 maximum payload was announced on May 14, 1993, and thegrounding and cessation of in-flight refueling of some C-141s on August 9, 1993. The first opera-tional C-17s were introduced on June 4, 1993, and the C-17 fleet barely began to contribute to theflying duty during FY 1993. The combined effects of C-141s and C-17s also forced C-5s to fly moreto compensate.
In addition to the FY 1990 and FY 1991 data points associated with the Gulf War, the FY 1994 datapoint was excluded in determining the peacetime trend line for the reasons discussed earlier.16See also Table 2.1.

14 The Peacetime Tempo of Air Mobility Operations
RANDMR1506-2.6
Annual fly
ing hours per aircraft
1980
Fiscal year
1,600
1985 1990 1995 2000
1,200
600
400
200
0
NOTE: Data points for 1990, 1991, and 1994 were excluded from the determination
of the trend line.
y = 3.3x – 5,874.1
t = 1.2 l.s. = 0.25 r = +0.5%/year
1,400
1,000
800
Figure 2.6—C-5 Annual Flying Hours per Aircraft During Peacetime
cantly, however, Figure 2.6 shows that the trend is not statistically significant—that is, the increase of 0.5 percent per year is not significantly different from a 0percent increase.17 Therefore, there is no basis for arguing that the C-5 wasflying more in the 1990s than in the 1980s.
______________ 17For all trend line analyses, we performed a t-test to determine whether the coefficient of the in-dependent variable (the slope) is zero. The standardized t-test statistic (t), the level of significance(l.s.), and the rate (r) are shown below the regression equation. The l.s. is the probability of type Ierror, or the probability that the slope is actually zero . However, our sample results led us to erro-neously reject a zero slope. Thus, the smaller the l.s., the smaller the probability that there is notrend or the higher our confidence that there is a nonzero trend. To highlight those likely nonzerotrends in the figures and tables throughout the following chapters, we have boldfaced the t, l.s., andr numbers whenever the l.s. is 0.05 or less. In other words, there is a probability of 95 percent orhigher that the trend or slope is not zero. To calculate the rate, we first determined the averageannual value of the 1980s (or those years in the 1980s for which data were available) as the referencevalue or base. The rate is the annual change or the slope of the linear regression line divided by theaverage value (i.e., 3.3/700 = 0.5 percent in the current case). If there were no data for the 1980s, weused the average value for the years in the 1990s (excluding 1990, 1991, and 1994). It should also benoted that the regression software often gives the coefficients of the linear equations throughoutthis report more digits than their numbers of significant figures.

Is AMC Flying Less? 15
Table 2.1
Annual Flying Hours per Aircraft During Peacetime
AircraftData Period(fiscal years)
Average During the1990s (hours/year–aircraft)
Rate of Change(%/year)
t-TestStatistic
Level ofSignificance
C-5 1981–1999 756 +0.5 1.2 0.25C-141 1981–1999 929 –1.3 6.2 0.00C-17 1994–1999 937 +18.0 5.9 0.01C-130 1981–1999 609 –0.2 0.4 0.70KC-135 1993–1999 388 –1.1 0.6 0.61KC-10 1992–1999 748 –0.7 0.3 0.77
NOTE: Data points for 1990, 1991 and 1994 were excluded from the determination of the numbersin the third to sixth columns. Bold entries indicate that the probability of a nonzero trend (rate ofchange) is 95 percent or higher.
We similarly calculated annual flying hours per C-141, which are shown inFigure A.6 in the appendix and in Table 2.1.18 The C-141 did not fly more in the1990s, and its annual flying hours fell by 1.3 percent per year (see Table 2.1).The C-141 aircraft inventory was stable throughout the 1980s and until 1992.Thereafter, it declined quite rapidly, from 220 in 1992 to 74 in 1999 (See FigureA.5). However, even this seemingly sharp decline was less rapid than that inflying hours, thus causing a decline in flying hours per aircraft in the 1990s.
During 1995–1999, the annual flying hours per C-17 increased by 18 percent peryear (see Table 2.1).19 For a newly deployed aircraft, it is normal for annual fly-ing hours per aircraft to increase initially. Moreover, the trend indicates thatthe flying hours per C-17 will be higher than those per C-141 or C-5.20 However,more data points are needed to confirm this trend. The annual flying hours perC-130 did not increase over the past two decades (see Table 2.1).21 Nor didthose for the KC-135 and KC-10 (Table 2.1).22
Overall, none of the aircraft examined except the C-17 showed a statisticallysignificant increase in annual flying hours per aircraft in the 1990s. Indeed, wefound that C-5, C-141, and C-130—aircraft for which comparable data were
______________ 18For our analysis of each aspect of operations, we often show only the C-5 graph in the text andrefer the reader to specific graphs in the appendix for other aircraft (the C-141, C-17, C-130, KC-135,and KC-10). However, we discuss the characteristics and trends of all these aircraft in the text.Moreover, for many statements made in the text, we refer to graphs in the appendix for datasupport.19See also Figure A.7 in the appendix.20See Figure A.7 in the appendix.21See Figure A.8 in the appendix.22See Figures A.9 and A.10 in the appendix.

16 The Peacetime Tempo of Air Mobility Operations
available for the past two decades—were not flown more in the post–Cold Warera than during the Cold War.
One might argue that the actual number of flying hours per aircraft is not rele-vant to AMC because military airlifters and tankers in any case fly far less thando their commercial equivalents, such as the B-747. These military aircraft canbe flown substantially more per year without stressing the aircraft. However,more flying per year would increase the maintenance cost in returning aircraftto their wartime readiness status.
MONTHLY FLYING HOURS PER COPILOT
Thus far we have shown that aircraft did not fly more in the post–Cold War erathan during the Cold War, but whether CPs and ACs have been subject to in-creased flying demand remains to be discussed.
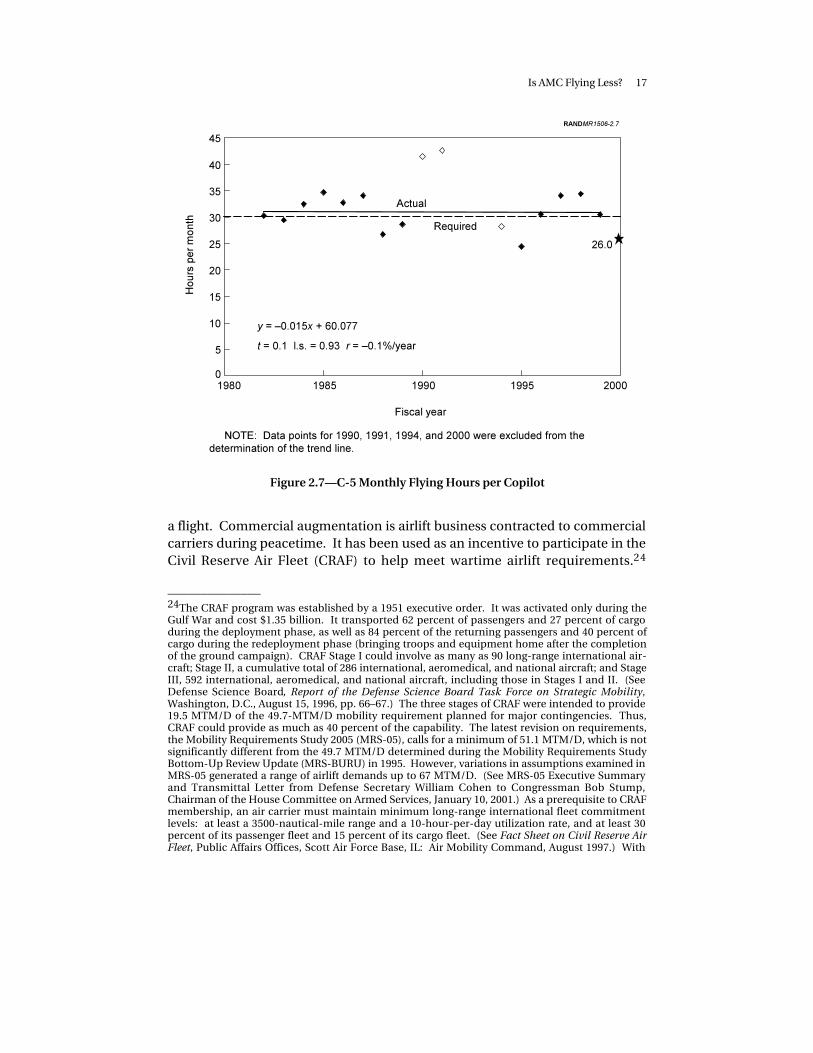
Craig Vara at AMC/DOT provided us with annual data on the number of AMCCPs and ACs and their monthly flying hours. Figure 2.7 shows the monthly fly-ing hours per C-5 CP.23 The aging requirement for a C-5 CP is 30 flying hoursper month. Over the past two decades, monthly flying hours showed no signifi-cant trend of either rising or declining and were on average slightly above theaging requirement. After the Cold War and the Gulf War, frequent peacetimecontingencies and normal airlift activities yielded as much flying as C-5 CPs hadexperienced during the Cold War. However, lower overall peacetime demandfrom time to time and increased competition from commercial carriers canprevent CPs from meeting their aging requirement. In fact, the CPs of all sixaircraft studied here had trouble meeting the requirement during FY 2000 andFY 2001. During FY 2000, average monthly flying hours per C-5 CP dropped to26 (indicated as a star in Figure 2.7), well below the required 30 hours permonth.
In general, the frequency and intensity of peacetime contingencies in the post–Cold War era are hard to predict and the counterterrorism initiative adoptedafter September 11 has not made such prediction any easier. Both variables willlikely fluctuate so that for some years flying will be considerably below the agingrequirement, while for other years it will be above. AMC’s corrective measuresfor the recurring shortage of organic flying hours consist of cutting commercialaugmentation, flying organic aircraft with lesser loads, and putting more CPs on
______________ 23Flying hours of any mission type or flying distance can be used to satisfy the aging or proficiencyrequirement. The trend line was based on data points from 1982 to 1999, excluding 1990, 1991, and1994. For this and Figures A.11 to A.15, the determination of the trend lines was based on the an-nual data up to and including FY 1999.
Is AMC Flying Less? 17
RANDMR1506-2.7
Hours per m
onth
1980
Fiscal year
45
1985 1990 1995 2000
35
20
15
10
5
0
NOTE: Data points for 1990, 1991, 1994, and 2000 were excluded from the
determination of the trend line.
y = –0.015x + 60.077
t = 0.1 l.s. = 0.93 r = –0.1%/year
30
25
Required
Actual
26.0
40
Figure 2.7—C-5 Monthly Flying Hours per Copilot
a flight. Commercial augmentation is airlift business contracted to commercialcarriers during peacetime. It has been used as an incentive to participate in theCivil Reserve Air Fleet (CRAF) to help meet wartime airlift requirements.24
______________ 24The CRAF program was established by a 1951 executive order. It was activated only during theGulf War and cost $1.35 billion. It transported 62 percent of passengers and 27 percent of cargoduring the deployment phase, as well as 84 percent of the returning passengers and 40 percent ofcargo during the redeployment phase (bringing troops and equipment home after the completionof the ground campaign). CRAF Stage I could involve as many as 90 long-range international air-craft; Stage II, a cumulative total of 286 international, aeromedical, and national aircraft; and StageIII, 592 international, aeromedical, and national aircraft, including those in Stages I and II. (SeeDefense Science Board, Report of the Defense Science Board Task Force on Strategic Mobility,Washington, D.C., August 15, 1996, pp. 66–67.) The three stages of CRAF were intended to provide19.5 MTM/D of the 49.7-MTM/D mobility requirement planned for major contingencies. Thus,CRAF could provide as much as 40 percent of the capability. The latest revision on requirements,the Mobility Requirements Study 2005 (MRS-05), calls for a minimum of 51.1 MTM/D, which is notsignificantly different from the 49.7 MTM/D determined during the Mobility Requirements StudyBottom-Up Review Update (MRS-BURU) in 1995. However, variations in assumptions examined inMRS-05 generated a range of airlift demands up to 67 MTM/D. (See MRS-05 Executive Summaryand Transmittal Letter from Defense Secretary William Cohen to Congressman Bob Stump,Chairman of the House Committee on Armed Services, January 10, 2001.) As a prerequisite to CRAFmembership, an air carrier must maintain minimum long-range international fleet commitmentlevels: at least a 3500-nautical-mile range and a 10-hour-per-day utilization rate, and at least 30percent of its passenger fleet and 15 percent of its cargo fleet. (See Fact Sheet on Civil Reserve AirFleet, Public Affairs Offices, Scott Air Force Base, IL: Air Mobility Command, August 1997.) With

18 The Peacetime Tempo of Air Mobility Operations
When the demand for organic airlift unexpectedly drops during a fiscal year,AMC can reduce its commercial expansion buy and thus generate additionalorganic flying hours.25 Of course, no commercial carrier would like a reductionin airlift business. However, whether the reduced incentive has to be compen-sated depends on whether there has already been significant growth in incen-tives in recent years as well as on whether the overall incentives even after thereduction are still adequate. On the other hand, flying aircraft less full alwayscosts more. Putting more CPs on a given aircraft will provide less piloting ex-perience despite the current accounting rule that credits all flying hours on aflight to each working CP irrespective of how many working CPs and ACs are onthe aircraft.26 A long-term solution is needed to resolve the recurring problemof inadequate flying hours or piloting experience to meet the aging require-ment.
During the 1980s, the aging requirement for a C-141 CP was 40.7 flying hoursper month.27 In recent years, this requirement has declined to 29 hours permonth.28 In the 1980s and 1990s, actual flying hours on average matched the
_______________________________________________________________________ consent from the carrier, AMC will assign the committed aircraft to Stage I, II, or III based on itsprojected airlift requirements. The entitlements to peacetime business received by a carrier aretied to its level of commitment to Stages I and II. Carriers who want to participate in Stage III onlyas a patriotic gesture do not earn any guarantee peacetime entitlements but are eligible for overflowbusiness that Stage I and II carriers are unable to provide. (See Carl Evans, Maintaining CivilReserve Air Fleet Participation, Newport, RI: Naval War College, 1993, pp. 13–14.)
CRAF Stage I was activated during Phase I of Operation Desert Shield on August 17, 1990. Stage IIwas activated at the start of the air campaign on January 17, 1991, and the key parts of the messageread: “[T]he Government may exercise its option to increase the services . . . to the full capacity ofyour aircraft volunteered to CRAF Stage II.” (See Mary Chenoweth, The Civil Reserve Air Fleet andOperation Desert Shield/Desert Storm: Issues for the Future, MR-298-AF, Santa Monica: RAND,1993, p. 13.) Actually, only the cargo airlift of Stage II was called up during the deployment phase,because there were very few unfulfilled passenger requirements at the time. Although Stage IIcould have provided an additional 17 cargo aircraft, many of those aircraft were already flying fulltime as volunteers, and the net gain was only nine aircraft. The passenger airlift of Stage II was notcalled up until March 23, 1991, during the redeployment phase, and up to half of the Stage IIcommitment was expected to be used. (See Ronald Priddy, A History of the Civil Reserve Air Fleet inOperations Desert Shield, Desert Storm, and Desert Sortie, Cambridge, MA: Arthur D. Little, Inc.,1993, pp. 146–147 and 176–177.) As to Stage III, it has never been activated.25In this report, a commercial buy is defined as one for international (not domestic) airlift. Wefocus on international long-distance flights because they are less costly in generating flying hoursfor strategic airlifters and tankers. There are two types of commercial buys. A fixed buy is made be-fore the beginning of a fiscal year and is not expected to be canceled. An expansion buy is madethroughout the fiscal year, when the need arises. If the need disappears, AMC can decide not toissue the buy and incur no penalty.26We will introduce a metric—average number of pilots per flight—to determine whether a pilot isgetting less piloting experience during training. If this occurs and starts to affect the quality oftraining, AMC should refine its aging and proficiency requirements to ensure that pilots receiveenough flying hours in piloting.27See Figure A.11 in the appendix.28The reduction from 40.7 to 29 took place over time and in multiple steps. From 1981 to 1990, thenumber of C-141 aircraft (PAA) held relatively steady, declining from 250 in 1981 to 234 in 1990.Then, C-141s were on their way to retirement and declined sharply from 231 in 1991 to 74 in 1999.

Is AMC Flying Less? 19
aging requirement. During FY 2000, however, C-141 CPs averaged only 24.1hours, a level that fell below even the already-reduced requirement of 29 hours.Thus, there were not enough flying hours for aging during that period.Although C-141s are now being retired, insufficient flying will thus delay thepromotion of C-141 CPs whether they are flying C-141s or, at a later point, otheraircraft.
The aging requirement for a C-17 CP is 35 hours.29 From 1995 to 1999, thenewly deployed C-17 increased its flying hours per CP to about 35, thus meetingthe aging requirement. Yet during FY 2000, the number of flying hours per CPdropped to 27.8, well below the aging requirement of 35.
In the 1980s, there were sufficient C-130 flying hours to meet the aging re-quirement. Yet during the 1990s this number declined, and by FY 2000 thenumber of flying hours per CP was 24.3—below the requirement of 29 hours permonth.30
In contrast, the monthly flying hours per KC-135 tanker from 1994 to 1999 stoodcomfortably above the aging requirement of 25 hours.31 There was also mini-mal fluctuation during this period. Although commercial augmentation com-petes for airlift business with organic airlifters (the C-5, C-141, C-17, and C-130),AMC tankers (the KC-135 and KC-10) face no such competition.32 This may beone of the reasons KC-135 CPs, unlike those of organic airlifters, flew consider-ably in excess of their aging requirement. When overall demand was low duringFY 2000, however, even KC-135 CPs flew only 24.8 hours per month, slightlybelow the requirement of 25.
KC-10 CPs flew 5.4 percent more (in monthly flying hours) per year during1995–1999.33 Even so, during FY 2000, KC-10 CPs flew 27.9 hours per month,slightly below the aging requirement of 29.
In sum, the CPs of airlifters (the C-5, C-141, C-17, and C-130) and tankers (theKC-135 and KC-10) all had insufficient flying hours during FY 2000.
_______________________________________________________________________ In the 1990s, AMC needed CPs and ACs to man its sharply decreased fleet of C-141s. In addition toreducing the hiring of C-141 CPs, AMC reduced its monthly flying-hour requirement in order tolengthen the number of years for CPs to be promoted to ACs. This had the effect of reducing thenumber of ACs and of better matching the lower manning requirement.29See Figure A.12 in the appendix.30See Figure A.13 in the appendix.31See Figure A.14 in the appendix.32The expenses of flying tankers (KC-135s and KC-10s) and the tactical airlifter (C-130s) are notreimbursed by TWCF.33See Figure A.15 in the appendix.

20 The Peacetime Tempo of Air Mobility Operations
MONTHLY FLYING HOURS PER AIRCRAFT COMMANDER
ACs’ flying-hour requirements are significantly less than those of CPs.34 For ex-ample, a CP is required to fly from 1000 to 1400 hours before he can become anAC, but an AC is required to fly only 200 to 500 hours more to become an in-structor pilot. An instructor pilot faces no further flying-hour requirement tobecome a flight examiner.35 Both CPs and ACs are, however, required to meettheir own Pilot Semiannual Flying Requirements (PSFRs).36 CPs can easilymeet these requirements if they fulfill their aging requirement of 25 to 35 hoursper month. ACs, by contrast, must first understand PSFRs before they can de-termine whether these requirements can be easily met. Some of the require-ments for C-5 ACs are the number of practices every six months in overseassorties, takeoffs, landings, instrument approaches, night landings, three-enginemiss approaches, and night receiver air refuelings. Many PSFRs can, however,be met in flight simulators. For C-5 ACs, only events such as overseas sorties,Have Quick radio procedures, Secure Voice operations, and some air refuelingmissions need be performed in an aircraft.37 Generally, ACs of C-5s or otherairlifters or tankers can meet these requirements with monthly flying hoursnumbering in the teens. In reality, however, the ACs of airlifters and tankers flyconsiderably more, as a CP must be accompanied by an AC on every flight, andAMC seeks to maintain similar numbers of full-time ACs and CPs in the force.Thus, even during FY 2000, when CPs flew below their aging requirements, ACshad no trouble flying a sufficient amount to meet their PSFRs. Still, it would beof interest to estimate the trend of ACs’ flying hours.
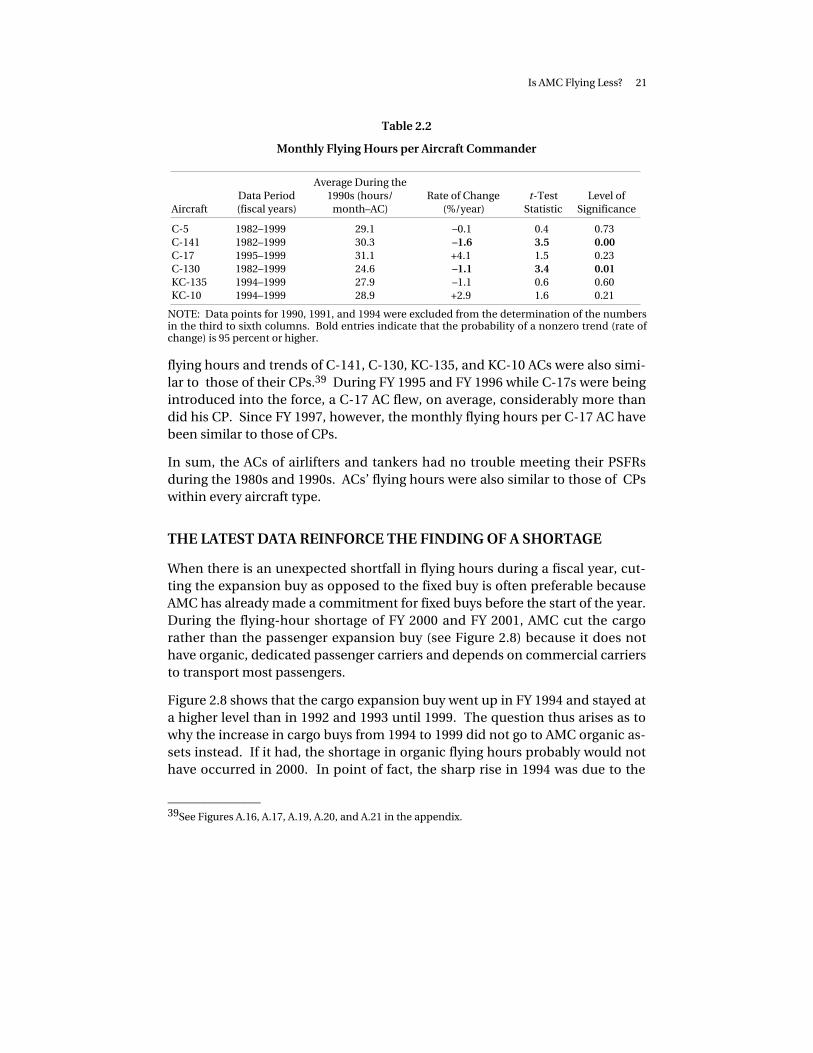
Table 2.2 shows monthly flying hours per AC during the past two decades.38
For the C-5, both the number and the trend of flying hours per month per ACduring the 1980s and the 1990s were very similar to those for CPs. The monthly
______________ 34In this sentence, we continue to refer to both ACs and CPs as two pilot categories. The AC pilotcategory includes the following crew positions: aircraft commander, instructor pilot, and flight ex-aminer. The CP category includes copilot and first pilot.35These are crew positions. The flying-hour requirements to become an AC are 1400, 1300, 1200,and 1000 hours for the C-5, C-141, C-17, and C-130, respectively. The corresponding flying-hourrequirements to become an instructor pilot are 300, 300, 200, and 500.36We now return to pilot categories as opposed to crew positions.37ACs are classified into four experience levels: A to D. Regardless of experience level, an AC is re-quired to perform four overseas sorties, two Have Quick radio procedures, and two Secure Voiceoperations semiannually. ACs must also receive aerial refueling in four, five, six, or seven missions(up to two of which may be in simulators) for experience levels A, B, C, or D, respectively. See C-5Aircrew Training, AFI 11-2C-5, Vol. 1, January 1, 1999.38See also Figures A.16 to A.21 in the appendix.
Is AMC Flying Less? 21
Table 2.2
Monthly Flying Hours per Aircraft Commander
AircraftData Period(fiscal years)
Average During the1990s (hours/
month–AC)Rate of Change
(%/year)t-Test
StatisticLevel of
Significance
C-5 1982–1999 29.1 –0.1 0.4 0.73C-141 1982–1999 30.3 –1.6 3.5 0.00C-17 1995–1999 31.1 +4.1 1.5 0.23C-130 1982–1999 24.6 –1.1 3.4 0.01KC-135 1994–1999 27.9 –1.1 0.6 0.60KC-10 1994–1999 28.9 +2.9 1.6 0.21
NOTE: Data points for 1990, 1991, and 1994 were excluded from the determination of the numbersin the third to sixth columns. Bold entries indicate that the probability of a nonzero trend (rate ofchange) is 95 percent or higher.
flying hours and trends of C-141, C-130, KC-135, and KC-10 ACs were also simi-lar to those of their CPs.39 During FY 1995 and FY 1996 while C-17s were beingintroduced into the force, a C-17 AC flew, on average, considerably more thandid his CP. Since FY 1997, however, the monthly flying hours per C-17 AC havebeen similar to those of CPs.
In sum, the ACs of airlifters and tankers had no trouble meeting their PSFRsduring the 1980s and 1990s. ACs’ flying hours were also similar to those of CPswithin every aircraft type.
THE LATEST DATA REINFORCE THE FINDING OF A SHORTAGE
When there is an unexpected shortfall in flying hours during a fiscal year, cut-ting the expansion buy as opposed to the fixed buy is often preferable becauseAMC has already made a commitment for fixed buys before the start of the year.During the flying-hour shortage of FY 2000 and FY 2001, AMC cut the cargorather than the passenger expansion buy (see Figure 2.8) because it does nothave organic, dedicated passenger carriers and depends on commercial carriersto transport most passengers.
Figure 2.8 shows that the cargo expansion buy went up in FY 1994 and stayed ata higher level than in 1992 and 1993 until 1999. The question thus arises as towhy the increase in cargo buys from 1994 to 1999 did not go to AMC organic as-sets instead. If it had, the shortage in organic flying hours probably would nothave occurred in 2000. In point of fact, the sharp rise in 1994 was due to the
______________ 39See Figures A.16, A.17, A.19, A.20, and A.21 in the appendix.

22 The Peacetime Tempo of Air Mobility Operations
RANDMR1506-2.8
Cargo expansio
n buy (m
illions of 1999 dollars)
1991
Fiscal year
800
1993 1995 2001
600
300
0
200
100
1997 1999
500Passenger fixed buy
Passenger expansion buy
Cargo fixed buy
Cargo expansion buy
Total buy
700
400
Figure 2.8—AMC Chose to Cut Its Cargo Expansion Buy in FY 2000 and FY 2001
rare occurrence of weep-hole cracks in C-141 wings.40 As shown in Figures 2.3and 2.5, both total strategic airlifter and C-141 flying levels were below normalduring 1994, and AMC used commercial expansion buys to fill the gap. Thiswas consistent with AMC’s traditional approach toward meeting flying demand:Each year, AMC prefers to fly the number of hours that meets the pilot trainingrequirement, and if demand exceeds that number, it prefers to contract com-mercial fixed and expansion buys rather than to fly more itself. As shown inFigures 2.7 and A.11, C-5 and C-141 CPs were already flying in excess of theirflying requirements during 1995–1999.41 AMC thus turned to the commercialair carriers during that period to meet the excess flying demand.
Figure 2.9 takes a closer look at the cut in the cargo expansion buy depicted inFigure 2.8.42 A sharp cut occurred in July 2000, and the cut continued to thepoint at which the buy was near zero by the early months of calendar year 2001.
______________ 40The wing-crack problem was described earlier in this chapter.41The only exception was the C-5 during 1995. C-17s are not included here because during thesame period, C-17s were still in the buildup phase and could not fly more.42We have included the combination buy (a mix of cargo and passenger buys) in the cargo as op-posed to passenger buy because AMC does so in tallying the total cargo expansion buy.

Is AMC Flying Less? 23
RANDMR1506-2.9
Monthly
cargo expansio
n buy (m
illions of 1999 dollars)
26
24
22
20
18
16
14
12
10
8
6
4
2
0
Oct
1998
Jan
1999
Apr
1999
Jul
1999
Oct
1999
Jan
2000
Apr
2000
Jul
2000
Oct
2000
Jan
2001
Apr
2001
Jul
2001
Sep
2001
Month
Figure 2.9—The Cargo Expansion Buy Declined Sharply inJuly 2000 Until August 2001
It then remained low until activities surged after September 11.43 Unfor-tunately, even with such a large cut in the cargo expansion buy, CPs for allairlifters and tankers still failed to meet their monthly flying-hour requirementduring FY 2000 and FY 2001.
In point of fact, in the face of the flying-hour shortage during FY 2000 and thefirst half of FY 2001, AMC tried to increase organic flying during the second halfof FY 2001 (see Figure 2.10).44 The average monthly flying hours per CP forairlifters during the second half of FY 2001 thus increased from 16 percent to 23percent over those during the first half of that fiscal year.45 While these effortsdid not eliminate the shortage, they did reduce it considerably. For example,
______________ 43Figure 2.9 shows the surge in the cargo expansion buy during September 2001, at which time itwas close to $14 million, or about $12 million above normal. In contrast, the cargo fixed buy stayedat $12 million in September 2001 and changed little from prior months. This is to be expected be-cause the fixed buy is contracted at the beginning of the fiscal year, whereas the expansion buy iscontracted much closer to the time of need and is designed to meet unexpected demand.44See Chapter Eight for details.45In contrast, the monthly flying hours per pilot during the second half of FY 2000 showed a declinefrom the first half (see Figure 2.10).

24 The Peacetime Tempo of Air Mobility Operations
Increase in
hours durin
g the second half of F
Y 2001 (%
)
RANDMR1506-2.10
30
C-5
CP
Aircraft/pilot
20
10
0
–10
–20
–30
C-141
CP
C-17
CP
C-130
CP
KC-135
CP
KC-10
CP
C-5
AC
C-141
AC
C-17
AC
C-130
AC
KC-135
AC
KC-10
AC
FY 2000
FY 2001
Figure 2.10—AMC Increased Monthly Flying Hours per Pilot During theSecond Half of FY 2001
Table 2.3
AMC Was Able to Reduce but Not Eliminate the Flying-Hour Shortagea
Monthly Flying Hours per Pilot
Full Year First Half Full Year Full Year AgingFY 2001 FY 2001 FY 2000 FY 1999 Requirement
CopilotsC-5 28.3 26.2 26.0 30.5 30C-141 24.9 22.6 24.1 33.4 29C-17 32.0 28.7 27.8 33.6 35C-130 21.2 19.6 24.3 25.5 29KC-135 23.5 23.2 24.8 30.1 25KC-10 22.1 22.4 27.9 35.5 29
Aircraft commandersC-5 22.4 20.7 24.3 26.9 NAb
C-141 24.0 22.7 24.7 31.1 NAC-17 29.2 28.1 28.3 33.6 NAC-130 21.8 20.6 21.6 24.2 NAKC-135 20.7 20.4 22.0 27.8 NAKC-10 21.2 21.6 26.0 31.7 NA
aBold entries indicate failure to meet aging requirement.bNot applicable.

Is AMC Flying Less? 25
such efforts brought the monthly hours per C-5 CP up from 26.2 during the firsthalf to 30.4 during the second half of FY 2001, resulting in an average of 28.3hours for the full year (see Table 2.3). However, this average was still 1.7 hoursshort of the required 30 hours per month per CP. C-141 CPs were on their part4.1 hours short; C-17 CPs, 3 hours; C-130 CPs, 7.8 hours; KC-135 CPs, 1.5 hours;and KC-10 CPs, 6.9 hours. Shortfalls will recur from time to time because onecannot know when and how many peacetime deployments will occur in anygiven year.46 On the other hand, ACs do not have an aging requirement, andmonthly flying hours numbering in the teens will satisfy their proficiency re-quirement. Although ACs flew less during FY 2000 and FY 2001 than during FY1999, they still had no trouble meeting their proficiency requirement.
ENGAGEMENT VERSUS READINESS MISSIONS
As shown in the previous two sections, AMC pilots did not fly more in the 1990sthan in the 1980s. However, they may still be flying more short-notice missionsas opposed to routine missions with advance notice. Yet it is harder and morecostly for AMC to assemble the necessary aircraft and personnel for short-notice missions, and pilots prefer not to fly missions with little advance notice.
If such missions are occurring more frequently, AMC might either have to en-dure the situation or contract more of them to commercial carriers.
The AMC Flying-Hour Program divides missions into two groups: O&M andTWCF.47 O&M missions are not reimbursed by customers, but TWCF missionsare. O&M missions are further divided into test, training, and ferry (TTF) andjoint airdrop/air transportability training (JA/ATT). TWCF missions are dividedinto channel, exercise, contingency, and SAAMs. Channel missions are sched-uled deliveries between established aerial ports of embarkation (APOEs) andaerial ports of debarkation (APODs). The other TWCF missions are generallyunscheduled, have shorter notice,48 and deliver passengers and cargo to sup-port joint exercises, small-scale contingencies, humanitarian relief operations,
______________ 46The OEF has significantly increased AMC flying hours. However, OEF is considered a contin-gency with a high air mobility demand, not a peacetime operation. In any case, it will eventuallyend. Nor does one know at what level U.S. counterterrorism efforts as a whole will be sustained andfor how long. AMC cannot count on these continuous, heightened activities to solve the flying-hourshortage.47The TWCF is “(t)hat part of the Defense Business Operations fund operated by AMC to financethe operating costs of the airlift services provided by AMC, who is reimbursed for such costs by au-thorized customers to whom airlift services are rendered. Formerly known as DBOF-T.” SeeCommand Data Book, November 1999, p. 144.48It is possible that as contingencies mature and as schedules become set, missions are no longershort notice. Unfortunately, AMC has not used a classification that separates short-notice fromlong-notice missions. Nor is “short notice” defined. One can still say, however, that other TWCFmissions, on average, have shorter notice than channel missions.
26 The Peacetime Tempo of Air Mobility Operations
presidential travel, and the like. Pilots prefer channel missions because they arescheduled well in advance, so pilots are not called out of town unexpectedly.AMC management prefers such missions as well because it can reliably and ac-curately schedule pilots to fly them to satisfy aging and proficiency require-ments. AMC also knows that many training elements will be accomplished inchannel missions. We believe, however, that short-notice missions can be usedto train pilots for short-notice wartime missions.
We have classified missions into three categories: channel, engagement, andO&M. Channel missions are TWCF missions that AMC favors for maintainingand upgrading pilots’ flying skills. Engagement missions consist of the otherTWCF missions that AMC is expected to perform to support U.S. peacetime op-erations.49 O&M missions refer to those that are not reimbursed by customersor are dedicated to training (without airlifting items for customers at the sametime). Flying hours for missions in any of these three categories can be used tosatisfy pilots’ flying-hour requirements. The military annual flying-hours forthe airlifters (the C-5, C-141, C-17, and C-130) during peacetime declined 63percent between 1981 and 2000 (see Figure 2.11).
When we compared the annual engagement missions conducted during 1981and 1989, we found an increase of 35,000 flying hours, or 32 percent.Conversely, we found annual channel missions to have declined by 57,000hours, or 27 percent, and O&M by 24,000 hours, or 15 percent.50
It is instructive to see how AMC managed airlift demand and supply during1981–1989. When the engagement demand rose, AMC used its own assets to
______________ 49Paul Killingsworth classifies peacetime missions into two categories: engagement and readiness.The former has high priority and short notice and is composed of small-scale contingencies, expe-ditionary Air Force support, banner operations (presidential support), humanitarian relief opera-tions, short-notice SAAMs, and mission support. The latter has lower priority and advance plan-ning and consists of local training, exercises, JA/ATT, channels, long-lead SAAMs, and efforts suchas air evacuations. (Information is derived from a private communication with the author inJanuary 2001.) We do not use Killingsworth’s mission categories here for two reasons. First, thedata in the authoritative Flying-Hour Program cannot be readily reclassified into these twocategories. Second, missions in Killingsworth’s engagement category, like the channel missions inhis readiness category, can be used to meet flying-hour requirements, which can be consideredreadiness requirements. In this important sense, Killingsworth’s engagement missions are notdistinctive from his readiness missions. In any case, our O&M and channel missions combinedshould approximate Killingsworth’s readiness category, while our engagement missions should besimilar to his engagement category.50See Figure A.22 in the appendix. To understand why engagement flying hours increased, onewould have to examine and tally the numerous activities every year during those years. For exam-ple, the rise in engagement missions in FY 1984 was caused by several major events (on top of othermore typical engagement activities): the U.S. intervention in Grenada from October 25 toNovember 19, 1983; airlift missions conducted in association with U.S. Airborne Warning andControl System (AWACS) aircraft deployment to help Egyptians monitor Libyan threats to theircountry, from March 19 to April 9, 1984; President Reagan’s trip to China from April 7 to May 2,1984; and the deployment of U.S. minesweeping assets to the Red Sea from August 7 to October 2,1984.

Is AMC Flying Less? 27
Ann
ualf
lyin
gho
urs
ofst
rate
gic
and
tact
ical
airli
fters
Fiscal year
800,000
1981
RANDMR1506-2.11
EngagementO&MChannel
700,000
600,000
500,000
400,000
300,000
200,000
100,000
0
1982
1983
1984
1985
1986
1987
1988
1989
1990
1991
1992
1993
1994
1995
1996
1997
1998
1999
2000
NOTE: The years 1990 and 1991 were not considered peacetime in this study.
Figure 2.11—Military Airlifters’ Annual Flying Hours During Peacetime Declined Afterthe Cold War
perform these activities, as it would do traditionally. At the same time, AMCpreferred to fly just enough hours to meet its pilots’ training requirements.Therefore, when AMC pilots flew more engagement missions than expected,AMC reduced the organic flying of channel missions, which indeed happenedduring this period. The question remains, however, as to why the 57,000-hourdecrease in channel missions exceeded the 35,000-hour increase in engage-ment missions. This was because C-5, C-141, and C-130 CPs generally flew inexcess of their requirements during 1981–1989 even with the larger reduction.51
In other words, if AMC had reduced channel as well as O&M flying any less, itspilots would have had to fly even more than they were required. Our recom-mendations52 for alleviating flying-hour shortages follow AMC’s approach offavoring organic assets to fly engagement missions and using commercial ser-
______________ 51See Figure 2.7 and Figures A.11 and A.13 in the appendix.52This will be discussed in Chapter Eight.

28 The Peacetime Tempo of Air Mobility Operations
vices as shock absorbers53 while also focusing on creating new avenues for AMCto fly more when it needs to. Channel flying also declined faster than engage-ment and O&M over the past two decades.54 This trend can be unfavorable forAMC given its preference for using channel flying for pilot training.
Figure 2.12 shows the three mission categories for the C-5. During the past twodecades, O&M missions remained stable at about 20 percent of C-5 pilots’ flyinghours. On the other hand, channel missions steadily declined at a rate of 5.6percent per year, and engagement missions rose by 13 percent per year. By1999, annual engagement missions constituted 68 percent of the total missionsflown on a flying-hour basis, compared to only 11 percent in 1981. In the 1980s,in other words, the annual flying hours for channel missions were significantlyhigher than those for engagement missions, while in the 1990s the situation wasreversed. C-5 pilots had been flying many more short-notice missions.
For the C-141, the shares of flying hours in the channel-mission category de-clined by 2.5 percent per year, while O&M missions increased by 2.7 percent peryear and engagement missions increased by 2.1 percent per year.55 C-141channel missions and engagement missions showed trends similar to those ofthe C-5, but with less intensity. Thus, a similar concern arises that the C-141 isbearing an increasing portion of short-notice missions.
The trend lines also reflect the penetration of the new C-17 during the secondhalf of the 1990s.56 These trends do not reflect how the mission percentageschanged for a matured airlifter such as the C-5 or C-141. The end points (in1999) may be more illustrative of future trends for a maturing C-17. In 1999,channel missions accounted for 31 percent of all annual flying hours, O&M for23 percent, and engagement missions for 46 percent. As with the C-5 andC-141, engagement missions accounted for the largest share of AMC’s C-17peacetime flying hours. It should be emphasized, however, that there are toofew data points to justify any definitive statements about C-17 trends.
The O&M share of C-130 flying hours was stable and accounted for about half ofall flying hours.57 Channel missions showed a steady decline of 4.5 percent peryear, while engagement missions exhibited an increase of 4 percent per year.
______________ 53They are shock absorbers because AMC will use commercial air carriers to take care of the excesswhen there is an unexpected airlift demand. Likewise, when there is a deficit in demand, commer-cial services will be cut to allow more flying hours for AMC’s own pilots.54See Figure A.22 in the appendix.55See Figure A.23 in the appendix.56See Figure A.24 in the appendix.57See Figure A.25 in the appendix.

Is AMC Flying Less? 29
In sum, for all four airlifters (the C-5, C-141, C-17, and C-130), engagementmissions accounted for a growing share of flying hours. Moreover, for the C-5,C-141, and C-130, channel missions, which are favored by AMC managementand pilots, declined. The O&M shares of flying hours for the C-5, C-141, andC-130 remained relatively stable over the past two decades. We do not havedata on the KC-135 and KC-10 tankers with which to address trends in variousmission categories.
RANDMR1506-2.12
Ann
ualf
lyin
gho
urs
ina
mis
sion
cate
gory
(%)
1980
Fiscal year
100
1985 1990 1995 2000
90
50
40
30
20
10
0
NOTE: Data points for 1990, 1991, and 1994 were excluded from the determinationof the trend lines.
80
60
70
Channely = –0.029x + 57.232t = 12 l.s. = 0.00 r = –5.6%/year
Engagementy = 0.031x – 60.508t = 14 l.s. = 0.00 r = +13%/year
O&My = –0.0040x + 8.1658t = 2.6 l.s. = 0.02 r = –1.6%/year
Figure 2.12—C-5: Growing Engagement Missions and Declining Channel Missions